the Creative Commons Attribution 4.0 License.
the Creative Commons Attribution 4.0 License.
 | 14 May 2025
The unique features in the 4 d widespread extreme rainfall event over North China in July 2023
Jinfang Yin
Feng Li
Mingxin Li
Rudi Xia
Xinghua Bao
Jisong Sun
Xudong Liang
Synoptic forcings have traditionally played a pivotal role in extreme rainfall over North China. However, there are still large unexplained gaps in our understanding of the formation of extreme rainfall events over this region. This heavy rainfall event, lasting from 29 July to 2 August 2023 (referred to as the “23⋅7” event), is characterized by a long duration, widespread coverage, and high accumulation of rainfall over North China. Overall, the persistent extreme rainfall is closely associated with the remnant vortex originating from Typhoon Doksuri (2305), Tropical Storm Khanun (2306), and the unusual westward extension of the western North Pacific subtropical high (WNPSH), as well as quasi-stationary cold, dry air masses surrounding North China on the west and north sides. Based on wind profiles and rainfall characteristics, the life cycle of the 23⋅7 event is divided into two stages. In the first stage, the western part of the WNPSH was weakened by Tropical Storm Doksuri, where it appeared that the WNPSH retreated eastward with decreasing height. The marginal zone of this subtropical high then became inclined below 500 hPa. Therefore, convection was limited by the tilted WNPSH, with a warm, dry cover embedded in the low-to-middle troposphere. Meanwhile, mountain areas in the western part of North China were occupied by cold air masses above approximately 3.0 km. Combining the orographic and cold-air blocking, only a thin layer of southeasterly wind (between 1.3 and 3.0 km) was able to pass over the mountains. Although the warm and moist southeasterly flows were lifted by orography, no convection was triggered because of the local capped cold and dry air masses overhead. Under this regime, equivalent potential temperature (θe) gradients were established between warm, humid and dry, cold air masses, similar to a warm front, causing warm air to lift and generating widespread but low-intensity rainfall. However, the lifting was too weak to allow convection to be highly organized. In the second stage, the WNPSH was further weakened by the enhancement of Khanun, and thus the embedded warm, dry cover associated with the tilted WNPSH was significantly thinned. Consequently, convection triggered by orographic blocking was able to extend upward and develop further, forming deep convection. Generally speaking, the convection in the second stage is much deeper than that in the first stage. The results may shed new light on a better understanding and forecasting of long-lasting extreme rainfall.
- Article
(21381 KB) - Full-text XML
- BibTeX
- EndNote


A persistent severe rainfall event occurred over central China and North China during the period from 29 July to 2 August 2023 (referred to as “23⋅7” event), which was regarded as one of the global precipitation extremes of 2023 (Fowler et al., 2024). Despite the low intensity of the rainfall, it was long-lasting and widespread, resulting in a large accumulation of rainfall. Overall, the average accumulation of rainfall over North China (including Beijing, Tianjin, and Hebei province) was 175 mm, which was approximately one-third of the average annual precipitation in this region. Flooding from this event affected 1.3 million people, bringing severe human casualties and economic losses. The sustained severe rainfall over Beijing left 33 people dead and 18 missing. One of the distinct features of this rainfall event was closely associated with the remnant vortex originating from Typhoon Doksuri (2305), Tropical Storm Khanun (2306), an unusual westward extension of the western North Pacific subtropical high (WNPSH), and quasi-stationary cold, dry air masses surrounding North China on the west and north sides.
It is common for rainfall to occur over North China due to strong water vapour supply by tropical cyclones over the East China Sea and/or Southern China Sea (e.g. Ding, 1978; Feng and Cheng, 2002; Yin et al., 2022c). Like the “96⋅8” severe rainfall event (Sun et al., 2006; Bao et al., 2024), the present persistent rainfall event was closely linked to two tropical storms, Doksuri (2305) and Khanun (2306). Note that Doksuri weakened to a typhoon remnant vortex (typhoon low pressure) at the moment that it moved inland after making landfall, while Tropical Storm Khanun was in a fast-developing stage. Tropical Storm Khanun and the typhoon remnant vortex jointly built a water vapour bridge, transporting a large amount of water vapour to North China from the East China Sea. Previous studies (e.g. Hirata and Kawamura, 2014; Gao et al., 2022; Yang et al., 2017) have pointed out that large amounts of water vapour brought by a typhoon over the North Pacific are favourable for severe rainfall generation in eastern China.
In the last several decades, considerable attention has been paid to remote rainfall events associated with tropical cyclones, with substantial progress having been made (e.g. Wang et al., 2009; Xu et al., 2023a, b; Lin and Wu, 2021). Commonly, sufficient water vapour provided by a tropical cyclone plays an important role in extreme rainfall over North China (e.g. Rao et al., 2023; Xu et al., 2023b). Aside from this, many studies confirmed that the WNPSH is closely related to water vapour transportation and the spatial distribution of rainfall (e.g. Hu et al., 2019; Gao et al., 2022). Additionally, orographic forcing of the approaching warm and moist unstable airflow plays a critical role in determining the location of convection initialization, although sometimes orographic forcing plays a small role compared to the typhoon's circulation (Wang et al., 2009). Moreover, severe rainfall can be generated by the complicated cloud microphysical processes due to the interactions between tropical oceanic warm, moist and midlatitude cold, dry air masses (Wang et al., 2009; Xu and Li, 2017; Xu et al., 2021). Despite some experience gained, there are still large unexplained gaps in understanding the formation of extreme rainfall (Meng et al., 2019).
Due to the tremendous impacts of the 23⋅7 event, many scholars have carried out studies of the event, focusing on various aspects. M. Li et al. (2024) provided a detailed analysis of the fine characteristics of the precipitation using radar and dense rain gauge observations. Xia et al. (2025) investigated extreme hourly rainfall from different episodes. Fu et al. (2023) paid attention to the effects of dynamic and thermodynamic conditions on precipitation, while Gao et al. (2024) focused on the impact of mountain–plain thermal contrast on precipitation distribution. Although operational forecasts gave a reasonable spatial distribution of precipitation at that time, the precipitation intensity was underestimated significantly. Indeed, it was found that, during this event, the unusual westward extension of the WNPSH played an important role in modulating convection initialization and development, with several unusual features revealed. However, given the unusual westward extension of the WNPSH, some unexplainable questions have been raised, to which little attention has been paid to-date. Firstly, what mechanism(s) could account for the persistent severe rainfall? Aside from this, what is the role of the unusual westward extension of the WNPSH in governing the rainfall over North China? Therefore, we are motivated to conduct the present modelling study to answer those questions.
The rest of the paper is organized as follows. A detailed description of the main features of extreme rainfall and synoptic-scale weather conditions is documented. Section 3 provides the detailed model configuration and verification against observations. We present a detailed analysis of the extreme rainfall production in Sect. 4. The paper finishes with conclusions and outlooks.
2.1 Characteristics of rainfall
Figure 1 shows the spatial distribution of 96 h of accumulated rainfall from observations during the period from 00:00 UTC on 29 July to 00:00 UTC on 2 August 2023, with the peak amount of 1004 mm at the Liangjiazhuang station near Xingtai, Hebei province, in North China. An exceptionally long duration of rainfall is a notable feature of the event, with the longest duration being 80 h within the 4 d at some stations. The spatial distribution of the rain belt with three severe rainfall cores is consistent with the orographic direction of the Yanshan Mountains to the north as well as of the Taihang Mountains to the south, suggesting that orography plays an important role in the precipitation. It should be emphasized that three rainfall cores, marked by Mentougou (MTG, 741 mm) in Beijing and Yixian (YX, 753 mm) and Xingtai (XT, 1004 mm) in Hebei province, correspond to the regions with large topographic gradients (Fig. 1). Please refer to Li et al. (2024) for a detailed analysis of the fine features of this rainfall event.
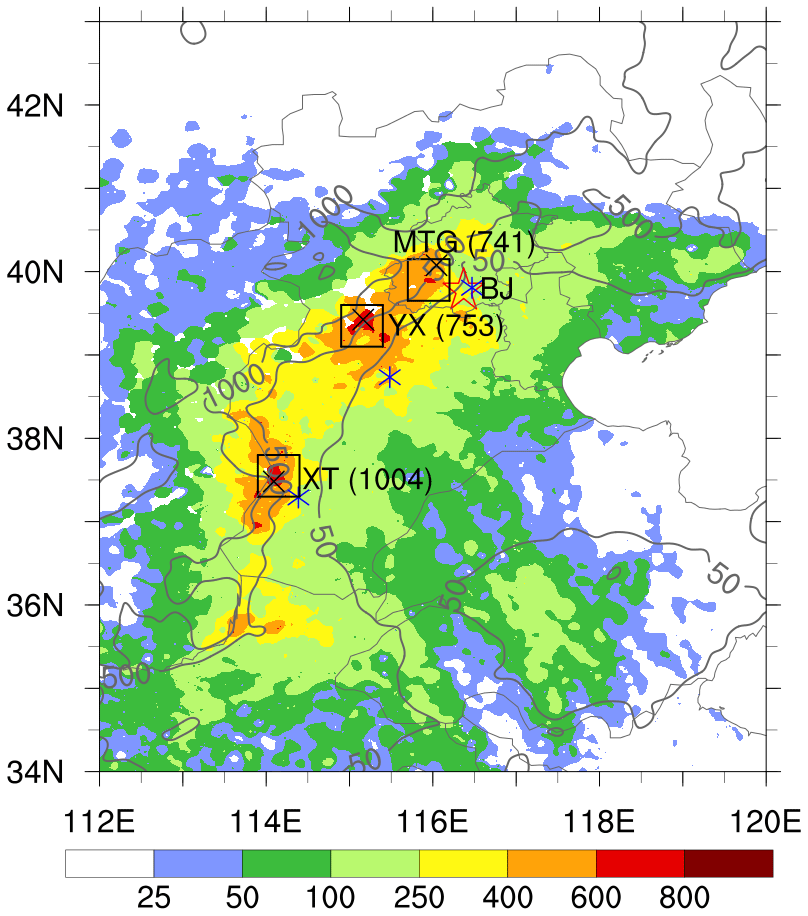
Figure 1Spatial distribution of 96 h of accumulated rainfall (mm, shading) from the intensive surface rain gauge observations during the period from 00:00 UTC on 29 July to 00:00 UTC on 2 August 2023; grey contours denote orography from 50 to 1000 m as marked. Three rainfall cores, Mentougou (MTG) in Beijing and Yixian (YX) and Xingtai (XT) in Hebei province, are denoted by squares, with the values in parentheses indicating the maximum accumulation of rainfall (marked by an X symbol, ×) for the respectie regions. The blue asterisks (∗) represent the locations of wind profiler observational stations near the three rainfall cores. The star (![]() ) symbol indicates the location of Beijing (BJ) (similarly for the rest of figures).
) symbol indicates the location of Beijing (BJ) (similarly for the rest of figures).
2.2 Wind profiles
The wind profiles observed near MTG, YX, and XT are shown in Fig. 2. It was found that temporal variations in horizontal wind fields are distinct during the rainfall event. Taking the wind profiles near MTG as an example (Fig. 2a), the easterly or southeasterly wind at the levels below 4 km increased gradually from 2 m s−1 at 12:00 UTC on 28 July to 24 m s−1 at 12:00 UTC on 30 July 2023. The easterly or southeasterly wind lasted until 04:00 UTC on 31 July 2023, turned southerly except near the ground, and then turned southwesterly around 04:00 UTC on 1 August 2023. After 04:00 UTC on 31 July, the wind speed decreased significantly and then increased drastically. More specifically, the wind speed decreased from 8 to 2 m s−1 and then increased to 14 m s−1 near 1 km above the ground. However, the opposite variations were observed above 4 km. One can see that the horizontal wind shifted from southwesterly to southerly, then back to southwesterly. Overall, the shift in wind direction and speed altered the vertical wind shear, which directly affected the development and organization of subsequent convection (Pucik et al., 2021). Similar variations can also be found at the YX and XT stations, although the timing of changes is not synchronized (Fig. 2c, d). The variations proceeded from south to north, starting first at XT and finally arriving at MTG, at the same pace as the typhoon moving from south to north.
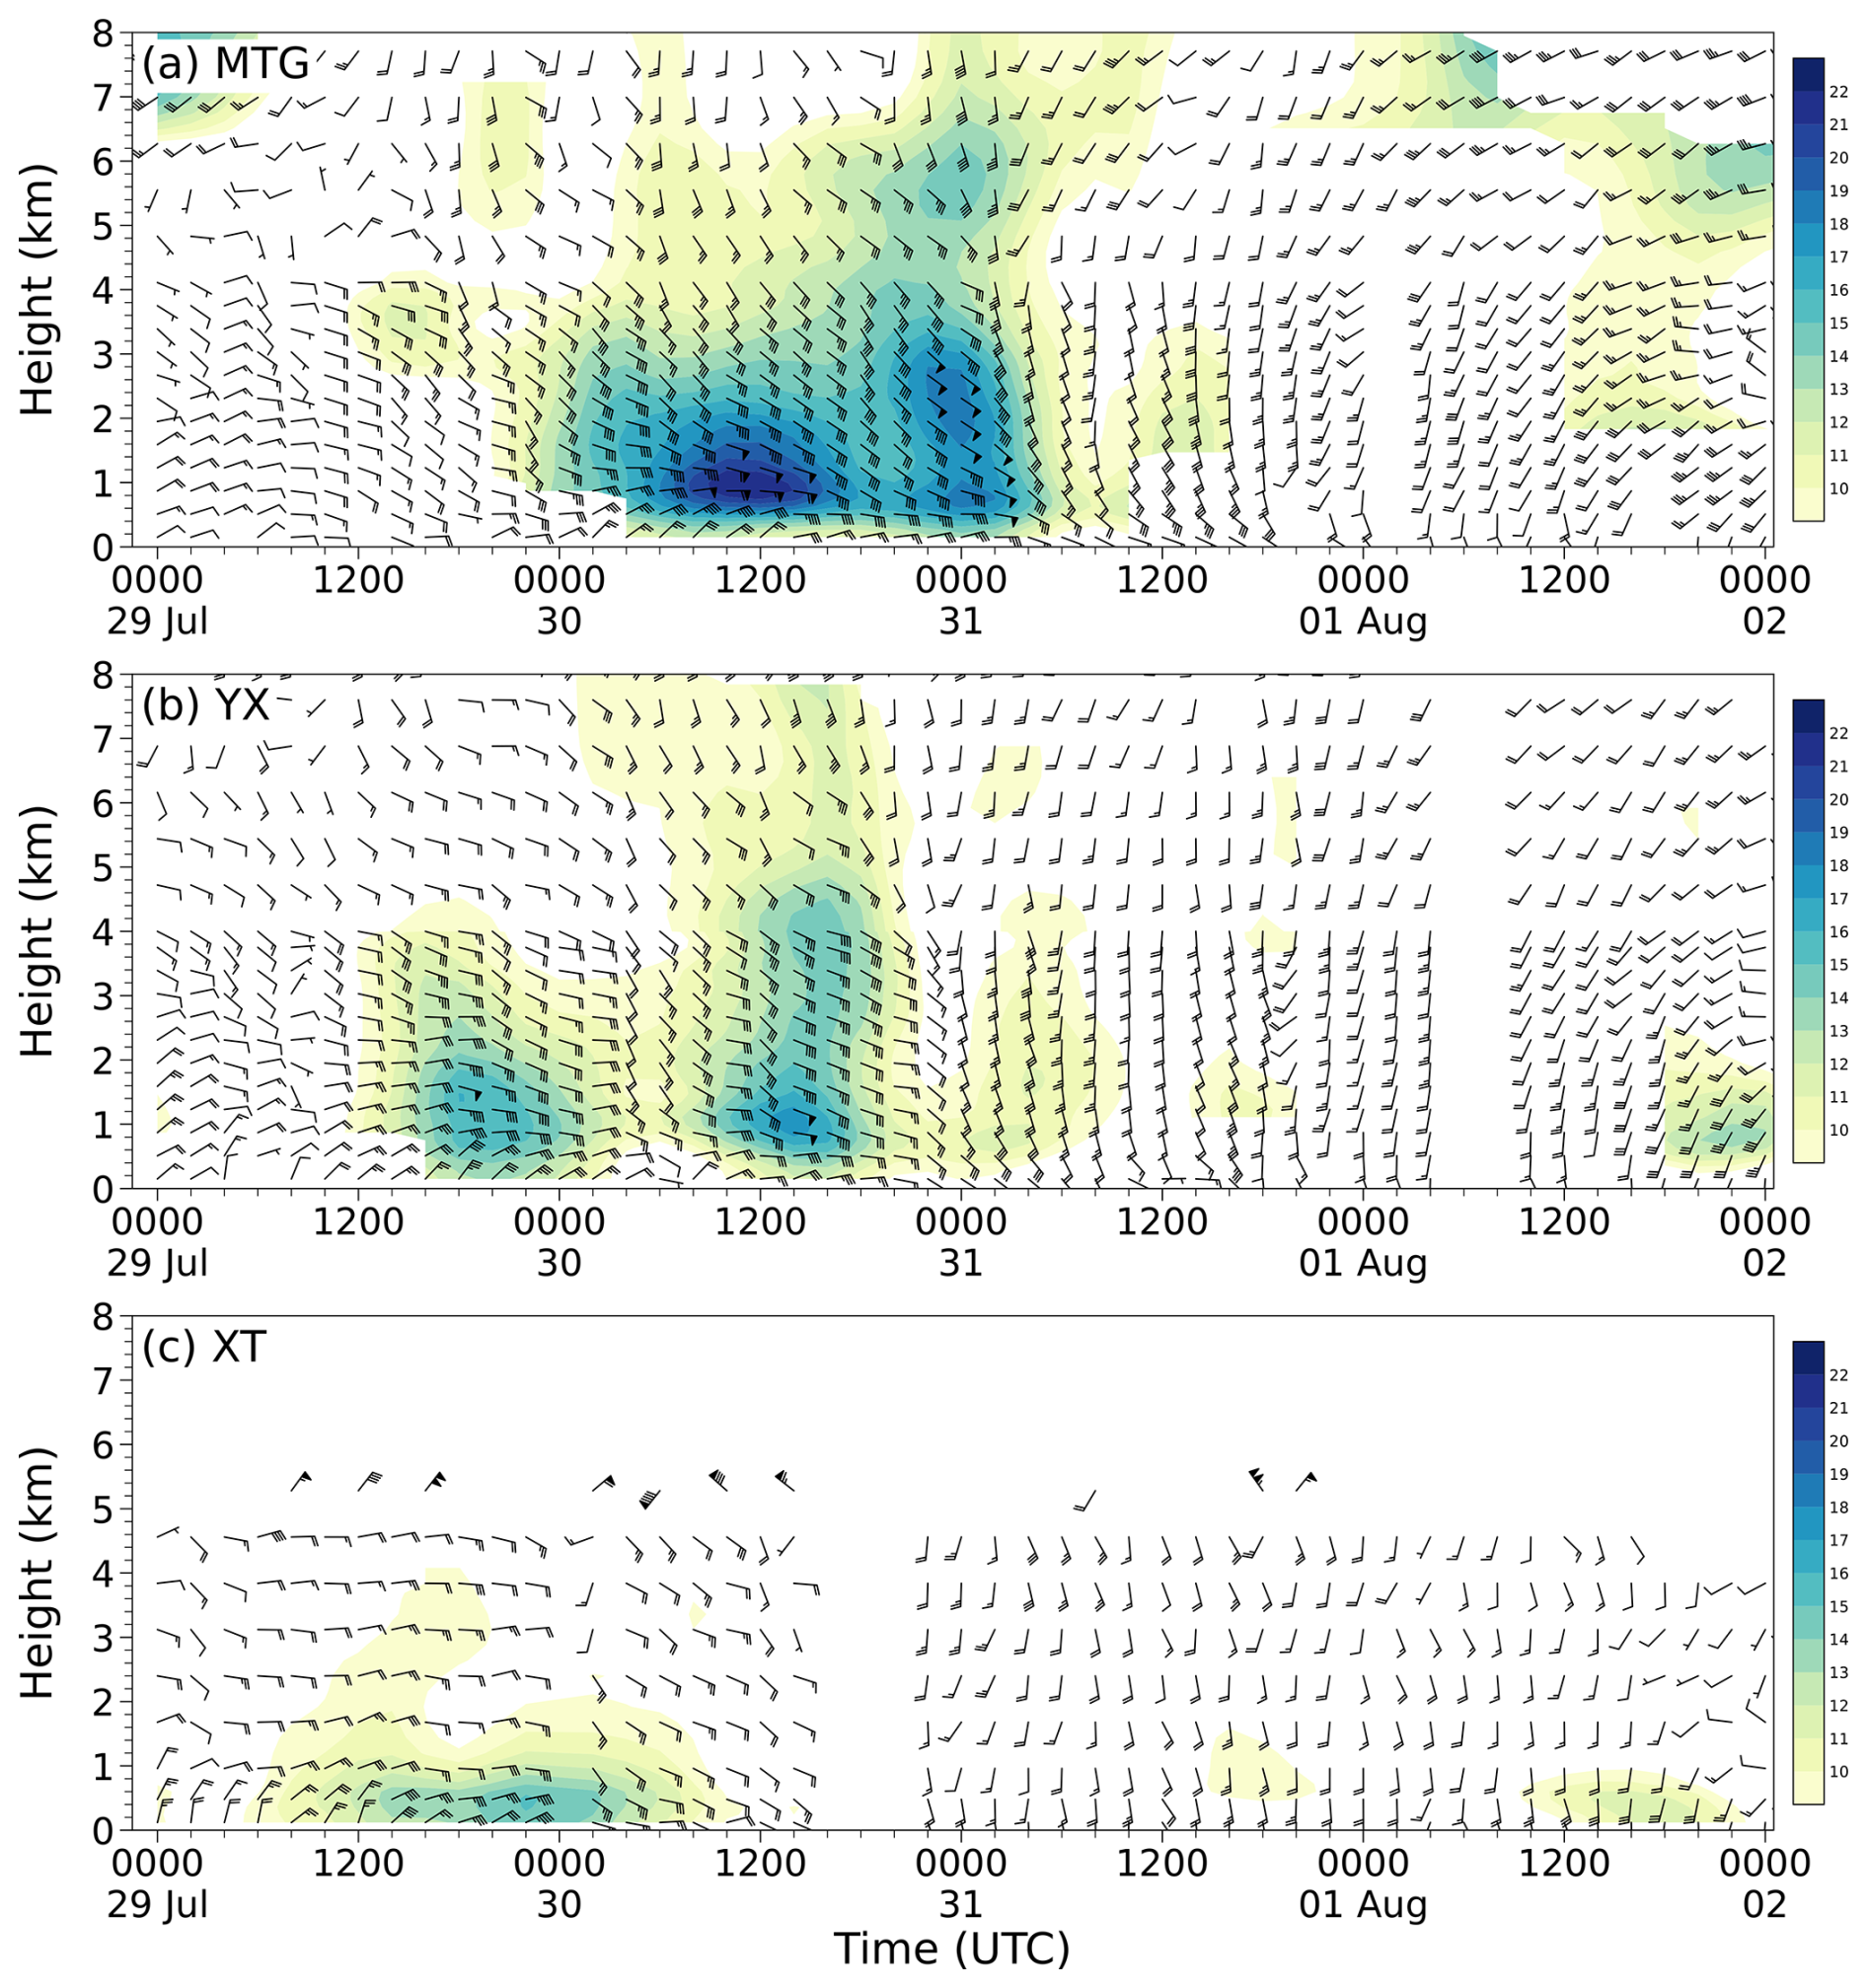
Figure 2Temporal evolution of the wind profile (a full barb is 4 m s−1, and shading denotes wind speed over 10 m s−1) from observations near (a) MTG, (b) YX, and (c) XT during the period of 00:00 UTC on 29 July to 00:00 UTC on 2 August 2023. Note that only the wind profiles below 5 km above the ground were able to be observed due to the limitation of the instrumentation near Xingtai (XT) (see Fig. 1 for their locations).
2.3 Synoptic conditions on 28 July 2023
Figure 3 displays a weather chart at 500 hPa at 12:00 UTC on 28 July 2023. One can see that the large-scale flow patterns show the coexistence of Tropical Storm Khanun (2306) with a remnant vortex originating from Typhoon Doksuri (2305).1 Note that Khanun was in the rapid development stage then, while the vortex weakened significantly at that time. Another important weather system was the WNPSH (denoted by the 588 isoline), with a square-head shape on its western border. Clearly, a water vapour transportation passage was built due to the cyclonic circulation of the tropical storm in combination with the anticyclonic circulation in the southwestern part of the WNPSH. As a result, central China and North China were covered by high levels of precipitable water (PW) of over 68 mm. Similar patterns can be viewed at the level of 850 hPa (not shown).
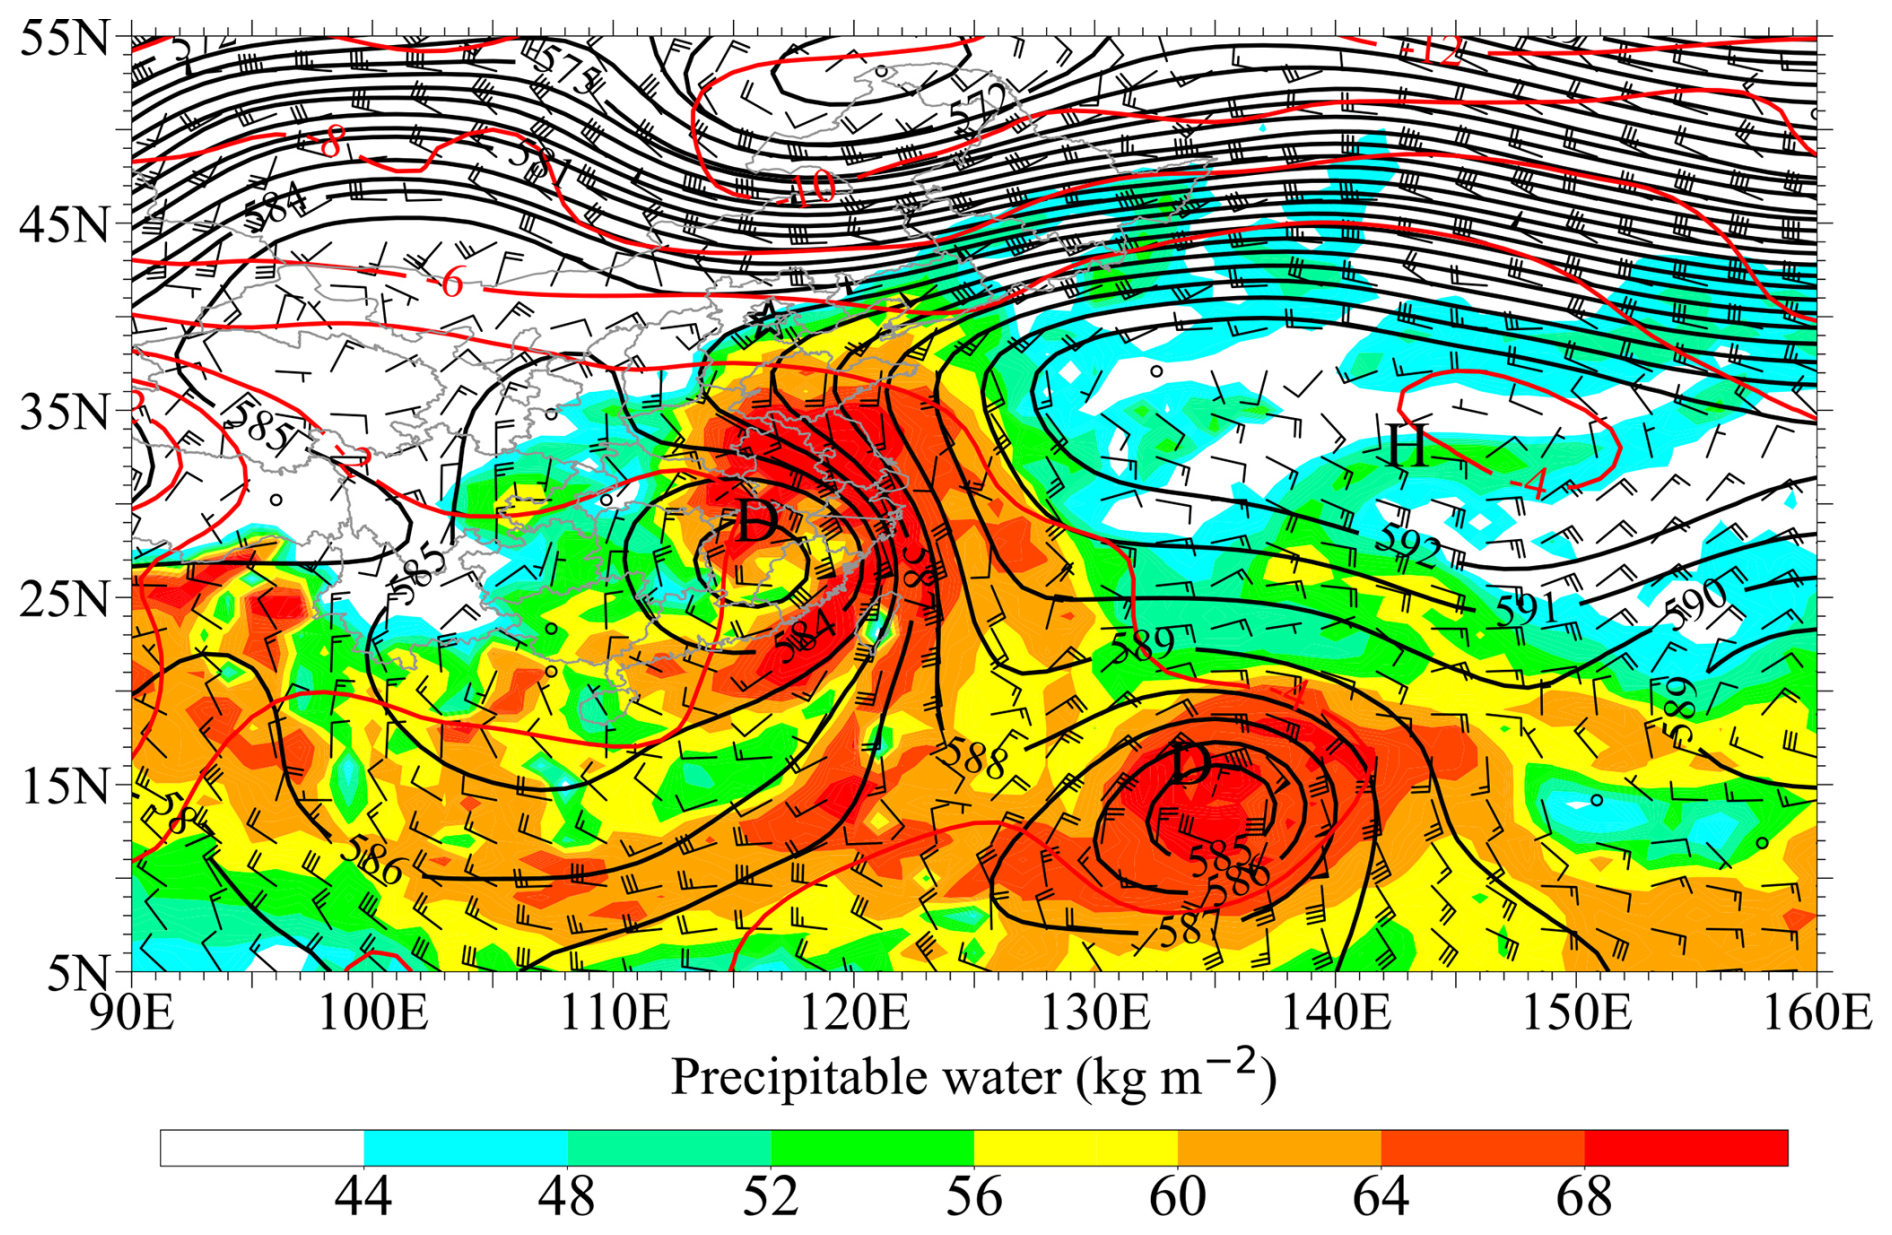
Figure 3Weather chart at 500 hPa at 12:00 UTC on 28 July 2023: geopotential height (black contours at 15 gpm intervals), temperature (red contours at 2 °C intervals), wind barbs (a full barb is 4 m s−1), and precipitable water (kg m−2, shading).
3.1 Model description
In this study, the persistent severe rainfall event is reproduced with the Weather Research and Forecasting (WRF) model version 4.1.3. The WRF model is configured in two-way nested grids with horizontal grid sizes of 9, 3, and 1 km. Figure 4 displays the geographical coverage of the WRF model domains, with 901(nx) × 601(ny), 973 × 1231, and 1231 × 1591 grid points for the outer, intermediate, and inner domains, respectively. The outermost domain (i.e. D01) is centred at 115° E, 35° N, and a total sum of 58σ levels is assigned in the vertical, with the model top fixed at 20 hPa. Since the rainfall is closely associated with the spatial distribution of the orography over North China (Fig. 1), Shuttle Radar Topography Mission (SRTM) high-resolution (90 m) topographic data are employed in the present simulation. It should be noted that the model vertical level distribution was carefully tested and has achieved good performance (Yin et al., 2018, 2020, 2022a, b). The WRF model physics schemes are configured with the Yonsei University (YSU) scheme for the planetary boundary layer (Hong et al., 2004) and the revised MM5 Monin–Obukhov (Jiménez) scheme for the surface layer (Jiménez et al., 2012), as well as the Unified Noah Land Surface Model (Tewari et al., 2004). The rapid radiative transfer model (RRTM) (Mlawer et al., 1997) and the Dudhia scheme (Dudhia, 1989) are used for longwave and shortwave radiative flux calculations, respectively. The Kain–Fritsch cumulus parameterization scheme (Kain, 2004) is utilized for the outer two coarse-resolution domains but is bypassed in the finest domain (i.e. D03). The Thompson-ensemble cloud microphysics scheme is applied to the explicit cloud processes (Thompson et al., 2008; Yin et al., 2022a).
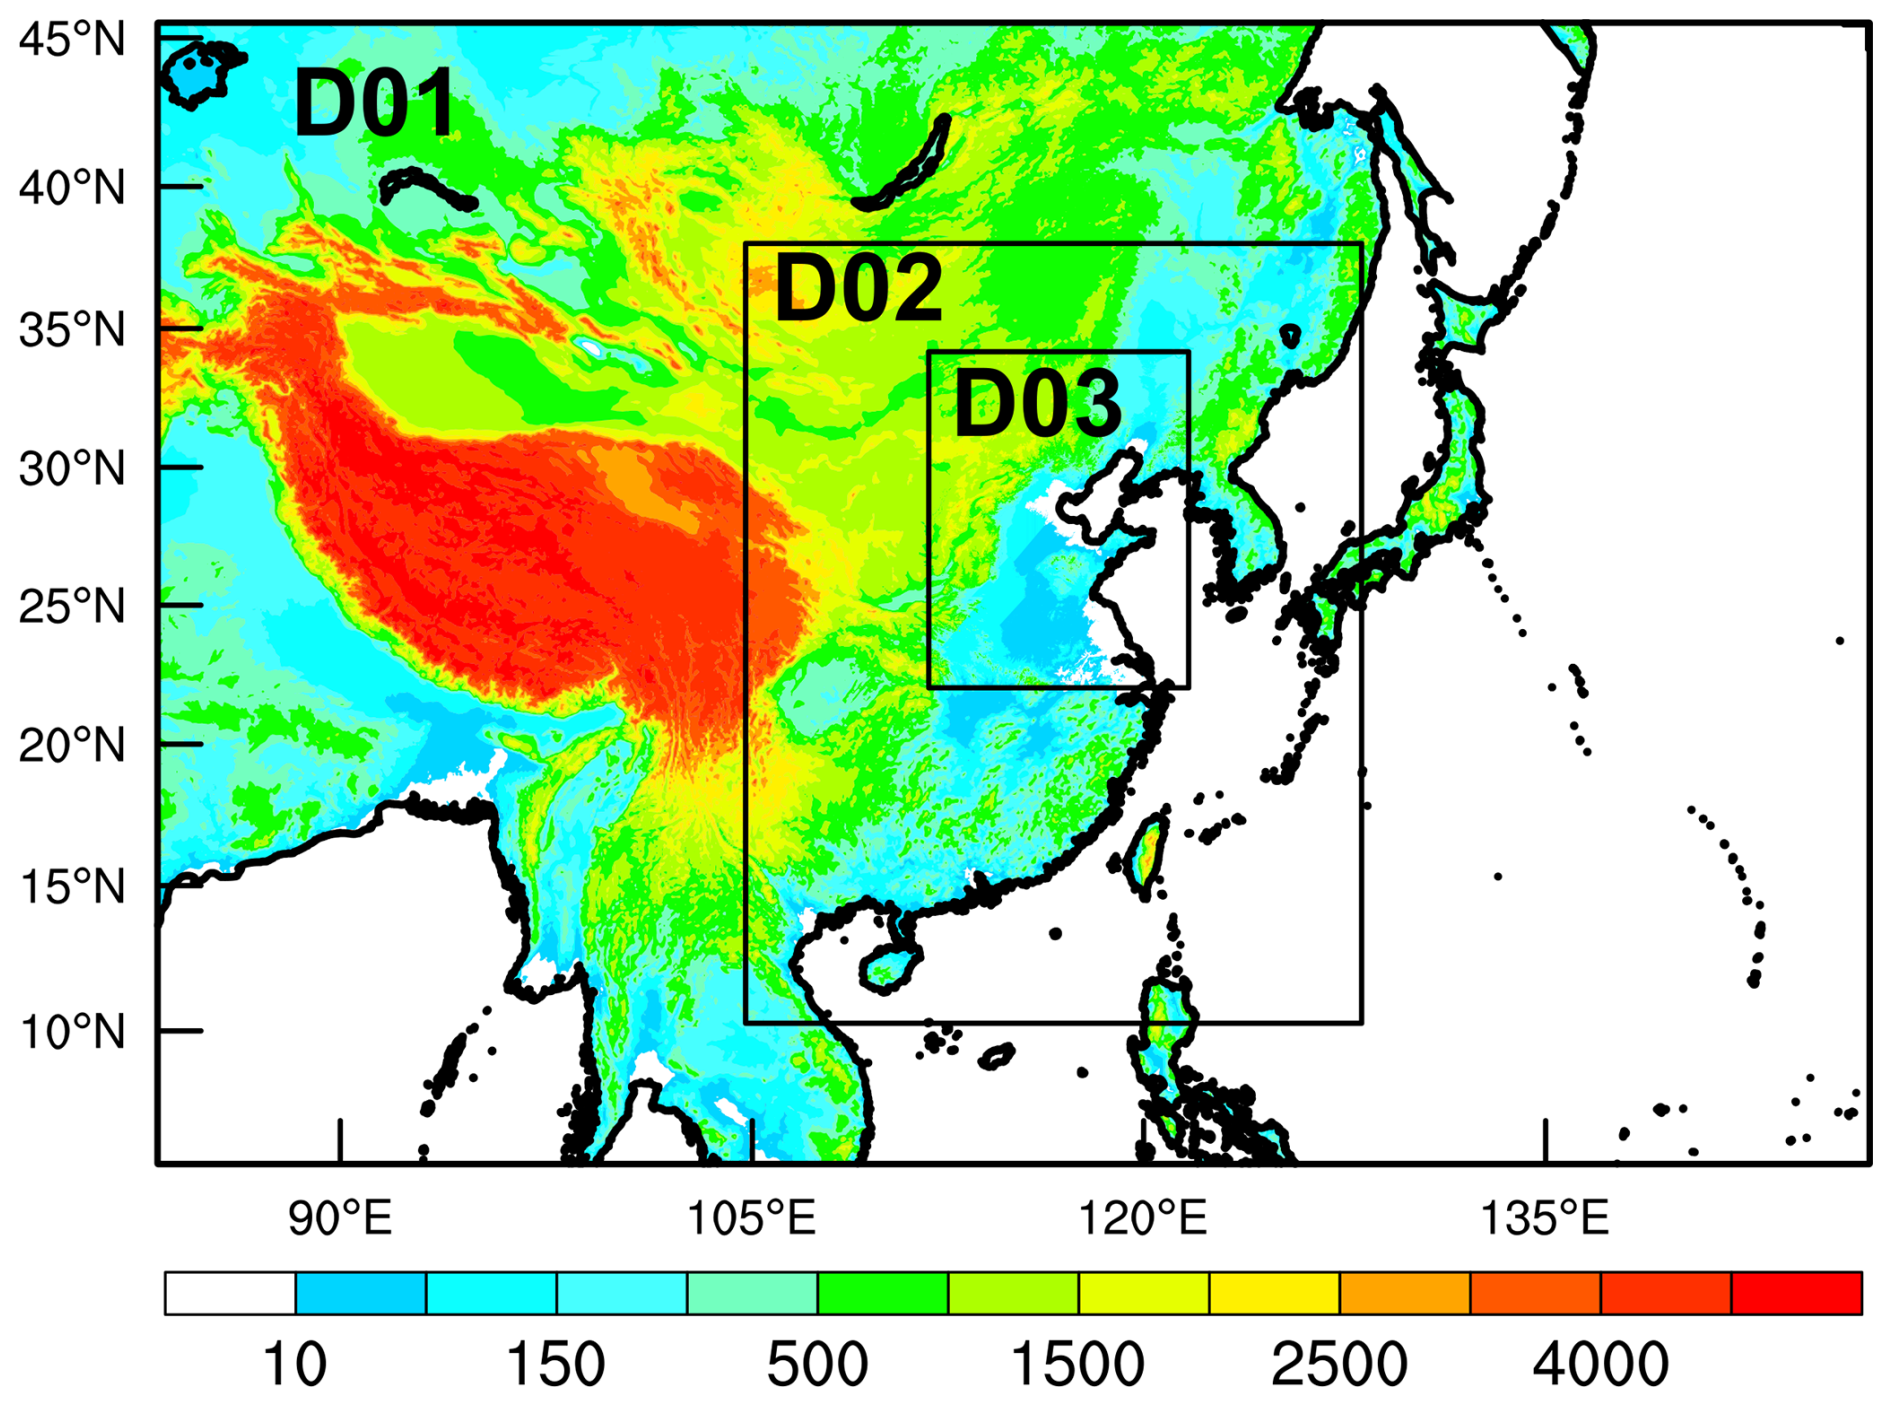
Figure 4The WRF model orography (m, shading) and the nested model domains used for simulations, with the grid sizes of 9 km (D01), 3 km (D02), and 1 km (D03).
The WRF model is integrated for 108 h, starting from 12:00 UTC on 28 July 2023, with outputs at 6 min intervals. The model outputs in the first 12 h are considered the spin-up process and thus are not used for the present work. The initial and outermost boundary conditions are interpolated from the final operational global analysis of 1° × 1° data at 6 h intervals from the Global Forecasting System of the National Centers for Environment Prediction (NCEP). In order to force large-scale fields consistent with the driving fields, grid analysis nudging is activated by performing four-dimensional data assimilation (FDDA) throughout the model integration (Bowden et al., 2012; Stauffer et al., 1991). The innermost domain (i.e. D03) outputs are validated and used for further analysis, and the outermost domain (i.e. D01) outputs are used to demonstrate weather-scale dynamical and thermal features. The wind profiler and surface hourly observations are provided by the National Meteorological Information Centre (NMIC) of the China Meteorological Administration (CMA) after strict quality control.
3.2 Model verification
Figure 5 shows the spatial distribution of 96 h of accumulated rainfall from the simulation during the period from 00:00 UTC on 29 July to 00:00 UTC on 2 August 2023. Generally speaking, the WRF model replicates the spatial distribution of severe rainfall well. The rainfall belt with three rainfall cores coinciding with the orography is reproduced well, and the simulated extreme rainfall amount matches well with the observations. Note that the model produces a 96 h accumulated rainfall peak of 778 mm over the XT region, while a maximum rainfall amount of 1004 mm was observed over the XT region. Despite the simulation underestimating rainfall over this region, it captures the main features of rainfall over central China and North China.
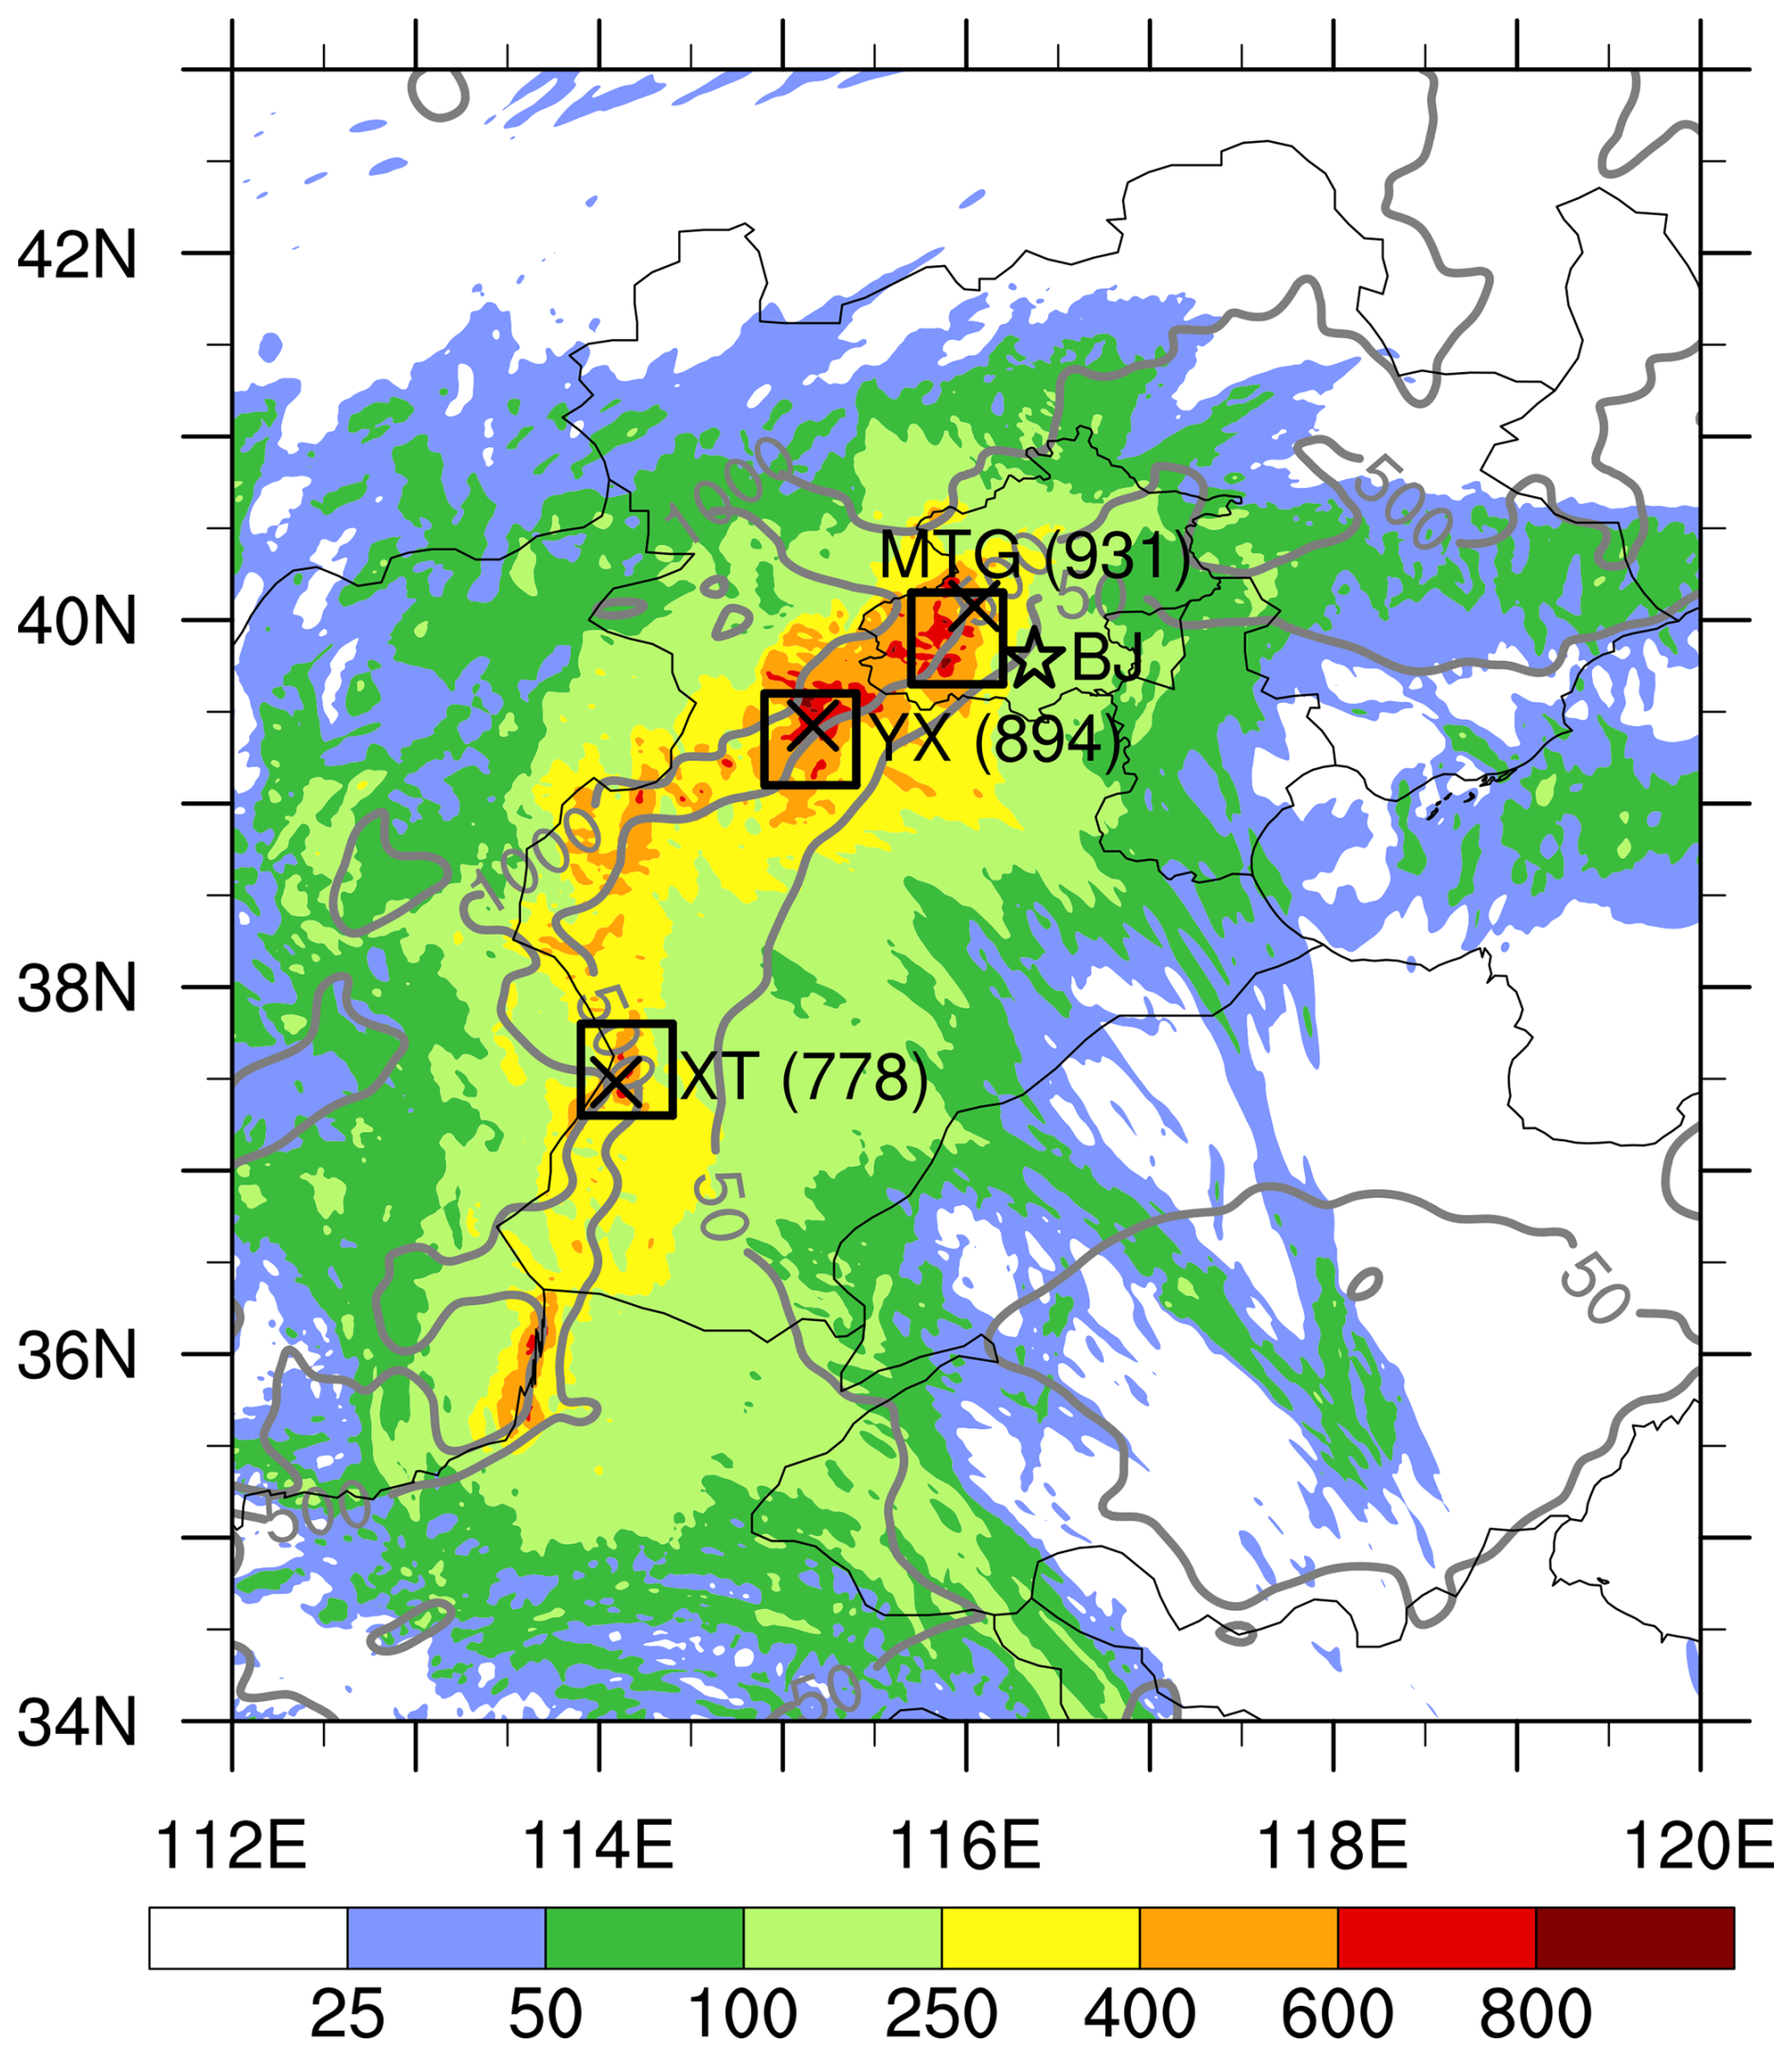
Figure 5Same as Fig. 1 but for the simulated rainfall (mm, shading).
Figure 6 compares the spatial distributions of daily rainfall between observations and simulations during the period from 00:00 UTC on 30 July to 00:00 UTC on 2 August 2023. From observations, one can see that the daily rainfall shows obvious variations. On the first day (Fig. 6a), the rainfall occurred mainly in northern Henan province and southern Hebei province, on the east side of the Taihang Mountains, with rainfall cores over 250 mm. On the next day (Fig. 6b), the rainfall extended significantly northeastward, and a new, strong rainfall core occurred, covering central Hebei province and southwest Beijing. On the third day (Fig. 6c), rainfall significantly decreased in both coverage and intensity, mainly occurring in Beijing and the surrounding areas. On the fourth day (Fig. 6d), rainfall moved eastward and weakened rapidly. It is apparent that the model reproduces the evolution of the rainfall well (Fig. 6e–h), with general characteristics similar to the observations (Fig. 6a–d).
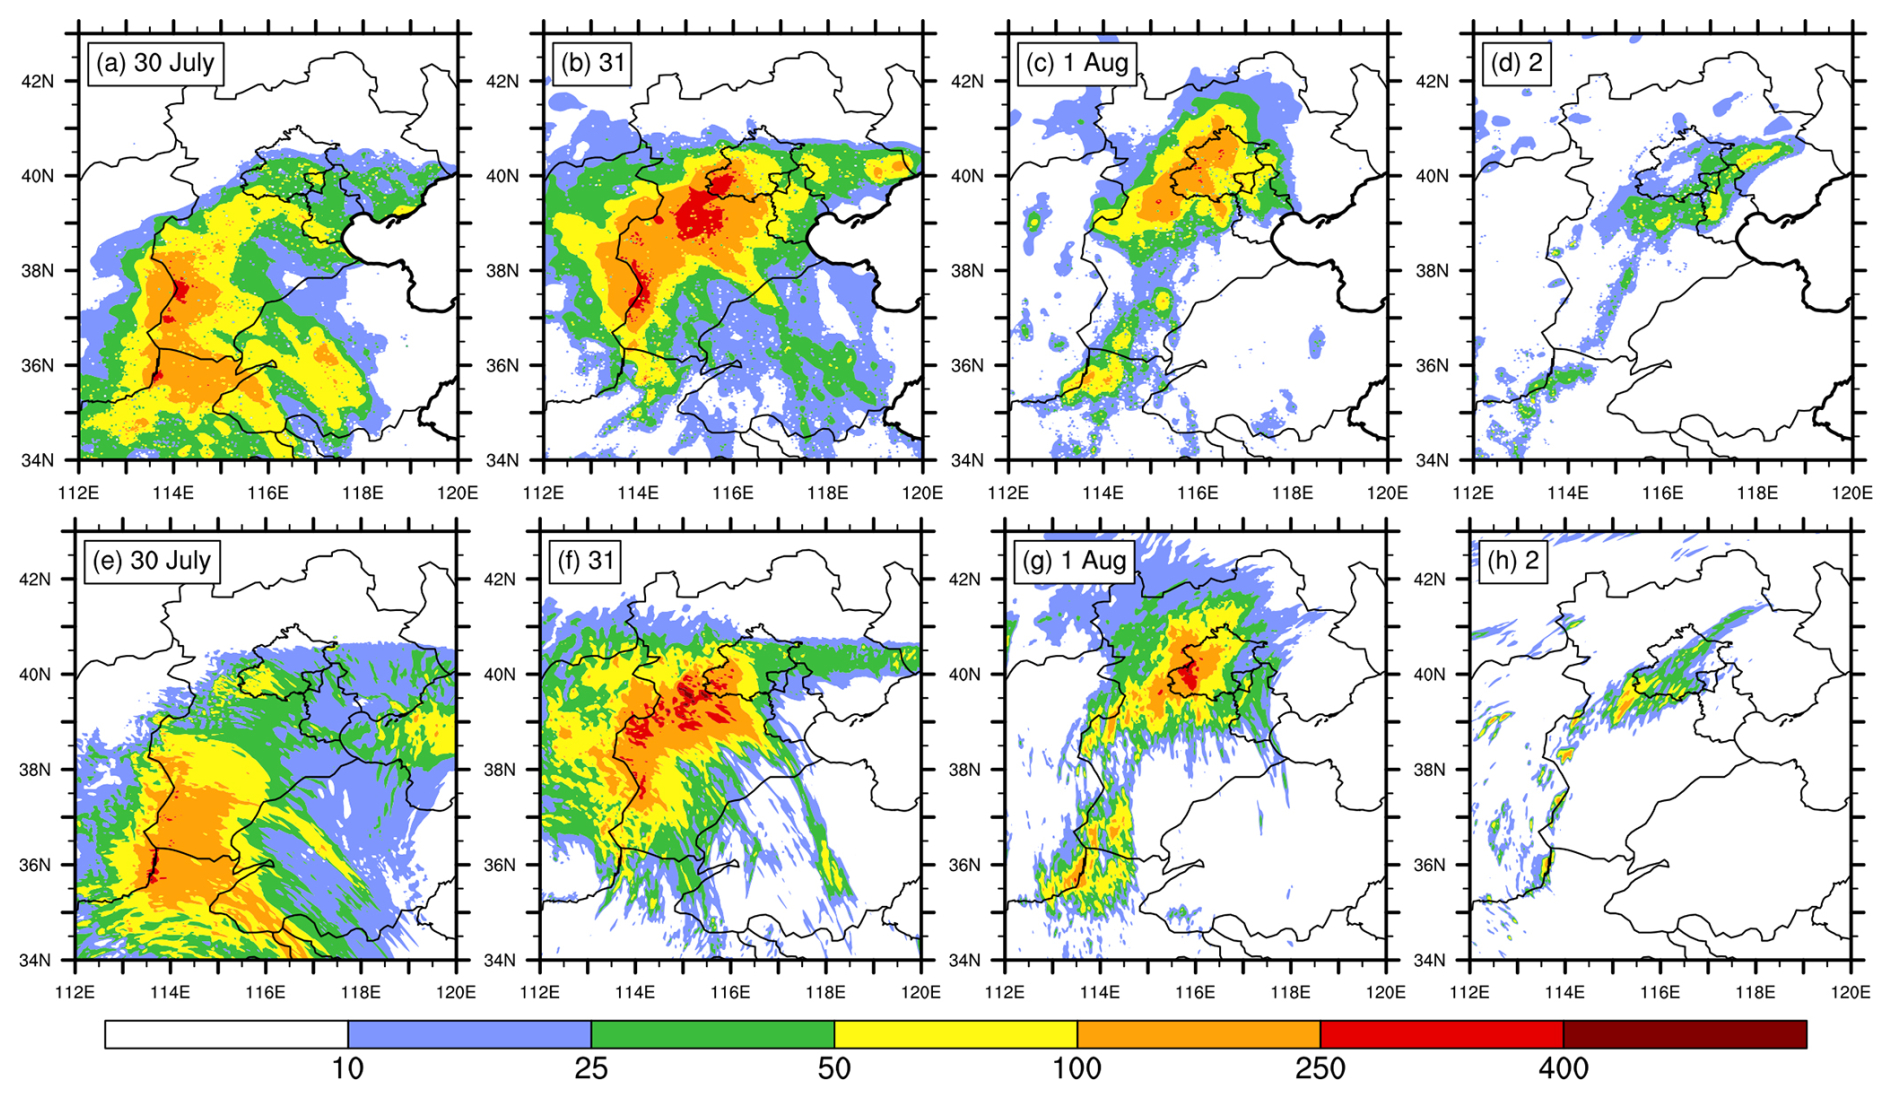
Figure 6Spatial distribution of (a–d) observed and (e–h) simulated daily rainfall (mm) during the period from 00:00 UTC on 30 July to 00:00 UTC on 2 August 2023.
Figure 7 compares the time series of hourly rainfall rates between the observations and the simulations over the MTG, YX, and XT regions. The rainfall event is characterized by long duration, widespread coverage, and high intensity. As has been mentioned above, the rainfall extended from the south to the north, covering Henan province, Hebei province, and Beijing. The rainfall first occurred in the XT region and ended around 00:00 UTC on 31 July 2023. In the wake of that, the rainfall belt moved northeastward, rainfall occurred over both the MTG and YX regions, and it ended around 00:00 UTC on 2 August. The observed timings of initiation and ending of the rainfall event are replicated by the WRF model well, with the observed peaks reproduced as well, although there are some timing biases. For example, the strongest rainfall occurred over the MTG region during the period from 00:00 to 06:00 UTC on 31 July. However, the simulated strongest rainfall has a 6 h lag, occurring from around 06:00 to 12:00 UTC on 31 July, depending on the region. Overall, good agreement between the simulation and observations was obtained in terms of the timing and location of the spatial distribution of rainfall.
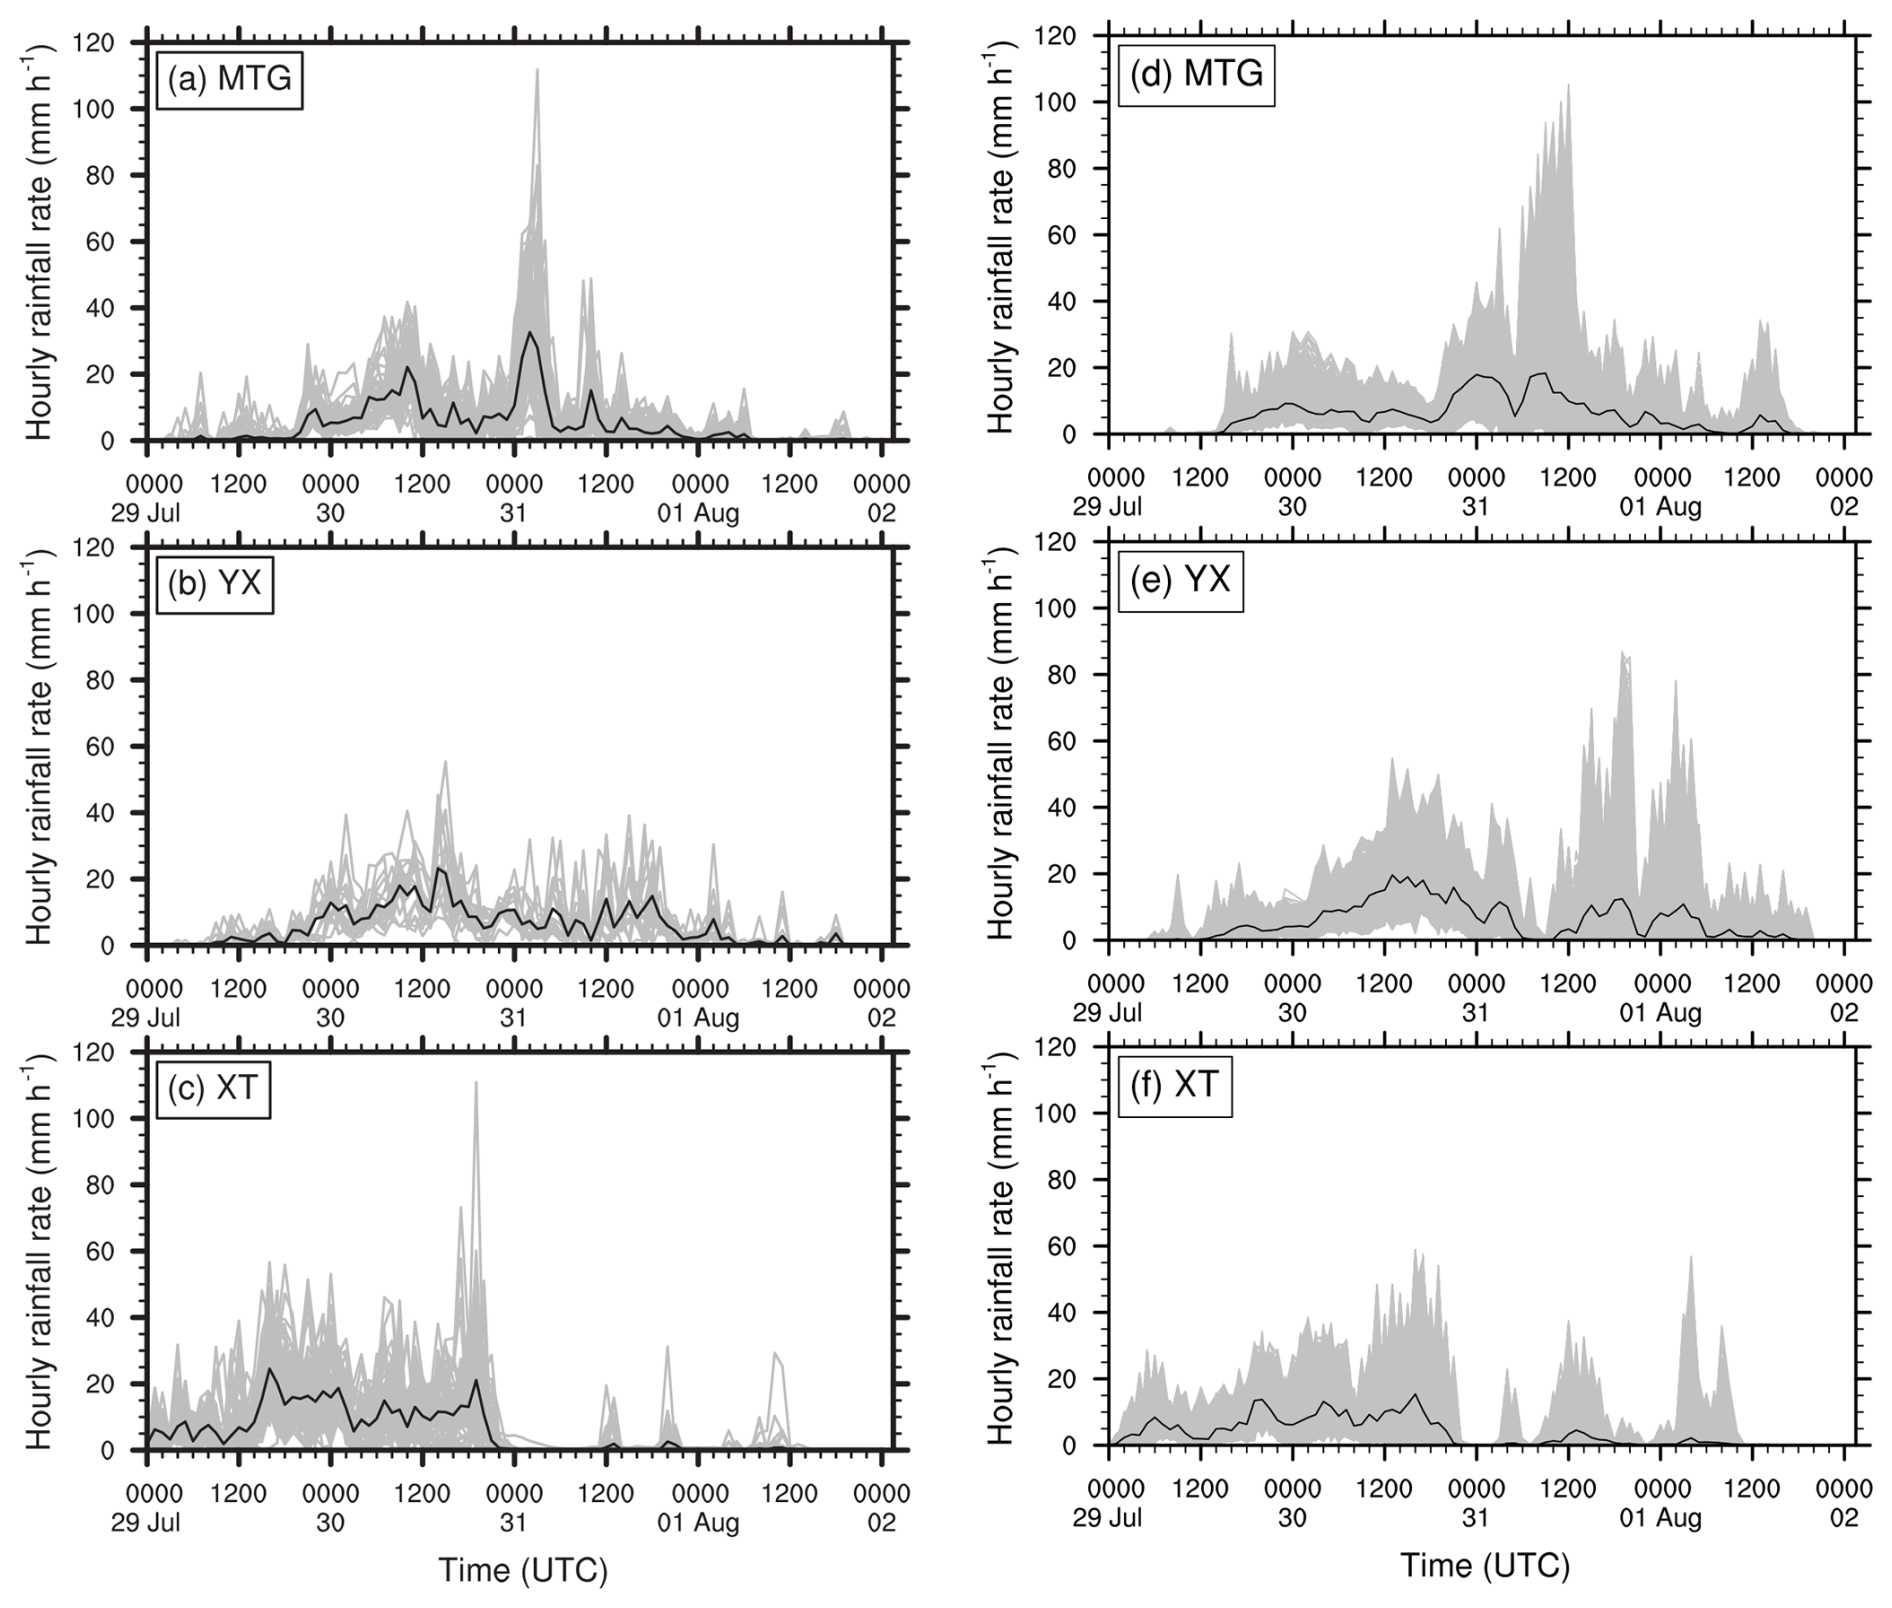
Figure 7Time series of (a–c) the rain gauge observations and (d–f) the simulated hourly rainfall rates (grey lines, mm h−1) for all the stations/grid points over the (a, d) MTG, (b, e) YX, and (c, f) XT regions during the period from 00:00 UTC on 29 July to 00:00 UTC on 2 August 2023. The black line denotes the domain-averaged hourly rainfall rates over all the stations (grid points) from observations (simulations) (see Fig. 1 for their locations). In total, 74, 19, and 67 observations are used for (a) MTG, (b) YX, and (c) XT, respectively. For the simulations, there are (d) 2296, (e) 2365, and (f) 2420 grid points.
The evolution of the simulated wind profile is presented in Fig. 8. Similar to the observations (Fig. 2), the simulated easterly wind increased gradually from approximately 12:00 UTC on 29 July, corresponding to the start of the precipitation (Fig. 6e–h). The horizontal wind shifted from easterly to southerly, except near the ground, and then turned to the southwest, with wind speeds decreasing significantly. Overall, the variations in the simulated wind profile were consistent with those observed, indicating that the WRF model was able to capture the main features of the wind profile well. Based on the wind profile and rainfall features, the simulated rainfall process is roughly divided into two stages. The shift moments (roughly marked by thick black lines) are around 08:00 UTC on 31 July, 20:00 UTC on 30 July, and 16:00 UTC on 30 July for the MTG, YX, and XT regions, respectively. It should be noted that the wind field was significantly influenced by Typhoon Khanun (2306) and the remnant vortex originating from Typhoon Doksuri (2305) during the present event. As the typhoon gradually moved northwestward and the vortex weakened, the first region to be affected was Xingtai (XT) in the south, then Yixian (YX) in the centre, and finally Mentougou (MTG) in the north, suggesting that the wind shift occurred at different moments.
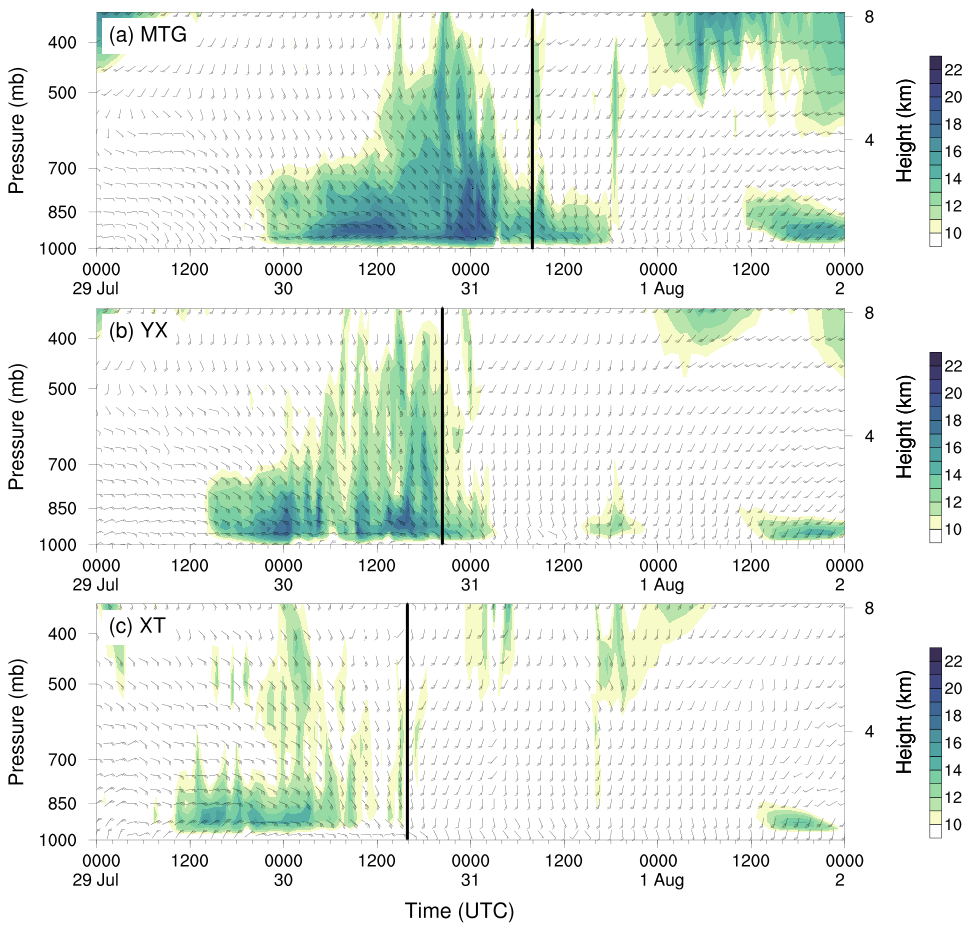
Figure 8Same as Fig. 2 but for the simulations. The black lines denote wind shifts from southeasterly to southerly/southwesterly over the levels in the low to middle troposphere, which roughly divided the rainfall event into two stages.
4.1 Dominant dynamic processes for convection initialization
The evolution of the dynamical and thermal systems of the rainfall event in the first stage is shown in Fig. 9. Although only a remnant vortex remained over central China at this time, Typhoon Doksuri had an important influence on the WNPSH when it was still a super typhoon. Several days before the rainfall event, Super Typhoon Doksuri was close to the WNPSH, and the southwest WNPSH edge was within the typhoon's outer region. Owing to the inflow mass flux entering the typhoon region, the southwest part of the WNPSH was severely weakened by Typhoon Doksuri (Sun et al., 2015). As a result, the west boundary of the WNPSH appeared to retreat eastward from 500 to 850 hPa, showing an inclined vertical distribution on its western boundary, especially from 700 to 850 hPa. Capped by the inclined WNPSH, water vapour was mainly transported to North China through a passage under approximately 850 hPa that was built by the typhoon remnant vortex combined with Tropical Storm Khanun. At 500 hPa (Fig. 9a), the WNPSH (represented by the 588 isoline) covered a large part of eastern China, with an unusual westward extension of the northwest corner over northwestern China. At that time, the northwest corner extended much further westward compared to its position 12 h previously (Fig. 3). Similar patterns can be seen at 700 hPa (Fig. 9b), but the west boundary of the WNPSH (represented by the 316 isoline) retreated to the East China Sea, except for the northwest corner. At 850 hPa (Fig. 9c), the WNPSH (represented by the 156 isoline) completely retreated to the western North Pacific, far away from China.
The spatial distribution of the high PW was consistent with that of a large equivalent potential temperature (θe) of 344 K at 500 hPa, indicating that the 334 K contour covered a relatively warm and/or wet region (Fig. 9a). Most importantly, the boundary of the high PW corresponded to a large value of the potential temperature gradient over 8 K on the east side and 12 K on both the north and west sides. Previous studies (e.g. Rao et al., 2023) proposed that the heavy rainfall region was closely connected to the distributions of θe. Although the warm and moist conditions were favourable for precipitation, the unfavourable large-scale forcings explain well why no deep convection formed over this region (marked with a dashed box in Fig. 9c, d). The convergence, resulting from changes in wind direction and wind speed, was conducive to triggering convection. Consequently, the weak convergence led to weak lifting and consequent precipitation. Since the convergence occurred at the junction of cold and warm air masses, like a warm-front rainfall, rainfall formed with low intensity but a long duration and widespread coverage. It is important to note that the spatial distribution of rainfall is usually considered to be consistent with the western boundary of the WNPSH (i.e. the 588 isoline) at 500 hPa. However, the spatial distribution of rainfall in the present event is consistent with the dense zone of θe instead of the western boundary of the WNPSH. Therefore, in addition to the isoline 588 at 500 hPa, the spatial distribution of θe needs to be given more attention in future operational forecasts.
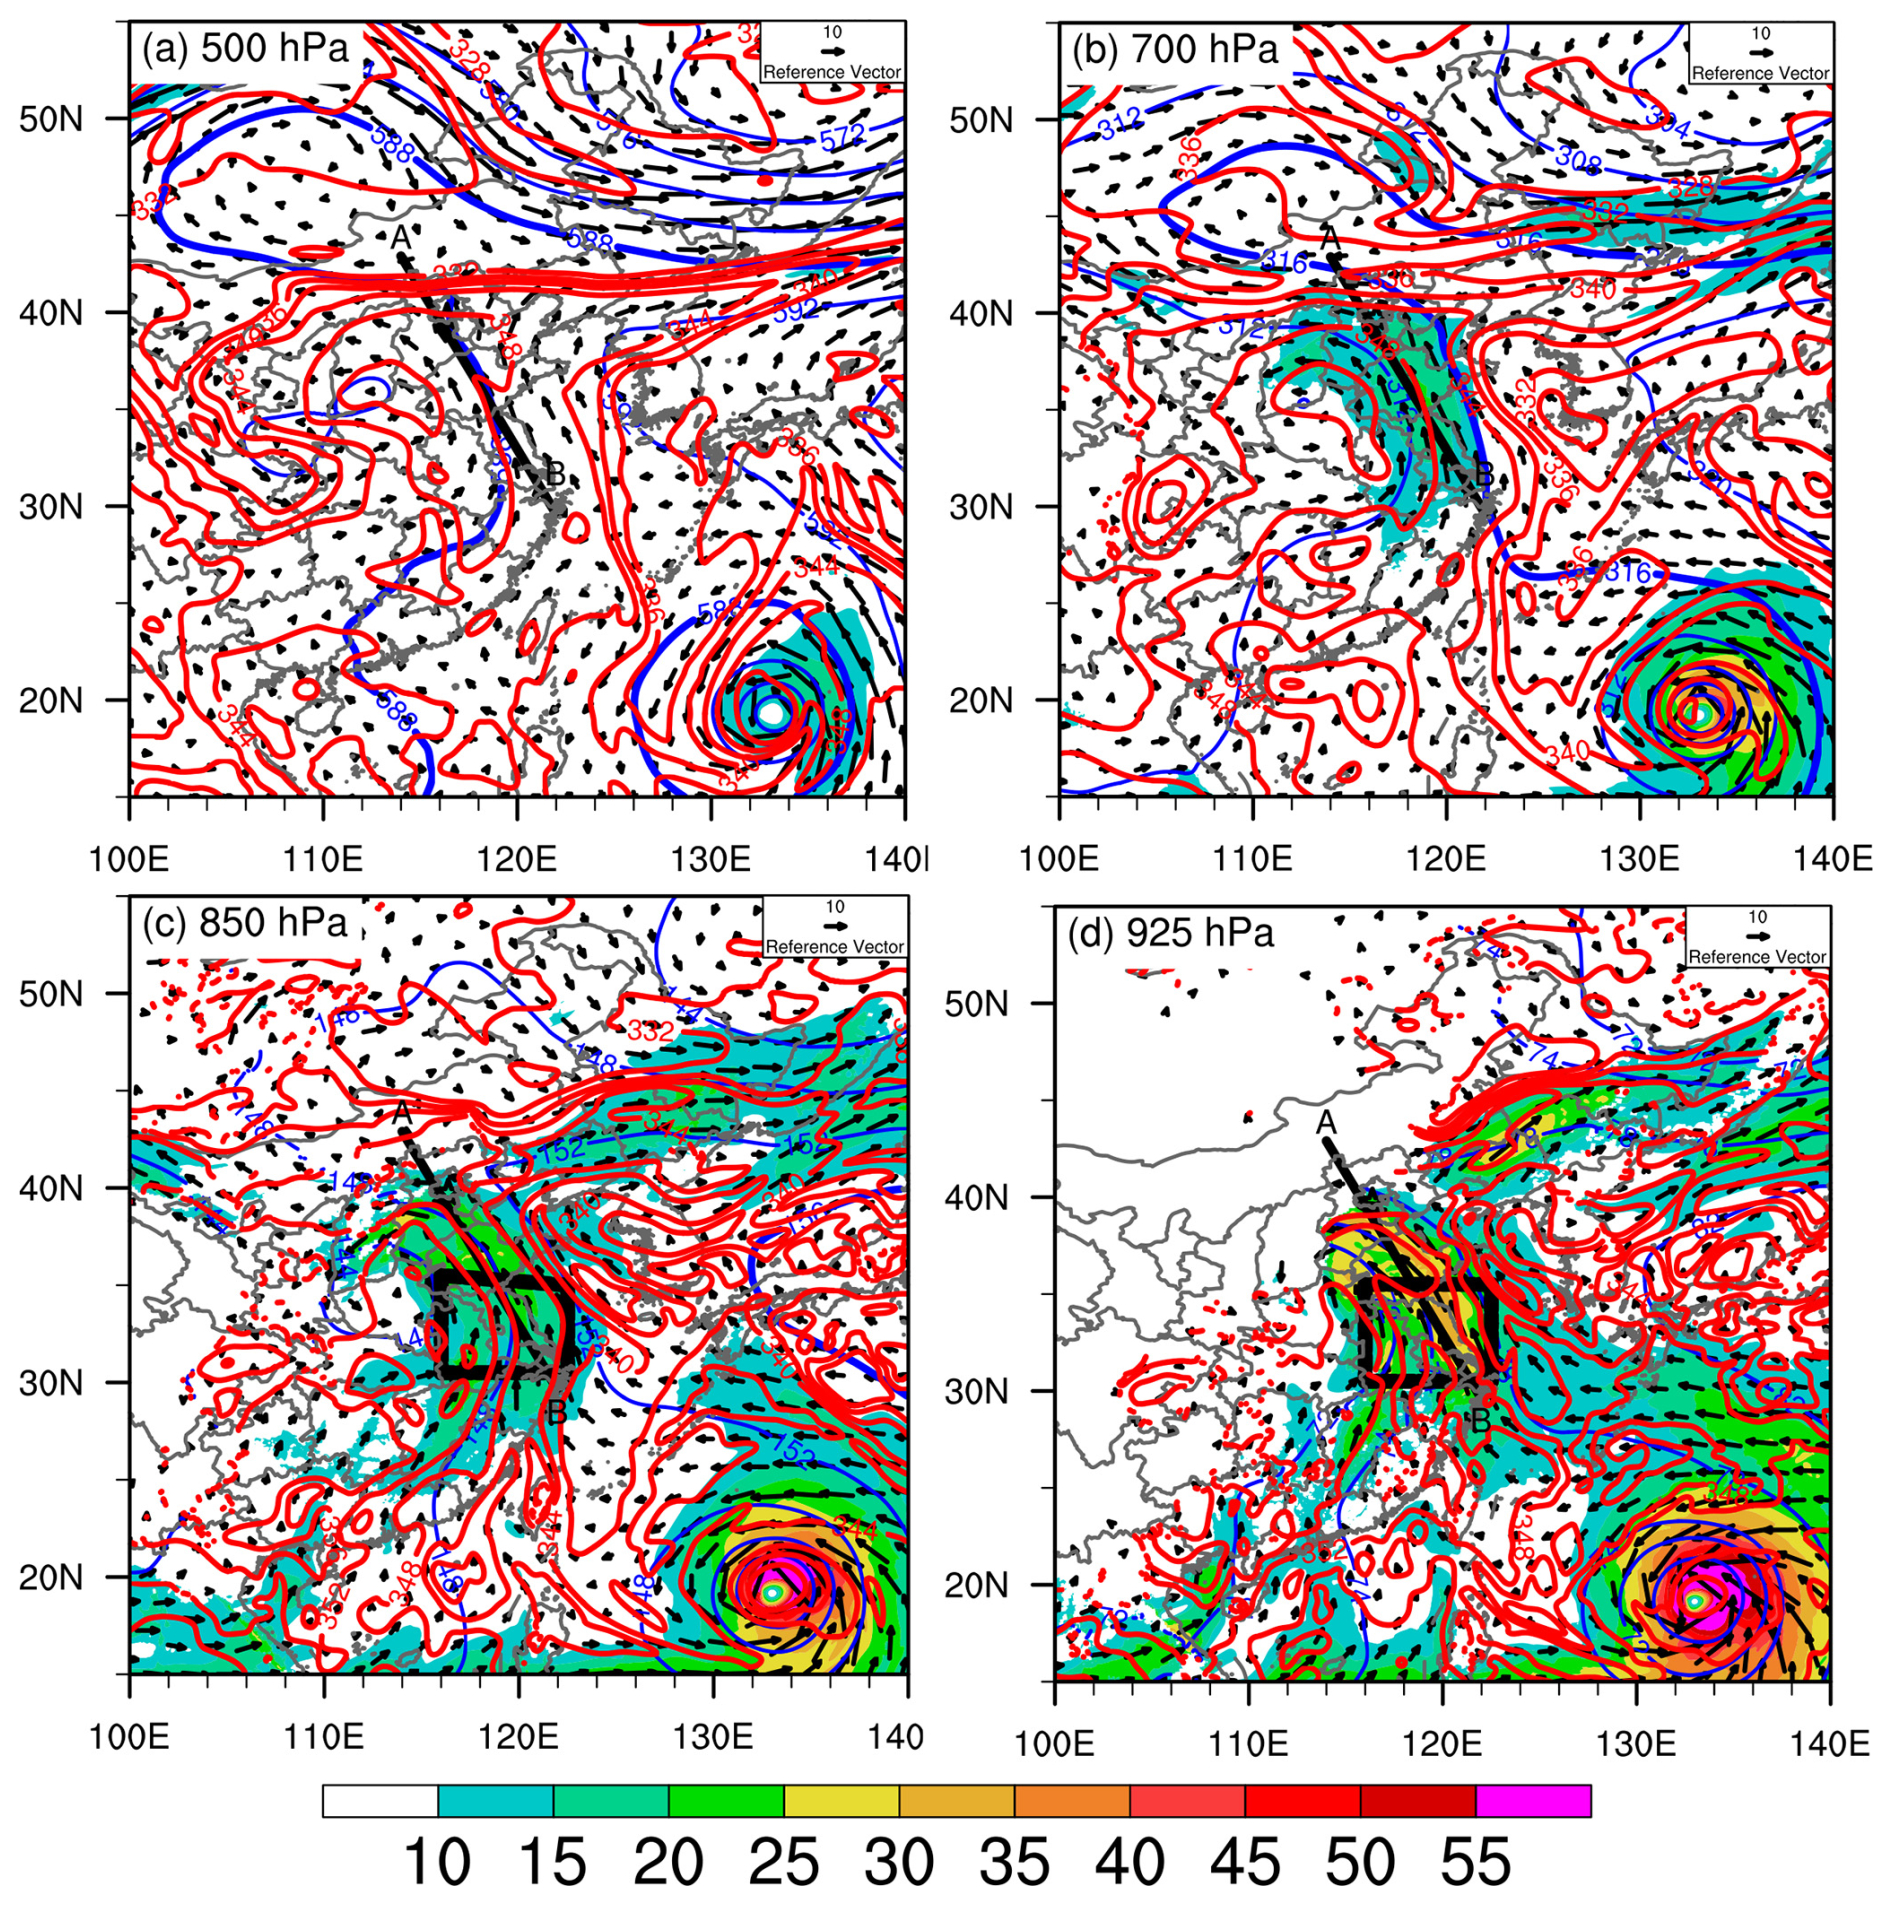
Figure 9Spatial distribution of geopotential height (blue contours at 40 gpm), equivalent potential temperature (red contours at 2 K intervals, θe), wind barbs (a full barb is 4 m s−1), and water vapour flux (g s−1 cm−1 hPa−1, shading) from the model D01 at 00:00 UTC on 30 July 2023: (a) 500 hPa, (b) 700 hPa, (c) 850 hPa, and (d) 925 hPa. The isolines at 588, 316, and 156 are bolded to represent the WNPSH at 500, 700, and 850 hPa, respectively. The convergence zone of southeast and southwest flows is marked by a dashed box in panels (c) and (d). The thick black line A–B denotes the location of the cross-section along the water vapour transport pathway used in Fig. 10. Publisher's remark: please note that the above figure contains disputed territories.
The warm and moist features over North China can also be seen from the cross-section along the line A–B, as shown in Fig. 10. The western orography region was occupied by a cold air mass over the levels above 3.0 km. Under the conditions, significant equivalent potential temperature gradients were established between the warm and cold air masses, similar to a warm front. Meanwhile, owing to the blocking of the orography below 1.3 km and the strong cold air mass above 3.0 km, only the southeasterly flows between 1.3 and 3.0 km a.s.l. (kilometres above sea level) were able to pass over the mountains. It should be noted that although the warm and moist southeasterly flows were lifted by the orography, they could not move further upward to trigger convection because of the local capped cold and dry air masses overhead. Consequently, convergence mainly resulted from the changes in wind direction and wind speed caused by upward motion. As the warm and moist air was lifted, condensation occurred and even generated precipitation. It should be emphasized that the lifting was too weak to allow convection to be highly organized (Fig. 10). For example, the updraughts in strong, deep-convective systems (e.g. Yin et al., 2020, 2022c) are 5–10 times as large as the updraughts in the present event. Therefore, the weak lifting was responsible for the rainfall with large coverage but low intensity. Aside from this, the continuous and stable water vapour supply was another favourable factor for the precipitation.
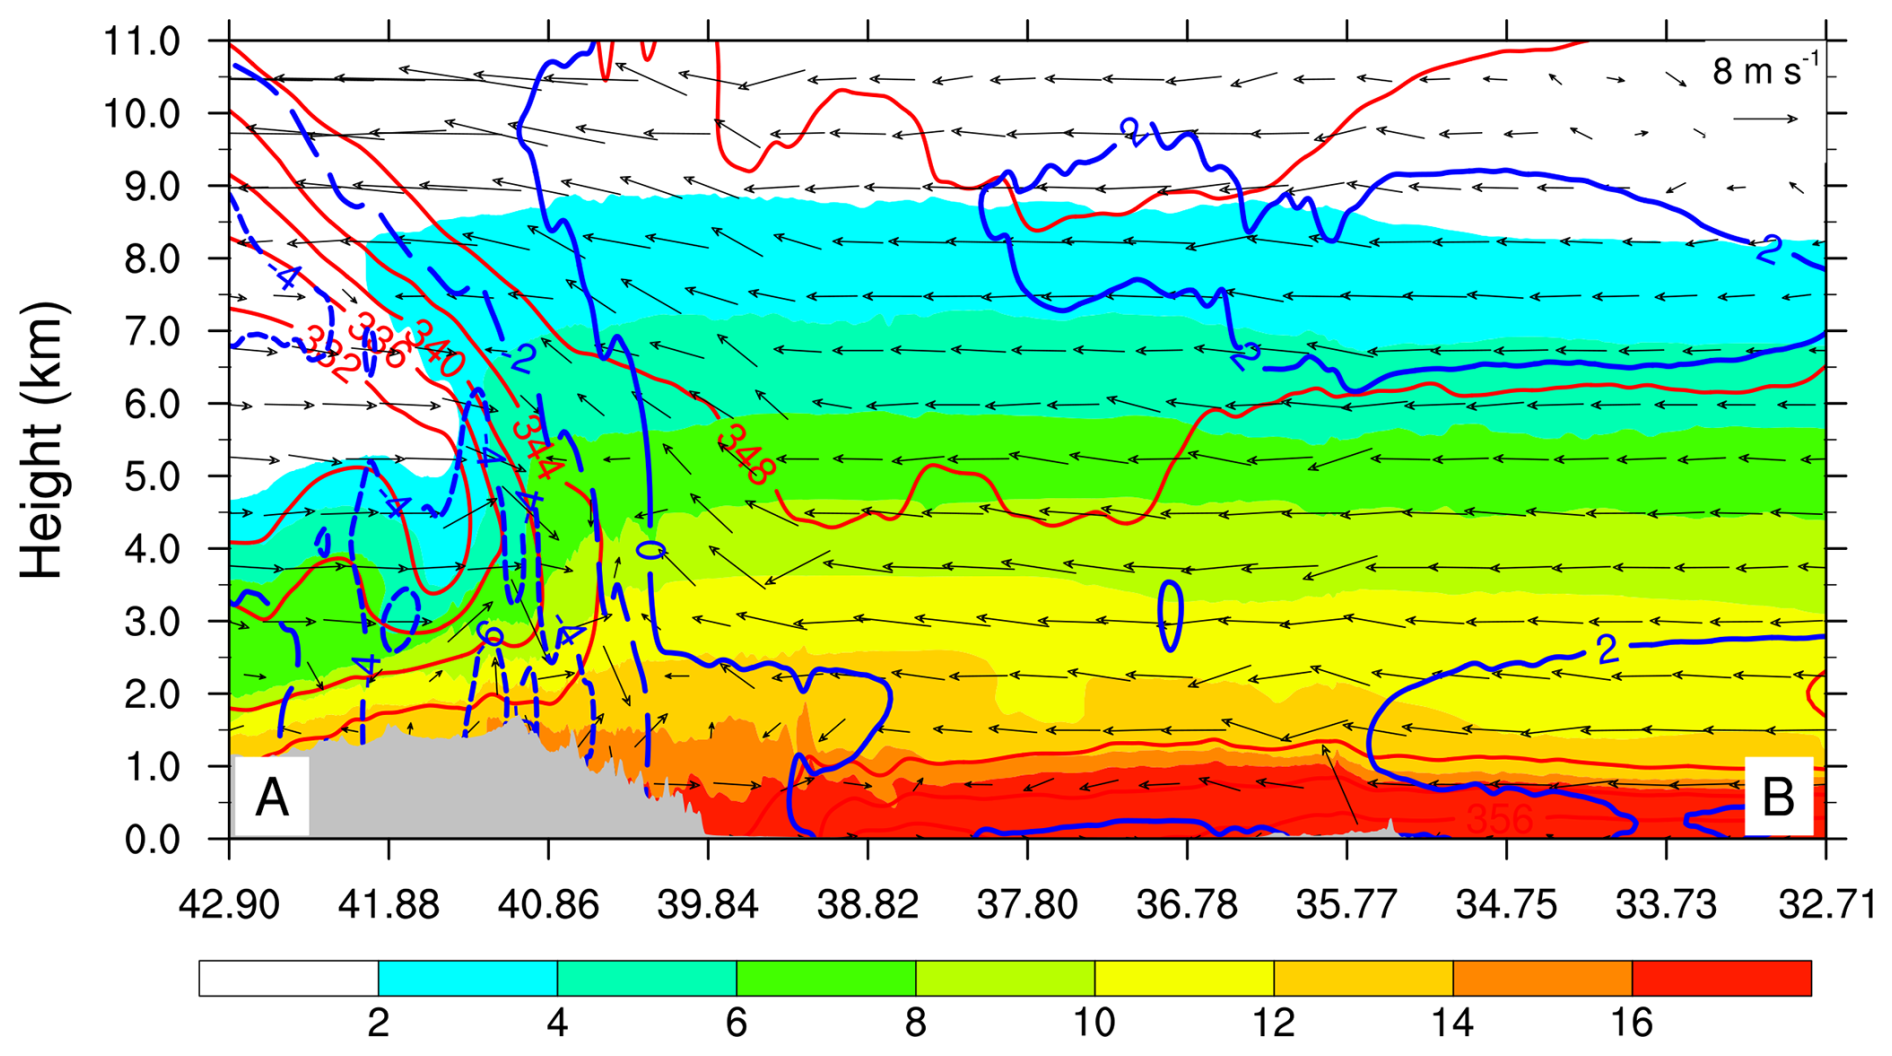
Figure 10Vertical cross-section along the line A–B given in Fig. 9 for the following: temperature deviations (blue contours at 2 °C intervals) from their level-averaged values in the cross-section, equivalent potential temperature (red contours at 4 K intervals), the water vapour mixing ratio (qv in g kg−1, shading), and in-plane flow vectors (vertical motion amplified by a factor of 20) at 00:00 UTC on 30 July 2023. Grey shading denotes terrain.
Also from Fig. 10, one can see that North China was surrounded by warm, dry air masses on the east side and cold, dry air masses on both the north and west sides. More specifically, the air mass at the levels above 1 km on the east side was over 3 °C warmer than surrounding regions, but the water vapour mixing ratio (qv) was less than 14 g kg−1 (humidity was less than 70 %) because this region was controlled by the WNPSH. The warm, dry cap overhead explains the absence of convection and rainfall over this region well (see Figs. 5 and 6). On the north and west sides, the air masses were dry, with qv less than 2 g kg−1. The air was over 3 °C colder than the surrounding region, except for the air near the ground. Since the warm air near the ground might be associated with radiative heating from the ground owing to being capped by the cold and dry air overhead, it is understandable that convection was not enhanced over the mountains.
In the second stage (Fig. 11), obvious differences in dynamical and thermal processes can be seen compared to those in the first stage (cf. Fig. 9). At 500 hPa (Fig. 11a), the WNPSH expanded further westward, with its western border reaching western China. It should be emphasized that the southwestern part of the WNPSH was severely damaged by the rapid intensification of Khanun into a super typhoon. Meanwhile, as the trough deepened over northeastern China, cold air from the north poured southward. Consequently, a north–south orientated θe dense zone was established over eastern China. Similar patterns in θe and the horizontal wind field can be seen at 700 hPa (Fig. 11b). However, the WNPSH (represented by the 316 isoline) was further disrupted as Khanun continued to intensify; it seems that the WNPSH retreated to the East China Sea, except for the northwest corner. The north–south orientated θe dense zone largely prevented water vapour from being transported to North China above 850 hPa, and thus water vapour was mainly transported to North China by a shallow southeasterly flow near the ground (Fig. 11c, d). Consequently, the water vapour flux was significantly reduced (Fig. 12a). Aside from this, North China was dominated by southerly flows over levels above 500 hPa, and thus mid-tropospheric wind shear was significantly enhanced.
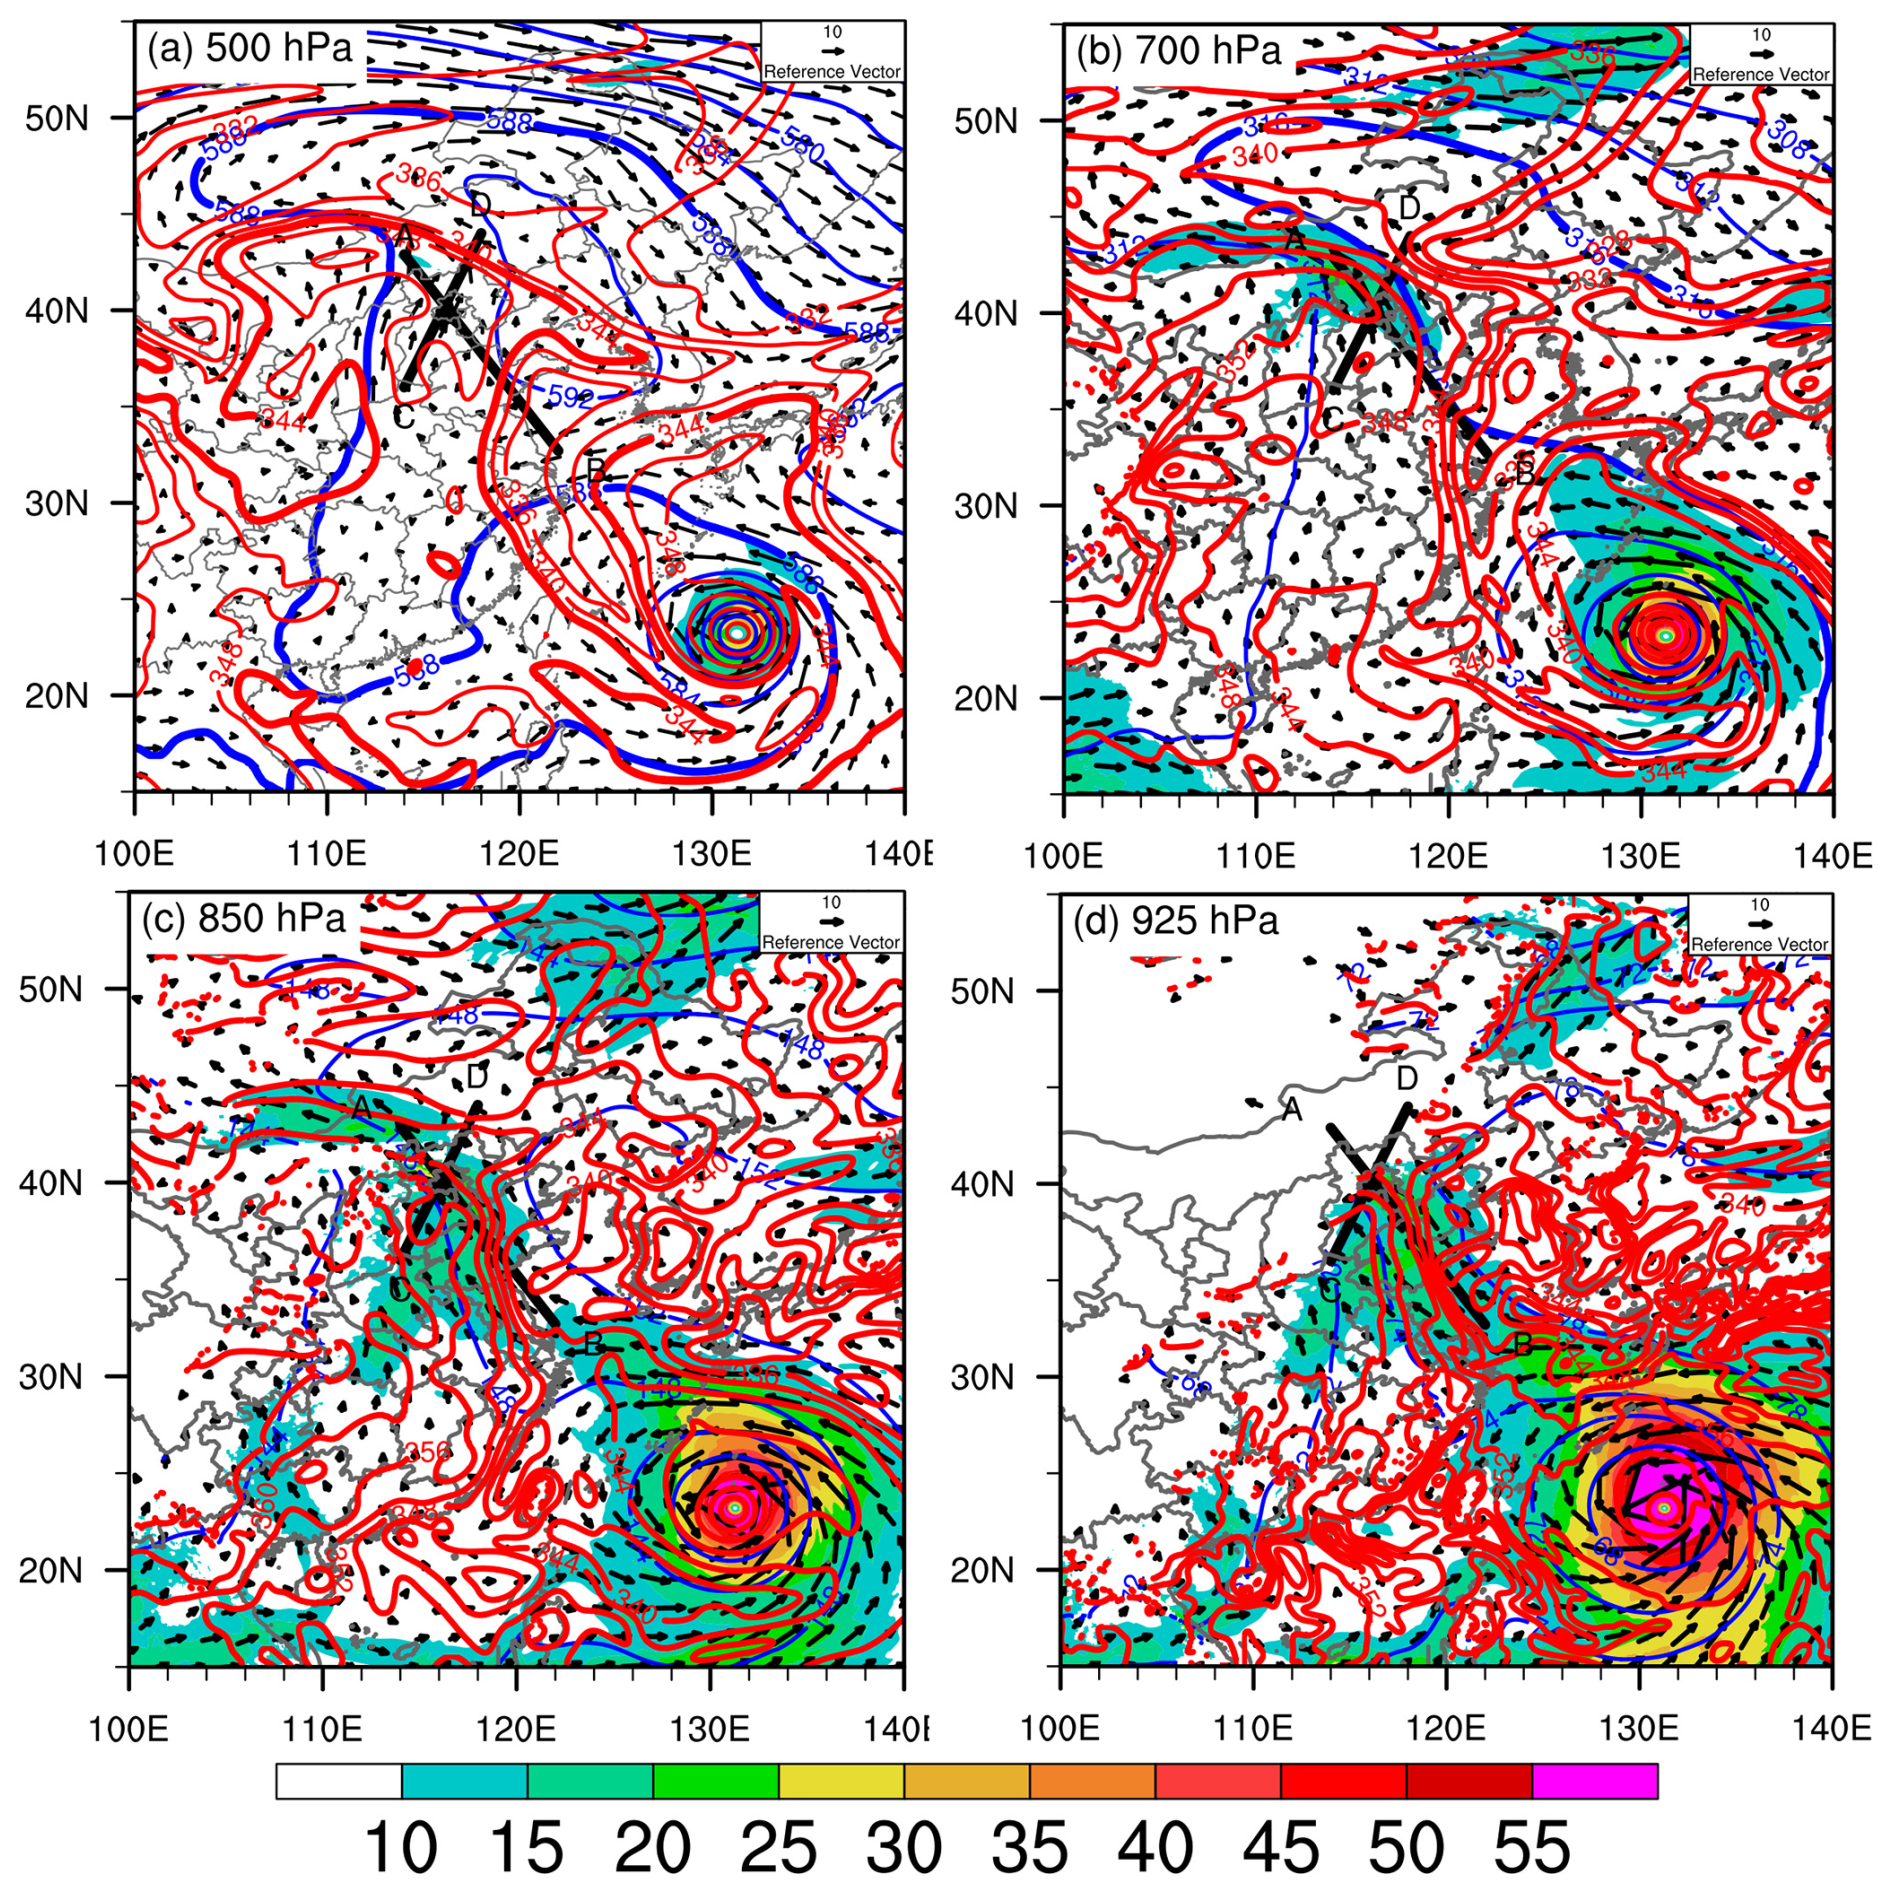
Figure 11Same as Fig. 9 but for 08:00 UTC on 31 July 2023. The thick black lines A–B and C–D denote the locations for the cross-sections in Fig. 12. Publisher's remark: please note that the above figure contains disputed territories.
As addressed above, it was the variation in environmental conditions that caused consequent rainfall changes in nature. In particular, the shift in the wind field brought changes in thermodynamic processes and water vapour sources. Before the wind shift (Figs. 9 and 10), water vapour was mainly from the East China Sea, associated with the cyclonic circulation of the typhoon remnant vortex, Tropical Storm Khanun, and southeasterly flow below 925 hPa. After the shift, water vapour flux was significantly reduced from both southwesterly and southeasterly flows (Fig. 11). Under such a framework, convection was largely triggered by orographic blocking and the lifting of southerly and/or southwesterly flows as convective instability air approached the orography (Fig. 12). Unlike in the first stage, convection developed further northward over mountains, forming deep convection (Fig. 12b), which might be attributed to the fact that the cold air on the north side moved northward. Generally speaking, the convection in the second stage is much stronger and deeper than that in the first stage. Consequently, the rainfall intensity increased compared to the intensity in the first stage (Fig. 7d, e).
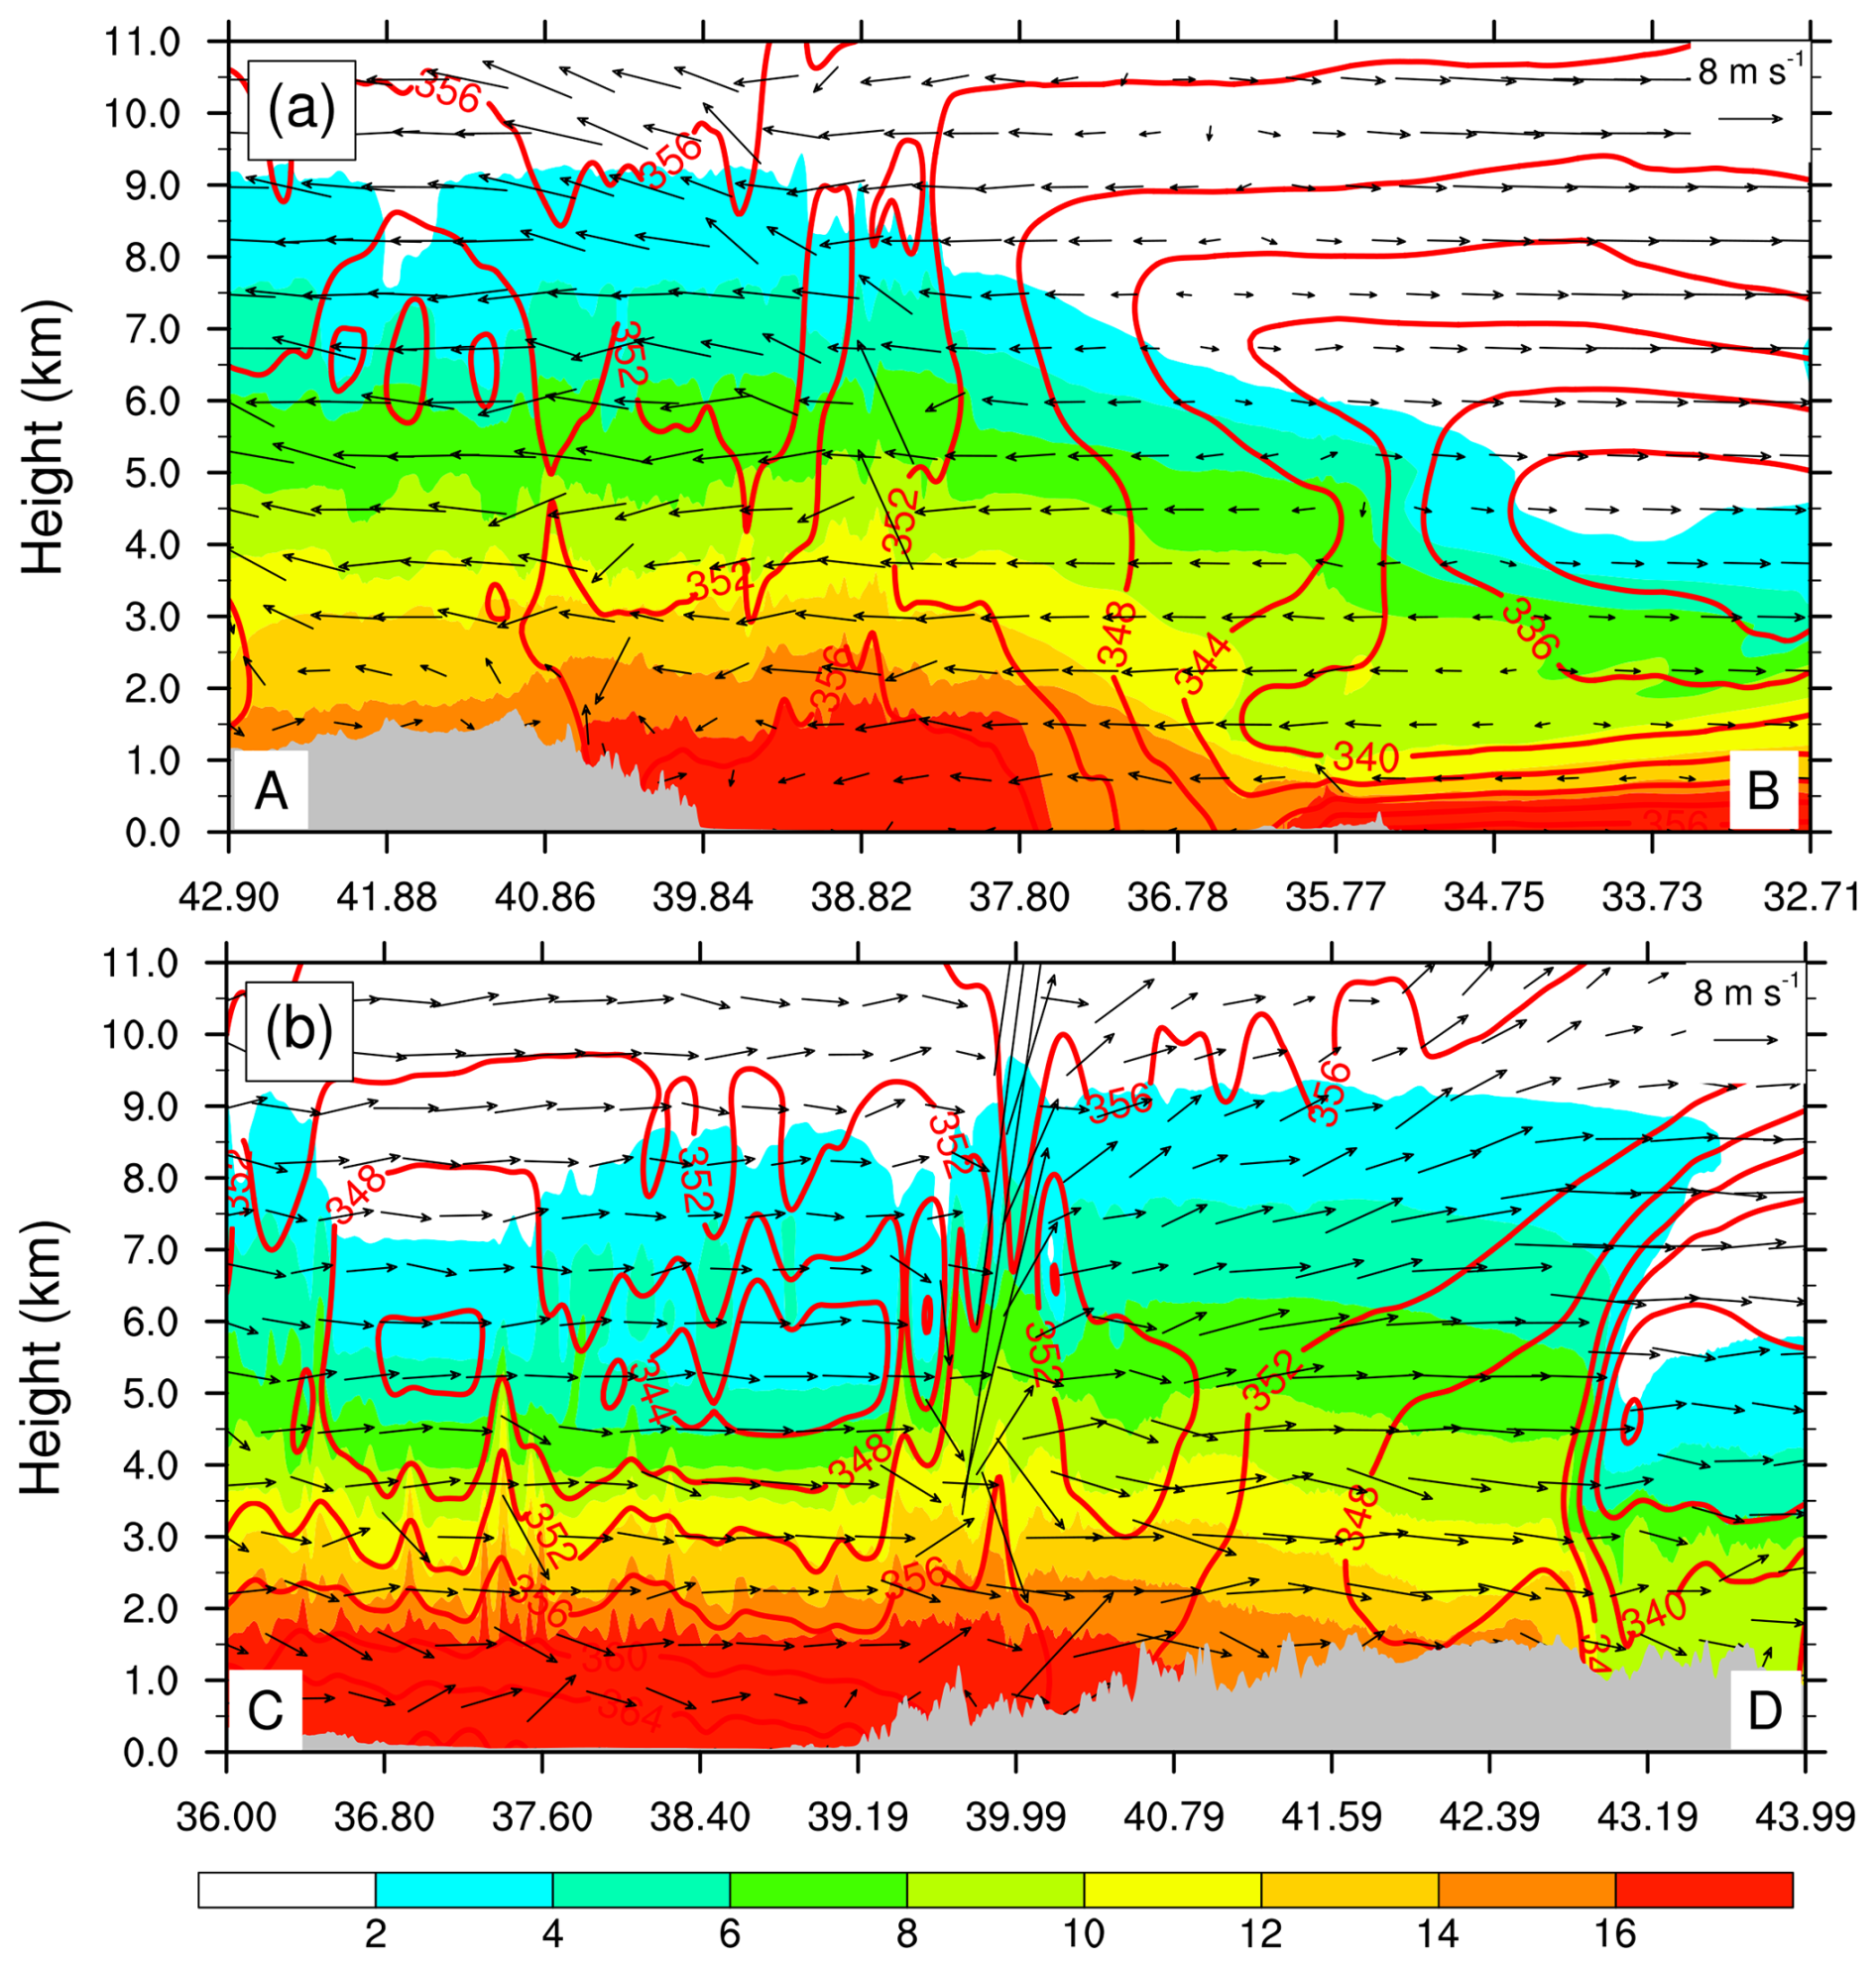
Figure 12Vertical cross-sections along the lines (a) A–B and (b) C–D given in Fig. 11 for the following: equivalent potential temperature (θe, red contours at 4 K intervals), the water vapour mixing ratio (qv in g kg−1, shading), and in-plane flow vectors (vertical motion amplified by a factor of 10) at 08:00 UTC on 31 July 2023. Grey shading denotes terrain.
4.2 Moisture budget
The shift in wind direction and speed implies a change in water vapour source and rainfall properties (Fig. 13). As stated above, water vapour was mainly from the East China Sea, associated with the cyclonic circulation of Typhoon Khanun before the wind shift, and was fuelled by the southeasterly flow below 925 hPa. After the shift, the water vapour supply was significantly reduced due to both southwesterly and southeasterly flow variations. Figure 13 shows the time–height cross-sections of moisture flux across the eastern, southern, western, and northern boundaries and the total lateral boundary moisture flux for the MTG region. The moisture flux is calculated as
Here, QFlux is the moisture flux across one of the four boundaries, and qv, v, and L are the water vapour mixing ratio, wind vector, and the length of the boundary, respectively. The TOT is a summation of the QFluxes from the four boundaries by taking inward (outward) as positive (negative).
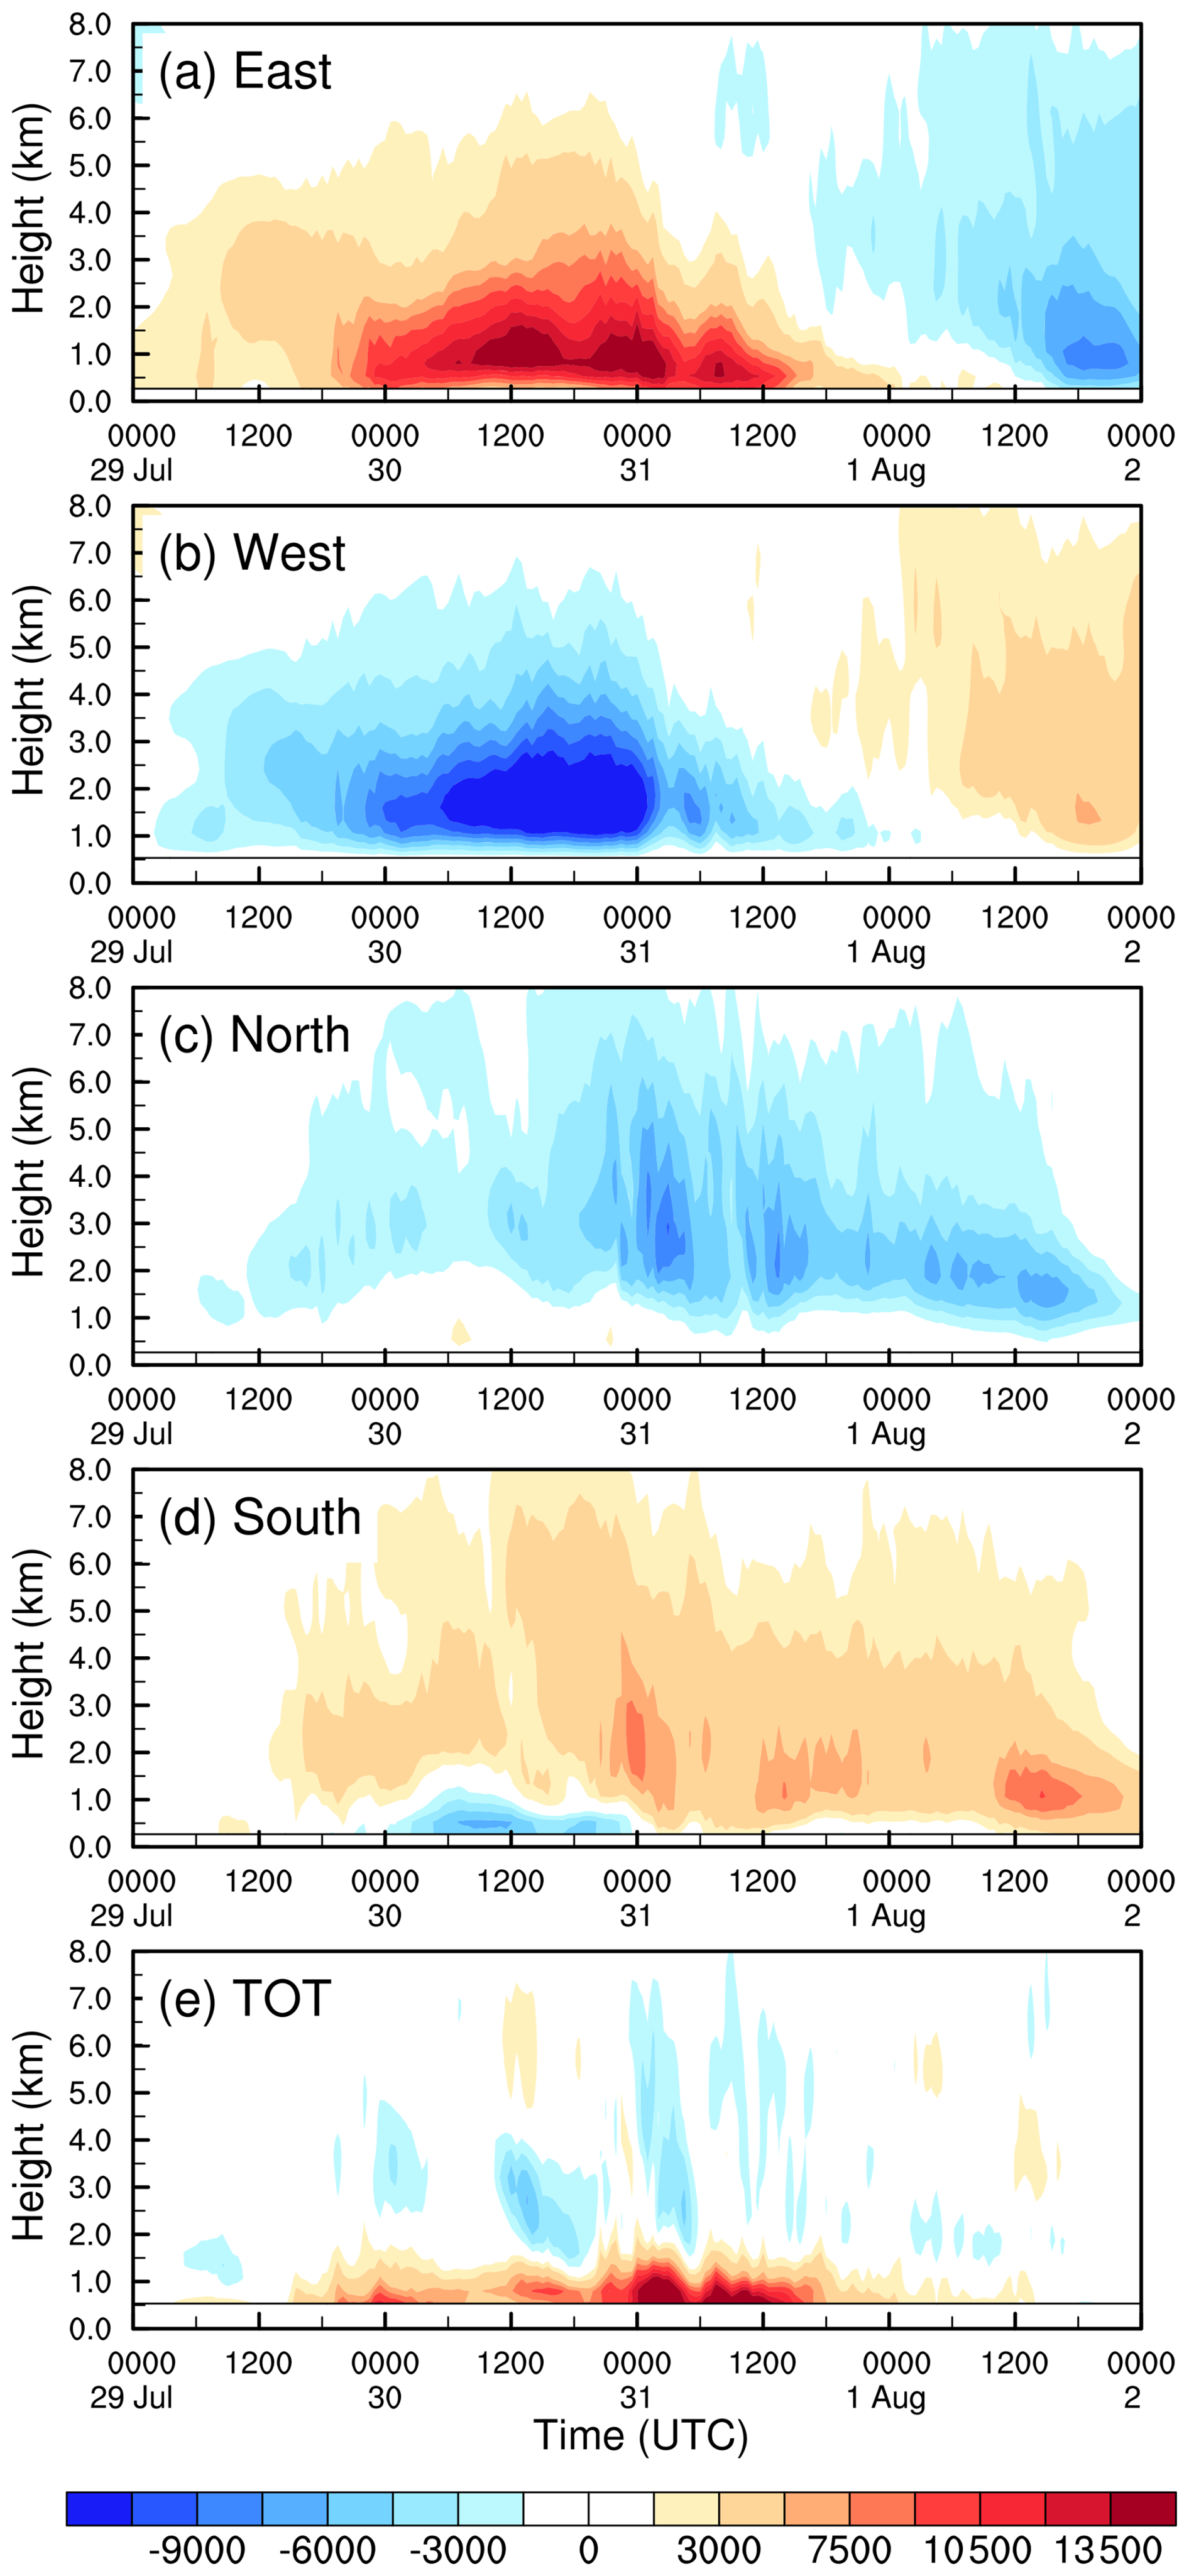
Figure 13Time–height cross-sections of the moisture fluxes (kg kg−1 m2 s−1) through the (a) eastern, (b) western, (c) northern, and (d) southern boundaries of the MTG region in Fig. 1; (e) TOT provides the total net moisture flux of all boundaries.
One can see that the MTG region experienced vigorous lower-to-middle level inward (outward) moisture fluxes across the eastern and southern (western and northern) boundaries. For the eastern boundary (Fig. 13a), the inward moisture flux began to increase gradually from 00:00 UTC on 29 July, with the maximum values over 13 500 kg kg−1 m2 s−1 occurring between 12:00 UTC on 30 July and 00:00 UTC on 31 July 2023. Then, the inward flux moisture decreased rapidly and even transformed into the outward flux at 00:00 UTC on 1 August 2023. The inward moisture flux was mainly concentrated below 3 km a.s.l. because the upper levels were capped by the warm, dry air masses associated with the WNPSH (cf. Figs. 9 and 10) movement. However, owing to weak lifting, most of the water vapour flowed out through the western boundary (Fig. 13b). Meanwhile, part of the water vapour was transported in this region from the southern boundary, except for the lower levels from 00:00 UTC on 30 July to 00:00 UTC on 31 July 2023 (Fig. 13d). The outward flow of water vapour was caused by the northeasterly branch around flow due to the blocking of the Yanshan Mountains. Similar patterns can be found at the northern boundary, with almost the same outward water vapour flux (Fig. 13c). The temporal evolution of the water vapour flux across the eastern boundary is consistent with that of rainfall over this region (Figs. 13a and 7d), suggesting that rainfall formation was dominated by the inward flow of water vapour from the eastern boundary. Overall, the inward net moisture fluxes were concentrated in the lower troposphere between 0.5 and 1.5 km (Fig. 13e), suggesting that most of the water vapour was consumed by condensation in this layer. Despite the high water vapour flux, the water-vapour-rich layer is too thin (about 1 km) to be favourable for the formation of severe rainfall. Similar patterns can be found over both the YX and XT regions (not shown), although there were temporal and quantitative differences.
In the second stage, the north–south orientated θe dense zone largely prevented water vapour from being transported to North China by southeasterly flows from the East China Sea, and thus water vapour was mainly transported to North China across the southern boundary (Fig. 13b, d). It is unlikely that the water vapour was mainly provided by the southeasterly (southwesterly) flow below (above) 500 hPa. Figure 13 shows the time–height cross-sections of the moisture fluxes. It can be seen from Fig. 13 that the amount of water vapour flux decreased significantly. Despite the thickening of the water vapour flux layer associated with the southerly/southwesterly flows, the water vapour flux is much smaller compared to that of the first stage. Therefore, the wind shift had strong effects on the reduction in water vapour flux and consequent rainfall over North China. The same results can also be obtained in the YX and XT regions (not shown). It is worth emphasizing that strong hourly rainfall occurred during the wind shift period (cf. Figs. 2, 7, and 8), suggesting that the changes in wind direction enhanced wind shear and thus promoted the development of convection and consequent precipitation under moisture and instability conditions (Chen et al., 2015; Rotunno et al., 1988; Schumacher and Rasmussen, 2020). Therefore, it is important to pay special attention to environmental wind alterations in future remote rainfall forecasts.
4.3 Properties of convection
Figure 14 shows the temporal evolution of maximum upward motion and radar reflectivity over the MTG region during the rainfall period from 00:00 UTC on 29 July to 00:00 UTC on 2 August 2023. In the first stage (i.e. before 08:00 UTC on 31 July), most of the maximum updraughts were less than 3 m s−1. Owing to the weak updraughts, the storm did not stretch as high as typical convective systems over North China, with hydrometeors concentrated on the levels with a temperature above 0 °C (Fig. 14a). As addressed above (Fig. 10), weak updraughts were attributed to the unfavourable large-scale conditions. The vertical distribution of hydrometeors indicates that the warm-rain processes were dominant in the persistent rainfall event. The result is consistent with the layer of water vapour consumed between 0.5 and 1.5 km (Fig. 13e). It is unlikely that the maximum updraught was over 11 m s−1 in the second stage (i.e. after 08:00 UTC on 31 July), which is much stronger than that in the first stage (Fig. 14). Correspondingly, the radar reflectivity penetrated through the 0 °C level, with a cloud top exceeding 12 km, indicating that both warm- and cold-rain processes were active in this stage. Correspondingly, the intensity of hourly rainfall increased significantly, with the maximum value exceeding 100 mm (Fig. 7d). Generally speaking, there are larger strong convective areas in the second than in the first stage. The same features were also found in the regions of YX and XT (not shown). Unlike the usual short-duration heavy rainfall in North China (Mao et al., 2018; Xia and Zhang, 2019; Yin et al., 2022b; H. Li et al., 2024), this precipitation was mainly dominated by warm-cloud processes (Fig. 14), consistent with observations (e.g. Fu et al., 2023). As addressed above, the weak updraughts with warm, moist air were responsible for persistent but low-intensity rainfall. A detailed analysis of cloud microphysical processes for this event will be given in a forthcoming study, in which all microphysical source and sink terms will be explained.
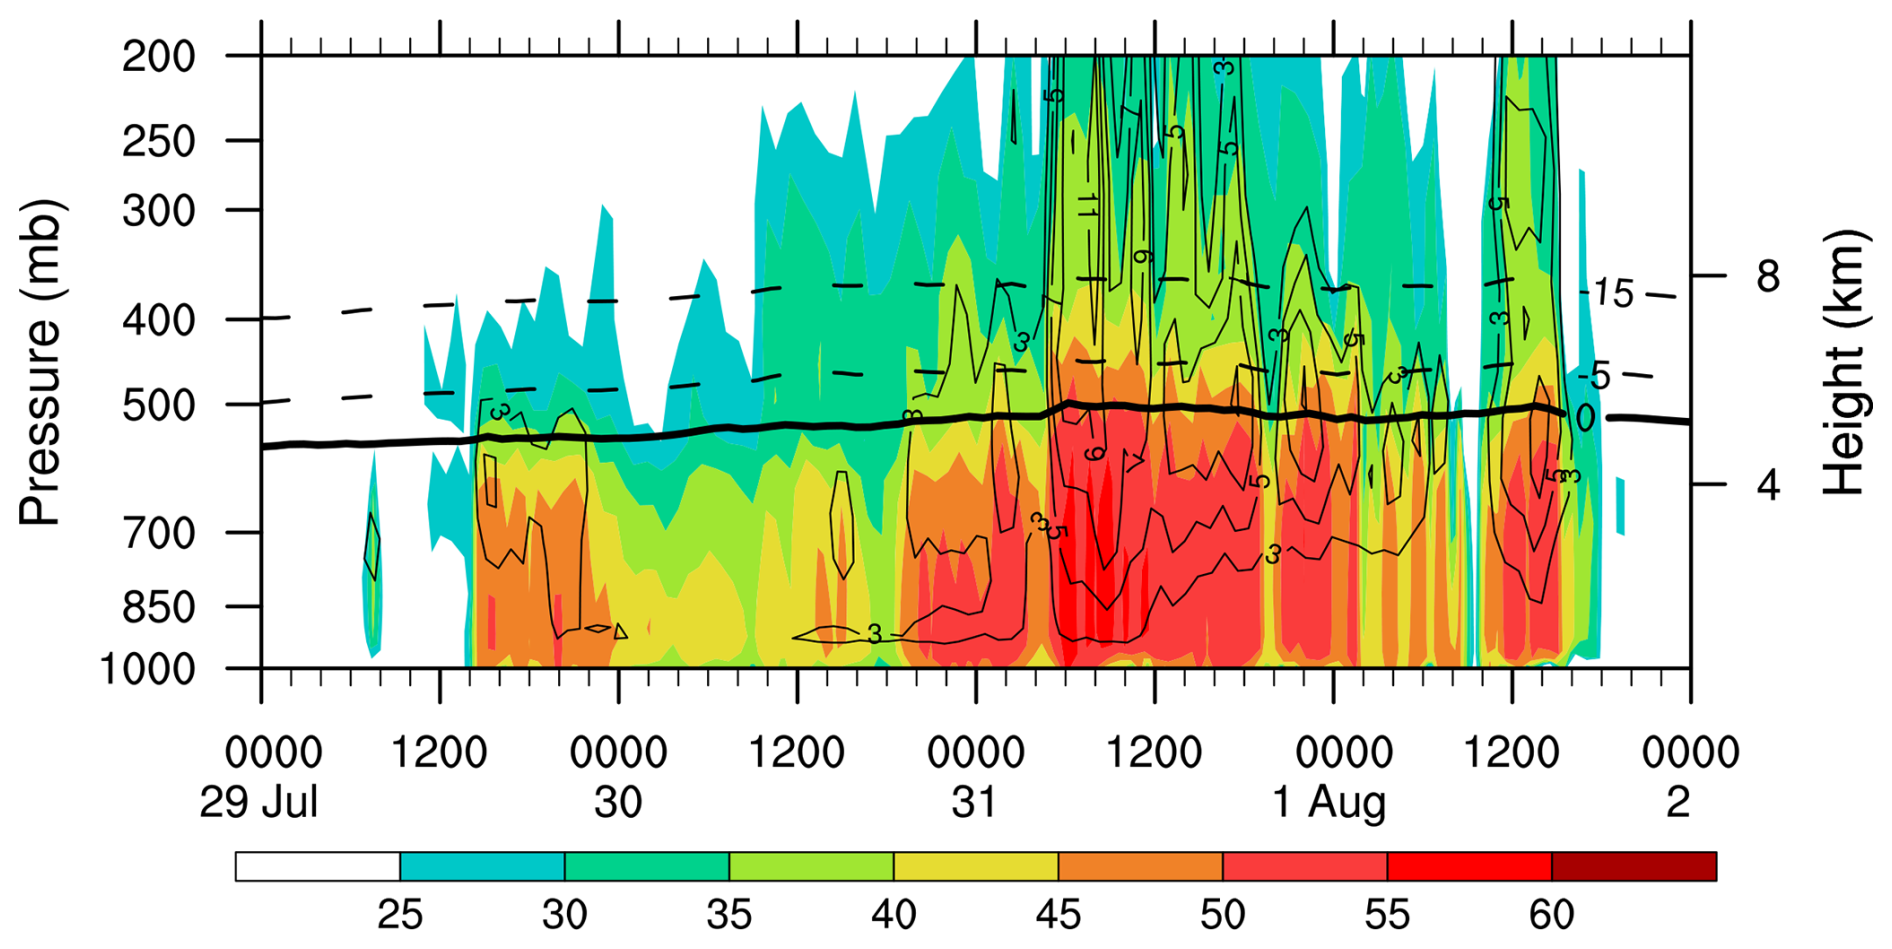
Figure 14Time–height cross-section of the domain maximum radar reflectivity (dBz, shading) and upward motion (contoured at 2 m s−1) taken from MTG region during the period from 00:00 UTC on 29 July to 00:00 UTC on 2 August 2023. The isothermal lines denote the 0 (the melting layer), −5, and −15 °C levels.
In this study, we examined the convective initiation and subsequent persistent heavy rainfall over North China during the period from 29 July to 2 August 2023 in terms of observations and simulations with the WRF model. From observations, the rainfall was characterized by a long duration and widespread coverage but low intensity, like a warm-front rainfall. Firstly, the persistent severe rainfall event was reproduced by the WRF model. Further analysis based on the simulations shows that this persistent precipitation was caused by the combination of a remnant vortex originating from Typhoon Doksuri (2305), Tropical Storm Khanun (2306), the western North Pacific subtropical high (WNPSH) with an unusual westward extension of the northwestern corner, and stable cold, dry air from over northern China.
According to the simulated wind profiles and rainfall features, the persistent heavy rainfall event was divided into two stages. Figure 15 summarizes the synoptic-scale forcings and possible dynamic mechanisms for the persistent heavy rainfall. In the first stage (Fig. 15a), a water vapour transportation passage was built by a typhoon remnant vortex and Tropical Storm Khanun, providing a stable warm, moist water vapour supply. Several days before the rainfall event, the southwestern WNPSH was within Typhoon Doksuri's outer region, and thus the southwestern WNPSH was weakened by Tropical Storm Doksuri. It appears that the west boundary of the western North Pacific subtropical high (WNPSH) retreated eastward from 500 to 850 hPa, showing an inclined vertical distribution on the western boundary, especially from 700 to 850 hPa. Capped by the inclined WNPSH, water vapour was mainly transported to North China through a water vapour passage under approximately 850 hPa (Fig. 10). Although the warm and moist regions were favourable for precipitation over North China, organized strong convective systems were infrequent because of the absence of favourable large-scale conditions. At the same time, the orography in the western part of North China was occupied by a dry, cold air mass over levels above 3.0 km. Owing to the blocking of orography below 1.3 km and the strong, cold air mass above 3.0 km, only the southeasterly flows between 1.3 and 3.0 km a.s.l. can pass over the mountains. Although the warm and moist southeasterly flows were lifted by the orography, they could not go further upward to trigger convection because of the locally capped cold and dry air masses overhead. Under these conditions, significant equivalent potential temperature gradients were established between the warm and cold air masses, similar to a warm front. Consequently, convergence mainly resulted from the changes in wind direction and wind speed that led to upward motion. As the warm and moist air was lifted, condensation occurred and generated further precipitation. However, the lifting was too weak to allow convection to be highly organized (Fig. 14), leading to rainfall with low intensity but large coverage. Aside from this, the continuous and stable transportation of water vapour provided by Tropical Storm Khanun ensured stable precipitation over a long period of over 80 h. Therefore, this event shows similar rainfall features to those of warm-front rainfall, with a long duration and widespread coverage but low intensity.
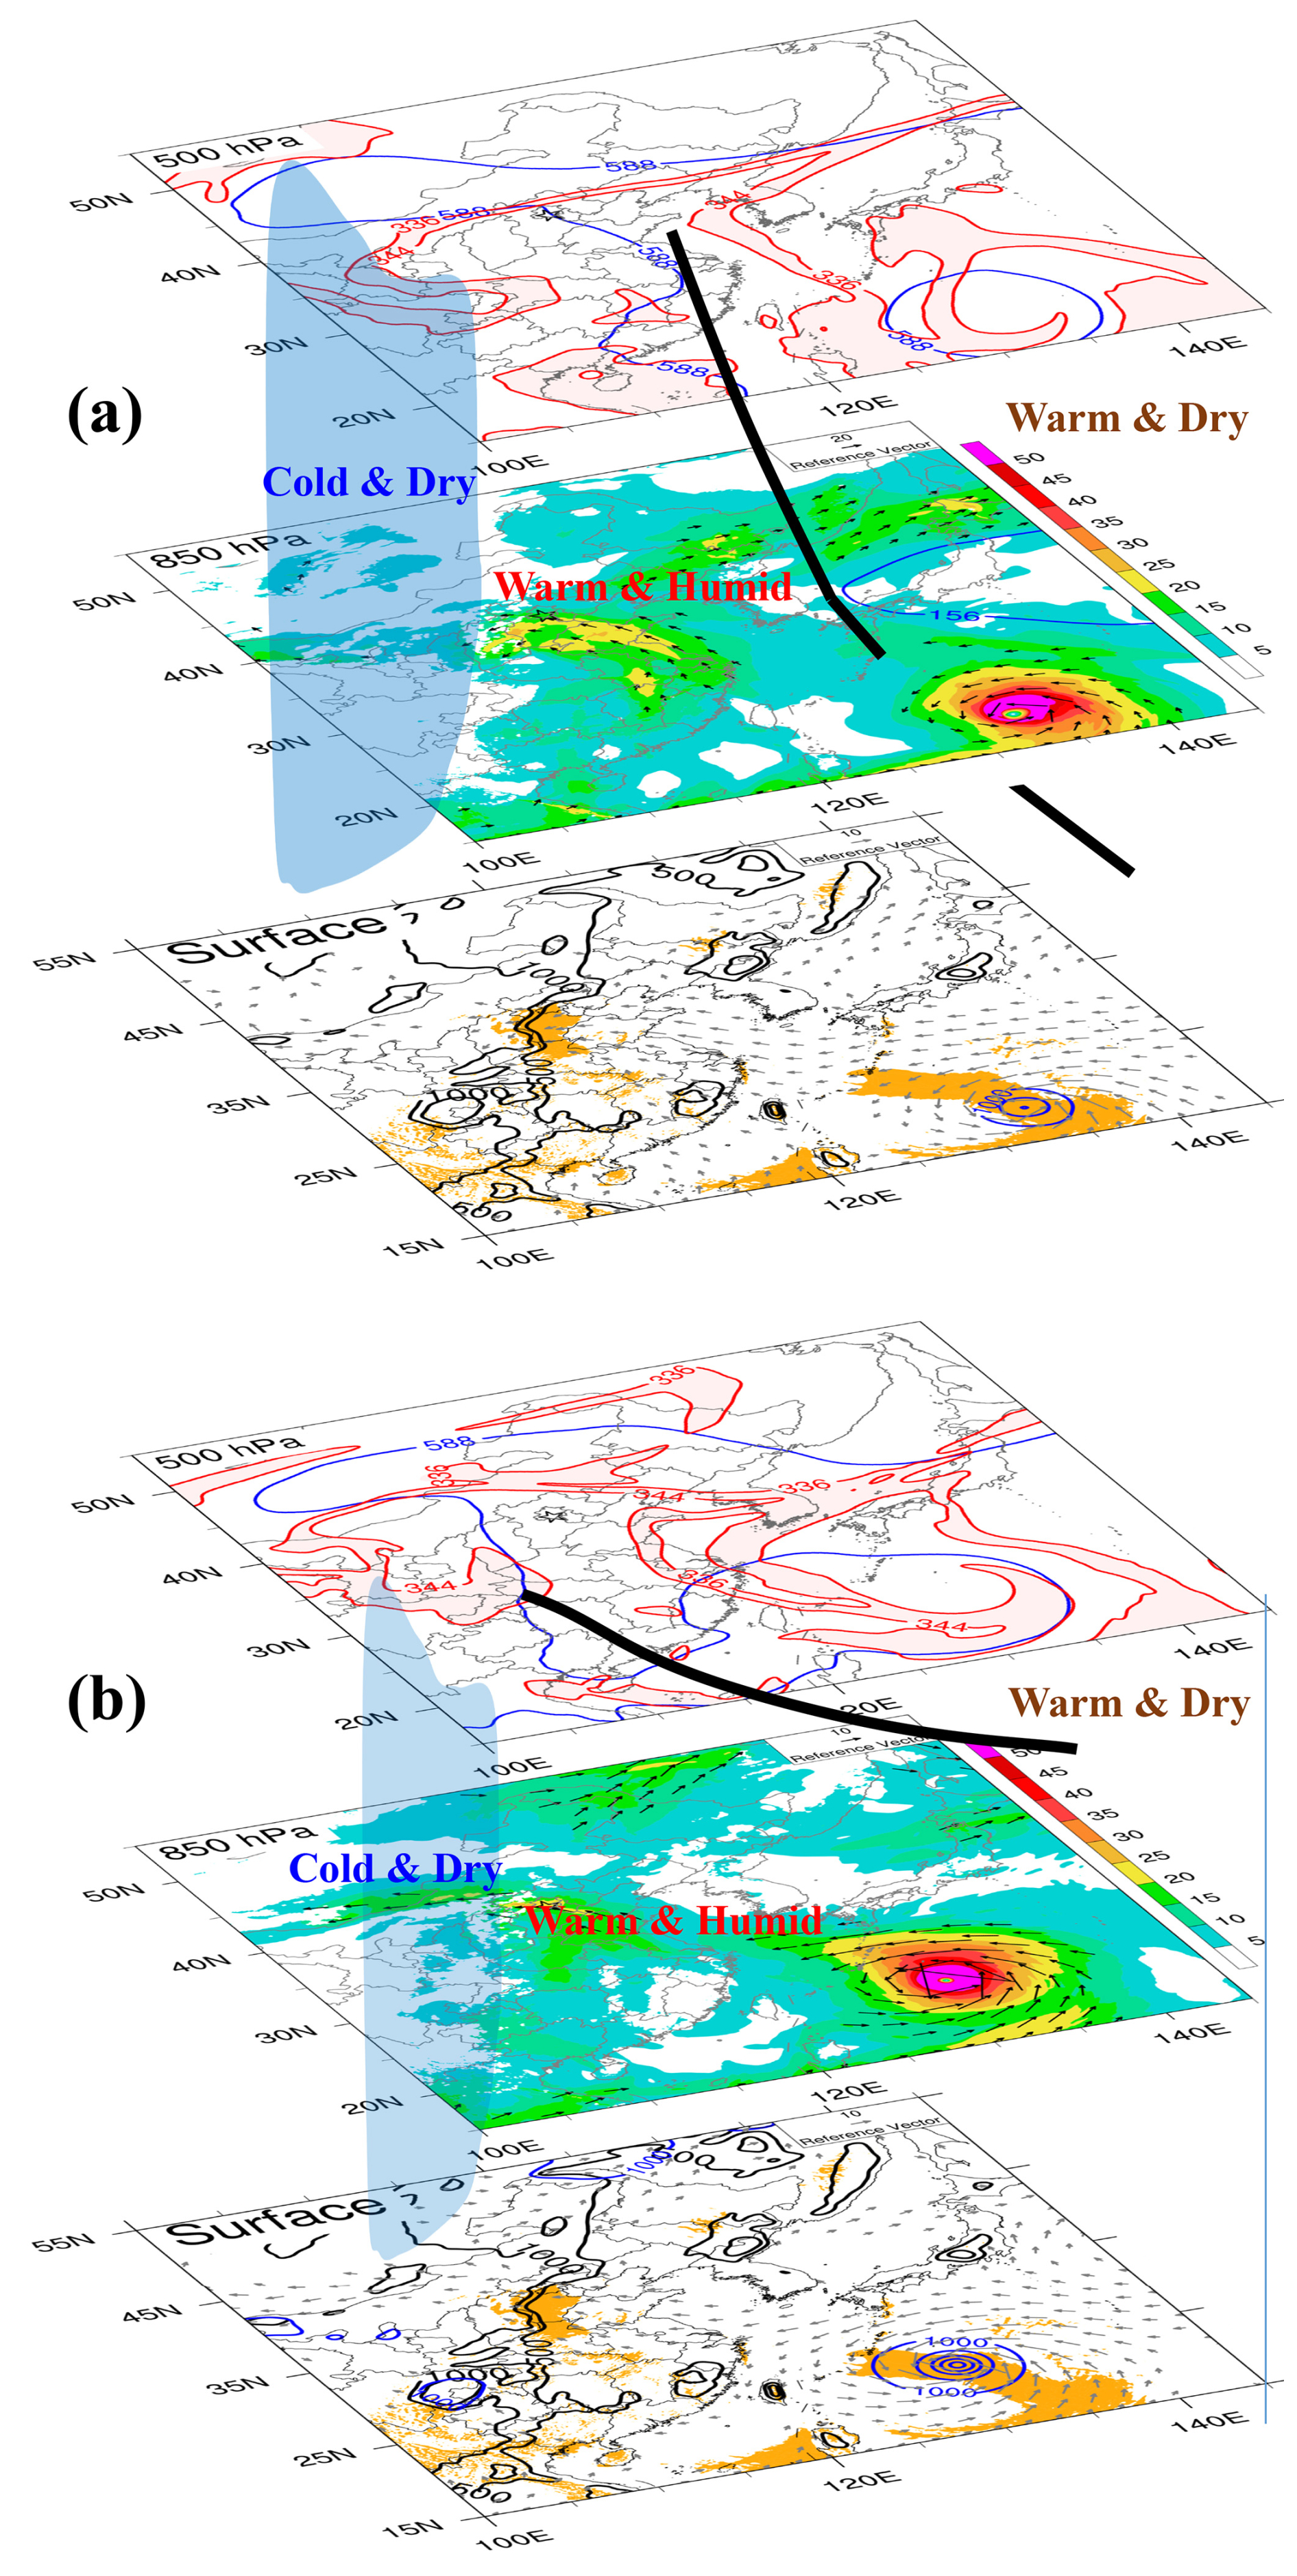
Figure 15(a) Three-dimensional diagram of the mechanisms for the persistent heavy precipitation in the first stage. Several distinct synoptic systems, including Tropical Storm Khanun (2306), a remnant vortex originating from Typhoon Doksuri (2305), quasi-stationary cold, dry air masses, and an abnormal western North Pacific subtropical high (WNPSH) with inclined vertical distribution on the western boundary (thick black line), are present. Blue lines marked with 588 and 156 represent the WNPSH at 500 and 850 hPa, respectively. Red lines denote the spatial distribution of the equivalent potential temperature (θe) dense zone between 336 and 344 K. At 850 hPa, black arrows indicate jets with wind speed over 12 m s−1, and shading denotes water vapour flux. Orange shading indicates 96 h of accumulated rainfall over 200 mm, blue contours denote sea level pressure, grey arrows denote surface (i.e. z = 10 m) horizontal wind with wind speed over 5 m s−1, and black contours indicate orography (m). (b) Same as (a) but for rainfall in the second stage. Publisher's remark: please note that the above figure contains disputed territories.
In the second stage (Fig. 15b), the WNPSH further expanded westward at 500 hPa, with its western border reaching western China. However, the southwest part of the WNPSH was further damaged by the rapid intensification of Khanun into a super typhoon. Consequently, the embedded warm, dry cover associated with the tilted WNPSH significantly thinned, favouring convective development. Meanwhile, as the trough deepened over northeastern China, cold air from the north poured southward. Consequently, a north–south-orientated equivalent potential temperature (θe) dense zone was established over eastern China, which largely prevented water vapour from being transported to North China (Fig. 12a). However, owing to the clockwise-rotated southeasterly flow, a deep southerly/southwesterly flow was built over North China. The convection was triggered by orographic blocking and the lifting of southerly/southwesterly flows as the air of the convective instability approached the orography. Unlike the first stage, the convection developed further northward over the mountains, forming deep convection. It should be noted that the northward-moving cold air on the north side was another favourable condition. Therefore, the convection in the second stage is much stronger and deeper than that in the first stage, although the water vapour flux is smaller in the second period. Consequently, the rainfall intensity increased compared to that in the first stage. Correspondingly, both warm- and cold-rain processes were active in the second stage, while warm-rain processes were dominant in the first stage.
In this study, we have gained the principal results of the persistent heavy rainfall event. It is important to note that the spatial distribution of rainfall is usually consistent with the western boundary of the WNPSH (i.e. the 588 isoline) at 500 hPa. In the present event, the spatial distribution of rainfall is consistent with the dense zone of θe rather than the western boundary of the WNPSH. Therefore, in addition to the 588 isoline, the spatial distribution of θe needs to be given more attention in future operational forecasts. Aside from this, we should give weight to environmental wind shifts, which may lead to changes in convection and the nature of consequent precipitation. Although reasonable dynamic mechanisms for the present persistent heavy rainfall have been proposed, there are still several questions that need to be answered. Among those, more work is required to understand detailed cloud and precipitation processes. In addition, diagnostic and budget analyses will be conducted to understand how the orography facilitates the generation of the rainfall belt with three rainfall cores along the mountains. Nevertheless, the concept of synoptic-forcing-based forecasting is discussed, as it might apply to a broader spectrum of forecast events than just over North China.
The source code of the Weather Research and Forecasting model (WRF v4.1.3) is available at https://github.com/wrf-model/WRF/releases (NCAR, 2024). The National Centers for Environmental Prediction (NCEP) Global Forecast System 1° final analysis data at 6 h intervals used for the initial and boundary conditions for the specific period analysed can be downloaded at https://doi.org/10.5065/D6M043C6 (National Centers for Environmental Prediction et al., 2000). The modified WRF model code and all the data used in this study are available from the authors upon request.
Conceptualization – JY, JS, and XL; methodology – JY and JS; data curation – JY and FL; writing (original draft preparation) – JY, and FL; writing (review and editing) – JY, ML, RX, XB, and JS; project administration – XL; and funding acquisition – JY and XL. All authors have read and agreed to the published version of the paper.
The contact author has declared that none of the authors has any competing interests.
Publisher's note: Copernicus Publications remains neutral with regard to jurisdictional claims made in the text, published maps, institutional affiliations, or any other geographical representation in this paper. While Copernicus Publications makes every effort to include appropriate place names, the final responsibility lies with the authors.
The authors acknowledge the use of the NCAR Command Language (NCL) in the preparation of figures.
This study has been jointly supported by the National Key R&D Program of China (grant no. 2022YFC3003903), the National Natural Science Foundation of China (grant no. U2442204), the Open Project Fund of China Meteorological Administration Basin Heavy Rainfall Key Laboratory (grant no. 2023BHR-Z03), the Basic Research Fund of the Chinese Academy of Meteorological Sciences (grant no. 2023Z001), and the Development Foundation of the Chinese Academy of Meteorological Sciences (grant nos. 2023KJ47 and 2024KJ017).
This paper was edited by Gregor C. Leckebusch and reviewed by two anonymous referees.
Bao, X., Sun, J., Yin, J., Gao, X., Li, F., Liang, X., Gu, H., Xia, R., Li, M., Wu, C., and Feng, J.: What Caused the Differences between the July 2023 and August 1996 Extreme Rainfall Events in North China under Similar Synoptic Background?, J. Meteorol. Res.-PRC, 38, 861–879, https://doi.org/10.1007/s13351-024-3192-0, 2024.
Bowden, J. H., Otte, T. L., Nolte, C. G., and Otte, M. J.: Examining Interior Grid Nudging Techniques Using Two-Way Nesting in the WRF Model for Regional Climate Modeling, J. Climate, 25, 2805–2823, https://doi.org/10.1175/JCLI-D-11-00167.1, 2012.
Chen, Q., Fan, J., Hagos, S., Gustafson Jr., W. I., and Berg, L. K.: Roles of wind shear at different vertical levels: Cloud system organization and properties, J. Geophys. Res.-Atmos., 120, 6551–6574, https://doi.org/10.1002/2015JD023253, 2015.
Ding, Y.: A case study on the excessively severe rainstrom in Honan province, early in August, 1975, Scientia Atmospherica Sinica, 2, 276–289, 1978 (in Chinese).
Dudhia, J.: Numerical Study of Convection Observed during the Winter Monsoon Experiment Using a Mesoscale Two-Dimensional Model, J. Atmos. Sci., 46, 3077–3107, https://doi.org/10.1175/1520-0469(1989)046<3077:NSOCOD>2.0.CO;2, 1989.
Feng, W. and Cheng, L.: Nonhydrostatic numerical simulation for the “96.8” extraordinary rainstorm and the developing structure of mesoscale system, J. Meteorol. Res., 16, 423–440, 2002.
Fowler, H. J., Blenkinsop, S., Green, A., and Davies, P. A.: Precipitation extremes in 2023, Nature Reviews Earth & Environment, 5, 250–252, https://doi.org/10.1038/s43017-024-00547-9, 2024.
Fu, J., Quan, W., Mai, Z., Luo, Q., Chen, T., Li, X., Xu, X., Zhu, W., Hua, S., and Han, X.: Preliminary study on the refined characteristics of rainfall intensity and dynamic and thermodynamic conditions in the July 2023 severe torrential rain in north China, Meteorological Monthly, 49, 1435–1450, https://doi.org/10.7519/j.issn.1000-0526.2023.112701, 2023 (in Chinese with English abstract).
Gao, Z., Zhang, J., Yu, M., Liu, Z., Yin, R., Zhou, S., Zong, L., Ning, G., Xu, X., Guo, Y., Wei, H., and Yang, Y.: Role of Water Vapor Modulation From Multiple Pathways in the Occurrence of a Record-Breaking Heavy Rainfall Event in China in 2021, Earth and Space Science, 9, e2022EA002357, https://doi.org/10.1029/2022EA002357, 2022.
Gao, X., Sun, J., Yin, J., Abulikemu, A., Wu, C., Liang, X., and Xia, R.: The impact of mountain-plain thermal contrast on precipitation distributions during the “23⋅7” record-breaking heavy rainfall over North China, Atmos. Res., 310, 107582, https://doi.org/10.1016/j.atmosres.2024.107582, 2024.
Hirata, H. and Kawamura, R.: Scale interaction between typhoons and the North Pacific subtropical high and associated remote effects during the Baiu/Meiyu season, J. Geophys. Res.-Atmos., 119, 5157–5170, https://doi.org/10.1002/2013JD021430, 2014.
Hong, S.-Y., Dudhia, J., and Chen, S.-H.: A Revised Approach to Ice Microphysical Processes for the Bulk Parameterization of Clouds and Precipitation, Mon. Weather Rev., 132, 103–120, https://doi.org/10.1175/1520-0493(2004)132<0103:ARATIM>2.0.CO;2, 2004.
Hu, G., Lu, M.-H., Reynolds, D., Wang, H.-K., Chen, X., Liu, W.-C., Zhu, F., Wu, X.-W., Xia, F., Xie, M.-C., Cheng, X.-N., Lim, K.-S., Zhai, B.-P., and Chapman, J.: Long-term seasonal forecasting of a major migrant insect pest: the brown planthopper in the Lower Yangtze River Valley, J. Pest Sci., 92, 417–428, https://doi.org/10.1007/s10340-018-1022-9, 2019.
Jiménez, P. A., Dudhia, J., González-Rouco, J. F., Navarro, J., Montávez, J. P., and García-Bustamante, E.: A Revised Scheme for the WRF Surface Layer Formulation, Mon. Weather Rev., 140, 898–918, https://doi.org/10.1175/MWR-D-11-00056.1, 2012.
Kain, J. S.: The Kain–Fritsch Convective Parameterization: An Update, J. Appl. Meteorol., 43, 170–181, https://doi.org/10.1175/1520-0450(2004)043<0170:TKCPAU>2.0.CO;2, 2004.
Li, H., Yin, J., and Kumjian, M.: ZDR Backwards Arc: Evidence of Multi-Directional Size Sorting in the Storm Producing 201.9 mm Hourly Rainfall, Geophys. Res. Lett., 51, e2024GL109192, https://doi.org/10.1029/2024GL109192, 2024.
Li, M., Sun, J., Li, F., Wu, C., Xia, R., Bao, X., Yin, J., and Liang, X.: Precipitation Evolution from Plain to Mountains during the July 2023 Extreme Heavy Rainfall Event in North China, J. Meteorol. Res.-PRC, 38, 635–651, https://doi.org/10.1007/s13351-024-3182-2, 2024.
Lin, Y.-H. and Wu, C.-C.: Remote Rainfall of Typhoon Khanun (2017): Monsoon Mode and Topographic Mode, Mon. Weather Rev., 149, 733–752, https://doi.org/10.1175/MWR-D-20-0037.1, 2021.
Mao, J., Ping, F., Yin, L., and Qiu, X.: A Study of Cloud Microphysical Processes Associated With Torrential Rainfall Event Over Beijing, J. Geophys. Res.-Atmos., 123, 8768–8791, https://doi.org/10.1029/2018JD028490, 2018.
Meng, Z., Zhang, F., Luo, D., Tan, Z., Fang, J., Sun, J., Shen, X., Zhang, Y., Wang, S., Han, W., Zhao, K., Zhu, L., Hu, Y., Xue, H., Ma, Y., Zhang, L., Nie, J., Zhou, R., Li, S., Liu, H., and Zhu, Y.: Review of Chinese atmospheric science research over the past 70 years: Synoptic meteorology, Sci. China Earth Sci., 62, 1946–1991, https://doi.org/10.1007/s11430-019-9534-6, 2019.
Mlawer, E. J., Taubman, S. J., Brown, P. D., Iacono, M. J., and Clough, S. A.: Radiative transfer for inhomogeneous atmospheres: RRTM, a validated correlated-k model for the longwave, J. Geophys. Res.-Atmos., 102, 16663–16682, https://doi.org/10.1029/97JD00237, 1997.
National Centers for Environmental Prediction, National Centers for Environmental Prediction, National Weather Service, NOAA, and U.S. Department of Commerce: NCEP FNL Operational Model Global Tropospheric Analyses, continuing from July 1999, Research Data Archive at the National Center for Atmospheric Research, Computational and Information Systems Laboratory [data set], https://doi.org/10.5065/D6M043C6, 2000.
NCAR: WRF Model, GitHub [code], https://github.com/wrf-model/WRF/releases, last access: 1 August 2024.
Pucik, T., Groenemeijer, P., and Tsonevsky, I.: Vertical wind shear and convective storms, ECMWF Technical Memoranda no. 879, https://doi.org/10.21957/z0b3t5mrv, 2021.
Rao, C., Chen, G., and Ran, L.: Effects of Typhoon In-Fa (2021) and the Western Pacific Subtropical High on an Extreme Heavy Rainfall Event in Central China, J. Geophys. Res.-Atmos., 128, e2022JD037924, https://doi.org/10.1029/2022JD037924, 2023.
Rotunno, R., Klemp, J., and Weisman, M.: A Theory for Strong, Long-Lived Squall Lines, J. Atmos. Sci., 45, 463–485, https://doi.org/10.1175/1520-0469(1988)045<0463:ATFSLL>2.0.CO;2, 1988.
Schumacher, R. S. and Rasmussen, K. L.: The formation, character and changing nature of mesoscale convective systems, Nature Reviews Earth & Environment, 1, 300–314, https://doi.org/10.1038/s43017-020-0057-7, 2020.
Stauffer, D. R., Seaman, N. L., and Binkowski, F. S.: Use of Four-Dimensional Data Assimilation in a Limited-Area Mesoscale Model Part II: Effects of Data Assimilation within the Planetary Boundary Layer, Mon. Weather Rev., 119, 734–754, https://doi.org/10.1175/1520-0493(1991)119<0734:UOFDDA>2.0.CO;2, 1991.
Sun, J., Qi, L., and Zhao, S.: A study on mesoscale convective systems of the severe heavy rainfall in north China by “9608” typhoon, Acta Meteorologica Sinica, 64, 57–71, https://doi.org/10.11676/qxxb2006.006, 2006 (in Chinese with English abstract).
Sun, Y., Zhong, Z., Yi, L., Li, T., Chen, M., Wan, H., Wang, Y., and Zhong, K.: Dependence of the relationship between the tropical cyclone track and western Pacific subtropical high intensity on initial storm size: A numerical investigation, J. Geophys. Res.-Atmos., 120, 11451–411467, https://doi.org/10.1002/2015JD023716, 2015.
Tewari, M., Chen, F., Wang, W., Dudhia, J., LeMone, M. A., Mitchell, K., Ek, M., Gayno, G., Wegiel, J., and Cuenca, R. H.: Implementation and verification of the unified NOAH land surface model in the WRF model, in: 20th Conference on Weather Analysis and Forecasting/16th Conference on Numerical Weather Prediction, Seattle, USA, 10–15 January 2004, 11–15, https://ams.confex.com/ams/84Annual/techprogram/paper_69061.htm. (last access: 30 April 2025), 2004.
Thompson, G., Field, P. R., Rasmussen, R. M., and Hall, W. D.: Explicit Forecasts of Winter Precipitation Using an Improved Bulk Microphysics Scheme. Part II: Implementation of a New Snow Parameterization, Mon. Weather Rev., 136, 5095–5115, https://doi.org/10.1175/2008MWR2387.1, 2008.
Wang, Y., Wang, Y., and Fudeyasu, H.: The Role of Typhoon Songda (2004) in Producing Distantly Located Heavy Rainfall in Japan, Mon. Weather Rev., 137, 3699–3716, https://doi.org/10.1175/2009MWR2933.1, 2009.
Xia, R., Ruan, Y., Sun, J., Liang, X., Li, F., Wu, C., Li, J., Yin, J., Bao, X., Li, M., and Gao, X.: Distinct Mechanisms Governing Two Types of Extreme Hourly Rainfall Rates in the Mountain Foothills of North China During the Passage of a Typhoon Remnant Vortex from July 30 to August 1, 2023, Adv. Atmos. Sci., 42, 761–779, https://doi.org/10.1007/s00376-024-4064-3, 2025.
Xia, R. and Zhang, D.-L.: An Observational Analysis of Three Extreme Rainfall Episodes of 19–20 July 2016 along the Taihang Mountains in North China, Mon. Weather Rev., 147, 4199–4220, https://doi.org/10.1175/MWR-D-18-0402.1, 2019.
Xu, H. and Li, X.: Torrential rainfall processes associated with a landfall of Typhoon Fitow (2013): A three-dimensional WRF modeling study, J. Geophys. Res.-Atmos., 122, 6004–6024, https://doi.org/10.1002/2016JD026395, 2017.
Xu, H., Zhang, D., and Li, X.: The Impacts of Microphysics and Terminal Velocities of Graupel/Hail on the Rainfall of Typhoon Fitow (2013) as Seen From the WRF Model Simulations With Several Microphysics Schemes, J. Geophys. Res.-Atmos., 126, e2020JD033940, https://doi.org/10.1029/2020JD033940, 2021.
Xu, H., Li, X., Yin, J., and Zhang, D.: Predecessor Rain Events in the Yangtze River Delta Region Associated with South China Sea and Northwest Pacific Ocean (SCS-WNPO) Tropical Cyclones, Adv. Atmos. Sci., 40, 1021–1042, https://doi.org/10.1007/s00376-022-2069-3, 2023a.
Xu, H., Zhao, D., Yin, J., Duan, Y., Gao, W., Li, Y., and Zhou, L.: Indirect Effects of Binary Typhoons on an Extreme Rainfall Event in Henan Province, China From 19 to 21 July 2021. 3. Sensitivities to Microphysics Schemes, J. Geophys. Res.-Atmos., 128, e2022JD037936, https://doi.org/10.1029/2022JD037936, 2023b.
Yang, L., Liu, M., Smith, J. A., and Tian, F.: Typhoon Nina and the August 1975 Flood over Central China, J. Hydrometeorol., 18, 451–472, https://doi.org/10.1175/JHM-D-16-0152.1, 2017.
Yin, J., Wang, D., Liang, Z., Liu, C., Zhai, G., and Wang, H.: Numerical Study of the Role of Microphysical Latent Heating and Surface Heat Fluxes in a Severe Precipitation Event in the Warm Sector over Southern China, Asia-Pacific J. Atmos. Sci., 54, 77–90, https://doi.org/10.1007/s13143-017-0061-0, 2018.
Yin, J., Zhang, D.-L., Luo, Y., and Ma, R.: On the Extreme Rainfall Event of 7 May 2017 Over the Coastal City of Guangzhou. Part I: Impacts of Urbanization and Orography, Mon. Weather Rev., 148, 955–979, https://doi.org/10.1175/MWR-D-19-0212.1, 2020.
Yin, J., Liang, X., Wang, H., and Xue, H.: Representation of the autoconversion from cloud to rain using a weighted ensemble approach: a case study using WRF v4.1.3, Geosci. Model Dev., 15, 771–786, https://doi.org/10.5194/gmd-15-771-2022, 2022a.
Yin, J., Gu, H., Yu, M., Bao, X., Xie, Y., and Liang, X.: Synergetic Roles of Dynamic and Cloud Microphysical Processes in Extreme Short-Term Rainfall: A Case Study, Q. J. Roy. Meteor. Soc., 148, 3660–3676, https://doi.org/10.1002/qj.4380, 2022b.
Yin, J., Gu, H., Liang, X., Yu, M., Sun, J., Xie, Y., Li, F., and Wu, C.: A Possible Dynamic Mechanism for Rapid Production of the Extreme Hourly Rainfall in Zhengzhou City on 20 July 2021, J. Meteorol. Res.-PRC, 36, 6–25, https://doi.org/10.1007/s13351-022-1166-7, 2022c.
Typhoon Doksuri (2305) weakened to a typhoon remnant vortex as it was passing through East China's Anhui province. The China Meteorological Administration (CMA) stopped issuing updates on Doksuri at 03:00 UTC on 29 July 2023. The remnant of Doksuri remained in a vortex in the lower troposphere, although its wind force diminished as it moved northward.
- Abstract
- Introduction
- Properties of rainfall and wind profiles
- Model configuration and verification
- Unique features of the extreme rainfall
- Conclusions and outlook
- Code and data availability
- Author contributions
- Competing interests
- Disclaimer
- Acknowledgements
- Financial support
- Review statement
- References