the Creative Commons Attribution 4.0 License.
the Creative Commons Attribution 4.0 License.
 | 12 May 2025
Social sensing a volcanic eruption: application to Kīlauea, 2018
James Young
Michelle Spruce
Ravi Pandit
Hywel Williams
Rudy Arthur
Wendy Stovall
Matthew Head
Protecting lives and livelihoods during volcanic eruptions is the key challenge in volcanology, conducted primarily by volcano monitoring and emergency management organisations, but it is complicated by scarce knowledge of how communities respond in times of crisis. Social sensing is a rapidly developing practice that can be adapted for volcanology. Here we use social sensing of Twitter (currently known as X) posts to track changes in social action and reaction throughout the 2018 eruption of Kīlauea on the island of Hawai`i. The volume of relevant posts very rapidly increases in early May, coincident with the beginning of the eruption; automated sentiment analysis shows a simultaneous shift towards more negative emotions being expressed in post text. Substantial negative trends in sentiment are evident in reaction to high-impact events, including the destruction of a popular residential area and injuries sustained by tourists viewing the eruption. Topics of local Twitter conversation reveal societal actions, including the sharing of hazard warnings, mitigation actions, and aid announcements. Temporal trends in societal actions reflect patterns in volcanic activity (e.g. the peak and waning of eruptive activity), civil protection actions (e.g. risk mitigation actions and the communication of official warnings), and socioeconomic pressures (e.g. the destruction of homes). Local tweets detailing eruption damage and disruption display a similar temporal trend to independent estimates of the number of buildings in contact with lava. We show how hazard and risk information is discussed and reacted to on Twitter, which helps inform our understanding of community response actions and aids situational awareness, and outline how our approach could be adapted for use in real time.
- Article
(7794 KB) - Full-text XML
- BibTeX
- EndNote


Volcanic crises can cause significant damage, casualties, and economic loss (Brown et al., 2015; Barclay et al., 2015), especially as over 800 million people live near volcanoes (< 100 km) (Loughlin et al., 2015) and many more people depend on them for their livelihoods (e.g. using resources related to the volcano) (Brown et al., 2015). During volcanic unrest and eruption, volcano monitoring agencies work closely with emergency management organisations to assimilate multi-disciplinary data streams and provide hazard updates and actionable risk mitigation advice to the communities at risk (Jolly and de la Cruz, 2015; Peltier et al., 2021; Bonaccorso et al., 2016; Stovall et al., 2023). Volcanic hazard and risk information are communicated to the public using a variety of media types, including newspapers (e.g. Calabrò et al., 2020), TV and radio (e.g. Mani et al., 2024), and, increasingly, social media (Stovall et al., 2023; Goldman et al., 2023; Williams and Krippner, 2019; Mani et al., 2024). Due to a lack of resources (financial, time, personnel), there is currently no common, large-scale mechanism to track how that information may result in individual- and community-level action (Mani et al., 2024) nor how that information may influence the emotional state (reaction) of affected populations (Ruiz and Hernández, 2014). Consequently, social impacts of volcanic crises can be poorly understood. In particular, the actions and reactions of local populations may evolve during an eruptive crisis in response to the dynamic nature of volcanic hazards (Hicks and Few, 2015) and the fluctuating impacts of mitigation and recovery actions (Barclay et al., 2019). These time-dependent changes could provide useful feedback and information for volcanic monitoring agencies and emergency management organisations (Barclay et al., 2015) but are likely lost when traditionally interviewing subsets of affected individuals once a crisis has ended (Mani et al., 2024; Goldman et al., 2023; Christie et al., 2015; Naismith et al., 2020; Armijos et al., 2017).
Social media posts (text, photos, and videos) are often shared in real time with useful identifying keywords or “hashtags”, and they can provide free, fast, efficient, quantifiable, and valuable information during times of crisis (Guan and Chen, 2014; Yu et al., 2018; Wadsworth et al., 2022). Social sensing is the systematic analysis of publicly available social media data to observe real-world events (Liu et al., 2015). Emerging social sensing techniques have proven effective for the study of a number of natural hazards across a range of social media networks (e.g. storms (Spruce et al., 2020), floods (Arthur et al., 2018; Young et al., 2022), hurricanes (Spence et al., 2015; Wu and Cui, 2018; Guan and Chen, 2014; Zhou et al., 2021), earthquakes (Steed et al., 2019), and heatwaves (Kirilenko et al., 2015)), providing early warnings and qualitative and quantitative information. Studies have been conducted to geospatially detect and locate hazardous events, uncovering previously unknown hazard extents (Spruce et al., 2020; Arthur et al., 2018; Wu and Cui, 2018; Guan and Chen, 2014); to investigate topics of discussion (Spruce et al., 2020; Spence et al., 2015; Guan and Chen, 2014) and emotional responses (Wu and Cui, 2018; Spruce et al., 2020; Giuffrida et al., 2020) that may vary through different temporal stages of a disaster; to analyse societal impacts (Wu and Cui, 2018; Kryvasheyeu et al., 2016); to assess how information spreads through social networks (Spence et al., 2015); and to conduct rapid damage assessment (Guan and Chen, 2014). Although analyses are sparse, with increased damage losses there appears to be greater social media activity (Wu and Cui, 2018; Kryvasheyeu et al., 2016) and a more negative sentiment expressed in social media content (Wu and Cui, 2018). Social sensing has never been systematically applied to a volcanic eruption. Here we aim to test whether social sensing can track and quantify changes in societal actions and emotional responses during an eruptive crisis and whether those changes are coincident with different stages of the eruption.
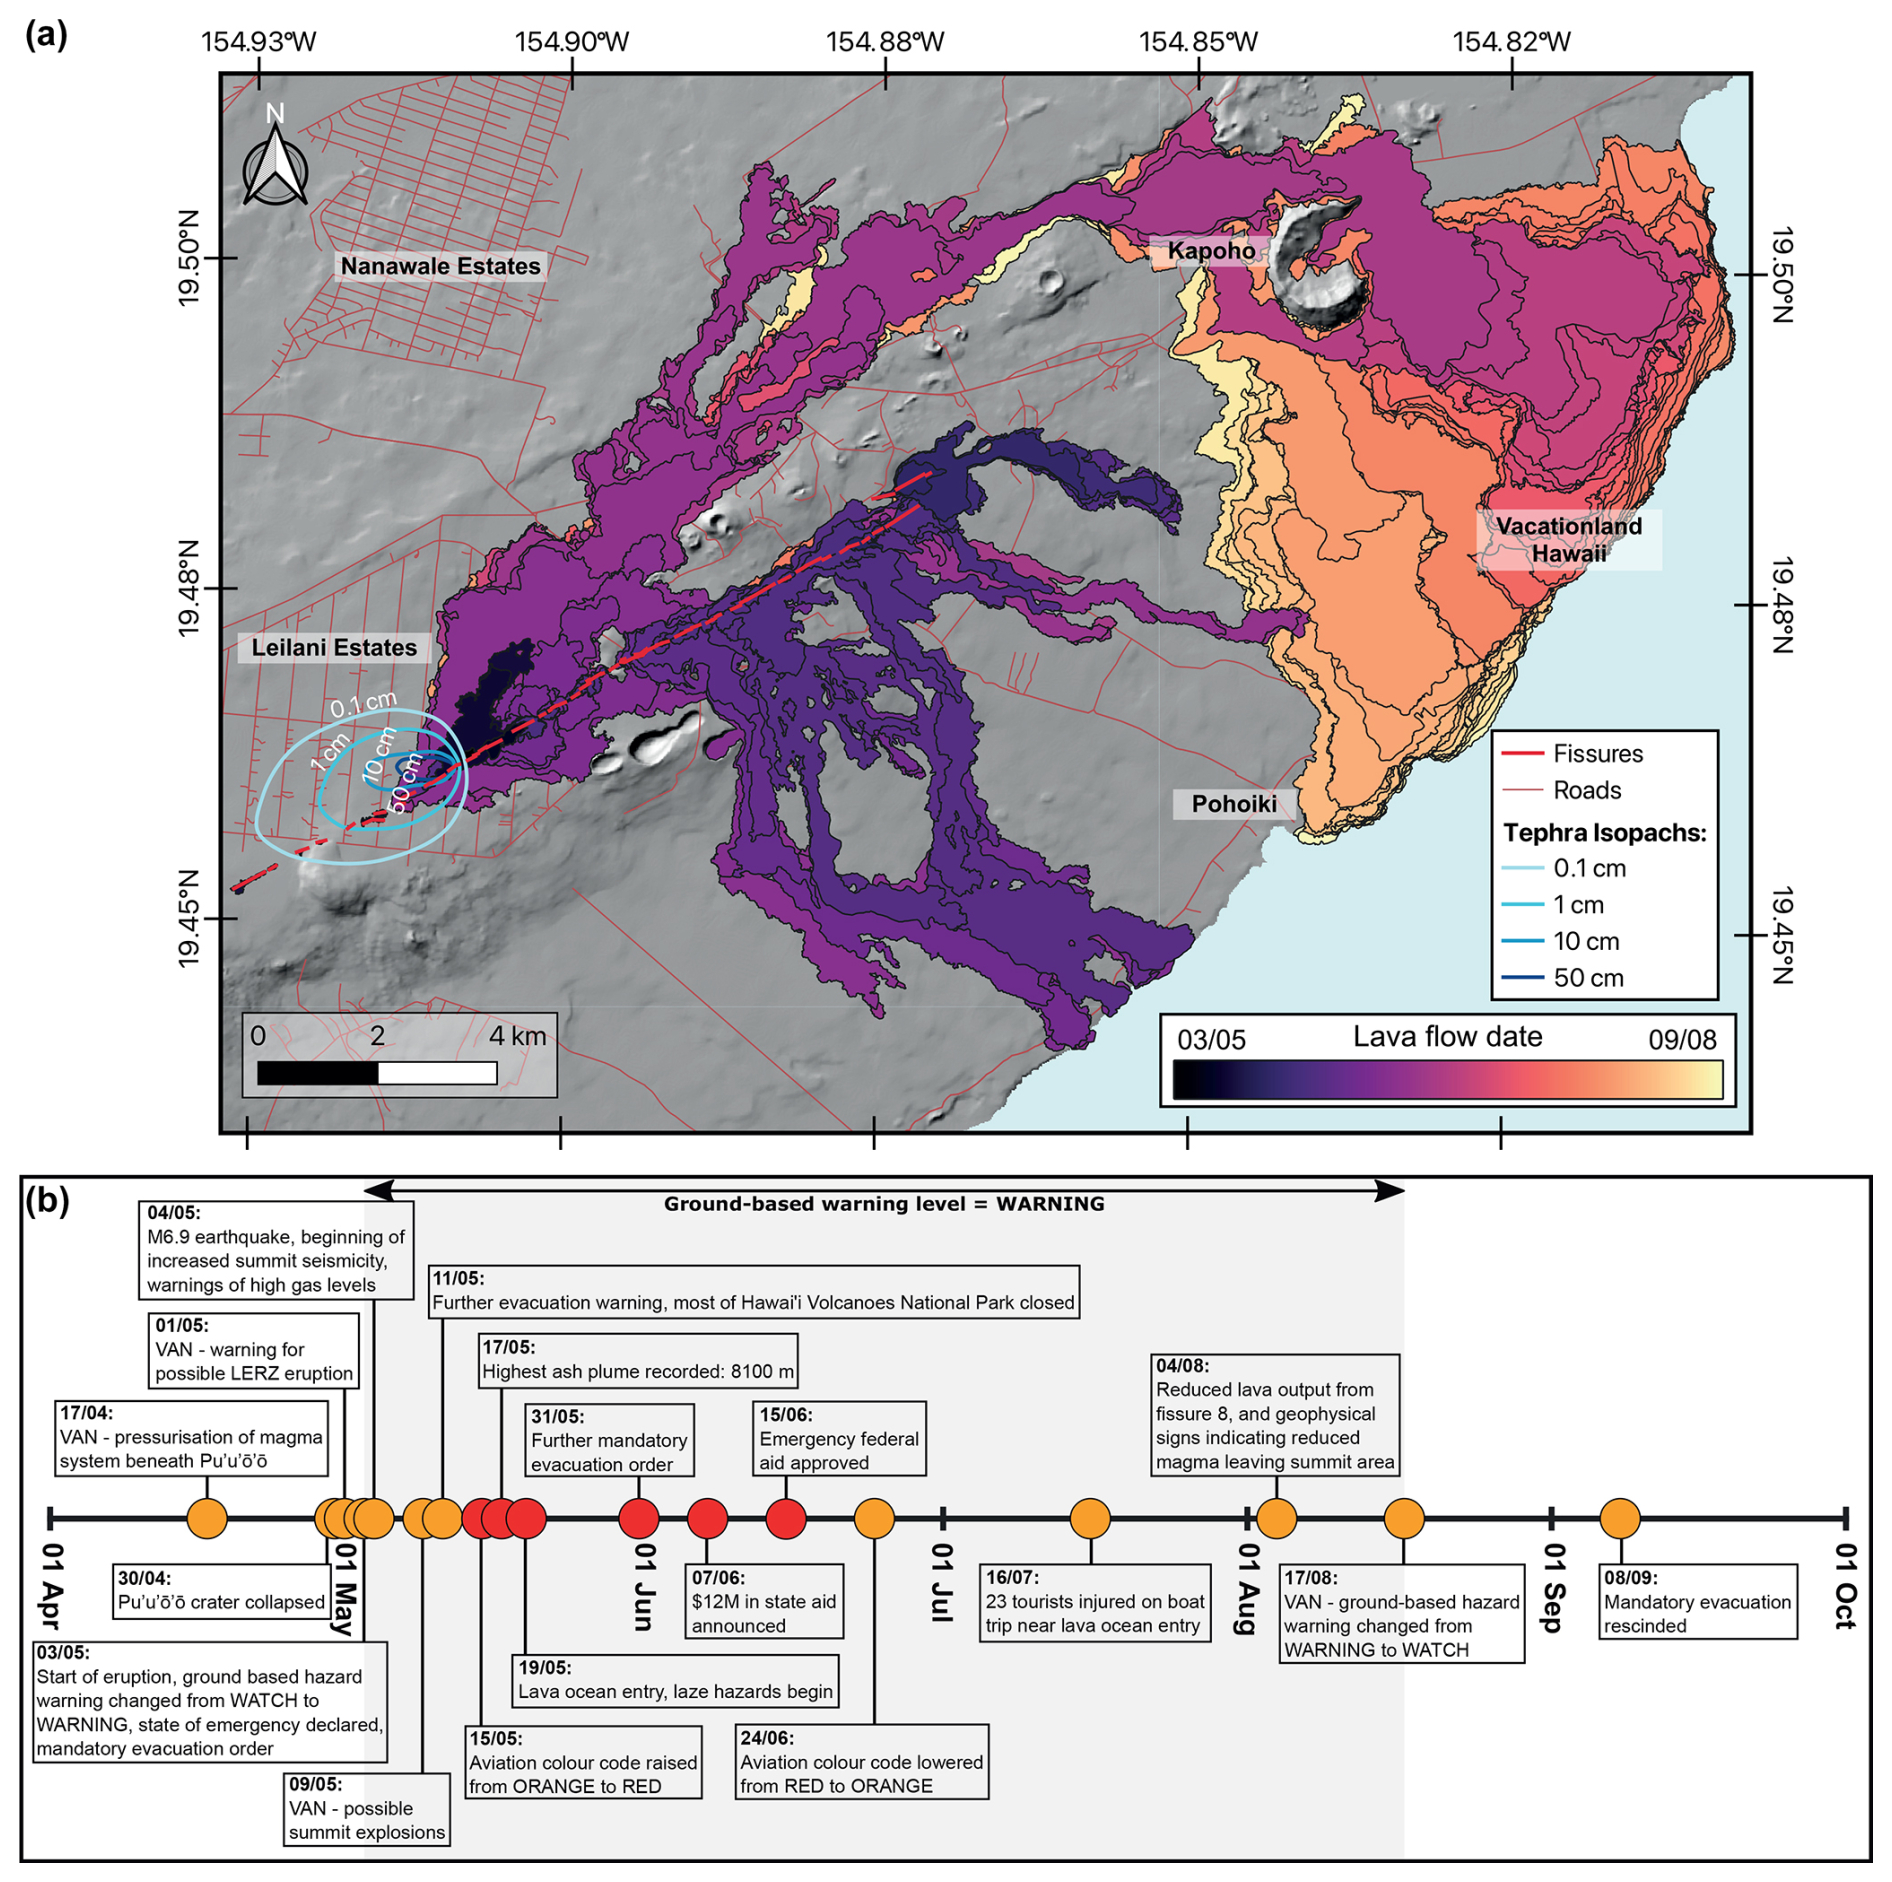
Figure 1Overview of the 2018 Kīlauea LERZ eruption. (a) Map of the eruption with key locations highlighted alongside the temporal evolution of the lava flow extent and the spatial distribution of tephra deposits from fissure 8. (b) Timeline of the eruption. The grey background indicates the period where the ground-based alert level was at “warning”, and the colour of the points reflects the aviation colour code. VAN – volcanic activity notice.
We focus our analyses on the 2018 lower East Rift Zone (LERZ) eruption of Kīlauea (Fig. 1) due to its long duration (May–August 2018) and substantial socioeconomic (i.e. affecting economic and social wellbeing) impacts (Meredith et al., 2022; Houghton et al., 2021; Williams et al., 2020). The LERZ eruption was preceded in March and April 2018 by rapidly rising pressure in the Kīlauea magmatic system, evidenced by inflation around the Pu`u`Ō`ō vent and rising levels in the Halema`uma`u lava lake (Neal et al., 2019; Anderson et al., 2019; Patrick et al., 2020). Eventually, the Pu`u`Ō`ō crater collapsed on 30 April, prompting magma to migrate eastwards downrift through dykes into the LERZ and causing elevated felt seismicity and surface deformation (including ground cracks) in the Puna district (Neal et al., 2019; Anderson et al., 2019). On 1 May, the United States Geological Survey (USGS) Hawaiian Volcano Observatory (HVO) issued a Volcanic Activity Notice (VAN), highlighting the possibility of a new eruption within the LERZ (Stovall et al., 2023). The eruption began on 3 May (Fig. 1), with a fissure opening in the Leilani Estates subdivision, erupting basaltic lava flows. A total of 24 fissures opened during the eruption and were sequentially numbered, with fissure 8 being the most productive (Gansecki et al., 2019). Lava flows first reached the coast on 19 May, entering the sea and producing laze (lava haze consisting of steam, hydrochloric acid, and tiny glass shards), while a later segment of the flow reached the sea on 3 June. Major lava effusion ended on 4 August.
At the same time as the LERZ fissure activity, the summit reservoir feeding the LERZ eruption sequentially deflated, initially producing summit explosions driven by rockfall into the lowering lava lake (Neal et al., 2019). As further deflation continued, the Halema`uma`u crater widened, and larger ash-plume-producing collapse explosions progressed into a series of regular caldera collapse events (Anderson et al., 2019). The successive caldera collapses were associated with felt ∼ M5 earthquakes, additional lower-magnitude seismicity (> ∼ 700 events per day, with M ≤ 4), and the production of ash plumes (Neal et al., 2019). The largest earthquake related to the volcanic activity measured M6.9 on 4 May, believed to have been initiated by the dyke intrusion into the LERZ (Neal et al., 2019).
The lava flows covered 32.4 km2 of the Puna district of Kīlauea's LERZ (Fig. 1), destroying 1839 structures and damaging a further 90 (Meredith et al., 2022). Damage to buildings extended beyond the lava flow margins as a result of fire, thermal effects, and the impact of volcanic gases and tephra (Meredith et al., 2022). Between May 2018 and April 2019, the estimated total economic cost of the eruption was ∼ USD 1 billion, alongside the loss of 2950 jobs (County of Hawai`i, 2020); the tourism and agriculture sectors were amongst the most severely impacted, and the closure of the Hawai`i Volcanoes National Park is thought to have cost ∼ USD 99 million alone (County of Hawai`i, 2020). An estimated 5563 people were permanently or temporarily displaced by the eruption, 2668 of whom were served mandatory evacuation orders (Kim et al., 2019). There were differences amongst the impacted regions in how eruption information was perceived, especially regarding trust and credibility of the messenger(s) (Goldman et al., 2023). For example, in the LERZ, where the impacts were felt most severely, surveyed residents reported placing more trust in “community messengers”, whose information was mostly shared through social media (Goldman et al., 2023). Social media was also used extensively by the USGS HVO, increasing two-way dialogue and the speed and reach of official communications (Goldman et al., 2024); it was deemed vital for the dynamic, rapidly evolving situations for which they needed to provide updates (Stovall et al., 2023). The proliferation of social media usage during this eruption makes it an ideal case for exploring the application of social sensing in a novel volcanological context to detect and monitor social activity and emotional responses.
We use data from the social media platform Twitter in this social sensing study due to the availability of these data when conducting our analyses. We note that Twitter has rebranded as “X”, but we will use the term Twitter (and tweets) in this publication, as that was its name in 2018. Twitter is an online micro-blogging social media service allowing users to post updates (called “tweets”) limited to 280 characters (including emoji). Tweets can be accompanied by multimedia content (e.g. photos or videos) and often contain “hashtags” (indicated by a #) that link all tweets containing the same hashtag and allow users to follow specific topics. Twitter is one of the world's most popular social networks, with over 300 million users in 2018, rising to 415 million in 2023 (Number of Twitter users worldwide from 2018 to 2027: https://www.statista.com/forecasts/1146722/twitter-users-in-the-world, last access: 18 August 2023), and is often used to share updates and information about events more rapidly than traditional media sources (Wu and Cui, 2018).
2.1 Twitter data collection
Our data collection centres around the 2018 LERZ eruption of Kīlauea. Twitter provides an application programming interface (API) that can be used to access and download Twitter data in real time or for historical events. At the time of data collection in May 2020, the free version of the API could not be used to access past (“historic”) tweets, so a paid service was used to collect our data via the trackmyhashtag.com analytics tool. Later in 2020, the use of the academic API was extended to allow free access to historical tweets. However, the free use of the academic API was discontinued in May 2023 following the change in Twitter ownership in October 2022, and it is now administered within a premium paid business service beyond the scope of most academic research projects (https://www.theverge.com/2023/5/31/23739084/twitter-elon-musk-api-policy-chilling-academic-research, last access: 18 August 2023). Government and public-owned services have retained free access to the API for posting public utility alerts, and there is hope that this will be extended to downloading tweet data, free usage of the API for monitoring severe events, and a possibly reduced rate for academic access.
Our data were collected using a “Kilauea” search term for all English-language historical tweets, excluding retweets, between 1 January 2018 and 1 December 2018 to cover the pre-eruption, eruption, and post-eruption periods. The search term is case-insensitive but does not include the spelling with kahakō (i.e. Kīlauea). Data were collected in JavaScript Object Notation (JSON) format for 163 438 tweets. The JSON file contains the tweet text, as well as a number of metadata fields (e.g. username, user location, geotag, tweet time and date, unique identifier); we do not attempt to infer any extra (and uncertain) demographic information (e.g. McCormick et al., 2017) to avoid data misclassification and privacy complications. The following analyses and investigation are consistent with the Twitter terms of service. We acknowledge the possibility that some tweets posted around the time of the eruption might have been deleted prior to our data collection, and therefore we may be missing some potentially insightful data.
2.2 Data filtering
Following data collection, several steps were taken to first remove irrelevant data and then to narrow the focus of the data to a greater proportion of human insight. The following filters are described in the order in which they were applied.
-
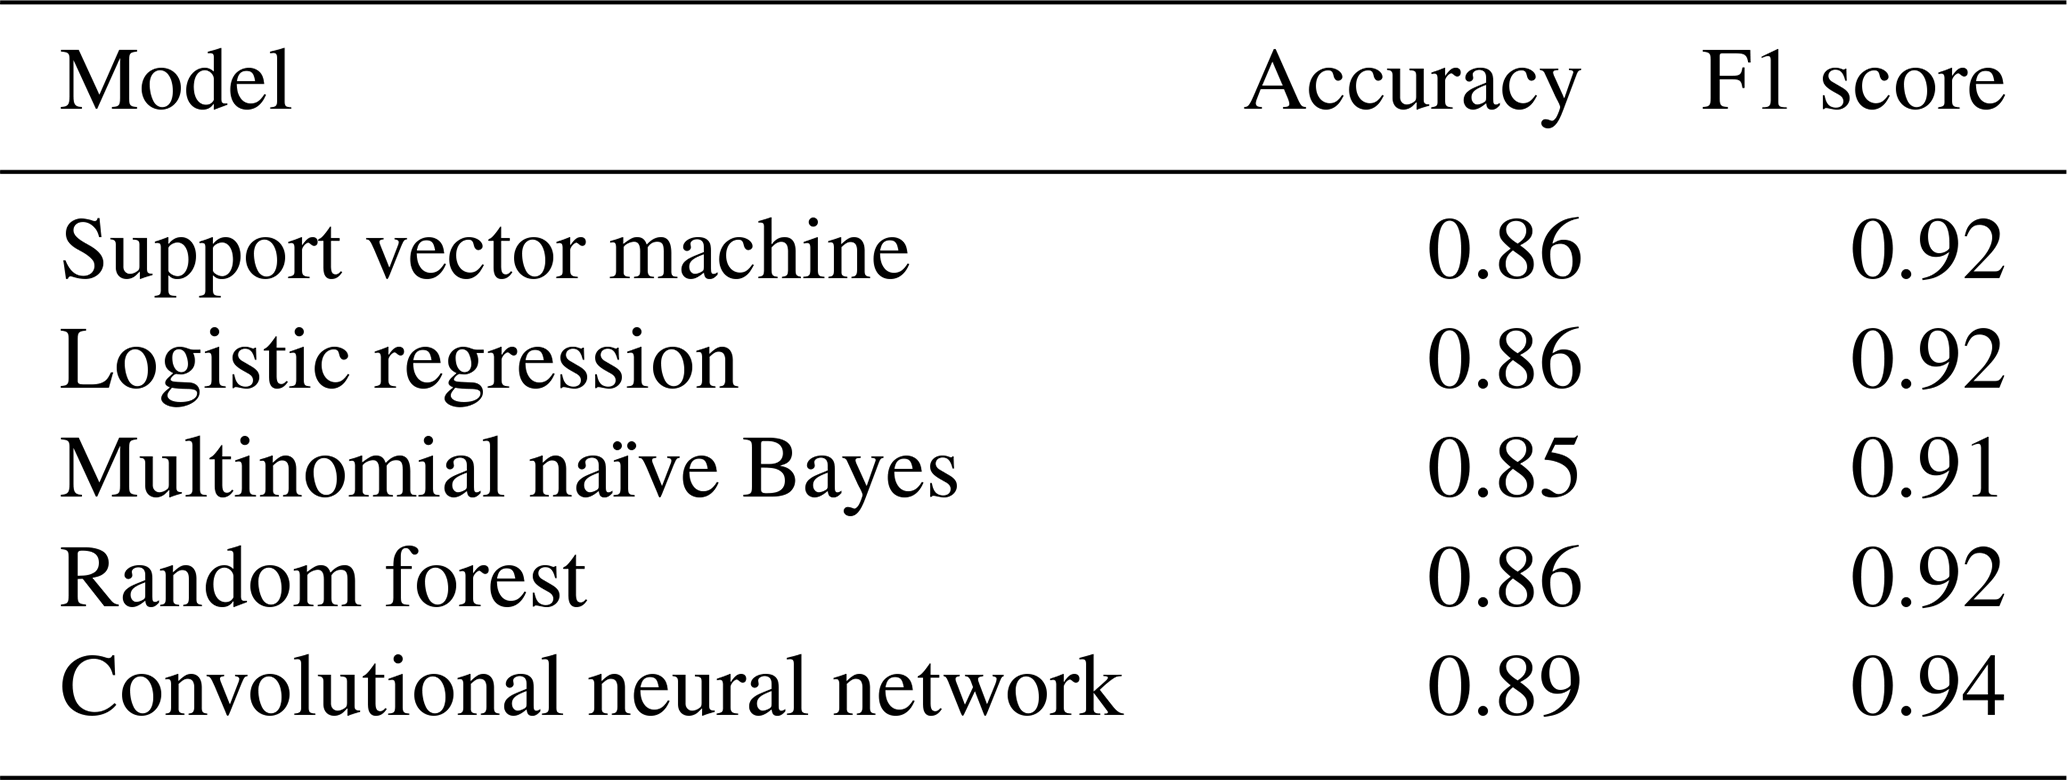
Machine learning relevance filter. A sample of 5748 tweets were manually classified as relevant or irrelevant by a team of five human coders who also performed inter-coder reliability checks. Similar splits of training and test data have been successfully used in other natural-hazard social sensing studies (Young et al., 2021, 2022; Spruce et al., 2020, 2021). To be classified as relevant, the tweet needed to be related to the eruption of Kīlauea. The labelled tweets were used as training data for a machine learning classifier; 70 % were used for training and the remaining 30 % were used for validation. A comparison of test data accuracy is shown in Table 1 for various machine learning models, where the F1 score represents the precision and recall and therefore the reliability of the model. The convolutional neural network yielded the highest accuracy on the test data and was consequently selected for use and applied to the full dataset; 89 % of the full dataset (142 877 tweets) passed the relevance filter (Fig. A1).
-
Source filter. Tweet metadata include a source attribute that identifies whether the tweet originated from Twitter or from an external source such as Facebook, Instagram, or a news website. Tweets from external sources are often automated and do not provide human insight into the event, and therefore only tweets that were directly posted on Twitter were kept for this analysis.
-
Username filter. A manual inspection of the dataset's 100 most active tweeting accounts showed that many were news accounts or automated volcano tracking/update accounts. As these often do not provide human insight into the event, it is common to remove them (Young et al., 2021). A list of words commonly found in unwanted Twitter account names was created, and if any of these words were found in a tweet username, the tweet was removed. The list of words contained the following: “news”, “daily”', “press”, “post”, “times”, “bbc”, “story”, “network”, “gazette”, “independent”, “stories”, “thesun”, “nation”, “media”, “guide”, “reuter”, “econom”, “radio”, “weather”, “climate”, “trending”, “volcan”, “hawaii”, “lava”, “magma”, “mantle”, “kilauea”, “environ”, “nature”, “physic”, “science”, and “quake”.
-
Duplicate filter. Duplicate tweets were identified and removed from the dataset to ensure high data quality. The three main causes of duplication were (i) duplicates arising during data collection; (ii) identical content shared across users, often copied and pasted from external sources; and (iii) user error or bots posting the same content multiple times.
Table 1Test data accuracy for machine learning models applied for the relevance classifier.
The results of the filtering stages are shown in Fig. A1, where parallel trends in data volume are evident throughout 2018.
2.3 Location inference
Location information is important for determining the spatial variation in eruption responses and can be obtained from Twitter users who enable geo-tagging or manually tag a location, providing either specific coordinates or a “bounding box” (a set area within which the location falls). Typically, however, only 2 % of tweets include such location information in their metadata (Laylavi et al., 2016), which can greatly limit geospatial analysis. Location inference techniques can address this limitation and accurately locate tweets while maintaining a high volume of data. We applied the location inference method of Arthur et al. (2018) to our filtered relevant tweets. This approach uses multiple tweet indicators, including locations in tweet text and user description; the user-entered location field; the manually tagged place attribute; and GPS coordinates of geo-tagged tweets. By overlaying the indicators present, the most probable location for the tweet is returned.
2.4 Sentiment analysis
Sentiment analysis is a natural-language-processing technique that quantifies emotions in text. VADER (Valence Aware Dictionary and sEntiment Reasoner) is a commonly used sentiment analysis model optimised for short-form social media data and is lightweight and transparent in how it operates, making it ideal for our task (e.g. Young et al., 2022; Spruce et al., 2020; Goldman et al., 2024; Valdez et al., 2020). VADER works by assessing the sentiment of text based on a predefined dictionary/lexicon of words, each manually assigned a sentiment score (Hutto and Gilbert, 2014). These scores range from negative (−1) to positive (+1), reflecting the emotional tone of the words. The model considers not only individual words but also the context, including the use of intensifiers, negations, punctuation, emoticons, and slang (Hutto and Gilbert, 2014). We applied VADER via the vaderSentiment Python package to the tweet text to calculate the overall sentiment score for each filtered relevant tweet. There is potential for the misinterpretation of some tweet text to introduce errors into the sentiment analysis, but with a big-data approach, these potential errors average out; consequently, VADER has been successfully applied in previous state-of-the-art social sensing studies (e.g. Young et al., 2022; Spruce et al., 2020; Arthur et al., 2018; Valdez et al., 2020; Goldman et al., 2024).
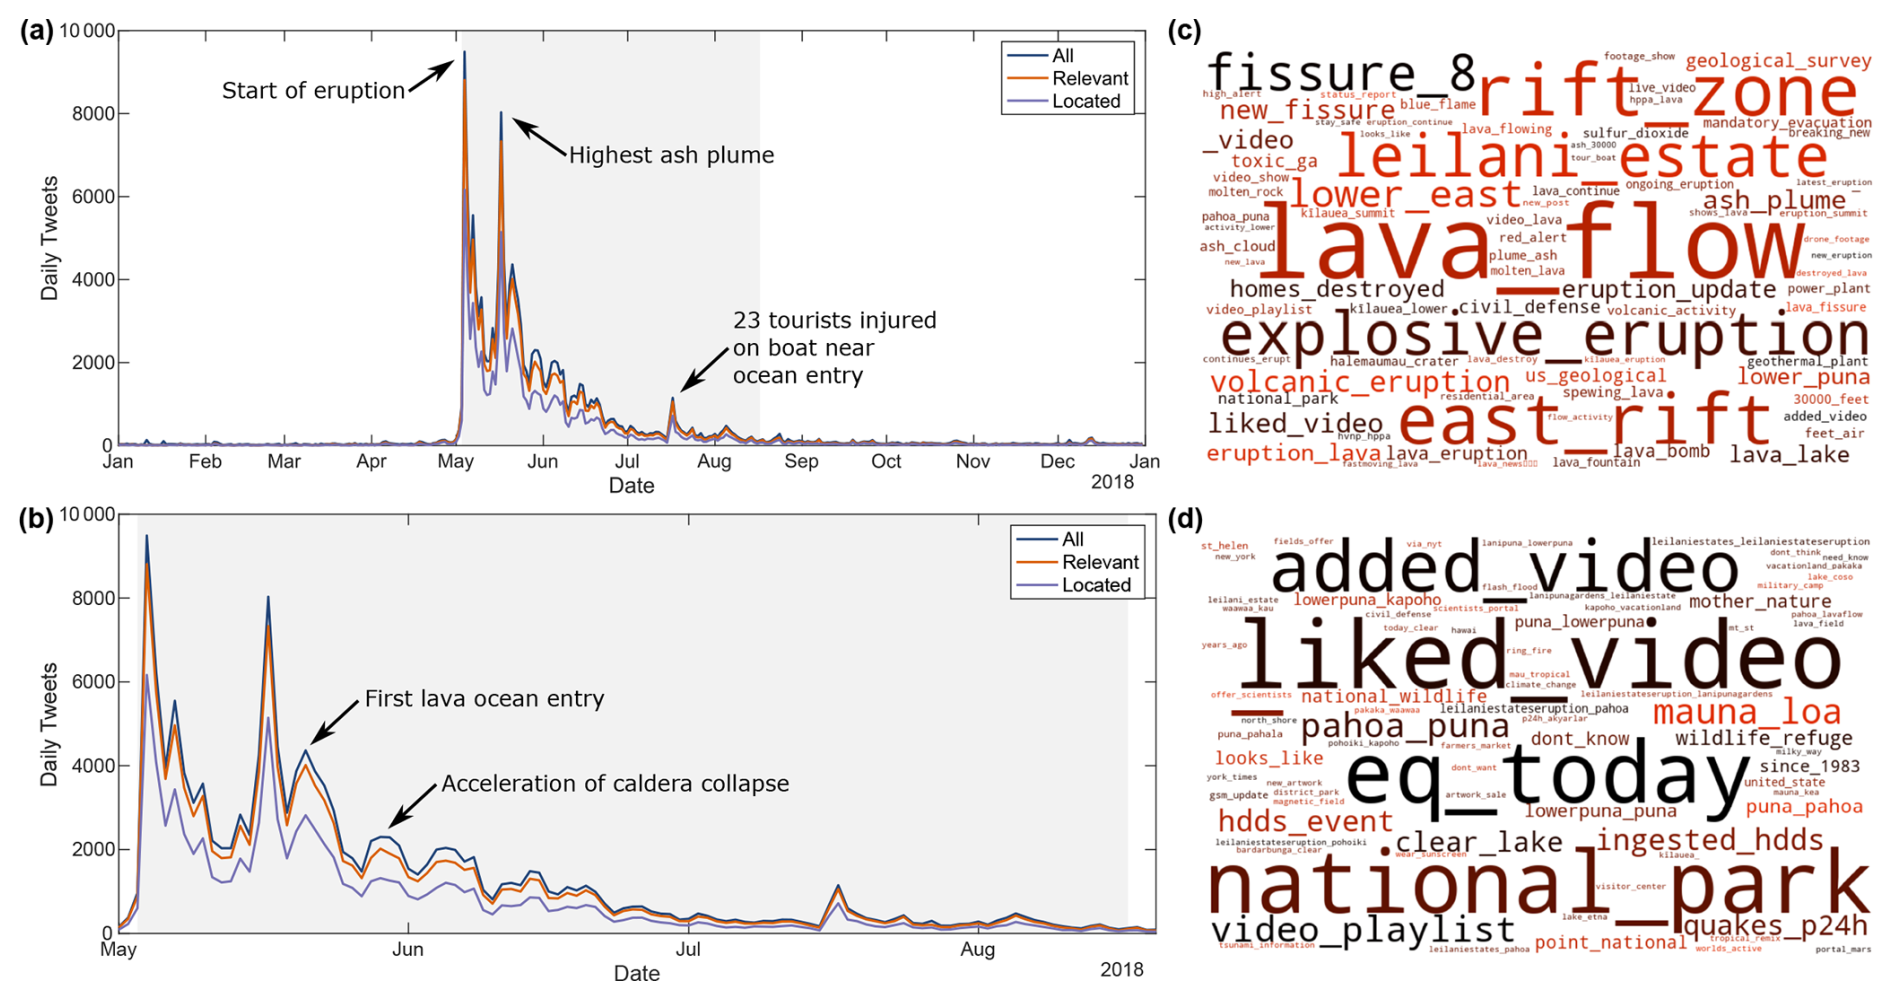
Figure 2Twitter dataset time series and relevancy. (a) Time series of the full Twitter dataset (dark blue) and the subsets that were deemed relevant (orange) and able to be assigned to a location (light purple) for all of 2018. (b) Same as (a) but for the eruption period only. In panels (a) and (b), the grey background indicates the period when the ground-based alert level was at “warning”. (c) Word cloud of the most common bigrams (a pair of consecutive written units) for all relevant tweets (maximum – “lava_flow”, where n = 3947, minimum – “footage_show”, where n = 2). (d) Word cloud of most common bigrams for all irrelevant tweets (maximum – `liked_video”, where n = 222, minimum – “leilani_estate”, where n = 1). Larger bigrams in the word clouds indicate more frequent occurrence.
2.5 Content analysis
Filtered relevant tweets that had a geographic origin within the state of Hawai`i (referred to henceforth as Hawaiian tweets) were manually analysed and placed into one of five categories. The categories were determined after five independent human coders inspected subsamples of the full dataset and comprised the following.
-
Observation. The tweet contains, or links to, a description, photo or video of eruptive phenomena.
-
Warning. The tweet contains, or links to, official or unofficial warnings of the eruption.
-
Support and concern. The tweet contains, or links to, messages of support and/or concern for impacted individuals or communities.
-
Damage and disruption. The tweet contains, or links to, accounts of damage and/or disruption caused by the eruption.
-
Other: The tweet is related to the eruption but does not fit into any of the previous categories.
The categorisation of 4583 tweets was performed manually by the lead author. Prior to this, the five human coders performed inter-coder reliability checks (O'Connor and Joffe, 2020) to ensure the category descriptions and tweet assignments into categories were self-consistent across the five coders. Iterations between category descriptions and the number of categories improved the Fleiss kappa agreement score from an initial 67 % (“good”) to 87 % (“very good”) (Altman, 1999; Landis and Koch, 1977), which was deemed sufficient to progress with the final categorisation of tweets. Tweet text and any links or multimedia content included were used to assign a category. Where tweets could have crossed multiple categories, they were assigned to the category they were deemed to represent most strongly in order to simplify the data analysis. Future work may wish to expand on this approach by allowing tweets to fit one or more categories simultaneously.
In addition to categorising the relevant Hawaiian tweets into one of the five categories, these tweets were also given a manual binary tag of being either related or unrelated to professional news. In this case, related to professional news meant a news agency or professional journalist posted the tweet or the tweet contained a link to a professional online news article.
Finally, URLs within filtered relevant tweets were extracted from the tweet metadata. URLs in tweets are usually shortened to minimise their impact on the character limit. Many URLs were shortened using bit.ly, and the bitly API was used to expand them. For the remaining shortened URLs, a script using selenium was used to fully load the URLs before scraping and returning the true domain.
3.1 Event time series
Our initial dataset contains 163 438 tweets. The number of tweets per day explodes in early May, coincident with the onset of unrest and beginning of the eruption, then slowly tails off, with a return to near-background levels in late August (Fig. 2), potentially due to a declining interest in the eruption and decreasing eruption impacts. From the full dataset, 89 % of the data (142 877 tweets) passed the relevance filter, and 68 % of the relevant tweets (96 965 tweets) were able to be assigned to an individual location; temporal trends in relevant and located tweets are parallel to that of the full dataset (Figs. 2 and A1). The relevant tweets are related to volcanic hazards and impacts of the eruption, as well as observations and civil protection activities, while the irrelevant tweets contain a mixture of automated tweets and tweets about the volcano and national park but not the eruption (Fig. 2) An initial peak in tweet volume at the beginning of the eruption is followed by later peaks that can be related to specific hazardous phenomena (e.g. the highest ash plume, the first lava ocean entry) or eruption impacts (e.g. tourists getting injured on a boat trip).
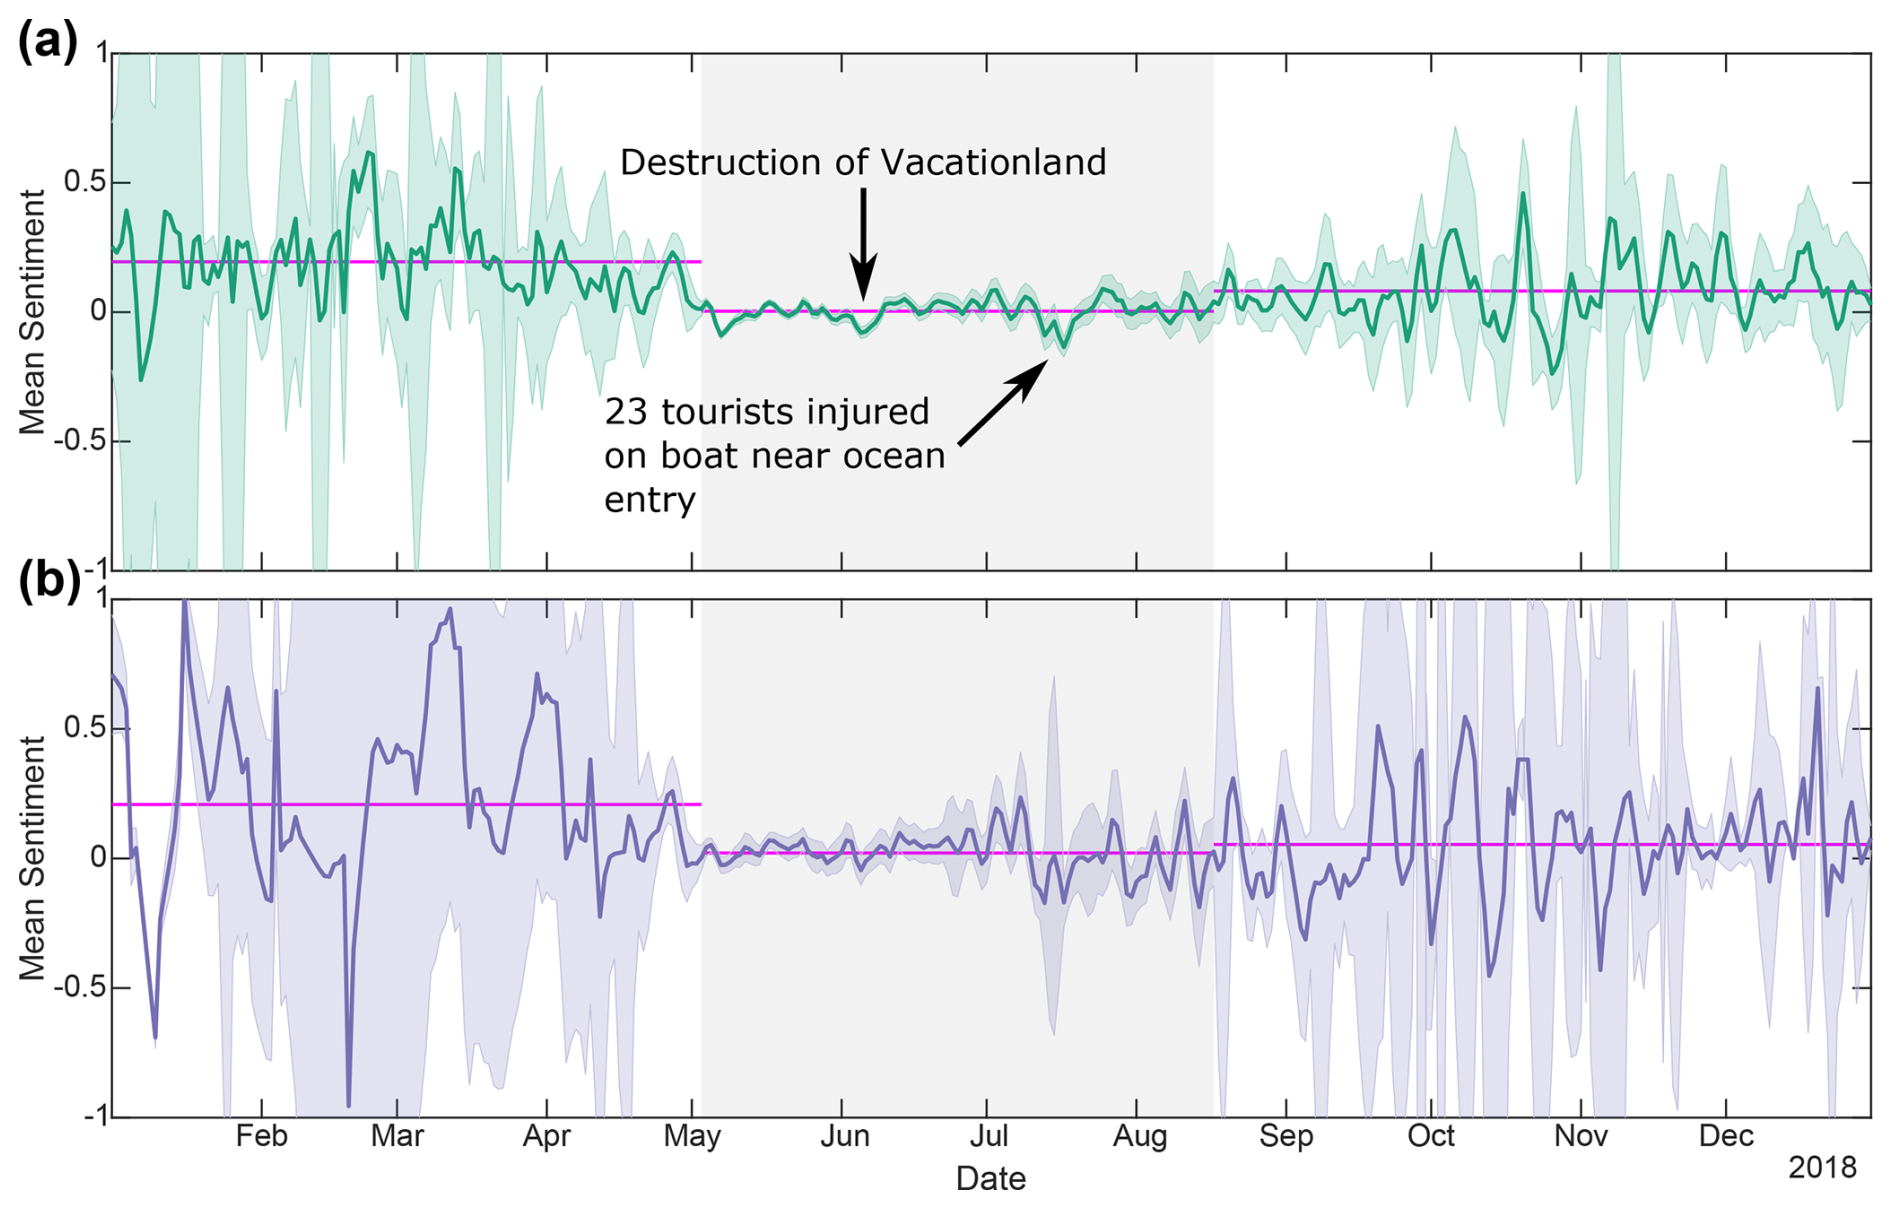
Figure 3Daily sentiment analysis time series. (a) Automated sentiment analysis values for all relevant filtered tweets. (b) Same as (a), but only for tweets assigned to a location within Hawai`i. In panels (a) and (b), the grey background highlights the period when the ground-based alert level was at “warning”, and positive values reflect more positive emotions (and vice versa). The horizontal purple lines mark the mean values for the pre-eruption, syn-eruption, and post-eruption periods, and the shaded error bars are the 95 % confidence intervals.
A high percentage of relevant tweets (89 %) contrasts with many social sensing studies of other natural hazards, for example ∼ 1 %–44 % for floods (Arthur et al., 2018; de Bruijn et al., 2019), 3 %–5 % for UK storms (Spruce et al., 2020), 11 % for worldwide high-impact rainfall events (Spruce et al., 2021), and 19 %–27 % for global heatwaves (Young et al., 2021). These findings may suggest that volcanic eruption discourse on Twitter is more unique when compared to general posts and that further volcano-focussed social sensing studies could possibly benefit from such high relevancy by minimising the collection of irrelevant data. However, such a high percentage of relevant data may also be a result of a very specific initial data search term (“Kilauea”) and may not be repeated for volcano name search terms that have crossover with other topics of conversation (e.g. Mount Baker, Three Sisters, White Island), or for impact-based initial search terms that are also used outside of volcanic eruptions (e.g. buried, covered, inundated). A similar finding has been reported for storm names, where the percentage of relevant tweets was much higher for a storm named “Ophelia” (an uncommon name) compared to a storm named “Brian” (a more common name) (Spruce et al., 2020). Within the relevant Kīlauea data, the clear peaks in data volume correlating with high-impact events highlight the strong public interest in such processes, justifying and enabling the use of social sensing to extract additional clues about social actions and reactions for the eruption in question but also for future eruptions that have, or could have, significant socioeconomic impacts.
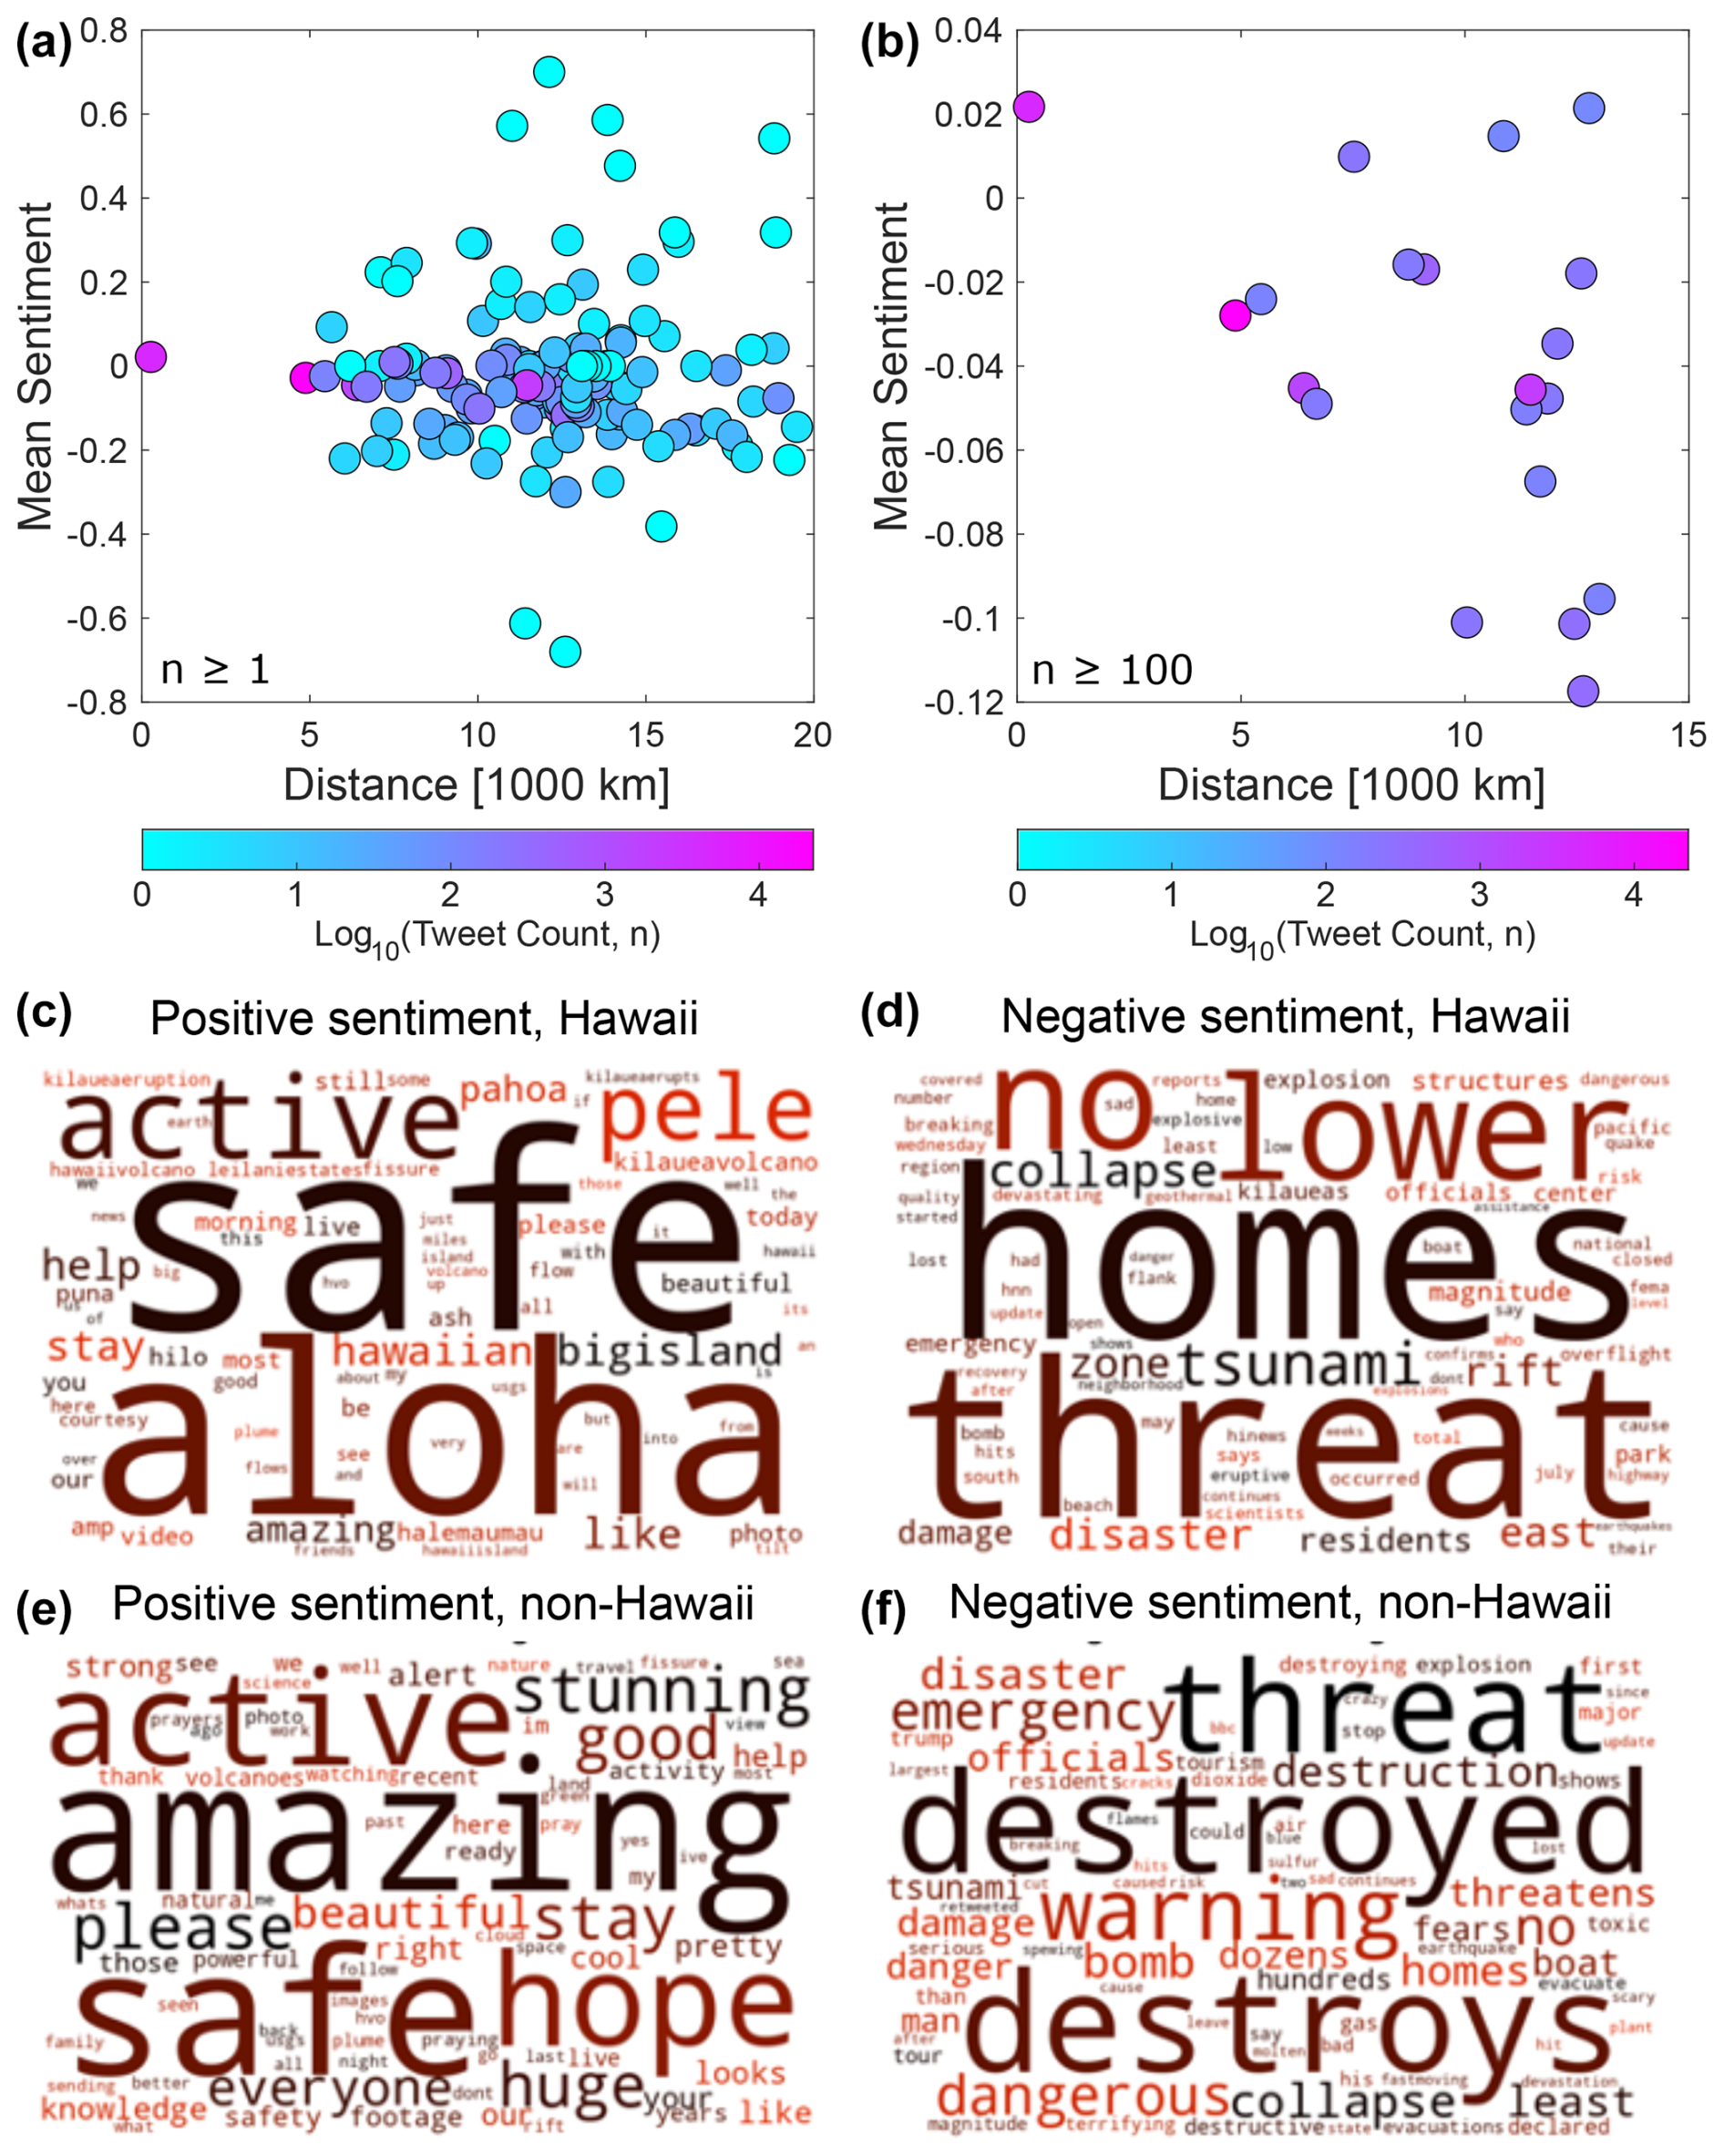
Figure 4Geospatial sentiment analysis. (a) Mean sentiment for all global regions with at least one tweet. (b) Same as (a) but with at least 100 tweets. (c–f) Bigram word clouds for Hawai`i or non-Hawai`i from positive- (0–1) or negative- (−1–0) sentiment-scored tweet groups. Larger bigrams in the word clouds indicate a greater relative frequency of occurrence; i.e. large bigrams contain words that are more common in positive tweets but uncommon in negative tweets (or vice versa).
3.2 Sentiment analysis
By examining only relevant filtered tweets, the automated sentiment analysis shows subtle temporal changes in the emotions expressed through 2018 (Fig. 3). Sentiment scores range from negative (−1) to positive (+1), reflecting the emotional tone of the words (Hutto and Gilbert, 2014). Prior to the eruption, the mean sentiment value is 0.19, matching an expected trend towards positive sentiment in general language (Dodds et al., 2015), but due to the very low data volume, there is a low degree of confidence. During the eruption the mean sentiment score decreases to 0.00, indicating a greater degree of more negative emotions being expressed in the tweet text. After the eruption, the mean sentiment through to the end of 2018 increases to 0.08 but also with a low confidence from a low data volume. The equivalent values for Hawai`i-specific relevant tweets for the same time periods are 0.21, 0.02, and 0.05 (Fig. 3), indicating a similar magnitude decrease in sentiment during the eruption but a smaller post-eruption recovery, potentially due to prolonged eruption impacts (e.g. County of Hawai`i, 2020) and post-event trauma. The temporal patterns between the Hawai`i-specific data and that of all geographic regions are similar. Within the eruption period there is an initial sharp decrease in sentiment, reflecting the personal shock and upset caused by the early impacts, as well as increased media attention and circulation of news articles on Twitter. The next two most negative periods in the sentiment time series can be temporally correlated with noteworthy damage (i.e. socioeconomic pressure) or impacts: the destruction of the residential area Vacationland and the injuries sustained by tourists on a boat trip, respectively (Fig. 3). There are generally no correlations identified between the more positive peaks in the sentiment time series and the eruption, or social and political interventions related to the eruption.
Combining the outputs of tweet location inference and sentiment analysis allows us to investigate geospatial patterns in sentiment. When considering all geographic regions that can be assigned at least one geo-located tweet, there is no correlation between mean sentiment and distance from the eruption (Fig. 4). Filtering that same analysis to regions with at least 100 geo-located tweets, producing more reliable averages, reveals a weak negative correlation between mean sentiment and distance from the eruption (Fig. 4). Perhaps non-intuitively, tweets originating from the state of Hawai`i are amongst the most positive, especially for regions with more than 30 geo-located tweets, driven largely by messages of hope and support (Fig. 4c). Hawaiian tweets with negative sentiment detail localised detrimental impacts of the eruption that would have likely driven socioeconomic pressures, such as the loss of homes, damage to property, and closure of the national park (Fig. 4d). Through grouping of tweets originating outside the state of Hawai`i, those with a negative sentiment reveal a trend towards more dramatised and/or sensationalised accounts of the eruption (perhaps a result of international media reporting; Calabrò et al., 2020), while the positive sentiment tweets praise the apparent “beauty” of the eruption, alongside a smaller proportion of messages of hope and support (Fig. 4).
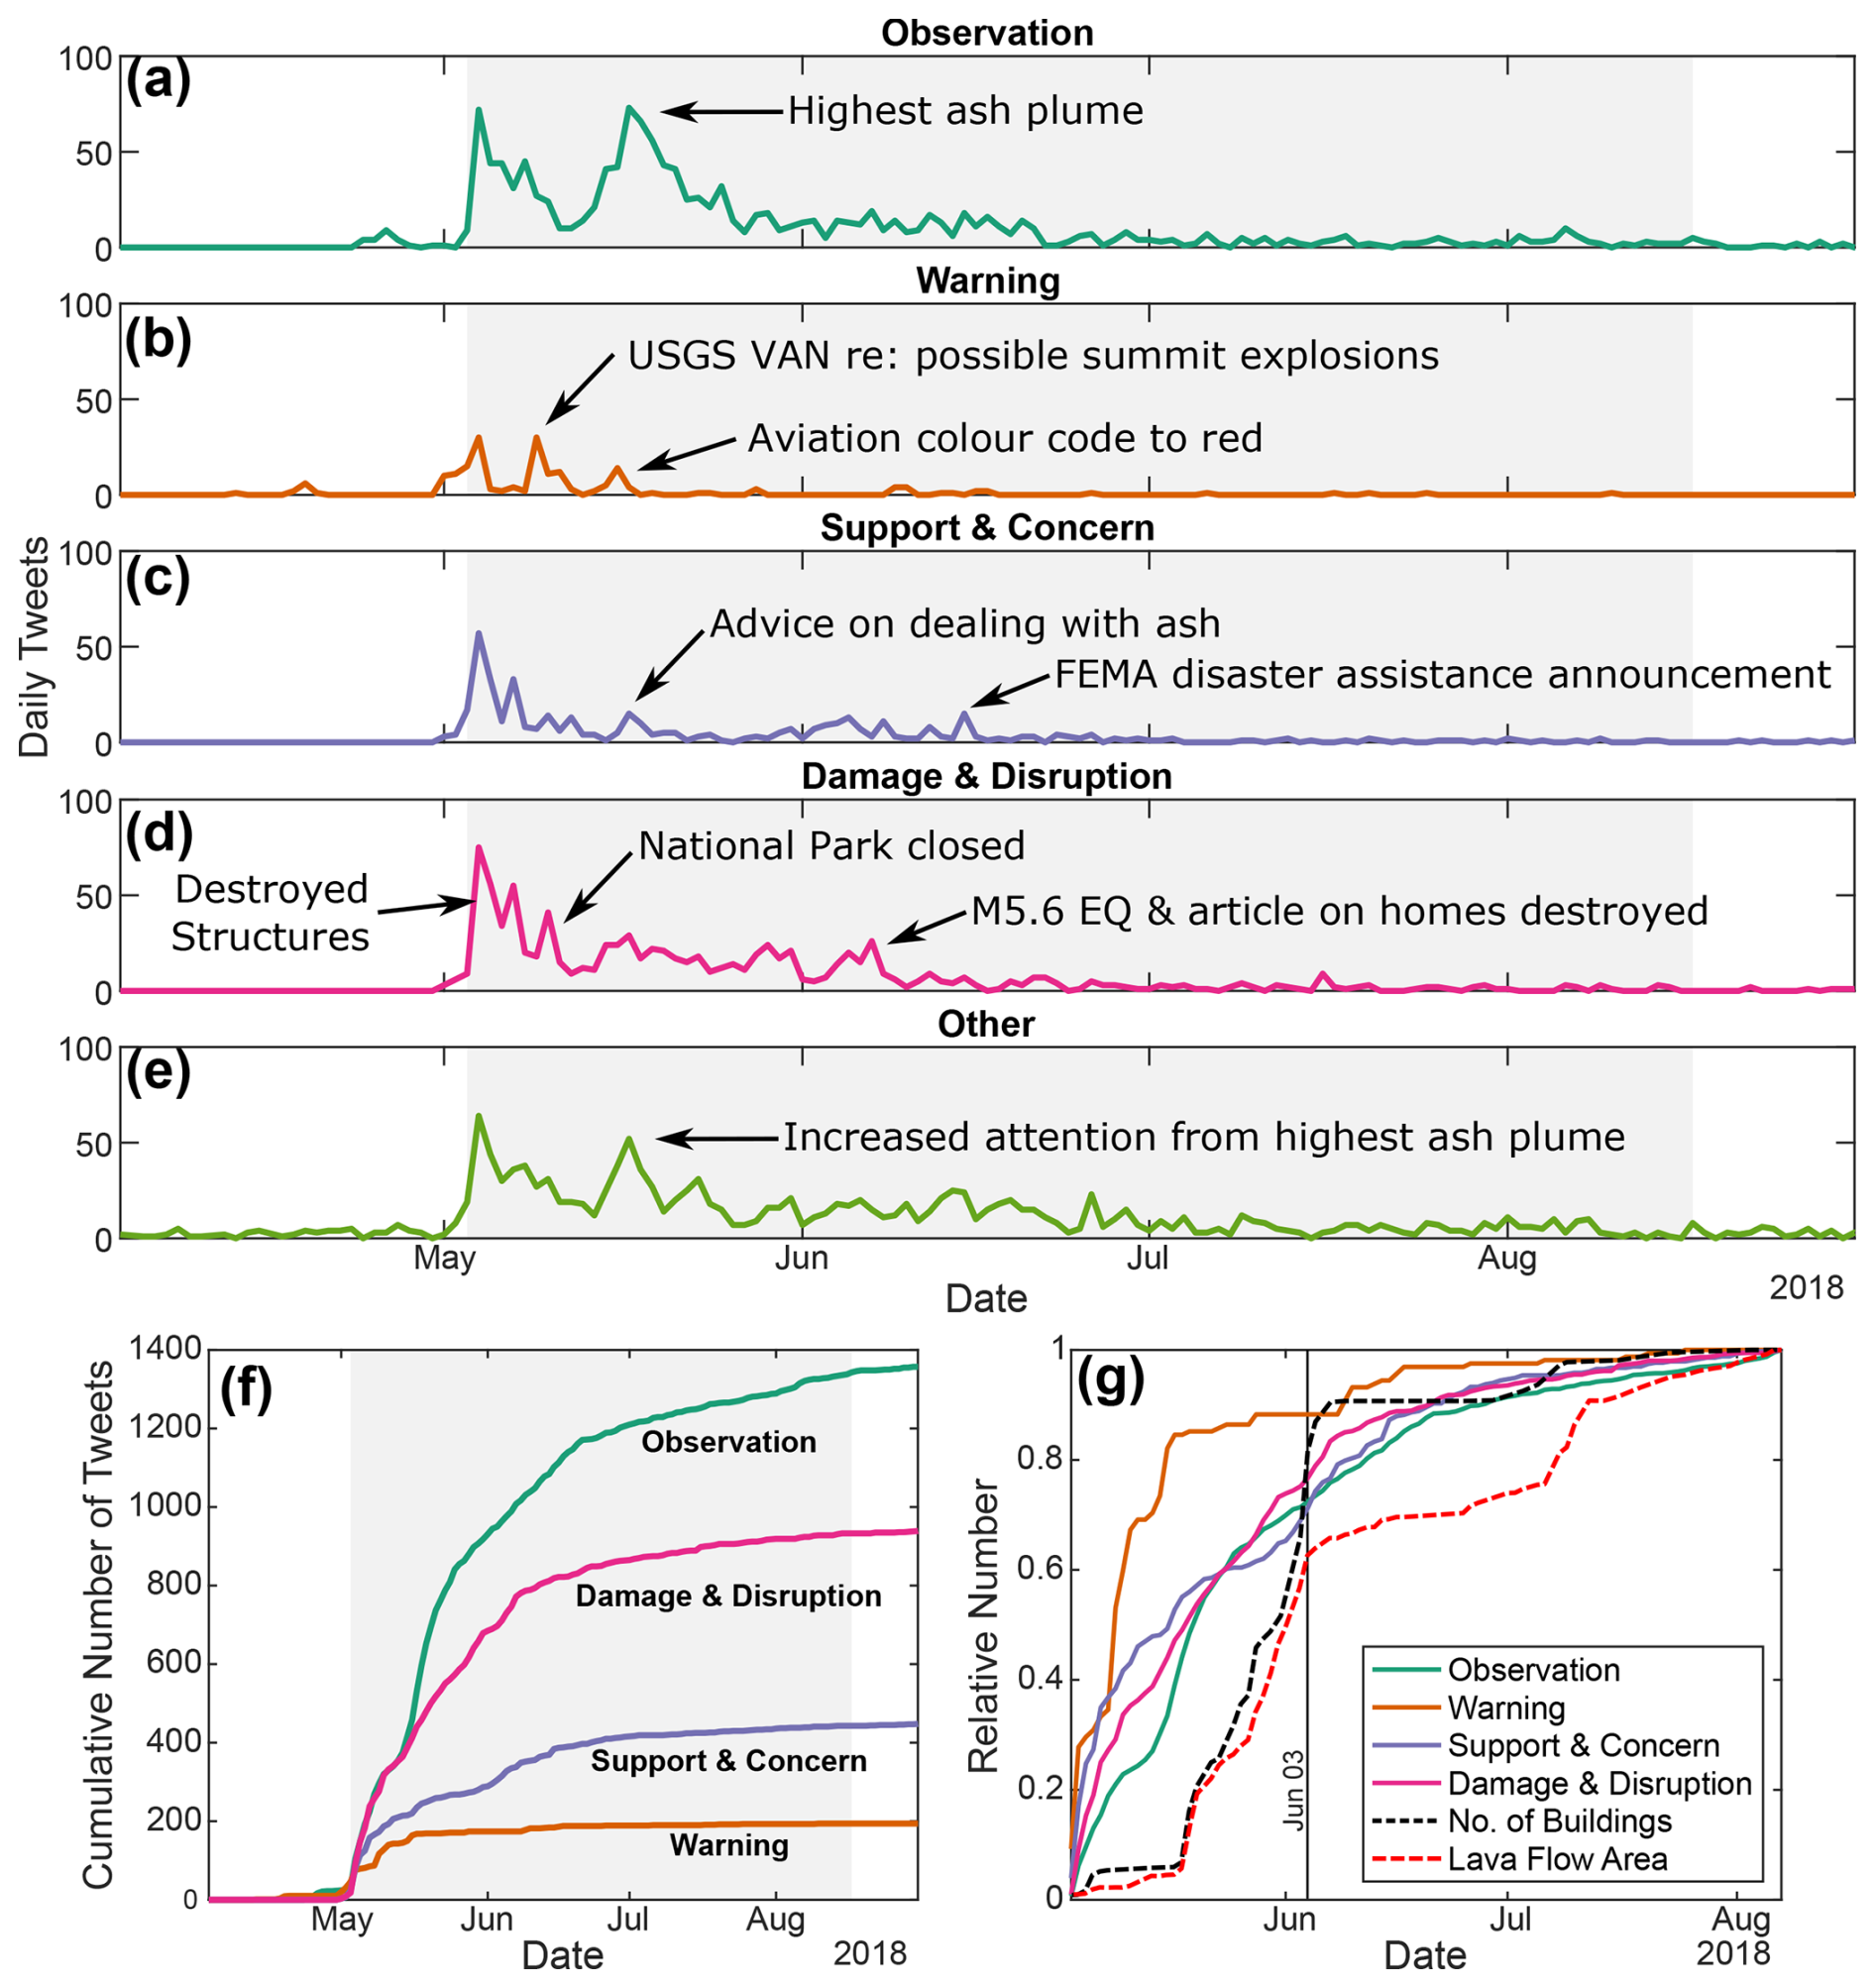
Figure 5Temporal content analysis for Hawaiian tweets. (a–e) Time series of daily tweet counts across five categories: observation, warning, support and concern, damage and disruption, and other. The earliest syn-eruption peaks correlate with the start of the eruption. (f) Cumulative counts of tweet categories, using the same data as (a–d). (g) Relative cumulative counts of tweet categories (observation, warning, support and concern, damage and disruption) compared to the relative number of buildings in contact with the lava and the area of lava flow inundation. All datasets are normalised to the same time period (3 May–7 August), and the thin black line indicates 3 June. Lava flow and building data are from Meredith et al. (2022). In panels (a–f), the grey background highlights the period when the ground-based alert level was at “warning”.
3.3 Content analysis
Manual classification of relevant, filtered Hawaiian tweets into one of five categories shows contrasting temporal patterns (Fig. 5). Warning-related tweets first increase prior to the eruption and coincident with the USGS VAN released on 1 May. Later peaks in warning-related tweets correlate with a subsequent USGS VAN warning about the potential for summit explosions (9 May) and a change in the aviation colour code to red (15 May) (Fig. 5b). These results indicate that a section of the public was not only noticing the official warnings but also taking the time and effort to spread the notifications within their social networks. Evidence of community response action in the sharing of warnings (Fig. 5b) is concurrent with the timing of hazard warning communications (Fig. 1b).
Observation-based tweets expectedly show a peak at the beginning of the eruption, reflecting the initial intrigue of witnessing the event and sharing updates about areas impacted. A later, similar-sized peak in observation-based tweets records updates about the highest ash plume generated during the eruption, highlighting elevated levels of interest in this significant event (Neal et al., 2019). Tweets categorised as relating to messages of support and concern also peak at the beginning of the eruption, as well as during the explosion producing the highest ash plume, with specific messages around sharing official risk reduction mitigation actions and advice on dealing with the ash. A later peak of tweets expressing support in mid-June correlates to the FEMA (Federal Emergency Management Agency) approval of emergency disaster assistance, corresponding with the prospect of aid. Damage and disruption tweets highlight socioeconomic pressures (Fig. 5d) and show peaks in the early stages of the eruption related to the prolonged destruction of structures by the lava flows, as well as a single peak that can be correlated with the closure of Hawai`i Volcanoes National Park. A minor peak in damage and disruption tweets occurs later, coincident with a M5.6 summit earthquake and news articles reporting on the destruction of homes in the LERZ (e.g. The Guardian, 2018). The remaining tweets were categorised as “other” and have a temporal trend that broadly mirrors observation-based tweets, which can be explained by a likely parallel pattern in eruption interest caused by the initiation and evolution of eruptive activity.
Contrasting temporal trends in the categorised tweets are also evident when examining their cumulative totals through time (Fig. 5f). Warning-based tweets roughly plateau in mid-May, while observation tweets increase throughout the eruption period, albeit with a lower rate after mid-June. Comparing the cumulative pattern of damage and disruption tweets with an independent field-based damage assessment (Meredith et al., 2022) shows a correlation with the number of buildings in contact with the lava (Pearson's linear correlation coefficient, r = 0.97); both begin to level off in early June (Fig. 5g). Support and concern tweets also level off in early June to mid-June, which is possibly all reflecting a change from channel-based lava emplacement to predominantly breakouts and overflows, which occurred after the second lava ocean entry on 3 June and drastically reduced the rate at which the lava flow was impacting built structures (Neal et al., 2019; Meredith et al., 2022). Observation tweets closely follow the temporal pattern of the lava flow area (Fig. 5g, and r = 0.96), plateauing in early August as the eruption ended. Favourable correlations between our social sensing data and independent field-based data confirm coincident temporal syn-eruption changes between the volcanic activity and social actions and provide an initial level of qualitative verification for our analyses.
Table 2Shared URL counts from relevant tweets, grouped by geographic region and inclusion/exclusion of duplicate tweets. These URLs were shared and last accessed in 2018 by people during the eruption. Links https://a.msn.com and https://volcanic-eruption.com no longer work.
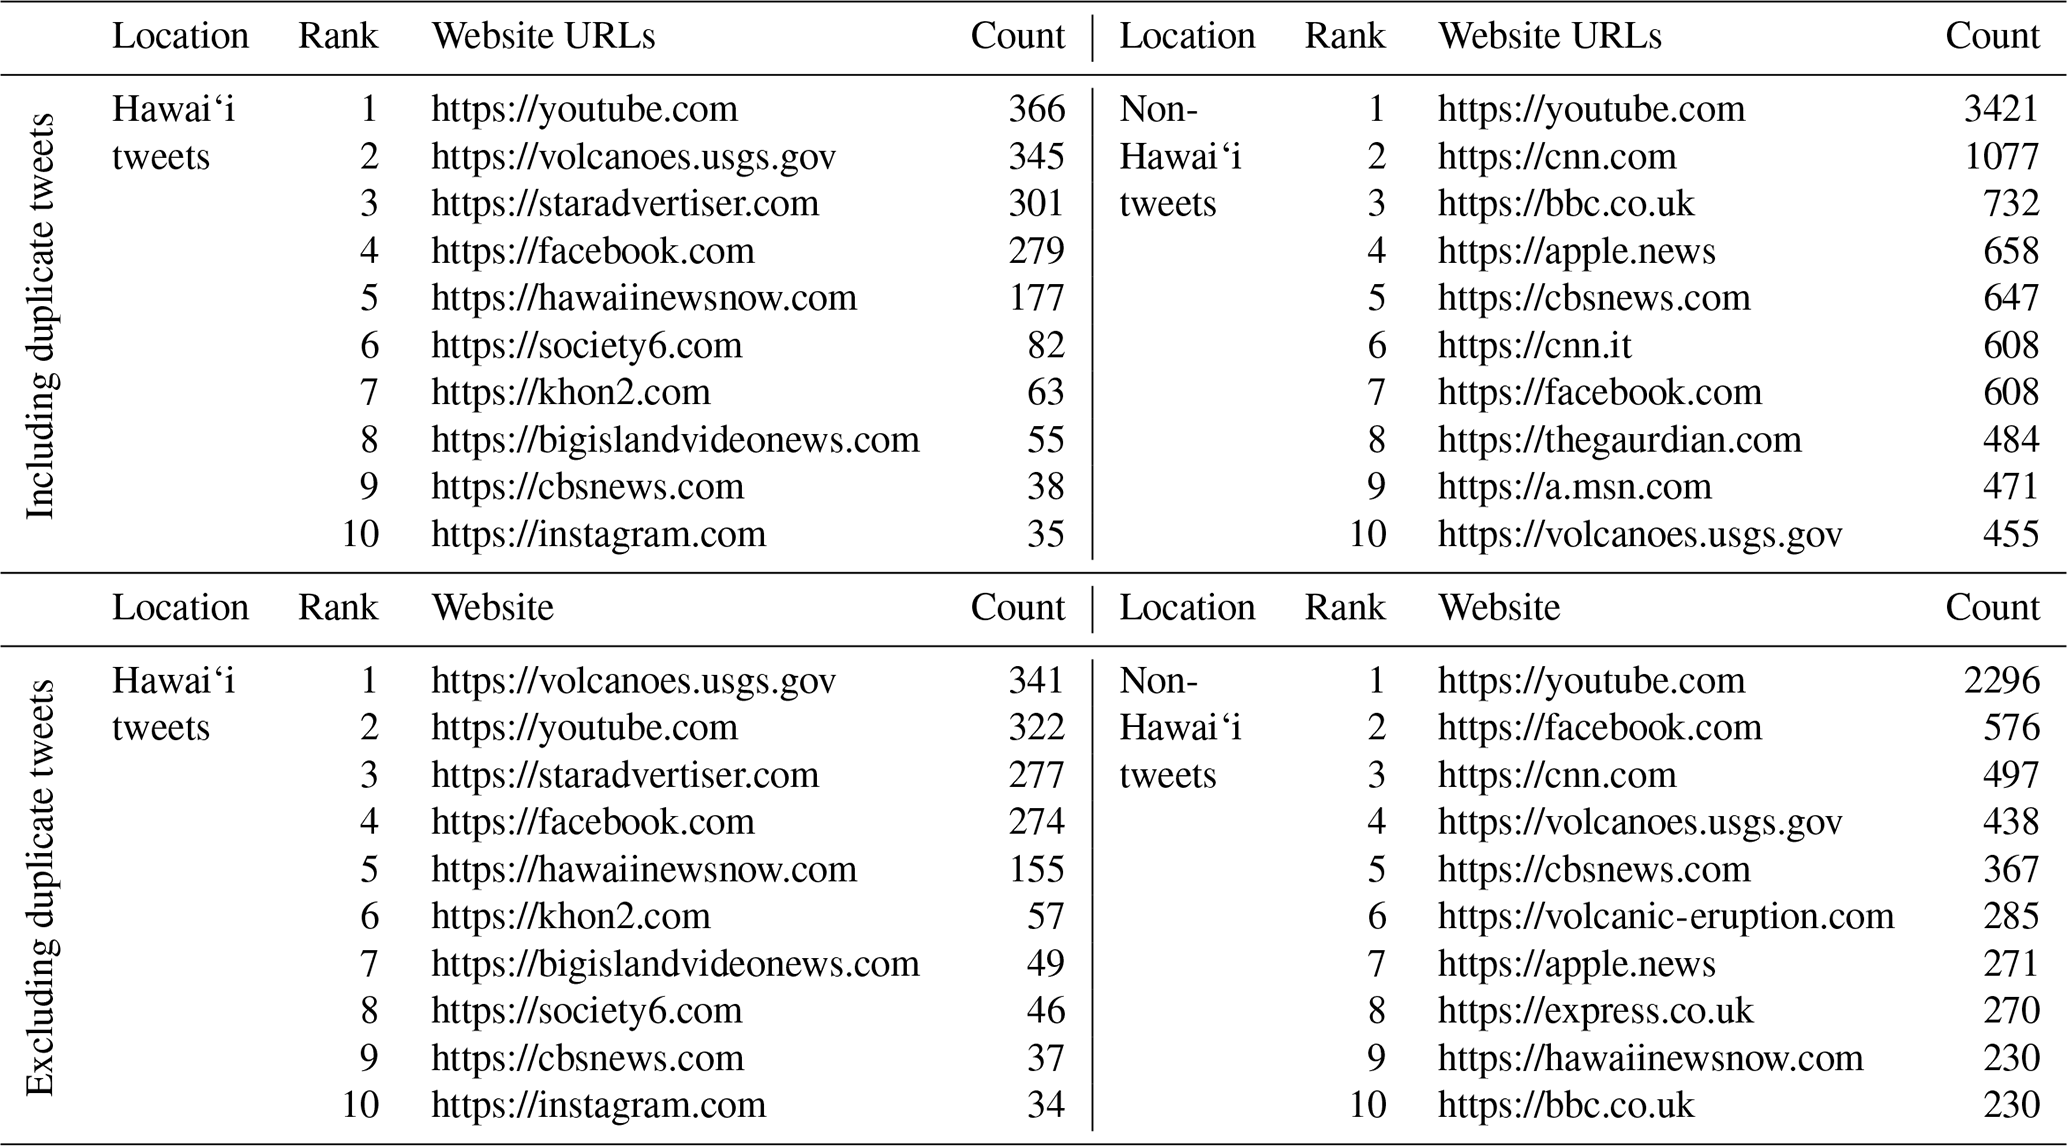
Our content analysis of the relevant Hawaiian tweets also highlighted the fact that a high proportion of these were related to professional news: tweets either from professional journalists or containing links to news articles. The proportion of news-related tweets reached ∼ 50 % in the early stages of the eruption before fluctuating back to ∼ 20 %–30 % by the end of the eruption (Fig. A2). In addition to the sharing of news articles, the tweets also contained URLs (web addresses) for other online media (Table 2). For those Hawaiian tweets, YouTube was the top-shared web domain, followed by the USGS Volcanoes webpage, and then mostly local news outlets. A complementary examination of relevant non-Hawaiian tweets also showed a high degree of URL sharing, with YouTube similarly the top-shared web domain but then followed by primarily international news outlets. Together, these findings suggest that news agencies/journalists can strongly influence information shared on social media during an eruptive crisis.
Social sensing of tweets during the 2018 LERZ Kīlauea eruption has demonstrated temporal variation in social reaction (sentiment analysis) and action (content analysis) during the crisis, with syn-eruption changes in each that reflect patterns in volcanic activity, civil protection actions, and socioeconomic pressures. We present and discuss our data in a purely observation-driven context without reference to particular social science theories. Exploring how our results could support, challenge, or develop current social science theories may be a fruitful avenue for future research.
A decrease in mean tweet sentiment is observed during the eruption, and especially in response to particular high-impact events, at global and Hawai`i-specific spatial scales. It has been suggested that big data from social media, including sentiment analyses, can be used to monitor mental health in response to crises (Valdez et al., 2020; Aebi et al., 2021), which could imply that the decreases in tweet sentiment seen here are recording adverse effects caused by the eruption on the wellbeing of individuals. However, given the anonymised big-data approach of the analysis, there is no guarantee that the individuals most affected, for example, those who lost property or livelihoods, contributed to the data collection, and there is no automated way to distinguish between tweets from residents or tourists in data originating geographically in Hawai`i. Given the strong media influence, and prevalent sharing of URLs, it is also possible that some of the negative shift in the recorded sentiment was driven by news headlines with sensationalised reporting (e.g. Fig. 4f) (Goldman et al., 2023). Regardless, within the uncertainty in the Hawaiian tweets with a negative sentiment, there is still a clear message highlighting localised eruption impacts and a harmful effect on societal mood. Simultaneously, there was widespread sharing of messages of support and concern, which included the word “Pele” as a highly used term (e.g. Fig. 4c). Pele refers to the Hawaiian volcano deity and highlights a link to local cultural beliefs and values in a region with an indigenous population. Although it was beyond our current scope, exploration of cultural themes and other qualitative analyses of the tweet content could provide further useful information for local authorities to help guide their hazard and risk communication (e.g. Graham et al., 2024).
Official communication of hazard and risk information is a key part of hazard management, and for our study of the 2018 LERZ Kīlauea eruption it included warnings of possible hazards, advice for responding to hazards (particularly ash), and emergency response assistance announcements. In our analyses, we show evidence for responses within the community to such information, including sharing warnings in the lead-up to, as well as early stages of, the eruption (e.g. Fig. 5b), and sharing mitigation actions later during the eruption (e.g. Fig. 5c). The sharing of hazard and risk information across individuals' social networks is a positive outcome for volcano monitoring and emergency management organisations, demonstrating that their communications are effective with regards to being seen, acknowledged, and passed on. Trust is a key issue in risk perception and hazard communication, and receiving crisis management advice shared by a friend, family member, or social network connection may lend more credibility to the information and increase its chances of uptake (Barclay et al., 2015; Christie et al., 2015; Goldman et al., 2023). It has already been shown, for example, that social-media-based “community messengers” were sharing very highly trusted information during the 2018 LERZ eruption (Goldman et al., 2023). Our analyses lend further weight to this finding by showing that Twitter posts were used to share warnings, advice, and observations of the eruption on social networks (Fig. 5), which suggests that leveraging established social networks is likely a very productive route in future volcanic hazard and risk communication (Williams and Krippner, 2019), at Kīlauea and volcanoes worldwide.
Observation-based tweets, and tweets detailing damage and destruction, were greater in number than tweets about warnings or support and concern (Fig. 5). The former two categories link to suggestions of using crowd-sourced observations of volcanic eruptions for scientific use (Wadsworth et al., 2022), but crowd-sourcing is resource-intensive and often requires participants to opt in, which could reduce uptake. However, the addition of a social-sensing-based approach would not require any participant to opt in and could be automated with programmed social media data scraping algorithms, potentially drastically increasing the volume of acquired data.
Automating the collection and selected analysis of social sensing data (from various social media platforms) in real time (e.g. Middleton et al., 2014; Zhou et al., 2021) could provide crucial insight during times of crisis for volcano monitoring, disaster management, and civil protection decision-makers. While we collected and analysed historical Twitter data, similar data scraping approaches could be established to download tweets meeting a particular search requirement (e.g. keyword(s)) in real time and subsequently rapidly processed in real time using pre-established analysis algorithms (like those developed and presented here). At volcanoes worldwide where social media usage is prevalent, real-time social sensing would improve situational awareness. For example, content analysis of tweet text could gauge community response to hazards, warnings, and mitigation actions; image and video analysis could enhance eruption observations; and content and network analysis could help track the spread of misinformation (Williams and Krippner, 2019; Goldman et al., 2024; Kim and Hastak, 2018). A real-time approach could be facilitated by the potential collection of high-relevancy data from online volcanic conversation (e.g. Fig. 2), but focussing on Twitter (or X) would likely require academic and/or governmental access to their API to be made more accessible and economically viable (https://www.theverge.com/2023/5/31/23739084/twitter-elon-musk-api-policy-chilling-academic-research, last access: 18 August 2023). There are also opportunities to examine sentiment and content in finer detail if improved geolocation information are available, as well as to compare the insights provided by different languages and social media networks/messaging applications, which may have more accessible data than Twitter/X under the current restrictions. Compared to traditional qualitative interview approaches, social sensing is likely to be able to “survey” a much larger number of people but to a lower degree of certainty and detail. However, the main strength of social sensing over interviews in long-lasting hazards like volcanic eruptions could be its ability to track time-dependent changes on daily (or even shorter) timescales (e.g. Figs. 2, 3, and 5).
In any future use of volcano social sensing, access to social media will play a role, with volcanic eruptions in regions with poor access likely to produce a smaller social sensing “signal” than similar eruptions and impacts in areas with good access. Consideration will also need to be given to the different social media networks in use and the typical demographics of people using each one. For our study based on Twitter data, we likely only capture a subset of the US population: studies suggest that 24 % of all US adults used Twitter in 2018, with notable variation in usage rates based on the highest education level attained by a user (e.g. high school vs. college) and different age ranges (Smith and Anderson, 2018). Therefore, our results may be limited to the typical user base of Twitter in 2018, and insights may vary for other social media platforms that may capture a different demographic profile (e.g. Ruan et al., 2022; Young et al., 2022). Comparing social sensing results for the same volcanic eruption across different social media networks could provide further insights into how hazard and risk information is received, as well as the actions and reactions that it provokes. When using social sensing to assess eruption impacts, it will also be important to ensure that external coverage of and conversation about eruptions do not bias our understanding of events, given their larger data volume compared to local data input and the demonstrated influence of international media outlets. In this regard, using social sensing in parallel with traditional structured interviews of affected individuals, where accurate demographic information can also be collected, will allow further verification and quality control of the social sensing approach (e.g. Creswell, 2009) and allow researchers and practitioners to benefit from the respective advantages of both methodologies.
Social sensing of Twitter posts can track changes in social action and reaction throughout the 2018 eruption of Kīlauea, Hawai`i, through analyses of tweet frequency, sentiment, geolocation, and content. The volume of relevant tweets rapidly increased in early May, corresponding to the beginning of the eruption; tweet frequency then generally declined to background levels over the course of the eruption, with the exceptions of notable peaks in daily tweet frequency in response to high-impact events. Automated sentiment analysis shows a shift towards more negative scores from the eruption onset, which indicates more negative emotions being expressed in the posts during the eruption. Time-dependent changes in topics in Hawai`i-specific Twitter conversations reflect patterns in volcanic activity, civil protection actions, and socioeconomic pressures. We find evidence of social action around sharing official warnings in the eruption's lead up and early stages and sharing official mitigation actions later during the eruption. Such evidence is a positive outcome for volcano monitoring and emergency management organisations that are responsible for the official messaging. Tweets detailing damage and disruption follow a similar temporal trend to the rate of lava flow field expansion and building damage. Our work generally shows how hazard and risk information (including warnings of possible hazards, advice for responding to hazards (particularly ash), and emergency response assistance announcements) is discussed and reacted to on Twitter, which informs our understanding of community response actions and the efficacy of warnings and other official risk reduction communications. Social sensing shows promise for further development and application in volcanology if wider social media platforms can be leveraged for data; we show the potential for real-time social sensing analyses to aid the situational awareness of risk-reduction professionals during volcanic crises. Finally, analysing social media posts following hazardous events can help emergency response managers improve communication and warning efforts for future crises.
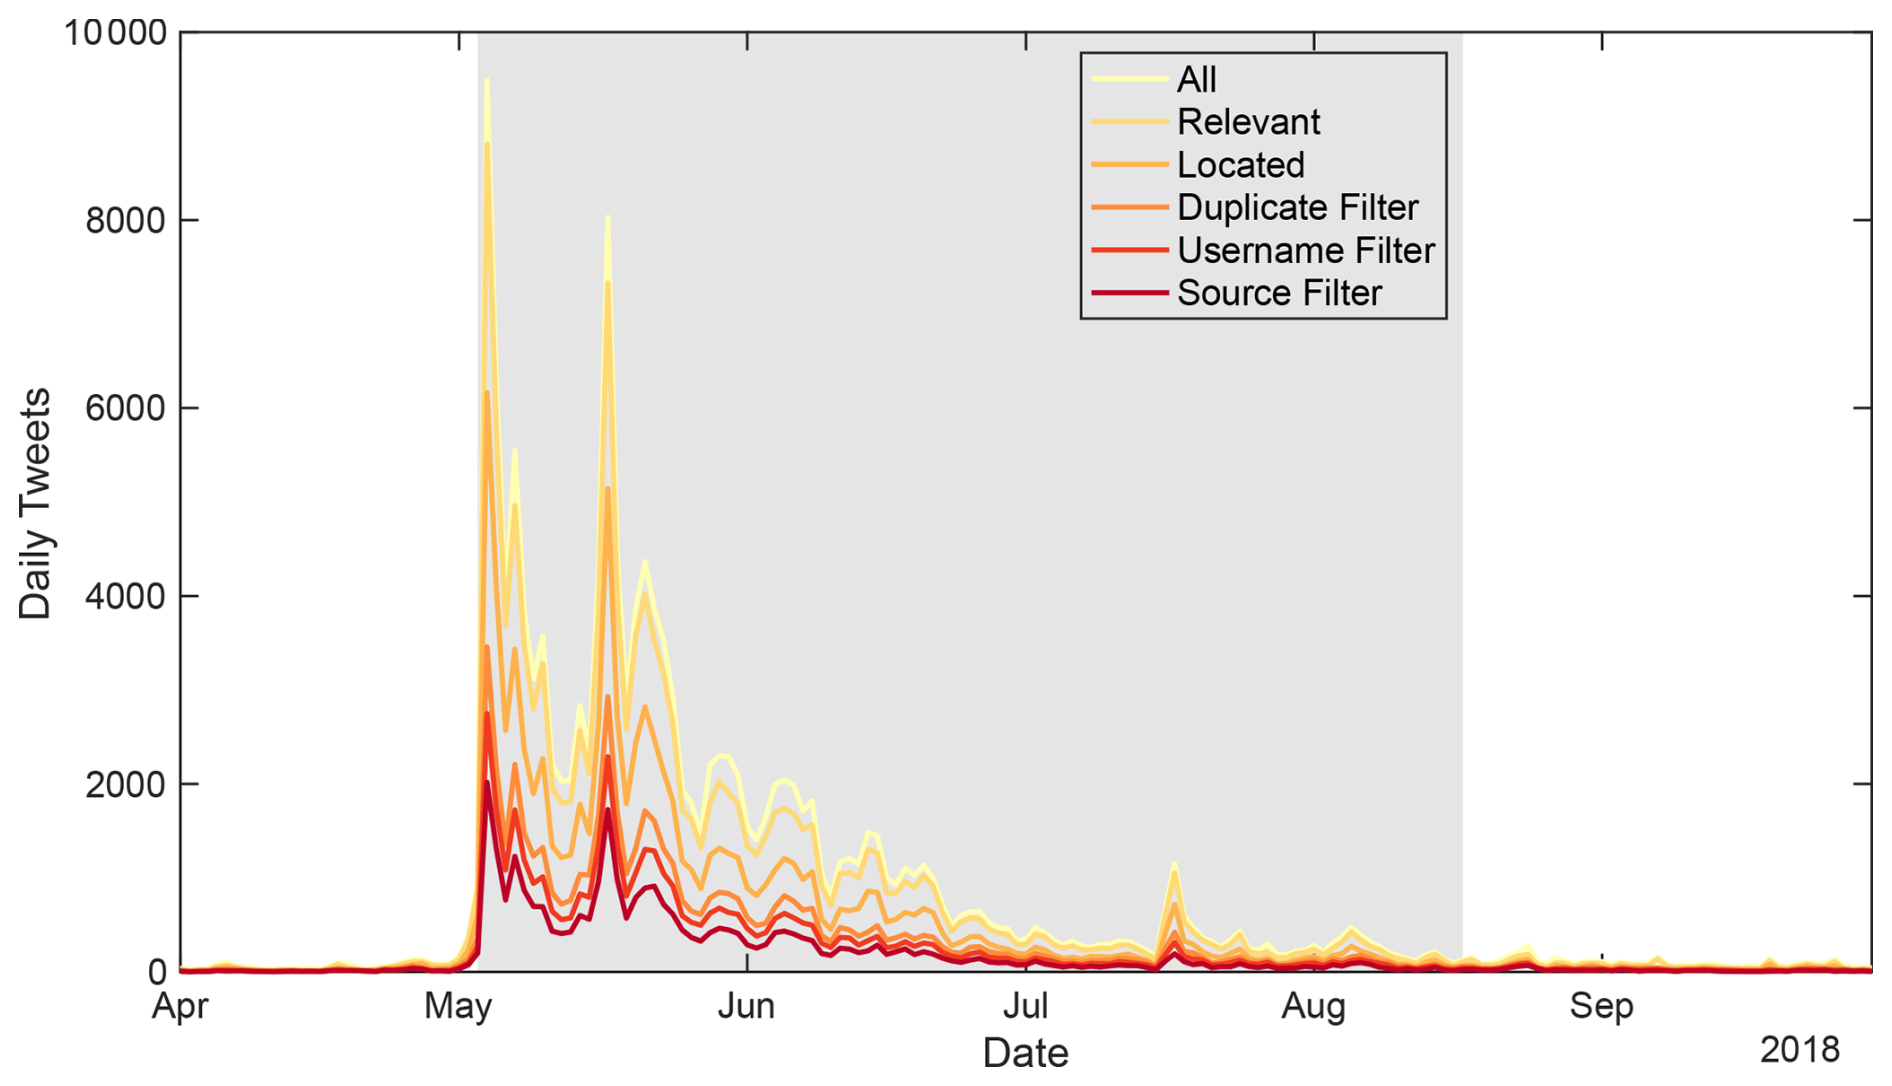
Figure A1Change in tweet data count at different stages of filtering. The grey background indicates the period when the ground-based alert level was at “warning”.
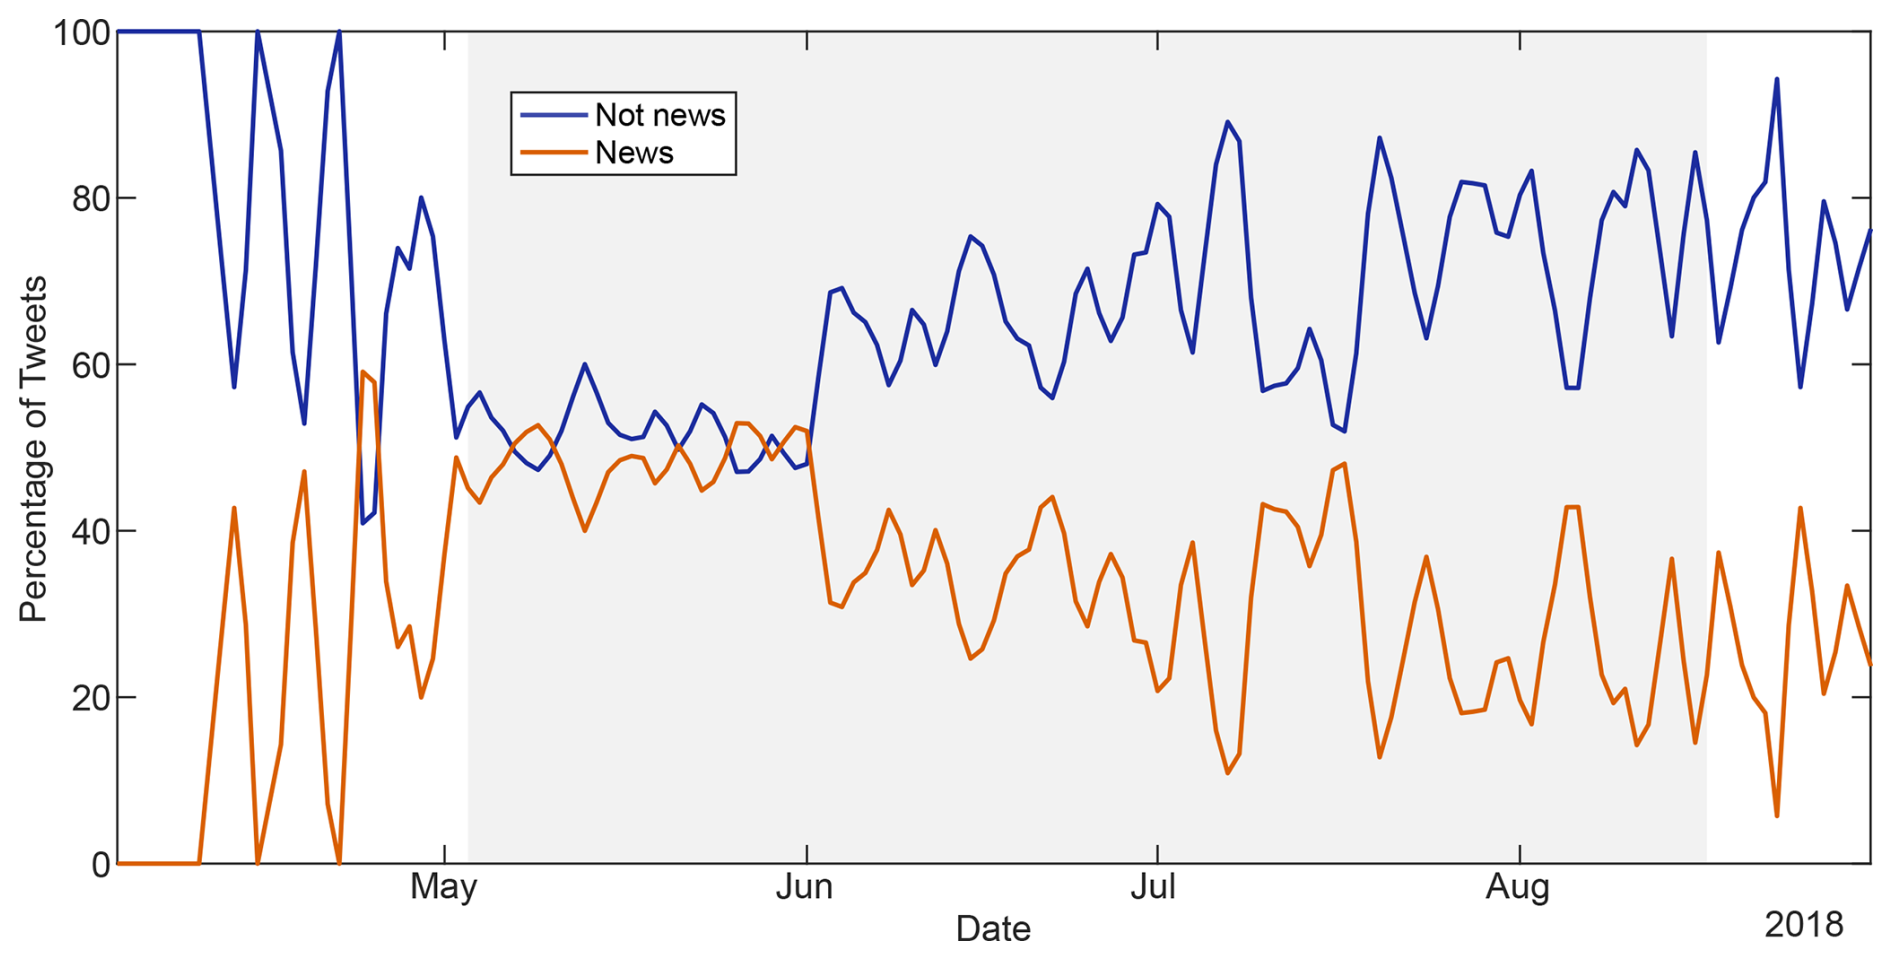
Figure A2Daily proportion of tweets classified as related to professional news outlets (orange), or not (blue). The grey background indicates the period when the ground-based alert level was at “warning”.
The Python code for analysing the Twitter data is stored on a GitHub repository; access is private and can be obtained by contacting the authors Rudy Arthur or Hywel Williams.
The tweet text data that support the findings of this study are available on Zenodo (https://doi.org/10.5281/zenodo.10473984; Hickey, 2024).
JH conceived the study and acquired the data. JY, MS, and RP analysed the data and contributed to its interpretation alongside JH, HW, RA, WS, and MH. JH wrote the initial draft of the paper with input and revision from all other authors.
The contact author has declared that none of the authors has any competing interests.
Publisher's note: Copernicus Publications remains neutral with regard to jurisdictional claims made in the text, published maps, institutional affiliations, or any other geographical representation in this paper. While Copernicus Publications makes every effort to include appropriate place names, the final responsibility lies with the authors. Any use of trade, firm, or product names is for descriptive purposes only and does not imply endorsement by the US Government. For the purpose of open access, the author has applied a “Creative Commons Attribution (CC BY)” licence to any author-accepted manuscript version arising.
James Hickey is supported by a UKRI NERC grant (NE/X013944/1) and acknowledges funding from the University of Exeter Institute for Data Science and Artificial Intelligence, which supported Ravi Pandit. Michelle Spruce and James Young were funded by UKRI EPSRC PhD studentships during this study. We thank Elinor Meredith for sharing the damaged building and lava flow area data (Meredith et al., 2022). We thank the anonymous reviewer, Robert Goldman, and Brianna Corsa for their detailed reviews.
This research has been supported by the UKRI NERC (grant no. NE/X013944/1).
This paper was edited by Giovanni Macedonio and reviewed by Robert Goldman, Brianna Corsa, and one anonymous referee.
Aebi, N. J., De Ridder, D., Ochoa, C., Petrovic, D., Fadda, M., Elayan, S., Sykora, M., Puhan, M., Naslund, J. A., Mooney, S. J., and Gruebner, O.: Can Big Data Be Used to Monitor the Mental Health Consequences of COVID-19?, Int. J. Public Health, 66, 633451, https://doi.org/10.3389/ijph.2021.633451, 2021.
Altman, D.: Practical statistics for medical research, Chapman & Hall/CRC Press, New York, https://doi.org/10.1201/9780429258589, 1999.
Anderson, K. R., Johanson, I. A., Patrick, M. R., Gu, M., Segall, P., Poland, M. P., Montgomery-Brown, E. K., and Miklius, A.: Magma reservoir failure and the onset of caldera collapse at Kīlauea Volcano in 2018, Science, 80, 366, https://doi.org/10.1126/science.aaz1822, 2019.
Armijos, M. T., Phillips, J., Wilkinson, E., Barclay, J., Hicks, A., Palacios, P., Mothes, P., and Stone, J.: Adapting to changes in volcanic behaviour: Formal and informal interactions for enhanced risk management at Tungurahua Volcano, Ecuador, Global Environ. Chang., 45, 217–226, https://doi.org/10.1016/j.gloenvcha.2017.06.002, 2017.
Arthur, R., Boulton, C. A., Shotton, H., and Williams, H. T. P.: Social sensing of floods in the UK, PLOS One, 13, e0189327, https://doi.org/10.1371/journal.pone.0189327, 2018.
Barclay, J., Haynes, K., Houghton, B., and Johnston, D.: Social Processes and Volcanic Risk Reduction, in: The Encyclopedia of Volcanoes, Second Edition, edited by: Sigurdsson, H., Academic Press, https://doi.org/10.1016/b978-0-12-385938-9.00069-9, 1203–1214 pp., 2015.
Barclay, J., Few, R., Armijos, M. T., Phillips, J. C., Pyle, D. M., Hicks, A., Brown, S. K., and Robertson, R. E. A.: Livelihoods, Wellbeing and the Risk to Life During Volcanic Eruptions, Front. Earth Sci., 7, 1–15, https://doi.org/10.3389/feart.2019.00205, 2019.
Bonaccorso, A., Calvari, S., and Boschi, E.: Hazard mitigation and crisis management during major flank eruptions at Etna volcano: Reporting on real experience, Geol. Soc. Spec. Publ., 426, 447–461, https://doi.org/10.1144/SP426.4, 2016.
Brown, S. K., Loughlin, S. C., Sparks, R. S. J., Vye-Brown, C., Barclay, J., Calder, E., Cottrell, E., Jolly, G., Komorowski, J.-C., Mandeville, C., Newhall, C. G., Palma, J. L., Potter, S., and Valentine, G.: Global volcanic hazard and risk, in: Global Volcanic Hazards and Risk, edited by: Loughlin, S. C., Sparks, S., Brown, S. K., Jenkins, S. F., and Vye-Brown, C., Cambridge University Press, https://doi.org/10.1017/CBO9781316276273.004, 81–172, 2015.
Calabrò, L., Harris, A. J. L., and Thouret, J. C.: Media views of the Stromboli 2002-2003 eruption and evacuation: A content analysis to understand framing of risk communication during a volcanic crisis, J. Appl. Volcanol., 9, 1–23, https://doi.org/10.1186/s13617-020-00094-0, 2020.
Christie, R., Cooke, O., and Gottsmann, J.: Fearing the knock on the door: Critical security studies insights into limited cooperation with disaster management regimes, J. Appl. Volcanol., 4, 19, https://doi.org/10.1186/s13617-015-0037-7, 2015.
County of Hawai`i: Kilauea Recovery and Resilience Plan, 2020.
Creswell, J. W.: Research design: Qualitative, quantitative, and mixed methods approaches, Third., SAGE Publications, ISBN-10 141296556X, 2009.
de Bruijn, J. A., de Moel, H., Jongman, B., de Ruiter, M. C., Wagemaker, J., and Aerts, J. C. J. H.: A global database of historic and real-time flood events based on social media, Sci. Data, 6, 1–12, https://doi.org/10.1038/s41597-019-0326-9, 2019.
Dodds, P. S., Clark, E. M., Desu, S., Frank, M. R., Reagan, A. J., Williams, J. R., Mitchell, L., Harris, K. D., Kloumann, I. M., Bagrow, J. P., Megerdoomian, K., McMahon, M. T., Tivnan, B. F., and Danforth, C. M.: Human language reveals a universal positivity bias, P. Natl. Acad. Sci. USA, 112, 2389–2394, https://doi.org/10.1073/pnas.1411678112, 2015.
Gansecki, C., Lopaka Lee, R., Shea, T., Lundblad, S. P., Hon, K., and Parcheta, C.: The tangled tale of Kīlauea's 2018 eruption as told by geochemical monitoring, Science, 80, 366, https://doi.org/10.1126/science.aaz0147, 2019.
Giuffrida, L., Lokys, H., and Klemm, O.: Assessing the effect of weather on human outdoor perception using Twitter, Int. J. Biometeorol., 64, 205–216, https://doi.org/10.1007/s00484-018-1574-7, 2020.
Goldman, R., Stovall, W., Damby, D., and McBride, S.: Hawai`i residents' perceptions of Kīlauea's 2018 eruption information, Volcanica, 6, 19–43, https://doi.org/10.30909/vol.06.01.1943, 2023.
Goldman, R. T., McBride, S. K., Stovall, W. K., and Damby, D. E.: USGS and social media user dialogue and sentiment during the 2018 eruption of Kīlauea Volcano, Hawai`i, Front. Commun., 9, 986974, https://doi.org/10.3389/fcomm.2024.986974, 2024.
Graham, O., Thomas, T., Hicks, A., Edwards, S., Juman, A., Ramroop, A., and Robertson, R.: Facts, faith and Facebook: science communication during the 2020–21 La Soufrière, St Vincent volcanic eruption, Geol. Soc. Spec. Publ., 539, 331–344, https://doi.org/10.1144/SP539-2022-289, 2024.
Guan, X. and Chen, C.: Using social media data to understand and assess disasters, Nat. Hazards, 74, 837–850, https://doi.org/10.1007/s11069-014-1217-1, 2014.
Hickey, J.: Tweet data for “Social sensing a volcanic eruption: application to Kīlauea 2018” (Version v1), Zenodo [data set], https://doi.org/10.5281/zenodo.10473984, 2024.
Hicks, A. and Few, R.: Trajectories of social vulnerability during the Soufrière Hills volcanic crisis, J. Appl. Volcanol., 4, 10, https://doi.org/10.1186/s13617-015-0029-7, 2015.
Houghton, B. F., Cockshell, W. A., Gregg, C. E., Walker, B. H., Kim, K., Tisdale, C. M., and Yamashita, E.: Land, lava, and disaster create a social dilemma after the 2018 eruption of Kīlauea volcano, Nat. Commun., 12, 10–13, https://doi.org/10.1038/s41467-021-21455-2, 2021.
Hutto, C. J. and Gilbert, E.: VADER: A Parsimonious Rule-Based Model for Sentiment Analysis of Social Media Text, Eighth Int. AAAI Conf. Weblogs Soc. Media, University of Michigan, 1–4 June 2014, 216–225, 2014.
Jolly, G. and de la Cruz, S.: Volcanic Crisis Management, in: The encyclopedia of Volcanoes, Second Edi., edited by: Sigurdsson, H., Elsevier Inc., https://doi.org/10.1016/b978-0-12-385938-9.00068-7, 1187–1202 pp., 2015.
Kim, J. and Hastak, M.: Social network analysis: Characteristics of online social networks after a disaster, Int. J. Inform. Manage., 38, 86–96, https://doi.org/10.1016/j.ijinfomgt.2017.08.003, 2018.
Kim, K., Pant, P., Yamashita, E., and Ghimire, J.: Analysis of Transportation Disruptions from Recent Flooding and Volcanic Disasters in Hawai'i, Transport Res. Rec., 2673, 194–208, https://doi.org/10.1177/0361198118825460, 2019.
Kirilenko, A. P., Molodtsova, T., and Stepchenkova, S. O.: People as sensors: Mass media and local temperature influence climate change discussion on Twitter, Global Environ. Chang., 30, 92–100, https://doi.org/10.1016/j.gloenvcha.2014.11.003, 2015.
Kryvasheyeu, Y., Chen, H., Obradovich, N., Moro, E., Van Hentenryck, P., Fowler, J., and Cebrian, M.: Rapid assessment of disaster damage using social media activity, Sci. Adv., 2, 1–12, https://doi.org/10.1126/sciadv.1500779, 2016.
Landis, J. R. and Koch, G. G.: The Measurement of Observer Agreement for Categorical Data, Biometrics, 33, 159, https://doi.org/10.2307/2529310, 1977.
Laylavi, F., Rajabifard, A., and Kalantari, M.: A multi-element approach to location inference of Twitter: A case for emergency response, ISPRS Int. J. Geo-Inf., 5, 1–16, https://doi.org/10.3390/ijgi5050056, 2016.
Liu, Y., Liu, X., Gao, S., Gong, L., Kang, C., Zhi, Y., Chi, G., and Shi, L.: Social Sensing: A New Approach to Understanding Our Socioeconomic Environments, Ann. Assoc. Am. Geogr., 105, 512–530, https://doi.org/10.1080/00045608.2015.1018773, 2015.
Loughlin, S. C., Vye-Brown, C., Sparks, R. S. J., and Brown, S. K.: Global volcanic hazards and risk: Summary background paper for the Global Assessment Report on disaster risk reduction 2015, IAVCEI, IAVCEI, 2015.
Mani, L., Edwards, S., Joseph, E., Juman, A., and Thomas, T.: Evaluating the UWI-SRC crisis communications campaign during the 2020-2021 eruption of La Soufrière, St Vincent, Geol. Soc. London, Spec. Publ., 539, 345–363, https://doi.org/10.1144/sp539-2022-297, 2024.
McCormick, T. H., Lee, H., Cesare, N., Shojaie, A., and Spiro, E. S.: Using Twitter for Demographic and Social Science Research: Tools for Data Collection and Processing, Sociol. Method. Res., 46, 390–421, https://doi.org/10.1177/0049124115605339, 2017.
Meredith, E. S., Jenkins, S. F., Hayes, J. L., Deligne, N. I., Lallemant, D., Patrick, M., and Neal, C.: Damage assessment for the 2018 lower East Rift Zone lava flows of Kīlauea volcano, Hawai`i, B. Volcanol., 84, 1–23, https://doi.org/10.1007/s00445-022-01568-2, 2022.
Middleton, S. E., Middleton, L., and Modafferi, S.: Real-time crisis mapping of natural disasters using social media, IEEE Intell. Syst., 29, 9–17, https://doi.org/10.1109/MIS.2013.126, 2014.
Naismith, A. K., Armijos, M. T., Escobar, E. A. B., Chigna, W., and Watson, I. M.: Fireside tales: Understanding experiences of previous eruptions among other factors that influence the decision to evacuate from eruptive activity of Volcán de Fuego, Volcanica, 3, 206–226, https://doi.org/10.30909/vol.03.02.205226, 2020.
Neal, C. A., Brantley, S. R., Antolik, L., Babb, J. L., Burgess, M., Calles, K., Cappos, M., Chang, J. C., Conway, S., Desmither, L., Dotray, P., Elias, T., Fukunaga, P., Fuke, S., Johanson, I. A., Kamibayashi, K., Kauahikaua, J., Lee, R. L., Pekalib, S., Miklius, A., Million, W., Moniz, C. J., Nadeau, P. A., Okubo, P., Parcheta, C., Patrick, M. R., Shiro, B., Swanson, D. A., Tollett, W., Trusdell, F., Younger, E. F., Zoeller, M. H., Montgomery-Brown, E. K., Anderson, K. R., Poland, M. P., Ball, J. L., Bard, J., Coombs, M., Dietterich, H. R., Kern, C., Thelen, W. A., Cervelli, P. F., Orr, T., Houghton, B. F., Gansecki, C., Hazlett, R., Lundgren, P., Diefenbach, A. K., Lerner, A. H., Waite, G., Kelly, P., Clor, L., Werner, C., Mulliken, K., Fisher, G., and Damby, D.: The 2018 rift eruption and summit collapse of Kīlauea Volcano, Science (80-), 363, 367–374, https://doi.org/10.1126/science.aav7046, 2019.
O'Connor, C. and Joffe, H.: Intercoder Reliability in Qualitative Research: Debates and Practical Guidelines, Int. J. Qual. Meth., 19, 1–13, https://doi.org/10.1177/1609406919899220, 2020.
Patrick, M. R., Houghton, B. F., Anderson, K. R., Poland, M. P., Montgomery-Brown, E., Johanson, I., Thelen, W., and Elias, T.: The cascading origin of the 2018 Kīlauea eruption and implications for future forecasting, Nat. Commun., 11, 1–13, https://doi.org/10.1038/s41467-020-19190-1, 2020.
Peltier, A., Ferrazzini, V., Muro, A. Di, Kowalski, P., Villeneuve, N., Richter, N., Chevrel, O., Froger, J. L., Hrysiewicz, A., Gouhier, M., Coppola, D., Retailleau, L., Beauducel, F., Gurioli, L., Boissier, P., Brunet, C., Catherine, P., Fontaine, F., Lauret, F., Garavaglia, L., Lebreton, J., Canjamale, K., Desfete, N., Griot, C., Harris, A., Arellano, S., Liuzzo, M., Gurrieri, S., and Ramsey, M.: Volcano Crisis Management at Piton de la Fournaise (La Réunion) during the COVID-19 Lockdown, Seismol. Res. Lett., 92, 38–52, https://doi.org/10.1785/0220200212, 2021.
Ruan, T., Kong, Q., McBride, S. K., Sethjiwala, A., and Lv, Q.: Cross-platform analysis of public responses to the 2019 Ridgecrest earthquake sequence on Twitter and Reddit, Sci. Rep.-UK, 12, 1–14, https://doi.org/10.1038/s41598-022-05359-9, 2022.
Ruiz, C. and Hernández, B.: Emotions and coping strategies during an episode of volcanic activity and their relations to place attachment, J. Environ. Psychol., 38, 279–287, https://doi.org/10.1016/j.jenvp.2014.03.008, 2014.
Smith, A. and Anderson, M.: Social Media Use in 2018, Pew Research Center, 2018.
Spence, P. R., Lachlan, K. A., Lin, X., and del Greco, M.: Variability in Twitter Content Across the Stages of a Natural Disaster: Implications for Crisis Communication, Commun. Q., 63, 171–186, https://doi.org/10.1080/01463373.2015.1012219, 2015.
Spruce, M., Arthur, R., and Williams, H. T. P.: Using social media to measure impacts of named storm events in the United Kingdom and Ireland, Meteorol. Appl., 27, 1–17, https://doi.org/10.1002/met.1887, 2020.
Spruce, M. D., Arthur, R., Robbins, J., and Williams, H. T. P.: Social sensing of high-impact rainfall events worldwide: a benchmark comparison against manually curated impact observations, Nat. Hazards Earth Syst. Sci., 21, 2407–2425, https://doi.org/10.5194/nhess-21-2407-2021, 2021.
Steed, R. J., Fuenzalida, A., Bossu, R., Bondár, I., Heinloo, A., Dupont, A., Saul, J., and Strollo, A.: Crowdsourcing triggers rapid, reliable earthquake locations, Sci. Adv., 5, 1–7, https://doi.org/10.1126/sciadv.aau9824, 2019.
Stovall, W. K., Ball, J. L., Westby, E. G., Poland, M. P., Wilkins, A., and Mulliken, K. M.: Officially social: Developing a social media crisis communication strategy for USGS Volcanoes during the 2018 Kīlauea eruption, Front. Commun., 8, 976041, https://doi.org/10.3389/fcomm.2023.976041, 2023.
The Guardian: Lava from Hawaii volcano destroys hundreds more homes, The Guardian, https://www.theguardian.com/us-news/2018/jun/05/hawaii-kilauea-eruption-lava-kapoho-bay-mayor-home (last access: 20 June 2023), 2018.
Valdez, D., ten Thij, M., Bathina, K., Rutter, L. A., and Bollen, J.: Social media insights into US mental health during the COVID-19 pandemic: Longitudinal analysis of twitter data, J. Med. Internet Res., 22, 12, https://doi.org/10.2196/21418, 2020.
Wadsworth, F. B., Llewellin, E. W., Farquharson, J. I., Gillies, J. K., Loisel, A., Frey, L., Ilyinskaya, E., Thordarson, T., Tramontano, S., Lev, E., Pankhurst, M. J., Rull, A. G., Asensio-ramos, M., Pérez, N. M., Hernández, P. A., Calvo, D., Solana, M. C., Kueppers, U., and Santabárbara, A. P.: Crowd-sourcing observations of volcanic eruptions during the 2021 Fagradalsfjall and Cumbre Vieja events, Nat. Commun., 13, 2611, https://doi.org/10.1038/s41467-022-30333-4, 2022.
Williams, D. M., Avery, V. F., Coombs, M. L., Cox, D. A., Horwitz, L. R., McBride, S. K., McClymont, R. J., and Moran, S. C.: U. S. Geological Survey 2018 Kilauea Volcano Eruption Response in Hawai'i – After-Action Review, U.S. Geological Survey Open-File Report 2020-1041, 56 p., https://doi.org/10.3133/ofr20201041, 2020.
Williams, R. and Krippner, J.: The use of social media in volcano science communication: Challenges and opportunities, Volcanica, 1, I–VIII, https://doi.org/10.30909/vol.01.02.i-viii, 2019.
Wu, D. and Cui, Y.: Disaster early warning and damage assessment analysis using social media data and geo-location information, Decis. Support Syst., 111, 48–59, https://doi.org/10.1016/j.dss.2018.04.005, 2018.
Young, J. C., Arthur, R., Spruce, M., and Williams, H. T. P.: Social sensing of heatwaves, Sensors, 21, 1–16, https://doi.org/10.3390/s21113717, 2021.
Young, J. C., Arthur, R., Spruce, M., and Williams, H. T. P.: Social sensing of flood impacts in India: A case study of Kerala 2018, Int. J. Disast. Risk Re., 74, 102908, https://doi.org/10.1016/j.ijdrr.2022.102908, 2022.
Yu, M., Yang, C., and Li, Y.: Big data in natural disaster management: A review, Geosciences, 8, 5, https://doi.org/10.3390/geosciences8050165, 2018.
Zhou, S., Kan, P., Huang, Q., and Silbernagel, J.: A guided latent Dirichlet allocation approach to investigate real-time latent topics of Twitter data during Hurricane Laura, J. Inf. Sci., 49, 2, https://doi.org/10.1177/01655515211007724, 2021.