the Creative Commons Attribution 4.0 License.
the Creative Commons Attribution 4.0 License.
 | 31 Mar 2025
Topographic controls on landslide mobility: modeling hurricane-induced landslide runout and debris-flow inundation in Puerto Rico
Mark E. Reid
Collin Cronkite-Ratcliff
Jonathan P. Perkins
In 2017, Hurricane Maria triggered more than 70 000 landslides in Puerto Rico. After initiation, these predominantly shallow landslides were mobilized to varying extents – some landslides only traveled partway downslope, whereas others reached drainage channels and were mobilized into long-traveled debris flows that could severely impact roads and infrastructure. Thus, forecasting potential landslide runout and inundation zones is critical for estimating landslide and debris-flow hazards. Here we conduct an in-depth topographic analysis of landslide-affected areas from nine study areas and apply a linked modeling technique to estimate locations susceptible to varying degrees of landslide runout in the Lares, Utuado, and Naranjito municipalities.
We find that the longest runout lengths are observed on high-relief escarpments, although highly mobile long-runout debris flows also occurred in lower-relief dissected uplands. These topographic differences indicate that landslides that are initiated under similar conditions and possess equal potential to be mobilized as debris flows may not travel the same distances or affect the same areal extent. Our modeling approach allows the local topography to automatically control the implementation of two runout methods: (1) runout zones are assigned directly downslope of landslide source zones, and (2) debris-flow inundation zones are estimated in the presence of a channel network. Debris-flow volumes are calculated as a function of area-integrated growth factors, estimated as a function of the upstream areas susceptible to shallow landslides. Applying our empirical modeling scheme over an area of 560 km2, our results highlight the efficacy of our methods for the assessment of the potential for landslide runout and debris-flow inundation over diverse terrains with varied susceptibility.
- Article
(12356 KB) - Full-text XML
-
Supplement
(998 KB) - BibTeX
- EndNote


Globally, 55 997 fatalities due to non-seismically triggered landslides were recorded over the 12-year period between January 2004 and December 2016 (Froude and Petley, 2018). When conditions for landslide mobilization exist, including at least partial liquefaction by high pore pressures, landslides may mobilize to form debris flows, fast-moving slurries of saturated, poorly sorted sediment (e.g., Iverson, 1997; Hungr et al., 2002). Fast-moving, far-traveled landslides, such as debris flows, are one of the most destructive types of landslides. Due to their rapid velocity and occurrence without warning, debris flows can be lethal (e.g., Highland and Bobrowsky, 2008; McDougall, 2017). In regions where humans and infrastructure are present, landslide susceptibility forecasting tools to identify potential runout zones for high-mobility landslides are of foremost importance.
Landslide susceptibility models typically focus on a single type of landslide or process of movement, either landslide initiation (e.g., Montgomery and Dietrich, 1994; Larsen and Parks, 1998; Pack et al., 1999; Baum et al., 2008; Lepore et al., 2012; Mergili et al., 2014; Reid et al., 2015; Merghadi et al., 2020; Hughes and Schulz, 2020) or runout (e.g., Guzzetti et al., 2006; McDougall, 2017). Runout models may be empirically based (e.g., Iverson et al., 1998; Horton et al., 2013; Berti and Simoni, 2014) or physics-based (e.g., McDougall and Hungr, 2004; Christen et al., 2010; George and Iverson, 2014; Iverson and George, 2014; FLO-2D Software Inc., 2022; Gorr et al., 2022) and are often focused on back analysis or site-specific investigations (e.g., McDougall, 2017), typically requiring detailed information about the location of landslide initiation and volume or a flow hydrograph (e.g., Barnhart et al., 2021). Empirical runout methods, based on power-law volume–area relations, such as Laharz (Iverson et al., 1998; Schilling, 2014) or DFLOWZ (Berti and Simoni, 2014), provide methods for the automated delineation of inundation areas of lahars (e.g., Major et al., 2004; Muñoz-Salinas et al., 2009) or debris flows (Crosta et al., 2002; Griswold and Iverson, 2008; Magirl et al., 2010). Several previous investigations have combined landslide models to estimate both landslide sources (initiation) and runout zones. These investigations incorporated empirical models (Guinau et al., 2007; Mergili et al., 2019), physics-based models (Hsu and Liu, 2019), or a combination of empirical and physics-based methods (Ellen et al., 1993; Benda et al., 2007; Bregoli et al., 2010; Park et al., 2016; Fan et al., 2017; Pollock et al., 2019). However, existing methods for analyzing runout do not directly account for location within the topography and the transition from non-channelized to channelized runout.
We build a conceptual framework to define zones of mobility within the landscape that provides the basis of our topographic analysis of landslide-affected areas (source and runout) and modeling approach in Puerto Rico. Landslide materials move downslope until they reach a stable position. Whereas some landslides travel only partway downslope (Fig. 1b), others reach drainage channels and are mobilized into debris flows that can severely impact roads and infrastructure. Non-channelized runout zones exist downslope of landslide source zones, where the source zone is not adjacent to the channel or in open-slope topographies (Fig. 1a). In open-slope topographies, no channels are present and landslides travel downslope without entering a drainage or topographic depression (Geotechnical Engineering Office, 2012). Where channels are present, highly mobile debris flows will travel into the channel, potentially grow in volume, and flow long distances downstream (Fig. 1c). Our empirical runout models allow topography to control the spatial distribution and extent of potential landslide runout and debris-flow inundation zones. Our approach simulates patterns consistent with observations from Hurricane Maria when applied over a topographically diverse area, including the full extent of three municipalities: Lares, Utuado, and Naranjito. Our USGS software package, Grfin Tools (Cronkite-Ratcliff et al., 2025; Reid et al., 2025), contains tools to implement these methods and enables runout assessment over large regions without the computational effort required by physics-based models.
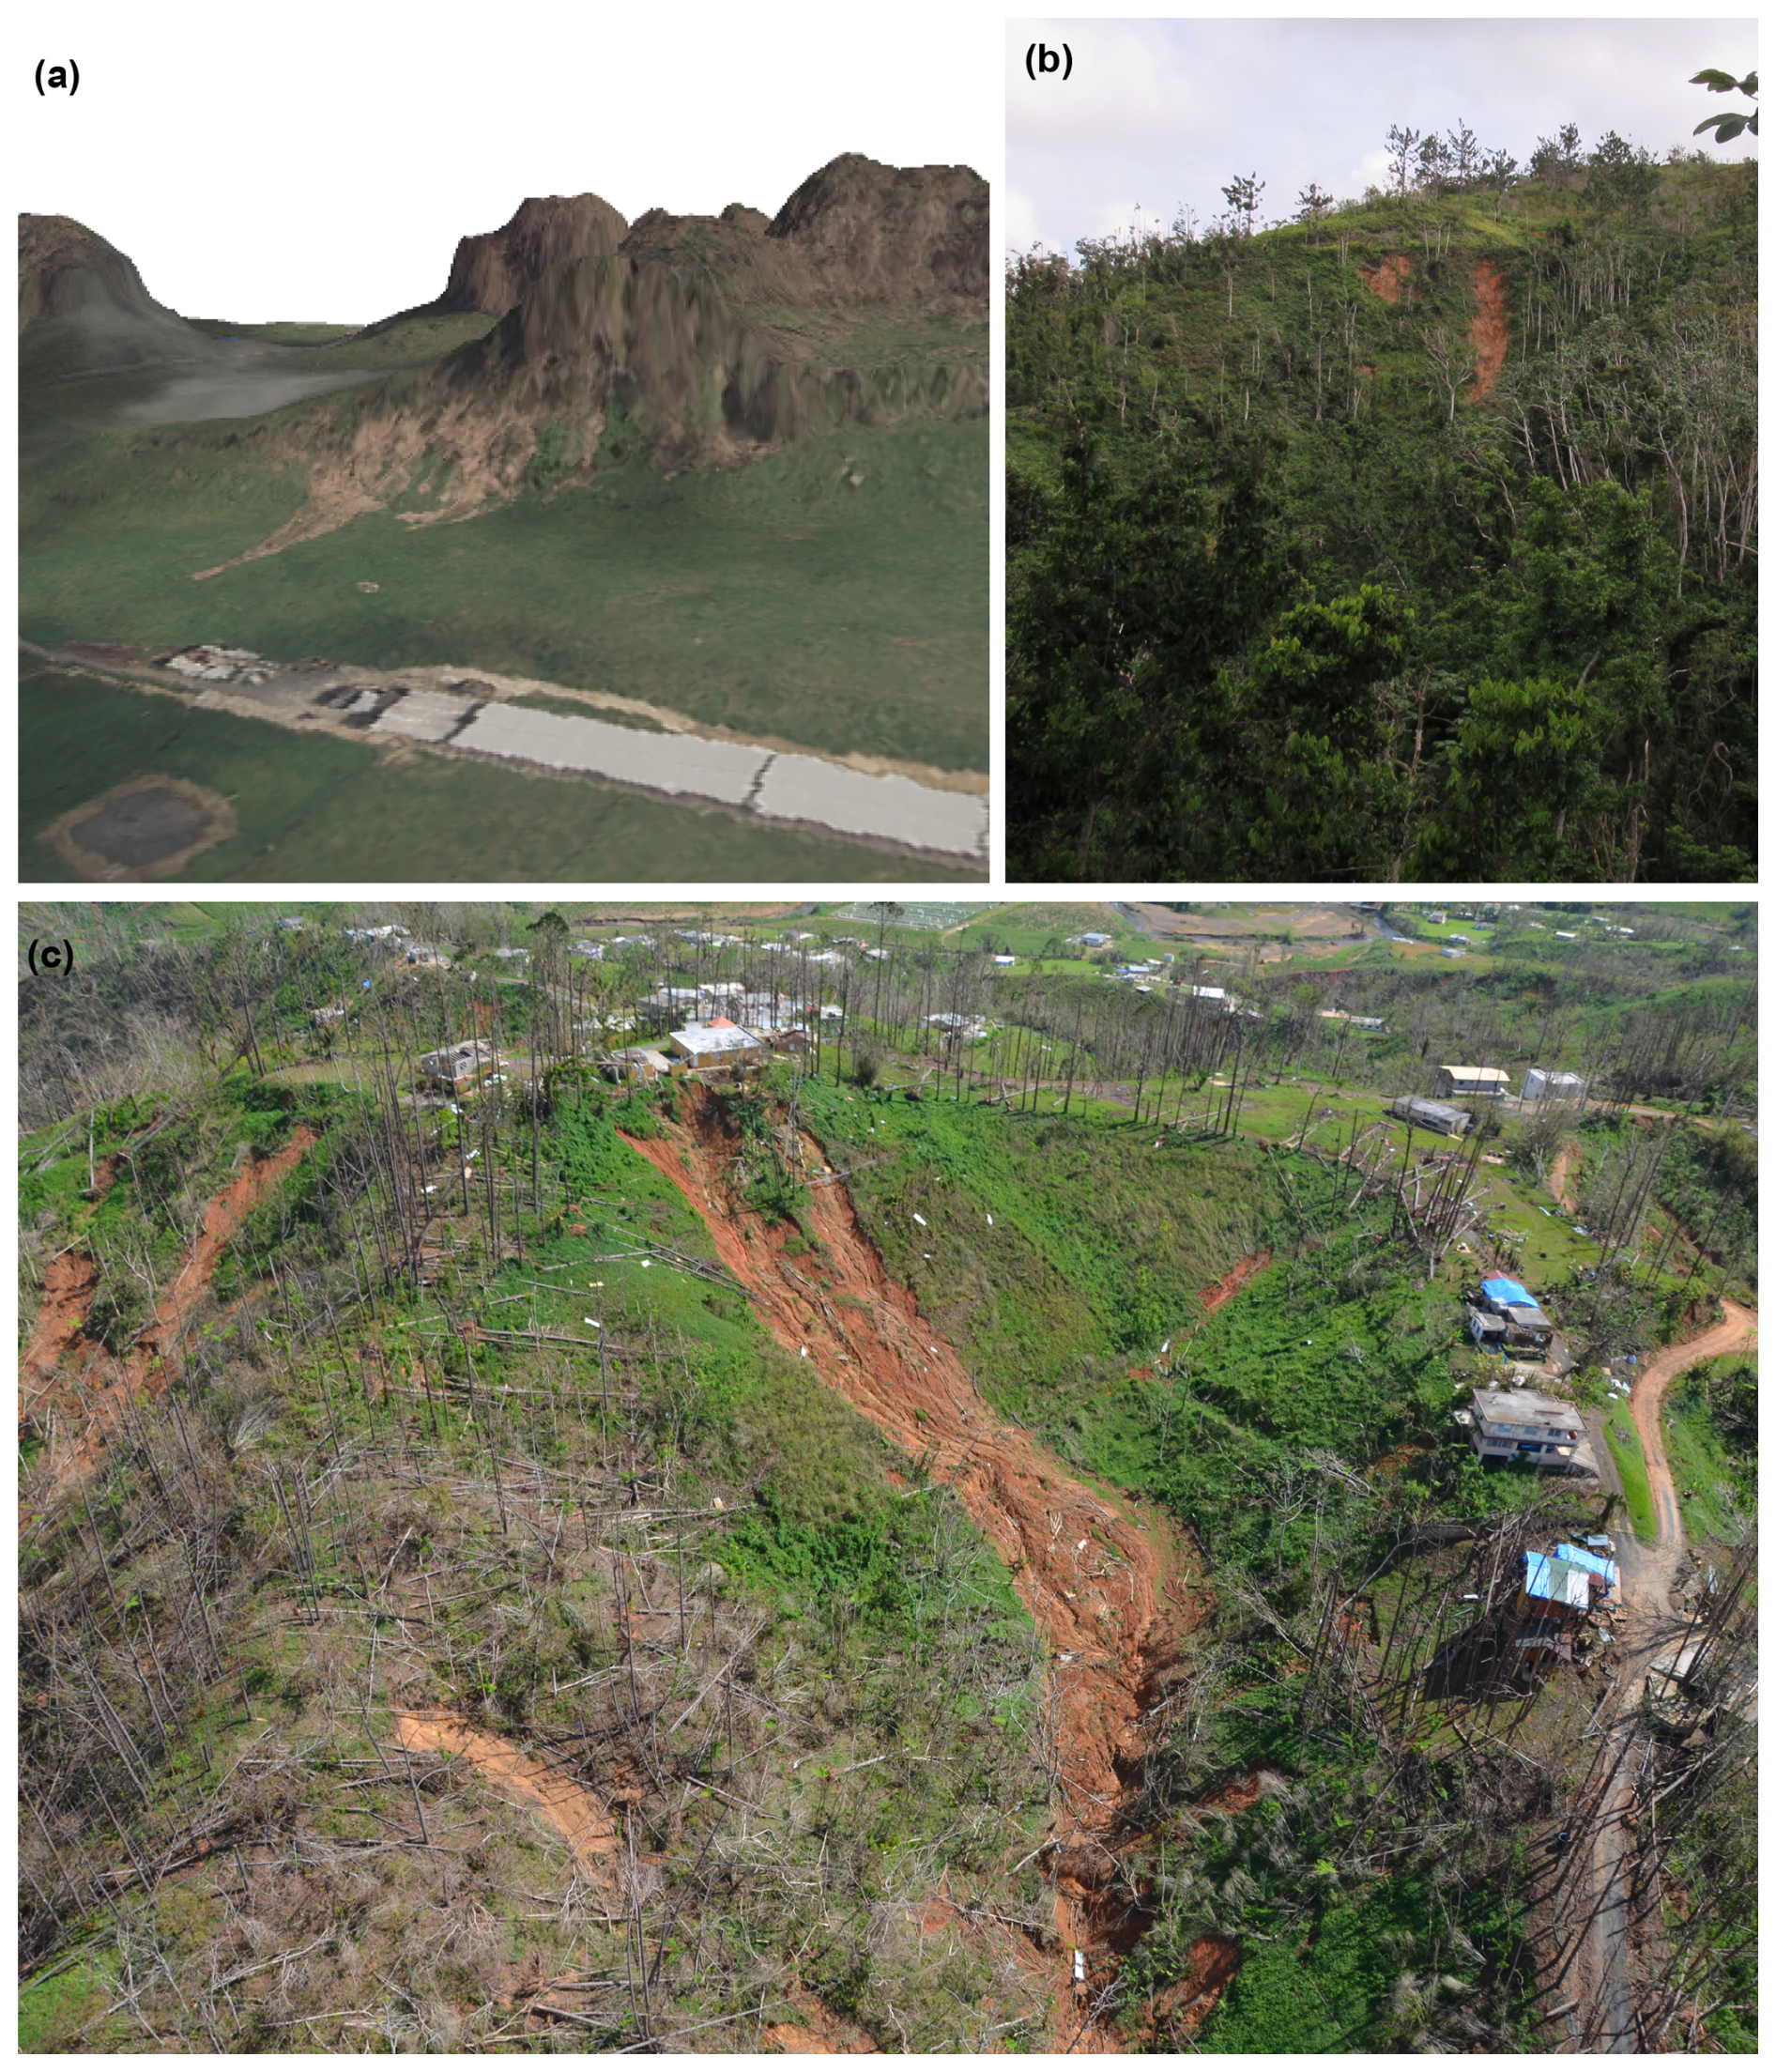
Figure 1Photographs showing Hurricane Maria landslides with various levels of mobility (a) Orthophoto (Quantum Spatial, Inc., 2017) draped on a DEM (U.S. Geological Survey, 2020a, b, and c), showing multiple landslides in non-channelized, open-slope topography of northern Utuado, adjacent to a cone karst topography. (b) Photograph (Dianne L. Brien, USGS) of two moderate-mobility, shallow landslides, in Utuado, Puerto Rico, that were mobilized and traveled partway downslope but an insufficient distance to reach a channel. (c) Photograph (Jason Kean, USGS) of a higher-mobility debris flow that was initiated from multiple shallow landslides and entered channelized topography in the lower half of photo, in the municipality of Ciales, Puerto Rico.
2.1 Zones of mobility
Our conceptual framework uses three zones of mobility within the landscape: (1) source zones, (2) non-channelized runout zones, and (3) channelized runout zones (debris-flow inundation zones). This framework provides the foundation to investigate two interrelated aspects of the Hurricane Maria landslides: (1) a topographic analysis of published landslide inventories and (2) a modeling approach to assess susceptibility to non-channelized and channelized runout in Puerto Rico. Results of the topographic analysis inform our selection of model parameters for candidate susceptibility scenarios, with the overall objective to select two final scenarios for regional susceptibility maps.
2.2 Topographic analysis
Our topographic analysis guided the selection of input parameters for runout modeling and provided an analysis associated with zones of mobility, enabling us to gain perspectives on the landslide-affected areas and relative contributions of each zone of mobility. Published landslide inventories of Hurricane Maria landslides (Bessette-Kirton et al., 2019b; Baxstrom et al., 2021a, b; Einbund et al., 2021a, b) provided the location of source zones and landslide-affected areas. We further divided landslide-affected areas not identified as source zones to distinguish channelized versus non-channelized runout. We then analyzed the percentage of area affected by each zone of mobility and extracted slope characteristics within each zone. We also assessed correlations between the study area slope and the slope of source areas and non-channelized runout, as trends could influence whether different parameters are needed for runout modeling as a function of geologic or topographic variability. This analysis provided valuable insights related to the question, “Does topography control mobility?”
In addition, we identified a subset of the mapped landslides, representative of the most mobile channelized debris flows. Typical characteristics of the inundation zones associated with the most mobile debris flows allowed us to define parameters for potential zones of debris-flow growth in our debris-flow inundation modeling. These inundation zones provided an important component for the assessment of the predictive success of our inundation methods. Details of this analysis are provided in the Supplement, and highlights are included in the “Results of runout and inundation modeling” and “Discussion” sections.
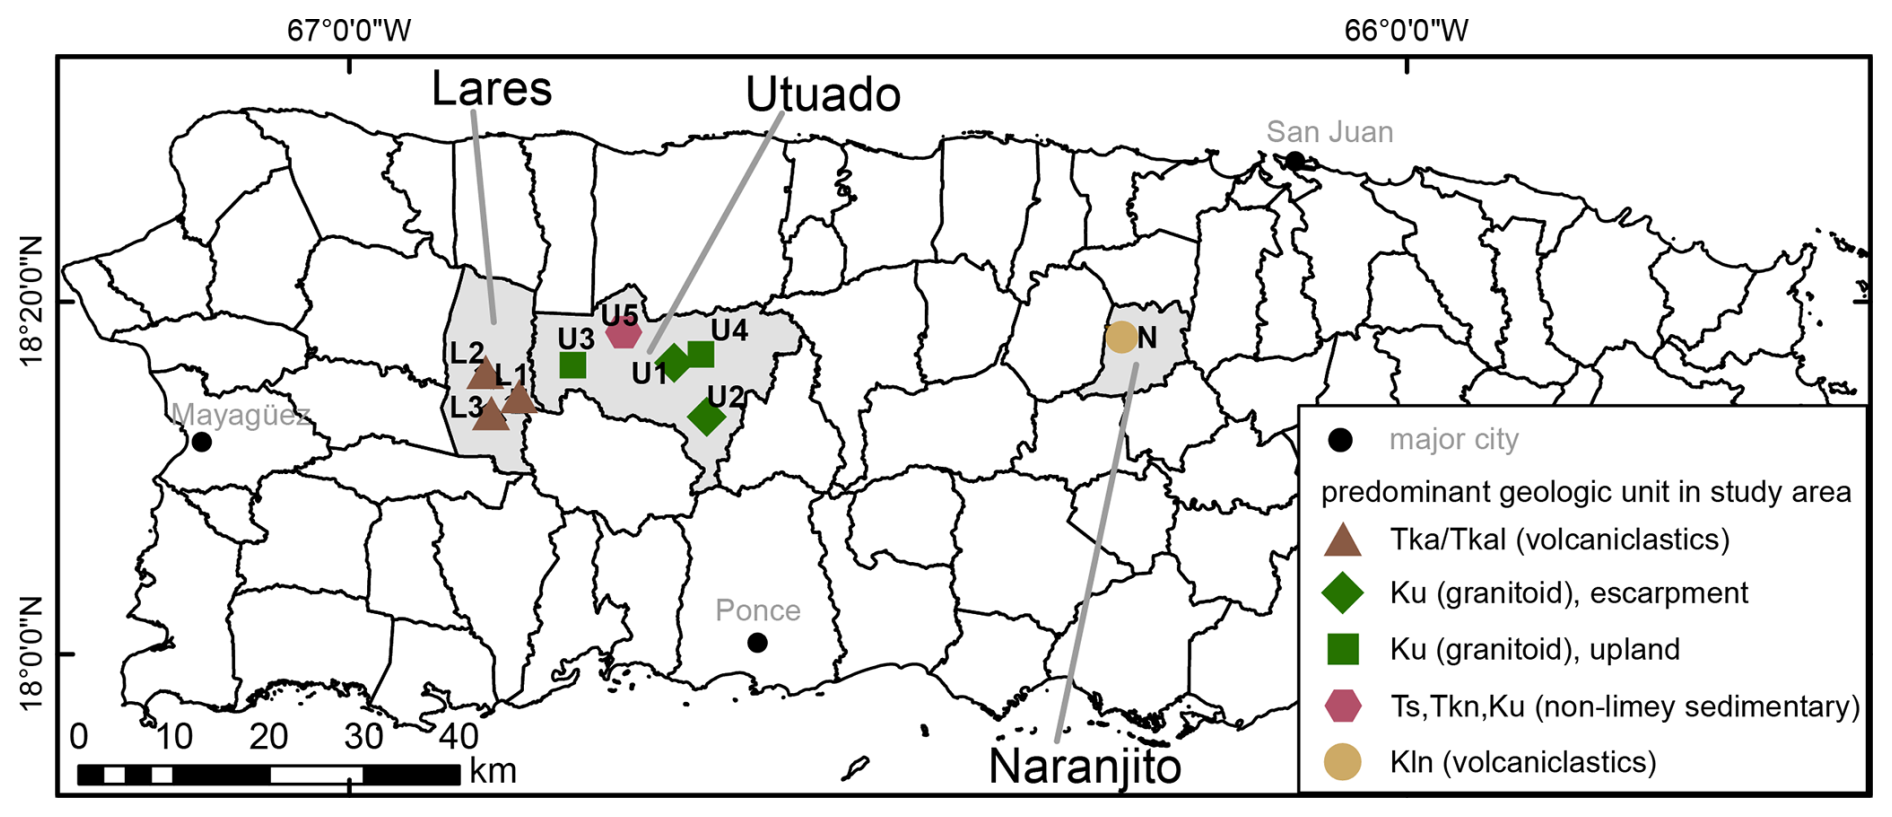
Figure 2Map of Puerto Rico, showing locations of nine study areas with detailed landslide mapping of 2919 landslides in the Lares, Utuado, and Naranjito municipalities (Bessette-Kirton et al., 2019b; Baxstrom et al., 2021a, b; Einbund et al., 2021a, b). The study area name is indicated by the first letter of the municipality followed by a numeral. Two unique symbols are used to distinguish escarpment (green diamonds) versus upland (green squares) geomorphic terrains.
Table 1Study area names, geologic terrane, predominant geologic units (Bawiec, 1998), and geomorphic terrains (escarpment or upland) for nine areas with mapped landslide-affected areas (Bessette-Kirton et al., 2019b; Baxstrom et al., 2021a, b; Einbund et al., 2021a, b).
2.3 Linked-model approach
Corresponding to the three zones of mobility, we developed a linked-model approach that combines potential landslide source zones with distinctive methods to identify areas susceptible to landslide runout versus debris-flow inundation. Here, the “link” is joined independently between potential landslide source areas and each runout method. The landslide source zones function as a shared connection or link.
The two runout methods differ based on the relative mobility and topographic setting of landslides. For moderate-mobility landslides and/or non-channelized runout zones, we define potential runout zones by the minimum angle of reach () from the landslide source. This approach provides a methodology to (1) estimate runout in open-slope topographies where channels are not present and (2) provide a transition from upslope landslide source zones to channels.
For high-mobility, channelized debris flows, we apply a different modeling approach. Although multiple types of landslides may flow, the definition of debris flow provided by Hungr et al. (2014) is well aligned with our modeling approach for inundation zones: “Very rapid to extremely rapid surging flow of saturated debris in a steep channel. Strong entrainment of material and water from the flow path”. These debris flows can increase in volume as they travel due to a combination of processes, including entrainment of bed sediment (e.g., Hungr et al., 1984; Takahashi, 1991; Iverson et al., 2011), coalescence of landslides (e.g., Coe et al., 2021), and stream bank collapse (Johnson, 1970). For channelized debris flows, we identify potential inundation zones using empirical volume–area relations (Griswold and Iverson, 2008) in concert with empirical debris-flow growth factors (Reid et al., 2016). Our growth factors integrate growth over a drainage basin and are defined as a function of the upstream contributing area susceptible to shallow landslides. This approach determines the spatial distribution and volumes of runout material contributing to debris-flow inundation zones.
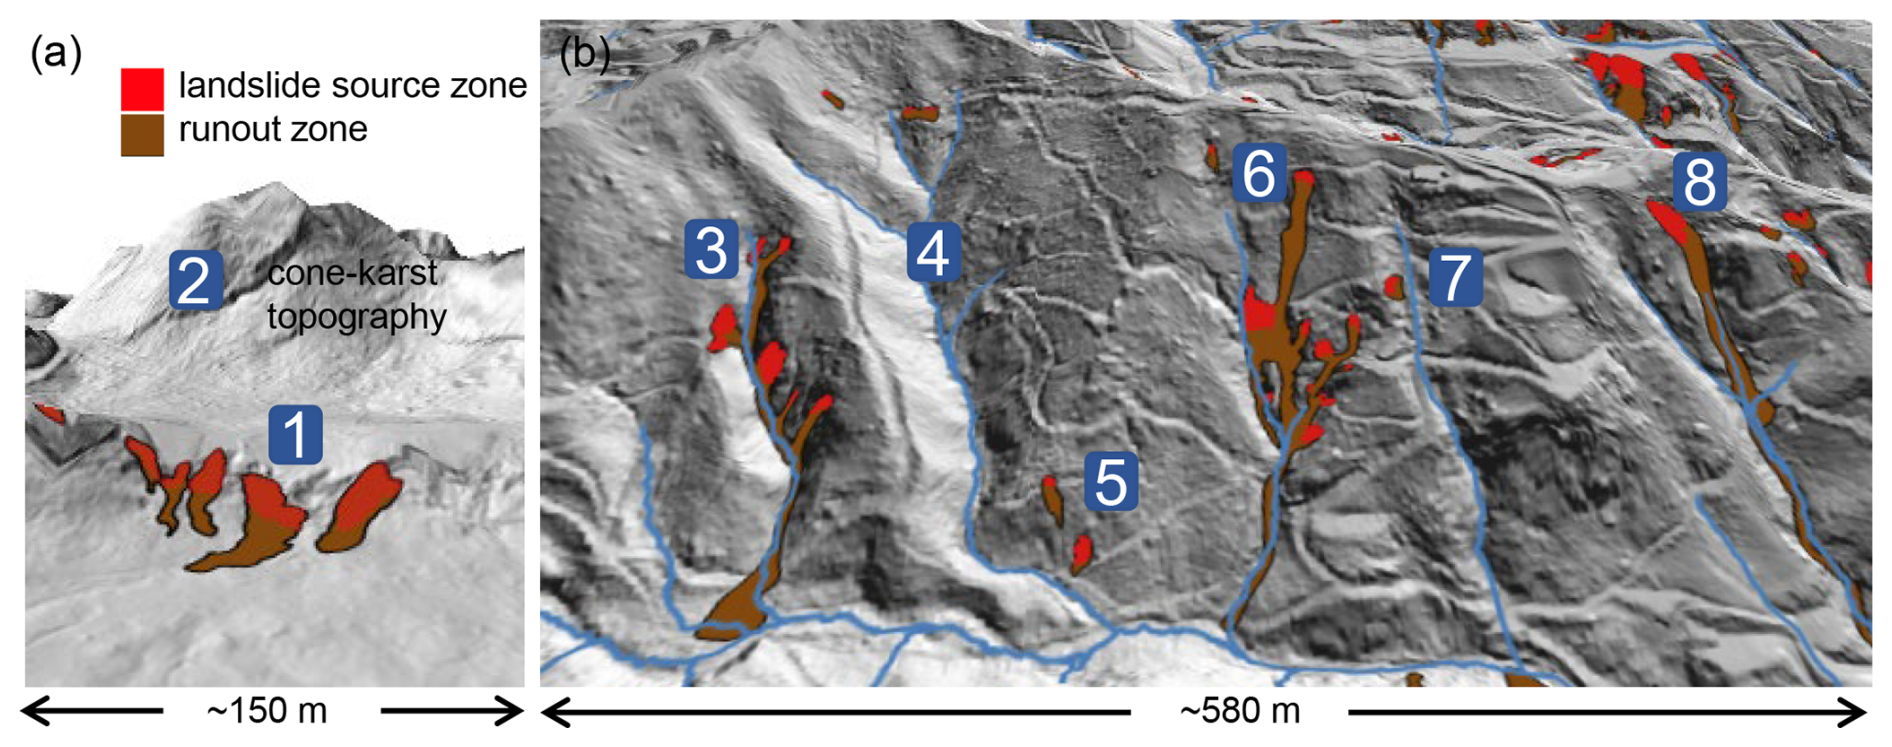
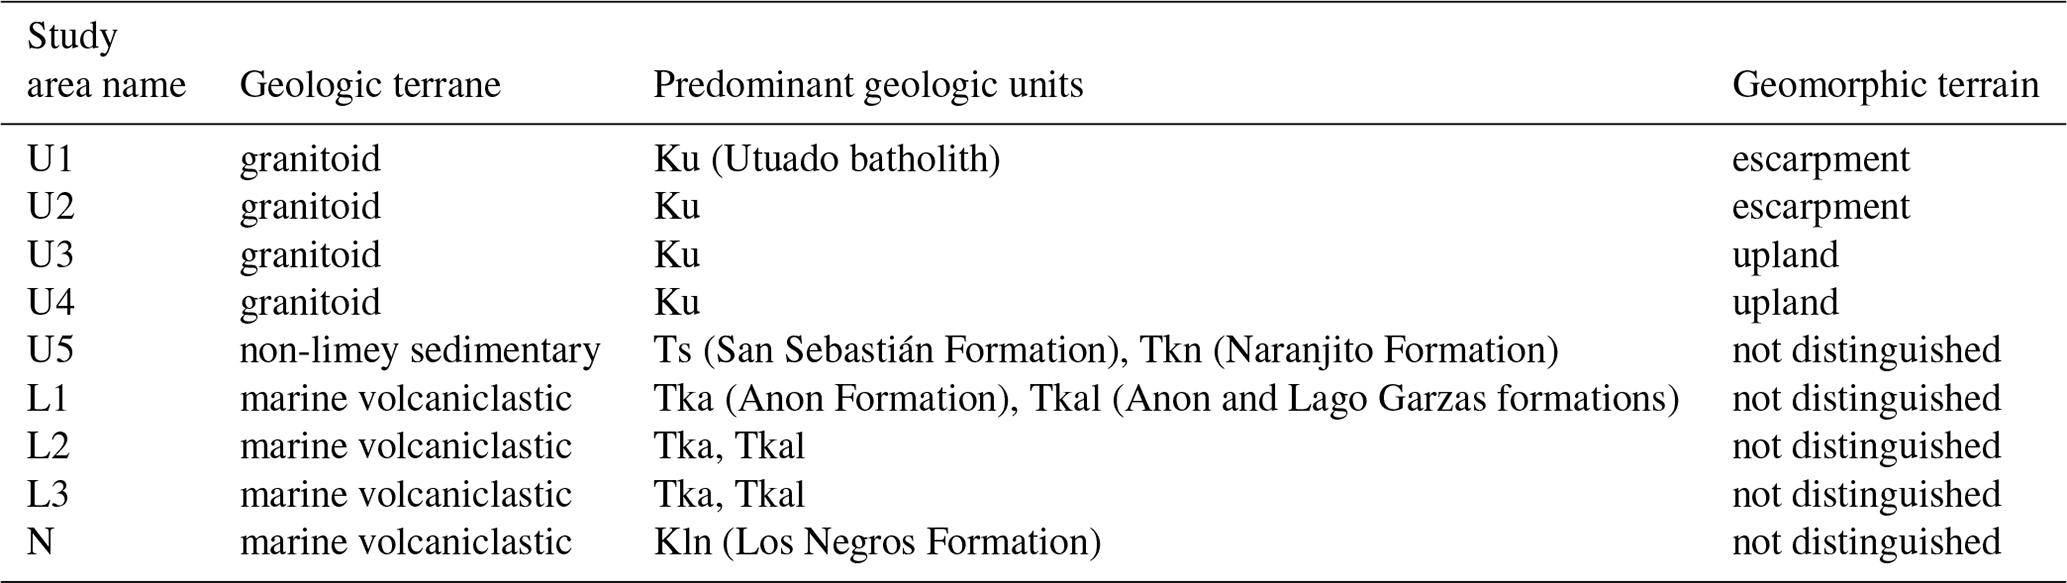
Figure 3Perspective views showing topographic features, mapped landslide source areas, and runout in small sections of two study areas in Puerto Rico. (a) Study area U5 (Baxstrom et al., 2021b), showing landslides on non-channelized, open-slope terrain (1) in northern Utuado, adjacent to cone karst topography (2). (b) Study area N (Bessette-Kirton et al., 2019b; Baxstrom et al., 2021a), showing basins with varying landslide densities and landslide types: (3) basin affected by landslides coalescing into debris flows, (4) unaffected basin, (5) low-mobility landslides on cut slopes adjacent to roads, (6) landslide on hillslope coalescing with multiple landslides closer to or located in drainage, (7) basin with one small low-mobility landslide, and (8) single landslide near the top of the hillslope that was mobilized as a channelized debris flow. The approximate location of (a) at the center of the image is 18°18′10′′ N, 66°49′10′′ W; (b) is located at 18°18′0′′ N, 66°16′0′′ W.
Our linked-model approach (1) provides three zones of hazard (landslide source, non-channelized runout, and channelized runout) related to landslide mobility; (2) uses angle of reach to identify potential non-channelized runout zones; (3) incorporates debris-flow growth for channelized debris flows; (4) estimates debris-flow volumes as a function of the contributing area susceptible to landslides; and (5) applies volume–area relations to estimate corresponding areas of debris-flow inundation. Combined, this approach provides a GIS-based method, applicable over diverse terrains of varied susceptibility to debris flows. Our USGS software package, Grfin Tools (“Gr” stands for growth, “f” for flow, and “in” for inundation; pronounced griffin) (Cronkite-Ratcliff et al., 2025; Reid et al., 2025), implements this approach and enables runout assessment over large regions without the computational effort typically required by physics-based models. We used our linked-model approach to create regional susceptibility maps of landslide initiation and runout in the three municipalities of Lares, Utuado, and Naranjito, Puerto Rico.
Steep mountainous terrain, high mean annual rainfall, and frequent intense storms in Puerto Rico contribute to the frequent occurrence of landslides, resulting in extensive property damage and loss of life (e.g., Larsen and Torres-Sanchez, 1998). Rainfall-triggered landslides are the most common type of landslide, occurring throughout the central mountains and foothills of the island, as frequently as 1 to 2 times per year (Larsen and Simon, 1993).
On 20 September 2017, Hurricane Maria produced rainfall amounts greater than any other hurricane or tropical storm in Puerto Rico since 1956; within a 48 h period, at least 250 mm of rain fell across Puerto Rico's mountainous terrain (e.g., Bessette-Kirton et al., 2019a) with as much as 1029 mm of precipitation recorded in the southeastern part of the island (Keellings and Hernández Ayala, 2019). Hurricane Maria triggered more than 70 000 landslides in Puerto Rico (Hughes et al., 2019). Our work builds on published data sources related to the widespread landsliding that occurred during Hurricane Maria.
3.1 Data sources and related work
3.1.1 Topographic base
We used high-resolution pre- and post-Hurricane Maria lidar-derived DEMs to construct a channel network and determine flow directions for our runout modeling. A pre-Maria, 1 m resolution DEM, acquired between January 2016 and March 2017 (U.S. Geological Survey, 2018), was representative of the topography at the time of Hurricane Maria. This pre-Maria DEM was used for extraction of topographic characteristics and assessment of model predictive success. A 0.5 m resolution, post-Maria lidar-derived DEM (U.S. Geological Survey, 2020a, b, c) was resampled to 1 m and used to create regional susceptibility maps of landslide initiation and runout.
3.1.2 Mapped landslide inventories
Published landslide inventories (Bessette-Kirton et al., 2019b; Baxstrom et al., 2021a, b; Einbund et al., 2021a, b) provided detailed mapping of landslide-affected areas from Hurricane Maria, including 2919 locations of landslide headscarp points, travel distance lines, landslide-affected areas, and source-area-only locations. Lengths were measured from the top of the headscarp to the farthest extent of visible landslide deposits (Bessette-Kirton et al., 2020). Hurricane Maria source-area locations were determined from pre- and post-event lidar-derived DEM differences (2016 to 2018) (U.S. Geological Survey, 2018, 2020a, b, c).
The inventories encompassed nine study areas, within three municipalities, over four distinctive geologic terranes – defined as groups of geologic formations, based on lithologic rock type, depositional environment, and/or age (Bawiec, 1998) (Table 1). Based on municipality, we applied naming conventions to identify the study areas. The Utuado municipality includes four ∼ 2.5 km2 study areas (U1, U2, U3, U4, Fig. 2) in a granitoid terrane (Ku) consisting of the Utuado batholith; these four areas are further distinguished by two geomorphic terrains (Einbund et al., 2021b): (1) escarpments (U1, U2) having highly dissected areas with predominantly steep topography and high drainage density and (2) upland terrain (U3, U4) consisting of dissected, low-relief plateaus (Monroe, 1980) with lower drainage density, relative to escarpments. Study areas U5, L1, L2, L3, and N (Fig. 2) do not have a distinctive plateau expression and do not contain a single unique geomorphic terrain. Northern Utuado includes the largest (∼ 30 km2) study area (U5), with low landslide density, located in non-limey sedimentary units (Baxstrom et al., 2021b) adjacent to cone karst topography, where conical, steep-sided hills of the Lares Limestone, named mogotes, rise to heights up to 100 m (Monroe, 1976). The Lares municipality includes three ∼ 2.5 km2 study areas (L1, L2, L3) (Einbund et al., 2021a), located in Tertiary–Cretaceous marine volcaniclastics and consisting mainly of breccia, tuff, sandstone, and siltstone (Tka/Tkal). The Naranjito municipality contains one ∼ 2.5 km2 study area (N) (Bessette-Kirton et al., 2019b; Baxstrom et al., 2021a), located in Cretaceous marine volcaniclastics, consisting mainly of basaltic breccia, sandstone, and siltstone (Kln).
3.1.3 Landslide types
Landslides triggered by Hurricane Maria included slumps, debris flows, rockfalls, and other slope failures (Hughes et al., 2019). Most landslides were shallow debris slides, and many of these mobilized and/or coalesced into channelized debris flows (Bessette-Kirton et al., 2020; Coe et al., 2021). Figure 3 shows the variety of landslide styles associated with channelized (Fig. 3b) and non-channelized (Fig. 3a) topography. In adjacent drainage basins, landslide density and the mobility of these landslides can vary widely (Fig. 3b).
3.1.4 Potential landslide source areas
To estimate potential landslide source areas in our linked-model approach, we used areas identified by the combination of three USGS models: (1) REGOLITH (Baum et al., 2021), for soil-depth estimation; (2) TRIGRS (Baum et al., 2008), for pore-water pressures; and (3) Slabs3D (Baum, 2023), for quasi-three-dimensional (3D) slope-stability analysis. The areas susceptible to shallow landslides during prolonged, intense rainfall were defined by factor-of-safety thresholds for high-susceptibility and very high susceptibility scenarios based on true positive rates compared to Hurricane Maria landslide inventories (Baum et al., 2024).
3.1.5 Debris-flow growth and volumes
For our debris-flow inundation modeling, we used published estimates of debris-flow growth factors and volumes. These estimates (Table 2) were based on lidar-derived DEM differencing in four drainage basins affected by long-runout debris flows from Hurricane Maria (Coe et al., 2021). Growth factors based on upslope contributing areas are shown as a function of both (i) the full contributing area and (ii) the area susceptible to landslides, approximated as slopes greater than 30° (Coe et al., 2021), where values in (i) are applicable to basins of similar susceptibility and values in (ii) are applicable to regions with spatially variable landslide susceptibility patterns.
Field measurements of stream slopes for several Hurricane Maria debris flows were measured using a laser rangefinder with an inclinometer (Coe et al., 2021). These measurements showed that growth transitioned to deposition at a stream slope between 3 and 8°, providing constraints on debris-flow growth zones for our modeling.
Table 2Range of values for debris-flow growth factors and total volumes from Hurricane Maria debris flows (Coe et al., 2021).
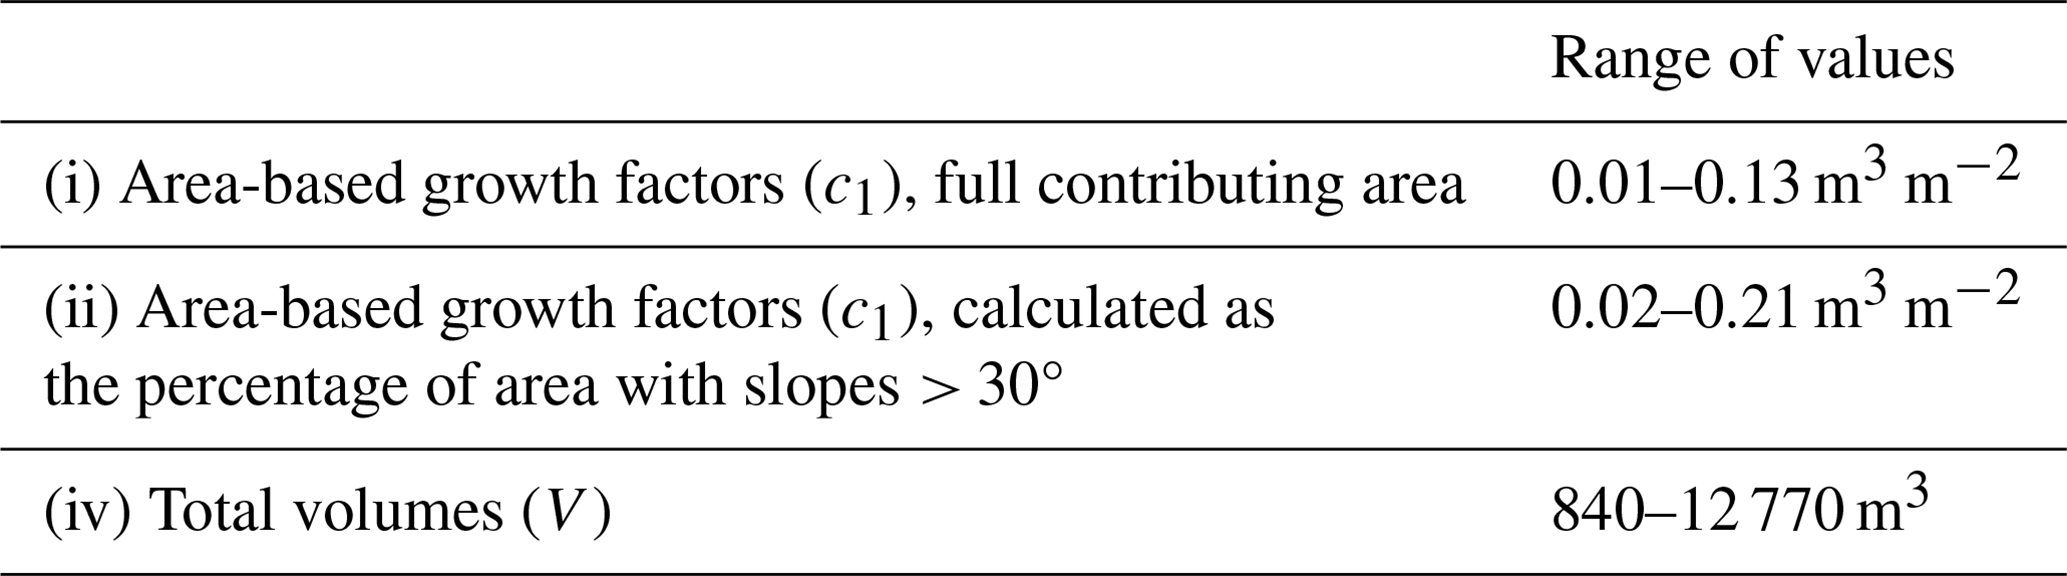
Figure 4 shows the steps in our linked-model approach, where blue boxes and one red box indicate existing data sources. Additional details of steps performed for channel network derivation (Sect. S1) and the topographic analysis (Sect. S2) are provided in the Supplement. The three landslide mobility components are highlighted: (1) source (red), (2) non-channelized runout (yellow), and (3) debris-flow inundation (purple).
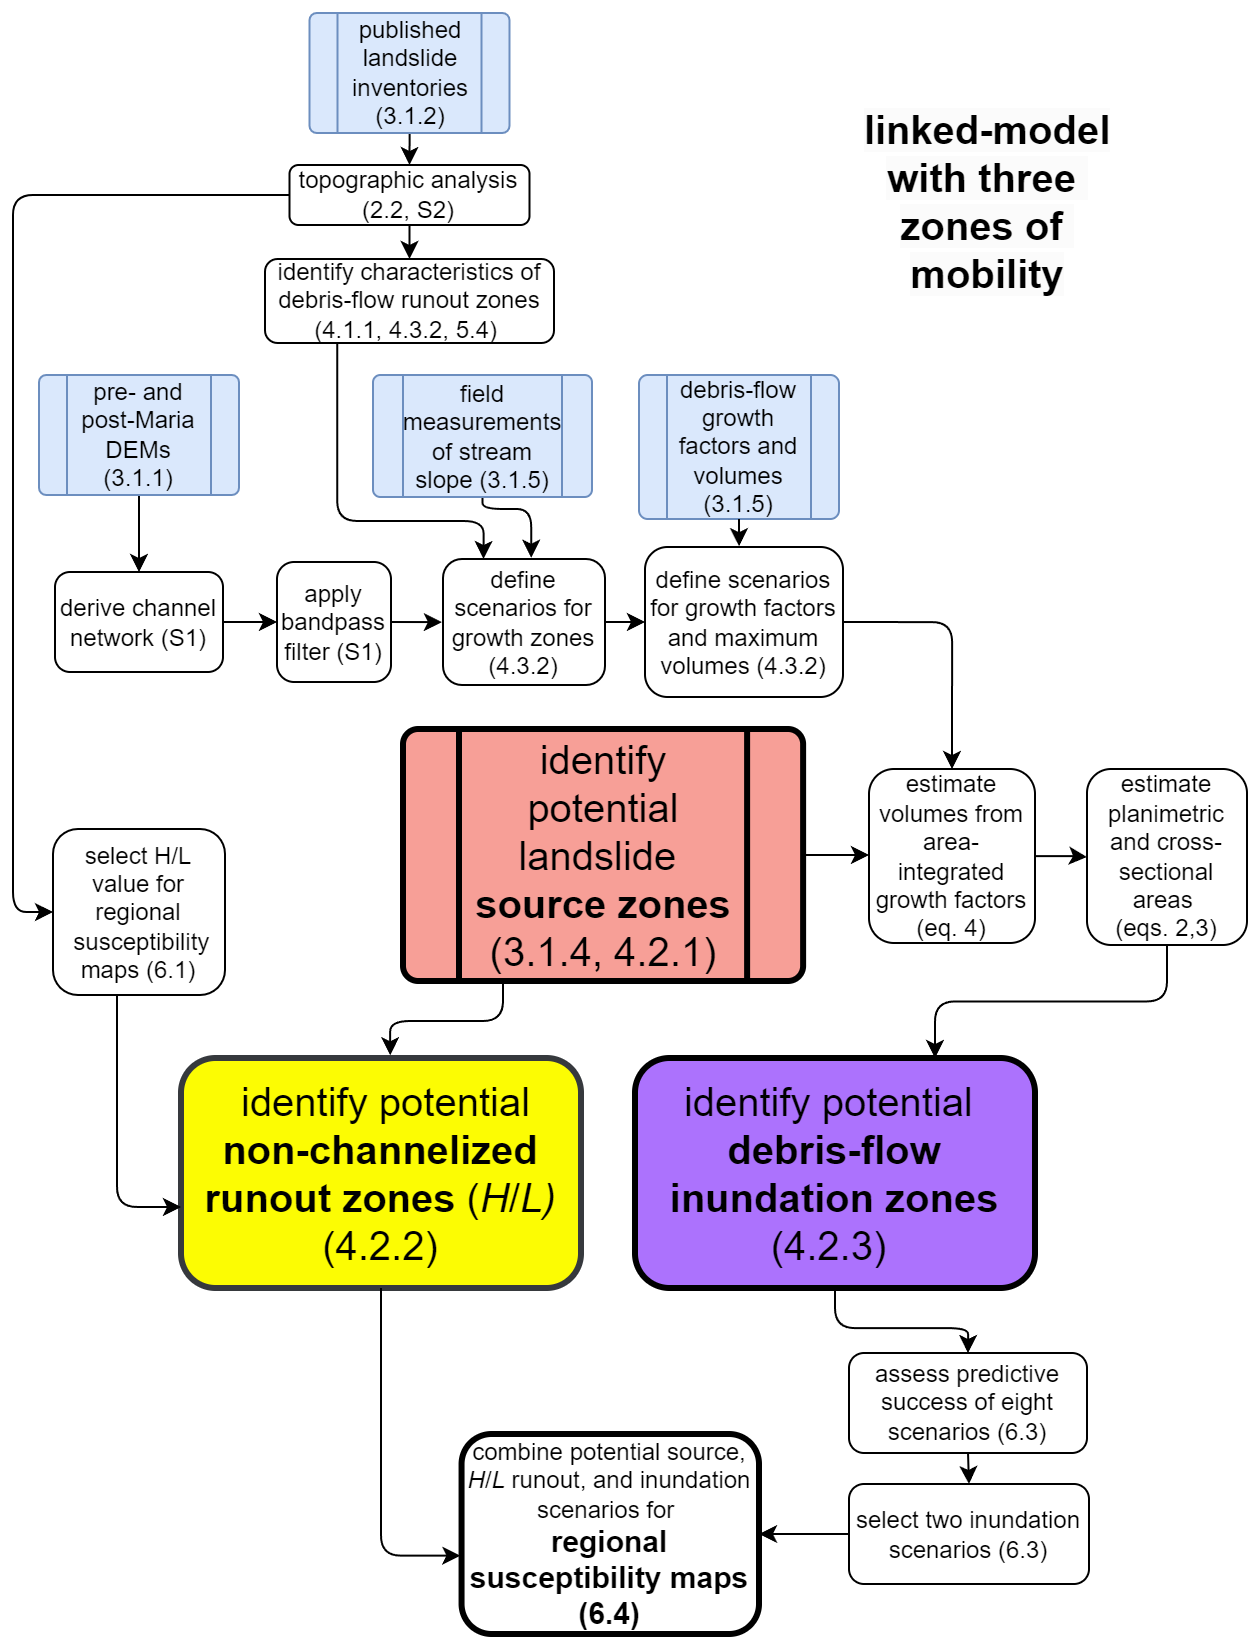
Figure 4Flowchart of our linked-model approach. Blue boxes (and one red box) indicate published data sources. Red, yellow, and purple boxes indicate the three landslide mobility components of our linked-model approach. The numbers refer to the corresponding sections in the paper and Supplement.
4.1 Topographic analysis of mobility zones
Using the published datasets of source areas and landslide-affected areas (Bessette-Kirton et al., 2019b; Baxstrom et al., 2021a, b; Einbund et al., 2021a, b), combined with our channel network (Sect. S1), we divided the mapped landslide-affected areas in the nine study areas into three zones of mobility. The published mapped source areas provided the first zone of mobility. Using ArcGIS® spatial analyst tools by Esri, we divided the remaining area into non-channelized and channelized runout. Runout zones from small landslides (length < 20 m) with a small percentage (< 20 %) of area adjacent to the drainage or distanced greater than 3 m from the delineated drainage network were assigned as non-channelized runout, and the remaining landslide-affected area was designated channelized runout. Additional details are provided in the Supplement (Sect. S2).
4.1.1 Hurricane Maria's most mobile landslides (MMMs)
Next, we developed criteria to extract a subset of mapped landslide-affected areas representative of Hurricane Maria's most mobile landslides (MMMs) in Puerto Rico. This subset possesses characteristics of channelized debris flows. The identification of MMMs provided a dataset for the assessment of predictive success of our debris-flow inundation modeling. Characterization of the runout (non-channelized and channelized) zones associated with the MMM debris flows guided the parameterization of debris-flow growth zones.
The primary criterion to identify MMMs was a high (> 40 %) percentage of runout area located in close proximity (< 5 m) to a designated channel. This criterion identified channelized debris flows as well as some less mobile, non-channelized runout zones located close to the channel. To eliminate these non-channelized runout zones, we applied an additional criterion: runout length > 100 m. We used runout lengths available in the published landslide inventories. Given that post-event evidence did not provide information to distinguish between specific contributions from sources upstream of tributary junctions, coalescing runout zones were grouped together; one runout zone may represent the path of a single debris flow or many coalescing debris flows. We applied these two criteria to extract MMMs for the nine study areas (Brien et al., 2024).
To evaluate representative characteristics of channelized debris-flow runout zones and define constraints on debris-flow growth zones for inundation modeling, we compiled percentile statistics from the runout zones associated with MMMs. These zones may have included stream reaches of growth, transport, and/or deposition. We were not able to identify reaches with only debris-flow growth given the available information; therefore the values extracted represent extremes of reasonable values to constrain debris-flow growth zones. Due to the small sample size of MMMs identified in upland terrains, we grouped the study areas by geologic terrane.
We computed percentile statistics within the runout zones, where the maximum value of the stream order provided the most useful statistic to constrain characteristics of growth zones and other variables described below were characterized by statistical means. For each runout zone, we determined the maximum Strahler stream order; mean stream slope calculated over a horizontal distance of 50 m; mean planform curvature from a smoothed DEM; and mean percentage of contributing area susceptible to shallow landslides (Psrc), where
Asrc is the total contributing area susceptible to shallow landslides, estimated from source-zone modeling (Baum et al., 2024), and A is the total upslope contributing area. Contributing areas and corresponding values for Psrc were calculated for each raster cell within a runout zone using a single-direction D8 flow model (Tarboton et al., 2015).
4.2 Linked-model approach
4.2.1 Landslide initiation zones
Our runout methods can be applied with potential source areas obtained from any empirically based (e.g., Furbish and Rice, 1983; Larsen and Parks, 1998; Lepore et al., 2012; Hughes and Schulz, 2020; Merghadi et al., 2020) or physics-based (e.g., Montgomery and Dietrich, 1994; Pack et al., 1999; Baum et al., 2008; Mergili et al., 2014; Reid et al., 2015) landslide susceptibility methods. For Puerto Rico, we used slope-stability analysis results to identify potential source areas. Baum et al. (2024) defined factor-of-safety thresholds needed to capture 0.75 (high susceptibility) and 0.90 (moderate susceptibility) true positive rates for observed headscarp points (from Hughes et al., 2019) of landslides triggered by Hurricane Maria. For our non-channelized runout zones, discussed below, we used the combined high- and moderate-susceptibility potential source areas. The high-susceptibility areas were used as the upslope contributing source area for debris-flow inundation scenarios.
4.2.2 Delineation of non-channelized runout zones
We identified runout zones for moderate-mobility landslides using runout zones delineated with the Grfin Tools implementation (Cronkite-Ratcliff et al., 2025; Reid et al., 2025) of the avalanche runout tool from the TauDEM toolbox (Tarboton et al., 2015). This tool uses a D-Infinity method to determine flow directions along a flow path (Tarboton, 1997). The length downslope of potential source areas is limited by a threshold angle equivalent to arctan () or the angle of reach (α) (e.g., Scheidegger, 1973; Hsu, 1975; Nicoletti and Sorriso-Valvo, 1991; Corominas, 1996; Iverson et al., 2015; Legros, 2002; Wallace et al., 2022), where H is defined as the vertical drop and L is the horizontal projection of distance. On a hillslope or in a DEM, the flow path for measurement of the horizontal length, L, may follow a winding pathway downslope and down-channel. In locations where runout enters a channel, the runout zones defined by are not able to delineate the width of inundation. However, this limitation is addressed by our application of debris-flow inundation modeling in channelized topography.
4.2.3 Delineation of channelized debris-flow inundation zones
For high-mobility, channelized debris flows that grow as they travel, we identified potential debris-flow growth zones, calculated debris-flow volumes using debris-flow growth factors (Reid et al., 2016), and identified areas susceptible to inundation with Grfin Tools (Cronkite-Ratcliff et al., 2025; Reid et al., 2025). Grfin Tools inundation eliminates spiky artifacts that can be present in results using other empirical debris-flow inundation models such as Laharz (Schilling, 2014) or DFLOWZ (Berti and Simoni, 2014).
Our modeling used a semiempirical approach relating volume to cross-sectional and planimetric area (Iverson et al., 1998), allowing us to estimate the inundation area from debris flows. This approach uses power-law relations for debris-flow inundation (Griswold and Iverson, 2008) combined with empirical growth factors (Reid et al., 2016, 2025; Coe et al., 2021). Planimetric and cross-sectional inundation area estimations are calculated from two statistically derived equations based on a worldwide database of debris-flow measurements from diverse data sources and geographic locations, ranging in volume from 10 to 106 m3 (Griswold and Iverson, 2008):
where A is the cross-sectional area, B is the planimetric area, and V is the debris-flow volume. Previous studies of non-post-wildfire debris flows yield similar coefficients for these relations, where the cross-sectional area coefficient ranged from 0.07 to 0.1 and the planimetric area coefficient ranged from 17 to 20 (Griswold and Iverson, 2008; Berti and Simoni, 2014). The estimated cross-sectional area and planimetric areas are applied to a DEM to define areas susceptible to channelized debris flows.
Debris-flow volume is of foremost importance for this approach and for inundation modeling in general. Previous studies indicate debris-flow inundation patterns, and flow depth estimates may be more sensitive to flow volume than flow properties (Barnhart et al., 2021). We compute volume as a function of the upslope contributing area susceptible to shallow landslides at locations in the digitally derived channel network where debris-flow growth is likely to occur (growth zones):
where V is debris-flow volume, c1 (units of L3 L−2) is an empirically derived growth factor (Reid et al., 2016, 2025), Asrc is the potential upslope contributing source area, and Vmax is the maximum volume. Volumes are ultimately constrained by Vmax, based on volume estimates from Hurricane Maria. Using volumes from Eq. (4), cross-sectional and planimetric inundation areas can be derived using Eqs. (2) and (3).
For Puerto Rico, volumes calculated as a function of areas susceptible to debris flows (Asrc), based on Baum et al. (2024), allow us to apply these empirical relations over large regions with various geologic terranes and geomorphic terrains where landslide susceptibility is spatially variable. Equation (4) provides volumes regulated by c1 and Asrc. Basins with a minimal susceptible area result in smaller volumes, and basins of high susceptibility produce larger volumes, limited by Vmax. For areas with no susceptible contributing source area, computed debris-flow volumes are nil, and these conditions result in no inundation. We use the term “self-regulating” volumes to describe volumes estimated by Eq. (4).
4.3 Parameters and assessment of the linked-model approach
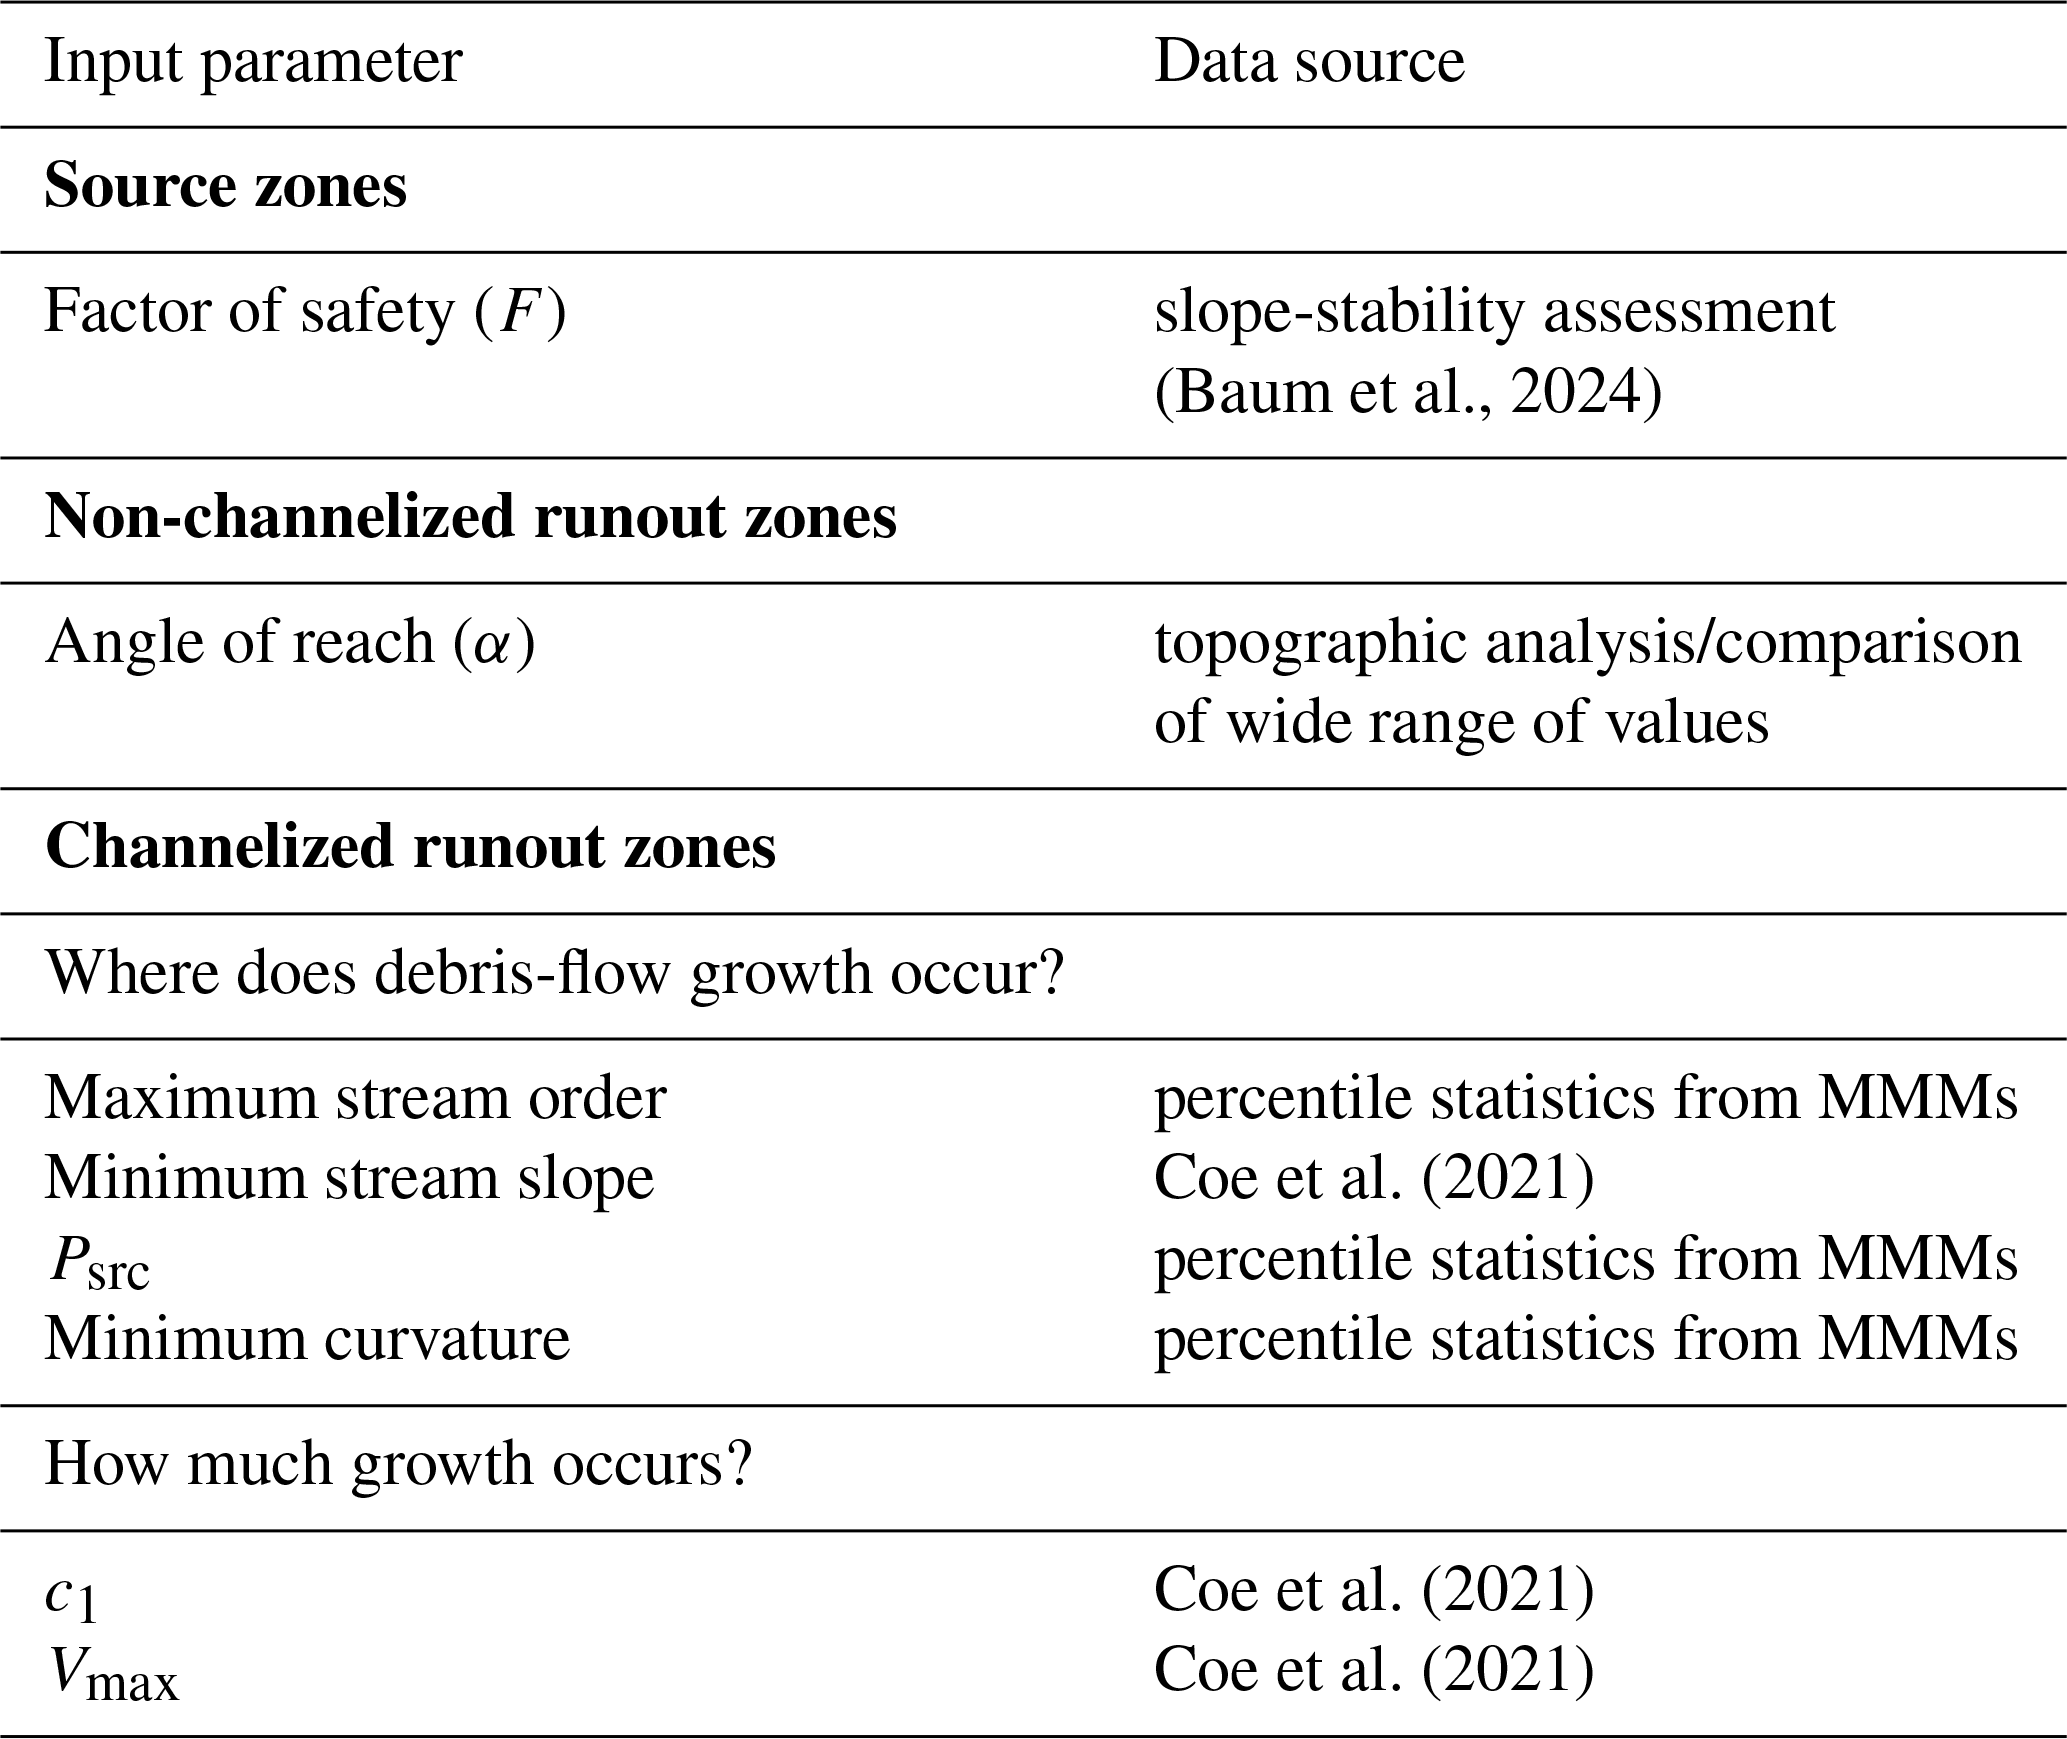
Once potential landslide source zones are identified, additional input parameters are required for the linked-model approach. The only required parameter for non-channelized runout is α (). Inputs for the debris-flow inundation modeling require answers to the following questions: (1) where does debris-flow growth occur? (2) How much growth occurs? And (3) what are expected maximum debris-flow volumes? Table 3 summarizes input parameters for our regional susceptibility maps and associated data sources or analyses for these values.
Table 3List of required input parameters and data sources for linked-model approach.
4.3.1 Selection of height length () values for regional susceptibility maps
To select values for regional susceptibility maps, we considered a range of previously published values in Puerto Rico as well as global datasets. Published data for landslides in the volume range from Hurricane Maria include regression equations quantifying the relation between the angle of reach (α) and landslide volume; for all landslide types combined, log ( log V−0.047, which yields values of 0.61 (α=31°) to 0.41 (α=22°) for landslide volumes of 100 to 10 000 m3, respectively (Corominas, 1996). Data from USGS debris-flow flume experiments yield (equivalent to α≈27°) for unconfined runout but values greater than 2 for channelized runout, for volumes of ∼10 m3 (Iverson, 1997). In Puerto Rico, Bessette-Kirton et al. (2020) calculated median values for 1035 landslides from Hurricane Maria as 0.68 (α=34°) and coalescing landslides as 0.52 (α=27°), with median lengths (L) of 17.5 and 25.2 m, respectively. These values represent typical Maria-induced landslides with relatively short travel distances, as reflected by the median lengths. The smallest values calculated were less than 0.25 (α=14°; Bessette-Kirton et al., 2020). Given the wide range of published values, we used mapped landslide source areas to assess the change in area affected by runout over a wide range of α values: 10, 15, 20, 25, and 30°.
4.3.2 Debris-flow growth zones and volumes
Debris-flow volumes, calculated as a function of the upslope contributing area susceptible to shallow landslides (Eq. 4), were computed where debris-flow growth is likely to occur. Debris-flow growth zones were defined by a combination of parameters, including the stream slope, stream order, planform curvature, and Psrc (Eq. 1). The rate of volumetric growth was controlled by c1, limited by Vmax (Eq. 4).
We considered eight debris-flow inundation scenarios (Fig. 5), constrained by (1) the minimum stream slope where growth transitioned to deposition (3°) (Coe et al., 2021); (2) MMM statistics for stream order, stream slope, curvature, and Psrc; and (3) published debris-flow volumes and growth factors (c1) (Coe et al., 2021). All scenarios excluded channel sections with planform curvature < 0.02 m−1 and Psrc<20 %, which are sections unlikely to produce debris-flow growth based on 75 %–90 % of MMM observations. Unrealistically short (< 4 m) stream segments of channel identified as potential growth zones were also excluded. The final selection of two scenarios for region-wide susceptibility maps was based on evaluation of predictive success from the inundation results produced from these eight scenarios.
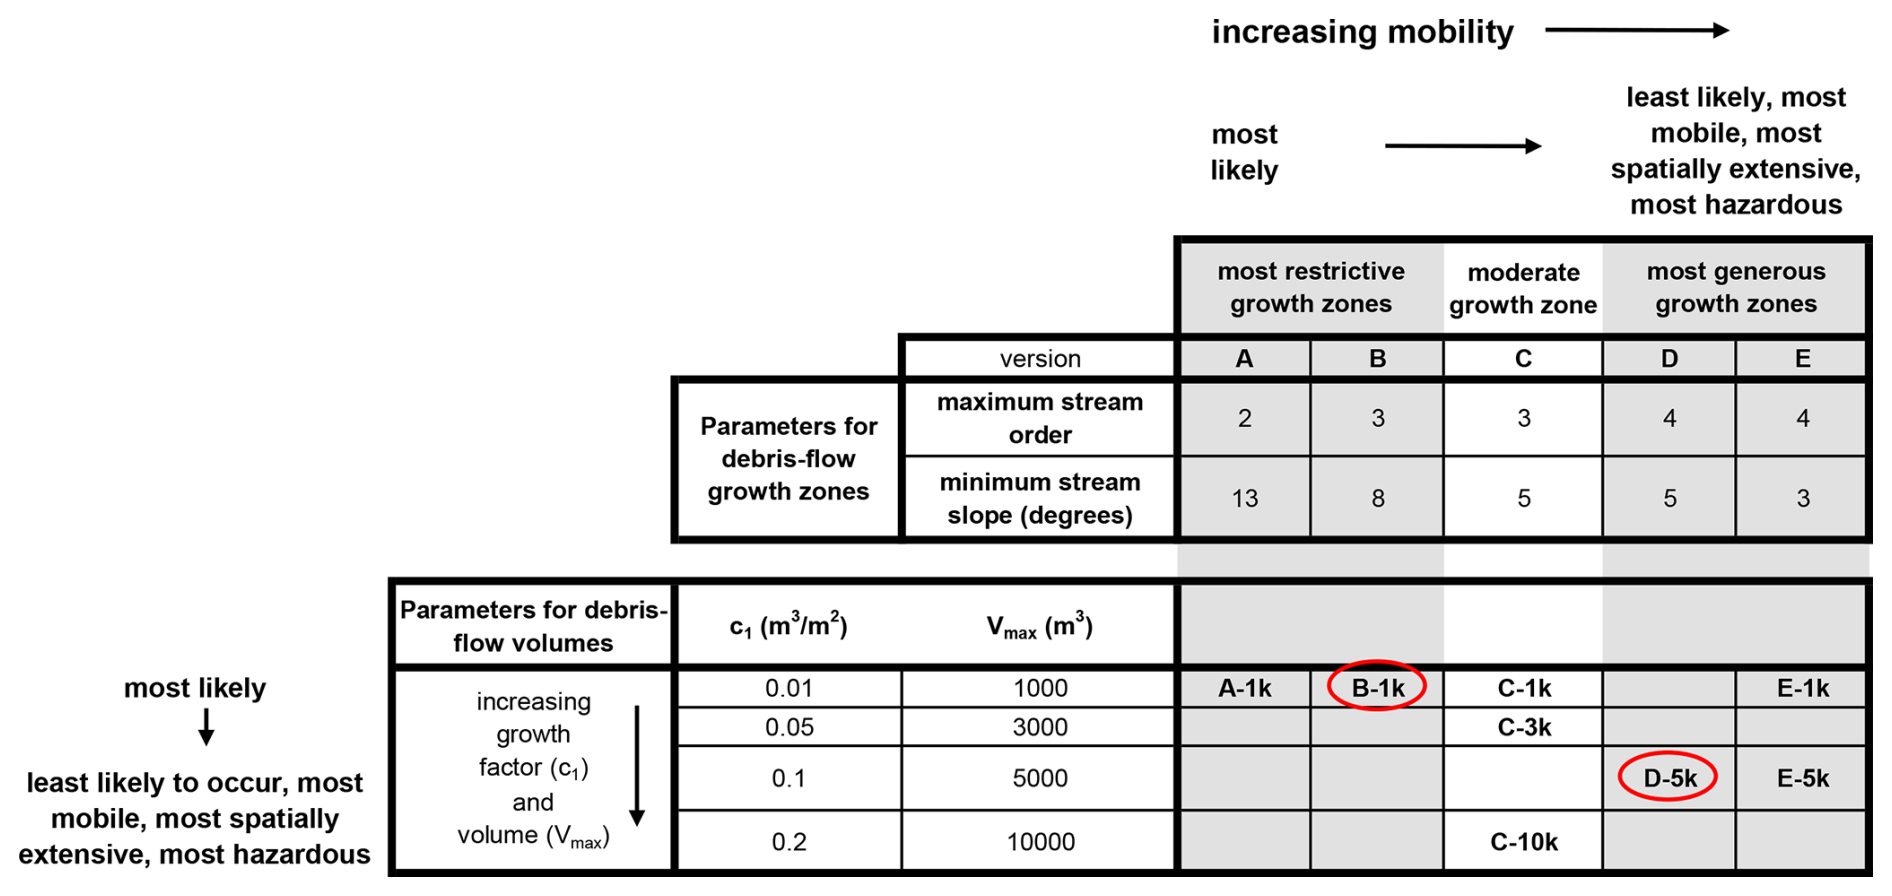
Figure 5Matrix of eight debris-flow inundation scenarios considered in three municipalities. Red outlines highlight the two final scenarios selected.
Columns in the matrix of scenarios (Fig. 5) identify debris-flow growth zone scenarios (A, B, C, D, E). Rows identify associated parameters for debris-flow volumes, including maximum volumes of 1000, 3000, 5000, and 10 000 m3. Each scenario is assigned an identifier, such as A-1k, based on a combination of the associated letter for the growth zone scenario (A) and assigned maximum volume (1 km3).
4.3.3 Assessment of predictive success for H/L runout
The assessment of predictive success for zones was not easily quantifiable given that the landslide inventories were focused on areas with the highest landslide densities. In these high-density areas, steep (> 30°) slopes led directly to channelized zones and non-channelized runout typically reflected the local topographic slope. The limited number of mapped landslides located in open-slope terrains was not extractable from the inventories and likely would not have provided a statistically representative sample size for quantitative assessment of the predictive success for . We used source areas from the published landslide inventories and considered the spatial patterns in the estimated runout area for α values between 10 and 30°. With decreasing α, we assessed changes in the location of affected areas (from non-channelized to channelized) and relative increase in estimated runout area.
4.3.4 Assessment of predictive success for debris-flow inundation
In a back-analysis mode commonly used in the evaluation of debris-flow runout (e.g., McDougall, 2017), we evaluated the success of the eight debris-flow inundation scenarios to predict the presence and extent of 124 debris-flow inundation zones from MMMs. Our assessment used contingency table statistics and standard receiver operator characteristic (ROC) analysis (Powers, 2011) to analyze the predictive success of our results. ROC analysis is based on statistics computed from a binary contingency table, whereby four categories of predictive success are identified: (1) true positive (TP) indicates successful prediction of an area susceptible to landslide runout, (2) false positive (FP) indicates false prediction of a susceptible area, (3) false negative (FN) indicates that a susceptible area was not identified, and (4) true negative (TN) indicates successful prediction of a stable area. We considered three measures of predictive success: (1) the true positive rate, TPR = TP (TP + FN); (2) the false positive rate, FPR = FP (FP + TN); and (3) the positive likelihood ratio, PLR = TPR FPR.
To select two scenarios for regional susceptibility maps, our ROC analysis used the intersection of (1) inundation zones from Hurricane Maria (MMMs) within 5 m of the channel thalweg and (2) the area encompassed by all inundation scenarios combined. This method evaluated a combination of inundation width and length but was deleteriously influenced by minor georeferencing discrepancies between the mapped landslides and lidar-derived DEM, as well as underestimation of runout length, where the terminus of debris-flow deposits could not be discerned in the aerial photographs due to uncertainty in debris-flow extent for flows entering drainage channels where floodwaters reworked deposits (Bessette-Kirton et al., 2019b; Baxstrom et al., 2021a, b; Einbund et al., 2021a, b). For the two selected scenarios, we also assessed TPR to determine success in identification of MMM inundation zones, a method that does not consider runout width or length.
5.1 Zones of mobility
Figure 6 shows landslide-affected areas (Einbund et al., 2021b) divided into the three zones of mobility.
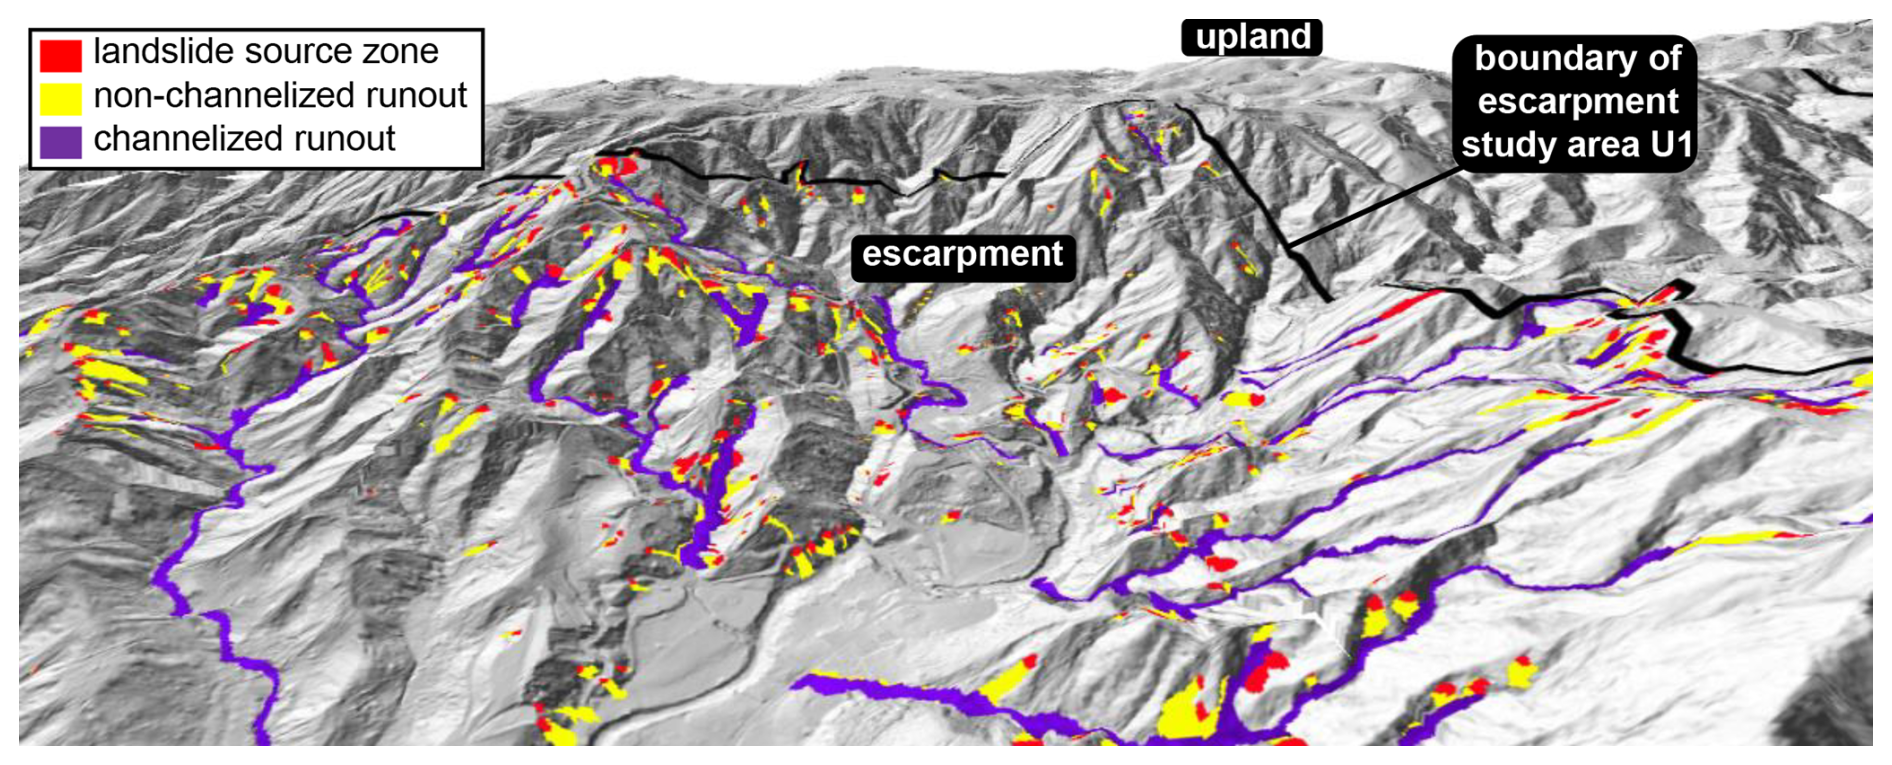
Figure 6Perspective view showing landslide-affected areas (Einbund et al., 2021b) for study area U1, on an escarpment in the Utuado municipality, Puerto Rico. We divided these mapped areas into three zones of mobility: (1) source zones (red areas), (2) non-channelized runout (yellow areas), and (3) channelized runout (purple areas). For reference, a dissected upland terrain, representative of topography in U3 and U4, is visible in the background. The approximate location at the center of the image is 18°16′40′′ N, 66°41′ 20′′ W.
5.2 Area affected by zones of mobility
We assessed the percentage of area affected by each mobility zone in the nine study areas (Table 4). The percentage of the study areas with mapped landslide source zones is shown as both the percentage of the study area susceptible to landslides, approximated as slopes > 30° (column 3), and the percentage of the entire study area (column 4). Although all study areas encompass some steep topography susceptible to landslides, escarpments (U1, U2) contain a majority of the study area susceptible, whereas dissected uplands (U3, U4) have lower relief and a smaller percentage of the study area susceptible to landslides (Table 4, column 2, and Fig. 7). Note that the other five study areas (U5, L1, L2, L3, N) contained a combination of escarpment and upland terrains.
Table 4Percentage of nine study areas in Puerto Rico susceptible to landslides (column 2) and affected by landslides during Hurricane Maria (column 7) divided into three zones of mobility: source zone (columns 3 and 4), non-channelized runout (column 5), and channelized runout (column 6). Column 7 shows the sum of these three zones. The percentage of the study areas with landslide source zones are shown as the percentage study area susceptible to landslides (column 3) and the percentage of the entire study area (column 4). Study areas are listed in order of increasing percentage of area susceptible to landslides (column 2).
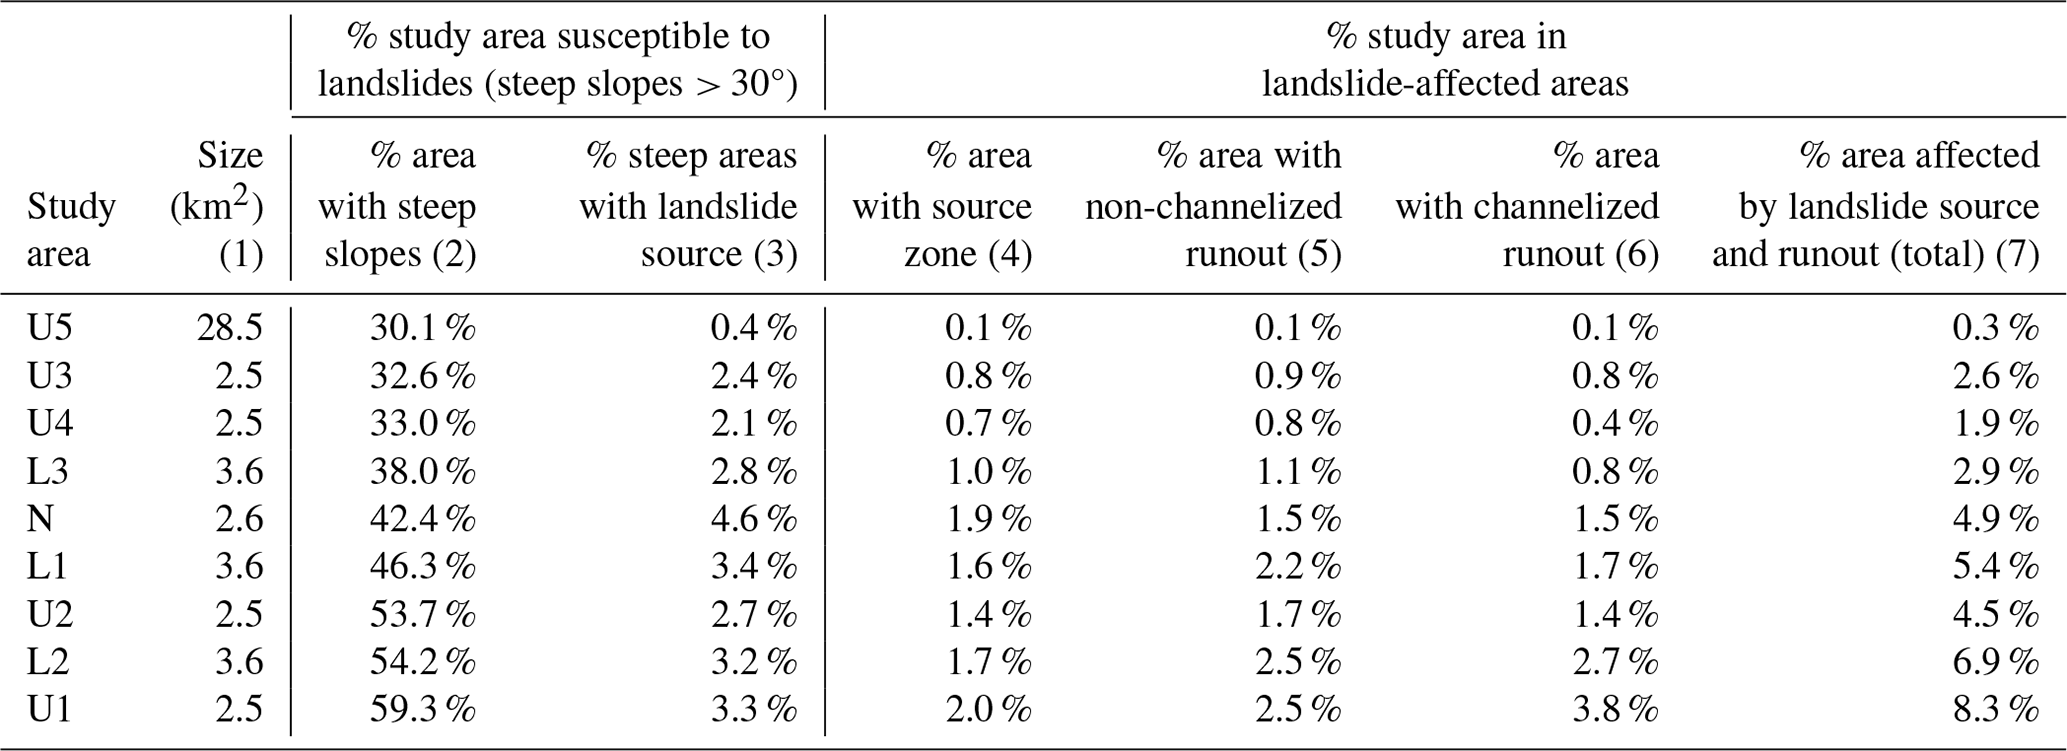
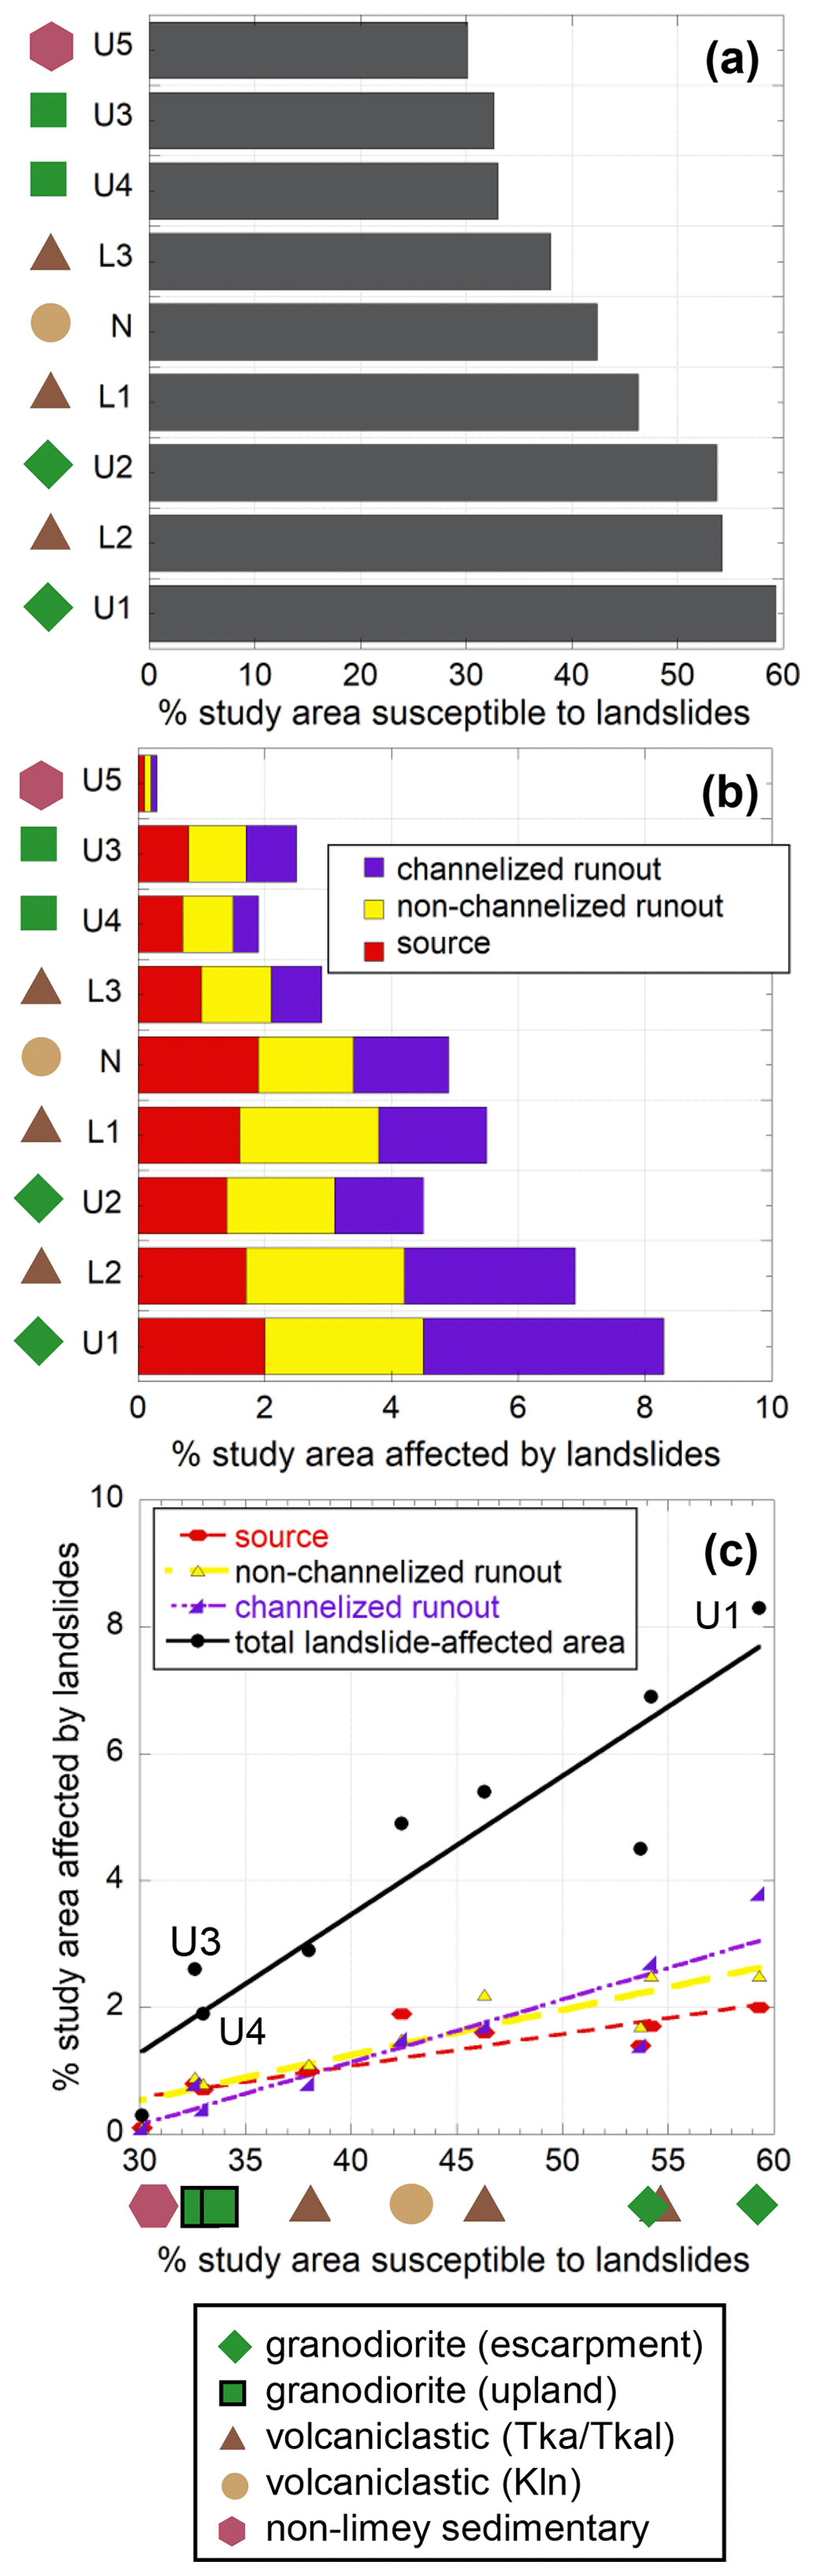
Figure 7Graphs showing areas affected by different zones of mobility, from Table 4. (a) Percentage of the nine individual study areas susceptible to landslides (column 2). (b) Percentage of individual study areas affected by Hurricane Maria landslides, divided into three mobility zones (columns 4, 5, 6). (c) Linear regressions of percentage of the study area susceptible to shallow landslides (column 2) with the percentage of the study area affected by (1) source zones (red line; column 4), (2) non-channelized runout (yellow line; column 5), (3) channelized runout (purple line; column 6), and (4) total landslide-affected areas (source, non-channelized and channelized runout zones; black line; column 7). Symbols represent geologic terranes and geomorphic terrains of study areas (Fig. 2 and Table 1).
The percentage of each study area affected by observed landslide source zones (Table 4, column 4) increases slightly with the percentage of the study area susceptible to landslides (column 2). In contrast, the percentage of susceptible area affected by landslide sources (column 3) does not consistently increase or decrease. For example, study area N has the median percentage of area susceptible to landslides but the highest (4.6 %) percentage of area affected by landslide sources.
To examine general trends in the area affected by landslides for the nine study areas, we show linear regression lines between the percentage of area susceptible to landslides with (1) source zones only, (2) non-channelized runout, (3) channelized runout, and (4) total landslide-affected area. The linear trends produce an increasing gradient of the line when progressing through the zones of mobility from upslope to downslope/downstream (source to non-channelized runout to channelized runout). The sum of all mobility zones (total landslide-affected area) shows the steepest line gradient, with a significant increase in the affected area for study areas with a high percentage of the study area in susceptible terrain (Fig. 7c), with the most gently sloping line for source areas (dashed red line) and steepest line for total landslide-affected area (solid black line). If all other contributing factors (e.g., rainfall distribution, material properties, and hydrologic conditions) were equal, the percentage of the susceptible area affected by landslide sources (Table 4, column 3) would be similar across all study areas, whereas the percentage of the entire area affected by landslide sources (Table 4, column 4) would increase proportionally to the area susceptible to landslides. In addition, if the area affected by landslide runout were directly proportional to the area affected by landslide sources, the slope of the regression lines would be equal. However, in comparison to the relation with source zones only (red line), the percentage of the total landslide-affected area (black line) increases at a greater rate than the percentage of the area susceptible to landslides. In addition, the ratio between landslide-affected area and landslide source areas only shows the largest difference for study areas with the same underlying geologic terrane (Fig. 7c, U1 versus U3/U4), where strength and hydrologic properties would likely be similar.
5.3 Statistical distribution of topographic slopes within mobility zones
We examined the statistical distributions and extracted percentile statistics (P10, P25, P50, P75, and P90) (Fig. 8) for slopes in landslide source zones, non-channelized runout (predominantly runout on hillslopes), and channelized runout zones (Table S1). The median (P50) represents typical slopes of Hurricane Maria-landslide-affected areas, whereas P10 represents characteristics of higher-mobility landslides, with the ability to travel further downstream to areas of more gently sloping topography. Overall, these statistical distributions of slopes for the three zones show a progression of decreasing slopes along the travel path of landslides from Hurricane Maria in both escarpment and upland terrains (Fig. 8). Additional details of these statistics are provided in the Supplement (Sect. S2.2).
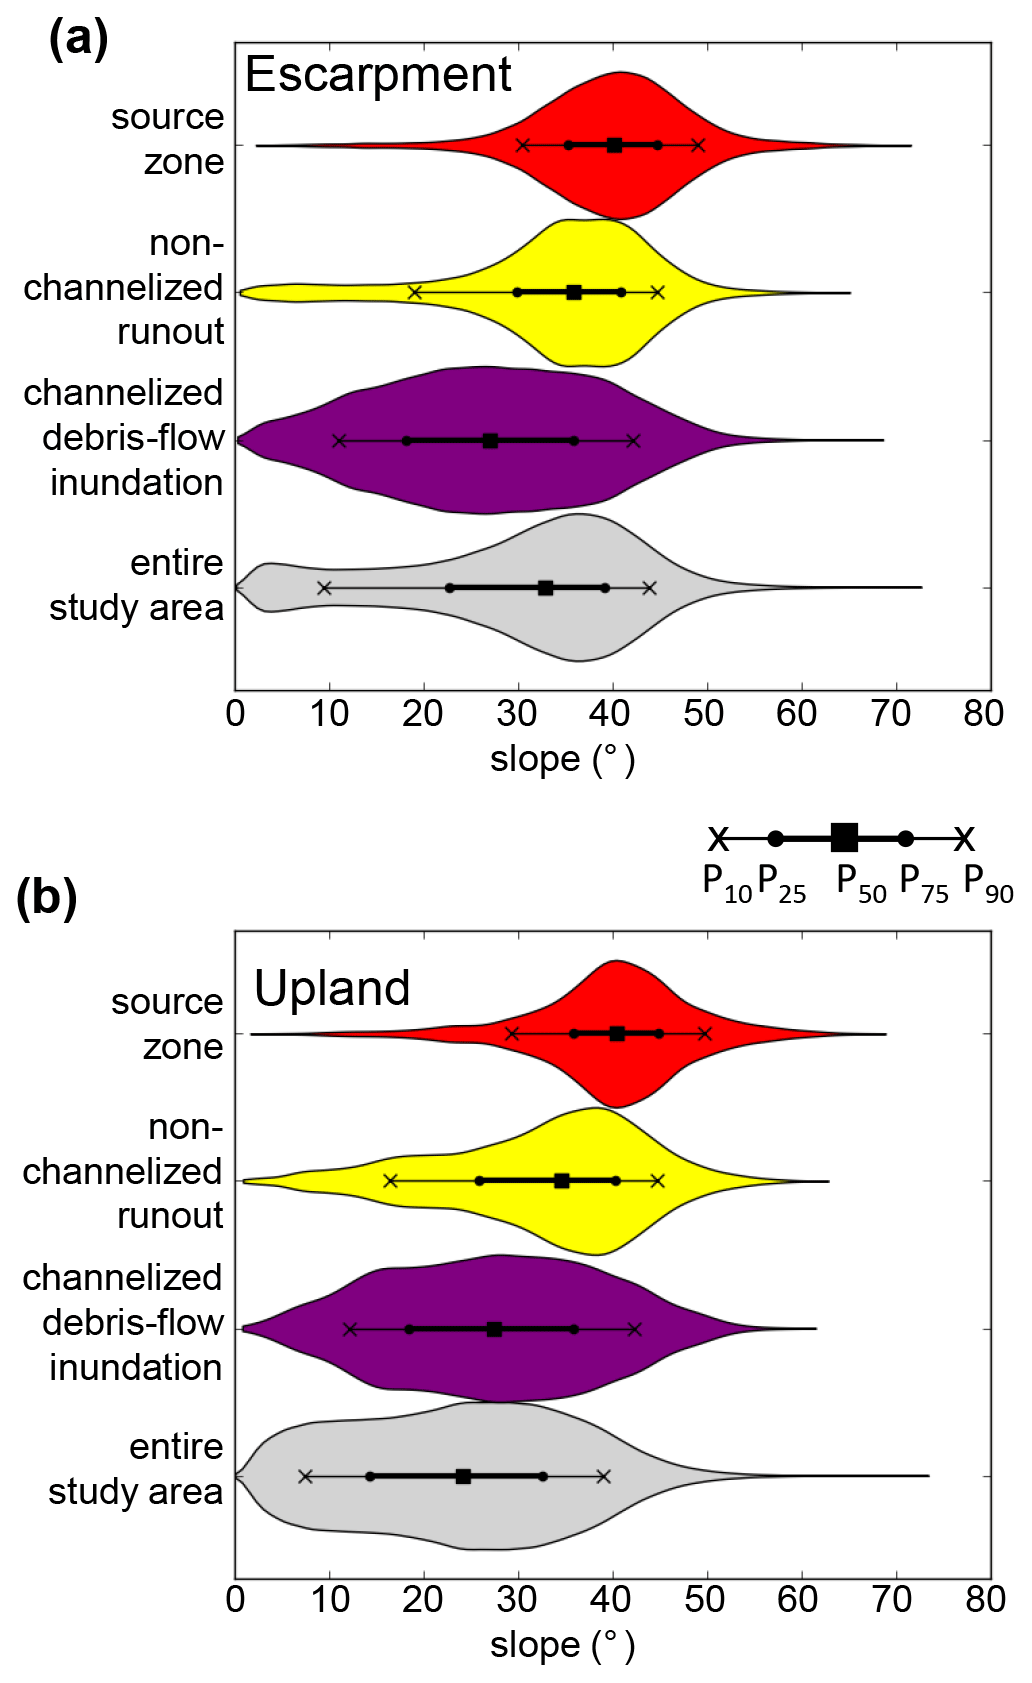
Figure 8Violin plots showing statistical distributions of slopes in the three zones of landslide mobility and in the entire study area for (a) study area U1, a steep escarpment region, and (b) study area U3, a dissected upland terrain. Both U1 and U3 are in a granitoid geologic terrane in Utuado. Symbols (as defined in the legend) plotted within the violin plots show the median (P50), interquartile range (P25 to P75), P10, and P90.
5.4 Identification and characterization of channelized debris flows – Maria's most mobile landslides (MMMs)
We applied our two criteria to extract MMMs from the published landslide inventories in the nine study areas (Sect. 4.1.1). Figure 9 highlights landslides with > 40 % of runout area located in close proximity (5 m) to a channel, including some non-channelized, lower-mobility landslides (Fig. 9b). Figure 10 highlights MMMs in the context of the two criteria.
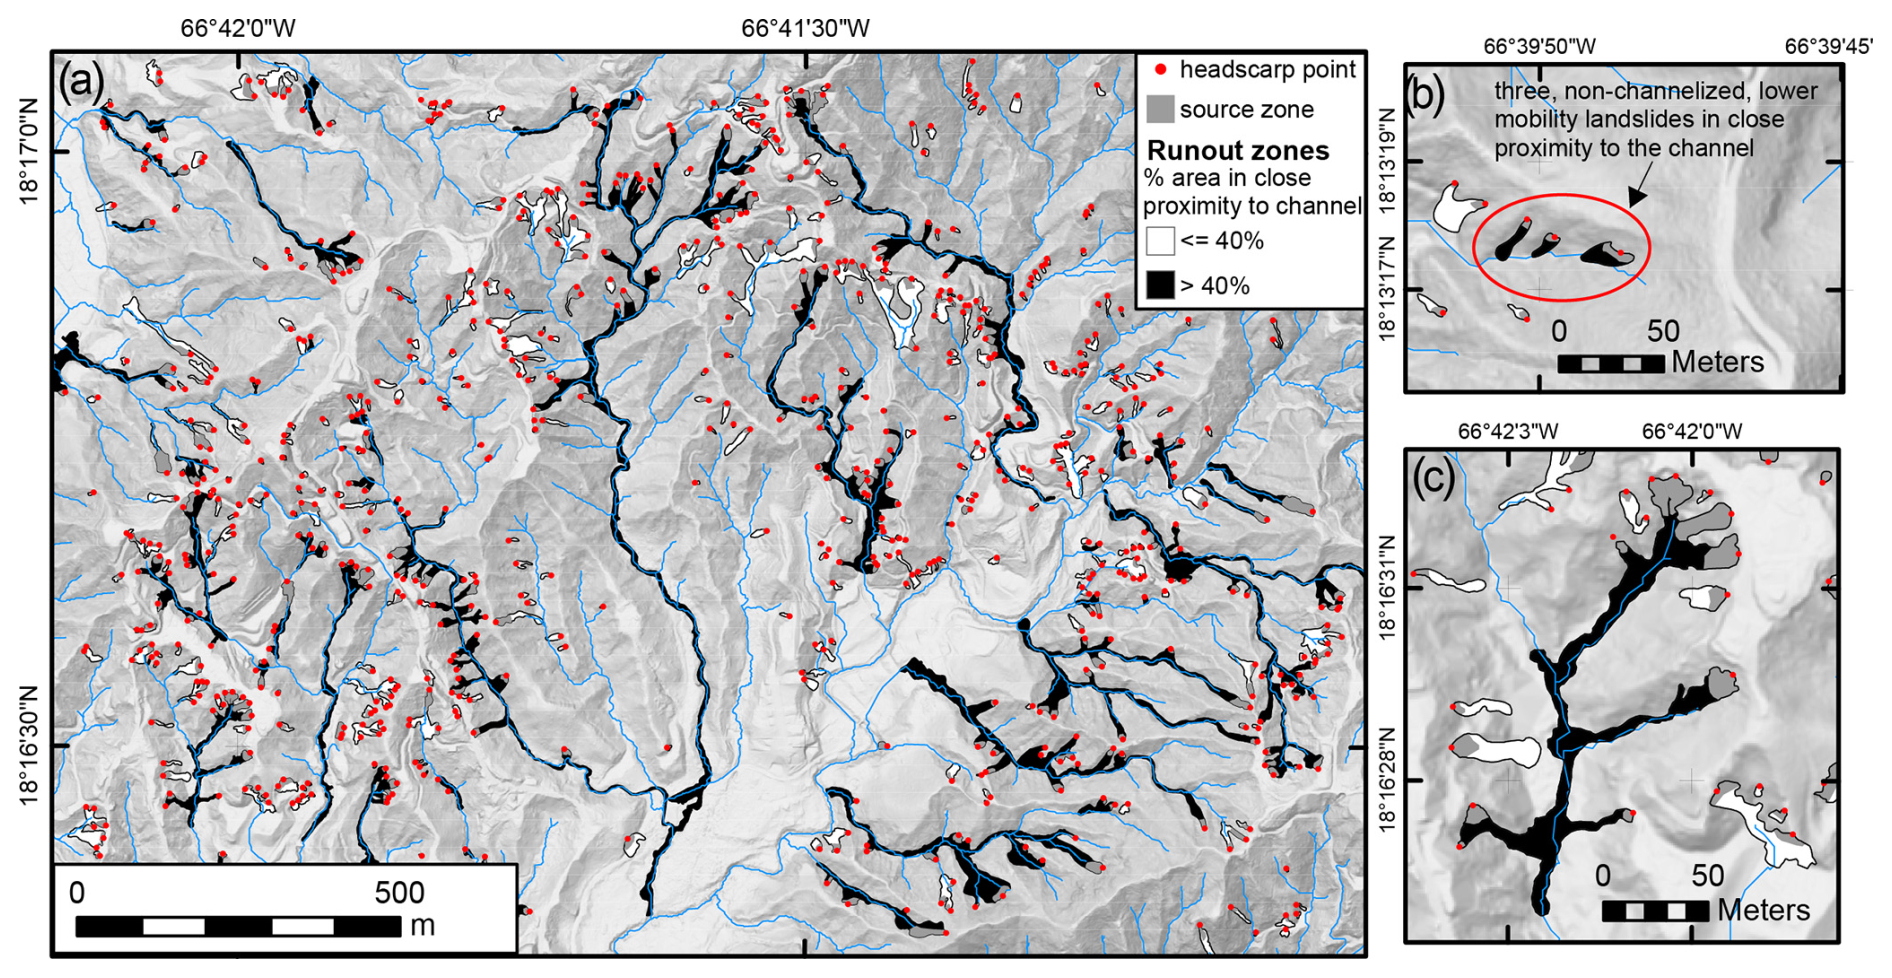
Figure 9Mapped landslides, highlighting some of Hurricane Maria's most mobile debris flows, Utuado, Puerto Rico. (a) Map view of study area U1 showing 761 mapped landslide headscarp points (red points), associated source zones (dark gray), and 391 runout zones (Bessette-Kirton et al., 2019b; Einbund et al., 2021b). Runout zones with > 40 % runout area located in or in close proximity to the channel are shown in black and those with < 40 % in white. (b) Zoomed-in view of study area U4, showing lower-mobility landslides with short runout length, identified as having > 40 % runout length in the channel. (c) Zoomed-in view illustrating multiple landslide sources coalescing into a single debris-flow runout zone.
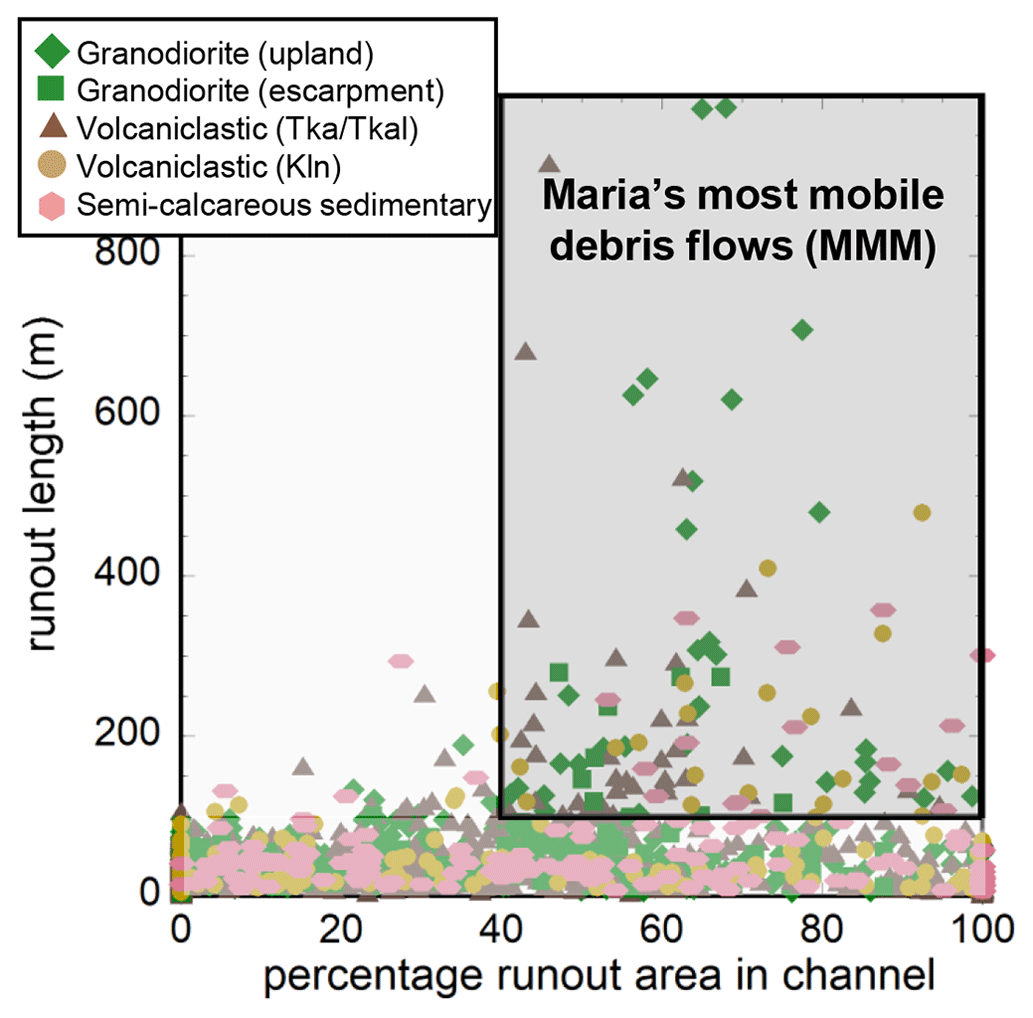
Figure 10Runout length and percentage of runout area in designated channels, for runout zones in all study areas, grouped by geologic terrane. The gray box highlights MMM debris flows from Hurricane Maria.
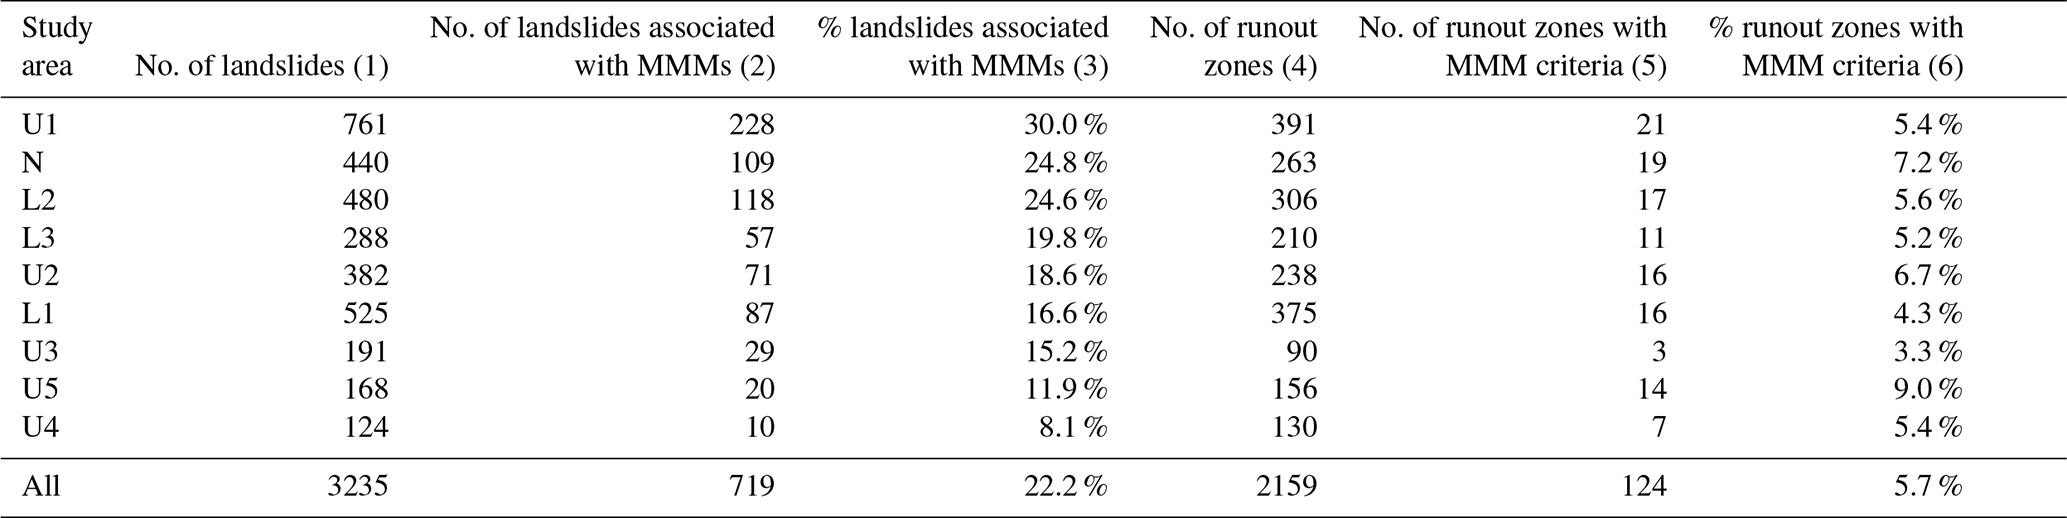
Table 5 summarizes the quantities and percentages of (1) landslide source areas (landslides) associated with MMMs (columns 1, 2, and 3) and (2) runout zones meeting the MMM criteria (columns 4, 5, and 6), where the influence of coalescence (Fig. 9c) results in multiple landslides contributing to a single runout path. Here, the runout zones may contain both non-channelized and channelized runout. We found that the percentage of landslide source areas associated with MMMs ranged from 8.1 % to 30 % (column 3) in different study areas. The study areas with the three highest percentages, U1, N, and L2, are located in three different geologic terranes; here, 30%, 24.8 %, and 24.6 % of landslides met the MMM criteria, respectively. The percentage of runout zones meeting the criteria for MMMs ranged from 3.3 % to 9.0 % (column 6), with the highest percentages found in study areas U5, N, and U2, also associated with three different geologic terranes; in this case the percentage of runout zones was 9.0 %, 7.2 %, and 6.7 %, respectively. Study areas in other geologic terranes (L2, U1, U4, and L3) had slightly smaller percentages (5.2 % to 5.6 %) of runout zones identified as MMMs; L1 and U3 had the smallest values, with 4.3 % and 3.3 % of runout zones identified as MMMs. Our results highlight several observations for channelized debris flows triggered by Hurricane Maria: (1) channelized debris flows comprise a minority of the landslides; (2) all geomorphic terrains and geologic terranes have some channelized debris flows; (3) escarpment terrains have a higher percentage of landslides associated with the MMM criteria, in comparison with upland terrains; (4) the percentage of runout zones does not show any consistent trends; and (5) there is no distinct pattern related to geologic terrane. Areas with a high landslide density, such as some of the escarpment terrains, may have many landslides in close proximity, thereby increasing their potential to coalesce in the nearest drainage. Given the influence of coalescence, the percentage of landslides and percentage of runout zones (Table 5, columns 3 and 6) did not correlate.
Table 5Number and percentage of landslides and runout zones meeting the most-mobile-landslide (MMM) criteria for nine study areas, sorted by the percentage of landslides associated with MMMs.
Our results from 124 debris-flow inundation zones (Table 6) show that MMMs typically (P50) occur in stream reaches with stream order ≤ 2; all MMMs occur in stream reaches with stream order ≤5. MMMs have mean stream slopes of about 5 to 16°, mean planform curvature of 0.03 m−1, and a mean Psrc of 58 % to 85 %. Less common, but more extreme, endmembers of MMMs have a stream order of 4 or 5, stream slope of 0.2 to 7.0°, planform curvature from a smoothed DEM of 0.0 to 0.02 m−1, and Psrc of 9 % to 33 %. These results provide criteria to define debris-flow growth zones for inundation scenarios.
Table 6Percentiles of the maximum Strahler stream order, mean stream slope, mean planform curvature, and mean percentage of the contributing area susceptible to shallow landslides (Psrc) for debris-flow inundation zones. Values are based on the mean or maximum (for stream order only) value along the runout path of MMM debris flows from Hurricane Maria.
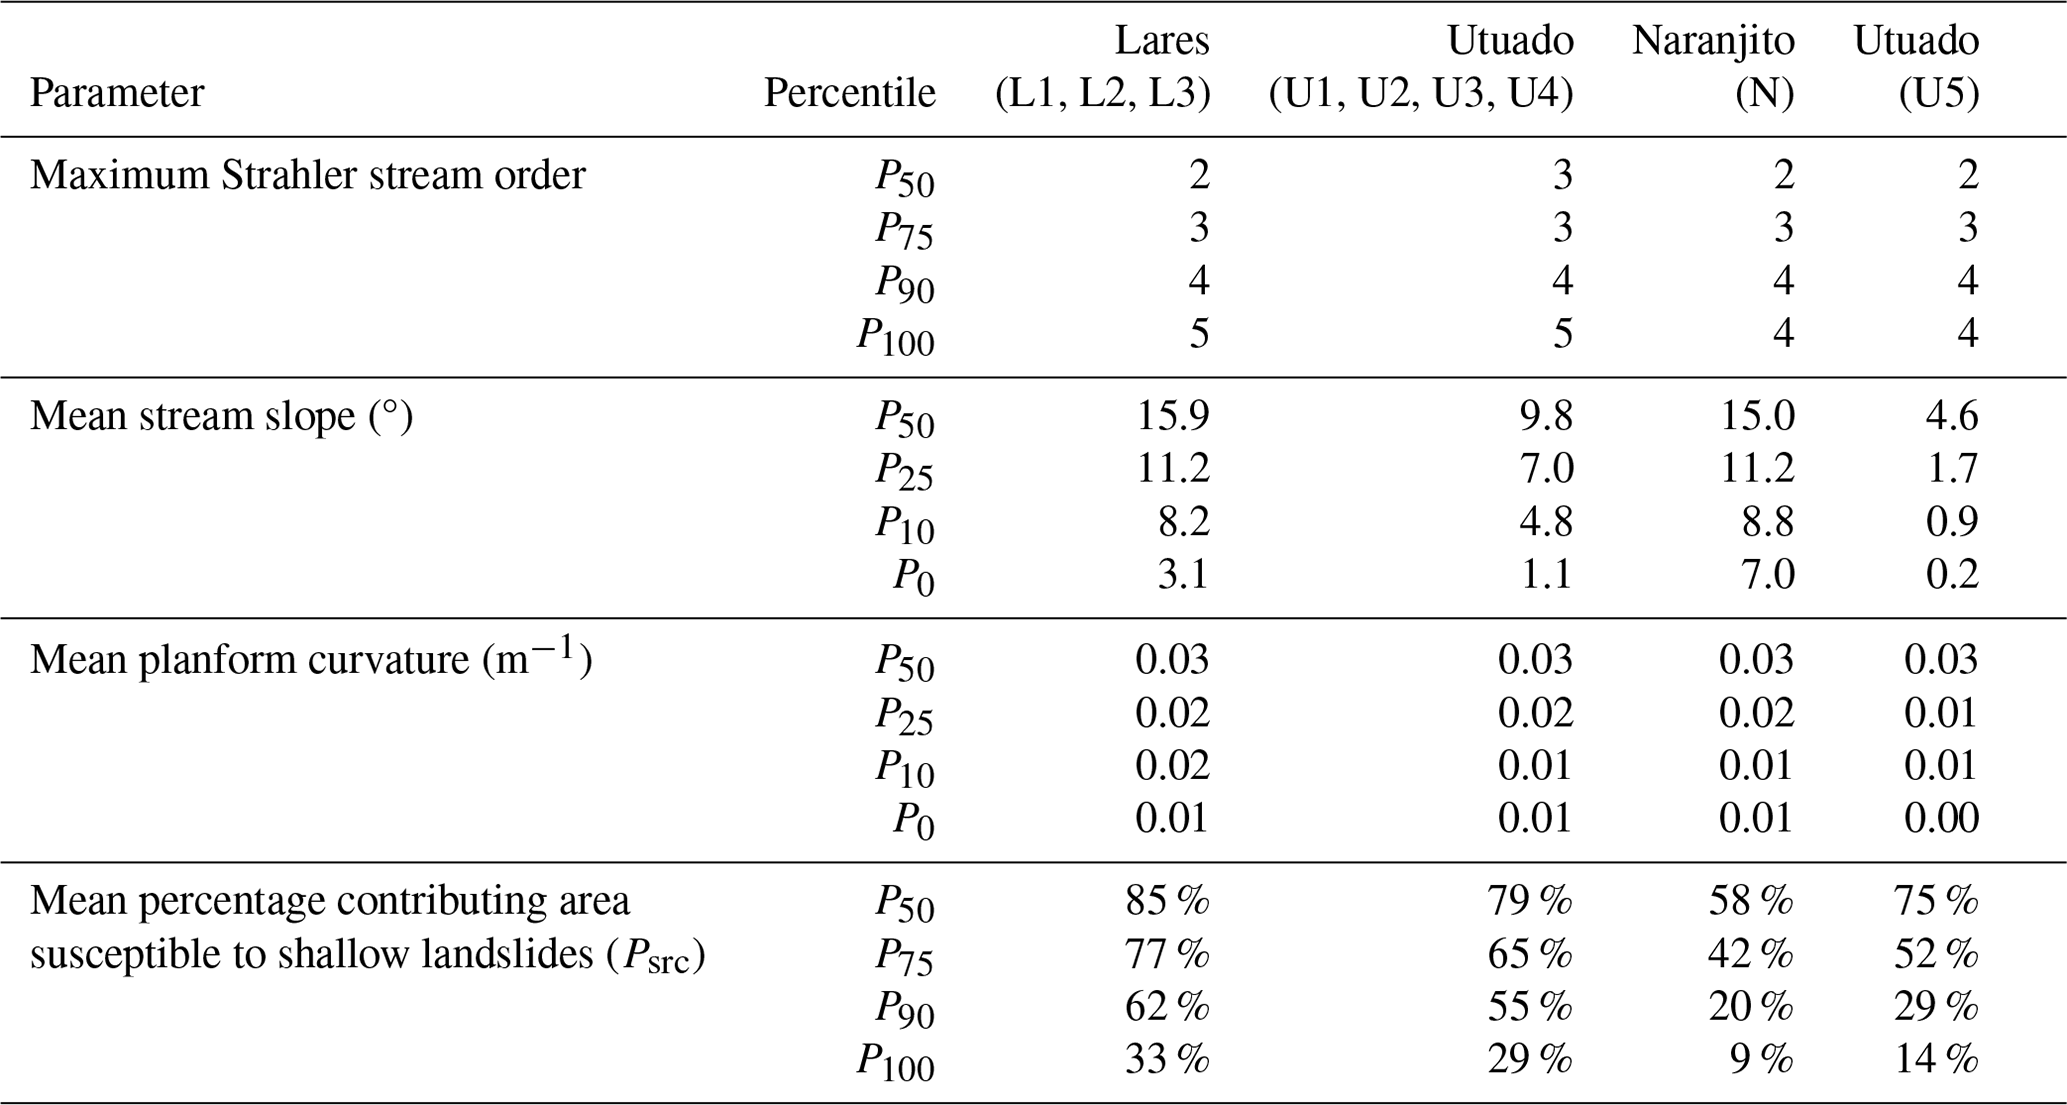
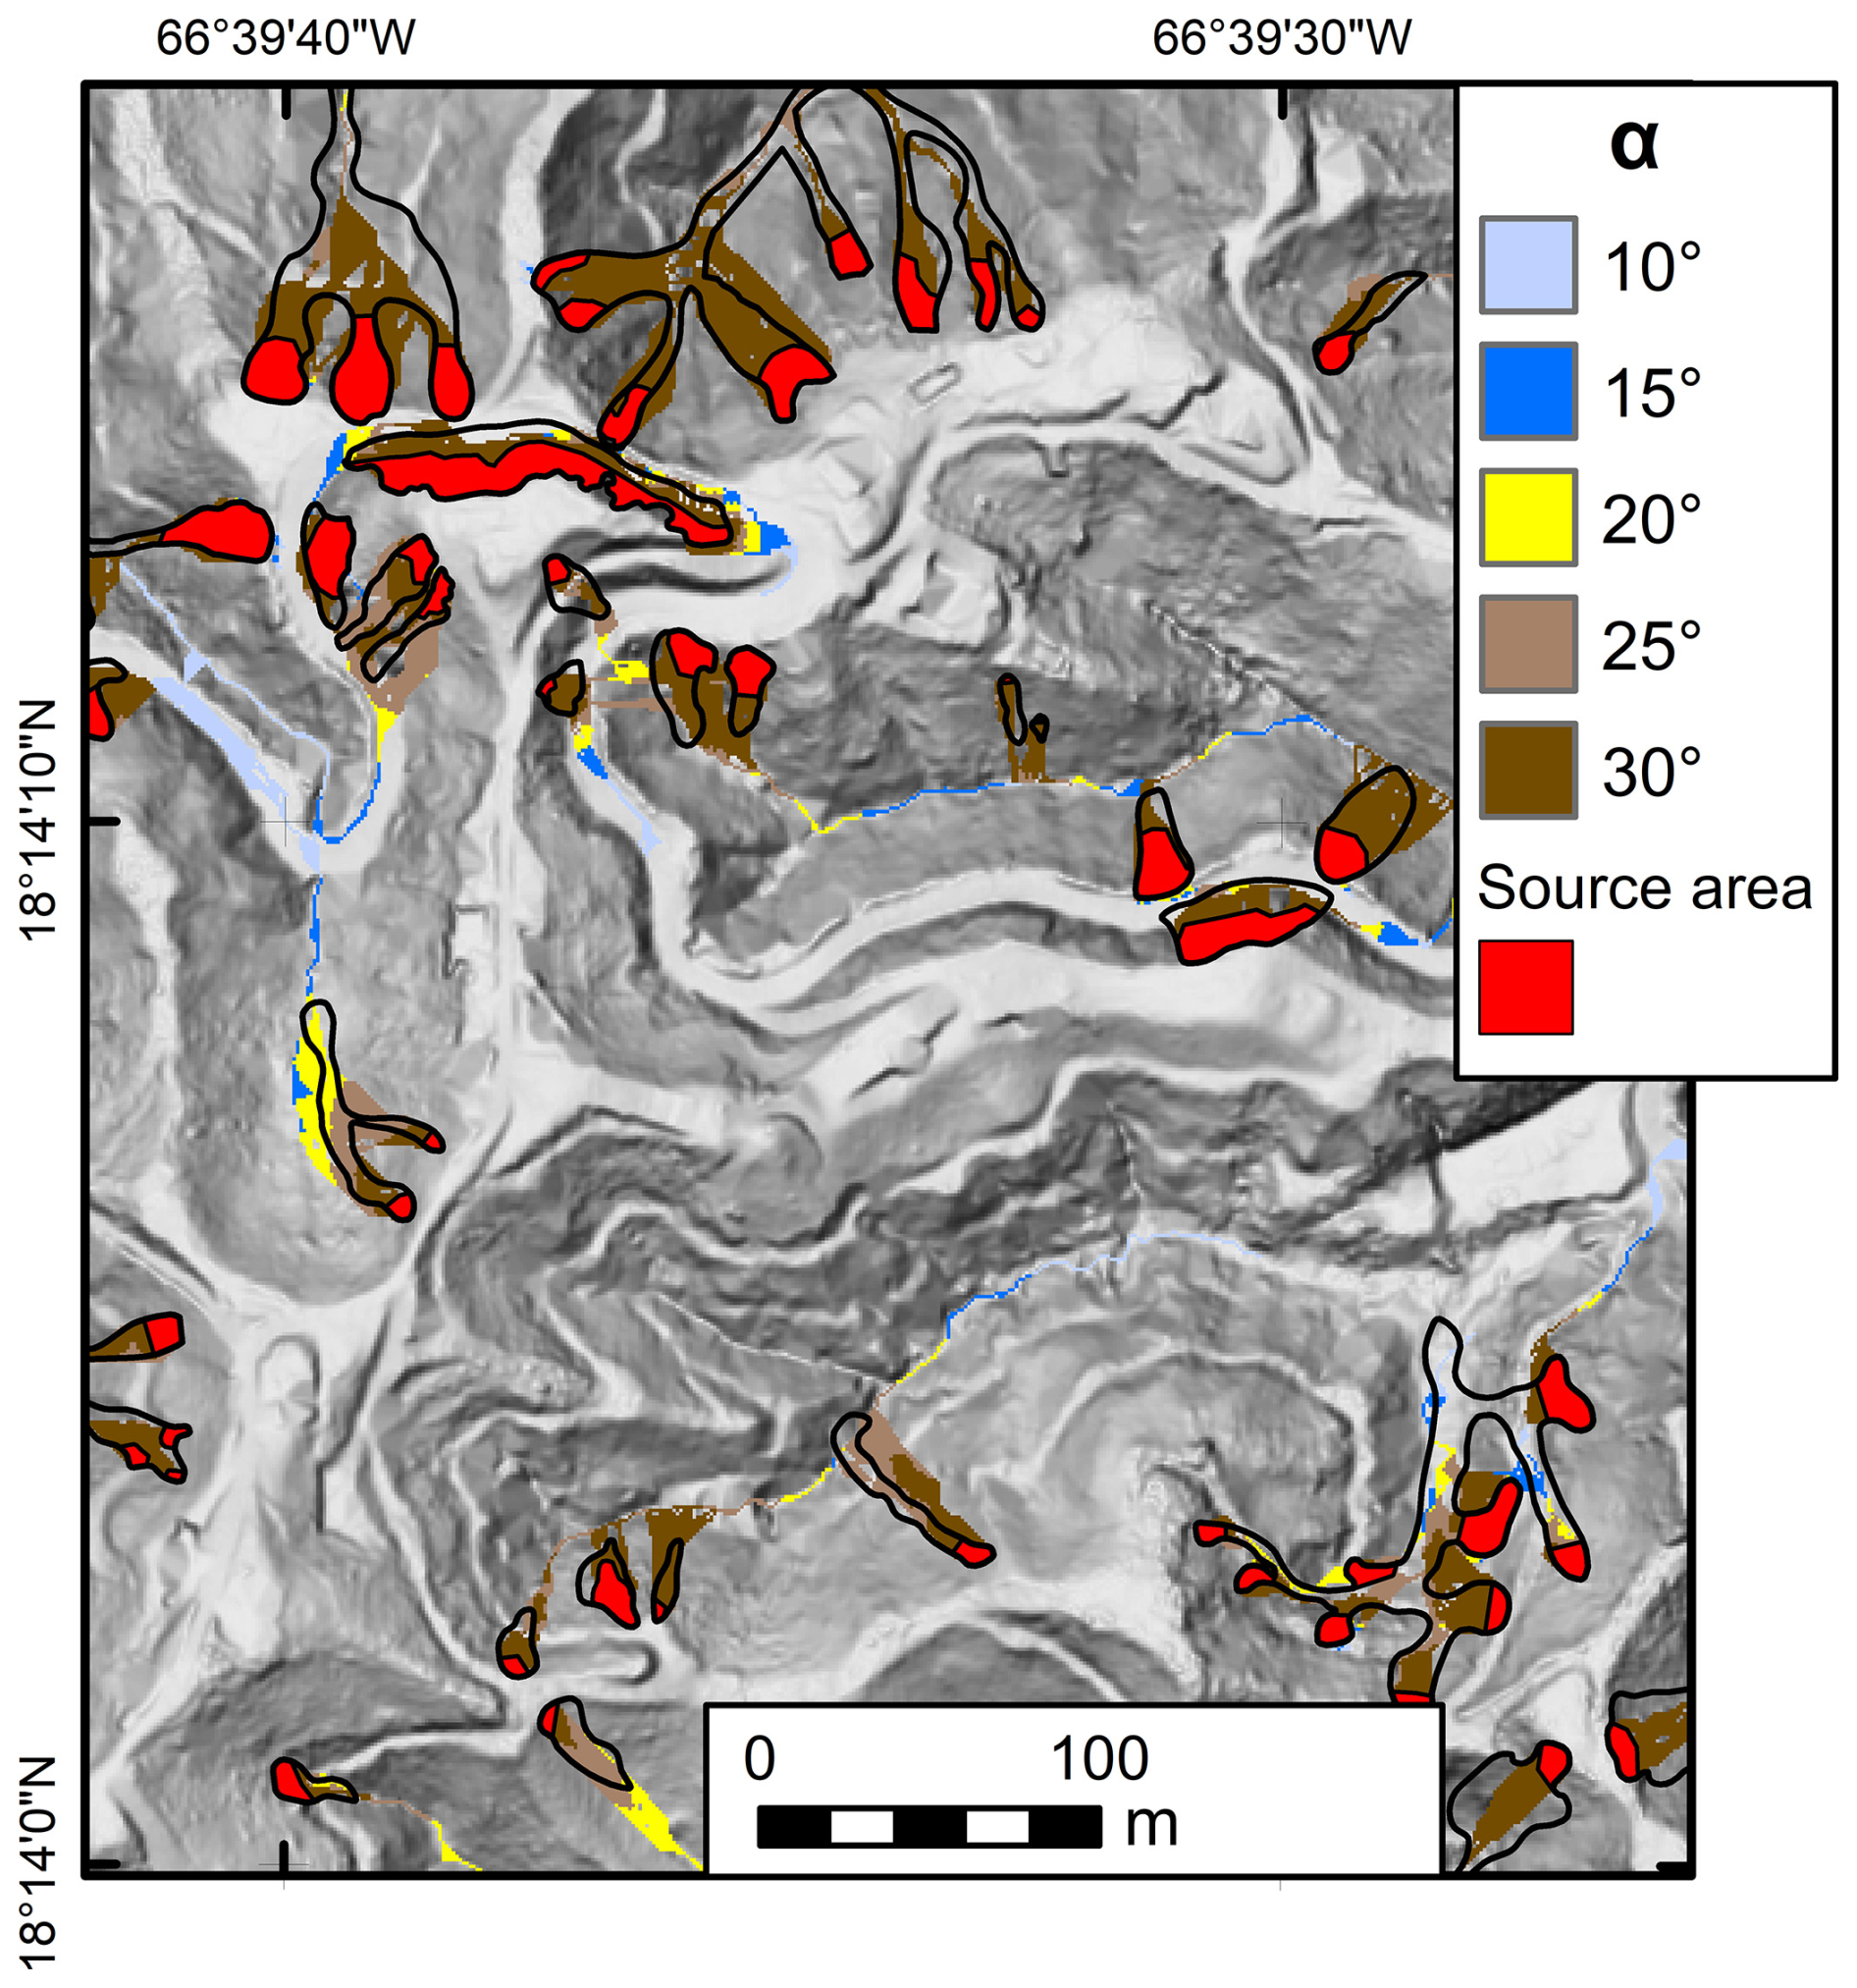
Figure 11 runout results for a range of α values (10, 15, 20, 25, and 30°) in a section of U2, an escarpment study area in the granitoid terrane, Utuado. Hurricane Maria landslide source areas from Einbund et al. (2021b).
6.1 runout scenarios
For the mapped study areas, consisting predominantly of highly dissected topography, steep slopes, and narrow valleys, even large changes in α did not greatly modify zones of runout. Figure 11 illustrates where there is some minimal additional runout area with a substantial decrease in the angle of reach, α, from 30 to 20°. Significant areas on the hillslope are encompassed by runout zones in the range of 25 to 30° (Fig. 11, brown zones) derived from Hurricane Maria source areas, whereas, when α is < 20°, the affected areas (Fig. 11, blue zones) are located within narrow channel bottoms. A decrease to 20° captures additional area within the non-channelized runout zones of mapped landslides without a significant increase in areas identified as susceptible (added yellow areas). The area shown in Fig. 11 is representative of the majority of areas where landslide inventories from the Hurricane Maria event were available. Making an appropriate choice of α for regional maps is controlled by the slope angle of topography upslope of channels, quantified in our analysis of slopes in mapped non-channelized runout zones (Table S1, columns 7 and 8). Our analysis of slopes in these zones indicates a wide range of potential α values. To eliminate the potential for gaps between estimated non-channelized runout areas and channelized debris-flow inundation areas, we selected α to be equal to 20° for our susceptibility maps.
6.2 Debris-flow inundation scenarios
Our evaluation of eight debris-flow inundation scenarios (Fig. 5) indicates that modification of the parameters defining debris-flow growth zones can have a significant influence on the pattern and extent of inundation. For example, pink and purple zones in Fig. 12a illustrate the inundation area where debris-flow growth zones extended lower in the drainage network, as controlled by a larger value for the maximum stream order and smaller value for the minimum stream slope. The maximum volume (Vmax=1000 m3) and growth factor (c1=0.01 m3 m−2) are held constant in scenarios A-1k, B-1k, C-1k, and E-1k. In the case of relatively wide basins and multiple incoming tributaries, more generous growth zones create greater runout lengths (Fig. 12a). In the same topography, increased growth factors with a fixed growth zone also create longer and wider inundation zones (Fig. 12b).
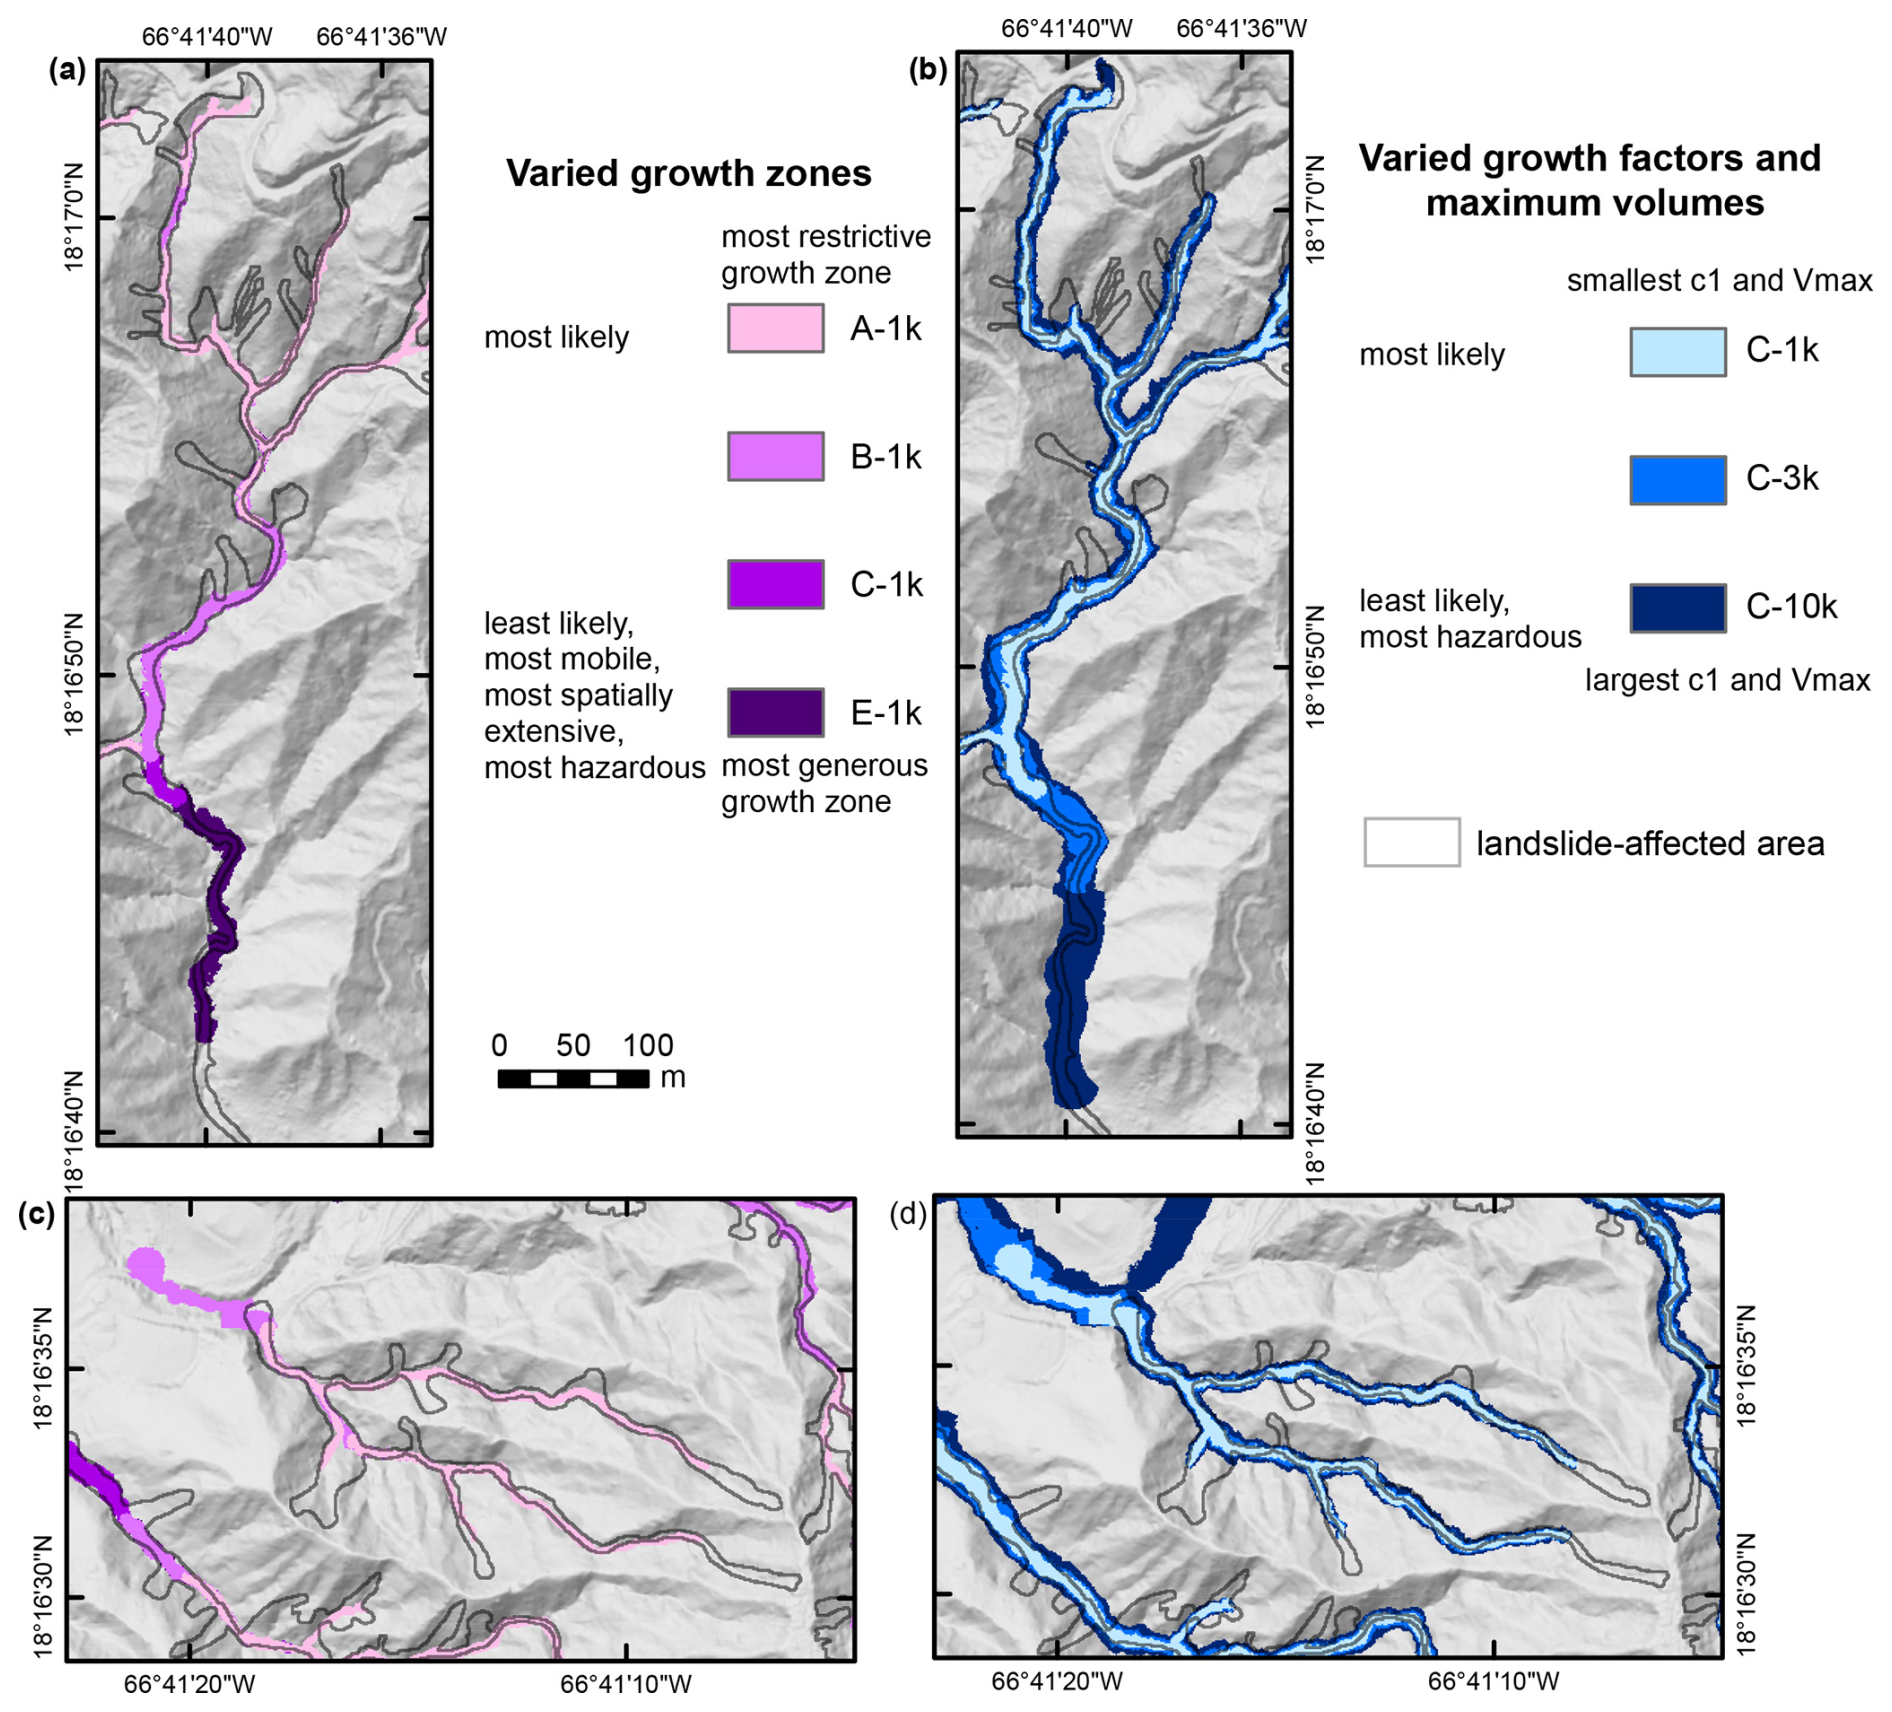
Figure 12Results from debris-flow inundation scenarios with various growth controls in different topographies in Puerto Rico. (a) Wider topography with various growth zones. A-1k, B-1k, C-1k, and E-1k show progressively greater inundation lengths with more generous growth zones. (b) Wider topography with increasing growth factors and maximum volumes. C-1k, C-3k, and C-10k show progressively wider and longer inundation lengths with increased growth factors and maximum volumes (Vmax). (c) Narrower basin with fewer incoming tributaries and various growth zones. Here, B-1k, C-1k, and E-1k produce identical results; only A-1k differs. (d) Narrower basin with increasing growth factors. Regardless of basin shape, C-1k, C-3k, and C-10k produce progressively wider and longer inundation lengths. For comparison, black outlines are mapped landslide-affected areas from Hurricane Maria (Einbund et al., 2021b). The scale bar is the same for all panels.
In contrast, narrower drainage basins with few contributing tributaries that abruptly exit steep mountainous terrain into a wide, flat valley over a short distance exhibited no difference between results with highly variable definitions of growth zones. Figure 12c demonstrates this situation, where scenarios B-1k, C-1k, and E-1k produce identical inundation results. Scenarios C-1k, C-3k, and C-10k, with increasing growth factors (c1 of 0.01, 0.05, and 0.2 m3 m−2, respectively), and Vmax (1000, 3000, and 10 000 m3, respectively) produce progressively wider and longer runout length regardless of basin shape (Figs. 12c, d), where increased c1 produces wider inundation zones higher in the drainage network. Increased Vmax can produce both wider and longer inundation zones. In these scenarios, debris-flow growth will always be halted when the maximum stream order or minimum stream slope criteria for a given scenario are achieved, yielding a volume proportional to the upslope area susceptible to landsliding. Therefore, growth zones that terminate before Vmax is achieved will have smaller areas of inundation.
6.3 Evaluation of predictive success for debris-flow inundation scenarios
Figure 13 shows our ROC analysis for the eight scenarios, evaluated for all MMMs. The series of solid gray lines show positive likelihood ratios (PLR = TPR FPR), where higher PLR indicates a higher likelihood of correct prediction. Dashed gray lines show the distance from the upper-left corner, the location of perfect classification. The false positive rate (FPR) may be overestimated in cases where the actual terminus of debris-flow deposits could not be identified.
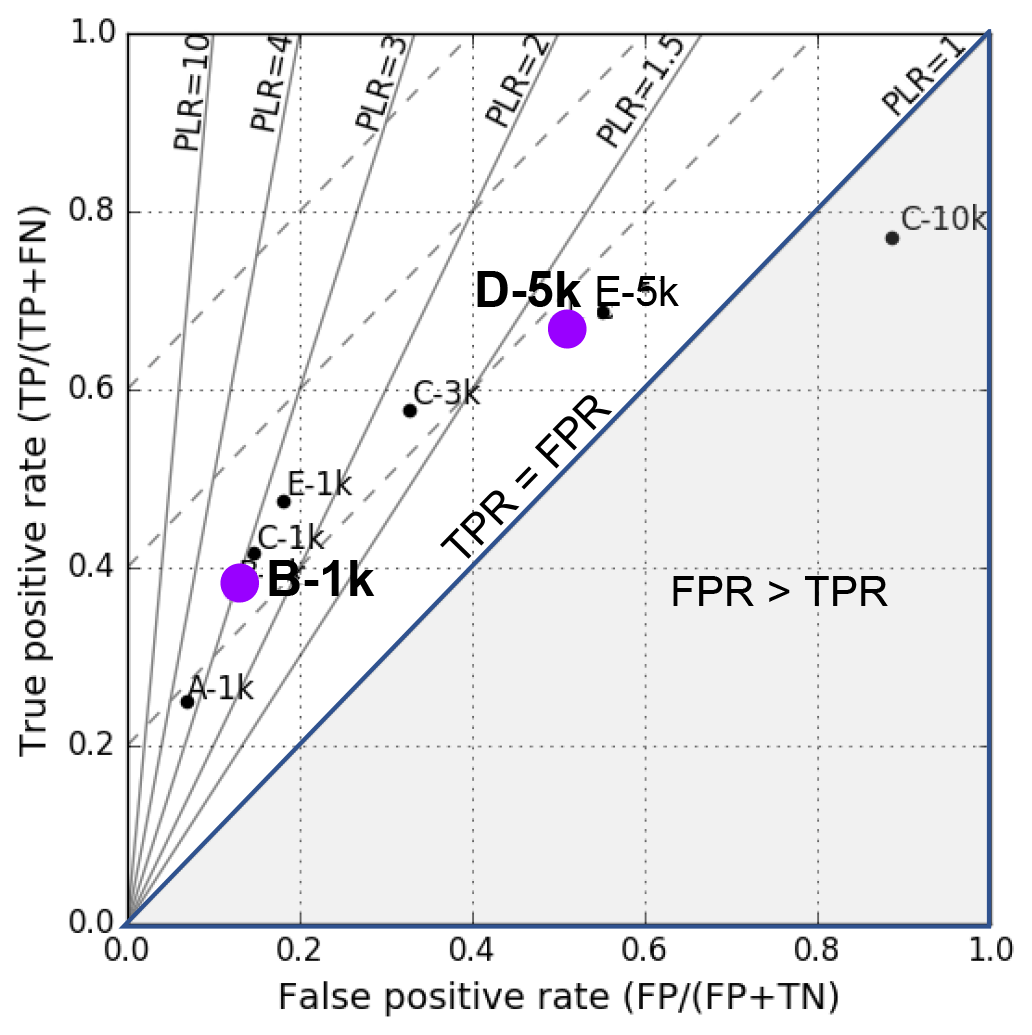
Figure 13Receiver operator characteristic (ROC) plot for eight debris-flow inundation scenarios evaluated for nine study areas affected by MMMs during Hurricane Maria. The two scenarios selected for regional susceptibility maps are highlighted in purple. Scenario B-1k is a likely scenario, and scenario D-5k is a less likely, but more hazardous, scenario.
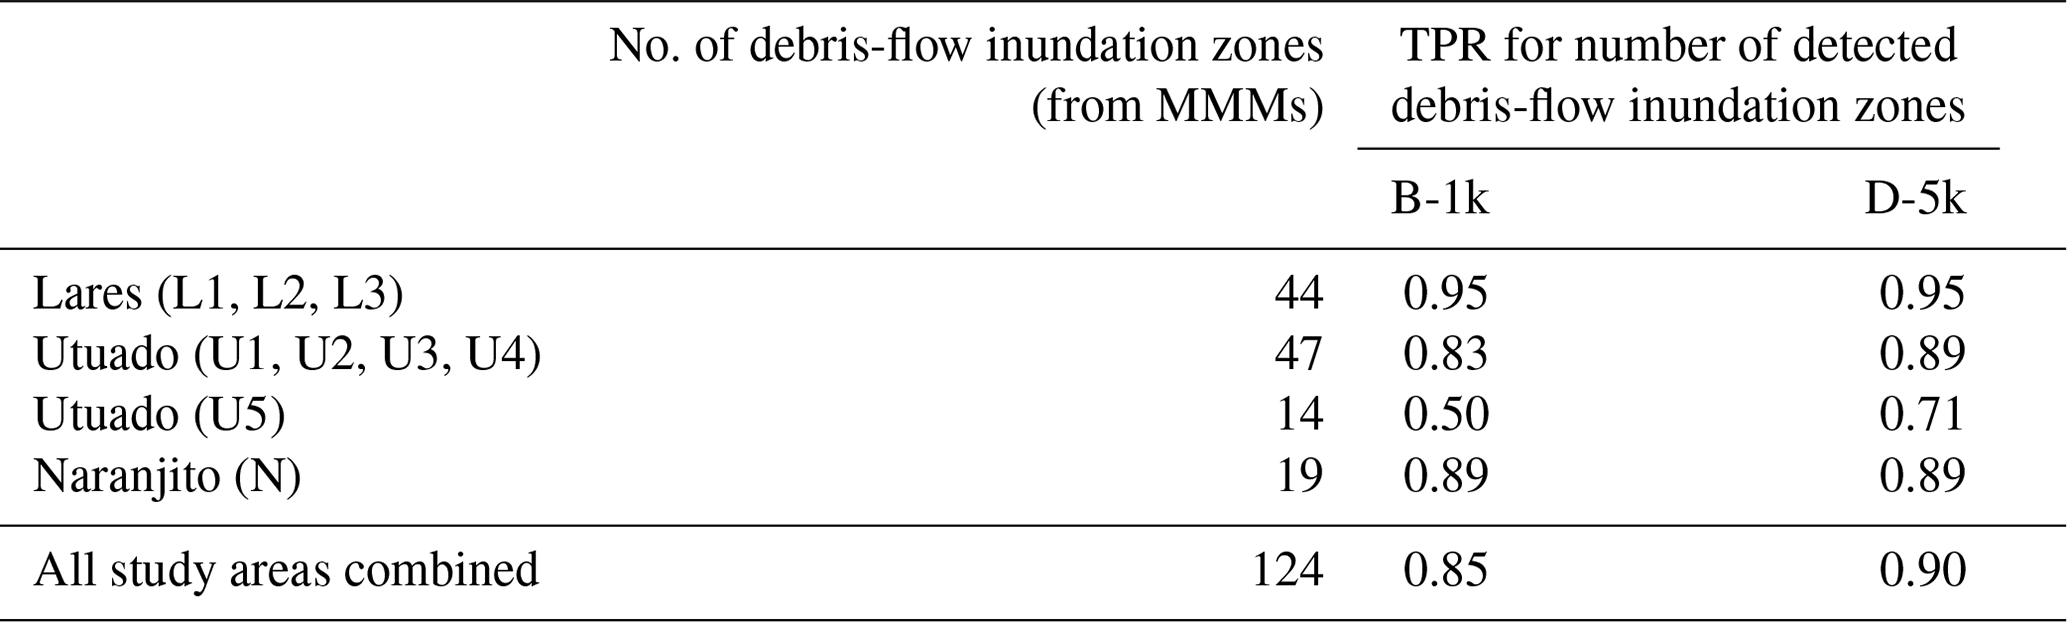
For our regional susceptibility maps, we first selected a scenario (B-1k) with a relatively high value for PLR (Fig. 13, PLR ≈ 3). This scenario, B-1k, defines zones of extremely high susceptibility to debris-flow inundation. Scenario B-1k minimizes over-prediction, as characterized by relatively low FPR and high PLR. TPR based on the area affected is ∼0.38, whereas examination of the number of debris-flow inundation runout zones provides more impressive TPR values, with an overall TPR for all study areas of 85 % (Table 7). TPR was lowest for U5, the largest study area with a very low percentage of area affected by landslides (Table 4).
To aid selection of a more extensive scenario, we examined scenarios in map view, in combination with a ROC plot (Fig. 13). We selected D-5k because it provides an increased true positive rate (TPR) before the significant decrease in the positive likelihood ratio (PLR) seen with scenario E-5k. Scenario D-5k identified 90 % (TPR = 0.90) of debris-flow runout zones (Table 7). This TPR of 0.90 is equal to the TPR selected for source-area susceptibility thresholds (Baum et al., 2024). Scenario D-5k defines a more hazardous, but less likely, scenario representative of the area affected in the most severely impacted drainage basins during Hurricane Maria.
Table 7Number of debris-flow inundation zones (MMMs) and TPR for the two selected susceptibility scenarios. MMMs are grouped by geologic terrane in Puerto Rico.
6.4 Susceptibility maps portraying three mobility zones
We applied our linked-model approach to create regional susceptibility maps delineating potential locations of landslide initiation, downslope runout, and debris-flow inundation during prolonged, intense rainfall, for Lares, Naranjito, and Utuado municipalities, encompassing a total area of 560 km2. Potential source areas (initiation) from shallow landslide susceptibility modeling (Baum et al., 2024) were used to identify 20° runout zones and upslope contributing source areas for volume estimations (Eq. 4) used in debris-flow inundation scenarios B-1k and D-5k (Fig. 5).
In our regional susceptibility maps (e.g., Fig. 14), debris-flow inundation areas (purple zones) overlie all other zones and may conceal underlying source (red) and runout zones (yellow); non-channelized runout zones () underlie all other colors in the perspective view. Debris-flow inundation zones are shown in two shades of purple, where dark purple is scenario B-1k, highlighting inundation in upper parts of the drainage network and light purple is scenario D-5k. In steep, dissected escarpment terrains, such as U1, most of the topography meets the criteria for source zones, resulting in substantial overlap between areas susceptible to shallow landslides and runout zones.
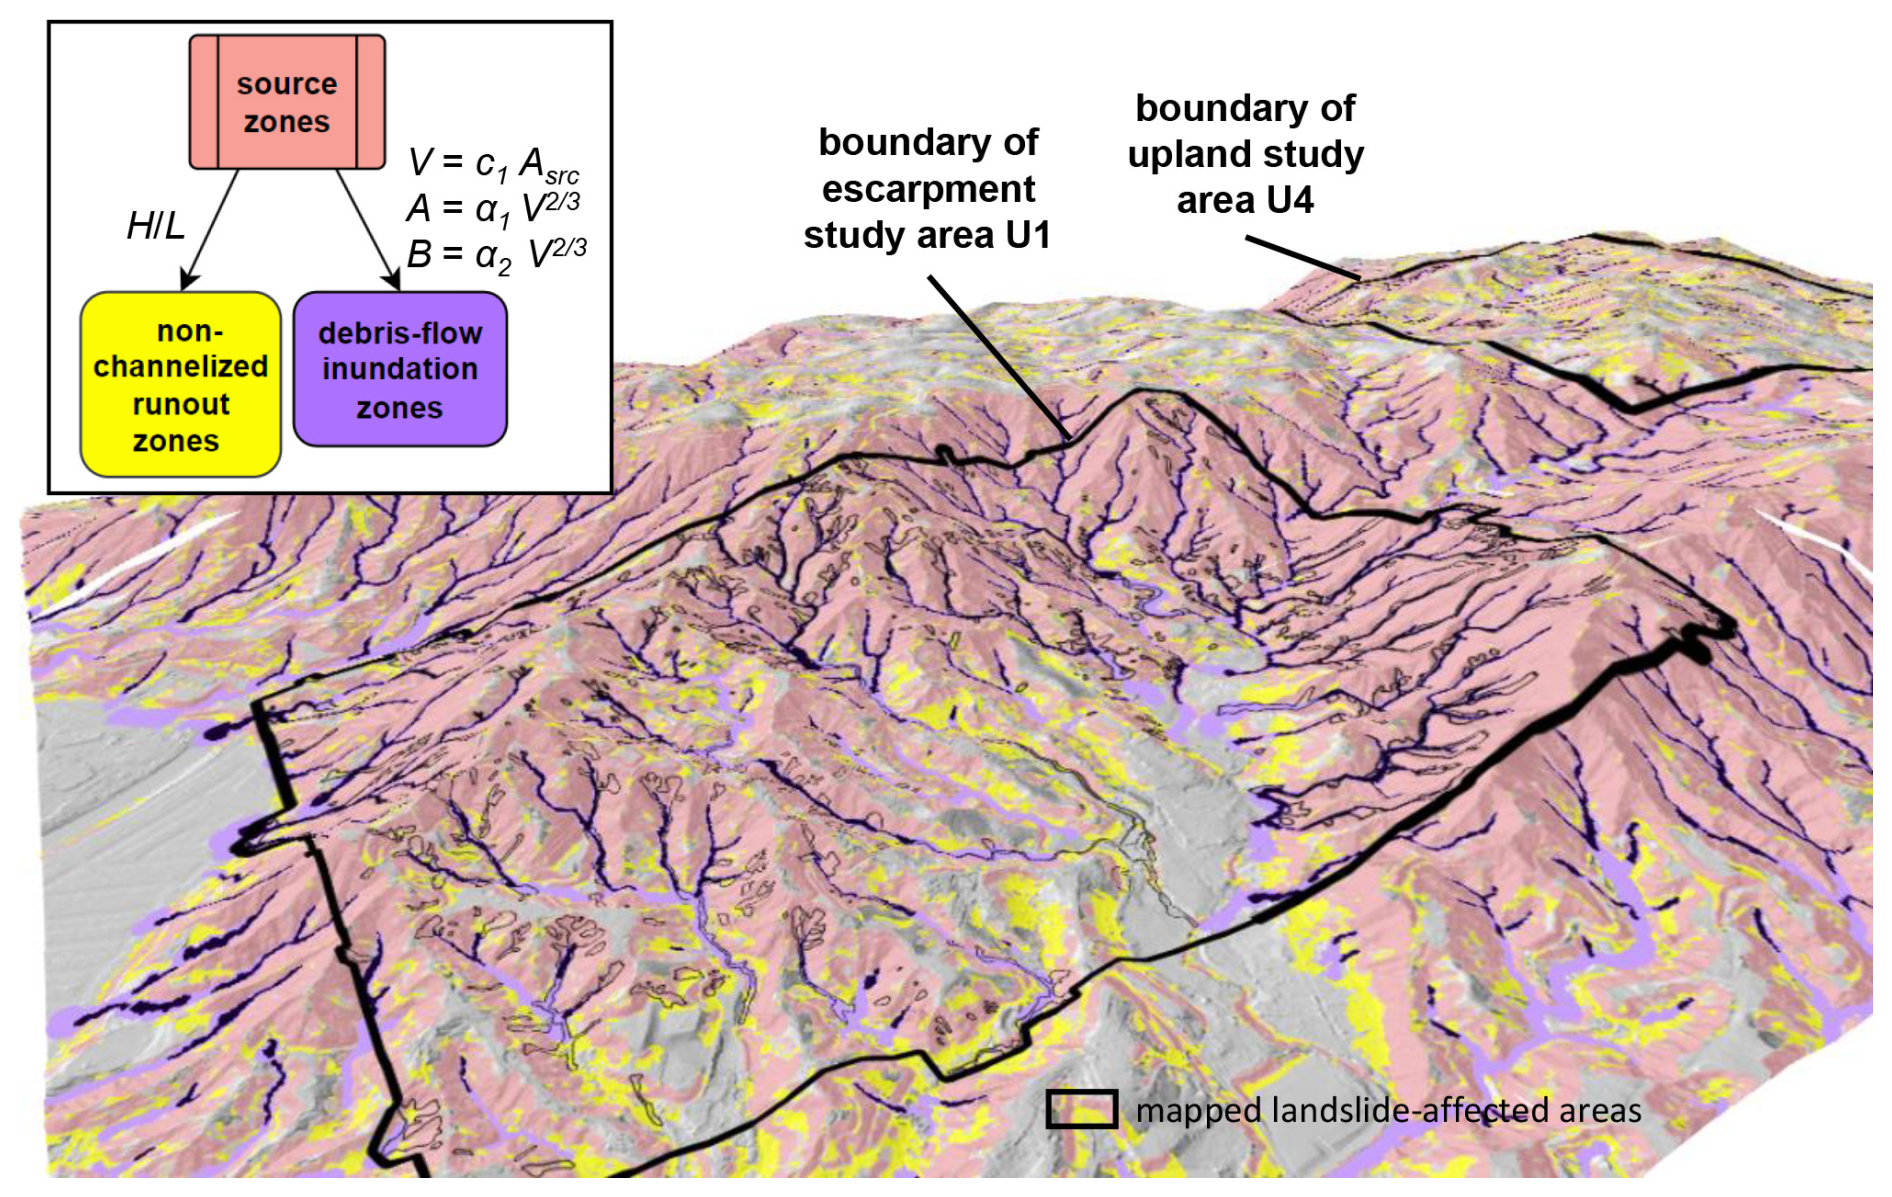
Figure 14Perspective view of landslide susceptibility results in part of Utuado, Puerto Rico, encompassing study area U1 (2.5 km2), located on an escarpment, and study area U4, located in upland terrain. Mapped landslides (Bessette-Kirton et al., 2019b; Einbund et al., 2021b) are shown with black outlines for reference. Dark purple is debris-flow inundation for scenario B-1k, and light purple is the more extensive inundation scenario D-5k. The approximate location at the center of the image is 18°16′40′′ N, 66°41′10′′ W.
In open-slope topographies, the absence of channelization controls the applied modeling approach and resulting susceptibility. Figure 15 shows a comparison of landslide-affected areas (Fig. 15a) and modeling results (Fig. 15b). Here, susceptibility results show runout for non-channelized areas; debris-flow inundation is not modeled.
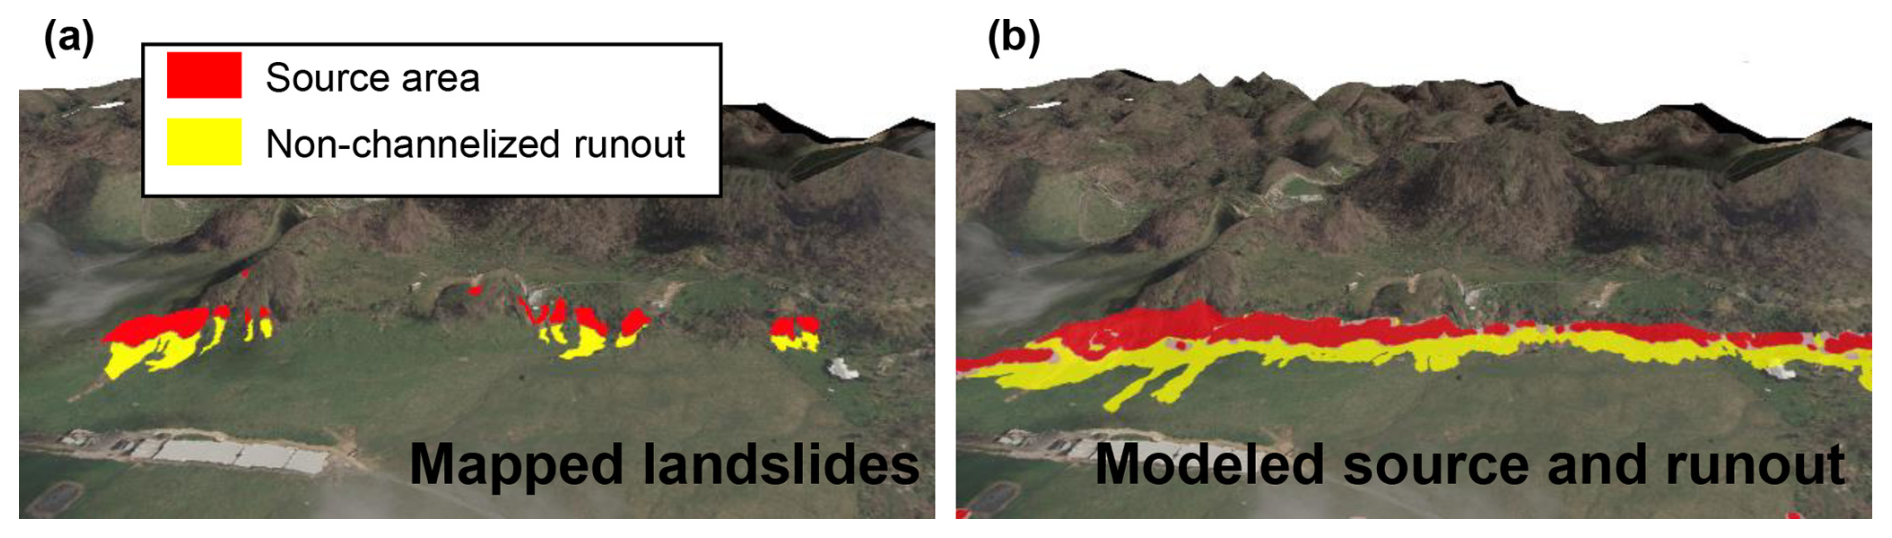
Figure 15Perspective view of post-Maria aerial imagery draped on the DEM in non-channelized, open-slope topography located in semi-calcareous sedimentary units adjacent to karst topography in northern Utuado, Puerto Rico. (a) Mapped landslides (U5; Baxstrom et al., 2021a) divided into source and non-channelized runout. (b) Runout modeling results of areas susceptible to shallow landslides (red; Baum et al., 2024) and runout zones (yellow). The approximate location at the center of the image is 18°18′5′′ N, 66°49′0′′ W.
We used three zones of landslide mobility as the framework for topographic analysis and a linked-model approach to estimate areas susceptible to landslide runout. Both non-channelized landslide runout and channelized debris-flow inundation were observed during Hurricane Maria (Figs. 1, 3, 6) and have the potential to adversely impact roads and infrastructure in the future.
7.1 How topography controls mobility
Our topographic analysis of landslide-affected areas illustrates the strong influence of topography on landslide mobility and guided our decision to use the same parameters for all municipalities. Data from Hurricane Maria landslide inventories show that differences in geomorphic terrain (escarpment versus upland) have a minor influence on the percentage of the study area affected by source zones (Table 4, column 4) but a significant influence on the total landslide-affected area (Table 4, column 7). We identify only a modest increase in the percentage of the study area affected by landslide source areas with an increasing percentage of the study area susceptible to landslides (Fig. 7c, red line). In comparison, when runout (non-channelized and channelized) is included, total landslide-affected area increases at a greater rate. This disproportionate increase in the total affected area with a high percentage of steep slopes suggests increased mobility and greater hazard levels in study areas with a high percentage of area susceptible to landslides, in contrast to more isolated steep slopes. This difference is not solely due to an increase in the area susceptible to landslides, but also influenced by the topographic potential for longer runout. The statistical distribution of topographic slopes shows that the escarpment study areas (U1 and U2) did not have steeper source areas than upland terrains (Table S2, columns 4 and 5), although the overall slopes are steeper in the escarpment areas, where channelized runout (debris-flow inundation) shows the largest increase in affected area for study areas with a higher percentage of area susceptible to landslides.
These combined observations indicate mobility differences are due not solely to slope angle, material strengths, and hydrologic properties or conditions, but also to predisposing factors related to the geomorphic setting. Possible explanations for this phenomenon might include coalescence (e.g., Coe et al., 2021), more readily available entrainable material due to frequent landslides (e.g., Coe et al., 2021; Scheip and Wegmann, 2022), soil depths, and/or topographic controls (e.g., Corominas, 1996; Coe et al., 2011). Escarpment terrains, with more terrain susceptible to landslides, provide more opportunity for the coalescence of contributing landslide source areas over a greater length of runout path, either channelized or non-channelized. Debris-flow runout paths may traverse a substantial distance through places of additional contributing landslide source area. In addition, individual basins in escarpment terrains (Fig. 16a) have higher topographic relief than dissected uplands (Fig. 16b). Higher relief provides the potential for greater runout lengths before there is a change in stream slope conducive to deposition – this results in correspondingly larger runout areas (Fig. 7). Likewise, areas with high drainage density will provide a greater opportunity to amalgamate multiple flows, potentially having a nonlinear impact on access to readily entrainable material. The strong influence of topography in our application indicates that topographic differences are more significant than geologic differences (Fig. 7) and guided the decision to use a single set of parameters for regional susceptibility maps of the Lares, Naranjito, and Utuado municipalities.
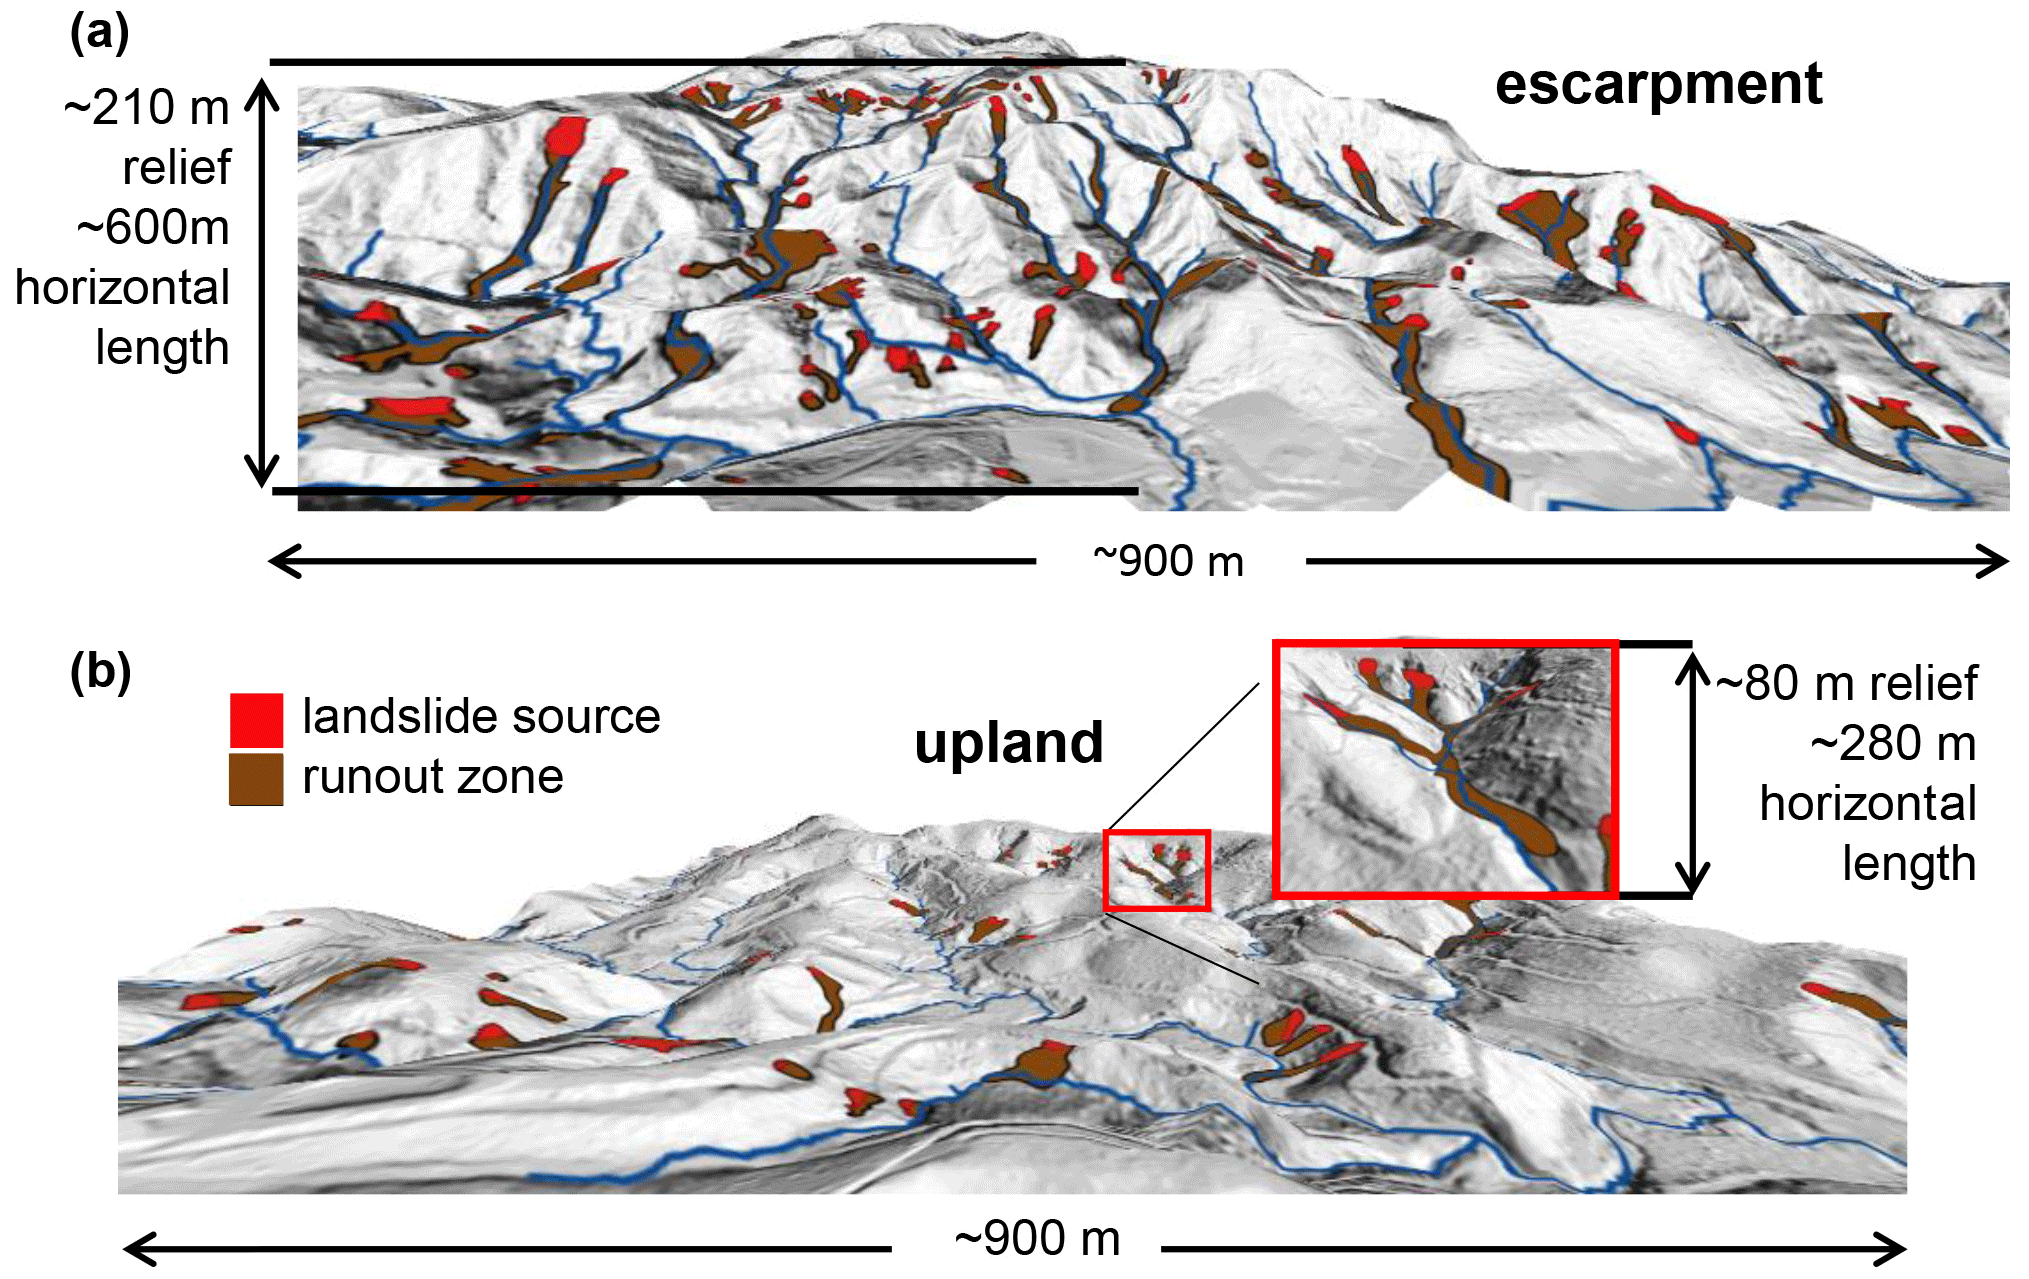
Figure 16Perspective views showing mapped landslide source and runout zones caused by Hurricane Maria in Utuado, Puerto Rico (data from Einbund et al., 2021b): (a) escarpment terrain in study area U1 and (b) upland terrain in study area U3. The approximate location of (a) at the center of the image is 18°16′30′′ N, 66°41′20′′ W; (b) is located at 18°16′30′′ N, 66°47′35′′ W.
Related to the calculation of mobility metrics such as , the two debris flows shown in Fig. 16 illustrate one potential problem with the use of for assessing mobility. For the escarpment flow (Fig. 16a), L≈600 m and α=19°, whereas for an upland terrain debris flow (Fig. 16b), L=280 m and α=16°. A lower α suggests greater relative mobility for dissected upland flow, despite its significantly shorter runout length. Thus, it can be difficult to determine if there is a fundamental difference in the initial potential for mobility (as measured by mobility metrics) versus the ultimate mobility; rather, each debris flow traveled until a decrease in the stream slope sufficient for deposition was reached. In these Hurricane Maria examples, topographic relief defines the H and L of travel before a decrease in stream slope, thereby controlling the ultimate mobility of these flows.
7.2 Advantages of the linked-model approach
By applying different model approaches for each zone of mobility, our linked-model methodology advances previous work combining source and runout models (Ellen et al., 1993; Benda et al., 2007; Guinau et al., 2007; Bregoli et al., 2010; Park et al., 2016; Fan et al., 2017; Pollock et al., 2019; Hsu and Liu, 2019; Mergili et al., 2019). Our approach provides a complete portrayal of susceptibility, starting at the landslide source, traveling downslope, and in the presence of channelization continuing downstream. Without these combined methods, which include modeling, the susceptibility from landside runout in non-channelized topography, such as Fig. 15, would not be identified. In the absence of debris-flow inundation modeling, such as that portrayed in Fig. 11, there would be no delineation of the width of inundation to define susceptible zones adjacent to the channel.
In our linked-model approach, topographic factors are automatically incorporated via multiple mechanisms. runout zones are inherently controlled by local topography, and in channelized topography, the minimal additional runout area is modeled with decreased α (as illustrated in Fig. 11). In channelized topography, debris-flow growth is restricted to channel segments with a sufficient stream slope and greater than 20 % of upslope contributing area being susceptible to shallow landslides (Psrc). These restrictions thereby provide a self-regulating method to estimate potential inundation. Likewise, most channelized debris flows will continue along their pathway until reaching a significant decrease in channel slope, after which deposition is predominant. This concept is applied in our inundation modeling without the need to define spatially variable input parameters.
7.3 Considerations for linked-model approach
7.3.1 Selection of angle of reach
Although much debate exists in the literature regarding the application of the angle of reach (α) (e.g., Hungr et al., 2005), is commonly used to quantify the relative mobility of landslides. As noted by Wallace and Santi (2021), there are potential limitations to the usefulness of to describe landslide mobility. Specifically, unless there is a change in gradient downslope of the source, only measures the overall slope gradient and does not distinguish between short- and long-runout events on uniform slopes. We found a correlation between slopes of non-channelized runout zones (P10 and P50) and the median (P50) slope of the study area (Fig. S2), an indication that local topography can influence runout angles and an important factor to consider when evaluating statistics of runout angles from landslide inventories.
Herein, we do not use or L to compare mobility between landslides as these metrics are also highly dependent on the basin shape, relief of basin, angle of intersection with tributary junctions, and type of landslide (e.g., Corominas, 1996). However, the subtleties of measurements complicate the selection of α for our modeling application. To address these complications, we assessed a wide range of values at 5° increments of α (Fig. 11) and considered the extent and locations of additional runout area. In many of the study areas with steep, dissected topography, we observed that most non-channelized runout is encompassed by runout zones identified with α>25°. Some additional non-channelized runout is within the zone between 20 and 25°. Additional areas encompassed by a value of less than 20° are typically located in the channel, where our methods for debris-flow inundation were applied. In open-slope topographies, where very few mapped landslide-affected areas were available for quantitative assessment, our choice of α equal to 20° compares well visually with the observed landslide runout from Hurricane Maria (Fig. 15).
In addition, worldwide datasets of (e.g., Corominas, 1996) provide useful relative comparison of some the most notable documented landslides in the literature. Many types of landslides, including rockfalls, translational slides, debris flows, earthflows, mudslides, and rock avalanches, display a reduction in α with increasing volume (e.g., Corominas, 1996; Iverson et al., 2015). The further application of reduced α with increasing volume can be employed with our methods to refine estimates of areas susceptible to non-channelized runout.
7.3.2 Selection of debris-flow growth zones
The selection of debris-flow growth zones controls where debris-flow growth factors are applied (Reid et al., 2025). The location of these zones can impact inundation patterns and extent as significantly as the choice of c1 or Vmax (Fig. 12). In some cases, the stream slope can serve as a single control on the location of these growth zones. Reid et al. (2016) summarized slopes where deposition was predominant from previous studies, with deposition for confined flows occurring at slopes of less than 15° and in some cases as low as 1°. More recent studies provide stream slope thresholds in a similar range. For debris flows in North Carolina, Scheip and Wegmann (2022) found a transition from erosion to deposition in the range of 8 to 30°, with a mean value of 18°. Burns et al. (2022) identified that debris-flow transport (non-deposition) occurs on either steep (> 8°) channel reaches or highly confined reaches with gentler slopes (< 5°). In Puerto Rico, field measurements of locations where growth transitioned to deposition (3 to 8°) guided our selection of stream slopes for growth zones (Coe et al., 2021).
In the diverse topography of Puerto Rico, complexities such as short segments of steep stream slopes distanced from areas of landslide susceptibility and locally isolated areas susceptible to landslides necessitated multiple parameters to restrict growth zones. We used characteristics of MMM inundation zones to constrain growth zones for our debris-flow inundation modeling. Statistics based on analysis of MMMs provided ranges of values for the Strahler stream order, percentage of the contributing area susceptible to debris flows (Psrc, Eq. 1), and planform curvature (Table 6). Stream reaches with high values of Psrc are typically coincident with locations where the most susceptible source areas are located, and this parameter might be used as the primary control to define growth zones.
7.3.3 Selection of debris-flow growth factors and volumes
Volume estimates within zones of debris-flow growth are controlled by debris-flow growth factors and limited by Vmax. Published values for growth factors (sometimes termed “growth rates”) are typically estimated from differences in elevation calculated from photogrammetry or lidar-derived DEMs (Reid et al., 2016; Coe et al., 2021; Scheip and Wegmann, 2022). Reid et al. (2016) summarize published length-based growth factors and apply length- and area-based growth factors for Oregon, with values ranging from 11–24 m3 m−1 and from 0.12–0.2 m3 m−2, respectively.
For Hurricane Maria, estimates of c1 and Vmax based on the difference in DEMs from pre- and post-Maria lidar were available (Coe et al., 2021). Our calculation of growth factors normalized to the contributing susceptible area rather than the full contributing area (Table 2) allows application over large areas, where susceptibility to shallow landslides is spatially variable.
For our assessment of debris-flow inundation scenarios, we found that the scenario with the largest maximum volume estimate (C-10k) resulted in a false positive rate that exceeded the true positive rate, indicating severe over-prediction (Fig. 13). The maximum volume for C-10k originated from a site with a significant volume contribution from a single landslide and minimal contribution from debris-flow growth mechanisms (Four Car site; Coe et al., 2021). In this situation, our area-integrated growth factor will underestimate volume at the site of channel initiation and overestimate growth along the travel path. In regions where these characteristics are known to be the predominant pattern, smaller growth factors, power-law growth factors, or initial source volumes can be applied to our methodology (Cronkite-Ratcliff et al., 2025; Reid et al., 2025).
Future investigations of debris-flow growth factors could help determine the applicability of growth factors beyond the specific basins for which they were calculated. Likewise, whether the same basins will repeatedly generate debris flows of the same magnitude or may have a delay in time after a storm event has removed readily entrainable material from the channels could affect the selection of growth factors. In addition, the susceptibility of different drainage basins with seemingly similar characteristics may depend on human modifications within each basin. Nevertheless, we found that single growth factors applied over large areas reasonably matched Hurricane Maria observations.
7.3.4 Assessment of debris-flow inundation scenarios
Contingency table metrics provide multiple evaluation criteria (e.g., Powers, 2011). Choosing a metric for optimization of scenarios depends on the objectives – selection of a high value for TPR maximizes the number of true positives (TPs) and provides high success in the prediction of susceptible areas. Unfortunately, selection of a scenario based solely on TPR typically contributes to a higher value for FPR (Fig. 13) and can result in the assignment of a significant area not affected by actual landslides in a given landslide-inducing event as susceptible. With landslide modeling, this may result in a false prediction for a specific previous event, but the model results may produce successful prediction in a future event. Typically, only a small percentage of area susceptible to landslide initiation or runout is affected by a single event. For example, in Hurricane Maria, only 0.4 % to 3.3 % of steep slopes were subject to landslides (Table 4).
When available, information regarding the specific locations of landslide initiation and stream reaches where readily entrainable material is available can be incorporated into our methods (Reid et al., 2025). For example, Jibson (1989) noted that channel scouring and side-slope debris contributed 90 %–95 % of debris-flow volume in debris flows along the south-central coast of Puerto Rico during a tropical storm on 5–8 October 1985. Although generalized parameters provide a good initial estimate, field observations and debris-flow history can focus on locations where conditions conducive to enhanced debris-flow growth are present. Field observations have the potential to highlight basins with an elevated level of hazard and improve the predictive success of modeling results.
7.4 Limitations of the linked-model approach
Our methods are not a replacement for site-specific investigations or cases where physics-based models can be calibrated to provide more detailed information, including estimates of velocity and inundation depth (e.g., McDougall and Hungr, 2004; Christen et al., 2010; George and Iverson, 2014; Iverson and George, 2014; FLO-2D Software Inc., 2022; Barnhart et al., 2021). Our methodology is designed to assess large regions for runout and debris-flow inundation hazard. In areas of high concern, field studies, analysis of past events, and application of physics-based models may provide more refined hazard estimates.
The advantages of our modeling approach include the ability to estimate areas susceptible to runout and inundation without the need to invoke spatially variable angles of reach, debris-flow growth zones, or debris-flow growth factors based on material properties. Our linked-model approach successfully estimated runout susceptibility for three municipalities in Puerto Rico, where knowledge of site-specific materials and conditions was limited.
Our analysis of landslide-affected areas from Hurricane Maria illustrates that both non-channelized and channelized landslide runout (debris-flow inundation) occurred across nine study areas, encompassing escarpment and upland terrains in volcaniclastic, granitoid, and non-limey sedimentary geologic terranes. Non-channelized runout was the most recurrent, whereas channelized runout was the most areally extensive. Using the concept of zones of mobility, we analyzed topographic characteristics of landslide-affected areas and applied an empirical, linked-model approach to estimate areas susceptible to non-channelized and channelized runout. Our linked-model approach provided a self-regulating method, whereby topography controls the runout method, spatial distribution, and extent of potential landslide runout and debris-flow inundation zones in four primary ways:
-
The presence or absence of a channel network controls the application of the runout method, where areas susceptible to non-channelized runout are identified by a minimum angle of reach and channelized debris-flow inundation zones are estimated using debris-flow growth factors combined with volume–area relations.
-
runout zones provided a transition from source zones to channels and helped in identifying non-channelized runout in areas with open-slope topography, where channels are not present.
-
In channelized topography, debris-flow growth zones were restricted to steep stream reaches (> 5°) possessing characteristics of Hurricane Maria's most mobile debris flows (MMMs) – low stream order (≤4), a high percentage of the contributing area susceptible to debris flows (>20 % Psrc), and concave planform curvature (> 0.02 m−1).
-
Within the zones of debris-flow growth, volumes were calculated as a function of the upslope area susceptible to shallow landslides, whereby drainage basins with a minimal susceptible area were assigned smaller volumes and highly susceptible areas were assigned larger volumes, up to a specified maximum, Vmax. The rate of debris-flow growth is controlled by a growth factor, c1.
Our linked-model approach, available as a USGS software package, Grfin Tools (Cronkite-Ratcliff et al., 2025; Reid et al., 2025), incorporates these methods for portraying runout and inundation for landslides over a range of mobilities and enables runout assessment over large regions without the computational effort required by physics-based models or the need to identify precise locations and volumes of landslide sources. To provide an assessment of areas susceptible to landslide runout and inundation, we applied two runout models in three municipalities in Puerto Rico that had high landslide density from Hurricane Maria – Utuado, Lares, and Naranjito – covering a total area of 560 km2.
Our results illustrate that the geomorphic setting can exert a primary influence on debris-flow runout. Escarpment terrains, with high relief and a high percentage of the contributing area susceptible to shallow landslides, were predicted to have larger areas affected by long-runout debris flows in contrast to dissected upland terrains. These patterns match observations from Hurricane Maria. Assessment of the predictive success of our debris-flow inundation modeling, based on 124 debris-flow runout zones from Hurricane Maria's most mobile debris flows in all terrains, demonstrates that one of our scenarios identified 90 % of the Hurricane Maria debris-flow runout zones.
Grfin (“Gr” stands for growth, “f” for flow, and “in” for inundation; pronounced griffin) Tools computer code used for this study, along with a user guide describing the modeling methods and application examples (https://doi.org/10.3133/tm14-A3, Reid et al., 2025), is available in a U.S. Geological Survey software release (https://doi.org/10.5066/P9NVKFE2, Cronkite-Ratcliff et al., 2025).
Pre- and post-Hurricane Maria lidar-derived DEMs are available at https://apps.nationalmap.gov/lidar-explorer/ (U.S. Geological Survey 2018, 2020a, b, c). Landslide inventories are available as U.S. Geological Survey data releases (https://doi.org/10.5066/P9OW4SLX, Bessette-Kirton et al., 2019b; https://doi.org/10.5066/P9GBGA4I, https://doi.org/10.5066/P9YYU7W1, Baxstrom et al., 2021a, b; https://doi.org/10.5066/P9EASZZ7, https://doi.org/10.5066/P9ZNUR1P, Einbund et al., 2021a, b). Hurricane Maria's most mobile landslides (MMMs) are also available as a U.S. Geological Survey data release (https://doi.org/10.5066/P9NJ8MSP, Brien et al., 2024).
The supplement related to this article is available online at https://doi.org/10.5194/nhess-25-1229-2025-supplement.
DLB performed linked-model simulations with input from all authors. DLB designed and conducted topographic analysis. MER directed the Puerto Rico project landslide mobility task and led the development of Grfin Tools. CC contributed statistical expertise and wrote the Grfin Tools computer code. JPP performed bandpass filtering of DEMs. DLB wrote and revised the manuscript. All authors reviewed the manuscript and provided technical and editorial comments.
The contact author has declared that none of the authors has any competing interests.
Any use of trade, firm, or product names is for descriptive purposes only and does not imply endorsement by the U.S. Government. All authors commented on previous versions of the paper.
Publisher's note: Copernicus Publications remains neutral with regard to jurisdictional claims made in the text, published maps, institutional affiliations, or any other geographical representation in this paper. While Copernicus Publications makes every effort to include appropriate place names, the final responsibility lies with the authors.
We thank Jeffrey Coe, Katy Barnhart, Martin Mergili, and the two anonymous reviewers for their time and thoughtful reviews. Dianne L. Brien thanks those who provided opportunities, encouragement, and/or positive feedback, including Phillip Dawson, Judy Fierstein, Dean Miller, and William Schulz.
This research has been supported in part by the Additional Supplemental Appropriations for Disaster Relief Requirements Act, 2018 (P.L. 115–123).
This paper was edited by Margreth Keiler and reviewed by Martin Mergili and two anonymous referees.
Barnhart, K. R., Jones, R. P., George, D. L., McArdell, B. W., Rengers, F. K., Staley, D. M., and Kean, J. W.: Multi-model comparison of computed debris flow runout for the 9 January 2018 Montecito, California post-wildfire event, J. Geophys. Res.-Earth Surf., 126, e2021JF006245, https://doi.org/10.1029/2021JF006245, 2021.
Baum, R. L.: Slabs3D – A Fortran 95 program for analyzing potential shallow landslides in a digital landscape, U.S. Geological Survey software release, https://doi.org/10.5066/P9G4I8IU, 2023.
Baum, R. L., Savage, W. Z., and Godt, J. W.: TRIGRS – A Fortran program for transient rainfall infiltration and grid-based regional slope-stability analysis, version 2.0, U.S. Geological Survey Open-File Report, 2008-1159, 75 p., https://doi.org/10.3133/ofr20081159, 2008.
Baum, R. L., Cerovski-Darriau, C., Schulz, W. H., Bessette-Kirton, E. K., Coe, J. A., Smith, J. B., and Smoczyk, G. M.: Variability of Hurricane Maria debris-flow source areas in Puerto Rico – Implications for hazard assessment, American Geophysical Union Fall Meeting abstract #NH14A-02, https://agu.confex.com/agu/fm18/meetingapp.cgi/Paper/412740 (last access: 10 August 2023), 2018.
Baum, R. L., Bedinger, E. C., and Tello, M. J.: REGOLITH – A Fortran 95 program for estimating soil mantle thickness in a digital landscape for landslide and debris-flow hazard assessment, U.S. Geological Survey software release, https://doi.org/10.5066/P9U2RDWJ, 2021.
Baum, R. L., Brien, D. L., Reid, M. E., Schulz, W. H., and Tello, M. J.: Assessing locations susceptible to shallow landslide initiation during prolonged intense rainfall in the Lares, Utuado, and Naranjito municipalities of Puerto Rico, Nat. Hazards Earth Syst. Sci., 24, 1579–1605, https://doi.org/10.5194/nhess-24-1579-2024, 2024.
Bawiec, W. J. (Ed.): Geology, geochemistry, geophysics, mineral occurrences and mineral resource assessment for the Commonwealth of Puerto Rico, U.S. Geological Survey Open-File Report 98-38, https://doi.org/10.3133/ofr9838, 1998.
Baxstrom, K. W., Einbund, M. M., and Schulz, W. H.: Map data from landslides triggered by Hurricane Maria in a section of Naranjito, Puerto Rico, U.S. Geological Survey data release, USGS [data set], https://doi.org/10.5066/P9GBGA4I, 2021a.
Baxstrom, K. W., Einbund, M. M., and Schulz, W. H.: Map data from landslides triggered by Hurricane Maria in the greater karst region of northwest Puerto Rico, U.S. Geological Survey data release, USGS [data set], https://doi.org/10.5066/P9YYU7W1, 2021b.
Benda, L., Miller, D., Andras, K., Bigelow, P., Reeves, G., and Michael, D.: NetMap: a new tool in support of watershed science and resource management, Forest Sci., 53, 206–219, https://doi.org/10.1093/forestscience/53.2.206, 2007.
Berti, M. and Simoni, A.: DFLOWZ: A free program to evaluate the area potentially inundated by a debris flow, Comput. Geosci., 67, 14–23, https://doi.org/10.1016/j.cageo.2014.02.002, 2014.
Bessette-Kirton, E. K., Cerovski-Darriau, C., Schulz, W. H., Coe, J. A., Kean, J. W., Godt, J. W., Thomas, M. A., and Hughes, K. S.: Landslides triggered by Hurricane Maria: Assessment of an extreme event in Puerto Rico, GSA Today, 29, 4–10, https://doi.org/10.1130/GSATG383A.1, 2019a.
Bessette-Kirton, E. K., Coe, J. A., Kelly, M. A., Cerovski-Darriau, C., and Schulz, W. H.: Map data from landslides triggered by Hurricane Maria in four study areas of Puerto Rico, U.S. Geological Survey data release [data set], https://doi.org/10.5066/P9OW4SLX, 2019b.
Bessette-Kirton, E. K., Coe, J. A., Schulz, W. H., Cerovski-Darriau, C., and Einbund, M. M.: Mobility characteristics of debris slides and flows triggered by Hurricane Maria in Puerto Rico, Landslides, 17, 2795–2809, https://doi.org/10.1007/s10346-020-01445-z, 2020.
Bregoli, F., Ciervo, F., Medina Iglesias, V. C. D., Bateman Pinzón, A., Hurlimann Ziegler, M., Chevalier, G., and Papa, M.: Development of preliminary assessment tools to evaluate debris flow risks, In XVIII International Conference on Computational Methods in Water Resources, 1–9 pp., Centro Internacional de Métodos Numéricos en Ingeniería (CIMNE), 835–844 pp., https://doi.org/10.4408/IJEGE.2011-03.B-091, 2010.
Brien, D. L., Reid, M. E., Einbund, M. M., and Baxstrom, K. S.: Hurricane Maria's Most Mobile (MMM) landslides in nine study areas in the Lares, Naranjito and Utuado Municipalities, Puerto Rico, U.S. Geological Survey data release [data set], https://doi.org/10.5066/P9NJ8MSP, 2024.
Brown, S.: Measures of Shape: Skewness and Kurtosis, https://brownmath.com/stat/shape.htm (last access: 14 March 2025), 2022.
Burns, W. J., Franczyk, J. J., and Calhoun, N. C.: Protocol for Channelized Debris Flow Susceptibility Mapping: Oregon Department of Geology and Mineral Industries, Special Paper 53, https://pubs.oregon.gov/dogami/sp/SP-53/p-SP-53.htm (last access: 14 March 2025), 2022.
Christen, M., Kowalski, J., and Bartelt, P.: RAMMS: Numerical simulation of dense snow avalanches in three-dimensional terrain, Cold Reg. Sci. Technol., 63, 1–14, https://doi.org/10.1016/j.coldregions.2010.04.005, 2010.
Coe, J. A., Reid, M. E., Brien, D. L., and Michael, J. A.: Assessment of topographic and drainage network controls on debris-flow travel distance along the west coast of the United States, in: The 5th International Conference on Debris-Flow Hazards Mitigation: Mechanics, Prediction and Assessment, https://doi.org/10.4408/IJEGE.2011-03.B-024, 2011.
Coe, J. A., Bessette-Kirton, E. K., Brien, D. L., and Reid, M. E.: Debris-flow growth in Puerto Rico during Hurricane Maria: Preliminary results from analyses of pre- and post-event lidar data, in: Proceedings of the 13th International Symposium on Landslides, Cartagena, Colombia, edited by: Cabrera, M. A., Prada-Sarmiento, L. F., and Montero, J., International Society for Soil Mechanics and Geotechnical Engineering, 8 p., https://www.issmge.org/uploads/publications/105/106/ISL2020-7.pdf (last access: 9 March 2022), 2021.
Corominas, J.: The angle of reach as a mobility index for small and large landslides, Can. Geotech. J. 33, 260–271, https://doi.org/10.1139/t96-005, 1996.
Cronkite-Ratcliff, C., Reid, M. E., Brien, D. L., and Perkins, J. P.: Grfin – Software package and runtime documentation for users, version 1.0, U.S. Geological Survey Software Release [code], https://doi.org/10.5066/P9NVKFE2, 2025.
Crosta, G. B., Cucchiaro, S., and Frattini, P.: Determination of the inundation area for debris flow through semi-empirical equations, in: Mediterranean storms proceedings of the 4th EGS Plinius conference, Spain Universitat de les Illes Balears, https://meteorologia.uib.es/ROMU/informal/proceedings_4th_plinius_02/PDFs/Crosta_et_al.pdf (last access: 14 March 2025), 2002.
Einbund, M. M., Baxstrom, K. S., and Schulz, W. H.: Map data from landslides triggered by Hurricane Maria in three study areas in the Lares Municipality, Puerto Rico, U.S. Geological Survey data release, USGS [data set], https://doi.org/10.5066/P9EASZZ7, 2021a.
Einbund, M. M., Baxstrom, K. S., and Schulz, W. H.: Map data from landslides triggered by Hurricane Maria in four study areas in the Utuado Municipality, Puerto Rico, U.S. Geological Survey data release, USGS [data set], https://doi.org/10.5066/P9ZNUR1P, 2021b.
Ellen, S. D., Mark, R. K., Cannon, S. H., and Knifong, D. L.: Map of debris-flow hazard in the Honolulu District of Oahu, Hawaii, U.S. Geological survey open-file report 93-213, https://doi.org/10.3133/ofr93213, 1993.
Fan, L., Lehmann, P., McArdell, B., and Or, D.: Linking rainfall-induced landslides with debris flows runout patterns towards catchment scale hazard assessment, Geomorphology, 280, 1–15, https://doi.org/10.1016/j.geomorph.2016.10.007, 2017.
FLO-2D Software Inc.: FLO-2D user's manual, version 2007.06, Hydrologic and Hydraulic Modeling Software, FLO2D Documentation, https://documentation.flo-2d.com/ (last access: 14 March 2025), 2022.
Froude, M. J. and Petley, D. N.: Global fatal landslide occurrence from 2004 to 2016, Nat. Hazards Earth Syst. Sci., 18, 2161–2181, https://doi.org/10.5194/nhess-18-2161-2018, 2018.
Furbish, D. J. and Rice, R. M.: Predicting landslides related to clearcut logging, northwestern California, USA, Mountain Res. Develop., 3, 253–259, https://doi.org/10.2307/3673019, 1983.
George, D. L. and Iverson, R. M.: A depth-averaged debris-flow model that includes the effects of evolving dilatancy, II, Numerical pre-dictions and experimental tests, P. Roy. Soc. A, 470, 20130820, https://doi.org/10.1098/rspa.2013.0820, 2014.
Geotechnical Engineering Office: Guidelines on the Assessment of Debris Mobility for Open Hillslope Failure (TGN No. 34), Hong Kong, 16 p., https://www.cedd.gov.hk/filemanager/eng/content_427/TGN 34_1A.pdf (last access: 14 March 2025), 2012.
Gorr, A. N., McGuire, L. A., Youberg, A. M., and Rengers, F. K.: A progressive flow-routing model for rapid assessment of debris-flow inundation, Landslides, 19, 2055–2073, https://doi.org/10.1007/s10346-022-01890-y, 2022.
Griswold, J. P. and Iverson, R. M.: Mobility statistics and automated hazard mapping for debris flows and rock avalanches, U.S. Geological Survey Scientific Investigations Report 2007-5276, 59 p., https://doi.org/10.3133/sir20075276, 2008.
Guinau, M., Vilajosana, I., and Vilaplana, J. M.: GIS-based debris flow source and runout susceptibility assessment from DEM data – a case study in NW Nicaragua, Nat. Hazards Earth Syst. Sci., 7, 703–716, https://doi.org/10.5194/nhess-7-703-2007, 2007.
Guzzetti, F., Reichenbach, P., Ardizzone, F., Cardinali, M., and Galli, M.: Estimating the quality of landslide susceptibility models, Geomorphology, 81, 66–184, https://doi.org/10.1016/j.geomorph.2006.04.007, 2006.
Highland, L. and Bobrowsky, P. T.: The landslide handbook: a guide to understanding landslides, Reston, U.S. Geological Survey, https://pubs.usgs.gov/circ/1325/pdf/C1325_508.pdf (last access: 14 March 2025), 2008.
Horton, P., Jaboyedoff, M., Rudaz, B., and Zimmermann, M.: Flow-R, a model for susceptibility mapping of debris flows and other gravitational hazards at a regional scale, Nat. Hazards Earth Syst. Sci., 13, 869–885, https://doi.org/10.5194/nhess-13-869-2013, 2013.
Hsu, K. J.: Catastrophic debris streams (sturzstroms) generated by rockfalls, Geol. Soc. Am. Bull., 86, 129–140, https://doi.org/10.1130/0016-7606(1975)86<129:CDSSGB>2.0.CO;2, 1975.
Hsu, Y. C. and Liu, K. F.: Combining TRIGRS and DEBRIS-2D models for the simulation of a rainfall infiltration induced shallow landslide and subsequent debris flow, Water, 11, 890, https://doi.org/10.3390/w11050890, 2019.
Hughes, S. K., Bayouth García, D., Martínez Milian, G. O., Schulz, W. H., and Baum, R. L.: Map of slope-failure locations in Puerto Rico after Hurricane María, U.S. Geological Survey data release, https://doi.org/10.5066/P9BVMD74, 2019.
Hughes, S. K. and Schulz, W. H.: Map depicting susceptibility to landslides triggered by intense rainfall, Puerto Rico. U.S. Geological Survey Open-File Report 2020–1022, 91 p., 1 plate, scale 1:150,000, https://doi.org/10.3133/ofr20201022, 2020.
Hungr, O. J., Morgan, G. C., and Kellerhals, R.: Quantitative analysis of debris torrent hazards for design of remedial measures, Can. Geotech. J., 21, 663–677, https://doi.org/10.1139/t84-073, 1984.
Hungr, O. J., Evans, S. G., Bovis, M. M., and Hutchinson, J. N.: A review of the classification of landslides of the flow type, Environ. Eng. Geosci., 8, 221–238, https://doi.org/10.2113/gseegeosci.7.3.221, 2002.
Hungr, O. J., Corominas, J., and Eberhardt, E.: Estimating landslide motion mechanism, travel distance and velocity, in: Landslide risk management, 109-138 pp., CRC Press, ISBN 9780429151354, 2005.
Hungr, O. J., Leroueil, S., and Picarelli, L.: The Varnes classification of landslide types, an update, Landslides, 11, 167–194, https://doi.org/10.1007/s10346-013-0436-y, 2014.
Iverson, R. M.: The physics of debris flows, Rev. Geophys., 35, 245–296, https://doi.org/10.1029/97RG00426, 1997.
Iverson, R. M. and George, D. L.: A depth-averaged debris-flow model that includes the effects of evolving dilatancy, I, Physical basis, Proceedings of the Royal Society A, Mathematical, Phys. Eng. Sci., 470, 20130819, https://doi.org/10.1098/rspa.2013.0819, 2014.
Iverson, R. M., Schilling, S. P., and Vallance, J. W.: Objective delineation of lahar-inundation hazard zones, Geol. Soc. Am. Bull., 110, 972–984, https://doi.org/10.1130/0016-7606(1998)110<0972:ODOLIH>2.3.CO;2, 1998.
Iverson, R. M., Reid, M. E., Logan, M., LaHusen, R. G., Godt, J. W., and Griswold, J. P.: Positive feedback and momentum growth during debris-flow entrainment of wet bed sediment, Nat. Geosci., 4, 116–121, https://doi.org/10.1038/ngeo1040, 2011.
Iverson, R. M., George, D. L., Allstadt, K., Reid, M. E., Collins, B. D., Vallance, J. W., Schilling, S. P., Godt, J. W., Cannon, C. M., Magirl, C. S., and Baum, R. L.: Landslide mobility and hazards: implications of the 2014 Oso disaster, Earth Planet. Sci. Lett., 412, 197–208, https://doi.org/10.1016/j.epsl.2014.12.020, 2015.
Jibson, R. W.: Debris flows in southern Puerto Rico. Geological Society of America Special Papers, 236, 29–55, https://doi.org/10.1130/SPE236-p29, 1989.
Johnson, A. M.: Physical Processes in Geology: A Method for Interpretation of Natural Phenomena, Freeman Cooper, San Francisco, 577 p., ISBN 0877353190, 1970.
Keellings, D. and Hernández Ayala, J. J.: Extreme rainfall associated with Hurricane Maria over Puerto Rico and its connections to climate variability and change, Geophys. Res. Lett., 46, 2964–2973, https://doi.org/10.1029/2019GL082077, 2019.
Larsen, M. C. and Parks, J. E.: Map showing landslide susceptibility in the Comerío municipality, Puerto Rico, U.S. Geological Survey Open-File Report 98-566, https://doi.org/10.3133/ofr98566, 1998.
Larsen, M. C. and Simon, A.: Rainfall-threshold conditions for landslides in a humid-tropical system, Puerto Rico, Geogr. Ann. A, 75A 1–2,13–23, https://doi.org/10.2307/521049, 1993.
Larsen, M. C. and Torres-Sanchez, A. J.: The frequency and distribution of recent landslides in three montane tropical regions of Puerto Rico, Geomorphology, 24. 309–331, https://doi.org/10.1016/S0169-555X(98)00023-3, 1998.
Legros, F.: The mobility of long-runout landslides, Eng. Geol., 63, 301–331, https://doi.org/10.1016/S0013-7952(01)00090-4, 2002.
Lepore, C., Kamal, S. A., Shanahan, P., and Bras, R. L.: Rainfall-induced landslide susceptibility zonation of Puerto Rico, Environ. Earth Sci., 66, 1667–1681, https://doi.org/10.1007/s12665-011-0976-1, 2012.
Magirl, C. S., Griffiths, P. G., and Webb, R. H.: Analyzing debris flows with the statistically calibrated empirical model LAHARZ in southeastern Arizona, USA, Geomorphology, 119, 111–124, https://doi.org/10.1016/j.geomorph.2010.02.022, 2010.
Major, J. J., Schilling, S. P., Pullinger, C. R., and Demetrio Escobar, C.: Debris-flow hazards at San Salvador, San Vicente, and San Miguel volcanoes, El Salvador, in: Natural Hazards in El Salvador, edited by: Rose, W. I., Bommer, J. J., López, D. L., Carr, M. J., and Major, J. J., Geological Society of America Special Paper 375, 89–108, https://doi.org/10.1130/0-8137-2375-2.89, 2004.
McDougall, S.: 2014 Canadian Geotechnical Colloquium: Landslide runout analysis – current practice and challenges, Can. Geotechn. J., 54, 605–620, https://doi.org/10.1139/cgj-2016-0104, 2017.
McDougall, S. and Hungr, O.: A model for the analysis of rapid landslide motion across three-dimensional terrain, Can. Geotech. J., 41, 1084–1097, https://doi.org/10.1139/t04-052, 2004.
Merghadi, A., Yunus, A. P., Dou, J., Whiteley, J., ThaiPham, B., Tien Bui, B., Avtar, R., and Abderrahmane, B.: Machine learning methods for landslide susceptibility studies: A comparative overview of algorithm performance, Earth-Sci. Rev., 207, 103225, https://doi.org/10.1016/j.earscirev.2020.103225, 2020.
Mergili, M., Marchesini, I., Rossi, M., Guzzetti, F., and Fellin, W.: Spatially distributed three-dimensional slope stability modelling in a raster GIS, Geomorphology, 206, 178–195, https://doi.org/10.1016/j.geomorph.2013.10.008, 2014.
Mergili, M., Schwarz, L., and Kociu, A.: Combining release and runout in statistical landslide susceptibility modeling, Landslides, 16, 2151–2165, https://doi.org/10.1007/s10346-019-01222-7, 2019.
Monroe, W. H.: The karst landforms of Puerto Rico, U.S. Geological Survey Professional Paper 899, https://doi.org/10.3133/pp899, 1976.
Monroe, W. H.: Some tropical landforms of Puerto Rico, U.S. Geological Survey Professional Paper 1159, https://doi.org/10.3133/pp1159, 1980.
Montgomery, D. R. and Dietrich, W. E.: A physically based model for the topographic control on shallow landsliding, Water Resour. Res., 30, 1153–1171, https://doi.org/10.1029/93WR02979, 1994.
Muñoz-Salinas, E., Castillo-Rodríguez, M., Manea, V., Manea, M., and Palacios, D.: Lahar flow simulations using LAHARZ program: Application for the Popocatépetl volcano, Mexico, J. Volcanol. Geotherm. Res., 182, 13–22, https://doi.org/10.1016/j.jvolgeores.2009.01.030, 2009.
Nicoletti, P. G. and Sorriso-Valvo, M.: Geomorphic Control of the Shape and Mobility of Rock Avalanches, Geol. Soc. Am. Bull., 103, 1365–1373, https://doi.org/10.1130/0016-7606(1991)103<1365:GCOTSA>2.3.CO;2, 1991.
Pack, R. T., Tarboton, D. G., and Goodwin, C. N.: SINMAP – A Stability Index Approach to Terrain Stability Hazard Mapping, User's Manual, Produced in ArcView Avenue and C for Forest Renewal B.C. under Research Contract No: PA97537-0RE, https://digitalcommons.usu.edu/cee_facpub/16/ (last access: 14 March 2025), 1999.
Park, D. W., Lee, S. R., Vasu, N. N., Kang, S. H., and Park, J. Y.: Coupled model for simulation of landslides and debris flows at local scale, Nat. Hazards, 81, 1653–1682, https://doi.org/10.1007/s11069-016-2150-2, 2016.
Pollock, W., Grant, A., Wartman, J., and Abou-Jaoude, G.: Multimodal method for landslide risk analysis, MethodsX, 6, 827–836, https://doi.org/10.1016/j.mex.2019.04.012, 2019.
Powers, D. M.: Evaluation: from precision, recall and F-measure to ROC, informedness, markedness and correlation, J. Mach. Learn. Technol., 2011, 37–63, https://doi.org/10.48550/arXiv.2010.16061, 2011.
Quantum Spatial, Inc.: FEMA PR imagery, https://s3.amazonaws.com/fema-capimagery/Others/Maria (last access: October 2017), 2017.
Reid, M. E., Christian, S. B., Brien, D. L., and Henderson, S.: Scoops3D – Software to analyze three-dimensional slope stability throughout a digital landscape, U.S. Geological Survey Techniques and Methods, book 14, chap. A1, 218 p., https://doi.org/10.3133/tm14A1, 2015.
Reid, M. E., Coe, J. A., and Brien, D. L.: Forecasting inundation from debris flows that grow volumetrically during travel, with application to the Oregon Coast Range, USA, Geomorphology, 273, 396–411, https://doi.org/10.1016/j.geomorph.2016.07.039, 2016.
Reid, M. E., Brien, D. L., Cronkite-Ratcliff, C., and Perkins, J. P.: Grfin Tools – User guide and methods for modeling landslide runout and debris-flow growth, and inundation, U.S. Geological Survey Techniques and Methods, book 14, chap. A3, https://doi.org/10.3133/tm14A1, 2025.
Scheidegger, A. E.: On the prediction of the reach and velocity of catastrophic landslides, Rock Mechan., 5, 231–236, https://doi.org/10.1007/BF01301796, 1973.
Scheip, C. and Wegmann, K.: Insights on the growth and mobility of debris flows from repeat high-resolution lidar, Landslides, 19, 1297–1319, https://doi.org/10.1007/s10346-022-01862-2, 2022.
Schilling, S. P.: Laharz_py – GIS tools for automated mapping of lahar inundation hazard zones, U.S. Geological Survey Open-File Report 2014-1073, 78 p., https://doi.org/10.3133/ofr20141073, 2014.
Takahashi, T.: Debris Flow, IAHR Monograph, A. A. Balkema, Rotterdam, https://openlibrary.org/books/OL9590406M/DEBRIS_FLOW_(Iahr-Airh_Monograph_Series) (last access: 20 March 2025), 1991.
Tarboton, D. G.: A new method for the determination of flow directions and upslope areas in grid digital elevation models, Water Resour. Res., 33, 309–319, https://doi.org/10.1029/96WR03137, 1997.
Tarboton, D. G., Dash, P., and Sazib, N.: TauDEM 5.3 Guide to using the TauDEM command line functions, http://hydrology.usu.edu/taudem/taudem5/downloads.html (last access: 9 March 2022), 2015.
U.S. Geological Survey: 2015–2016 USGS Puerto Rico LiDAR (project PR_PuertoRico_2015), https://apps.nationalmap.gov/lidar-explorer (last access: 10 August 2023), 2018.
U.S. Geological Survey: 2018 USGS Puerto Rico – Virgin Islands LiDAR (project PR_PRVI_A_2018), USGS [data set], https://apps.nationalmap.gov/lidar-explorer (last access: 10 August 2023), 2020a.
U.S. Geological Survey: 2018 USGS Puerto Rico – Virgin Islands LiDAR (project PR_PRVI_D_2018), USGS [data set], https://apps.nationalmap.gov/lidar-explorer (last access: 10 August 2023), 2020b.
U.S. Geological Survey: 2018 USGS Puerto Rico – Virgin Islands LiDAR (project PR_PRVI_H_2018), USGS [data set], https://apps.nationalmap.gov/lidar-explorer (last access: 10 August 2023), 2020c.
Wallace, C. S. and Santi, P. M.: Runout Number: a new metric for landslide runout characterization, Environ. Eng. Geosci., 27, 455–470, https://doi.org/10.2113/eeg-d-20-00144, 2021.
Wallace, C. S., Santi, P. M., and Walton, G.: Scoring system to predict landslide runout in the Pacific Northwest, USA, Landslides, 19, 1449–1461, https://doi.org/10.1007/s10346-021-01839-7, 2022.
- Abstract
- Introduction
- Conceptual framework
- Study areas
- Methods
- Results of topographic analysis
- Results of runout and inundation modeling
- Discussion
- Conclusions
- Code availability
- Data availability
- Author contributions
- Competing interests
- Disclaimer
- Acknowledgements
- Financial support
- Review statement
- References
- Supplement