the Creative Commons Attribution 4.0 License.
the Creative Commons Attribution 4.0 License.
 | 12 Mar 2025
The Avalanche Terrain Exposure Scale (ATES) v.2
Cam Campbell
The Avalanche Terrain Exposure Scale (ATES) is a classification system that communicates avalanche terrain severity to different target audiences. ATES is a static terrain rating method that is independent of avalanche hazard, so the ratings do not change with the weather and snow conditions. The system was originally introduced in Canada in 2004 as a risk management tool for public avalanche safety programs and uses two synonymous methods: one for terrain assessment and another for public communication. The ATES method applies technical specifications for assessing avalanche terrain to determine ratings, and it is paired with communication models to convey those terrain ratings to different user groups. ATES ratings are found in guidebooks and route descriptions or are displayed spatially as zones on a map, and they have been widely applied to public safety programs and workplace avalanche safety plans. This paper introduces ATES v.2, a revised and updated system that merges the two previous ATES models into a single method that (1) expands the original version from three levels to five by including Class 0 (Non-avalanche terrain) and Class 4 (Extreme terrain), (2) removes glaciation as an input parameter, and (3) introduces a communication model for waterfall ice climbing. The ATES technical specifications are reviewed in detail, along with guidance on their application by field-based practitioners and desktop-based Geographic Information System (GIS) users. The use of both manual and automated ATES assessment methods is discussed, along with methods for presenting ATES ratings to the target audience. This paper addresses a gap in the literature with respect to avalanche terrain classification for backcountry travel. After 20 years of use in different jurisdictions and countries, the ATES method has not yet been published in a peer-reviewed journal. This publication seeks to correct that and establish a baseline reference for ATES upon which future terrain-based products and research can build.
- Article
(11229 KB) - Full-text XML
- BibTeX
- EndNote


The exposure of something vulnerable to avalanche hazard is the definition of avalanche risk (Statham, 2008; CAA, 2016) and one of the most basic but most important concepts in avalanche risk management; when nothing is exposed, nothing is at risk. Yet most winter backcountry travel scenarios are not this simple, especially with recreational and workplace activities, where the elements at risk such as skiers, climbers, snowmobilers, or workers are mobile and free to travel unrestricted through the landscape. In these cases, people will encounter terrain choices with different degrees of exposure to avalanche hazard. Their risk depends upon their route selection, the degree to which they expose themselves to the avalanche hazard, and their vulnerability to the impacts of an avalanche.
The Avalanche Terrain Exposure Scale (ATES) is an avalanche terrain rating system used to assess and communicate the degree of avalanche terrain exposure. It was first introduced as a guidebook style, terrain rating system for recreational backcountry trips (Statham et al., 2006) and then later expanded into a zoning model (Campbell and Gould, 2013) to accommodate spatial applications. Ratings are determined using both subjective and objective criteria and result in a measure of avalanche terrain exposure on an ordinal scale. Unlike the dynamic nature of avalanche hazard assessments, which rise and fall with the changing weather and snowpack conditions, ATES ratings are based on constant parameters that do not change (e.g., slope angle or exposure) or change slowly (e.g., long-term avalanche frequency or forest density), resulting in a static, unchanging terrain rating.
Since its introduction in Canada in 2004, ATES has been applied in many different jurisdictions and countries (e.g., Mcmanamy et al., 2008; Bogie and Davies, 2010; Gavaldà et al., 2013; Maartensson et al., 2013; Pielmeier et al., 2014; Larsen at al., 2020), has become a widely used risk management and avalanche education tool (Haegeli et al., 2006; Floyer and Robine, 2018; Zacharias, 2020), and has been used as a research tool to measure terrain use preferences (e.g., Sykes et al., 2020; Johnson and Hendrikx, 2021; Hendrikx et al., 2022). In Canada, use of ATES has grown beyond recreational applications into policy and regulatory frameworks (Parks Canada, 2005b), and it is now widely used in workplace avalanche safety plans.
Each of these ATES applications has used different approaches to meet different objectives or to utilize emerging technology. Examples of these different techniques include the manual rating of backcountry touring routes (Parks Canada, 2004; Baldwin, 2009; Scott and Klassen, 2011; Statham and Hueniken, 2023; Beacon Guidebooks, 2024), mixed GIS and manual mapping or rating of backcountry zones (Gavaldà et al., 2013; Avalanche Canada, 2024), and automated algorithm-based mapping or rating (Alberta Parks, 2024; Sykes et al., 2024; Toft et al., 2024a). Typically, a more objective approach leads to smaller-scale zoning around measurable terrain features, such as in Alberta Parks (2024), and this is different than a manual approach, where terrain is often grouped into zones that are logical for a recreational application (e.g., Avalanche Canada, 2024), but this requires local expertise. Striking the right balance between objective measurements (e.g., slope angle), subjective estimates (e.g., frequency and magnitude), and local knowledge (e.g., route options) is a challenge for the assessment of any ATES rating. Ultimately, ATES is a communication tool, and the resulting product must make sense and be easily understood by the receiver of the information.
Over the past 2 decades, advances in technology and geospatial tools have facilitated broader application of the ATES concept, including automated ATES ratings (Larsen et al., 2020), which greatly expands the potential scope of terrain classification. At the same time, the continued growth of backcountry recreation has furthered the need for improved avalanche terrain tools (Klassen, 2012) to meet the needs of both experienced backcountry users and people with no appetite for avalanche risk. Backcountry terrain use patterns have changed, and ATES needs to change with them.
The objectives of this paper are (1) to introduce an updated version of ATES called ATES v.2, (2) to establish a baseline reference for the ATES methodology in a peer-reviewed journal, and (3) to fill a gap in the literature with respect to avalanche terrain classification schemes. We start with an overview and the background of avalanche terrain rating systems, followed by a description of ATES v.2 that starts with changes from previous versions and then introduces three revised ATES models for assessment and communication. The application of ATES is then described, including methods for the assessment and presentation of terrain ratings, followed by a discussion of the limitations of the ATES system.
Terrain rating systems play an essential risk management role in recreational activities such as climbing, hiking, kayaking, skiing, and mountain biking. The primary objective of these systems is to simplify complex terrain attributes into easily understood categories that recreationists can use to (1) understand the difficulty or severity of their route beforehand in order to gauge this against their own skills and current conditions, (2) identify and study the crux points of their route ahead of time, and (3) recognize their position on a map in relation to the severity of the terrain around them.
In Canada, avalanche terrain classification systems are either impact-based or exposure-based (CAA, 2016). Traditional hazard mapping methods for land use planning employ impact-based hazard maps (e.g., Rudolf-Miklau et al., 2014; Jamieson and Gould, 2018; Bründl and Margreth, 2021), where the frequency and magnitude of avalanches to known locations can be quantified. Hazard maps delineate zones to evaluate and manage risk to infrastructure, roads, and occupied structures and can be applied to any asset with a fixed location. However, traditional methods become impractical when the element at risk is mobile with unrestricted movement in the landscape, as is the case with backcountry travel. When the element at risk can move anywhere, impact-based methods using avalanche frequency and magnitude at fixed locations become impractical because the location of the element at risk is constantly changing. Thus, avalanche terrain classification for backcountry recreation requires an exposure-based approach.
Canadian Mountain Holidays (Snow Safety Guidelines, Chapter 6: Terrain Categories Outline, unpublished internal company document, 1993) was the first to introduce a static, exposure-based terrain rating system for backcountry skiing, using three terrain categories (A, B, and C) and applying these to their inventory of helicopter ski runs. Penniman and Boisselle (1996) proposed a five-level Avalanche Terrain Risk scale based on terrain severity and modelled after river ratings, which describe the level of difficulty and the consequences of a river rapid (Walbridge and Singleton, 2005). Parks Canada introduced ATES v.1/04 (Statham et al., 2006) and rated 275 backcountry ski trips (Parks Canada, 2004) and 75 waterfall ice climbs (Parks Canada, 2005a) in the national parks. Their objective was to encourage guidebook authors to adopt ATES ratings as an aid to the route descriptions in their publications. This method assigned a single rating for each trail, climb, or backcountry ski area, and that rating defaulted to the highest terrain class along the entire route or area (Parks Canada, 2004). This method of rating routes has since been called ATESlinear (e.g., Thumlert and Haegeli, 2018).
While ATESlinear was effective as a trip planning tool, the application of a single ATES rating for a large area limited its utility for field-based decision making and for activities unbounded by specific routes, such as snowmobiling. Also, the absence of Class 0 was a notable limitation of ATES v.1/04, because most of the population and most workplaces wish to avoid avalanche risk completely. The ATES Zoning Model (Campbell and Gould, 2013) decoupled ATES from specific routes where the exposure is known and applied the ratings spatially as zones on a map. This encouraged a wider adoption of the ATES concept using an accessible methodology with a reduced and more deterministic set of criteria that was better suited to a GIS environment.
The ATES Zoning Model also introduced an optional Class-0 (Non-avalanche terrain) rating showing where avalanches with consequence are not expected to occur. Avalanche Canada subsequently mapped over 5000 km2 of winter backcountry recreation areas in British Columbia using the ATES Zoning Model (Avalanche Canada, 2024), which has since been called ATESspatial (e.g., Thumlert and Haegeli, 2018).
Dynamic avalanche risk maps for public recreation were first introduced by the website http://www.skitourenguru.ch (last access: 7 March 2025) using an algorithm that combined basic terrain characteristics with data from the Swiss avalanche bulletin (Schmudlach and Köhler, 2016a). At the same time, the authors proposed a method for automated avalanche terrain classification (Schmudlach and Köhler, 2016b) designed to remove the subjectivity in ATES. Following this, Harvey et al. (2018) achieved a major breakthrough using high-resolution digital elevation model (DEM) data to combine avalanche terrain characteristics with the avalanche simulation model RAMMS::EXTENDED and produce avalanche terrain maps for all of Switzerland. Their method was later refined to better communicate the resulting terrain classifications and incorporate the ATES system (Harvey et al., 2024).
To produce avalanche terrain maps and ratings at a national scale, automated models must be used (Bühler et al., 2018), and it was obvious that the efficiency of automated methods far exceeded that of manual mapping, which is time- and labour-intensive. To that end, AutoATES, an automated method of applying ATES ratings, was developed in Norway to create nationwide avalanche terrain maps (Larsen et al., 2020) and later updated to AutoATES v.2 (Toft et al., 2024a), which aligns with the ATES v.2 described herein.
Despite sharing the same name, there are significant differences between the ATES v1/04 Technical Model and the ATES Zoning Model that have been corrected in ATES v.2. ATES v1/04 was designed to be subjective and applied to recreational routes in the style of a guidebook (backcountry travel routes and waterfall ice climbs) and typically resulted in a single terrain rating that defaulted to the highest ATES class on that route. The ATES Zoning Model aimed to be more objective and GIS-based by introducing thresholds for slope angle and forest density to encourage smaller-scale spatial applications which included Class 0, but it did not consider key parameters such as exposure, avalanche frequency, and route options. Both models had strengths and weaknesses, and it was clear that an updated ATES v.2 could accommodate both the objective parameters from the Zoning Model and the subjective parameters from the ATES v1/04 Technical Model, brought together into a single system utilizing the best parts of both models.
Accordingly, the original ATES v.1/04 Technical Model and the ATES Zoning Model have now been merged into ATES v.2, and the ratings have been expanded from three to five levels of terrain exposure. This reflects important backcountry use patterns at both ends of the risk spectrum, from the conservative, no-risk Class 0 (Non-avalanche terrain) to the more aggressive, high-risk Class 4 (Extreme terrain). Additionally, glaciation has been removed as an input parameter to ATES v.2, and ATES for waterfall ice climbing is introduced as a communication model for that activity.
3.1 Class 0 – Non-avalanche terrain
Class 0 was first introduced by Campbell and Gould (2013) and is now being integrated into ATES v.2. Non-avalanche terrain is arguably the most important rating level because explicitly identifying trails and zones where avalanches do not occur is an essential service for the thousands of tourists who visit mountain areas each winter and want to completely avoid avalanche risk. Entities such as youth groups, tourist hikers, industrial camps, and workplace safety requirements often demand complete avoidance of avalanche risk. To meet this need, land managers require simple ways of directing people towards non-avalanche terrain. Figure 1 illustrates trails that are rated Class 0 in the immediate vicinity of Lake Louise, Canada, which millions of people visit annually, almost all of them seeking to completely avoid avalanche risk.
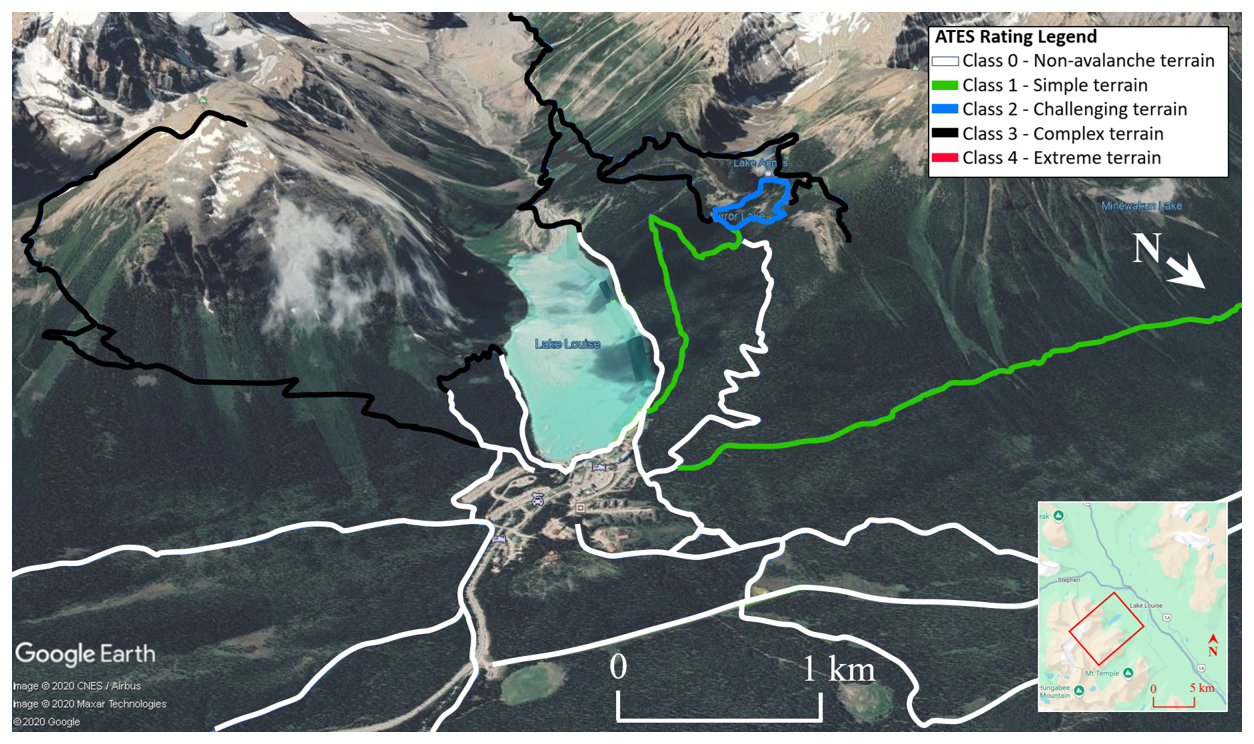
Figure 1Designated hiking, snowshoeing, and track set cross-country ski trails in the Lake Louise area of Canada's Banff National Park, with the white trails showing Class 0 – Non-avalanche terrain – in the area.
Although it is a basic competency of an avalanche professional to identify where avalanches can occur and where they cannot, this task is not trivial. For land use planning applications, determining an avalanche-free perimeter is a complex process involving vegetation analysis, mapping of historic events, climate analysis, and runout modelling (Jamieson and Gould, 2018). This level of effort is usually impractical for mapping backcountry avalanche hazard. Determining a Class-0 (Non-avalanche terrain) rating requires high confidence in the assessment and can have little to no uncertainty. For this reason, the use of ATES Class 0 is optional, and Class 1 can include Class-0 terrain.
3.2 Class 4 – Extreme terrain
In previous versions of ATES, complex terrain had broad criteria that encompassed much of the popular terrain used for alpine recreation, specifically alpine ski touring, snowmobiling, and ice climbing. According to backcountry skiing guidebooks for western Canada, 71 % of ski tours in the Coast Range (Baldwin, 2009) and 76 % in the Canadian Rocky Mountains (Scott and Klassen, 2011) are rated Class 3 – Complex terrain. Harvey et al. (2018) considered ATES to have limited practical value in the Swiss Alps because too many tours would inherently be classified as complex. This lack of a finer resolution within complex terrain has limited the value of an ATES rating for experienced recreationists, who spend much of their time in steep mountain terrain. As backcountry recreation continues to grow, this style of terrain is becoming more popular. Free riding and ice climbing routinely occur in or below high-consequence avalanche terrain that has its own distinct class now known as Class 4 – Extreme terrain (Fig. 2).
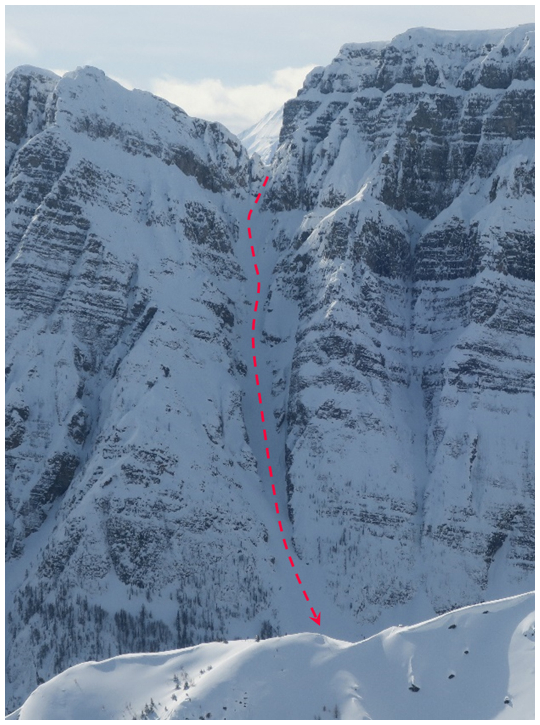
Figure 2The Kindergarten Couloir, a popular 1100 m free-riding route in Canada's Kootenay National Park rated ATES Class 4 – Extreme terrain due to its sustained exposure (ascent and descent), high slope angle, very high avalanche frequency (> 1 : 1), and lack of options for reducing exposure. This is a place where even small avalanches can be fatal.
3.3 Removal of glaciation
Glaciation was an important parameter in the original ATES v.1/04 (Statham et al., 2006), and all glaciated terrain automatically defaulted into at least Class 2 – Challenging terrain, irrespective of any other ATES parameters. There was no Class 1 – Simple terrain on a glacier. If a glacier presented “broken or steep sections of crevasses, icefalls or serac exposure”, the rating defaulted to Class 3 – Complex terrain. This was intended to capture the complexity of glacier travel but had the effect of defaulting flat or low-angled glaciers into an ATES Class-2 rating, even when there was little or no avalanche terrain. Notably, the ATES Zoning Model (Campbell and Gould, 2013) did not consider glaciation, creating a potential conflict between assessments using these two models.
ATES is primarily concerned with terrain exposed to snow avalanche hazard. Ice avalanches are distinct from snow avalanches in that their failure mechanism follows a different process (Pralong et al., 2005), leading to their inherent unpredictability by field practitioners. For these reasons, glaciation as an independent parameter has been removed from ATES v.2, but crevasses remain as a terrain trap consideration. This will have the effect of down-classifying low-angled glaciated terrain that was previously Class 2 – Challenging terrain into Class-1 or Class-0 terrain.
ATES v.2 is an ordinal, five-level terrain rating system that helps people gauge their exposure to avalanche-prone terrain, and it follows the communication theory of source–channel–receiver (Wogalter et al., 1999). The source is the person or group doing the assessment and determining the rating, the channel is the method of communication (e.g., website, app, or guidebook), and the receiver is the end-user of the information.
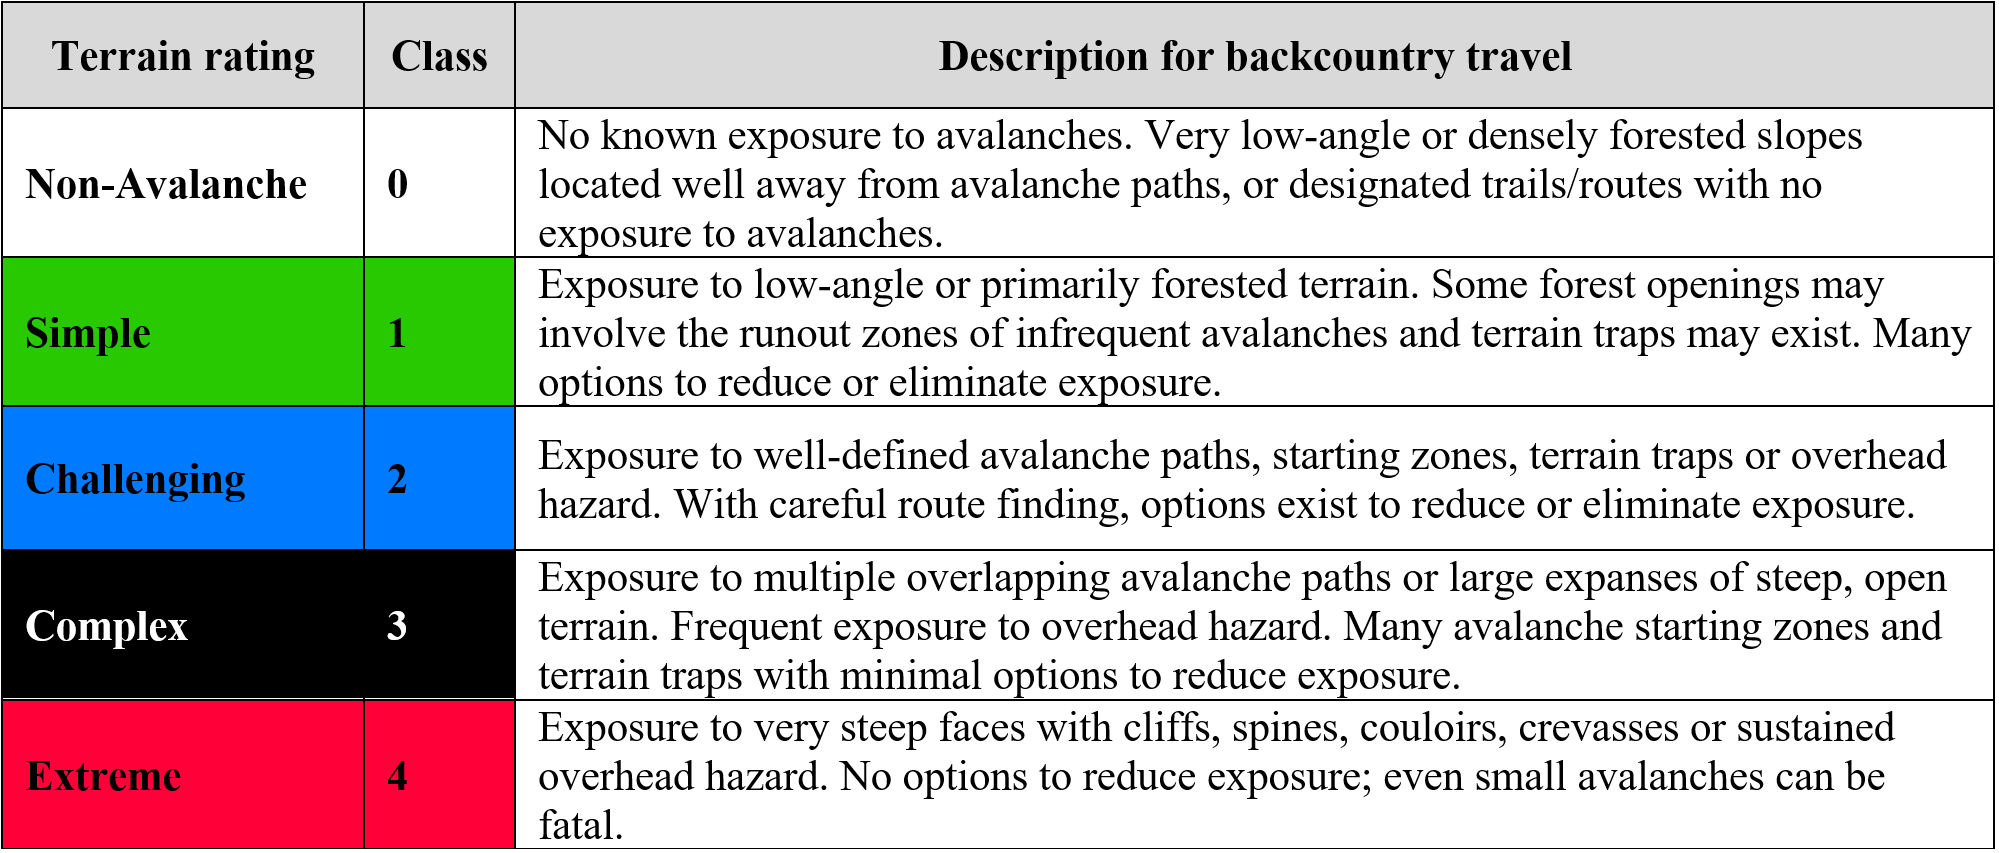
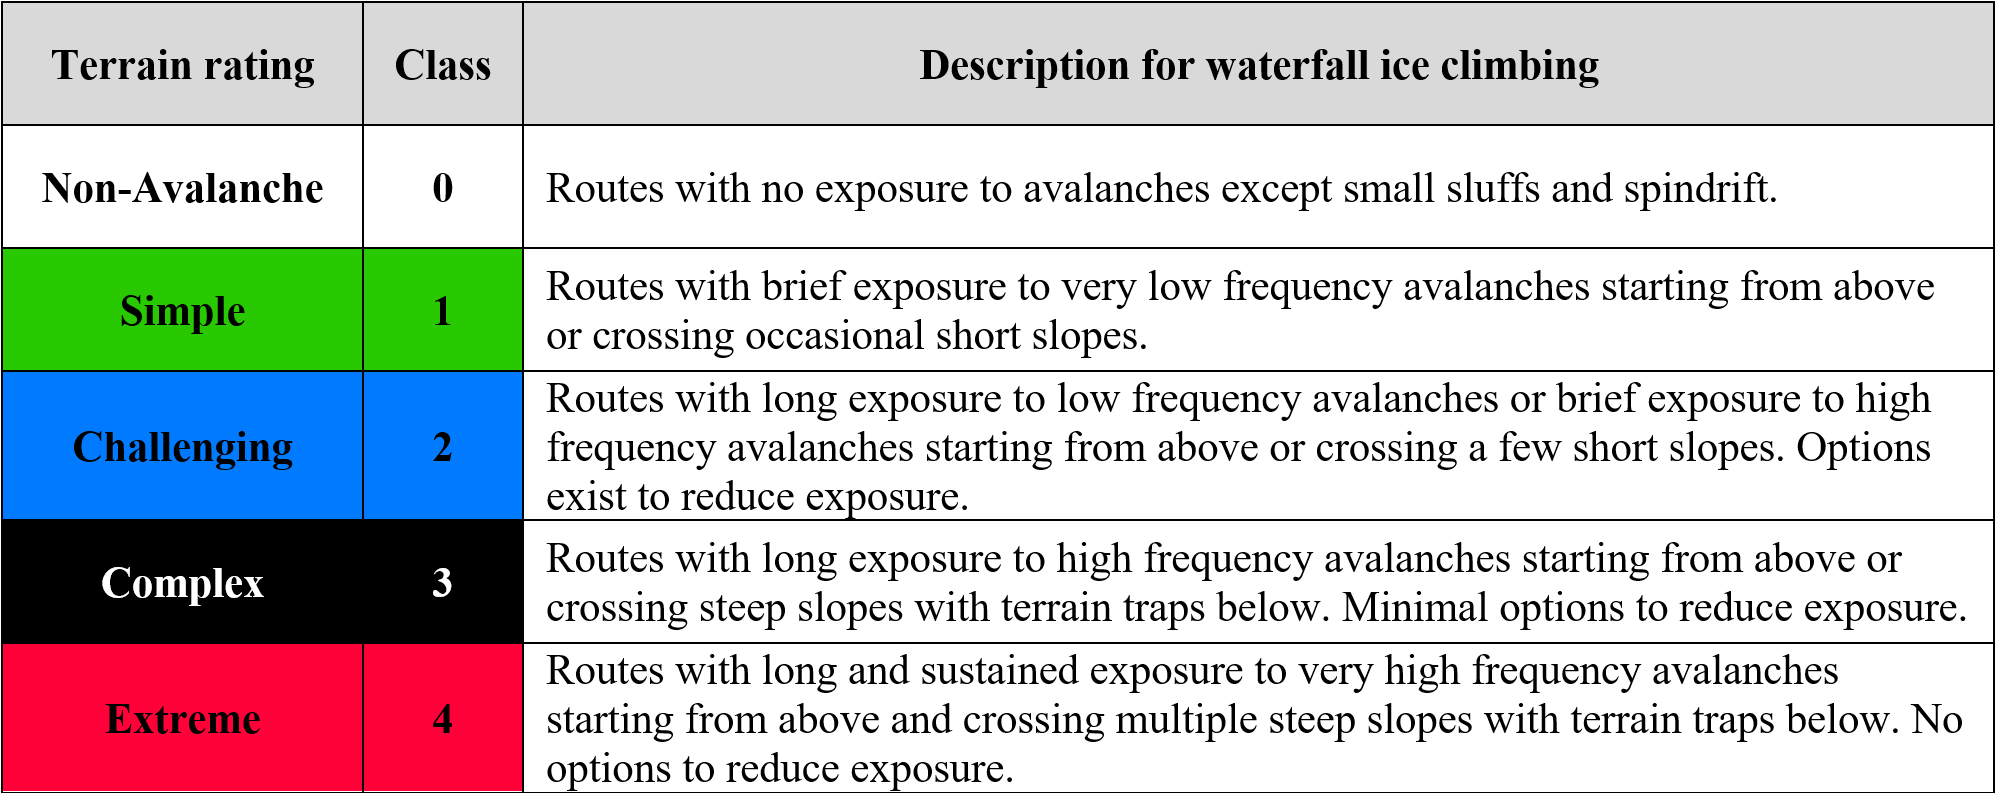
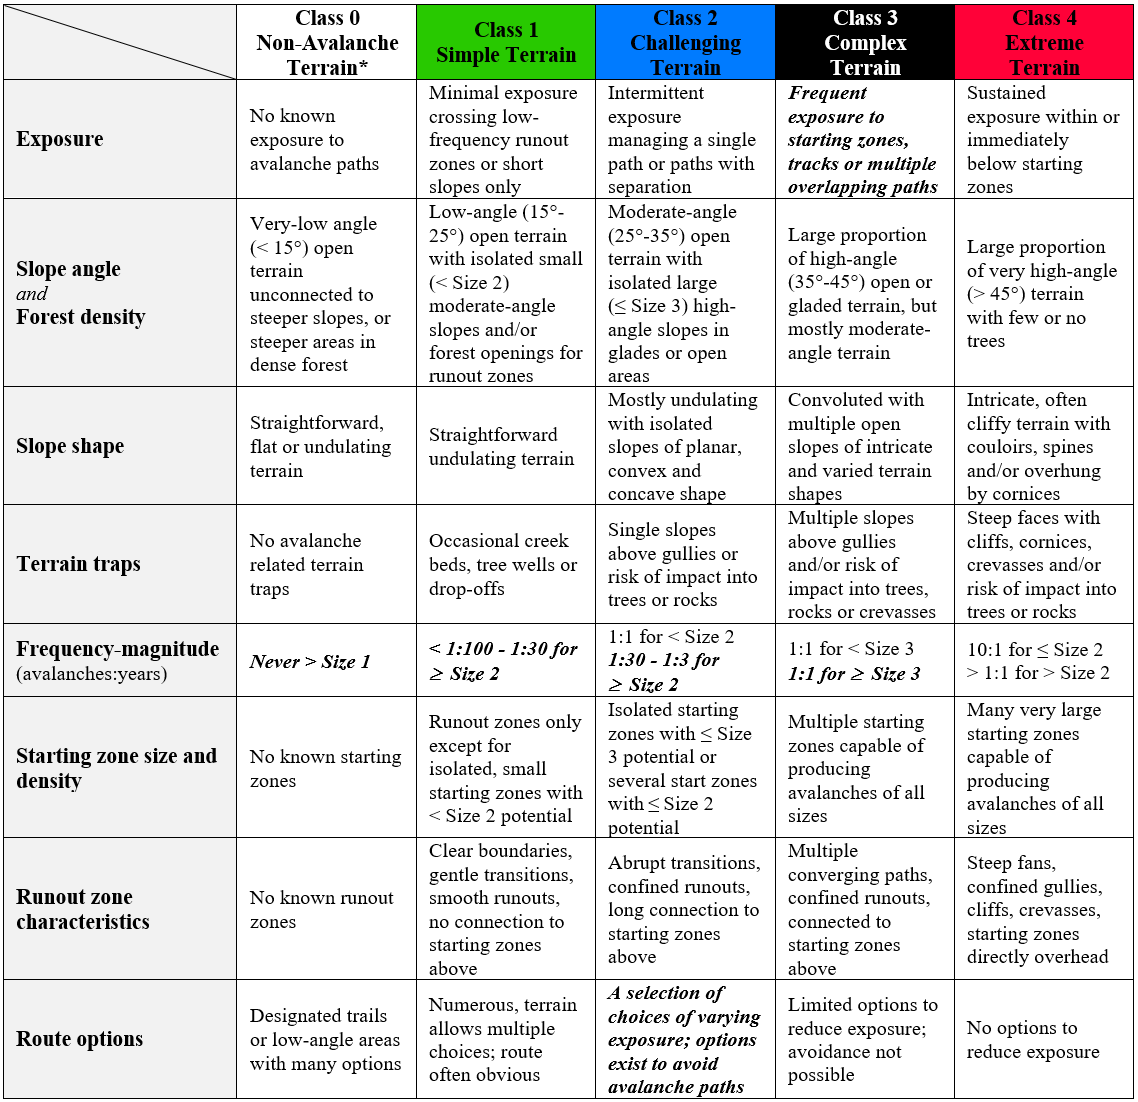
ATES is a terrain model with dual objectives: assessment and communication. The Communication Models (Tables 1 and 2) are simple by design to achieve the primary objective of ATES by conveying terrain ratings to different receiver groups. The Technical Model (Table 3) is designed for the source (i.e., the terrain assessor) as a specialized reference for identifying, analysing, and classifying avalanche terrain exposure. Although these different ATES models use different languages to achieve different objectives, they are synonymous and their thresholds correspond to one another. That is, ATES says the same thing in two different languages, one technical and one non-technical. The system uses numbers, signal words, and colours as options to communicate the rating level.
Table 3ATES Technical Model. The bold italicized text indicates default values that automatically place the ATES rating in that category or higher. ∗ The use of Class 0 is optional due to the reliability needed to make this assessment; otherwise, Class 1 includes Class-0 terrain.
4.1 ATES Communication Models
ATES was born from a Canadian backcountry avalanche disaster where seven high-school students were killed while on an outdoor-education school trip in February 2003. Upon review, it became clear that public safety agencies needed better tools to help the public determine what was serious avalanche terrain and what was not (O'Gorman et al., 2003). Risk communication was the original objective of ATES, and it remains its primary objective today. Regardless of the techniques used for the assessment of terrain exposure, ATES ratings must ultimately meet the criteria specified in Tables 1 and 2, as these are what is published to the receiver groups.
The ATES Communication Models describe terrain ratings in the language of the receiver group and are light on technical detail, with a priority placed on comprehension. Tables 1 and 2 describe and rank avalanche terrain in a simple way, similar to how the avalanche danger scale (Statham et al., 2010; Avalanche Canada, 2022; EAWS, 2024) describes and ranks avalanche danger; they represent the summary output of a technical assessment intended for public avalanche risk communication.
When used in combination, models of avalanche danger and models of terrain offer a simplistic but powerful way of illustrating good risk management through the interaction of snow, terrain, and people (Haegeli et al., 2006), and they offer a preview of a future where dynamic avalanche risk maps combine these models automatically (e.g., Schmudlach and Köhler, 2016a).
Waterfall ice climbing is a specialized activity often very exposed to avalanche hazard and high risk (Statham and Hueniken, 2023). Ice climbers are a unique audience in that their routes are commonly inside avalanche paths, meaning that climbers can be exposed for long periods of time to slopes overhead that cannot be assessed in conventional ways. The primary emphasis of ATES for waterfall ice climbers is on exposure time and avalanche frequency. How frequently does the route avalanche, and how long will climbers be exposed to it?
4.2 ATES Technical Model
The ATES Technical Model (Table 3) is designed for avalanche terrain assessment and is used to determine an ATES rating. The model breaks down avalanche terrain exposure using eight different parameters:
-
exposure;
-
slope angle and forest density;
-
slope shape;
-
terrain traps;
-
frequency and magnitude;
-
starting zone size and density;
-
runout zone characteristics; and
-
route options.
Any given area, zone, corridor, or route usually includes terrain criteria that fit into different ATES rating levels, and combining these into a single rating is a subjective exercise with some guidance provided in the following subsections. Not all eight parameters will be able to be assessed every time, particularly at smaller scales. For example, assessing the starting zone size and density implies that there are multiple starting zones, assessing exposure and route options implies that a route has been selected, and assessing slope shape often requires more than one slope to assess. Sometimes certain parameters will simply not be applied to the assessed terrain. For these reasons, none of these criteria is mandatory, and the assessor must gather and work with the best information available to them.
Of a total of 40 criteria, there are six bold defaults that, when met, automatically default the ATES rating into that category or higher. Otherwise, the overall rating is an evaluation based predominantly on expert judgement that involves (1) analysing the terrain against each ATES parameter for the best fit, (2) comparing this to levels above and below, and (3) deciding what the best overall ATES rating is. Field checking and peer review of ATES ratings from other qualified individuals are important for error correction, accuracy, and ultimate improvement in confidence in the assessment.
The following sections provide guidance for evaluating each of the eight parameters that define the ATES Technical Model (Table 3) by describing their influence on terrain severity and the range of thresholds from Class 0 to Class 4.
4.2.1 Exposure
Exposure is the situation of people, infrastructure, housing, or other tangible assets located in hazard-prone areas (UNDRR, 2016). With respect to avalanche risk, exposure is the extent to which an element at risk is subject to avalanche hazards and is a function of both space and time (CAA, 2016), i.e., where and for how long something is subject to an avalanche hazard. Exposure is a crucial ingredient in avalanche risk, and without it there is no risk.
Spatial exposure considers precisely where an element at risk is located in the terrain and its position relative to the surrounding avalanche hazard, including overhead hazard. This is fundamental, because even during periods of high avalanche hazard a simple reduction in spatial exposure will reduce the risk. In small-scale terrain features, even minor adjustments to how one is exposed to the hazard will change the risk – a few meters in either direction can be the difference between low- and high-risk situations (Statham, 2008). ATES uses the terms “none”, “runouts only”, “single paths”, “multiple paths”, and “inside/under starting zones” to describe the range of spatial exposure.
ATES considers temporal exposure in two different but related ways: the assessment of an ATES rating examines temporal exposure in terms of how long an element at risk is exposed. For example, being under an avalanche path for 10 min presents a higher severity than being exposed to the same path for only 1 min. This kind of temporal exposure applies directly to field techniques used to manage the risk: which is better, taking 10 min and crossing under one at a time, or taking 1 min and crossing as one large group of people? The terms “minimal”, “brief”, “intermittent”, “long”, “frequent”, and “sustained” used in Tables 2 and 3 refer to the length of time one should expect to be exposed. The application, or use of ATES ratings as a tool for risk management, asks the receiver to consider temporal exposure in terms of when different classes of terrain are within their risk threshold and when they are not. This is a dynamic avalanche risk assessment which requires combination of the ATES rating (static) with an avalanche hazard assessment (dynamic). For example, when the hazard is low, complex terrain may be appropriate; conversely, when the hazard is high, complex terrain may be inappropriate and simple terrain a better choice.
ATES considers both actual and potential exposure, depending on the approach. ATESlinear rates specific, predefined routes, meaning that the actual exposure is known and can be evaluated, whereas ATESspatial rates areas or zones of terrain without a specific route, which is potential exposure. Once the receiver of the information plans a specific route, their actual exposure becomes known and the ATES ratings can be utilized.
4.2.2 Slope angle and forest density
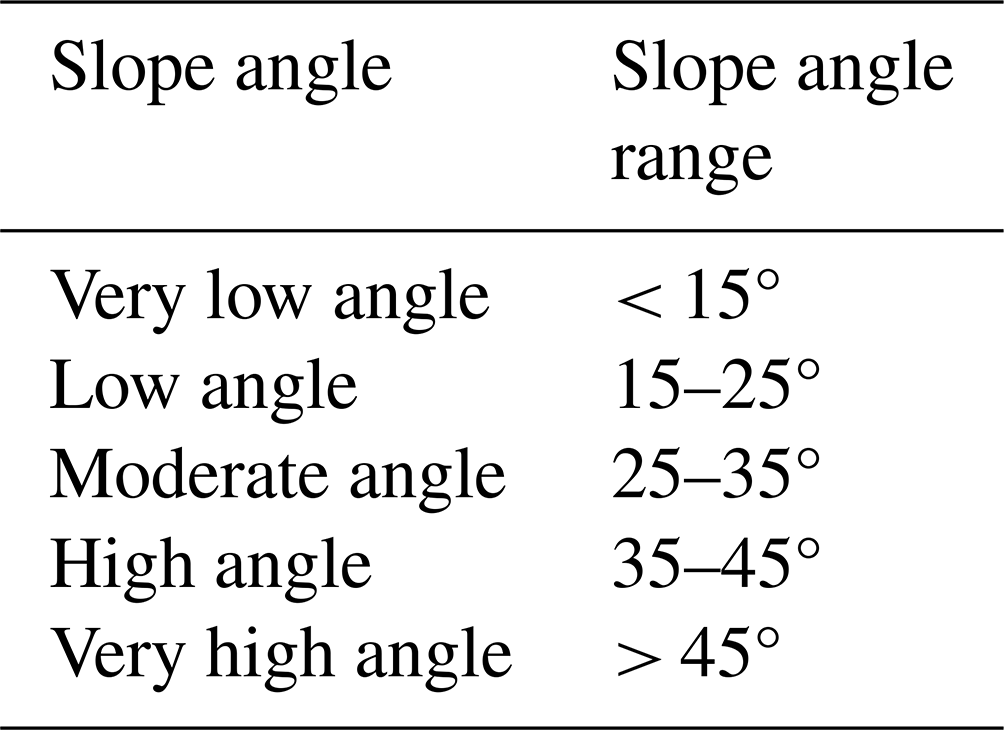
Slope angle is the primary terrain factor in avalanche release. Slab avalanches typically initiate within the range 25–55° (McClung and Schaerer, 2023), with most initiating on slopes that have an incline of 30–45°. Within any single slope, the steepest part is what matters most. This is known as the “critical slope”, which is the steepest angle from the horizontal averaged over 10–20 m in the starting zone (Schweizer et al., 2003; McClung and Schaerer, 2023). ATES associates common slope angle terminology with a range of slope angle values (Table 4).
The relationship between slope angle and avalanche release is modified by forest cover (Fig. 3) because dense trees can anchor the snowpack to the slope and reduce or eliminate the avalanche hazard. The degree of the anchoring effect depends on the tree spacing and stem diameter (Weir, 2002; Rudolf-Miklau et al., 2014) as well as the crown coverage and ground roughness from lying or standing trees. Forest cover also modifies the snowpack structure by sheltering the snowpack from wind effects and blocking incoming and outgoing solar radiation. Bebi et al. (2009) describe the physical processes that stabilize the snow cover in the forests and modify the effects of terrain factors as including (i) interception of falling snow, (ii) modification of the radiation and temperature regimes, (iii) reduction in near-surface wind speeds, and (iv) direct support of the snowpack by the stems.
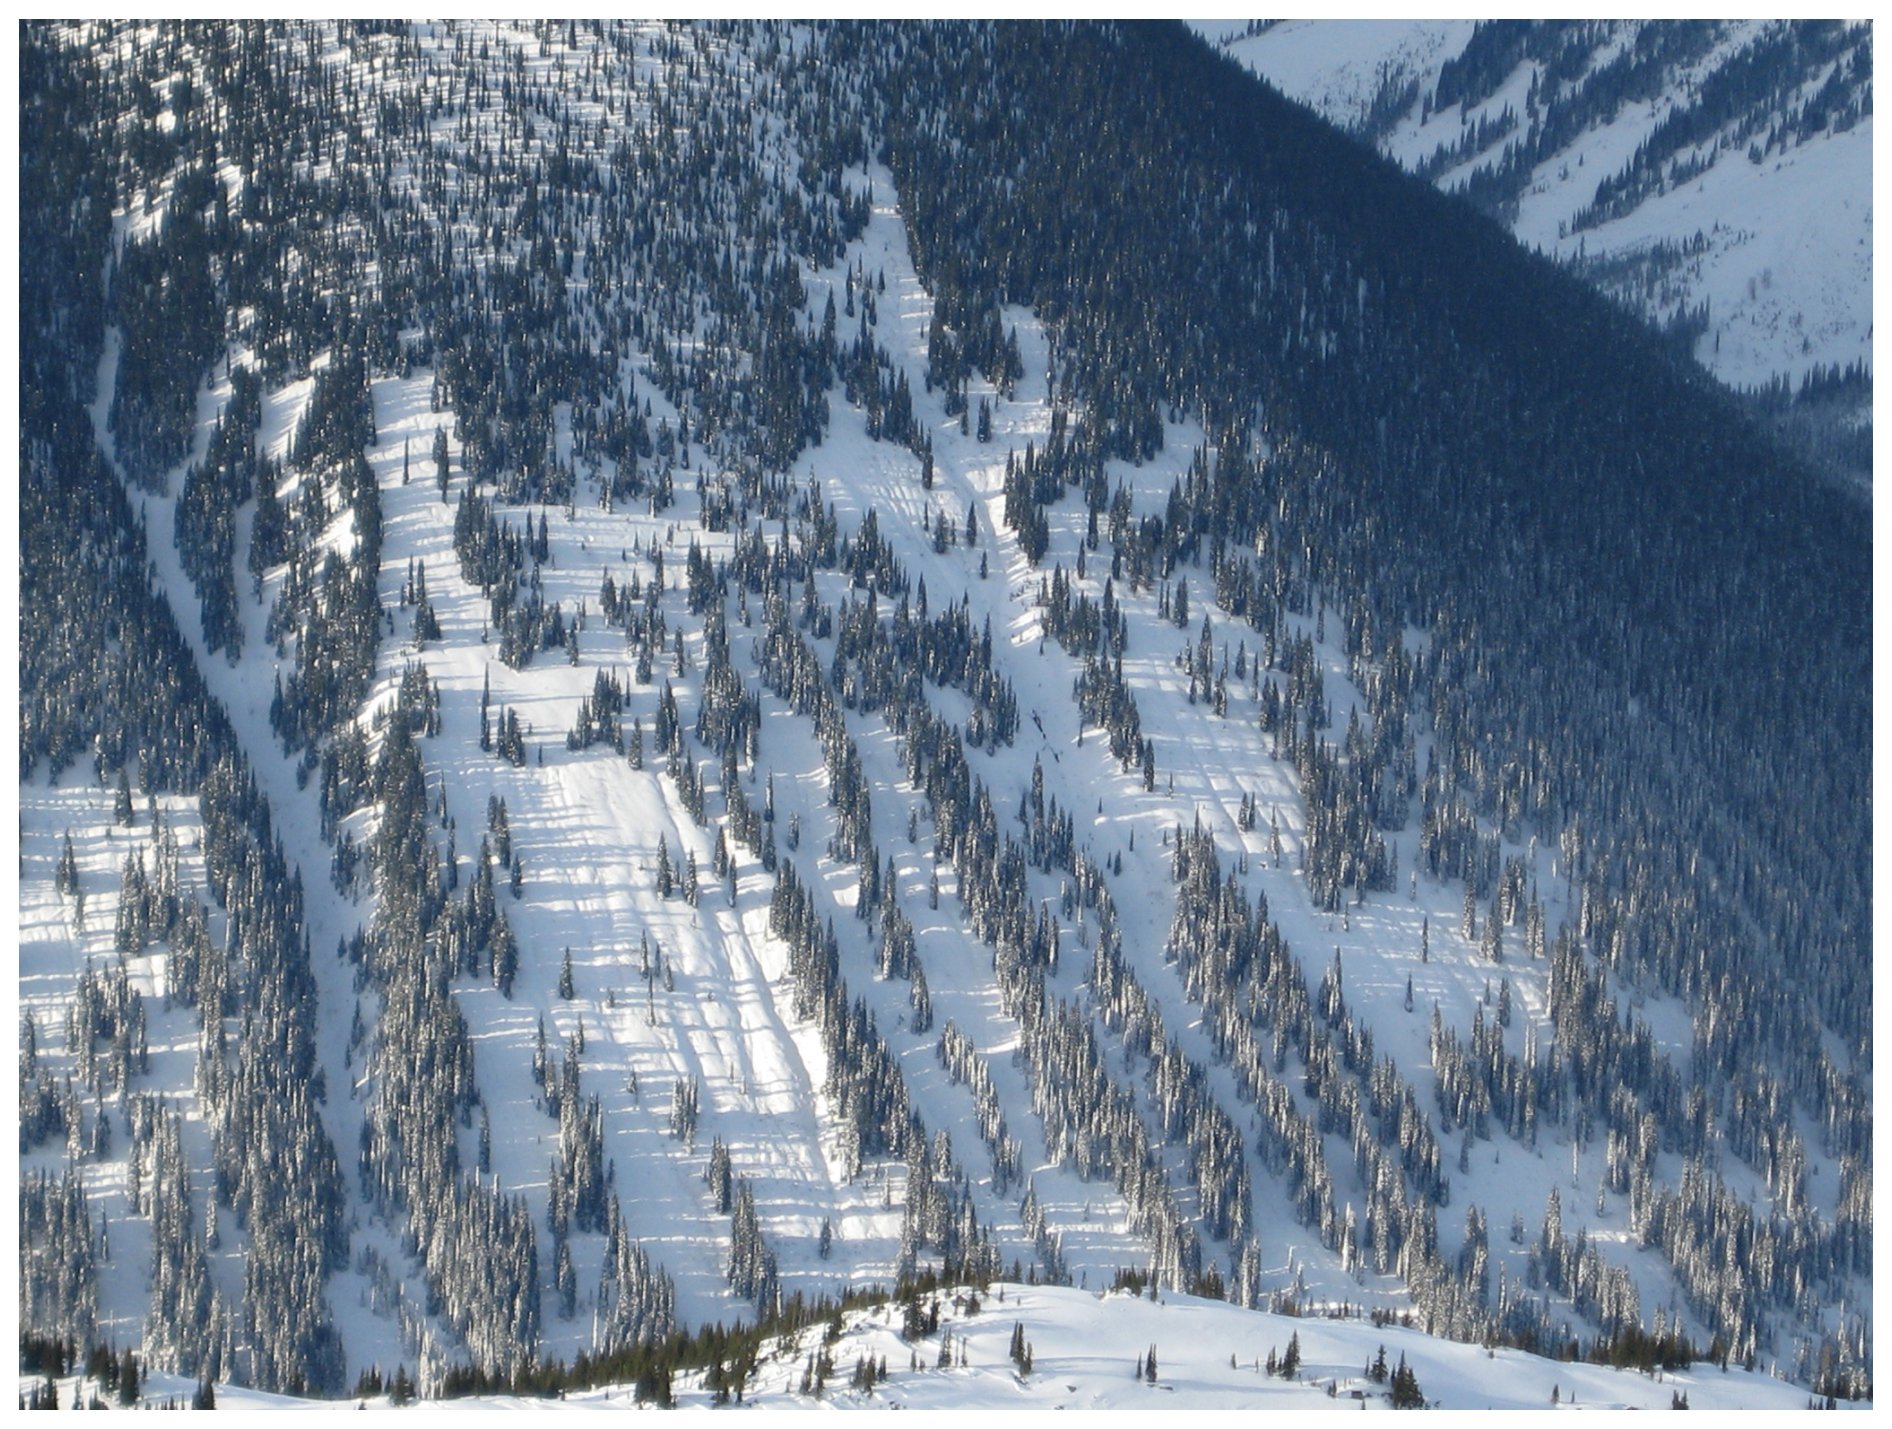
Figure 3The interaction between slope angle and forest density is illustrated here, where dense forest anchors the snowpack and the steep, open glades are avalanche paths.
This interaction between forests and avalanches is a complex phenomenon which has been simplified for its application to ATES to examine only tree spacing and its effect on anchoring the snowpack to the slope. Direct support of the snowpack by tree stems can prevent slab avalanche formation, though primarily in dense forests with more than 1000 stems per hectare (Salm, 1978). In steep forests with less than 1000 stems per hectare, natural and human-triggered slab avalanches are common, but minimal research exists on the effects of tree spacing on human triggering of avalanches. Good-quality forest cover data are challenging to source, although this is improving each year. In the absence of good data, ATES uses manual estimates of tree spacing by measuring the typical spaces between trees and then extrapolating or averaging across an area. The sizes of forest openings can be measured, and Table 5 defines typical spacings for open, gladed, and dense forest. Often, significant differences in forest density will delineate the edge of a zone.
Table 5ATES forest density terminology and associated values (adapted from Campbell and Gould, 2013).
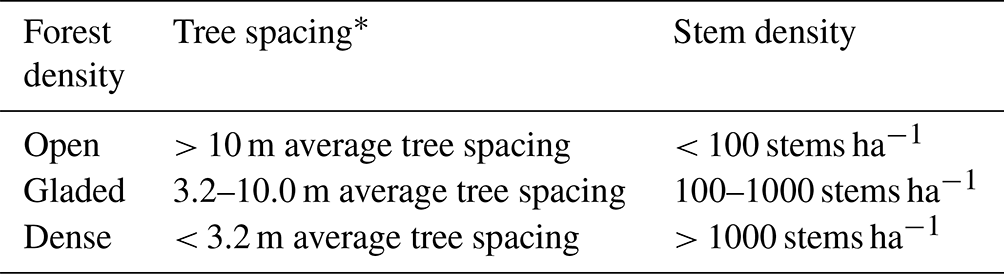
∗ Based on a minimum stem diameter of 16 cm.
Table 6Slope angle and forest density combined thresholds for GIS applications (adapted from Campbell and Gould, 2013).
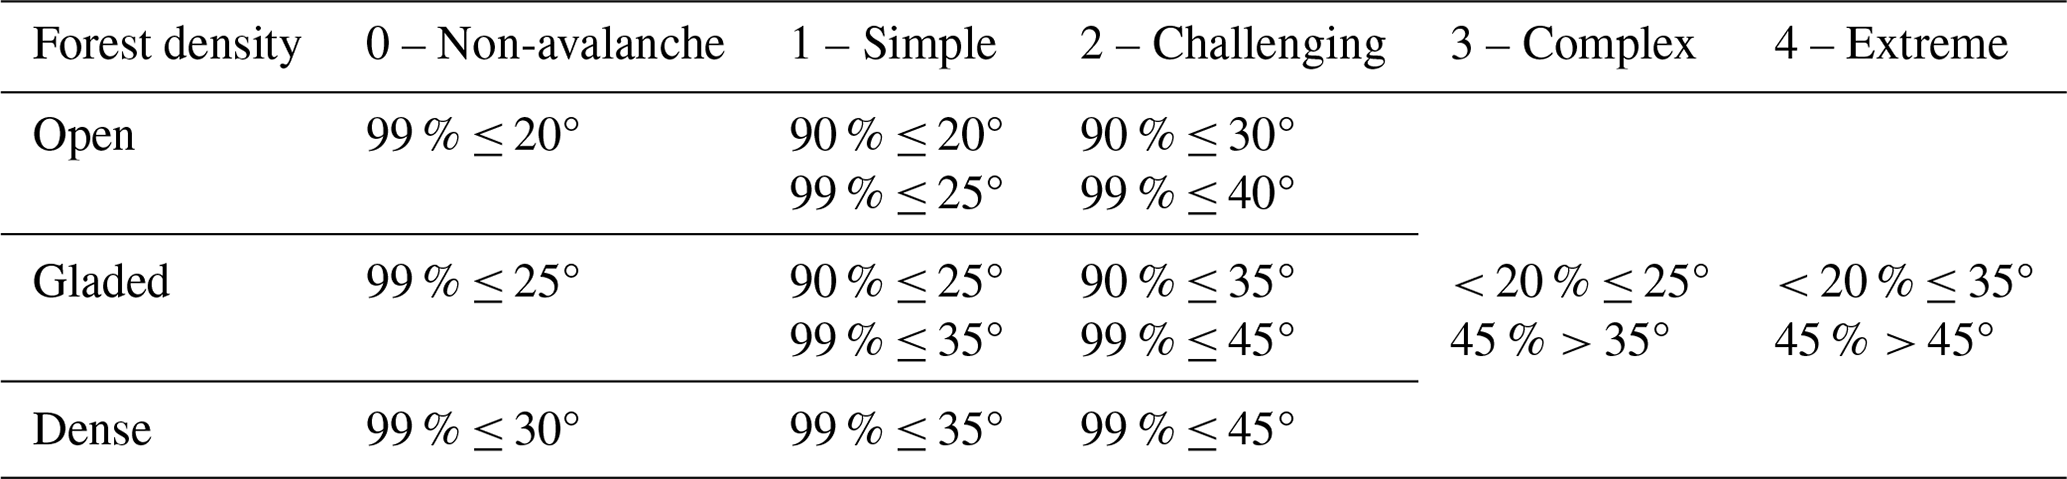
∗ Slope angles are averaged over a fall-line distance of 20–30 m.
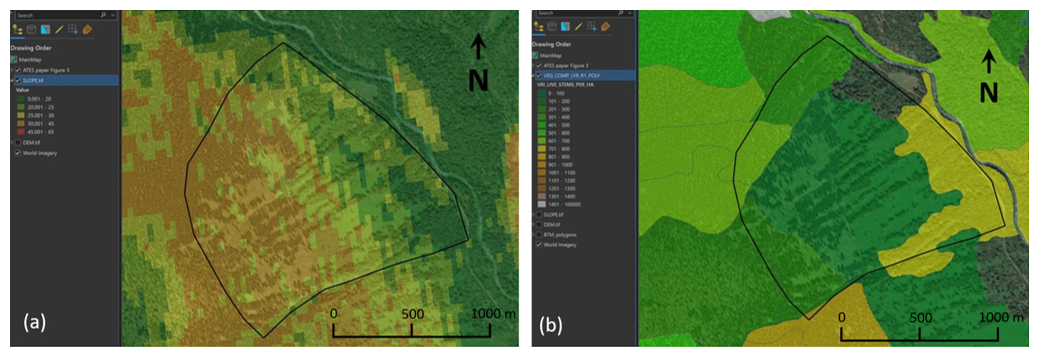
Figure 4The slope angle distribution (a) across the area shown in Fig. 3 indicates the lower half of the area in the 20–30° range, and the upper half is in the 30–45° range, while the forest density distribution (b) of the main open and gladed areas in the middle is 120 stems per hectare, with spacing slightly < 10 m. Combined, these thresholds make the overall rating of this area Class 3 – Complex terrain. Data source: Natural Resources Canada. Basemap source: Esri.
Table 6 shows combined thresholds of slope angle and forest density (Campbell and Gould, 2013), and these proportions can be applied when using GIS tools (Fig. 4). For example, the term large proportions in Table 3 means > 45 % of the terrain (Table 6). From a practical perspective, the average tree spacing is estimated as the distance between individual stems in various locations and is then applied to the entire slope to get an average value. The largest forest openings in Fig. 3 are 760 m long and 170 m wide, with slope angles of 30–45°, so there is little protection from avalanches here. For skiers descending this slope, it would be possible to sneak through this terrain under unstable conditions by following the contiguous strips of dense forest. However, these are very close to the large open glades, with limited options for reducing exposure.
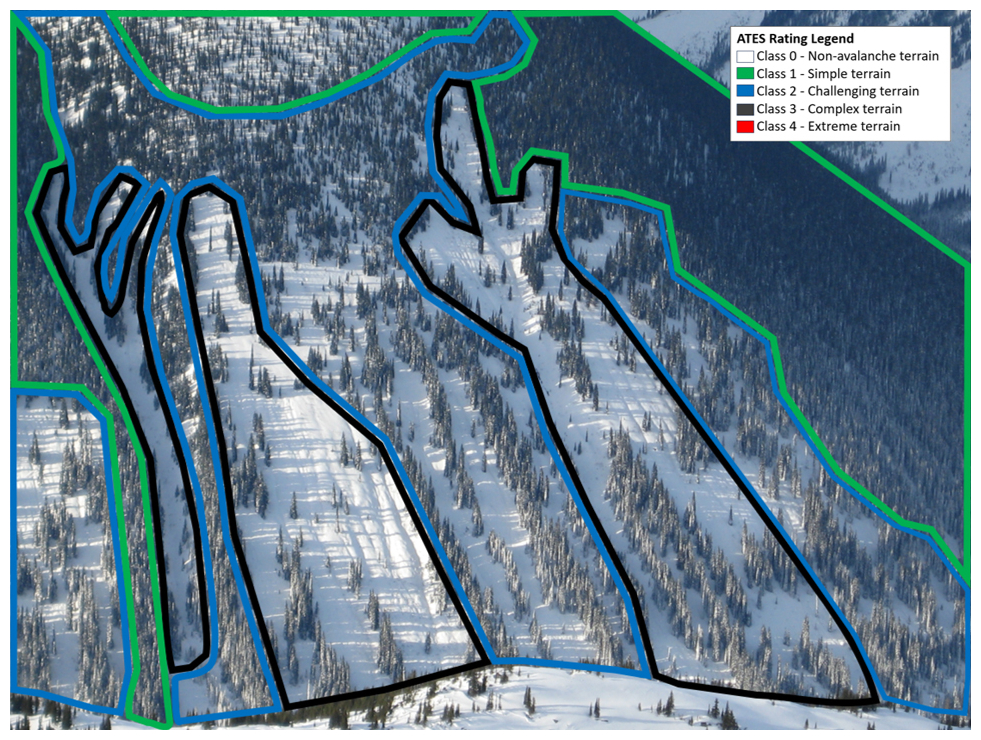
Figure 5ATES zoning based on the combination of slope angle and forest density, showing zones of Class-1, Class-2, and Class-3 terrain across the area in Fig. 3.
The overall terrain rating for the area shown in Fig. 3 would be Class 3 – Complex terrain, as single ratings usually default to the highest level within the area. However, smaller-scale zoning would consider the different distributions of forest density and slope angle, resulting in zones of Class-1, Class-2, and Class-3 terrain (Fig. 5).
4.2.3 Slope shape
The shapes of snow-covered slopes play an essential role in route-finding through avalanche-prone terrain. During backcountry travel, risk is routinely reduced by carefully weaving through terrain features and relying on their shapes to manage spatial exposure. Stopping on high ground to keep people above the flow of an avalanche, using the terrain's shape to set a track that avoids trigger spots and overhead hazard, minimizing spatial and temporal exposure whenever possible, and avoiding steep unsupported (convex) slopes are all best practices of professional mountain guides (ACMG, 2023). The more convoluted a slope shape is, the more complicated it is to travel through it.
Although slope curvature is a source of tensile stress (McClung and Schaerer, 2023), the effects of microtopography and slope curvature on avalanche release are not understood well. Convex terrain is said to be unsupported because, on the vertical axis, it rolls over at the top of the slope and becomes steepest near the bottom (i.e., the toe of the slope). Convexities add tension to the snowpack and are common trigger points given additional load (Landrø et al., 2020). Even when an avalanche is triggered from low on the slope, below the convexity the crack radiates outward from the trigger point, propagating upslope, downslope, and across the slope. The upslope portion of the crack frequently arrests on convexities, where a tensile fracture forms the crown face (Trottet et al., 2022).
Furthermore, conventional avalanche safety has traditionally taught avoidance of convex terrain in favour of planar or concave slopes when finding routes (Ferguson and LaChapelle, 2003; Haegeli, 2013), because concave slopes are thought to have less tensile stress and better toe support. In Canadian helicopter skiing, the most frequently closed ski runs (i.e., the most hazardous ones) are characterized as having more unavoidable, unsupported terrain shapes (Sterchi and Haegeli, 2019). However, recent research into avalanche accidents and the terrain use patterns of professional guides shows more accidents on planar and concave terrain (Vontobel et al., 2013; Harvey et al., 2018) and that professional guides tend to choose planar terrain in their route selection (Thumlert and Haegeli 2018).
Convoluted terrain also presents more spatially variable snowpack stability compared to planar terrain, because the depth and distribution of the snow are non-uniform. This is primarily due to redeposition from wind effects across uneven topography, both scouring and loading snow around micro-terrain features. These wind effects in convoluted terrain increase spatial variability, which is directly related to more trigger points and greater uncertainty in snow slope stability evaluation (Schweizer et al., 2008). As the variance increases, it creates more trigger spots on the slope because it creates more areas where the slab is thinner and the weak layer can be triggered (Meloche et al., 2025). Zones of terrain that present mixed concave, convex, and planar shapes (Fig. 6) usually present a snowpack with more trigger points than zones with a smooth, evenly distributed snowpack where the depth and layer distribution are more predictable.
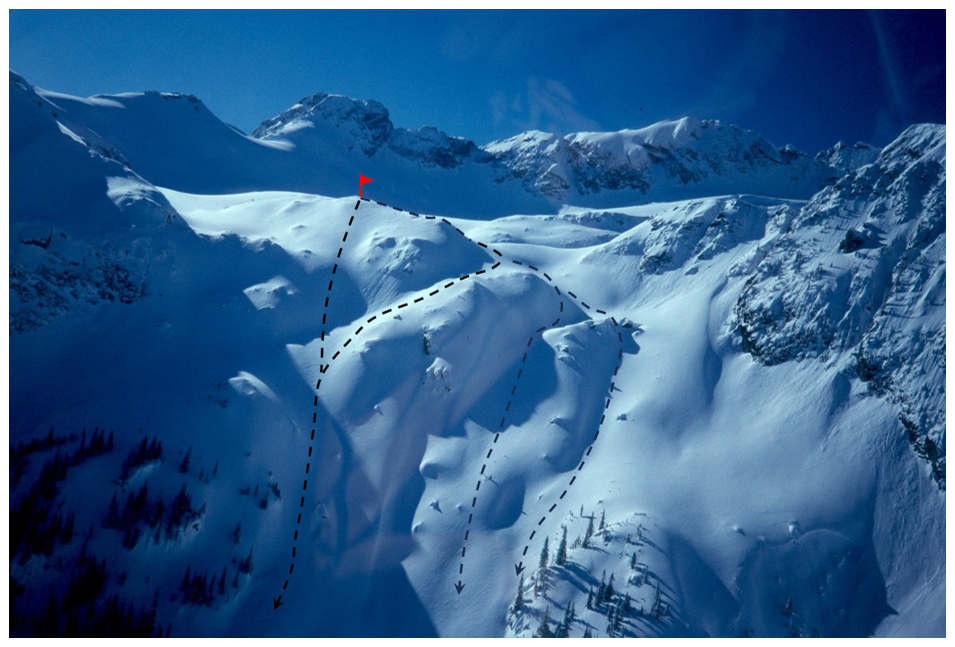
Figure 6A helicopter ski run rated Class 3 – Complex terrain, where the slope shapes are convoluted and include gullies, convex rolls, concave slopes, and thin rocky snowpack areas. The dashed lines indicate typical descent routes weaving around convexities to reach planar, well-supported terrain shapes with more consistent snowpack depth and avoiding obvious trigger points.
The shape of an individual slope is not usually the defining criterion within ATES; i.e., one convex or concave slope is unlikely to determine the rating, unless that single slope forms the crux of the route. Instead, slope shape should be considered in the aggregate across a larger area, recognizing the influence of that terrain's shape on both avalanche triggering and route finding. Large areas of convoluted terrain are more complex to deal with than large areas of planar terrain, even though in planar terrain there may be fewer options for safe travel. The ATES Technical Model (Table 3) uses the following terms to describe progressively increasing severity in slope shape: “flat”, “undulating”, “planar”, “concave”, “convex”, “convoluted”, “intricate”, and “cliffy”.
Our understanding of the effects of slope shape on avalanche behaviour are not well understood and not well supported in the literature. This is despite strongly held convictions by experienced mountain and ski guides, who maintain that the shape of the terrain is one of the most important influences on their route selection. This topic is rich with opportunity for future research.
4.2.4 Terrain traps
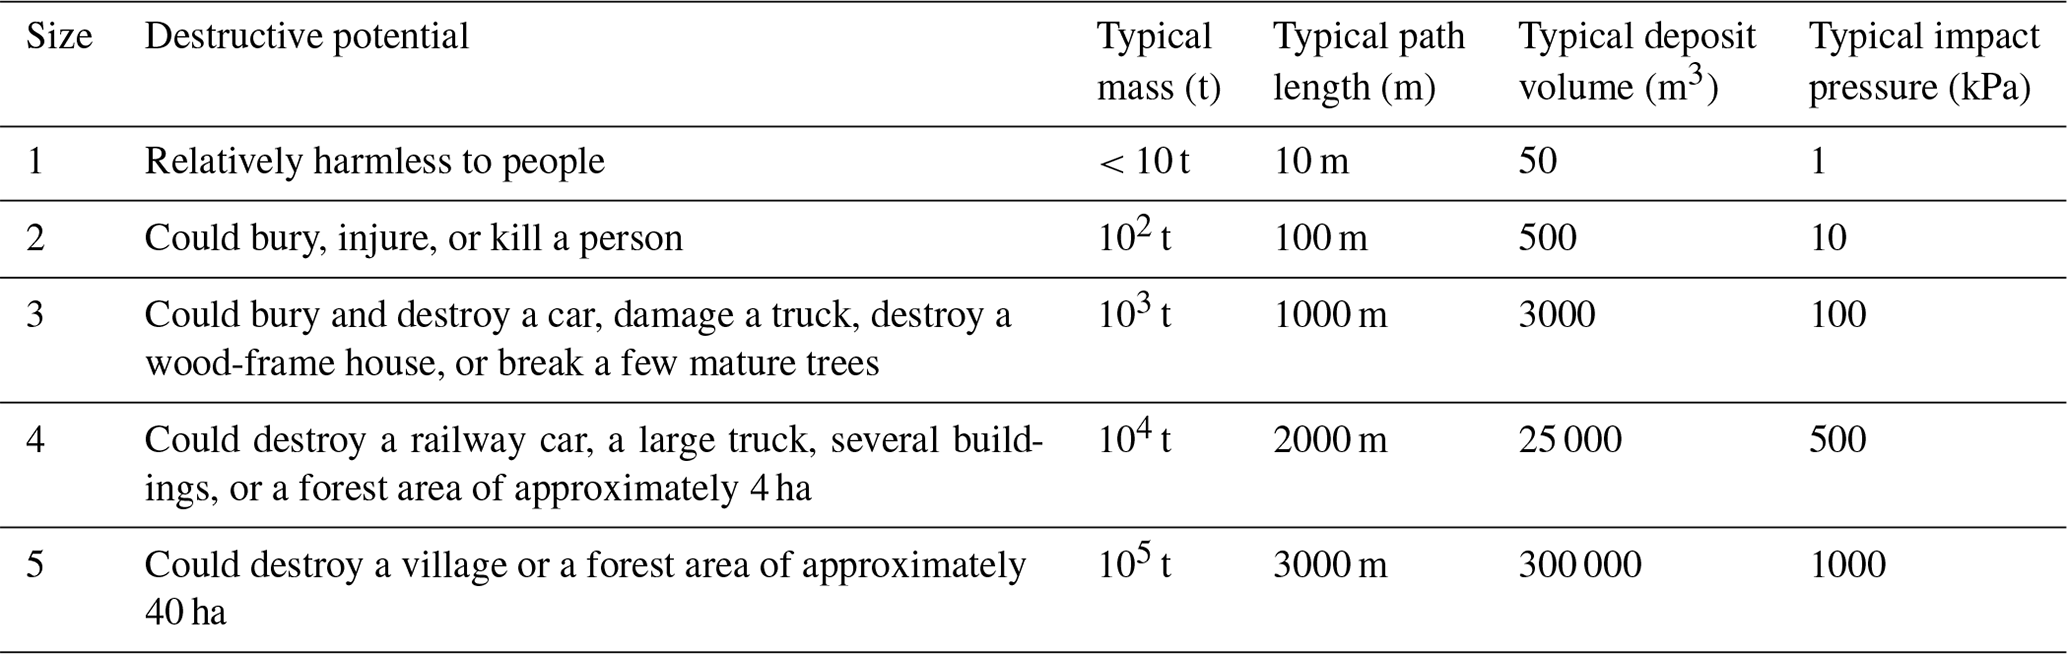
Terrain traps are topographic features in avalanche paths that increase the consequences of being caught in an avalanche, including serious injury or death from an otherwise harmless avalanche. While the mass of snow in a Size-1 avalanche (Table 8) is not enough to bury a person on a smooth slope, it can be forceful enough to push them off a cliff or bury them in a gully where the avalanche debris concentrates and becomes locally deep.
Campbell and Gould (2013) categorized terrain traps into those that increase the likelihood and depth of burial and those that can cause trauma to someone caught in a flowing avalanche. For example, gullies, depressions, and abrupt transitions concentrate avalanche flow, resulting in an increased depth of accumulated debris (Fig. 7), while being carried over cliffs or impacting trees, rocks, and other downslope obstacles can result in trauma. Trauma has been shown to be the primary cause of death in 20 %–30 % of avalanche fatalities (Boyd et al., 2009; Sheets et al., 2018; McIntosh et al., 2019). Campbell and Gould (2013) then ranked the severity of terrain traps in terms of increasing consequences from an otherwise harmless avalanche to one that can cause partial burial, minor injury, complete burial, or serious and fatal trauma. Harvey et al. (2018) calculated burial and fall potential using a high-resolution DEM to create a raster-based layer describing avalanche consequences.
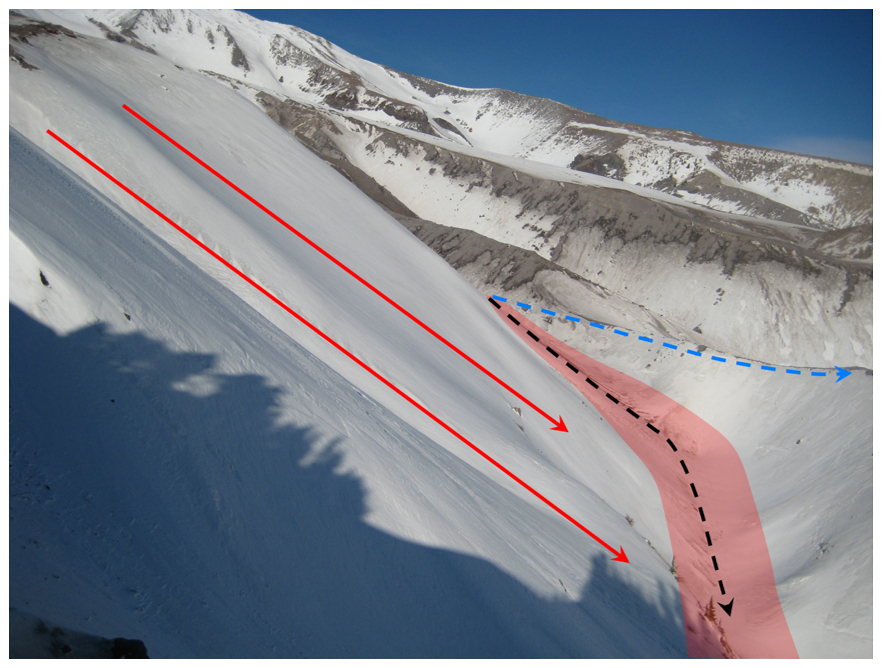
Figure 7A dangerous terrain trap where avalanches run down the red flow lines and accumulate deep avalanche debris in the gully below (pink deposition area). The black route is rated Class 3 – Complex terrain and is a poor route choice due to the unavoidable terrain trap, whereas the blue route on the crest of the moraine is Class 2 – Challenging terrain because it avoids most of the exposure.
ATES v.2 uses exposure to physical terrain traps such as gullies, cliffs, trees, and crevasses as a measure of terrain severity, and an increase in the number and severity of these terrain traps will have a corresponding effect on the ATES rating.
4.2.5 Frequency and magnitude
The frequency of a natural hazard is the number of times it occurs within a specified time interval (Jackson, 2016). Avalanche frequency within a specific avalanche path is the expected (average) number of avalanches per unit time reaching or exceeding a location (CAA, 2016). This is typically expressed in units of avalanches per year as a ratio that ranges from 1 : 1 (i.e., one avalanche per year) to 1 : 300 (i.e., one avalanche in 300 years). Avalanche paths producing multiple avalanches per year can also be described in the same way (e.g., 3 : 1 is three avalanches per year).
Table 7Avalanche frequency terminology and the associated frequency values and ranges used in ATES.
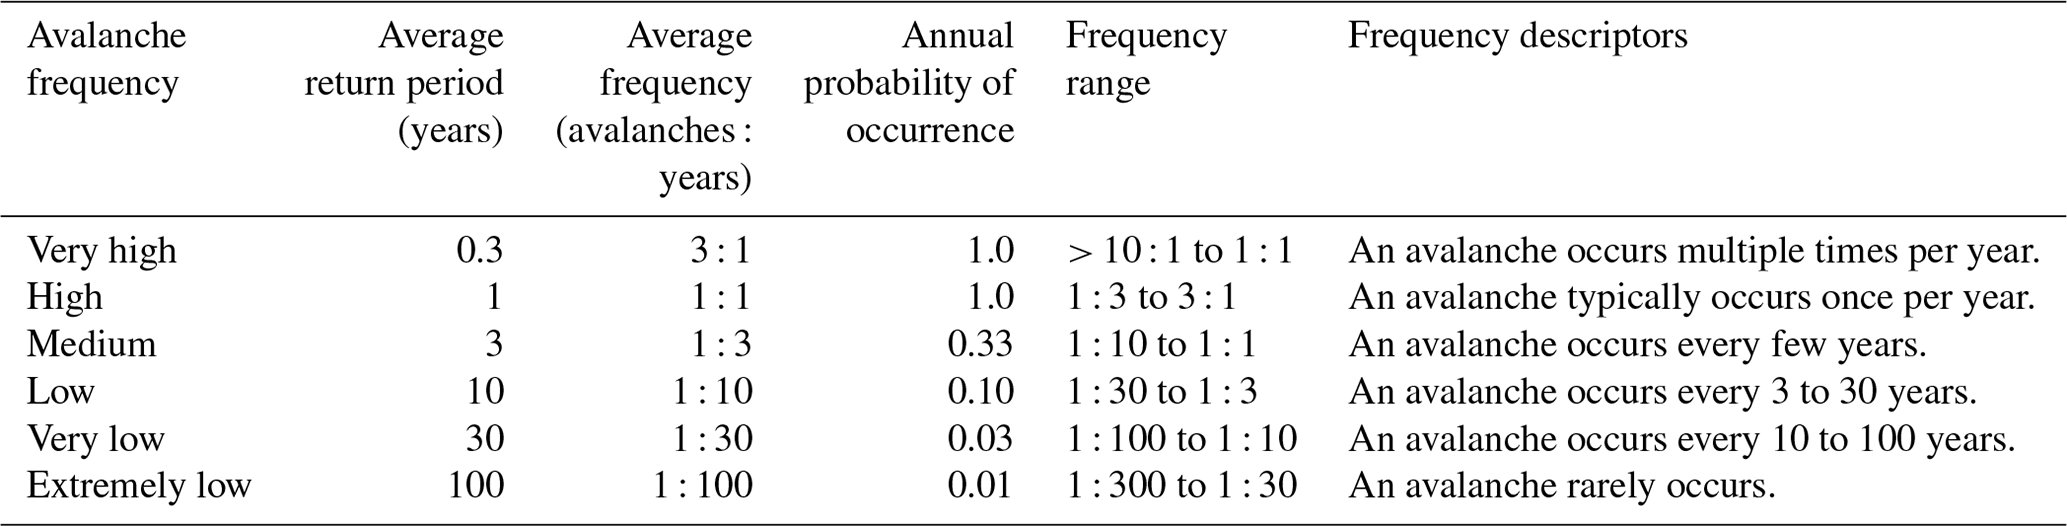
In practice, formal assessments of avalanche frequency are commonly done during the avalanche planning process for infrastructure developments such as roads or buildings, but this practice is less common for recreation. Avalanche frequency is commonly expressed using terminology such as low and high, which correspond to a set of frequency ranges (Table 7).
Table 8The destructive avalanche size classification system (CAA, 2024).
Avalanche frequency can be difficult to assess accurately. With good records kept over a long enough period, reasonable estimates of long-term frequency can be made. However, in the absence of good records, avalanche frequency estimates are a subjective exercise using a combination of local knowledge, records, stories, modelling, and indirect observations such as dendrochronology (Carrara, 1979). These are often rough estimates, but a lack of formal records does not diminish the importance of avalanche frequency and its influence on avalanche risk assessments and ATES ratings.
For backcountry travel applications, avalanche frequency is a critical measure of terrain severity; i.e., terrain that is known to produce avalanches more frequently is comparatively more dangerous than terrain that produces avalanches less frequently. Commercial backcountry operations are acutely aware of their high-frequency locations and treat them with respect when doing risk assessments. Accordingly, avalanche frequency carries significant weight as an ATES parameter in both the assessment and communication of the avalanche terrain ratings (Tables 1 and 2). Thresholds for frequency and magnitude are the dominant defaults in the ATES Technical Model (Table 3), meaning that, if that threshold is met, the terrain rating defaults to that category or higher.
Avalanche frequency is the only ATES parameter that considers the influence of the snowpack. This is possible within a static rating system because frequency is a long-term measurement that depends on snow climate (Haegeli and McClung, 2007) rather than short-term weather fluctuations. Consequently, avalanche frequency is assumed to be a constant parameter for a specific location, because each winter the probability of an avalanche with a certain frequency at that location is the same. However, avalanche frequencies are vulnerable to the changing climate, as changes in climate patterns will result in changes in avalanche frequencies.
Avalanche frequency depends on the position within an avalanche path, which is addressed differently for different ATES applications. For specific routes where the exposure is known (i.e., ATESlinear), the expected frequency of avalanches reaching the route is used, whereas for ATES zoning applications frequency is used to define positions within the track and runout zones (i.e., higher-frequency avalanches stop higher in the runout zone or track than lower-frequency avalanches).
This also has important implications for dry climates, where avalanche frequencies are typically lower than in wetter climates, and thus the ATES ratings will be lower to reflect the lower long-term frequency in dry areas. ATES for waterfall ice climbing (Table 2) relies heavily on avalanche frequency assessments due to the problem of overhead hazard associated with this activity.
The magnitude of a natural hazard is related to the energy released by the event. It is distinguished from intensity, which is related to the effects at a specific location or area (Jackson, 2016). Avalanche magnitude considers the destructive potential of the avalanche and is defined according to the Canadian avalanche size classification system (Table 8). Magnitude is inversely related to frequency because large destructive avalanches occur less frequently, while smaller ones occur on a more regular basis. Magnitude and frequency are also co-related to a specific location in an avalanche path. For example, a location near the bottom of an avalanche path will be affected by larger avalanches less frequently, relative to a location higher in the same path.
4.2.6 Starting zone size and density
Increasing exposure to avalanche starting zones increases the severity of the terrain rating due to a higher likelihood of triggering or getting caught in an avalanche. In the ATES Technical Model, starting zone size is described in terms of the potential size of avalanche release, whereas starting zone density refers to the number of starting zones within the area or along the route being assessed. This is particularly important with respect to route options and overhead hazard.
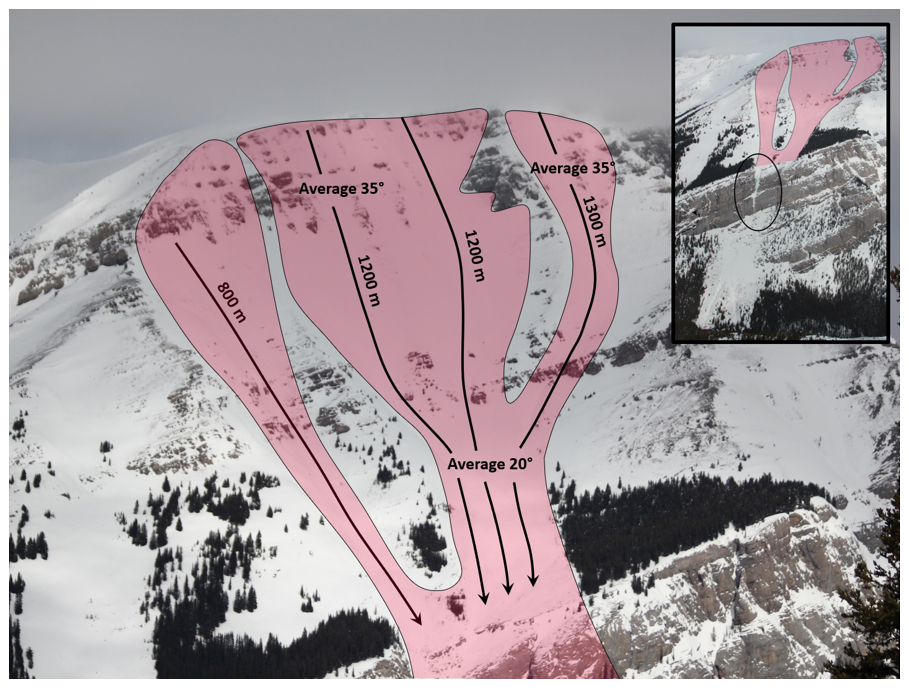
Figure 8Multiple large avalanche starting zones and tracks converge to create significant overhead hazard above the ice climb Bourgeau Left-Hand (inset) in the Canadian Rockies. This route is rated ATES Class 4 – Extreme terrain due to the overhead hazard, > 1 : 1 frequency for > size-2 avalanches, and the possibility of human triggering while en route.
The number of starting zones, together with their size and proximity to the route, influences the overall ATES rating. Exposure to an isolated, single starting zone is usually less severe than exposure to multiple starting zones, but this would depend on their size and frequency. Overhead hazard (Fig. 8) presents an additional challenge, particularly as the exposure becomes higher in the avalanche path and closer to the starting zone. Remote or toe triggering of slopes is an important consideration when the exposure occurs below or to the side of the starting zone.
4.2.7 Runout zone characteristics
Runout zones are the lowest portion of an avalanche path, beginning below the track and extending downslope to the maximum extent of the avalanche path. This is where avalanches begin to decelerate and deposition of snow and entrained material occurs. Certain terrain attributes affect the degree of avalanche exposure within runout zones. Characteristics such as runout zone shape (e.g., abrupt transitions and confinement), terrain obstacles, and ground roughness influence avalanche runout behaviour, while proximity to starting zones, interconnectedness, and surface features influences the potential for remotely triggered avalanches. A remotely triggered avalanche occurs when a crack is initiated and propagates into adjacent terrain before causing a slab to release.
The ATES Technical Model (Table 3) considers two avalanche risk scenarios in runout zones: (1) being struck by a natural avalanche starting overhead and (2) remotely triggering an avalanche by propagating a crack upslope into the starting zone where an avalanche releases. Every runout zone exposure scenario is unique, from simply crossing through the runout zone to travelling up the middle of it, directly under the avalanche track.
The ATES Technical Model describes exposure to runout zones on a continuum starting with Class-1 terrain with smooth, well-defined runouts with no connection to starting zones above (Fig. 9), extending to Class-3 and Class-4 terrain where runout zones are overlapping, steep, or confined or contain terrain traps such as cliffs or crevasses. Class-3 and Class-4 runout zones may also have the potential to propagate remote avalanches to adjacent or overhead starting zones.
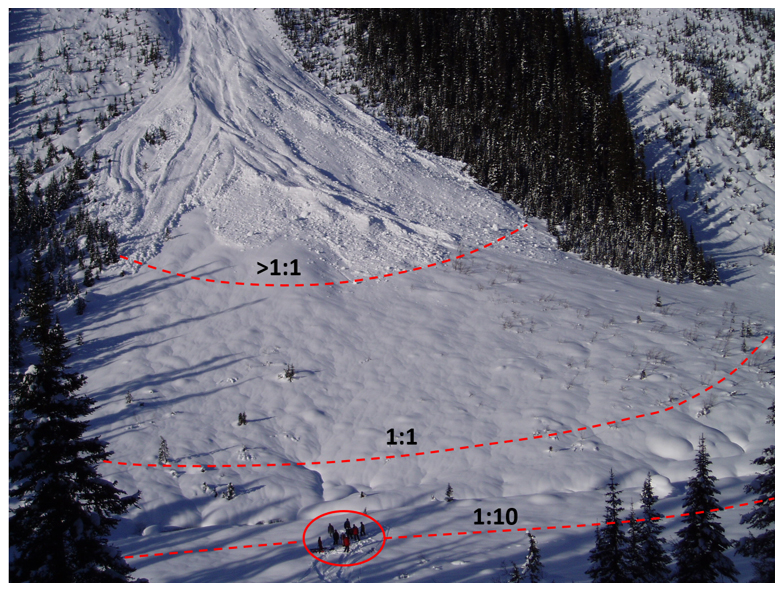
Figure 9An avalanche runout zone with a smooth surface, well-defined boundaries, and no potential to propagate into nearby starting zones. Estimated avalanche frequencies are shown, indicating that the helicopter pickup location (red circle) is exposed ∼ 1 : 10 years for > size 3, which makes this location ATES Class 2 – Challenging terrain.
4.2.8 Route options
Route options are different ways of travelling through terrain and, typically, every option presents a different level of exposure to avalanches and thus a different level of risk. Terrain with route options allows for different route-finding choices (Fig. 10a), facilitating good risk management under various conditions. This contrasts with terrain that has limited or no route options, where people can be forced into terrain that will increase their risk (Fig. 10b). Understanding and assessing route options is a crucial backcountry travel skill that occurs continuously from the planning stage right through to execution. Accordingly, route options are among the most important input parameters of ATES, simply because optional exposure is much less committal than mandatory exposure.
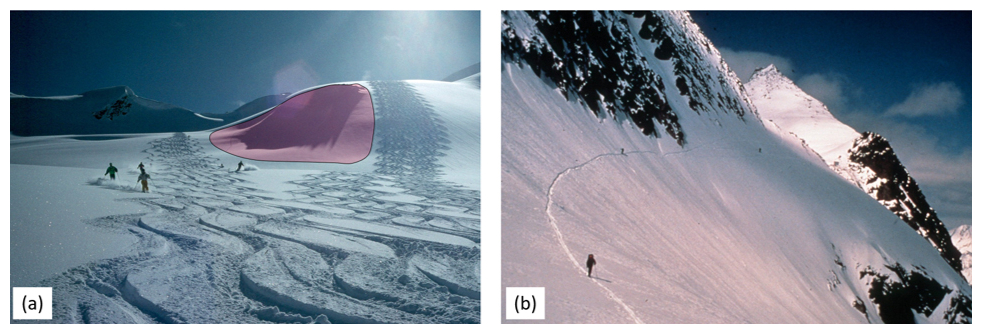
Figure 10Panel (a) shows ATES Class 2 because options exist for avoiding avalanche paths, whereas panel (b) shows ATES Class 3 because there are limited options for reducing exposure and avoidance is not possible; one must travel above a cliff to complete this route.
Assessing route options depends on what is being assessed: a specific, predetermined route or corridor (ATESlinear) or an area or zone of terrain with no fixed route (ATESspatial). Class-0 terrain avoids all avalanche terrain, Class-1 terrain can have many route options (some with no exposure), Class-2 terrain may be exposed to significant avalanche terrain but with options for avoiding it, Class-3 terrain has limited options with avoidance not possible, and Class-4 terrain forces mandatory, often extended exposure.
Basic risk management principles imply that, when the avalanche hazard is high, backcountry users should choose routes with low avalanche terrain exposure to reduce risk; conversely, when the avalanche hazard is low, choosing routes with higher avalanche terrain exposure may be an acceptable risk (Haegeli et al., 2006). For some people though, higher levels of avalanche terrain exposure (or any avalanche terrain exposure) are never an acceptable risk, and in this case the presence or absence of route options is crucial information, especially the option of avoiding avalanche terrain completely (i.e., Class 0).
4.3 Signal words, colours, and numbers
To provide options for communicating ATES ratings to different audiences and to meet accessibility objectives, the system uses a combination of signal words, colours, and numbers unique to each rating level (Table 9). Depending on the approach (Table 10) and the channels of communication (e.g., digital, map, or paper), different combinations of colours, words, and numbers can be used to reach the target audience and to ensure inclusion and accessibility for all users of ATES.
Table 9Signal words, numbers, and colours associated with ATES.
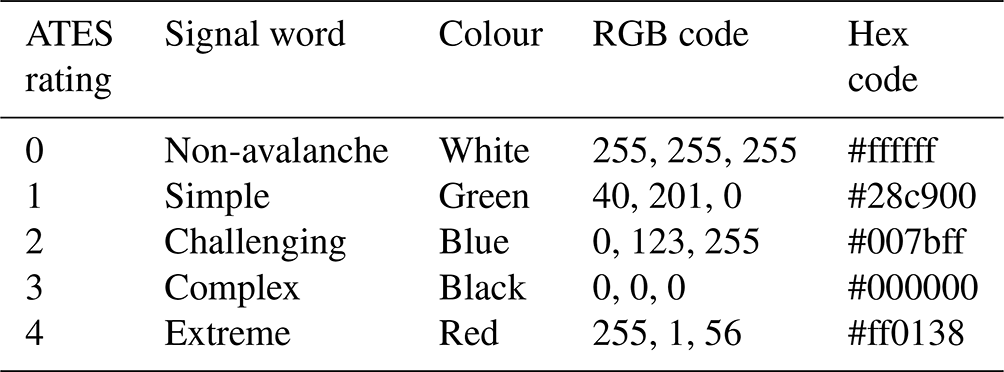
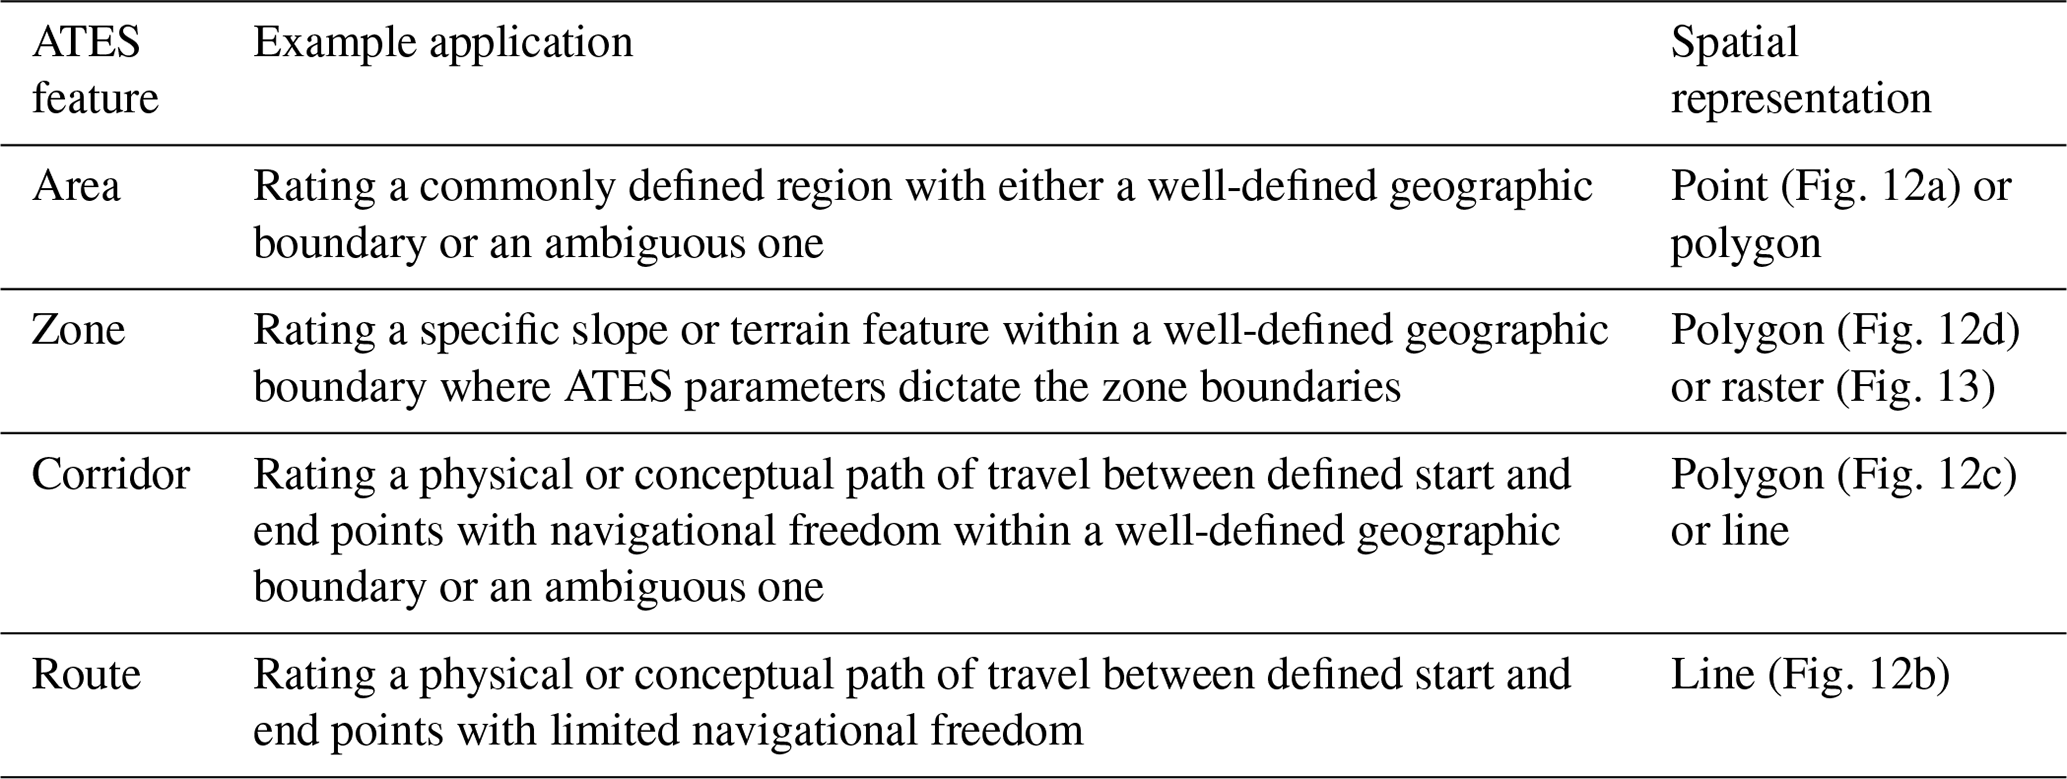
Table 10ATES approaches showing feature types and their spatial representations (Sharp et al., 2023).
Signal words are single terms that are used to denote the overall level of hazard implied by a warning (Hellier and Edworthy, 2006). They draw attention to a sign or label and quickly communicate the level of hazard. For ATES, each signal word is associated with a number which serves as a multilingual label. While numbers are helpful in a multilingual environment, they can be wrongly interpreted as having some specific value or implying linear growth between levels, which is incorrect. These numbers are simply labels.
Additionally, each rating level is assigned a unique colour for labels, lines, or polygons on a map (Table 9). ATES colours were originally chosen to mimic the North American ski run difficulty system of green, blue, and black (Statham et al., 2006) that is intuitive to North American users. European applications subsequently changed complex terrain from black to red in order to be consistent with the ski run difficulty system in Europe. As a result, European ATES maps use different colours to represent complex and extreme terrain. ATES v.2 continues with the original colour scheme and adds white for Class-0 terrain and red for Class-4 terrain (Table 9).
However, warning system colours can present difficulties for people with colour vision deficiency (CVD), and not all colours work well when overlain on maps, especially when maintaining visibility of the underlying map reference layers is important. Polygon transparency settings must be chosen carefully to ensure that the underlying basemap data remain visible. While black was originally a logical choice for complex terrain because it is intuitive to skiers as a higher degree of terrain severity (Statham et al., 2006), this was before ATES became a mapping system. Today, black is a poor colour choice for displaying ratings on some maps, as the basemap data are easily obscured and black lines can be difficult to distinguish on dark-coloured mapping such as Google Earth (Fig. 1).
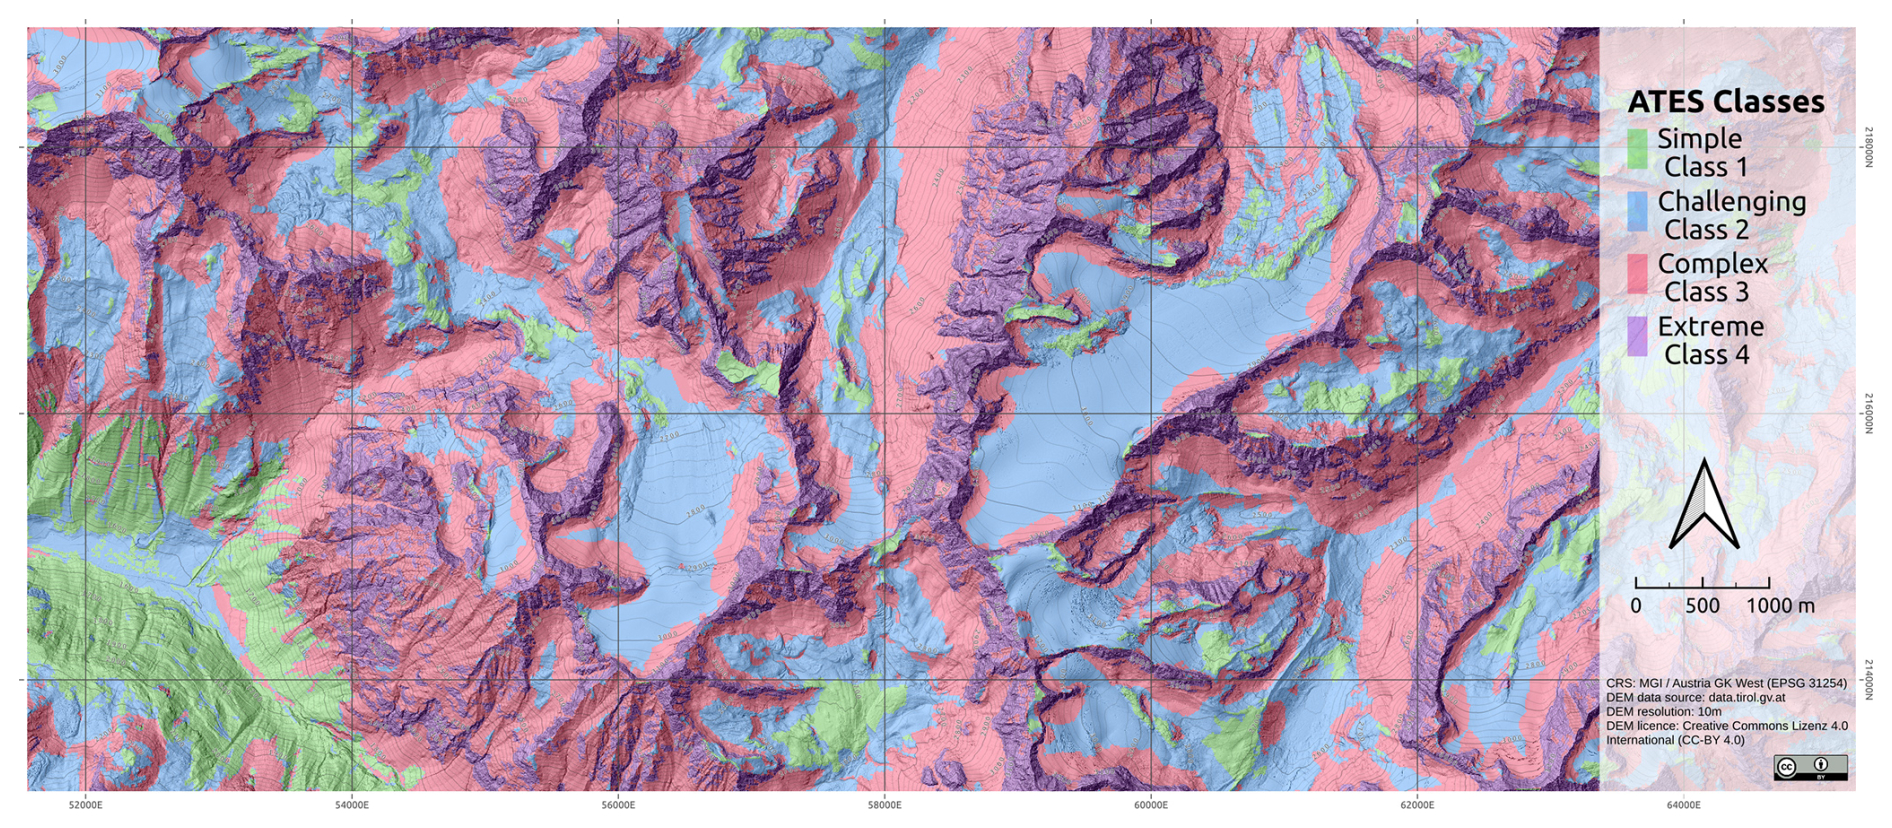
Figure 11An AutoATES map produced for a test site in Austria (Huber et al., 2023) that explores different colour patterns for complex (red) and extreme (purple) terrain.
Many warning systems in society use green and red, which poses a significant challenge for users with CVD. Engeset et al. (2022) tested six different colour combinations of ATES for conflicts with the avalanche danger scale colours and for users with CVD, recommending red for complex terrain and black–red cross-hatching for extreme terrain. Huber et al. (2023) present an ATES map for a test site in Austria using red for complex terrain and purple for extreme terrain, which shows the underlying basemap data well (Fig. 11). Sykes et al. (2024) tested colours using a colour blindness simulator (Colblindor, 2024) and updated the ATES colour codes to improve accessibility (Table 9).
In order to communicate with a diverse audience, including those with CVD, ATES v.2 uses a combination of signal words, numbers, and colours to provide options for different ways of communicating with different receiver groups. Computers, websites, and digital products can use colour-blind filters which help with deuteranopia, protanopia, and tritanopia. The design of an updated colour palette for ATES remains an open research question, and user testing is necessary to determine a colour standard that achieves the best balance between comprehension, basemap visibility, and CVD compliance.
No single scheme works for all target audiences. Applying a suitable combination of colours, numbers, and signal words in combination with an accessible legend is likely to achieve the best results.
4.4 Target audience
A thorough understanding of the receiver, i.e., the target audience, is necessary for effective risk communication. Laughery and Brelsford (1991) implored warning designers to “know thy user” with regard to (1) demographics and age, (2) familiarity with the product, (3) competence (technical knowledge, language, and reading ability), and (4) hazard perception.
The ATES system has three distinct target audiences:
-
avalanche professionals, educators, mappers, and guidebook authors;
-
backcountry recreational travellers like skiers, snowboarders, snowmobilers, snowshoers, climbers, and hikers; and
-
backcountry workers like persons employed to perform work in avalanche terrain.
The Technical Model (Table 3) is designed for avalanche professionals, mappers, or guidebook authors to use its specifications to assess avalanche terrain, determine the exposure of people to that terrain, and produce an ATES rating. The Technical Model also targets avalanche educators, who can use the model's specifications for teaching the specific elements of avalanche terrain, how each is scaled, and how they interact with the exposure of people to determine the severity of avalanche terrain exposure.
The Communication Model for backcountry travel (Table 1) is targeted at all backcountry users who move through avalanche terrain, regardless of recreation type. The language gives simple advice on expectations of exposure and potential options for mitigating risk. ATES is analogous to the avalanche danger scale (Statham et al., 2010; Avalanche Canada, 2022; EAWS, 2024) and targets the same audience, including workers (often industrial or resource staff) who follow rule-based workplace safety practices.
The Communication Model for waterfall ice climbs (Table 2) targets winter ice climbers and focuses on the concepts of exposure time, avalanche frequency, human triggering in terrain traps, and options for reducing exposure. The system was recently applied to Avalanche Canada's ice climbing avalanche atlas (Statham and Heuniken, 2023).
The application of ATES starts by considering the objectives of the final product, which informs the approach to assessment and communication methods. The objective and approach depend on the target audience, their intended use of the terrain ratings, and the availability of terrain data.
For example, the objective might be to facilitate recreational trip planning, in which case a single ATES rating for a specific area or route might be sufficient or multiple rating segments along that route for a more precise assessment. However, a navigational aide for backcountry travellers would typically require high-resolution ATES zones or specific route segments. Over the past 2 decades of ATES use, four distinct approaches to ATES classification have emerged (Table 10).
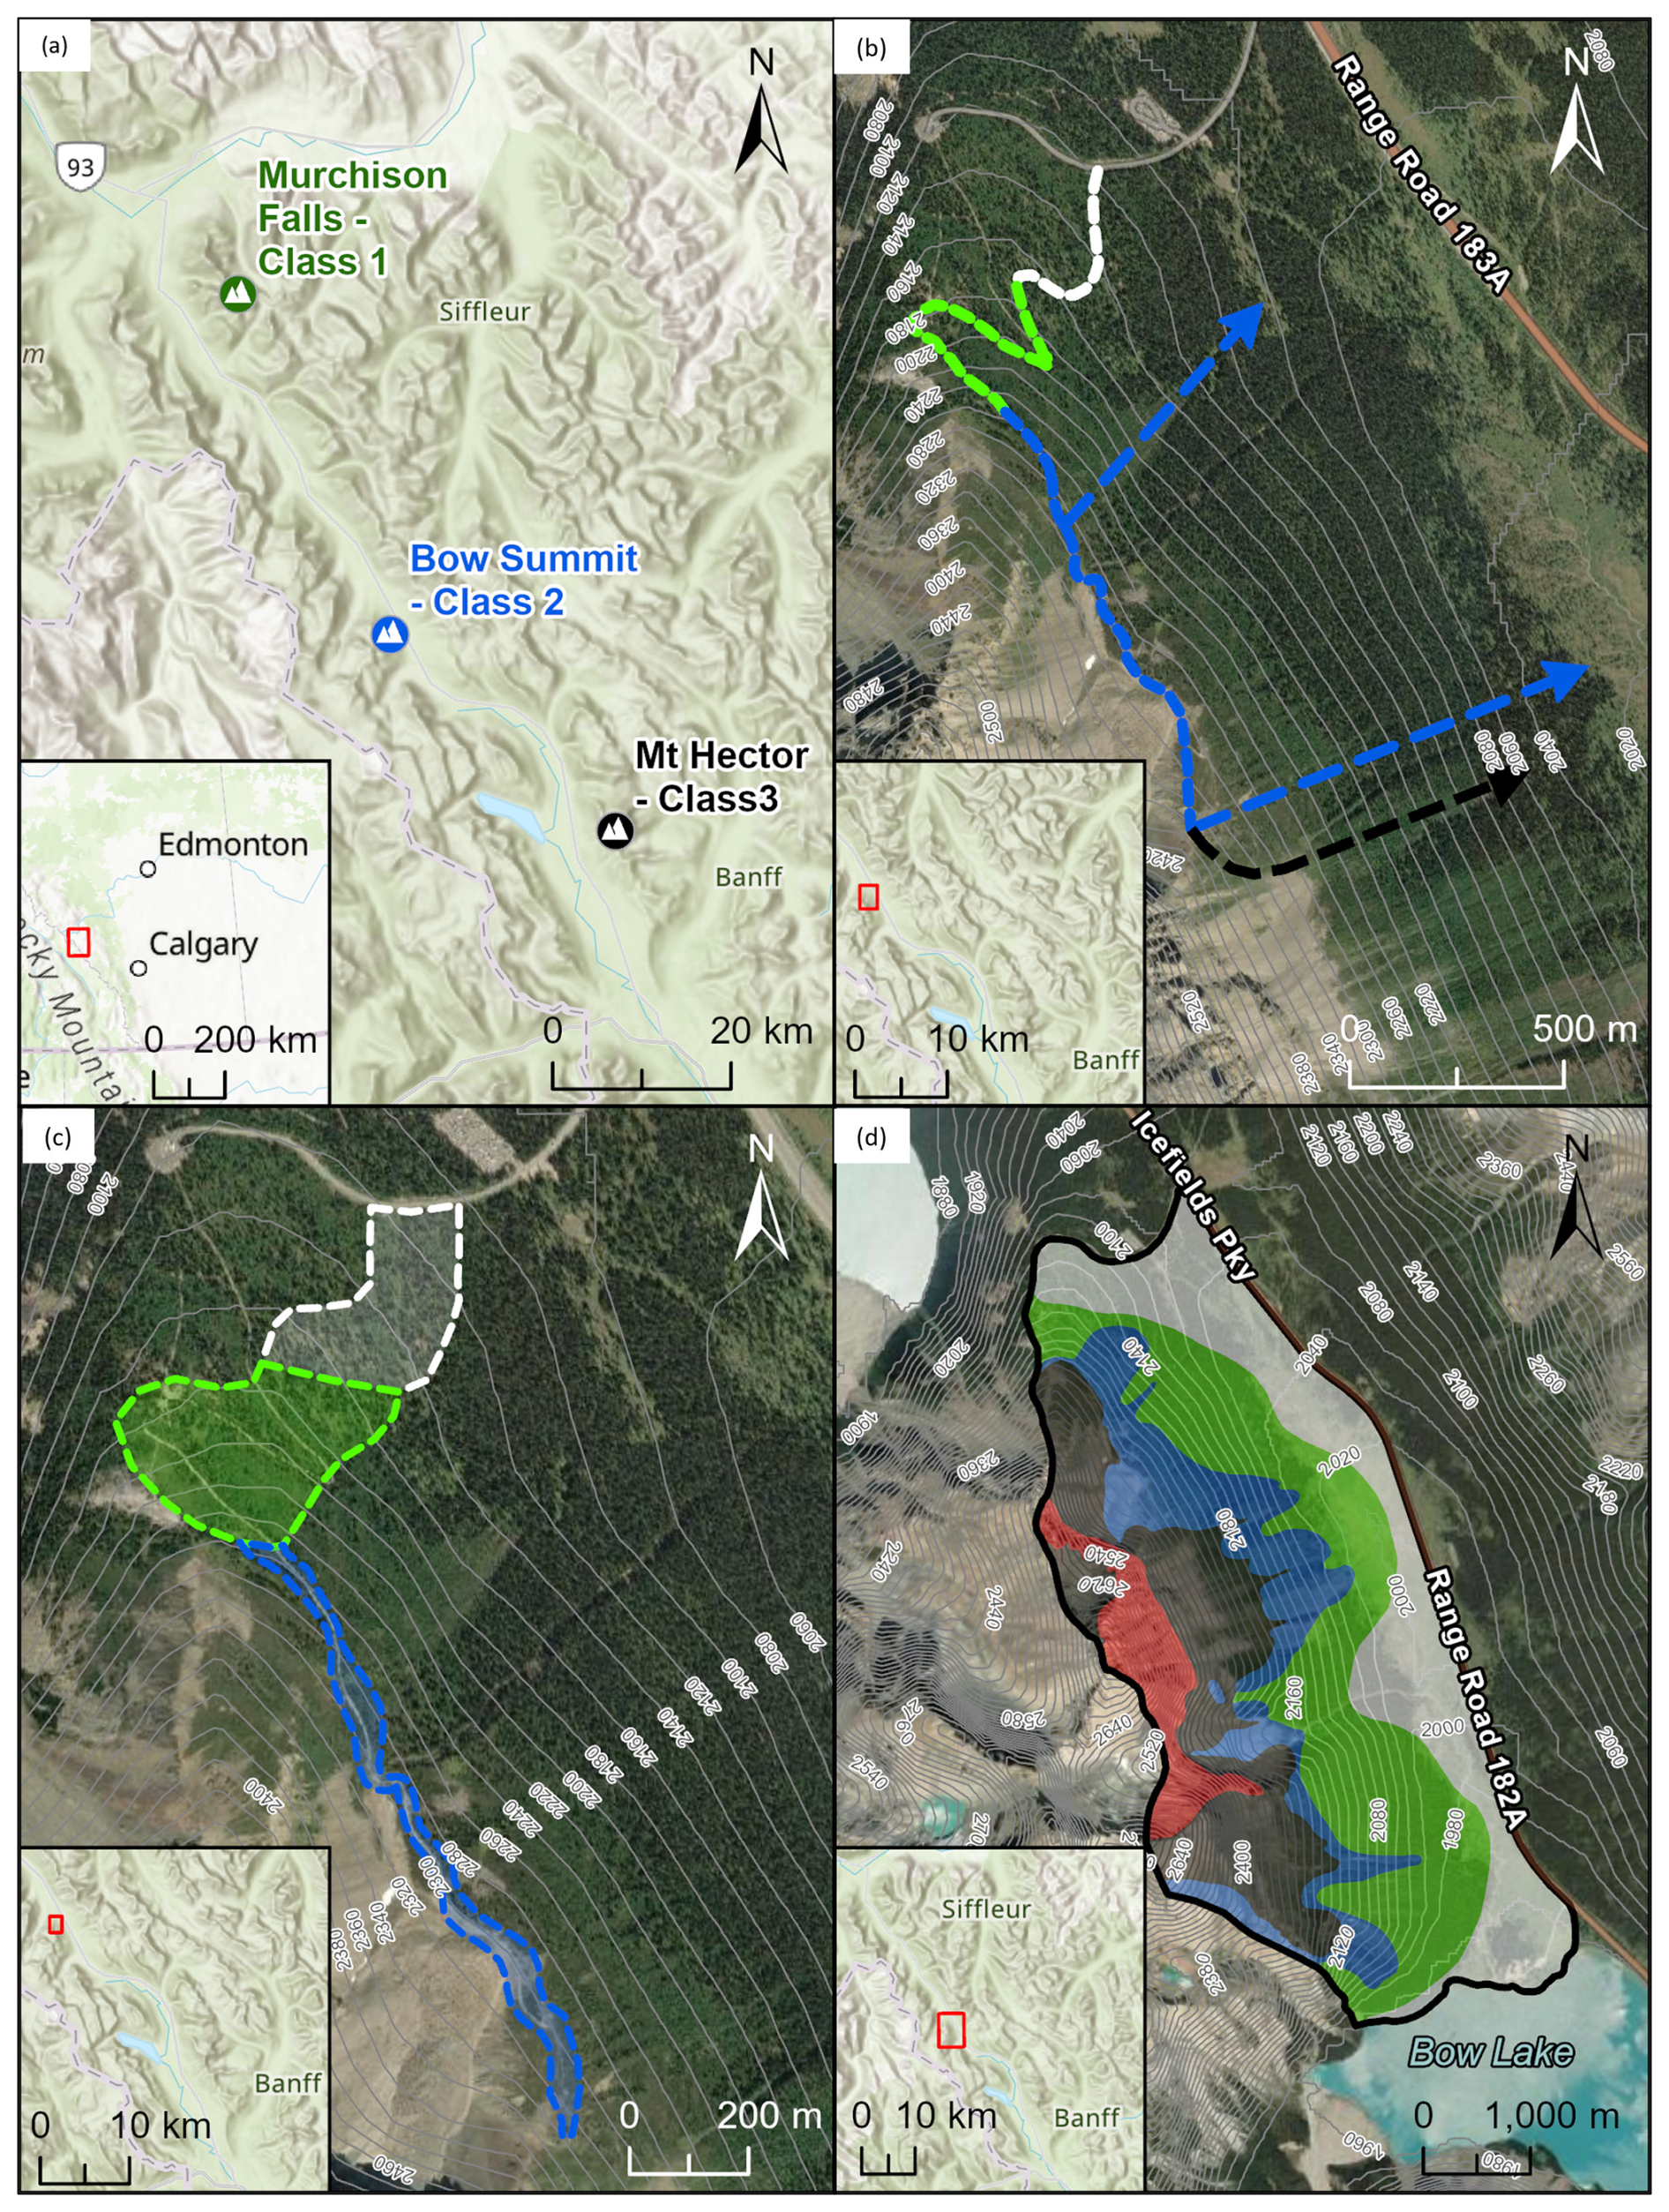
Figure 12Spatial representations of different ATES feature types illustrating areas represented as single-rating points (a), multi-rating routes represented as lines (b), multi-rating corridors represented as polygons, and ATES zones represented as polygons. Basemap sources: Natural Resources Canada and Esri.
An area defines the boundaries of an overall assessment and can either be given a single rating (Fig. 12a, b) or be broken down into smaller-scale zones (Fig. 12c). A route defines a linear path of travel from start to finish (Fig. 12d) and can be broken down into shorter segments using lines to represent precise routes and polygons to represent a corridor of travel where navigational freedom is possible (Fig. 12b). A zone is a specific slope or grouping of terrain features with common ATES characteristics that uses a polygon to spatially represent it, and it is typically surrounded by adjacent polygons showing ATES zone ratings (Fig. 12c).
The major difference between these approaches is that ATES ratings for routes rate the actual terrain exposure of specific, predetermined routes or corridors, such as an ice climb or ski tour where the start, route, and endpoint are known. ATES ratings for areas or zones rate the potential terrain exposure because a specific route is not prescribed, such as an open alpine bowl with numerous different ski lines. In this case, once a route has been planned through the terrain, the actual exposure can be evaluated and related to the ATES ratings.
5.1 Spatial scale
Spatial scale refers to the size or extent of a geographic area. Table 11 describes spatial scales used in avalanche forecasting (Statham et al., 2018), and these scales also relate directly to avalanche terrain assessments.
Table 11Spatial scales for ATES assessments (Statham et al., 2018).
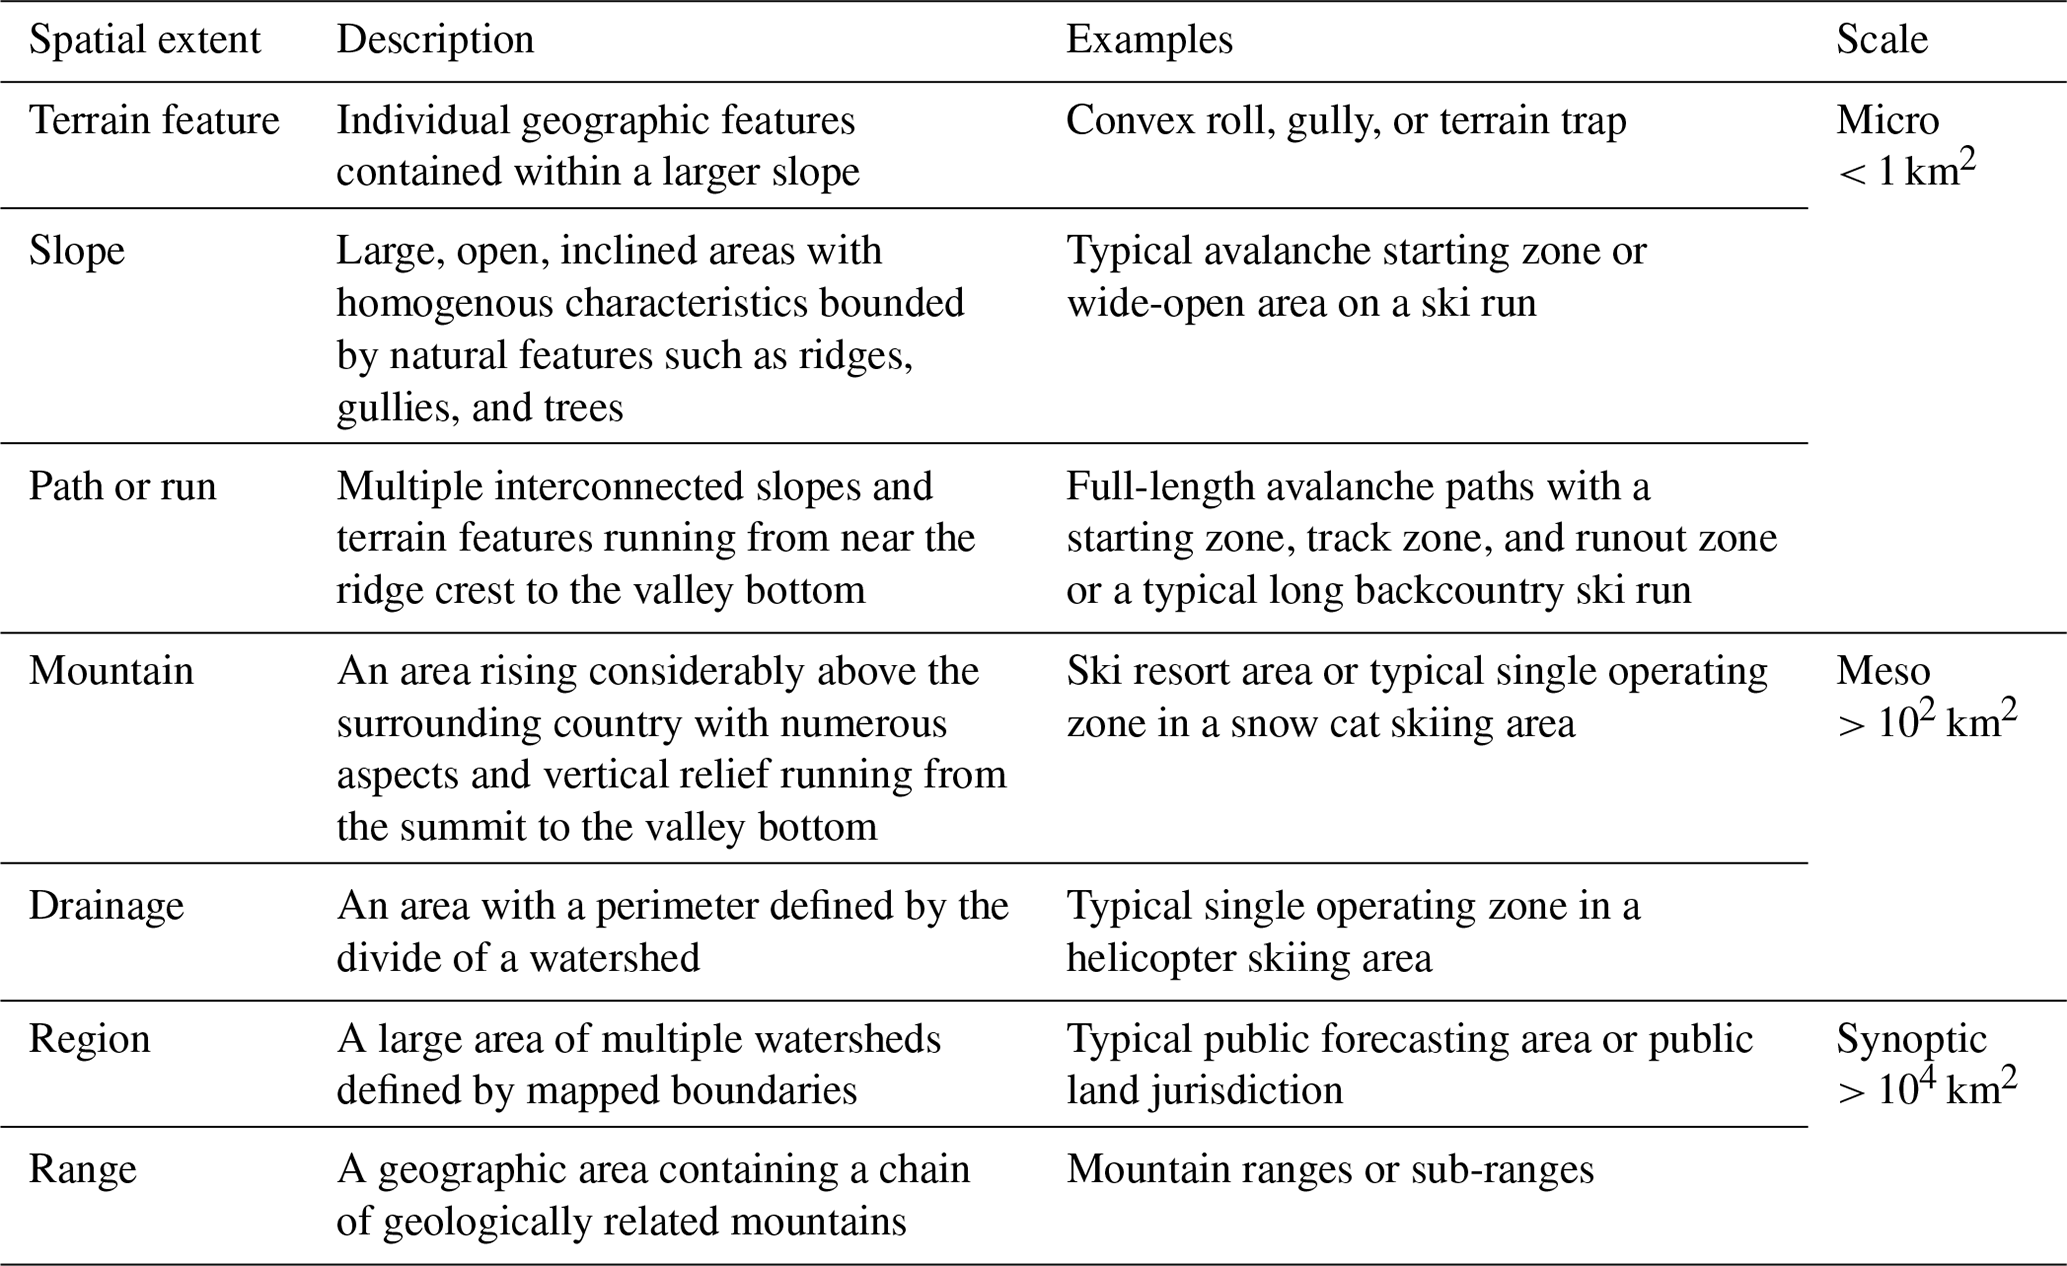
It is important to determine at which scale the ATES ratings are being applied and to recognize that not all the ATES criteria shown in Table 3 can be applied at all scales. Parameters such as starting zone size, density, runout zone characteristics, and exposure require multiple slopes to assess, meaning that they often cannot be applied to single slopes or terrain features. Forest density, in contrast, works better at smaller scales, where there is less variation across the terrain and the density can be determined more reliably. In some scenarios, small-scale (e.g., a terrain feature) zoning will not be required, in which case a larger scale can be applied. To achieve a larger scale, ATES mappers must filter out terrain features or route segments that are below the target scale and group these features together into larger-scale zones or routes.
For example, when classifying a predetermined route, the scale of the entire area is already defined by the route. However, along that route there will be variations in avalanche exposure. These could be represented using smaller-scale ATES ratings for improved accuracy, or they could be grouped together as part of the whole route and a single rating issued. Single ratings for routes and corridors should default to the highest terrain class along the route. Similarly, while an overall rating of Class 3 could be assigned to an area, within that area there could be zones of Class-1 and Class-2 terrain. Single ATES ratings for areas and zones sometimes default to the highest rating level, but this depends on the scale of the ratings and whether there are route options within that area. For example, while the overall area may have some Class-3 terrain, if there are options for avoiding it, the rating is Class 2.
The smaller the scale, the higher the resolution and more precise the classifications will be, but this comes at the cost of greater effort and resources. To be accurate enough to be used as a real-time navigational aid, a spatial scale of at least 20–30 m (i.e., terrain feature) is required (Larsen et al., 2020).
5.2 Assessment methods
Evaluating avalanche terrain exposure using ATES requires qualified people skilled in avalanche terrain assessment and backcountry route finding. Assessors with local terrain and route familiarity are a significant asset and necessary for analysing the interaction between people and avalanche terrain. Local knowledge of trails, backcountry routes, or climbs is an essential input in lieu of pre-mapped routes.
Rating avalanche terrain using ATES can be straightforward for single routes with single ratings. For uncomplicated terrain with good data, such as a well-travelled trail with only a few avalanche paths or an alpine bowl with high-quality mapping and imagery, sufficient accuracy can be achieved without field surveys or complex analyses. For more complicated projects such as large areas with extensive avalanche terrain, unfamiliar travel routes, significant overhead hazard, or a need for small-scale ATES zones, a more rigorous approach and level of effort are necessary. Typically, this utilizes some combination of GIS analysis, field investigations, aerial photographs, satellite image interpretation, climate analysis, and runout estimation.
Data for the analysis are collected using various methods, both qualitative and quantitative. GIS analysis provides a deterministic evaluation of some ATES parameters and helps to reduce human bias (e.g., Delparte, 2008; Campbell and Gould, 2013; Toft et al., 2024a), but not all ATES parameters can be represented digitally. Realistically, only slope angle and forest density can be determined objectively given adequate resolution, leaving the remaining ATES parameters to be mostly a subjective assessment. Route options and exposure both require a location on the ground to assess, and this means evaluating either a predetermined route or a conceptual line through the terrain. Data for every Technical Model parameter shown in Table 3 are often unavailable, so the assessor must make do with the best information they can obtain. ATES is intended to be used by both field practitioners and desktop GIS specialists or ideally a team of both. Assessors ultimately develop their own techniques and work within the bounds of their organization's capacity, but the most accurate results are achieved through a collaborative approach.
Ratings are determined by analysing the terrain against each ATES parameter for the best fit, comparing the levels above and below, and determining what the best overall ATES rating is. The following five-step process guides the determination of an ATES rating.
For every area, route, corridor, or zone,
-
assess each Technical Model (Table 3) parameter independently and determine its rating level,
-
determine which (if any) default criteria are met (this determines the minimum rating level),
-
compare each of the remaining terrain criteria to the minimum rating level or higher,
-
determine whether this outweighs the minimum rating level for determining the ATES rating for criteria higher than the minimum rating level, and
-
compare this to the Communication Models (Tables 1 and 2) for coherence.
For manual assessments at micro-scales and mesoscales (Table 11), ATES ratings and mappings should be reviewed and field-checked by peers familiar with the terrain. For zoning avalanche terrain exposure at synoptic scales, such as regional or mountain range mapping, manual assessments and field checking for verification of the entire area are often not practical, and instead a targeted approach to the fieldwork or an automated classification approach (or a combination of both) is often necessary.
5.3 AutoATES
Automated avalanche terrain classification enables large areas of mountain terrain to be analysed and coded by a computer algorithm (Fig. 13). This significantly reduces the cost of producing ATES ratings, improves consistency, and makes the system more accessible. Larsen et al. (2020) developed AutoATES v1.0, which was used to produce ATES zone maps for all of Norway using only a DEM as input. AutoATES v.2.0 (Toft et al., 2024a) has been updated to match the ATES v.2 model presented in this paper, and the algorithm's performance has been improved to better handle forest data, overhead exposure and flat runout zones.
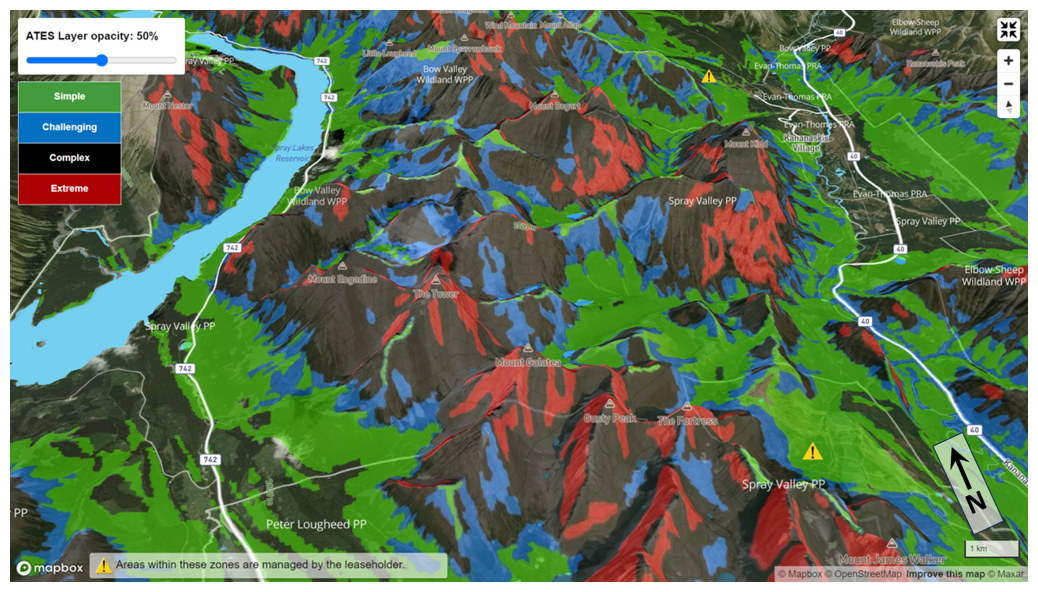
Figure 13AutoATES mapping of ∼ 450 km2 in Kananaskis Country, Canada (Alberta Parks, 2024). In this example, the ATES layer opacity can be adjusted to improve the visibility of the basemap data, and the Class-1 terrain includes Class 0.
AutoATES mapping can be adapted to local conditions by tuning the model parameters based on feedback from avalanche experts. Sykes et al. (2024) performed validation testing on AutoATES v.2.0 in the Connaught Creek and Bow Summit areas of Canada. Manual ATES zone “benchmark maps” for each area were developed collaboratively by three field experts. The benchmark maps were used as a validation dataset to tune the input parameters of AutoATES to the local characteristics of each study area. AutoATES v.2.0 maps were then produced for the same areas, compared to these benchmark maps (Fig. 14), and found to agree with 74.5 % of Connaught Creek and 84.4 % of Bow Summit ATES ratings (Sykes et al., 2024).
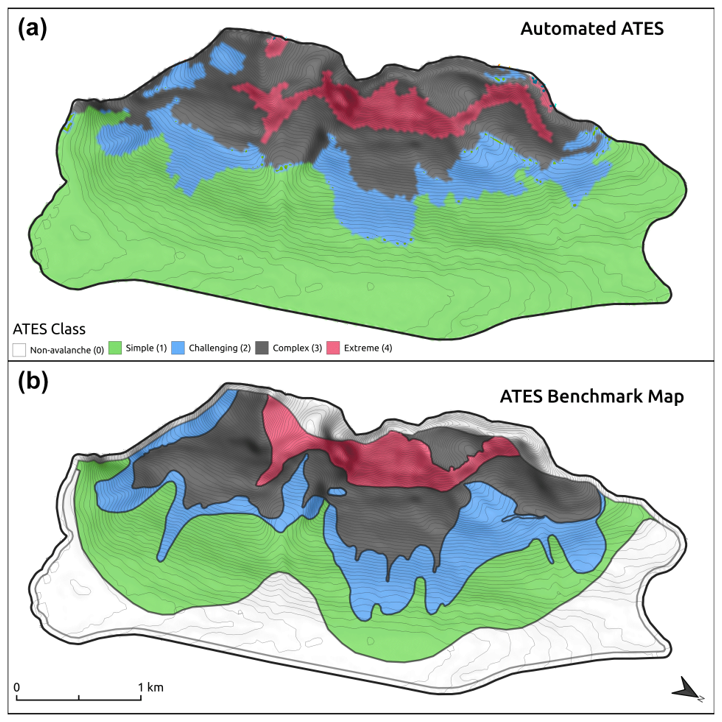
Figure 14A validation study comparing manual and automated ATES mapping (Sykes et al., 2024) where the AutoATES map agreed with 84.4 % of the manual “benchmark” map.
One of the biggest advantages of automated ATES zone mapping is that it can downscale zones to a much higher resolution than is practical with manual mapping. While it is possible to manually downscale to smaller zones, this requires a level of effort that may not be cost-effective, particularly in synoptic-scale or mesoscale areas (Table 11). This limits the scope of manual mapping in comparison to automated mapping, which can cover entire mountain ranges consistently and at smaller scales.
5.4 Presentation
ATES ratings can be displayed visually on maps or marked-up photos as areas, zones, corridors, or routes (Table 10; Fig. 12). Coloured lines and/or transparent polygons with fuzzy set boundaries can illustrate ATES ratings, ideally with the underlying ATES terrain attributes stored (Sharp et al., 2023). Fuzzy set boundaries incorporate uncertainty by overlapping and fading the boundary between adjacent ATES polygons, indicating that the boundary is not a precise line but rather an area of transition.
In addition to maps, ATES ratings for specific routes can be communicated using words, numbers, and colours. Backcountry recreation guidebooks, brochures, and online information commonly use textual ATES ratings as an adjunct to a detailed route description, map, and other important information about a specific route.
ATES is an avalanche terrain assessment and communication system that relies heavily on expert knowledge and judgement (Toft et al., 2024a). Despite developments to make it more deterministic (Campbell and Gould, 2013), applying and using ATES remains primarily an exercise in judgement that requires ground truthing and peer review. Although ATES incorporates the terrain parameters necessary for avalanche experts to capture their interpretation of the avalanche terrain, interpretations vary between individuals and can lead to inconsistency in application; i.e., two experts rating the same avalanche terrain using ATES may have different results. These differences highlight the subjectivity in manual ATES ratings and the challenge of having multiple individuals produce consistent ATES ratings (Sykes et al., 2024; Schmudlach and Köhler, 2016b).
Manual interpretation of geospatial data combined with observed terrain parameters is a time-consuming process which limits the scope of manual ATES mapping to high-traffic areas such as popular recreation areas and predefined worksites. ATES ratings for a specific route are less time-consuming since the assessment focuses on a predefined line or corridor where the exposure is known rather than all terrain in an area where the exposure varies. In these areas, costs can be justified relative to the large number of backcountry users (Larsen et al., 2020; Sykes et al., 2024) and terrain familiarity of local experts, but this is impractical for large swaths of mountainous terrain. Synoptic-scale ATES zone mapping is not practical using manual methods, and the development of AutoATES (Toft et al., 2024a) has been an important step towards enabling a broader implementation.
While ATES zone maps illustrate potential exposure across landscapes, the receiver of the information cannot assess their actual exposure until a location or route is specified. Once the receiver plans a route on the map (explicit or conceptual) or uses blue dot navigation, a location becomes evident and the ATES ratings can be related to that spot. Modern digital mapping applications that enable route planning are well suited to including an ATES layer, whereby the user can draw their route on the map and then turn an ATES layer on or off to see how that route intersects with the ATES ratings.
It is important to be aware of the limitations and uncertainties associated with using DEMs to produce avalanche terrain maps. Research confirms that starting zone and runout zone modelling is sensitive to DEM type and resolution (Bühler et al., 2011) and that a high-resolution DEM (i.e., < 5 m) is ideal for capturing terrain features relevant for avalanche release (Bühler et al., 2018). However, high-resolution DEMs have limited availability worldwide, and a 5 m DEM is not always necessary for modelling avalanche terrain exposure. Currently, 10 m satellite imagery and 30 m DEM data are available worldwide at no cost. Sykes et al. (2024) found that the resolution and type of input DEMs do not have a large impact on the overall accuracy of the AutoATES model.
Finally, developers of publicly available, digital avalanche risk applications must be wary of the potential for dangerous errors when their applications combine a micro-scale, high-resolution DEM with synoptic-scale, low-resolution avalanche bulletin information. Generalized aspect and elevation diagrams broadly applied at synoptic scales by avalanche forecasters are a mismatch with high-resolution DEM terrain models, and this type of scale mismatch will produce errors which are easily masked by the ease of use and the perception of accuracy in a mobile phone application.
Terrain rating systems play an essential risk management role in recreational outdoor activities such as climbing, hiking, kayaking, skiing, and biking. Industries where workers are exposed to avalanche risk also rely on terrain rating systems to enable occupational health and safety policies. Combined, these systems have helped millions of users plan and execute their activities by simplifying complex terrain attributes into easily understood categories that can be used to manage risk and improve their experience.
Backcountry avalanche risk is a complex interaction between snowpack, terrain, and people where terrain is the only factor that is constant over time. It is often said that “when snow is the problem, terrain is the solution”, and for decades professional mountain and ski guides have considered terrain assessment and route selection to be the principal mitigating factors in backcountry avalanche risk management: when nothing is exposed, nothing is at risk.
However, communicating to a lay person how to evaluate avalanche terrain and manage their risk in the backcountry is challenging, as the subject is complex with many technical variables that are easily lost upon the target audience. The classic slope-angle-based terrain choice method (Landrø et al., 2020), which has dominated avalanche decision making strategies for decades, is limited in its scope. Its attraction is that it is easy to understand, measurable, and accurate for human triggering inside avalanche starting zones. However, slope angle alone does not account for important factors such as propagation, overhead hazard, terrain traps, avalanche frequency, and the concept of exposure in general, which are the fundamentals of backcountry avalanche risk management. Including them in a simple, five-level terrain classification system that can be understood easily by the receiver is important in the same way that the avalanche danger scale (Avalanche Canada, 2022; EAWS, 2024) helps people to categorize and understand the level of avalanche danger in a simple way.
Public avalanche bulletins warn about backcountry avalanche danger, which is constantly changing and carries uncertainty, but this is only part of the avalanche risk equation. Ultimately, people choose their own risk by making decisions about where, when, and how they travel. Even during periods of high avalanche danger, a simple reduction in exposure can reduce or eliminate the risk. In small-scale terrain features, even minor adjustments to how one is exposed to the danger will change the risk – a few meters in either direction can be the difference between low- and high-risk situations. Thus, controlling terrain exposure is the most important avalanche risk management skill necessary for winter backcountry travel, and the objective of ATES is to make that more explicit and easier to understand for backcountry users.
ATES began in 2004 as a simple avalanche terrain rating system for specific backcountry ski tours and was intended for trip planning and implemented in response to an avalanche disaster in Canada's Glacier National Park. Soon after, ATES was used to rate avalanche exposure on waterfall ice climbs, and by 2010 ATES ratings were being mapped into zones using basic GIS. In 2020, the AutoATES algorithm enabled landscape-scale mapping of ATES ratings and more accessible widespread ATES mapping. Today, AutoATES technology can be used to automatically classify large, synoptic-scale areas, while manual ATES methods can be applied to smaller-scale projects or specific routes, where the input and accuracy of the human touch are necessary.
This paper introduces ATES v.2, which builds on 20 years of operational experience using ATES as a risk management tool in avalanche safety practices for public recreation and workplace avalanche safety. The updated five-level ATES adds Class 0 – Non-avalanche terrain and Class 4 – Extreme terrain to the original three-level system. Additionally, ATES v.1/04 and the ATES Zoning Model have been combined into a single Technical Model for assessment, with two corresponding Communication Models for backcountry travel and waterfall ice climbing. Using ATES v.2, avalanche terrain exposure can be mapped as areas, zones, corridors, or routes (Table 10). Alternatively, specific routes can be given a terrain rating or series of ratings in order to accompany a route description in the same way that rating systems are used for rock climbing and whitewater.
AutoATES is open-source, and the model code is available via Zenodo (https://doi.org/10.5281/ zenodo.10712035; Toft et al., 2024b). The data to replicate the AutoATES validation methods in Sykes et al. (2024) are available in an Open Science Framework repository (https://doi.org/10.17605/OSF.IO/ZXJW5; Sykes et al., 2023).
GS was the original creator and author of ATES v.1/04 and led the implementation of Parks Canada's initial application of ATES to backcountry tours and waterfall ice climbs in Canada's national parks. CC developed the ATES Zoning Model and was the first to apply ATES ratings to maps through his work with Avalanche Canada. Both authors have continued to develop and apply the ATES method to recreational and workplace applications, and both have helped to develop the validation dataset for AutoATES. GS led the development of this paper, with support from CC.
The contact author has declared that neither of the authors has any competing interests.
Publisher's note: Copernicus Publications remains neutral with regard to jurisdictional claims made in the text, published maps, institutional affiliations, or any other geographical representation in this paper. While Copernicus Publications makes every effort to include appropriate place names, the final responsibility lies with the authors.
This article is part of the special issue “Latest developments in snow science and avalanche risk management research – merging theory and practice”. It is a result of the International snow science Workshop, Bend, Oregon, USA, 8–13 October 2023.
The authors wish to thank Edward Bair, Stephan Harvey, Hans-Peter Marshall, and one anonymous reviewer for their helpful peer review. Chris Argue, Rune Engeset, James Floyer, Brian Gould, Pascal Haegeli, Steve Holeczi, Sarah Hueniken, Alan Jones, Karl Klassen, Mike Koppang, Eirik Sharp, Andy Sovick, John Sykes, Håvard Toft, and Brian Webster are also thanked for their contributions to this work.
This paper was edited by Hans-Peter Marshall and reviewed by Edward Bair, Stephan Harvey, and one anonymous referee.
Alberta Parks: Kananaskis Country Avalanche Terrain Ratings Scale (ATES), Alberta Parks, https://tinyurl.com/3sh3w3cm, last access: 19 May 2024.
Association of Canadian Mountain Guides (ACMG): Ski Guiding Manual, Canmore, A.B., Canada, 309 pp., https://www.acmg.ca/03public/resources/publications.aspx (last access: 28 April 2024), 2023.
Avalanche Canada: Glossary, North American Public Avalanche Danger Scale, Avalanche Canada, https://avalanche.ca/glossary/terms/avalanche-danger-scale (last access: 5 November 2024), 2022.
Avalanche Canada: Trip Planner, Avalanche Canada, https://avalanche.ca/planning/trip-planner, last access: 5 November 2024.
Baldwin, J.: Exploring the Coast Mountains on Skis – A Guide to Ski Mountaineering, 3rd edn., John Baldwin, Vancouver, B.C., Canada, 448 pp., ISBN 978-0-9691550-3-4, 2009.
Beacon Guidebooks: Avalanche Terrain Education, Beacon Guidebooks, https://beaconguidebooks.com/education, last access: 4 November 2024.
Bebi, P., Kulakowski, D., and Rixen, C.: Snow avalanche disturbances in forest ecosystems – State of research and implications for management, Forest Ecol. Manag., 257, 1883–1892, https://doi.org/10.1016/j.foreco.2009.01.050, 2009.
Bogie, D. and Davies, M.: Visitor Risk Management Applied to Avalanches in New Zealand, in: Proceedings International Snow Science Workshop, Lake Tahoe, USA, 17–22 October 2010, 497–501, https://arc.lib.montana.edu/snow-science/item.php?id=433 (last access: 21 April 2024), 2010.
Boyd, J., Haegeli, P., Abu-Laban, R. B., Shuster, M., and Butt, J. C.: Patterns of death among avalanche fatalities: A 21-year review, Can. Med. Assoc. J., 180, 507–512, https://doi.org/10.1503/cmaj.081327, 2009.
Bründl, M. and Margreth, S.: Integrative risk management: The example of snow avalanches, in: Snow and Ice-related Hazards, Risks and Disasters, edited by: Haeberli, W. and Whiteman, C., Elsevier, 259–296, https://doi.org/10.1016/B978-0-12-817129-5.00002-0, 2021.
Bühler, Y., Christen, M., Kowalski, J., and Bartelt, P.: Sensitivity of snow avalanche simulations to digital elevation model quality and resolution, Ann. Glaciol., 52, 72–80, https://doi.org/10.3189/172756411797252121, 2011.
Bühler, Y., von Rickenbach, D., Stoffel, A., Margreth, S., Stoffel, L., and Christen, M.: Automated snow avalanche release area delineation – validation of existing algorithms and proposition of a new object-based approach for large-scale hazard indication mapping, Nat. Hazards Earth Syst. Sci., 18, 3235–3251, https://doi.org/10.5194/nhess-18-3235-2018, 2018.
Campbell, C. and Gould, B.: A proposed practical model for zoning with the Avalanche Terrain Exposure Scale, in: Proceedings International Snow Science Workshop, Grenoble, France, 7–11 October 2013, 385–391, https://arc.lib.montana.edu/snow-science/item/1985 (last access: 21 April 2024), 2013.
Canadian Avalanche Association (CAA): Technical Aspects of Snow Avalanche Risk Management – Resources and Guidelines for Avalanche Practitioners in Canada, edited by: Campbell, C., Conger, S., Gould, B., Haegeli, P., Jamieson, B., and Statham, G., Canadian Avalanche Association, Revelstoke, BC, Canada, 117 pp., ISBN 978-1-926497-00-6, 2016.
Canadian Avalanche Association (CAA): Observation guidelines and recording standards for weather, snowpack and avalanches, Canadian Avalanche Association, Revelstoke, B.C., Canada, 110 pp., ISBN 978-1-926497-04-4, 2024.
Carrara, P.: The determination of snow avalanche frequency through tree-ring analysis and historical records at Ophir, Colorado, GSA Bull., 90, 773–780, https://doi.org/10.1130/0016-7606(1979)90<773:TDOSAF>2.0.CO;2, 1979.
Colblindor: Coblis Color Blindness Simulator, Colblindor, https://www.color-blindness.com/coblis-color-blindness-simulator, last access: 12 November 2024.
Delparte, D.: Avalanche Terrain Modeling in Glacier National Park, Canada, PhD Thesis, University of Calgary, Calgary, Canada, 195 pp., https://central.bac-lac.gc.ca/.item?id=NR38205&op=pdf&app=Library&is_thesis=1&oclc_number=6355515382008 (last access: 21 April 2024), 2008.
EAWS: Standards: European Avalanche Danger Scale, Tech. rep., European Avalanche Warning Services (EAWS), https://www.avalanches.org/standards/avalanche-danger-scale, last access: 21 April 2024.
Engeset, R., Pfuhl, G., Orten, C., Hendrikx, J., and Hetland, A.: Colours and maps for communicating natural hazards to users with and without colour vision deficiency, Int. J. Disast. Risk Reduct., 76, 103034, https://doi.org/10.1016/j.ijdrr.2022.103034, 2022.
Ferguson, S. A. and LaChapelle, E. R.: ABCs of Avalanche Safety – Third Edition, The Mountaineers Books, Seattle, WA, USA, 192 pp., ISBN 9780898868852, 2003.
Floyer, J. and Robine, K.: Avalanche Skills Training Handbook, Avalanche Canada, Revelstoke, BC, 104 pp., ISBN 978-1-99-952290-2, 2018.
Gavaldà, J., Moner, I., and Bacardit, M.: Integrating the ATES into the avalanche information in Aran Valley (Central Pyrenees), in: Proceedings International Snow Science Workshop, Chamonix, France, 7–11 October 2013, 381–384, https://arc.lib.montana.edu/snow-science/item.php?id=1984 (last access: 21 April 2024), 2013.
Haegeli, P.: Avaluator: Avalanche Accident Prevention Card – Second Edition (v2.0), Avalanche Canada, Revelstoke, B.C., Canada, 30 pp., ISBN 9780986659720, 2013.
Haegeli, P. and McClung, D.: Expanding the snow-climate classification with avalanche-relevant information: Initial description of avalanche winter regimes for southwestern Canada, J. Glaciol., 53, 266–276, https://doi.org/10.3189/172756507782202801, 2007.
Haegeli, P., McCammon, I., Jamieson, B., Israelson, C., and Statham, G.: The Avaluator – A Canadian Rule-Based Avalanche Decision Support Tool for Amateur Recreationists, in: Proceedings International Snow Science Workshop, Telluride, USA, 1–6 October 2006, 254–263, https://arc.lib.montana.edu/snow-science/item.php?id=934 (last access: 21 April 2024), 2006.
Harvey, S., Schmudlach, G., Bühler, Y., Dürr, L., Stoffel, A., and Christen, M.: Avalanche Terrain Maps for Backcountry Skiing in Switzerland, in: Proceedings International Snow Science Workshop, Innsbruck, Austria, 7–12 October 2018, 1625–1631, https://arc.lib.montana.edu/snow-science/item.php?id=2833 (last access: 21 April 2024), 2018.
Harvey, S., Christen, M., Bühler, Y., Hänni, C., Boos, N., and Bernegger, B.: Refined Swiss avalanche terrain mapping CAT v2/ATH v2, in: Proceedings International Snow Science Workshop, Tromsø, Norway, 23–25 September 2024, 1637–1644, https://arc.lib.montana.edu/snow-science/item.php?id=3363 (last access: 24 November 2024), 2024.
Hellier, E. and Edworthy, J.: Signal Words, in: Handbook of Warnings, edited by: Wogalter, M. S., Lawrence Erlbaum Associates, New Jersey, USA, 407–417, https://doi.org/10.1201/9781482289688, 2006.
Hendrikx, J., Johnson, J., and Mannberg, A.: Tracking decision-making of backcountry users using GPS tracks and participant surveys, Appl. Geogr., 144, 102729, https://doi.org/10.1016/J.APGEOG.2022.102729, 2022.
Huber, A., Hesselbach, C., Oesterle, F., Neuhauser, M., Adams, M., Plörer, M., Stephan, L., Toft, H. B., Sykes, J., Mitterer, C., and Fischer, J. T.: AutoATES Austria – Testing and Application of an Automated Model-Chain for Avalanche Terrain Classification in the Austrian Alps, in: Proceedings International Snow Science Workshop, Bend, OR, USA, 8–13 October 2023, 929–936, https://arc.lib.montana.edu/snow-science/item.php?id=2989 (last access: 28 April 2024), 2023.
Jackson, L. E.: Frequency and Magnitude of Events, in: Encyclopedia of Natural Hazards, Springer Netherlands, 359–363, https://doi.org/10.1007/978-1-4020-4399-4_147, 2016.
Jamieson, B. and Gould, B.: Avalanche hazard assessment, in: Planning Methods for Assessing and Mitigating Snow Avalanche Risk, edited by: Jamieson, B., Canadian Avalanche Association, Revelstoke, BC, Canada, 143–156, ISBN 978-1-926497-02-0, 2018.
Johnson, J. and Hendrikx, J.: Using Citizen Science to Document Terrain Use and Decision-Making of Backcountry Users, Citizen Sci., 6, 1–8, https://doi.org/10.5334/cstp.333, 2021.
Klassen, K.: Incorporating Terrain into Public Avalanche Information Products, in: Proceedings International Snow Science Workshop, Anchorage, AK, USA, 16–21 September 2012, 209–213, https://arc.lib.montana.edu/snow-science/item.php?id=1582 (last access: 12 May 2024), 2012.
Landrø, M., Pfuhl, G., Engeset, R., Jackson, M., and Hetland, A.: Avalanche decision-making frameworks: Classification and description of underlying factors, Cold Reg. Sci. Technol., 169, 102903, https://doi.org/10.1016/j.coldregions.2019.102903, 2020.
Larsen, H. T., Hendrikx, J., Slåtten, M. S., and Engeset, R. V.: Developing nationwide avalanche terrain maps for Norway, Nat. Hazards, 103, 2829–2847, https://doi.org/10.1007/s11069-020-04104-7, 2020.
Laughery, K. R. and Brelsford, J. W.: Receiver Characteristics in Safety Communications, Proceedings of the Human Factors Society Annual Meeting, San Francisco, California, USA, 2–6 September 1991, 35, 1068–1072, https://doi.org/10.1177/154193129103501510, 1991.
Maartensson, S., Wikberg, P.-O., Palmgren, P.: Swedish skiers knowledge, experience and attitudes towards off-piste skiing and avalanches, in: Proceedings International Snow Science Workshop, Chamonix, France, 7–11 October 2013, 483–485, https://arc.lib.montana.edu/snow-science/item.php?id=1822 (last access: 21 April 2024), 2013.
McClung, D. and Schaerer, P. A.: The avalanche handbook, 4th edn., Mountaineers Books, 368 pp., ISBN 978-1-68051-539-8, 2023.
McIntosh, S. E., Brant-Zawadzki, G., Milliner, B. H., Christensen, E. D., Nyberg, A. A., Grissom, C. K., Olivares, C. R., Kim, H. S., and Tremper, B.: Cause of Death in Utah Avalanche Fatalities, 2006–2007 through 2017–2018 Winter Seasons, Wild. Environ. Med., 30, 191–194, https://doi.org/10.1016/j.wem.2019.02.007, 2019.
Mcmanamy, S., Latuso, E., Corwin, W., and Brennan, S.: The Avalanche Terrain Exposure Scale in Alaska, in: Proceedings International Snow Science Workshop, Whistler, Canada, 21–27 September 2008, p. 605, https://arc.lib.montana.edu/snow-science/item.php?id=96 (last access: 21 April 2024), 2008.
Meloche, F., Guillet, L., Gauthier, F., Langlois, A., and Gaume, J.: Influence of slab depth spatial variability on skier-triggering probability and avalanche size, Ann. Glaciol., 65, e13, https://doi.org/10.1017/aog.2024.3, 2025.
O'Gorman, D., Hein, P., and Leiss, W.: Parks Canada's Backcountry Avalanche Risk Review, Parks Canada, Banff, Canada, 80 pp., 2003.
Parks Canada: Avalanche Terrain Ratings for the Mountain National Parks, 1st edn., Parks Canada, Banff, Canada, ISBN 0-662-38737-6, 2004.
Parks Canada: Waterfall Ice Climbing and Avalanches in Canada's Mountain National Parks, 1st edn., Parks Canada, Banff, Canada, ISBN 0-662-41954-5, 2005a.
Parks Canada: Public information package for custodial groups planning winter backcountry travel, Parks Canada, https://parks.canada.ca/pn-np/mtn/securiteenmontagne-mountainsafety/gardiens-custodial (last access: 21 April 2024), 2005b.
Parks Canada: Avalanche terrain ratings – Mountain safety, Parks Canada, https://parks.canada.ca/pn-np/mtn/securiteenmontagne-mountainsafety/avalanche/echelle-ratings, last access: 23 April 2024.
Penniman, D. and Boisselle, R.: Decision-making on Variable Risk Terrain, in: Proceedings International Snow Science Workshop, Banff, Canada, 6–11 October 1996, 67–72, https://arc.lib.montana.edu/snow-science/item.php?id=1406 (last access: 21 April 2024), 1996.
Pielmeier, C., Silbernagel, D., Dürr, L., and Stucki, T.: Applying the Avalanche Terrain Exposure Scale in the Swiss Jura Mountains, in: Proceedings International Snow Science Workshop, Banff, Canada, 7–11 October 2014, 927–933, https://arc.lib.montana.edu/snow-science/item/2170 (last access: 23 April 2024), 2014.
Pralong, A., Birrer, C., Stahel, W. A., and Funk, M.: On the predictability of ice avalanches, Nonlin. Processes Geophys., 12, 849–861, https://doi.org/10.5194/npg-12-849-2005, 2005.
Rudolf-Miklau, F., Sauermoser, S., Mears, A., and Boensch, M.: The Technical Avalanche Protection Handbook, Wilhelm Ernst & Sohn, Verlag für Architektur und technische Wissenschaften GmbH & Co. KG, https://doi.org/10.1002/9783433603840, 2014.
Salm, B.: Snow forces on forest plants, in: Proceedings of the IUFRO Seminar Mountain Forests and Avalanches, Davos, Switzerland, 25–28 September 1978, 157–182, 1978.
Schmudlach, G. and Köhler, J.: Automated avalanche risk rating of backcountry ski routes, in: Proceedings International Snow Science Workshop, Breckenridge, USA, 3–7 October 2016, 450–456, https://arc.lib.montana.edu/snow-science/item/2306 (last access: 4 November 2024), 2016a.
Schmudlach, G. and Köhler, J.: Method for an Automated Avalanche Terrain Classification, in: Proceedings International Snow Science Workshop, Breckenridge, USA, 3–7 October 2016, 729–736, https://arc.lib.montana.edu/snow-science/item.php?id=2356 (last access: 21 April 2024), 2016b.
Schweizer, J., Jamieson, J. B., and Schneebeli, M.: Snow Avalanche Formation, Rev. Geophys., 41, 1016, https://doi.org/10.1029/2002RG000123, 2003.
Schweizer, J., Kronholm, K., Jamieson, B., and Birkeland, K.: Review of spatial variability of snowpack properties and its importance for avalanche formation, Cold Reg. Sci. Technol., 51, 253–272, https://doi.org/10.1016/j.coldregions.2007.04.009, 2008.
Scott, C and Klassen, M.: Alpine Ski Tours in the Canadian Rockies, 3rd edn., Rocky Mountain Books, Calgary, A.B., Canada, 344 pp., ISBN 978-1-926855-78-3, 2011.
Sharp, E., Campbell, C., Statham, G., and Schroers, B.: A standardized multiscale, fuzzy GIS data model for ATES mapping, in: Proceedings International Snow Science Workshop, Bend, USA, 8–13 October 2023, 838–845, https://arc.lib.montana.edu/snow-science/item.php?id=2974 (last access: 21 April 2024), 2023.
Sheets, A., Wang, D., Logan, S., and Atkins, D.: Causes of Death Among Avalanche Fatalities in Colorado: A 21-Year Review, Wild. Environ. Med., 29, 325–329, https://doi.org/10.1016/j.wem.2018.04.002, 2018.
Statham, G.: Avalanche Hazard, Danger and Risk – A Practical Explanation, in: Proceedings International Snow Science Workshop, Whistler, Canada, 21–27 September 2008, 224–227, https://arc.lib.montana.edu/snow-science/item/34 (last access: 4 November 2024), 2008.
Statham, G. and Hueniken, S.: The Ice Climbing Avalanche Atlas, in: Proceedings International Snow Science Workshop, Bend, OR., USA, 8–13 October 2023, 117–123, https://arc.lib.montana.edu/snow-science/item.php?id=2993 (last access: 28 April 2024), 2023.
Statham, G., McMahon, B., and Tomm, I.: The Avalanche Terrain Exposure Scale, in Proceedings International Snow Science Workshop, Telluride, USA, 1–6 October 2006, 491–497, https://arc.lib.montana.edu/snow-science/item.php?id=970 (last access: 21 April 2024), 2006.
Statham, G., Haegeli, P., Birkeland, K., Greene, E., Israelson, C., Tremper, B., Stethem, C., McMahon, B., White, B., and Kelly, J.: The North American Avalanche Danger Scale, in Proceedings International Snow Science Workshop, Lake Tahoe, USA, 17–22 October 2010, 117–123, https://arc.lib.montana.edu/snow-science/item.php?id=353 (last access: 21 April 2024), 2010.
Statham, G., Haegeli, P., Greene, E., Birkeland, K., Israelson, C., Tremper, B., Stethem, C., McMahon, B., White, B., and Kelly, J.: A conceptual model of avalanche hazard, Nat. Hazards, 90, 663–691, https://doi.org/10.1007/s11069-017-3070-5, 2018.
Sterchi, R. and Haegeli, P.: A method of deriving operation-specific ski run classes for avalanche risk management decisions in mechanized skiing, Nat. Hazards Earth Syst. Sci., 19, 269–285, https://doi.org/10.5194/nhess-19-269-2019, 2019.
Sykes, J., Hendrikx, J., Johnson, J., and Birkeland, K. W.: Combining GPS tracking and survey data to better understand travel behavior of out-of-bounds skiers, Appl. Geogr., 122, 102261, https://doi.org/10.1016/j.apgeog.2020.102261, 2020.
Sykes, J., Toft, H. B., and Haegeli, P.: Automated Avalanche Terrain Exposure Scale (ATES) Mapping – Local Validation and Optimization in Western Canada, OSF [data set], https://doi.org/10.17605/OSF.IO/ZXJW5, 2023.
Sykes, J., Toft, H., Haegeli, P., and Statham, G.: Automated Avalanche Terrain Exposure Scale (ATES) mapping – local validation and optimization in western Canada, Nat. Hazards Earth Syst. Sci., 24, 947–971, https://doi.org/10.5194/nhess-24-947-2024, 2024.
Thumlert, S. and Haegeli, P.: Describing the severity of avalanche terrain numerically using the observed terrain selection practices of professional guides, Nat. Hazards, 91, 89–115, https://doi.org/10.1007/s11069-017-3113-y, 2018.
Toft, H. B., Sykes, J., Schauer, A., Hendrikx, J., and Hetland, A.: AutoATES v2.0: Automated Avalanche Terrain Exposure Scale mapping, Nat. Hazards Earth Syst. Sci., 24, 1779–1793, https://doi.org/10.5194/nhess-24-1779-2024, 2024a.
Toft, H., Sykes, J., and Schauer, A.: AutoATESv2.0, Zenodo [code], https://doi.org/10.5281/zenodo.10712035, 2024b.
Trottet, B., Simenhois, R., Bobillier, G., Bergfeld, B., van Herwijnan, A., Jiang, C., and Guame, J.: Transition from sub-Rayleigh anticrack to supershear crack propagation in snow avalanches, Nat. Phys. 18, 1094–109, https://doi.org/10.1038/s41567-022-01662-4, 2022.
United Nations Office for Disaster Risk Reduction (UNDRR): Report of the open-ended intergovernmental expert working group on indicators and terminology relating to disaster risk reduction, United Nations General Assembly, https://www.undrr.org/publication/report-open-ended-intergovernmental-expert-working-group-indicators-and-terminology (last access: 7 March 2025), 2016.
Vontobel, I., Harvey, S., and Purves, R.: Terrain analysis of skier-triggered avalanche starting zones, in: Proceedings International Snow Science Workshop, Chamonix, France, 7–11 October 2013, 371–375, https://arc.lib.montana.edu/snow-science/item.php?id=1818 (last access: 23 April 2024), 2013.
Walbridge, C. and Singleton, M.: Safety Code of American Whitewater, American Whitewater, https://www.americanwhitewater.org/content/Wiki/safety:start?#vi (last access: 4 November 2024), 2005.
Weir, P.: Snow Avalanche Management in Forested Terrain, in: Land Manag. Handb. No. 55, British Columbia Ministry of Forests, Victoria, B.C., http://www.for.gov.bc.ca/hfd/pubs/Docs/Lmh/Lmh55.htm (last access: 23 April 2024), 2002.
Wogalter, M. S., DeJoy, D., and Laughery, K. R.: Organizing theoretical framework: a consolidated communication-human information processing (C-HIP) model, in: Warnings and risk communication, CRC Press, 29–37, https://doi.org/10.1201/9780203983836, 1999.
Zacharias, C.: Decision Making in Avalanche Terrain, The Student Handbook for The AIARE Risk Management Framework, American Institute for Avalanche Research and Education, 43–51, https://avtraining.org/wp-content/uploads/2021/08/AIARE-2-Student-Manual-2020-21.pdf (last access: 21 April 2024), 2020.
- Abstract
- Introduction
- Background
- Primary changes to the Avalanche Terrain Exposure Scale
- Avalanche Terrain Exposure Scale v.2
- Application of ATES
- Limitations
- Conclusion
- Code and data availability
- Author contributions
- Competing interests
- Disclaimer
- Special issue statement
- Acknowledgements
- Review statement
- References