the Creative Commons Attribution 4.0 License.
the Creative Commons Attribution 4.0 License.
 | 11 Mar 2025
Probabilistic tsunami hazard analysis of Batukaras, a tourism village in Indonesia
Wiwin Windupranata
Muhammad Wahyu Al Ghifari
Candida Aulia De Silva Nusantara
Marsyanisa Shafa
Intan Hayatiningsih
Iyan Eka Mulia
Alqinthara Nuraghnia
Indonesia's location in the middle of tectonic plates makes it vulnerable to earthquakes and tsunamis, especially in the megathrust zone around the island of Sumatra and the southern part of the island of Java. Research shows a seismic gap in southern Java, which poses a potential threat of megathrust earthquakes and tsunamis, impacting coastal areas such as Batukaras in West Java, a popular tourist destination. To prepare for disasters, probabilistic tsunami hazard analysis (PTHA), which focuses on seismic factors, was carried out by modelling tsunamis on 3348 sub-segments of 4 large megathrust segments in the south of Java. Stochastic earthquake modelling was used to simulate the occurrence of a tsunami from an earthquake with Mw 6.5 to the highest potential magnitude. This research shows that the PTHA in Batukaras reveals varying heights of 0.84, 1.63, 2.97, and 5.7 m for each earthquake return period of 250, 500, 1000, and 2500 years, respectively. The dominant threat arises from the West Java–Central Java megathrust segment, emphasising the importance of preparedness, although the annual probability of tsunamis is generally low. Our study will deepen knowledge of tsunami hazards associated with megathrust activities near Batukaras for mitigation planning and decision-making, and it can become a reference for similar coastal tourist areas.
- Article
(14737 KB) - Full-text XML
- BibTeX
- EndNote


Indonesia is located in the convergent boundaries between several tectonic plates, making it prone to earthquakes and tsunamis. The meeting between these plates causes the emergence of a zone called the megathrust zone. A megathrust is a type of fault that occurs in the subduction zone of one tectonic plate forced under another plate. High seismic activity in Indonesia occurs around Sumatra and southern Java due to the megathrust zone (Koswara et al., 2021; Mulia et al., 2019; Supendi et al., 2023; Windupranata et al., 2020).
Research conducted by Supendi et al. (2023) shows a seismic gap to the south of the island of Java that has a potential source of future megathrust earthquakes. This potential earthquake could generate tsunami heights of up to 20 m on the south coast of West Java, with an average maximum height of 4.5 m along the south coast of Java. The annual probability of a tsunami event with a height of more than 3.0 m, which could cause significant loss of life and damage, is 1 %–10 % in the south of Java (Horspool et al., 2014). An earthquake occurred in Pangandaran Regency on 17 July 2006 with a magnitude of Mw 7.6 that generated a powerful tsunami (Fujii and Satake, 2006; Gunawan et al., 2016; Hanifa et al., 2014). This event resulted in more than 300 deaths, 301 serious injuries, 551 minor injuries, and 156 people missing (Mustafida et al., 2022). Other research shows that there is still a high tsunami potential due to the megathrust fault in southern Java, which has an earthquake return period of 500 years (Harris et al., 2019). This condition is reinforced by the fact that no major earthquakes have occurred in the past few years; only earthquakes with a magnitude below Mw < 8 have occurred in the past 100 years (Supendi et al., 2023). This means that megathrust earthquakes still have the potential to occur.
On the other hand, the southern part of Java has high tourism potential that can be developed. One of these tourism opportunities can be seen from the many tourist villages located on the southern coast of Java, one of which is Batukaras, located in Pangandaran Regency, West Java (Koswara et al., 2021; Nijman, 2021; Windupranata et al., 2020). Batukaras is one of the villages in Indonesia that is often visited by local and foreign tourists. Every year, the number of tourists visiting Batukaras can reach 521 000 people (before the pandemic) (Batukaras Village Profile, 2022). Batukaras itself is inhabited by 5172 residents with a density of 393 people km−2, making this population vulnerable to tsunami disasters. The coast of Batukaras is dominated by lodging places, restaurants, and plantation and agricultural land. Therefore, the preparedness of this tourist village for facing tsunami disasters needs to be reviewed to minimise casualties and economic losses.
Tsunami hazard analysis in this tourist village can be done by modelling tsunamis using probabilistic tsunami hazard analysis (PTHA). The PTHA method is an approach that can estimate the tsunami hazard in a certain period of time in each area that is likely to be exposed to the hazards of the tsunami disaster (Grezio et al., 2017). This method can analyse tsunami hazards originating from seismic (plate tectonic activity) or non-seismic (volcanic activity, submarine landslides, and other events) factors (Grezio et al., 2017; Salmanidou et al., 2019). However, the scenario of potential tsunami hazards from these non-seismic factors is unlikely, as the timing and mechanism of their occurrence are difficult to estimate (Grezio et al., 2017). In addition, most tsunamis that occur in Indonesia are caused by seismic factors, i.e., vertical displacement of the seabed caused by shallow earthquakes in subduction zones (Hamzah et al., 2000).
In this study, tsunami modelling based on seismic factors is conducted using the parameters of megathrust plate activity directly adjacent to Batukaras. The results of the PTHA are expected to characterise the tsunami hazard at the study site, thereby facilitating mitigation planning and decision-making. In addition, Batukaras is currently in the process of being recognised as a tsunami-ready village, which refers to 12 IOC-UNESCO indicators consisting of assessment, preparedness, and response components (Mustafida et al., 2022). The results of this PTHA can support the assessment component to make this village a tsunami-ready village issued by IOC-UNESCO. Furthermore, the results of the tsunami hazard analysis in this village can be used as a reference for other tourist villages, especially for areas that have similar characteristics to Batukaras.
2.1 Data
In this research, accurate bathymetry data will determine the quality of tsunami modelling results. Bathymetry data were obtained from National Bathymetry (BATNAS) provided by the Indonesian Geospatial Information Agency (BIG). These data were used to create the wave propagation domain of the tsunami modelling. Furthermore, earthquake generation parameter data were obtained from the National Centre for Earthquake Studies (PuSGeN) in 2017 and the United States Geological Survey (USGS). The earthquake parameter data are divided into rake, dip, slip, strike, length, and width data obtained from PuSGeN and the depth of the epicentre data obtained from USGS.
2.2 Method
PTHA was used for hazard modelling to determine the tsunami risk in Batukaras. This method is used to determine the tsunami hazard in an area with a geographically consistent approach to estimating long-term hazards, including uncertainties in the analysis (Grezio et al., 2017) and modelling parameters (Thio et al., 2007). In the process of tsunami analysis using the PTHA method, several stages of data processing must be carried out.
2.2.1 Green's function for tsunamis
The calculation of Green's function aims to obtain the height of a tsunami wave from each observation point. In the calculation of Green's function, domain creation, megathrust sub-segments, and determination of observation points are carried out.
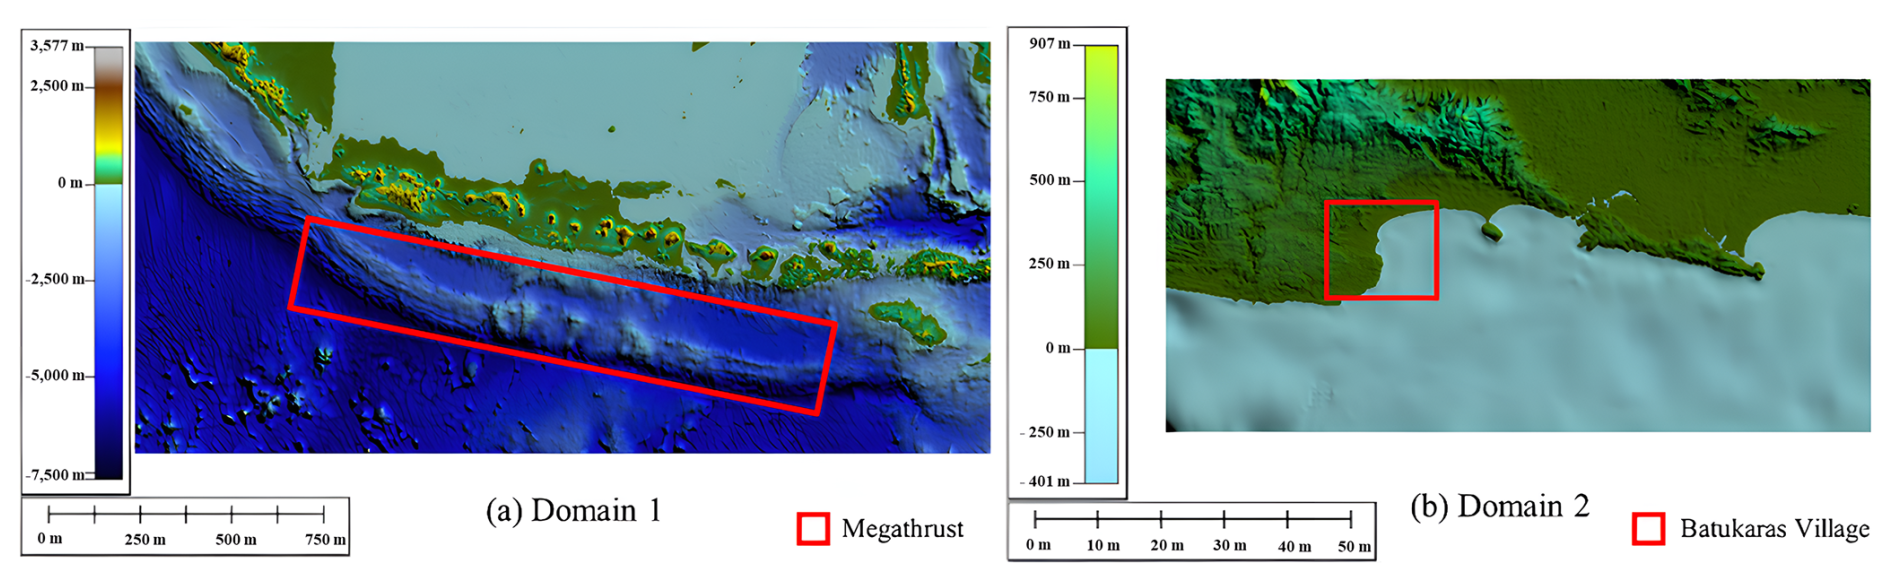
Figure 1Modelling domain illustration. (a) Domain 1. (b) Domain 2. Imagery © BATNAS 2018.
In this tsunami modelling, two types of model domains are formed, namely domain 1 and domain 2. Domain 1 is a large area covering the study area, namely Batukaras and the megathrust segment (Fig. 1). The megathrust segment used in this tsunami modelling includes the megathrust segments of the Sunda Strait, West Java–Central Java, East Java, and Bali (Fig. 2). Domain 2 is a smaller area that only covers the study area of Batukaras, which is located in Pangandaran Regency.
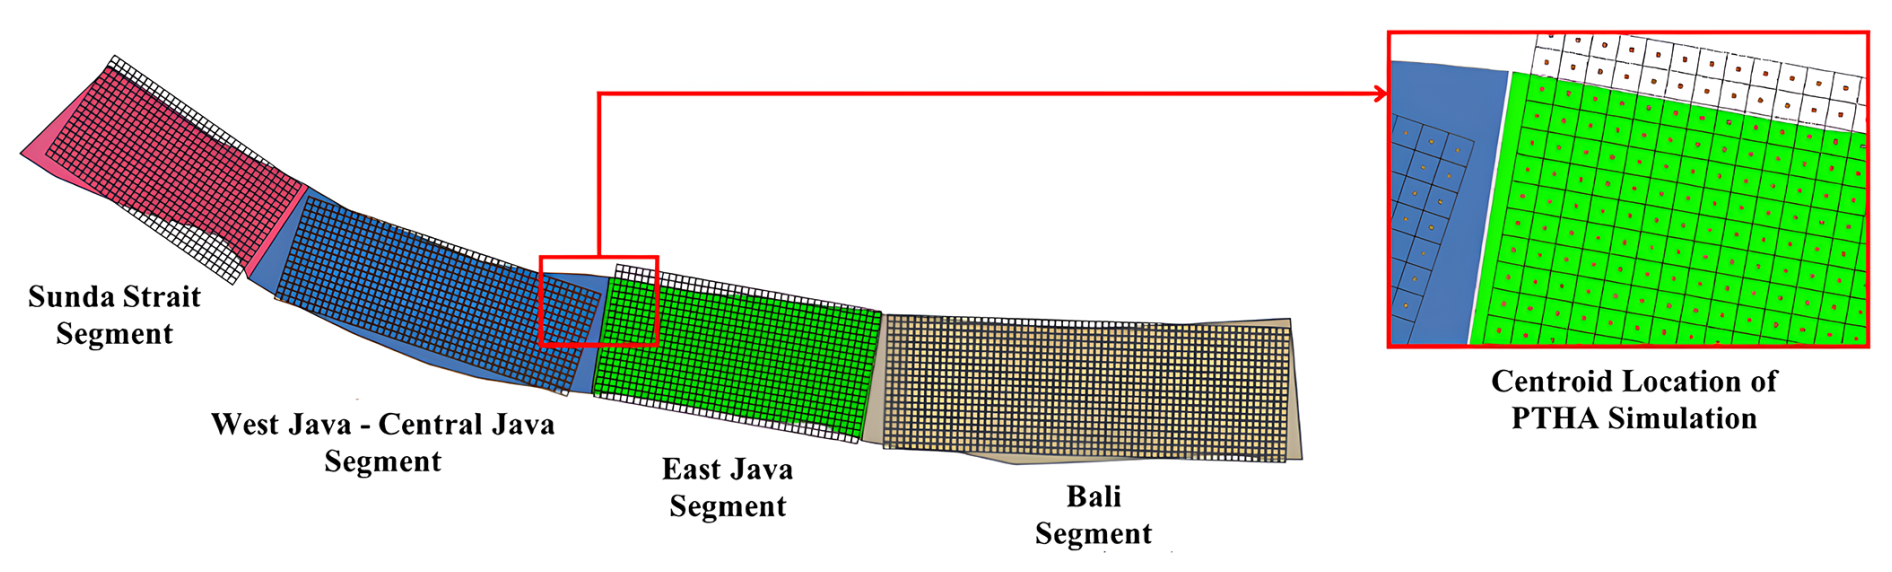
Here, data on the four segments, such as location and segment size, were sourced from PuSGeN in 2017. Furthermore, the four segments were modelled as megathrust sub-segments with a grid size of 10 km × 10 km, resulting in 3348 sub-segments divided into
-
the Sunda Strait segment (612 sub-segments)
-
the West Java–Central Java segment (800 sub-segments)
-
the East Java segment (736 sub-segments)
-
the Bali segment (1200 sub-segments).
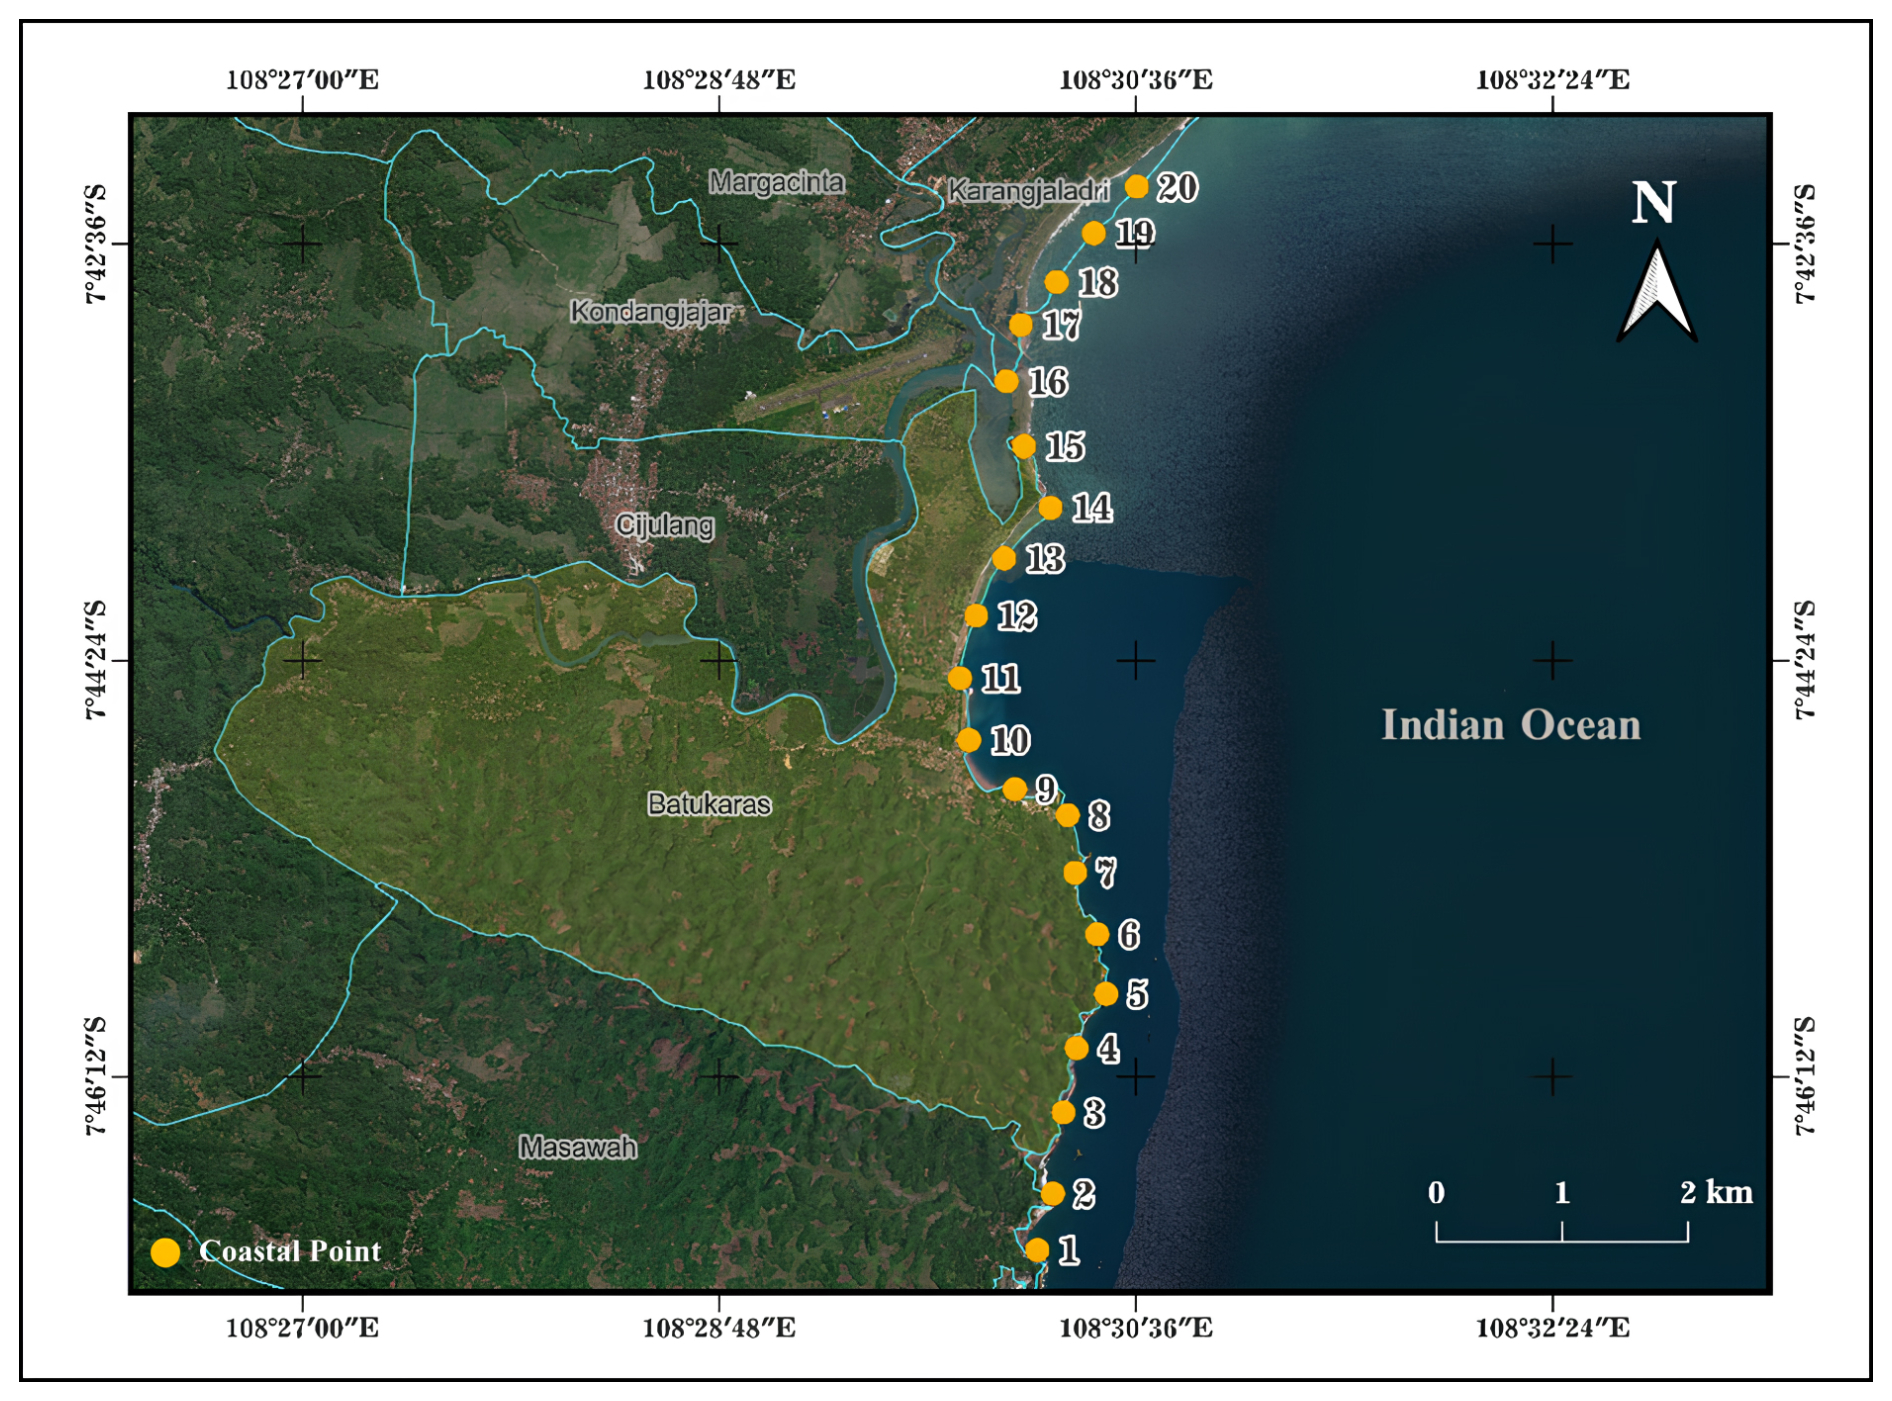
Figure 3Observation point along Batukaras coast. Imagery © Google Earth 2022.
In this tsunami modelling, the location of observation points was determined to evaluate the height of the tsunami generated at each observation point. The locations of these observation points are spread along the coastline in Batukaras (Fig. 3). In this modelling, 20 observation points were used based on bathymetry data, where the location of each point has an isobath (depth) of 1 m.
We used the Cornell Multi-grid Coupled Tsunami (COMCOT) software version 1.7 for tsunami modelling. In COMCOT, modelling is carried out by generating waves from earthquakes originating from megathrust segments based on earthquake parameter data and propagating the tsunami waves using the shallow-water equation to obtain tsunami heights at each observation point. This tool only simulates tsunami waves with no influence of wind and tides.
The COMCOT software uses the linear shallow-water equation (LSWE) and the non-linear shallow-water equation (NLSWE). The LSWE is used when tsunami waves are still in the open sea with smaller wave amplitude compared to depth. The following is the LSWE used (Wang, 2009).
Then, when the tsunami wave travels in shallow waters, the NLSWE is used. This is because the wavelength becomes shorter and the wave amplitude becomes larger when passing through shallow water. This means that the shape of the seabed influences the wave amplitude. The following is the NLSWE used (Wang, 2009).
Here, g is the acceleration of gravity (m s−2), P is the volume flux in −x (west–east) (m s−2), Q is the volume flux in −y (south–north) (m s−2), f is the Coriolis force coefficient, (φ,ψ) is latitude and longitude (°), R is the radius of the Earth (m), h is the water depth (m), η is the water surface height (m), H is the total water depth (m), Ω is the Earth rotation rate (7.2921 × 10⁻⁵ rad s−1), (Fx,Fy) is bottom friction at −x and −y; n is the Manning roughness coefficient (s m); u is the current velocity in −x (m s−1), and v is the current velocity in −y (m s−1).
2.2.2 Stochastic earthquake modelling
Stochastic earthquake modelling aims to simulate the slip amount on the fault plane, determining the initial seafloor displacement and the corresponding tsunamis. Mai and Beroza (2002) developed a method to characterise the complexity of earthquake slip represented by spatially random fields of anisotropic wave number spectra according to the von Karman autocorrelation function. The stochastic nature of the method is associated with uniformly distributed random phase angles embedded in the domain. In this study, random slips are initially calculated at a 1 km grid spacing and then interpolated into the sub-segment size for tsunamis using Green's function calculation. In this study, bilinear interpolation is performed without changing the average slip, thus maintaining the magnitude of the moment of the interpolated sample. In the formation of the stochastic earthquake model, several settings were used:
-
The minimum magnitude value used is Mw 6.5, sourced from USGS.
-
The maximum magnitude value used was sourced from PuSGeN in 2017. The maximum magnitude value used is different for each megathrust segment. The Sunda Strait segment has a maximum magnitude of Mw 8.8, West Java–Central Java Mw 8.8, East Java Mw 8.9, and Bali Mw 9.
-
The earthquake magnitude bin (interval) used in the modelling is Mw 0.1, so the earthquake will be generated starting from the minimum magnitude to the maximum magnitude with a difference of Mw 0.1.
-
The rupture area is randomly specified within the megathrust segment, as done in the PTHA study by Mori et al. (2017).
Figure 4 shows examples of the resulting slip distribution from various earthquake magnitudes by Mulia et al. (2020).
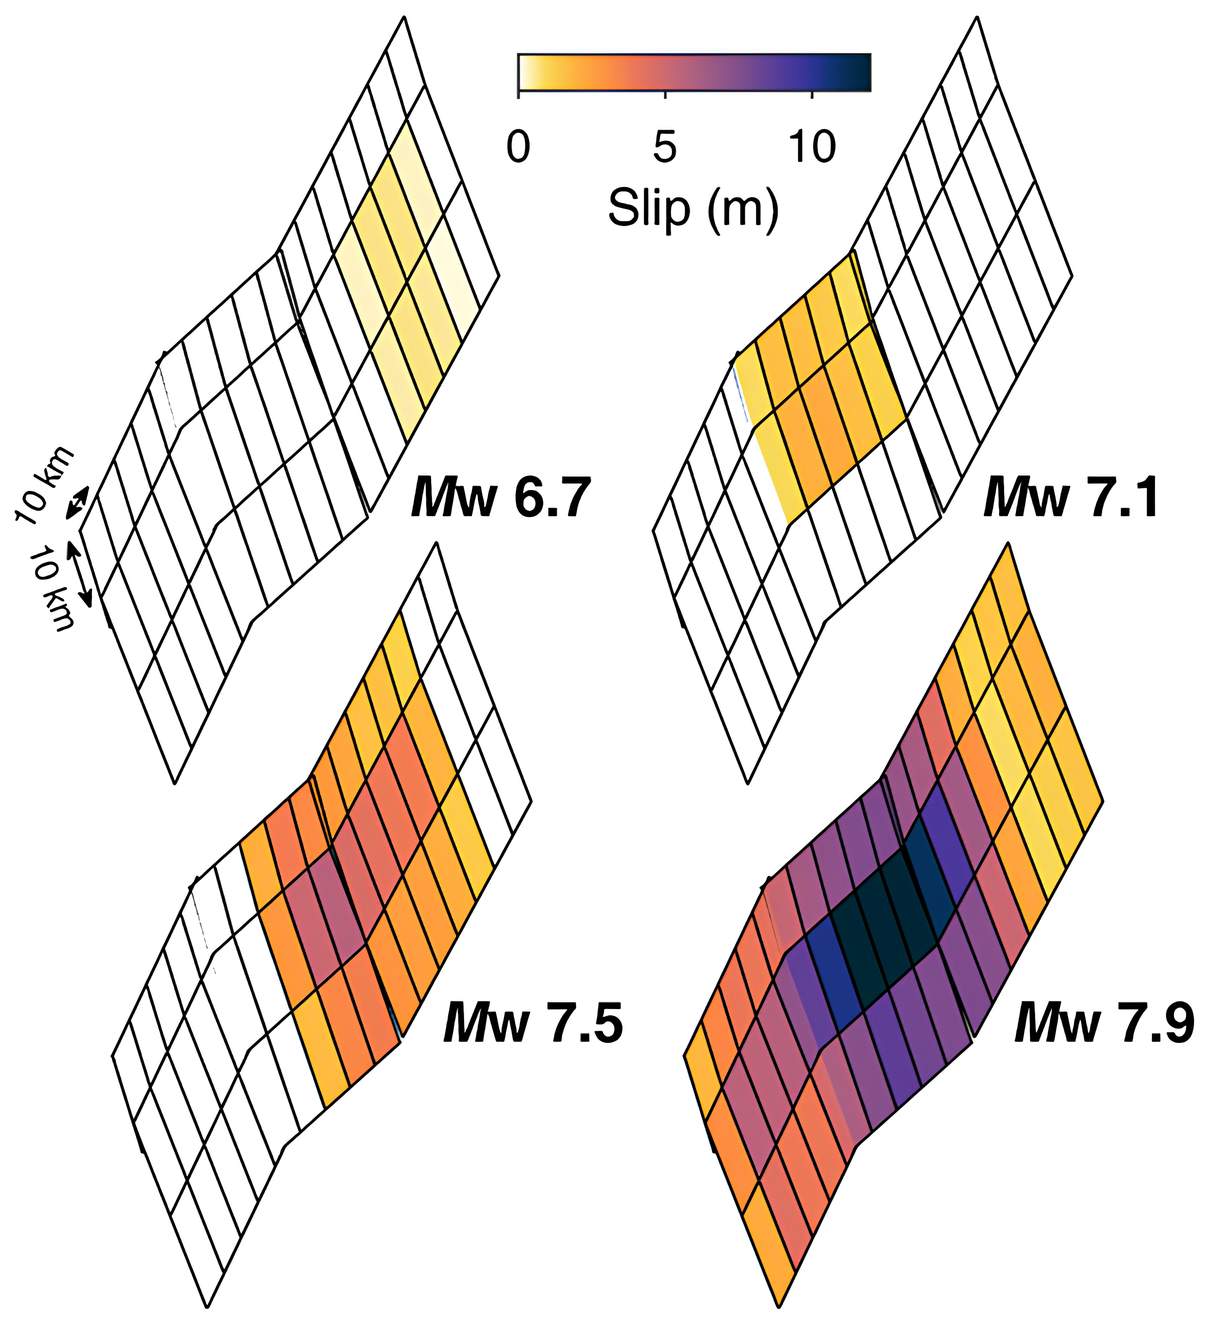
Figure 4Stochastic earthquake generation illustration (Mulia et al., 2020).
We also conducted statistical analyses that show the level of variability in each magnitude range. This analysis uses the coefficient of variation (CV) of , where σ is the standard deviation, and μ is the mean of maximum coastal tsunami heights at all coastal points. This analysis reflects the convergence of Monte Carlo samples of tsunami heights in coastal areas associated with the sources of the identified active faults so that the number of samples required across the earthquake magnitude range can be estimated.
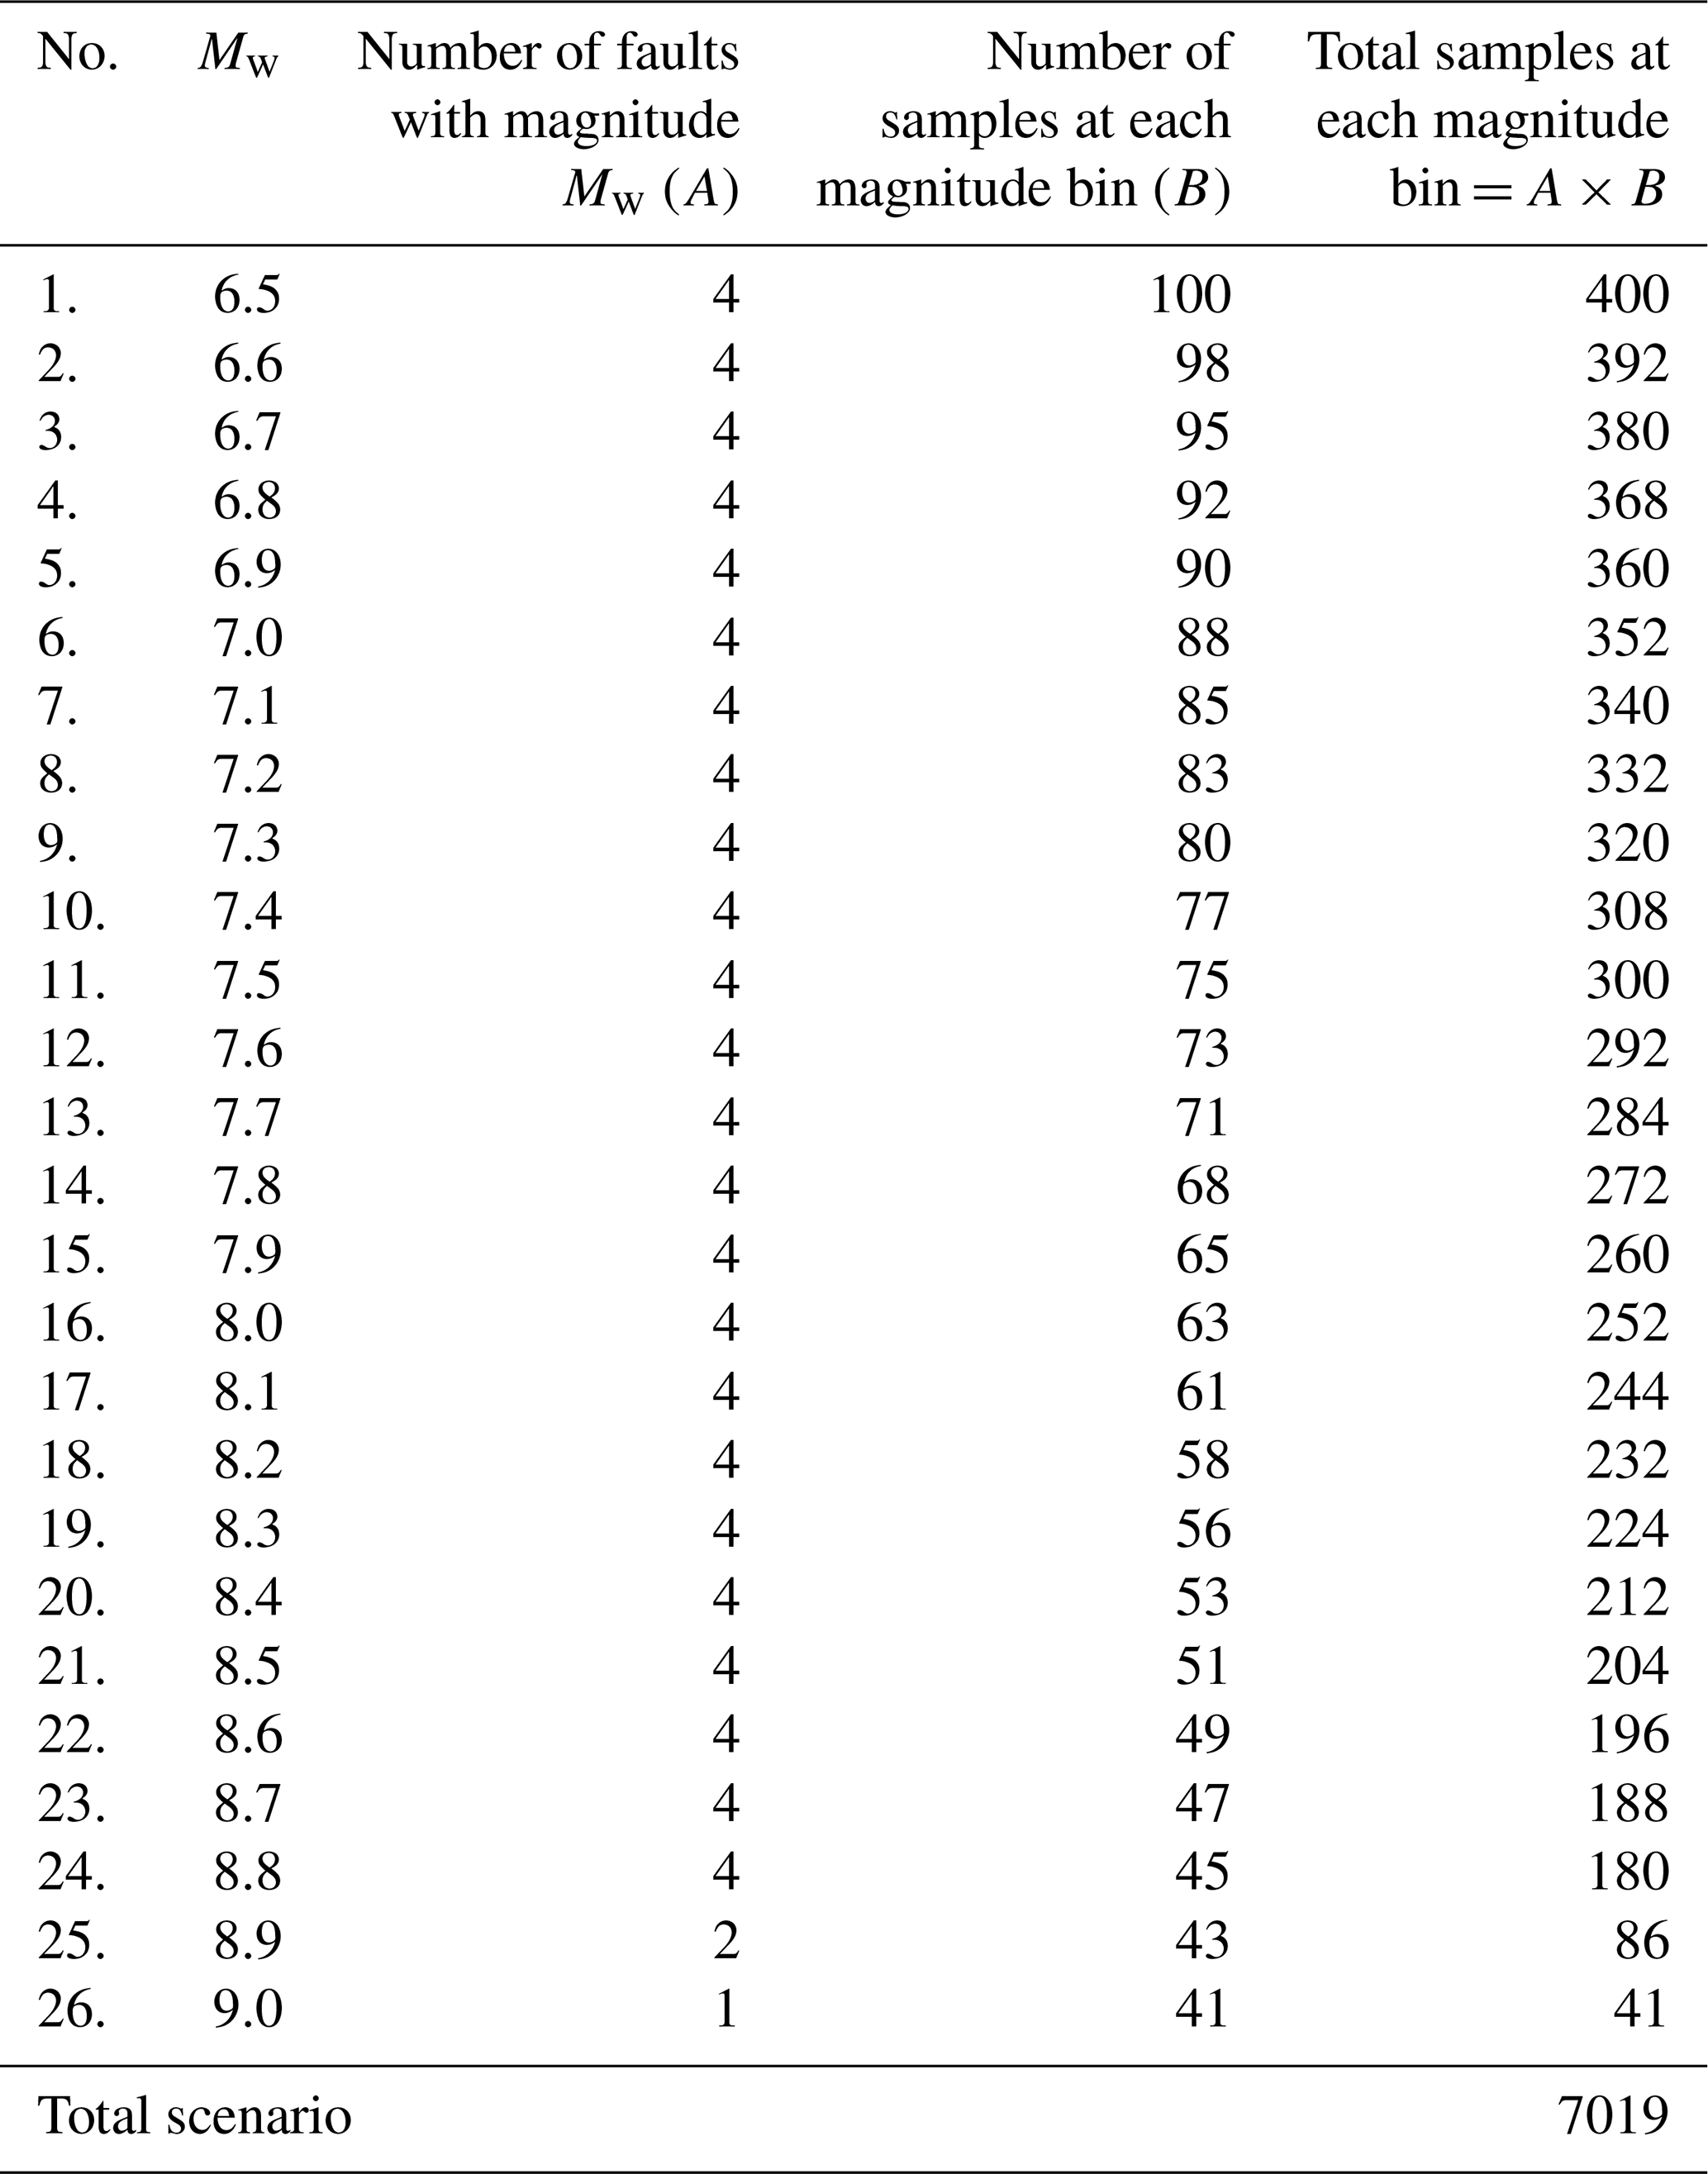
We performed this calculation for each increment of magnitude bin (Mw 0.1) of the earthquake in the interval Mw 6.5 to Mw 9.0. The maximum magnitude values used were sourced from PuSGeN in 2017, such as in the Sunda Strait (Mw 8.8), West Java–Central Java (Mw 8.8), East Java (Mw 8.9), and Bali (Mw 9.0) segments. At each magnitude interval, we calculated the coefficient of variation with each increase in the number of samples from 2 to 150.
In Fig. 5 it can be seen that the variability value decreases as the magnitude increases due to randomisation of the rupture area from smaller earthquakes. Each magnitude shows different variability. For example, the height of a coastal tsunami caused by a Mw 6.5 earthquake is quite stable if about 100 samples are used. Therefore, in this study we assume that the minimum number of samples required is 100 for Mw 6.5. From the resulting graph, using a visual approach, we also applied it to all magnitudes by drawing a straight line (blue-coloured line). This line shows the number of earthquake scenarios required for each magnitude. Thus, the resulting number of scenarios is 7019 scenarios, as can be seen in Table 1. This large number of scenarios is expected to provide a good explanation of the epistemic uncertainty in the PTHA results in this study.
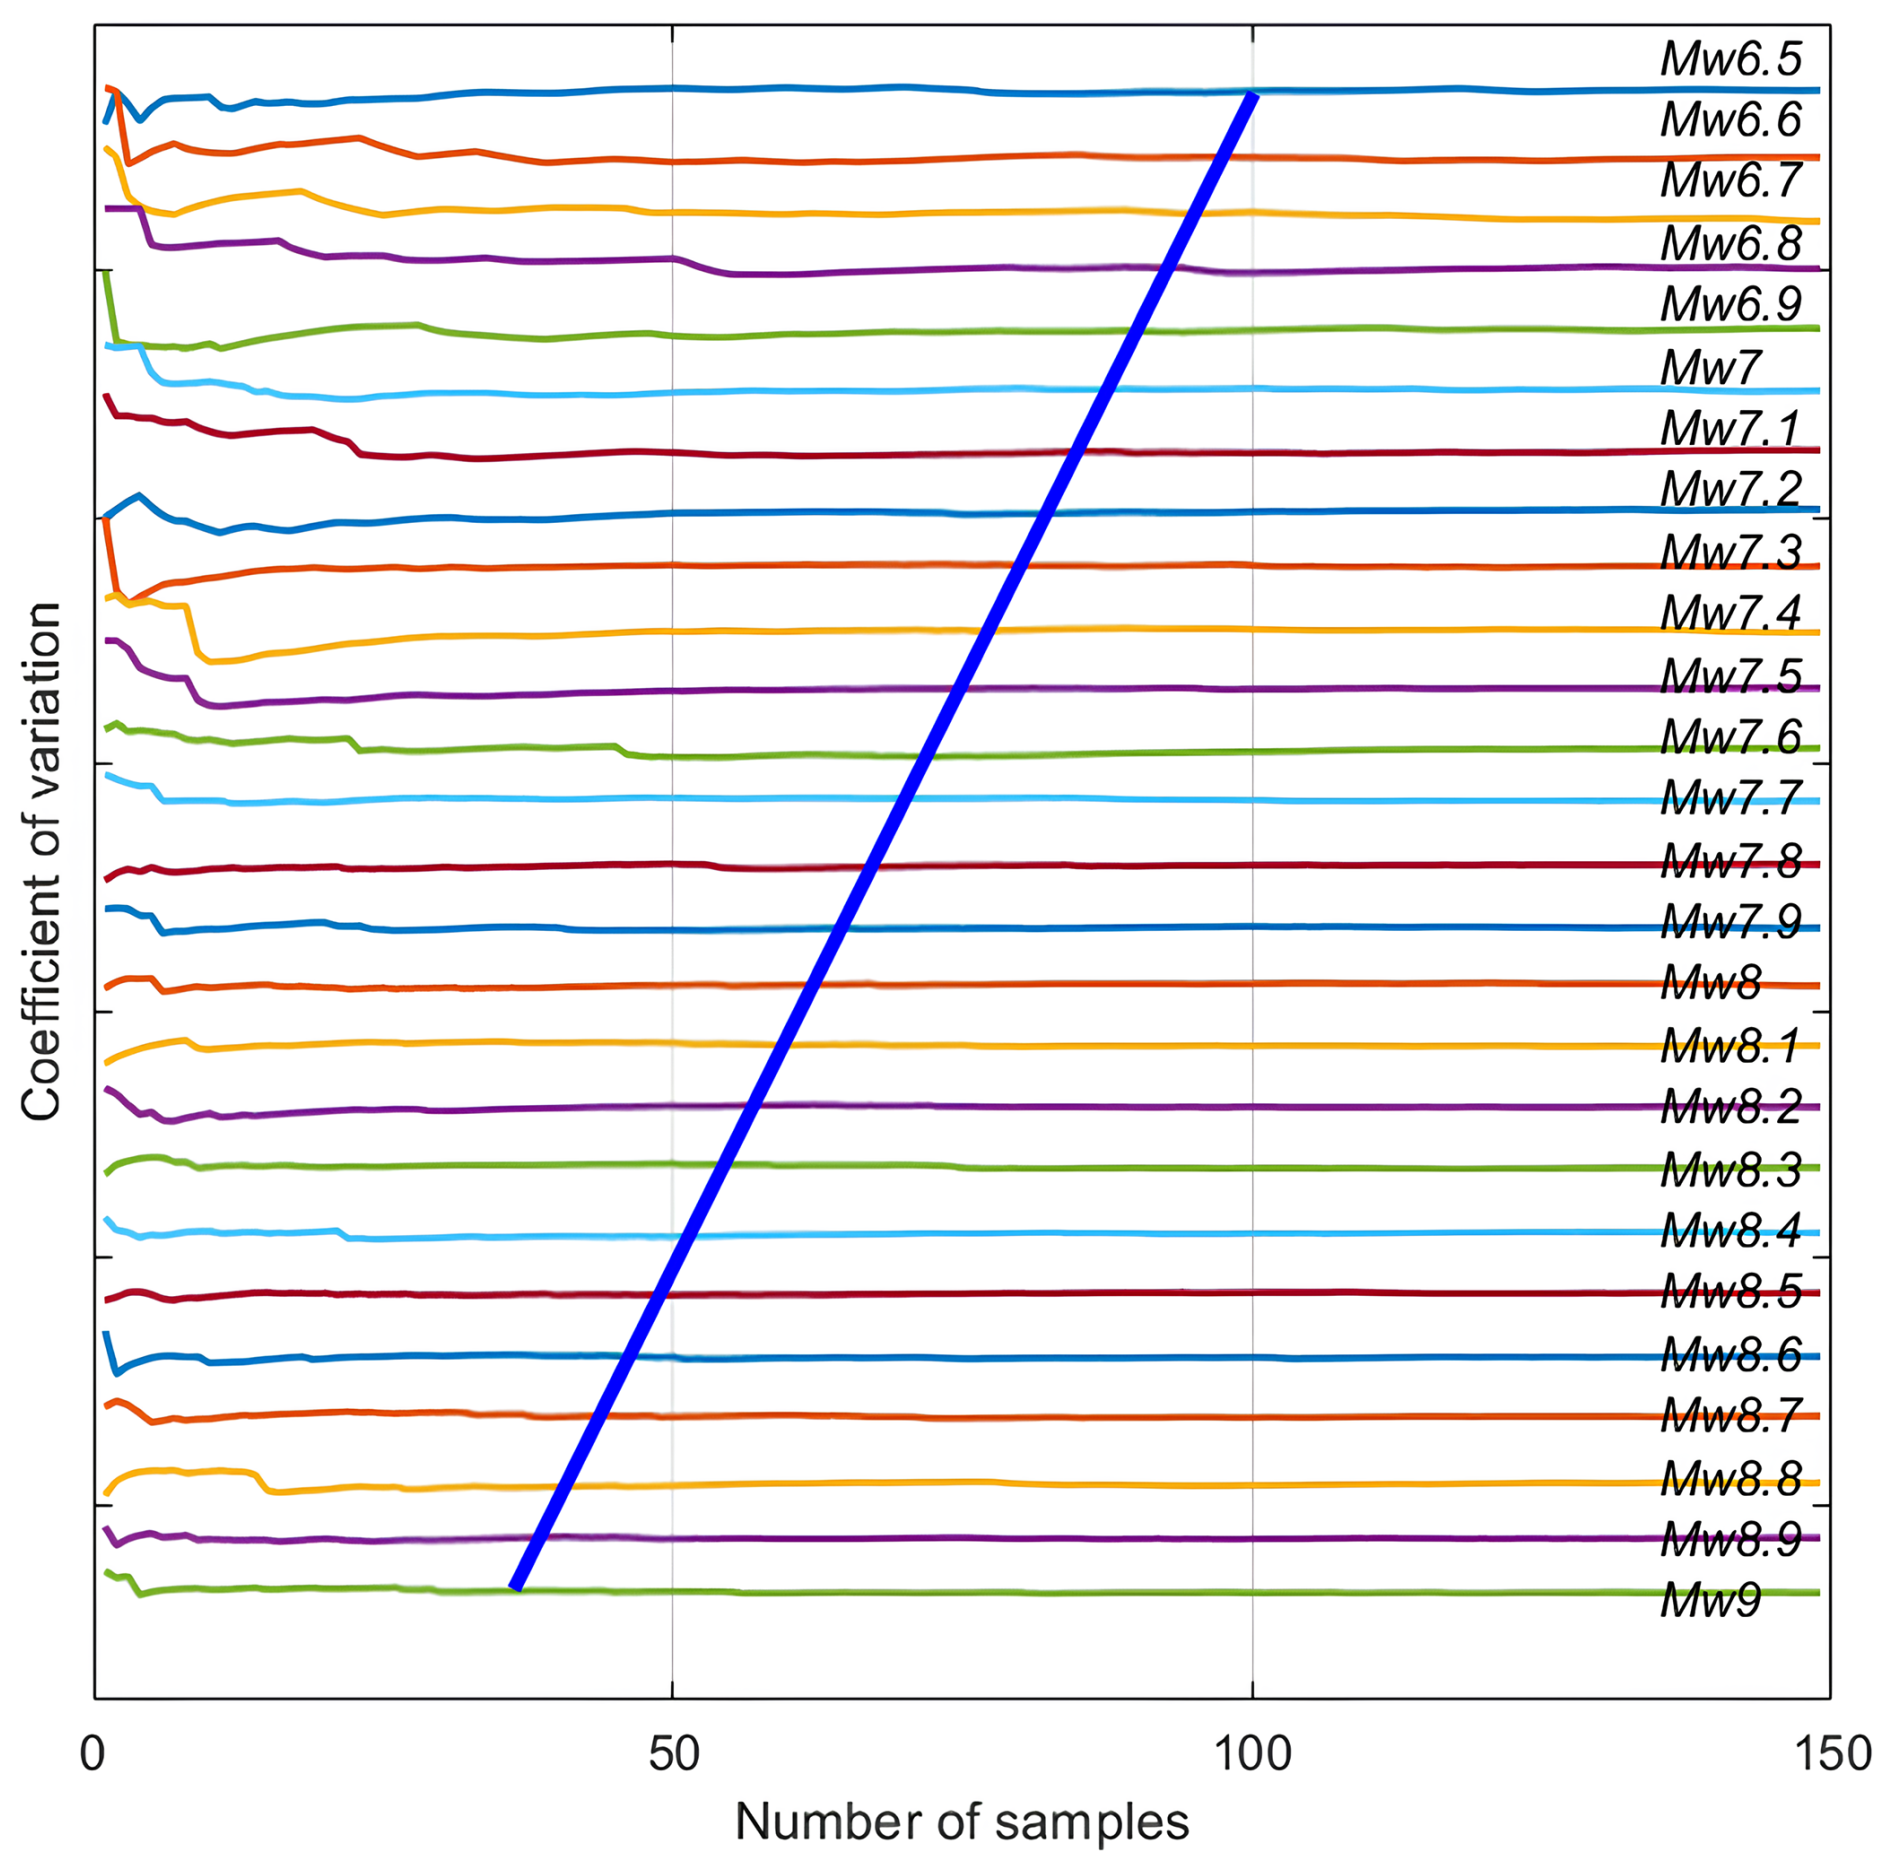
Figure 5Coefficient of variation of maximum coastal tsunami height for each magnitude across megathrust segments. The blue line indicates the number of samples required at each magnitude bin for the PTHA.
2.2.3 Determination of a and b value modelling
The values of a and b in PTHA are constants from the empirical formula derived by Beno Gutenberg and Charles Francis Richter with the following equation (Gutenberg and Richter, 1954):
where N is the earthquake frequency, M is the magnitude, and a and b are constants.
This equation shows the relationship between earthquake frequency and magnitude. The values of a and b indicate the seismic activity of the megathrust segment, which is influenced by the degree of rock fragility, and these values depend on the observation period, the area of observation, and the seismicity in the area. A larger value of a for a segment indicates that the segment has high seismic activity; a larger value of b indicates that the degree of rock fragility in the segment is higher. In this study, the values of a and b were not calculated. Instead, they were sourced from PuSGeN in 2017.
2.2.4 Probabilistic tsunami hazard analysis (PTHA) calculation
In this tsunami modelling, the modelling basis is used, which can be seen in Table 2.
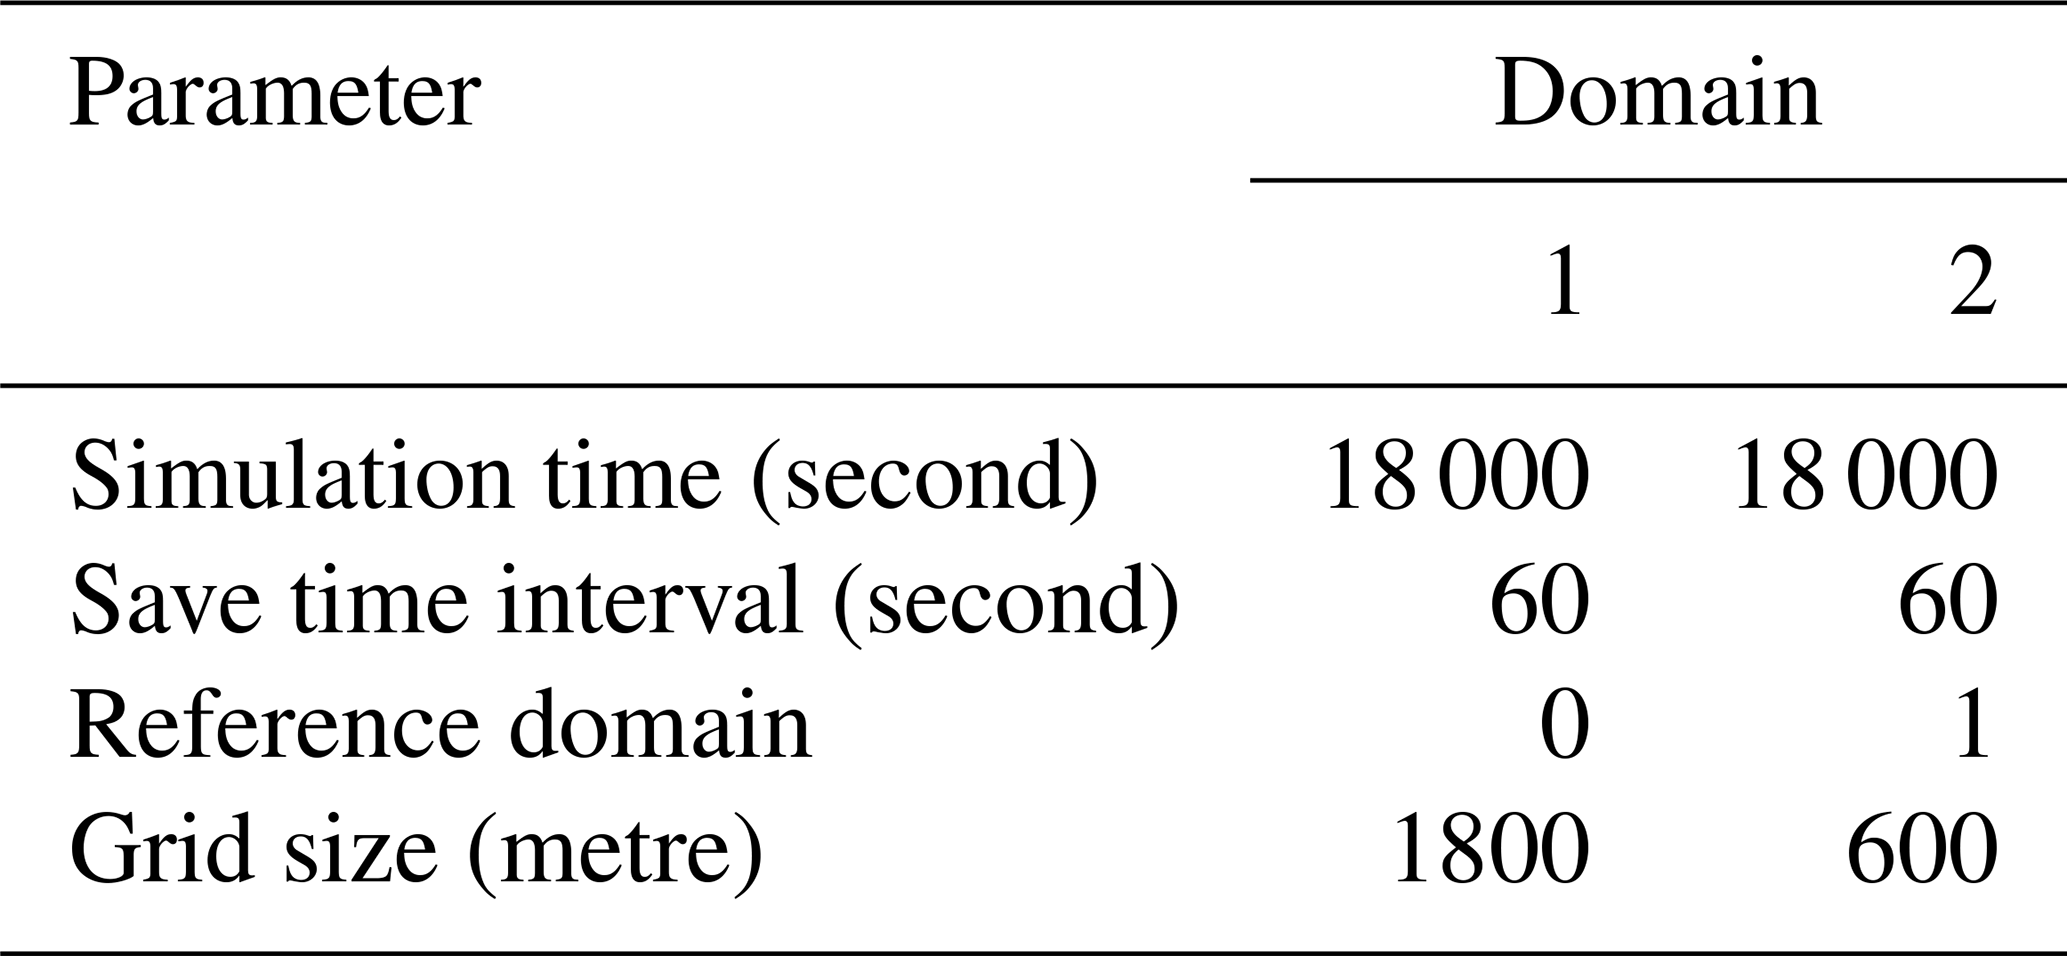
Based on Table 2, the simulation time used for each tsunami scenario run is 6 h. In addition, earthquake parameter data sourced from USGS and PuSGeN in 2017 were also determined. Earthquake parameters, such as depth, strike, slip, and dip, were obtained from the USGS slab 2.0 model, with the rake angle considered opposite to the direction of plate movement in the interseismic phase (Hayes et al., 2018). On the other hand, the parameters of the epicentre and megathrust segmentation were obtained from the results of the PuSGeN study in 2017.
Probabilistic seismic hazard assessment was introduced by Cornell (1968), which was then adopted in PTHA to predict the rate of exceedance of a certain tsunami height (H) relative to the tsunami height level (h), which in discrete form can be formulated in Eq. (15):
where ns is the total number of i sources/faults, nm is the number of magnitudes m considered with j intervals, m is the magnitude bin, υ is the occurrence rate of earthquakes from each common plate, and P is the probability of tsunami height.
In this study, a magnitude ranges from the smallest magnitude to the largest magnitude with a magnitude bin of 0.1. The variable υ indicates the occurrence rate of earthquakes with M equal to or greater than each fault calculated using the Gutenberg–Richter frequency magnitude distribution (Gutenberg and Richter, 1944). The variable υ can be defined by Eq. (16).
Next, the probability of tsunami height is calculated. The probability that the tsunami height H exceeds any tsunami height level given the magnitude m can be expressed as
where Φ is the cumulative standard-normal distribution function, ln (H) represents the median logarithmic tsunami height of all models with a given source and magnitude, and β is the standard deviation of ln (H).
Based on the PTHA manual by Thio (2012), a crucial aspect of a probabilistic hazard analysis is the incorporation of uncertainties in both the source and the propagation models into the final outcome. There are two types of uncertainties: aleatory and epistemic. These uncertainties belong to the frequency and degree of belief approaches to probability, respectively.
Aleatory uncertainties refer to the inability to predict the outcome of a process due to its random nature. However, it may not always be clear whether an uncertainty in the outcome of a process is a true aleatory uncertainty caused by the random behaviour of nature or the result of a limited understanding of the process itself. In such cases, researchers may have differing opinions. To express the outcome of a process that involves aleatory uncertainties, distribution functions are used rather than single mean or median values. The probability of an outcome being within a certain range is then given by the area under the probability density or distribution function. We have identified three main sources of aleatory uncertainty in our analysis, which are modelling uncertainty (σA), uncertainty in geometry (σD), and uncertainty in random slip distribution (σS).
The parameter β in Eq. (17) is included to account for aleatory uncertainty related to tsunami simulations and source uncertainties. Thio (2012) and Horspool et al. (2014) use combined uncertainty with a total β value of 0.519, while Davies et al. (2018) use the square root of the β values obtained from four historic tsunamis, which results in a larger β value of 0.927. Annaka et al. (2007) and Fukutani et al. (2015) have also treated β as epistemic uncertainty using a logic-tree approach. In this approach, β ranges from 0.223 to 0.438, corresponding to κ values of 1.25 to 1.55. The β value can be estimated from the logarithmic standard deviation κ of Aida (1978), where β=ln (κ), as used in this research. To obtain the logarithmic standard deviation κ, we compared the height of historical tsunami waves in Pangandaran in 2006 (Fritz et al., 2007) with the modelling scenario that has the closest characteristics to the historical tsunami waves. The κ value is then calculated in accordance with Aida (1978), and the β value can be obtained. Based on the 2006 Pangandaran tsunami, the value of β is 1.0999.
Based on the PTHA that has been carried out, several products are obtained that can be used as material for analysis to determine the level of tsunami hazard in Batukaras.
3.1 Tsunami hazard curve
The first product of the PTHA is the tsunami hazard curve. The hazard curve is a curve that describes the relationship between the tsunami intensity value and the return period of an earthquake at an observation point (Grezio et al., 2017). The tsunami hazard curve for Batukaras can be seen in Fig. 6.
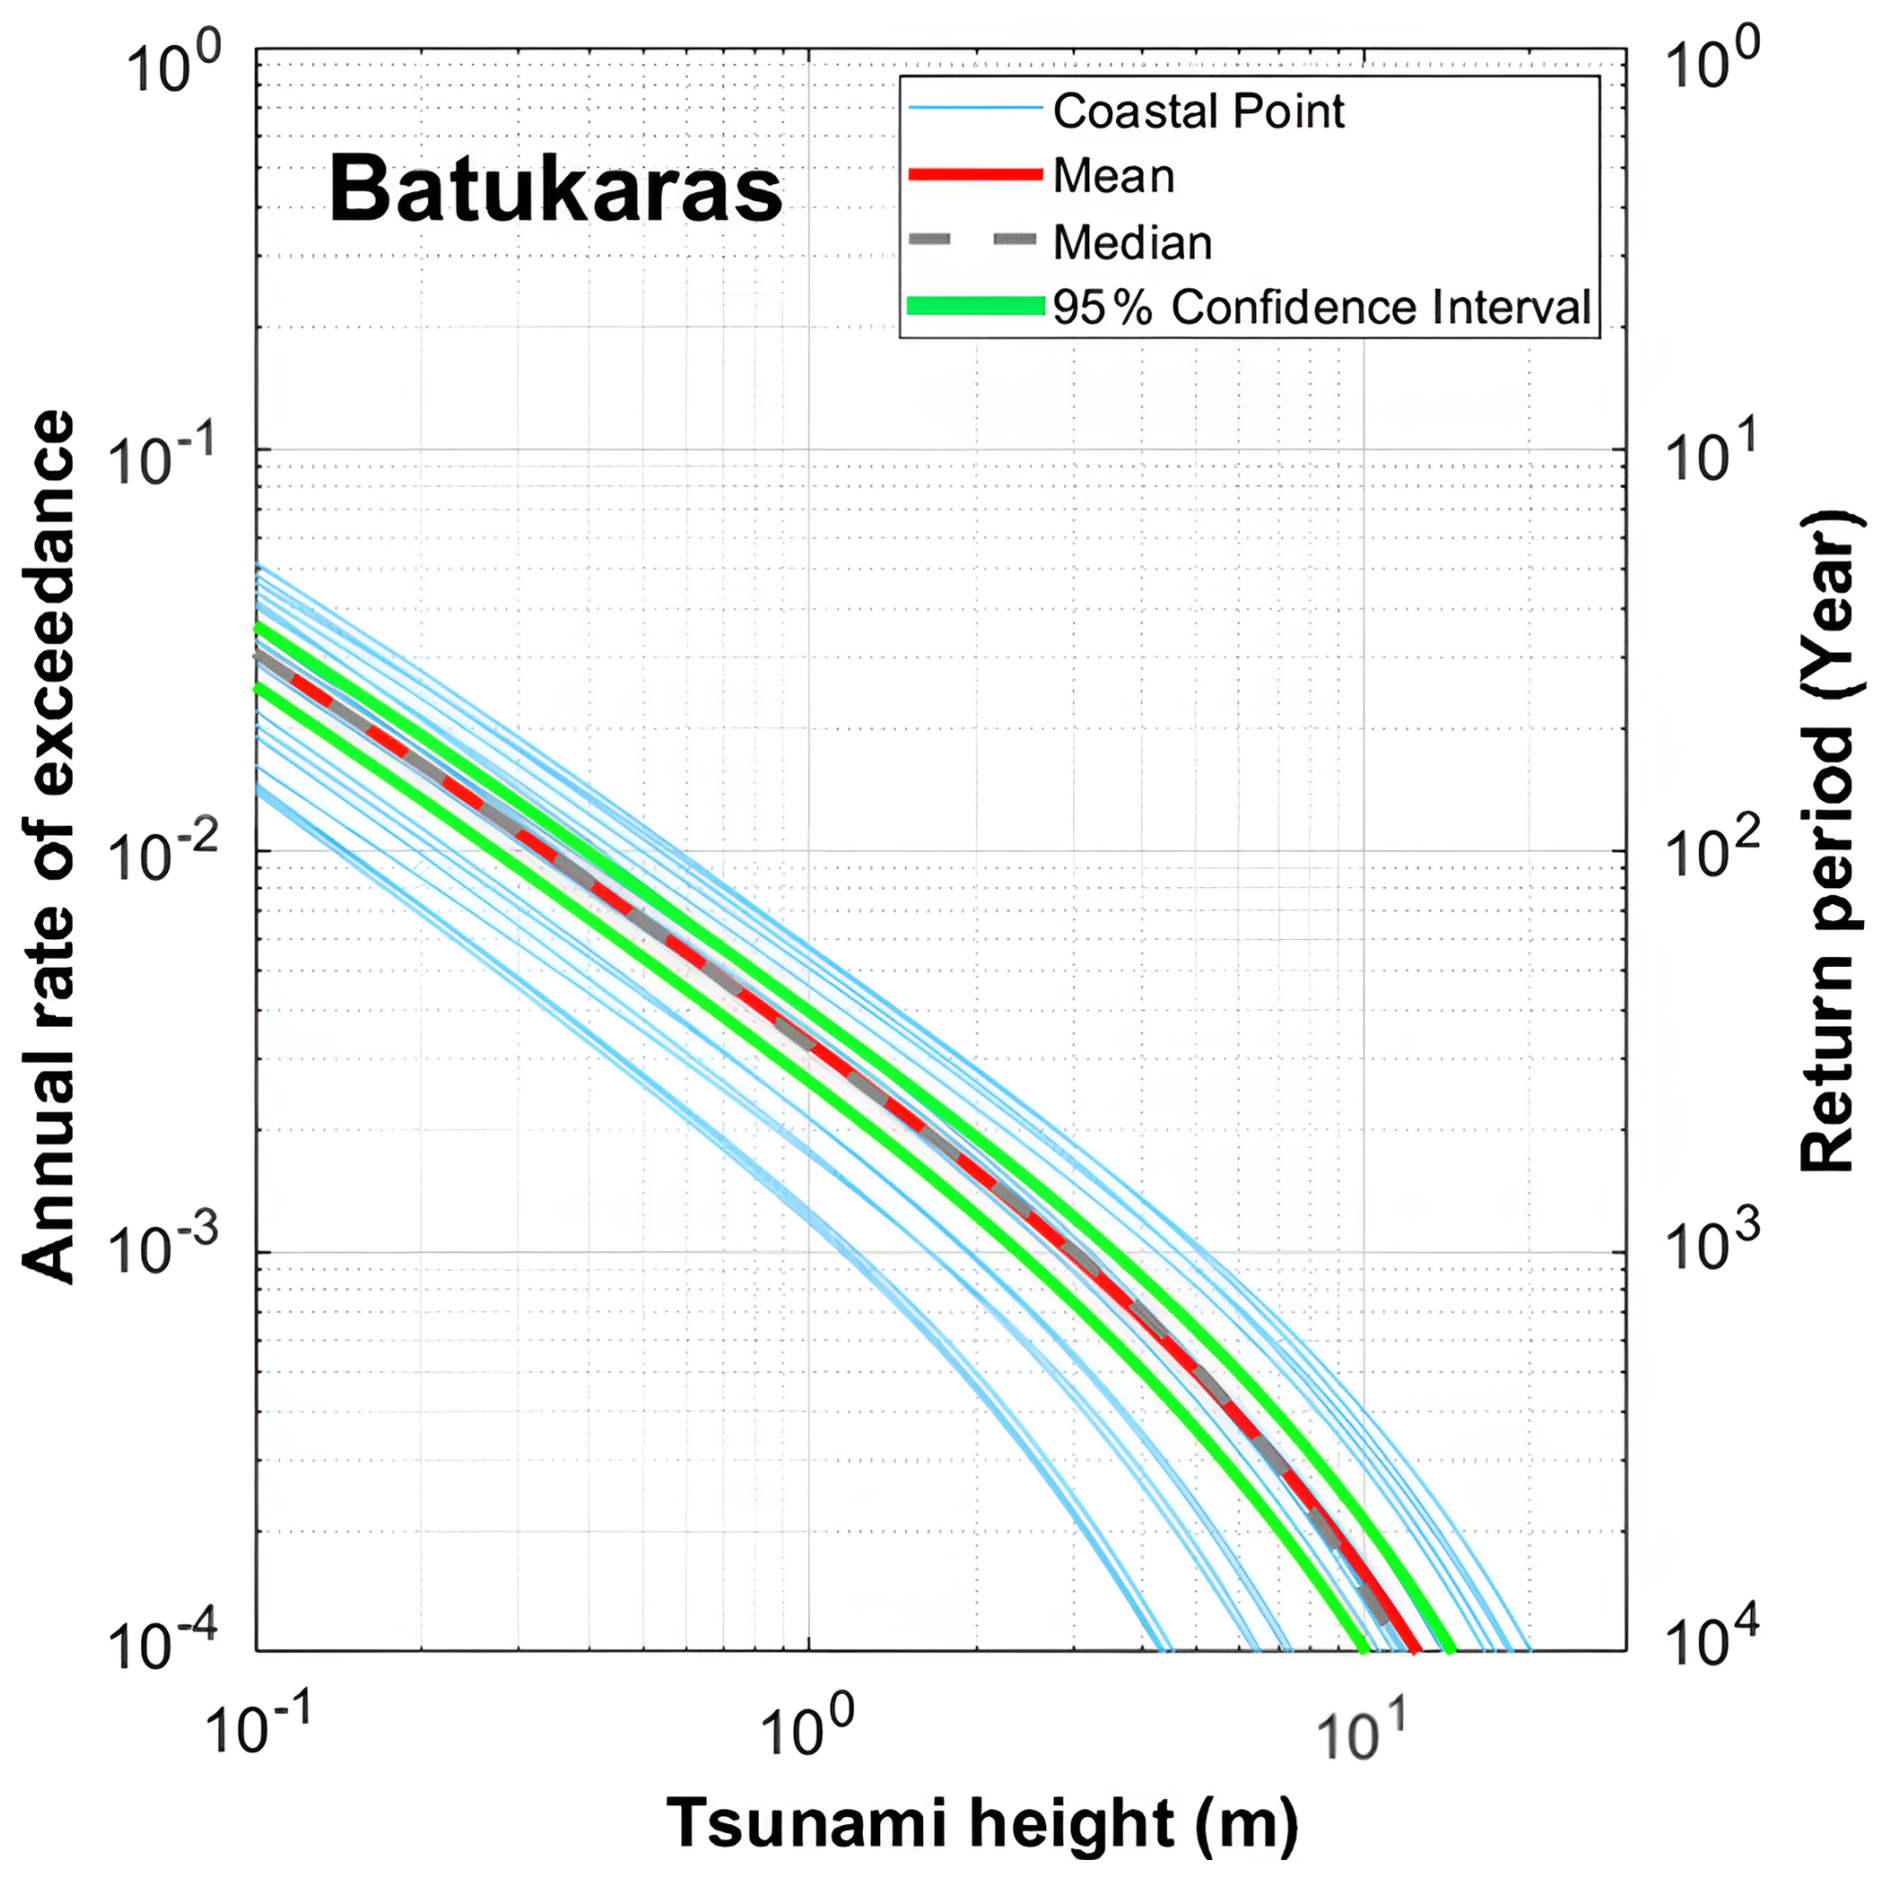
Figure 6Tsunami hazard curves at each observation point (light blue), including mean and median value curves in Batukaras.
Based on the hazard curve, the level of hazard can be seen from the probability of tsunami wave heights occurring in Batukaras at each observation point. In this case, 20 observation points were used, spread along the coastline of Batukaras. In addition, the mean and median values of the tsunami height can also be seen. As can be seen from Fig. 6, at an earthquake return period of 100 years, the tsunami height in Batukaras does not reach 1 m, but as the earthquake return period increases, the tsunami height will increase to 10 m at an earthquake period of 10 000 years.
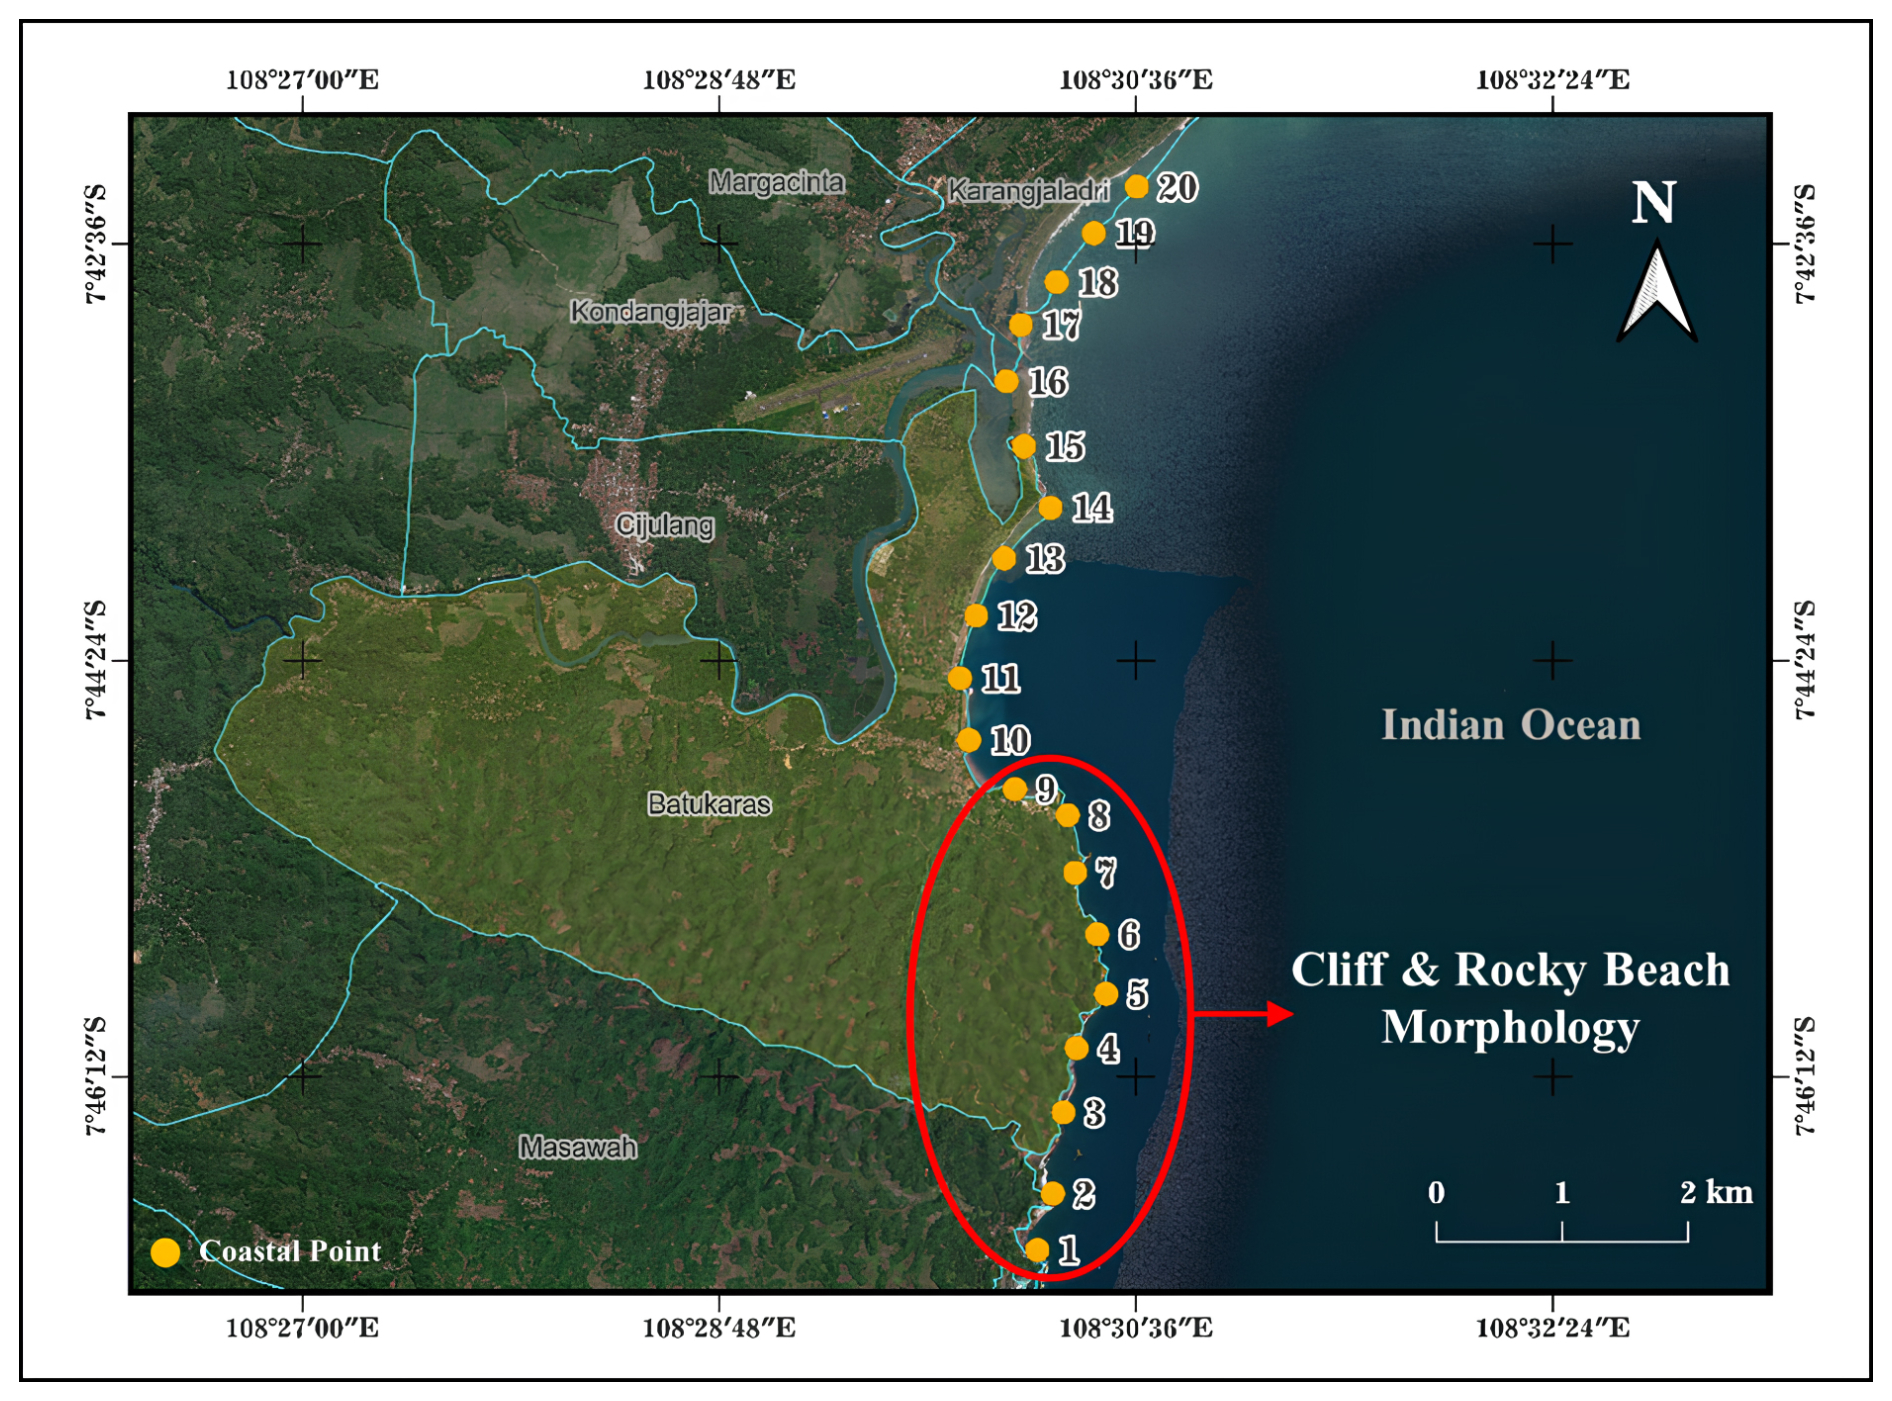
Figure 7Beach morphology in Batukaras. Imagery © Google Earth 2022.
The morphological conditions (shape) of the coast in Batukaras can be categorised into two types, namely steep and sloping coastal areas. When viewed from the distribution of observation points (coastal points) scattered along the coastline of Batukaras, the division of the two coastal morphologies can be seen in Fig. 7.
Based on Fig. 7, it can be seen that the first to ninth observation points are in the coastal area with steep morphology with characteristics of cliff and rocky beach. In contrast, the 10th to 20th observation points are located on the sloping coastal area in Batukaras. Therefore, in this PTHA in Batukaras, the tsunami height generated from the modelling results of the two types of coastal morphology is identified, which can be seen in Fig. 8.
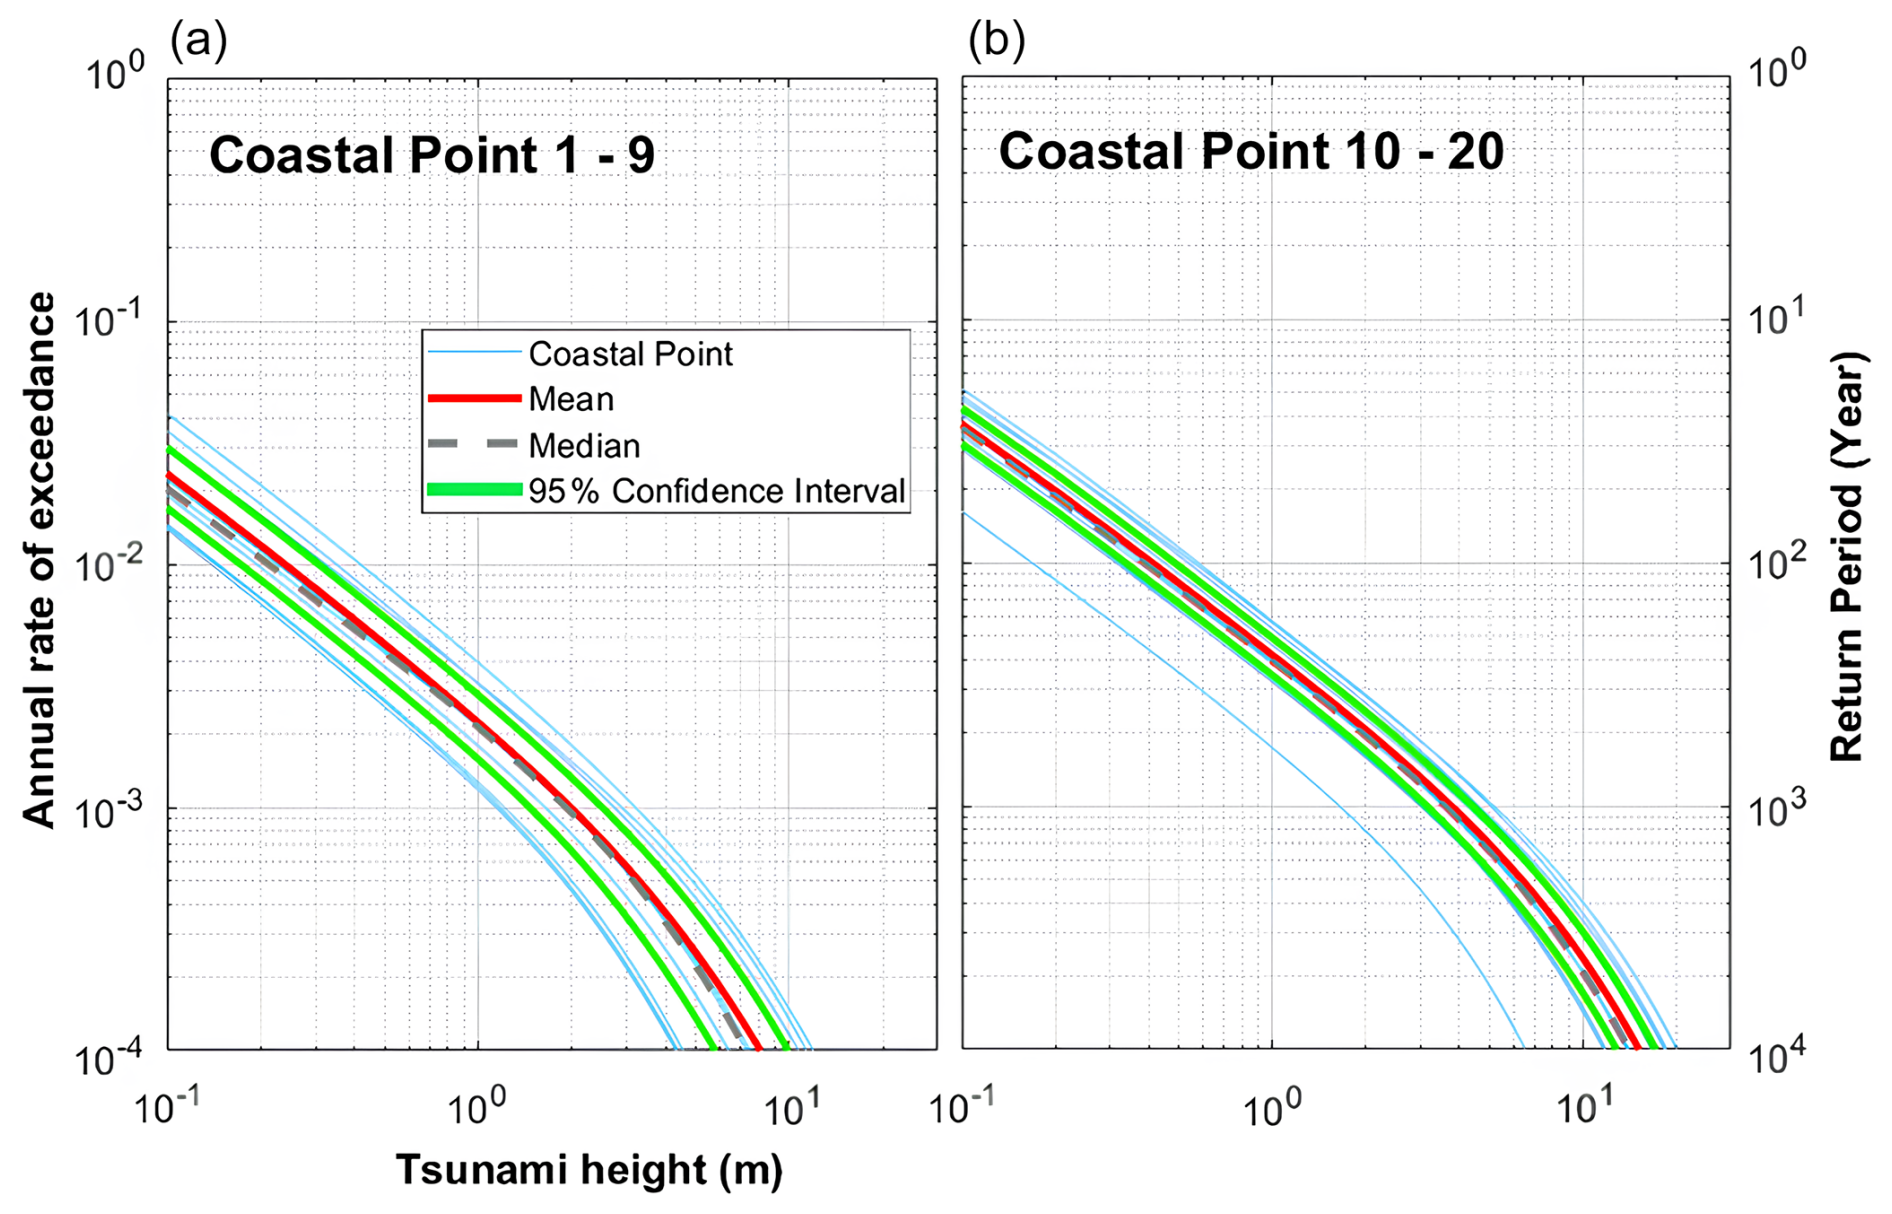
Figure 8Tsunami hazard curves based on earthquake return period. (a) Observation points 1 to 9; (b) observation points 10 to 20.
In the resulting hazard curve, a significant difference in average tsunami height can be seen between the two different coastal morphologies in Batukaras. In the coastal areas with steep morphology for an earthquake return period of 1000 years, the resulting average tsunami height is still below 10 m (lower than the average tsunami height in Batukaras presented in Fig. 6). In contrast, in coastal areas with a gently sloping morphology, the average tsunami height is already above 10 m (higher than the average tsunami height in Batukaras presented in Fig. 6). This shows that the morphology of the coast in Batukaras will affect the height of the tsunami generated.
3.2 Tsunami heights based on earthquake return period
The second product of the PTHA can also be viewed in graphical form to identify the tsunami height at each observation point. In this case, the tsunami height in Batukaras was identified based on four types of earthquake return periods, namely 250, 500, 1000, and 2500 years. This graph can be seen in Fig. 9.
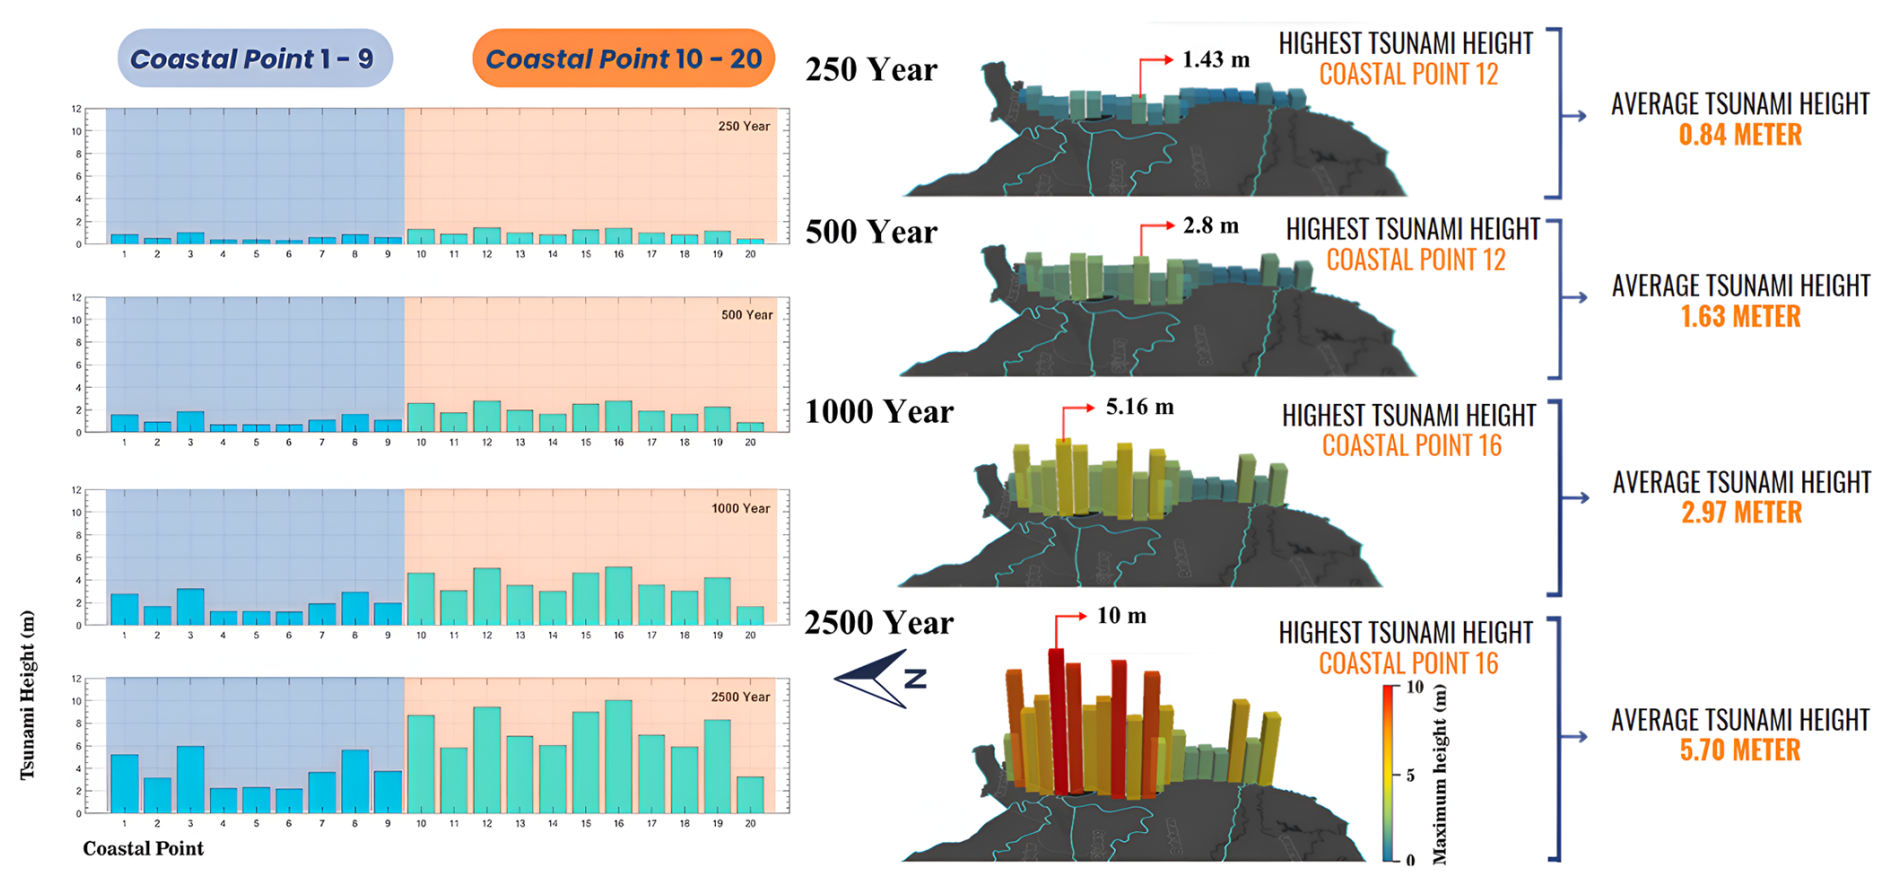
Figure 9Visualisation of tsunami height based on earthquake return period at each observation point.
Figure 9 shows a graph of the tsunami height at each earthquake return period derived from the tsunami hazard curve in Fig. 6. In this graph, the difference in tsunami height between the steep beach (1st to 9th observation points in the southern area) and sloping beach (10th to 20th observation points in the northern area) in Batukaras is clearly visible. Overall, tsunami heights at all observation points located on steep coastal areas were much lower than those on sloping coastal areas for each earthquake return period.
The average tsunami heights for sloping coastal areas are 0.58, 1.1, 1.98, and 3.75 m for each earthquake return period of 250, 500, 1000, and 2500 years, respectively. In contrast, the mean tsunami heights for steep coastal areas are 1.04, 2.05, 3.77, and 7.29 m for each of the 250-, 500-, 1000-, and 2500-year return periods, respectively. Based on these values, it can be seen that there is a twofold difference in the average tsunami height between the sloping coastal areas and the steep coastal areas at each earthquake return period.
3.3 Results of disaggregation of hazard in Batukaras
Disaggregation of earthquake hazard is the process of identifying which earthquake sources are most likely to affect an area, with a focus on magnitude and distance. This process yields the most significant average magnitude and distance combinations of earthquakes that are likely to have a large impact on the location (Kwong et al., 2015). Based on the results of this PTHA, the hazard contribution of each megathrust segment that can have an influence on tsunami events in Batukaras can be known. This disaggregation value can be seen at each observation point used in this modelling.
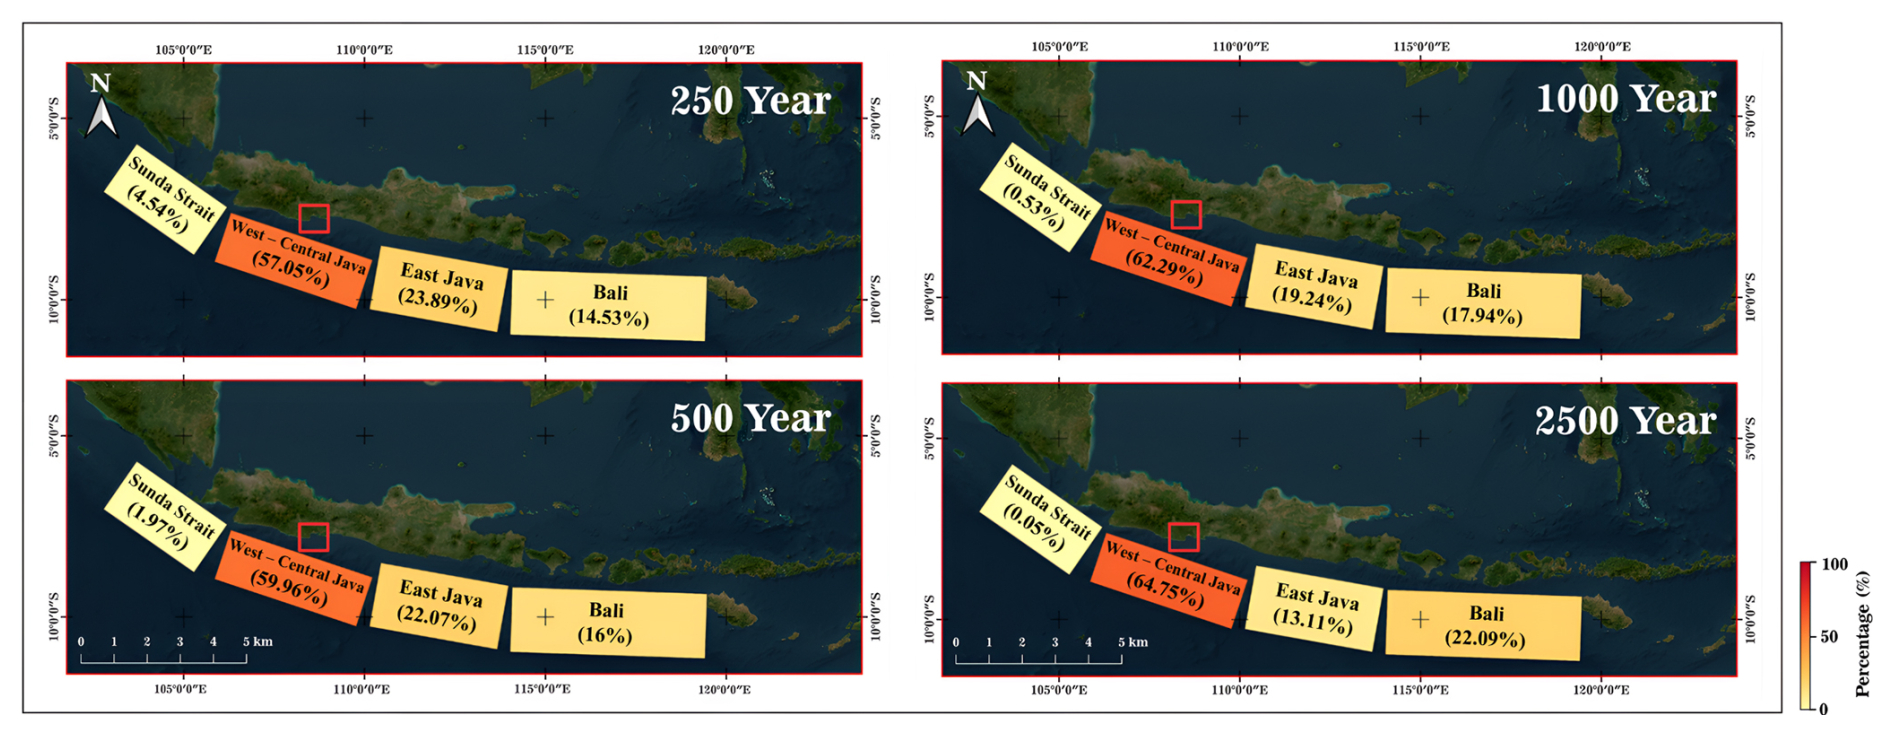
Figure 10Disaggregation map of each megathrust segment based on earthquake return period. Imagery © Google Earth 2022.
Overall, if the hazard disaggregation values are averaged from all observation points scattered along the coastline of Batukaras, the tsunami hazard disaggregation in Batukaras can be obtained. The hazard disaggregation values of each of these megathrust segments for tsunami events can be seen in Fig. 10.
Table 3Disaggregation of each megathrust segment based on earthquake return period.
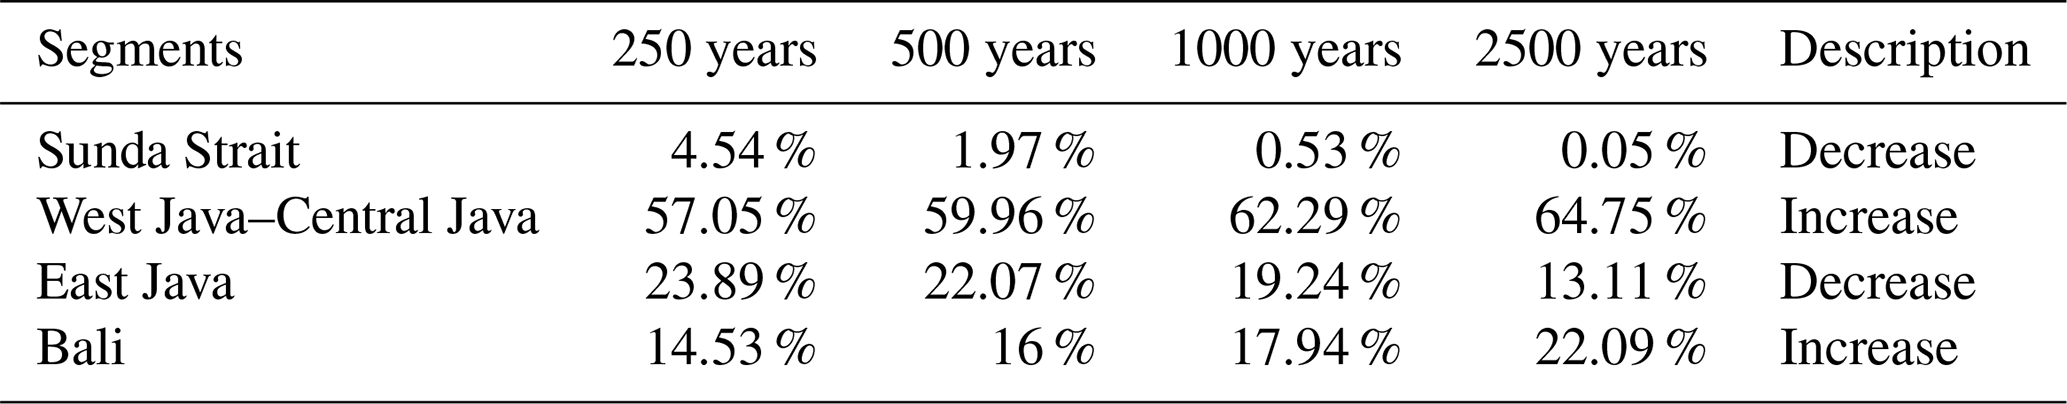
Based on the map, the disaggregation of each megathrust segment based on the return period of an earthquake can be seen. In each earthquake return period, the disaggregation numbers for each megathrust segment are shown in Table 3.
The table shows that the Sunda Strait megathrust segment has the smallest disaggregation for each earthquake return period. This is because the geographical location of this segment is in the western part of Batukaras. Thus, tsunami waves generated by an earthquake on this segment would have difficulty travelling to Batukaras since they do not directly face the Sunda Strait megathrust. In contrast, the disaggregation of the West Java–Central Java megathrust segment increases with each advancement of the earthquake return period. Geographically, this is because this segment is closest to and directly faces Batukaras. Therefore, if an earthquake occurs with an epicentre originating from this segment, the potential for the tsunami to reach Batukaras is quite high.
3.4 Results of annual probability of tsunami occurrence at earthquake return periods
The final PTHA product is the annual probability value of a tsunami occurring in Batukaras for each observation point. Based on this, the PTHA results show the annual tsunami probability values for each observation point for tsunami heights greater than 0.5, 1.5, and 3 m. These probability values are shown in Fig. 11.
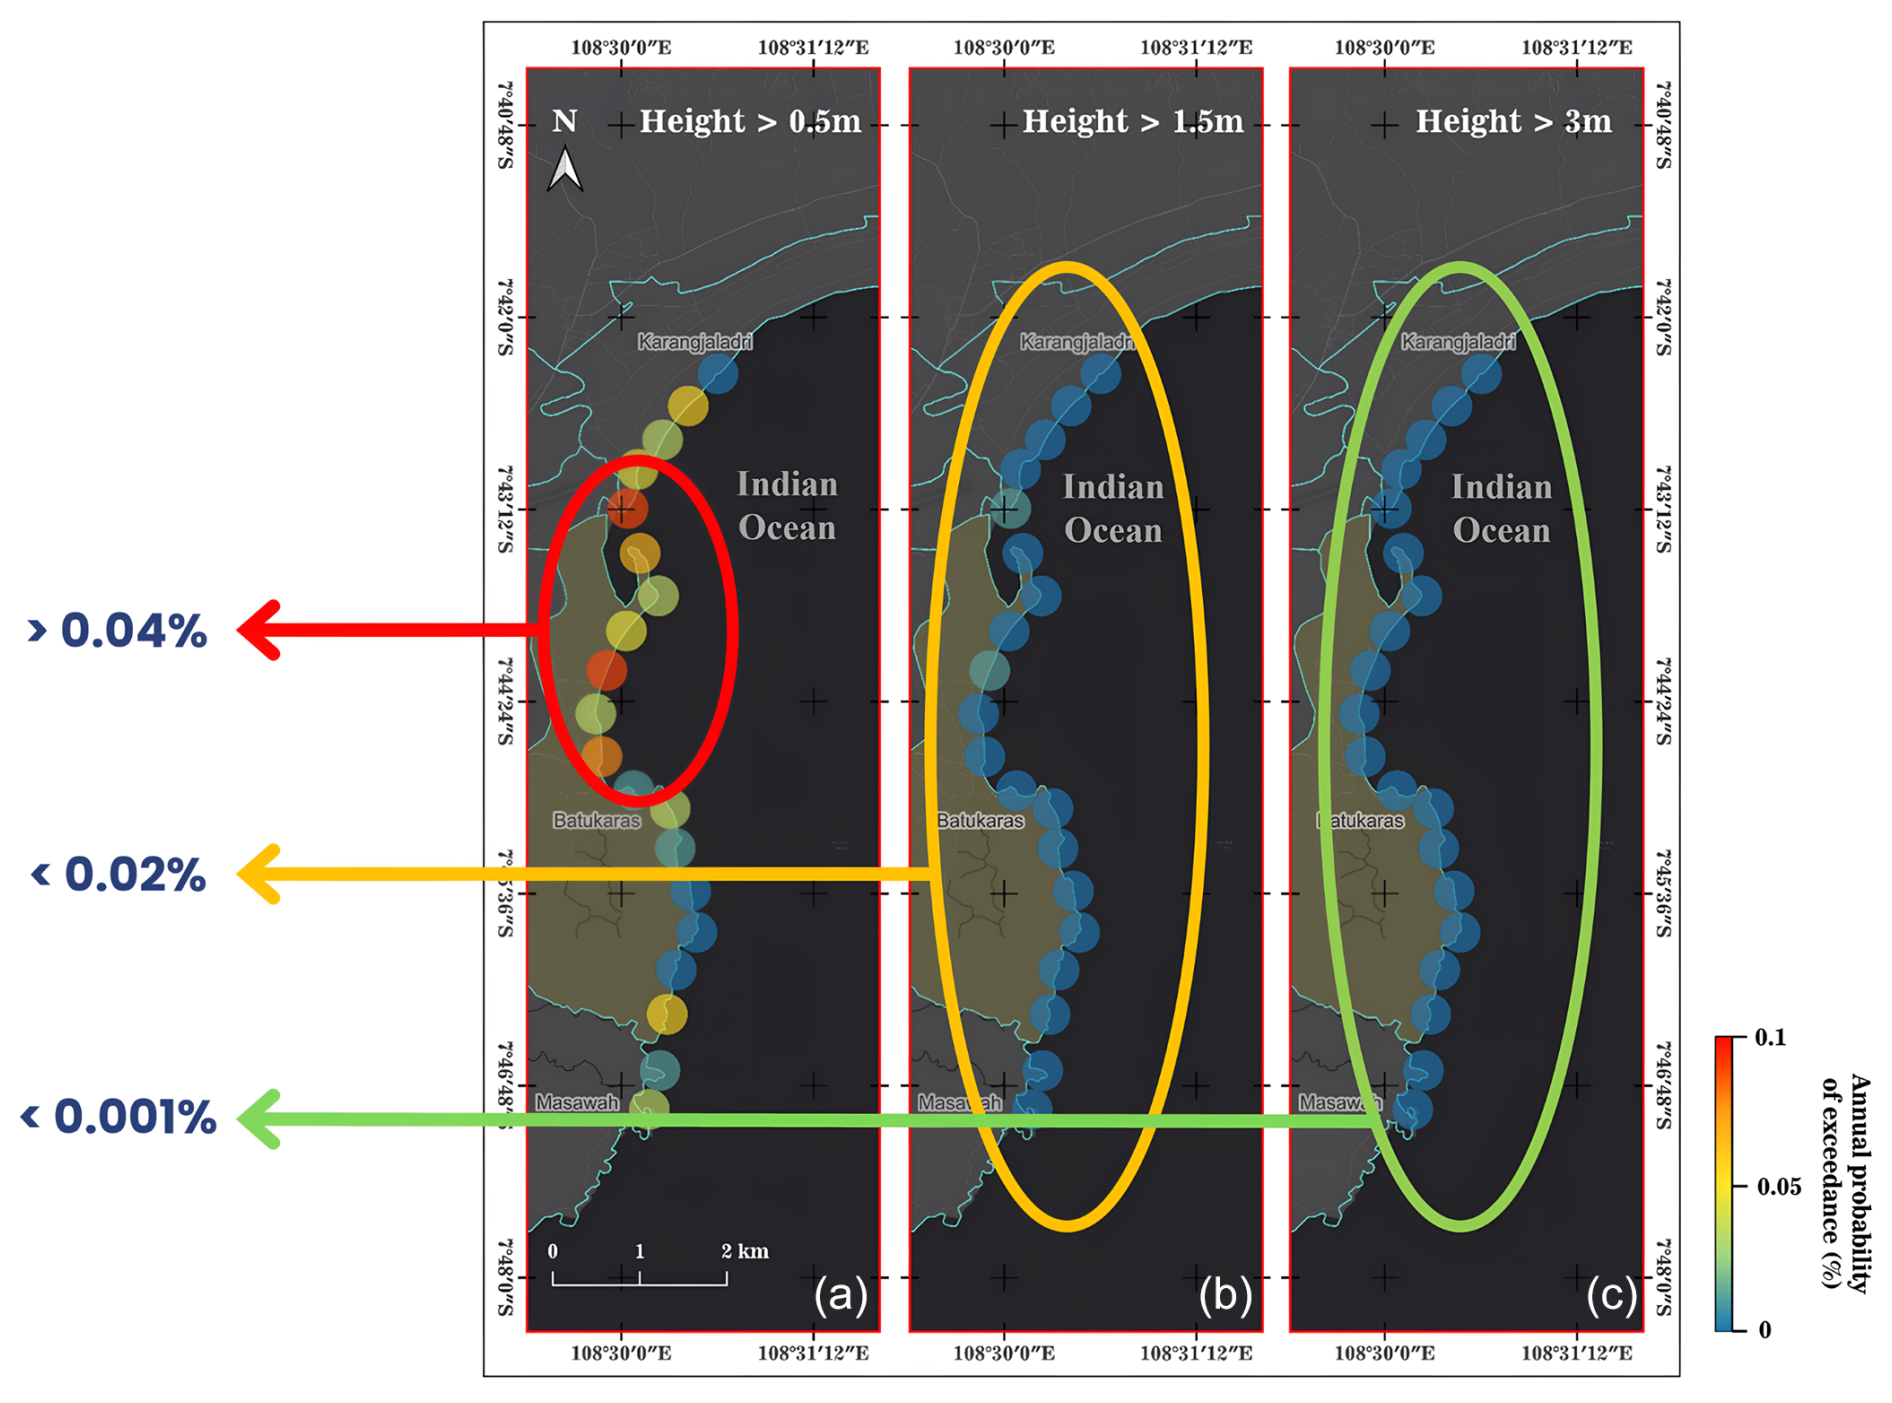
Figure 11Annual probability of tsunami occurrence in Batukaras based on tsunami heights of (a) > 0.5 m, (b) > 1.5 m, and (c) > 3 m.
Based on the map, it can be seen that the probability of a tsunami in Batukaras is less than 0.1 % in any given year. This probability value indicates a very small number of tsunami events in Batukaras. Such a result aligns with historical data, in which tsunami disasters are rare in Pangandaran Regency and its surroundings.
The probability for tsunami heights greater than 0.5 m in a given year, with a probability value greater than 0.04 %, is only found at observation points located in sloping coastal areas. The probabilities for tsunami heights of more than 1.5 and 3 m in a given year are less than 0.02 % and 0.001 % for all observation points, respectively. However, these probability values should not be used as the main reference because, like earthquakes, tsunamis can occur at any time.
The PTHA in Batukaras resulted in tsunami heights of 0.84, 1.63, 2.97, and 5.7 m for each earthquake return period of 250, 500, 1000, and 2500 years, respectively. The results of the tsunami hazard disaggregation in Batukaras show that the largest contribution of earthquake sources that can generate tsunamis in Batukaras comes from the West Java–Central Java megathrust segment, with a contribution value of more than 57 % for each earthquake return period. This can serve as a tsunami warning for Batukaras in the event of a high-magnitude earthquake centred on the West Java–Central Java segment. In contrast, the annual probability value of tsunami occurrence in Batukaras with a height of 0.5, 1.5, and 3 m has a probability smaller than 0.1 % in any given year.
The results of the PTHA can then be analysed in more detail by reviewing the tsunami height at each observation point. In the results of the hazard curve, different coastal morphologies produce different tsunami heights. The maximum tsunami height occurs in coastal areas with sloping morphology. This sloping coastal area is very vulnerable because it is dominated by lodging places and restaurants, making it vulnerable to tsunami disasters. Apart from the sloping coastal factor, the vulnerability of the Batukaras coast to tsunamis is also influenced by the social aspect, where the population in this village is quite dense, reaching 393 inhabitants per km−2. Apart from being crowded with residents, the Batukaras coast is also a famous tourist attraction for foreign tourists. This contributes to the vulnerability of the Batukaras coast to tsunami disasters. The coastal area is also vulnerable from an economic perspective because this coast is dominated by lodging, restaurants, and also agricultural land and plantations, which contribute to the village's regional income. The large amount of land that may be affected by the tsunami could cause significant economic losses for the surrounding community. The results of this PTHA modelling can be a reference for developing disaster mitigation strategies and scenarios in Batukaras, especially for sloping beach areas. This is particularly important considering that Batukaras is a tourist villages that is visited by many local and foreign tourists.
The results of this study can be used as a reference to conduct further research to calculate economic losses from buildings, land use, and other economic factors from tsunami disasters. In mitigation activities, the results of this research can be used to support assessment components in preparing Batukaras to become a tsunami-ready village, as published by IOC-UNESCO, considering that Batukaras is currently in the recognition process.
The bathymetry data were obtained from National Bathymetry (BATNAS) provided by the Indonesian Geospatial Information Agency (BIG) and are available at https://sibatnas.big.go.id/seamlessbatnas (login required; Geospatial Information Agency, 2025). The earthquake generation parameter data were obtained from the National Centre for Earthquake Studies (PuSGeN) in 2017 from https://klop.pu.go.id/knowledge/peta-sumber-dan-bahaya-gempa-1 (PusGen, 2017) and the United States Geological Survey (USGS) (https://doi.org/10.5066/F7PV6JNV, Hayes, 2018), and Hayes et al. (2018).
WW: writing – original draft, methodology, investigation, conceptualisation, supervision, funding acquisition. MWAG: writing – review and editing, data curation, formal analysis, visualisation. CADSN: writing – review and editing, data curation, supervision, validation. MS – data curation, formal analysis, visualisation. IH: writing – review and editing, supervision, validation. IEM: writing – review and editing, methodology, supervision. AN: writing – review and editing, validation.
The contact author has declared that none of the authors has any competing interests.
Publisher's note: Copernicus Publications remains neutral with regard to jurisdictional claims made in the text, published maps, institutional affiliations, or any other geographical representation in this paper. While Copernicus Publications makes every effort to include appropriate place names, the final responsibility lies with the authors.
This article is part of the special issue “Strengthening climate-resilient development through adaptation, disaster risk reduction, and reconstruction after extreme events”. It is not associated with a conference.
We acknowledge the support of the Faculty of Earth Sciences and Technology, Institut Teknologi Bandung, in the financial and administrative aspects of the research. We would also like to acknowledge the local government of Batukaras in Pangandaran Regency, Indonesia, for their support during the data acquisition.
Wiwin Windupranata is financially supported by Penelitian Kolaboratif (2023) (letter no. 1965/IT1.C01/SK-TA.00/2023), managed by the Faculty of Earth Sciences and Technology, Institut Teknologi Bandung (ITB).
This research has been supported by the Lembaga Penelitian dan Pengabdian Kepada Masyarakat (grant no. FITB.PPMI-1-42-2023).
This paper was edited by Marvin Ravan and reviewed by two anonymous referees.
Aida, I.: Reliability of a tsunami source model derived from fault parameters, J. Phys. Earth., 26, 57–73, https://doi.org/10.4294/jpe1952.26.57, 1978.
Annaka, T., Satake, K., Sakakiyama, T., Yanagisawa, K., and Shuto, N.: Logic-tree Approach for Probabilistic Tsunami Hazard Analysis and its Applications to the Japanese Coasts, Pure Appl. Geophys., 164, 577–592, https://doi.org/10.1007/s00024-006-0174-3, 2007.
Batukaras Village Profile: Batukaras Village Profile, Pangandaran Regency Government, Pangandaran, 2022.
Cornell, C. A.: Engineering seismic risk analysis, B. Seismol. Soc. Am., 58, 1583–1606, 1968.
Davies, G., Griffin, J., Løvholt, F., Glimsdal, S., Harbitz, C., Thio, H. K., Lorito, S., Basili, R., Selva, J., Geist, E., and Baptista, M. A.: A global probabilistic tsunami hazard assessment from earthquake sources, Geol. Soc. Spec. Publ., 456, 219–244, https://doi.org/10.1144/SP456.5, 2018.
Fritz, H. M., Kongko, W., Moore, A., McAdoo, B., Goff, J., Harbitz, C., Uslu, B., Kalligeris, N., Suteja, D., Kalsum, K., Titov, V., Gusman, A., Latief, H., Santoso, E., Sujoko, S., Djulkarnaen, D., Sunendar, H., and Synolakis, C.: Extreme runup from the 17 July 2006 Java tsunami, Geophys. Res. Lett., 34, 2007GL029404, https://doi.org/10.1029/2007GL029404, 2007.
Fujii, Y. and Satake, K.: Source of the July 2006 West Java tsunami estimated from tide gauge records, Geophys. Res. Lett., 33, 2006GL028049, https://doi.org/10.1029/2006GL028049, 2006.
Fukutani, Y., Suppasri, A., and Imamura, F.: Stochastic analysis and uncertainty assessment of tsunami wave height using a random source parameter model that targets a Tohoku-type earthquake fault, Stoch. Environ. Res. Risk. Assess., 29, 1763–1779, https://doi.org/10.1007/s00477-014-0966-4, 2015.
Geospatial Information Agency (BIG): SIBATNAS, Geospatial Information Agency (BIG) [data set], https://sibatnas.big.go.id/seamlessbatnas, last access: 19 February 2025.
Grezio, A., Babeyko, A., Baptista, M. A., Behrens, J., Costa, A., Davies, G., Geist, E. L., Glimsdal, S., González, F. I., Griffin, J., Harbitz, C. B., LeVeque, R. J., Lorito, S., Løvholt, F., Omira, R., Mueller, C., Paris, R., Parsons, T., Polet, J., Power, W., Selva, J., Sørensen, M. B., and Thio, H. K.: Probabilistic Tsunami Hazard Analysis: Multiple Sources and Global Applications, Rev. Geophys., 55, 1158–1198, https://doi.org/10.1002/2017RG000579, 2017.
Gunawan, E., Meilano, I., Abidin, H. Z., Hanifa, N. R., and Susilo: Investigation of the best coseismic fault model of the 2006 Java tsunami earthquake based on mechanisms of postseismic deformation, J. Asian Earth. Sci., 117, 64–72, https://doi.org/10.1016/j.jseaes.2015.12.003, 2016.
Gutenberg, B. and Richter, C. F.: Frequency of earthquakes in California, B. Seismol. Soc. Am., 34, 185–188, 1944.
Gutenberg, B. and Richter, C. F.: Seismicity of the earth and associated phenomena, Princeton University Press, New Jersey, USA, https://doi.org/10.1126/science.121.3146.562.c, 1954.
Hamzah, L., Puspito, N. T., and Imamura, F.: Tsunami Catalog and Zones in Indonesia., J. Nat. Disaster Sci., 22, 25–43, https://doi.org/10.2328/jnds.22.25, 2000.
Hanifa, N. R., Sagiya, T., Kimata, F., Efendi, J., Abidin, H. Z., and Meilano, I.: Interplate coupling model off the southwestern coast of Java, Indonesia, based on continuous GPS data in 2008–2010, Earth Planet. Sci. Lett., 401, 159–171, https://doi.org/10.1016/j.epsl.2014.06.010, 2014.
Harris, R., Meservy, W., Stuart, K., Deng, M., Emmett, C., Suliaman, H., Prasetyadi, C., Setiadi, G., Yulianto, E., Rafliana, I., Putra, P., Hall, S., Bunds, M., Arendt, A., and Horns, D.: Seismic and tsunami risk of the Java Trench and implementation of risk reduction strategies, in: SEG Technical Program Expanded Abstracts 2019, SEG Technical Program Expanded Abstracts 2019, 15–20 September 2019, SEG19 International Exposition and 89th Annual Meeting, San Antonio, Texas, 4786–4789, https://doi.org/10.1190/segam2019-3215203.1, 2019.
Hayes, G.: Slab2 – A Comprehensive Subduction Zone Geometry Model, U.S. Geological Survey data release [data set], https://doi.org/10.5066/F7PV6JNV, 2018.
Hayes, G. P., Moore, G. L., Portner, D. E., Hearne, M., Flamme, H., Furtney, M., and Smoczyk, G. M.: Slab2, a comprehensive subduction zone geometry model, Science, 362, 58–61, https://doi.org/10.1126/science.aat4723, 2018.
Horspool, N., Pranantyo, I., Griffin, J., Latief, H., Natawidjaja, D. H., Kongko, W., Cipta, A., Bustaman, B., Anugrah, S. D., and Thio, H. K.: A probabilistic tsunami hazard assessment for Indonesia, Nat. Hazards Earth Syst. Sci., 14, 3105–3122, https://doi.org/10.5194/nhess-14-3105-2014, 2014.
Koswara, D. V., Windupranata, W., Meilano, I., Hayatiningsih, I., and Hanifa, N. R.: Characteristics of Potential Tsunami Evacuee and Evacuation Infrastucture in Pangandaran Beach, Indonesia, IOP Conf. Ser.: Earth Environ. Sci., 925, 012036, https://doi.org/10.1088/1755-1315/925/1/012036, 2021.
Kwong, N. S., Chopra, A. K., and McGuire, R. K.: A framework for the evaluation of ground motion selection and modification procedures, Earthq. Engng. Struct. Dyn., 44, 795–815, https://doi.org/10.1002/eqe.2502, 2015.
Mai, P. M. and Beroza, G. C.: A spatial random field model to characterize complexity in earthquake slip, J. Geophys. Res., 107, 2308, https://doi.org/10.1029/2001JB000588, 2002.
Mori, N., Muhammad, A., Goda, K., Yasuda, T., and Ruiz-Angulo, A.: Probabilistic Tsunami Hazard Analysis of the Pacific Coast of Mexico: Case Study Based on the 1995 Colima Earthquake Tsunami, Front. Built Environ., 3, 34, https://doi.org/10.3389/fbuil.2017.00034, 2017.
Mulia, I. E., Gusman, A. R., Williamson, A. L., and Satake, K.: An Optimized Array Configuration of Tsunami Observation Network Off Southern Java, Indonesia, J. Geophys. Res.-Sol. Ea., 124, 9622–9637, https://doi.org/10.1029/2019JB017600, 2019.
Mulia, I. E., Ishibe, T., Satake, K., Gusman, A. R., and Murotani, S.: Regional probabilistic tsunami hazard assessment associated with active faults along the eastern margin of the Sea of Japan, Earth Planets Space, 72, 123, https://doi.org/10.1186/s40623-020-01256-5, 2020.
Mustafida, R. P., Veronica, N., Karima, A. Q., De Silva Nusantara, C. A., and Windupranata, W.: Identification of the IOC-UNESCO Tsunami Ready Indicator to Improve Coastal Community Preparedness for Tsunami Disaster in Batukaras Village, Pangandaran Regency, Indonesia, in: 2022 IEEE Asia-Pacific Conference on Geoscience, Electronics and Remote Sensing Technology (AGERS), 2022 IEEE Asia-Pacific Conference on Geoscience, Electronics and Remote Sensing Technology (AGERS), 21–22 December 2022, Surabaya, Indonesia, 41–47, https://doi.org/10.1109/AGERS56232.2022.10093500, 2022.
Nijman, V.: Tourism Developments Increase Tsunami Disaster Risk in Pangandaran, West Java, Indonesia, Int. J. Disaster Risk. Sci., 12, 764–769, https://doi.org/10.1007/s13753-021-00365-3, 2021.
PusGen: Map of Earthquake Sources and Hazards Year 2017, Pusat Penelitian dan Pengembangan Perumahan dan Pemukiman, Bandung, https://klop.pu.go.id/knowledge/peta-sumber-dan-bahaya-gempa-1 (last access: 19 February 2025), ISBN 978-602-5489-01-3, 2017.
Salmanidou, D. M., Heidarzadeh, M., and Guillas, S.: Probabilistic Landslide-Generated Tsunamis in the Indus Canyon, NW Indian Ocean, Using Statistical Emulation, Pure Appl. Geophys., 176, 3099–3114, https://doi.org/10.1007/s00024-019-02187-3, 2019.
Supendi, P., Widiyantoro, S., Rawlinson, N., Yatimantoro, T., Muhari, A., Hanifa, N. R., Gunawan, E., Shiddiqi, H. A., Imran, I., Anugrah, S. D., Daryono, D., Prayitno, B. S., Adi, S. P., Karnawati, D., Faizal, L., and Damanik, R.: On the potential for megathrust earthquakes and tsunamis off the southern coast of West Java and southeast Sumatra, Indonesia, Nat. Hazards, 116, 1315–1328, https://doi.org/10.1007/s11069-022-05696-y, 2023.
Thio, H.: Urs probabilistic tsunami hazard system: A user manual, Technical Report URS Corporation, San Francisco, CA, https://www.dropbox.com/scl/fi/3h1u723642zuv6s506a4c/Thio2012-PTHA-Manual-v1.00.pdf-dl-0?rlkey=odnj6kowfbln711f5zc8qylah&e=1 (last access: 19 February 2025), 2012.
Thio, H. K., Somerville, P., and Ichinose, G.: Probablistic Analysis of Strong Ground Motion and Tsunami Hazards in Southeast Asia, J. Earthq. Tsunami, 1, 119–137, https://doi.org/10.1142/S1793431107000080, 2007.
United States Geological Survey (USGS): Slab2 – A Comprehensive Subduction Zone Geometry Model, https://www.usgs.gov/data/slab2-a-comprehensive-subduction-zone-geometry-model, last access: 19 February 2025.
Wang, X.: User Manual for COMCOT Version 1.7 (First Draft), https://citeseerx.ist.psu.edu/document?repid=rep1&type=pdf&doi=401de93588d6c28d0c3984044ad1f95b75dadab0 (last access: 19 February 2025), 2009.
Windupranata, W., Hanifa, N. R., Nusantara, C. A. D. S., Aristawati, G., and Arifianto, M. R.: Analysis of tsunami hazard in the Southern Coast of West Java Province – Indonesia, IOP Conf. Ser.: Earth Environ. Sci., 618, 012026, https://doi.org/10.1088/1755-1315/618/1/012026, 2020.