the Creative Commons Attribution 4.0 License.
the Creative Commons Attribution 4.0 License.
 | 20 Mar 2024
A new regionally consistent exposure database for Central Asia: population and residential buildings
Alberto Tamaro
Baurzhan Adilkhan
Satbek Sarzhanov
Vakhitkhan Ismailov
Ruslan Umaraliev
Mustafo Safarov
Vladimir Belikov
Japar Karayev
Ettore Faga
Central Asia is highly exposed to a broad range of hazardous phenomena including earthquakes, floods and landslides, which have cause substantial damage in the past. However, disaster risk reduction strategies are still under development in the area. We provide a regional-scale exposure database for population and residential buildings based on existing information from previous exposure development efforts at the regional and national scale. Such datasets are complemented with country-based data (e.g., building census, national statistics) collected by national representatives in each Central Asian country (Kazakhstan, the Kyrgyz Republic, Tajikistan, Turkmenistan, Uzbekistan). We also develop population and residential-building exposure layers for the year 2080, which support the definition of disaster risk reduction strategies in the region.
- Article
(6713 KB) - Full-text XML
- BibTeX
- EndNote


Central Asia is highly exposed to a broad range of hazardous phenomena including earthquakes, floods and landslides. Such disasters can affect single countries but often have trans-boundary consequences. In addition, disaster risk and subsequent losses are expected to increase under the effect of climate change (Yuyu et al., 2019). For these reasons, a regional-scale approach is needed to support, plan and coordinate disaster risk reduction (DRR) strategies in the Central Asian region. Such an approach should rely on evidence-based technical and scientific assessments of all elements that determine risk. In particular, exposure plays a paramount role in disaster risk reduction by supporting the identification of the number and type of assets damaged or disrupted by hazardous phenomena (Pittore et al., 2017). For DRR purposes, it is particularly relevant to know the number and characteristics (e.g., demographics) of occupants to define mitigation measures (e.g., evacuation plans) and long-term preparedness programs (e.g., education activities). Knowledge on the typology and characteristics of residential buildings is also paramount in order to assess which buildings can suffer damage and the potentially harmed or stranded occupants. Finally, exposure layers provide a financial indicator of the exposed assets value, in particular buildings, to support regional disaster risk reduction and financial risk mitigation activities.
In Central Asia, strong efforts have been devoted to assessing expected hazard and to estimating risk for specific hazardous phenomena (e.g., earthquakes). However, most risk assessment efforts have been focused on single countries and hazards, such as during the project “Measuring Seismic Risk in Kyrgyz Republic”, developed by the World Bank in the period 2014–2017. During the EMCA (Earthquake Model Central Asia) project (https://www.emca-gem.org/, last access: 11 March 2024), a first important step was taken towards unifying hazard, exposure, vulnerability and risk assessment at the regional scale for Central Asia. However, the effort was focused on seismic risk, while less attention was devoted to assessing impacts of other hazardous phenomena (floods, landslides) at the regional scale. Flood hazard, nonetheless, has become increasingly relevant in Central Asia, causing impacts that were often exacerbated by the difficulties of trans-boundary cooperation (e.g., concerning reservoirs' operation and maintenance; UNECE, 2011; Libert and Trombitcaia, 2015). Following earthquakes and floods, landslides are the third most prevalent natural hazard in Central Asia (CACDRMI, 2009) and are often triggered by natural events such as earthquakes, floods, rainfall and snowmelt (Saponaro et al., 2014; Strom and Abdrakhmatov, 2017). The population of Central Asia is steadily growing and is expected to exceed 100 million people by 2050, with a much higher growth rate than the world average (36.9 % against 26.2 %, https://www.eurasian-research.org/publication/un-population-prospects-case-of-central-asia/, last access: 11 March 2024). The most populated countries are Uzbekistan and Kazakhstan, but population density is unevenly distributed in the region with almost 50 % of the population concentrated in few densely populated cities (Seitz, 2019). Given the wide range of impacts that might be caused by earthquakes, floods and landslides and their potential interaction beyond country boundaries, a regional-scale exposure database is currently of paramount importance. The only regional-scale exposure datasets of residential buildings available at the time of writing (April 2023) are provided by Pittore et al. (2020) and Yepes-Estrada et al. (2023). The dataset provided by Pittore et al. (2020) relies on ground-based and remote sensing data in the Kyrgyz Republic and Tajikistan (Wieland et al., 2012, 2015); was designed for the purpose of seismic risk assessment; and has a variable spatial resolution, obtained by Voronoi tessellation, which is coarser in rural areas. Similarly, the database provided by Yepes-Estrada et al. (2023), which also assimilates the dataset of Pittore et al. (2020), makes use of bottom-up approaches to produce an updated exposure layer at a resolution of approximately 30 km. Replacement costs provided by Pittore et al. (2020) were based on specific studies developed on the Kyrgyz Republic (Arup, 2016) but required additional validation based on more recent country-based data for all five countries of Central Asia. For these reasons, a regionally consistent exposure dataset with the latest information on population, residential buildings and associated replacement costs obtained from local representatives was needed. In addition, for the purpose of flood and landslide risk assessment, the resolution had to be increased. In this study, we assembled the first high-resolution (500 m) regionally consistent exposure database of population and residential buildings exposed to earthquakes, landslides and floods in Central Asia. The dataset was developed using the last available census of population and buildings and recent construction costs provided by local partners of the consortium in each of the five countries of Central Asia.
Exposure databases not only support current risk assessment estimates, but also can inform strategies for the mitigation of future risks, which might be exacerbated by long-term phenomena (e.g., climate change). This requires projecting the exposure to represent the future situation, e.g., at the end of the century. At the time of writing, no future dataset of population and residential buildings is available for Central Asia. Shared Socioeconomic Pathways (SSPs; O'Neill et al., 2014) represent possible developments scenarios over a century timescale based on different economic, environmental and social policies. Here, we present the first exposure dataset for 2080 developed for three selected SSPs in order to support the definition of long-term disaster risk reduction strategies at the regional scale. Future urban-area layers were developed at global scale for different SSPs developed specifically for Central Asia (Pedde et al., 2019). The work was developed within the SFRARR (Strengthening Financial Resilience and Accelerating Risk Reduction in Central Asia) program, promoted by the European Union and aimed at leveraging all risk-related data and assessments in order to quantify financial disaster risk in Central Asia. The program focused on earthquakes, floods and landslides and envisaged the creation of the first high-resolution (500 m) regionally consistent exposure database for multiple hazards in Central Asia.
The regional-scale exposure layers for Central Asia were developed based on data collected at two spatial scales: global–regional and national–sub-national.
Global–regional scale. Global- and regional-scale data were collected from existing official sources and literature works, following the suggestions of international experts in the region, such as the Regional Scientific and Technical Council (RSTC), constituted in the framework of the EU SFRARR program. In general, these databases have large coverage but often lower spatial resolution. For the development of population exposure layers, the Facebook global dataset was retrieved for the year 2020, available at the Humanitarian Data Exchange web page (https://data.humdata.org/dataset, last access: 7 December 2023, Facebook, 2023a, b, c, d, e). It contains the total population at 30 m resolution and the fraction of population by gender and age classes. As for residential buildings, the regional-scale layer of Pittore et al. (2020) is the most recent available exposure database for the region. The spatial distribution of urban and rural areas was retrieved from the Global Human Settlement Layer (GHSL) project (JRC, 2021) at 1 km resolution for the years 2000 and 2015. Spatial layers of expected urban area in 2080 under different SSPs were provided Chen et al. (2020) at 1 km resolution.
National–sub-national scale. The data collection was performed by the exposure working group, constituting contact persons for each of the five countries of Central Asia who collected data both from national ministries (e.g., census data) and from past projects carried out in their country. Local partners collected the population census for the latest year available (2021 for Uzbekistan, 2020 for Kazakhstan and the Kyrgyz Republic, 2019 for Turkmenistan, and 2018 for Tajikistan). For two countries, Kazakhstan and Uzbekistan, information about the number of households by oblast and load-bearing material was available. National and sub-national official data are usually provided by recognized institutions (e.g., national ministries) and have higher spatial resolution with respect to global or regional data. However, their availability is limited to some countries, such as in the case of building censuses. In addition, local experts can provide additional data related to their judgment (e.g., expert opinion) which support the exposure development efforts.
The exposure assessment is based on a combination of data collected at two spatial scales: global–regional and national–sub-national. The underlying assumption is that recent country-based data (national or sub-national scale) are more reliable than global or regional layers. Based on these considerations, existing global/regional layers were complemented with the national or sub-national scale, as described in the following subsections for population and residential buildings.
3.1 Development of population exposure layers
The population exposure layer was developed based on the Facebook high-resolution dataset (https://data.humdata.org/dataset, last access: 7 December 2023, Facebook, 2023a, b, c, d, e), which was enhanced using the country-based demographic information. Population data in the Facebook dataset, originally available at 20 m resolution, were aggregated at 100 m resolution and classified into three age intervals: population younger than 5 years old, older than 60 years old or in the intermediate age class. The Facebook data were then compared with national census data collected by local partners. These data include population data by age and gender in each country and sub-national administrative units (oblasts) extracted from the latest available national census (2021 for Uzbekistan, 2020 for Kazakhstan and the Kyrgyz Republic, 2019 for Turkmenistan, and 2018 for Tajikistan). Differences in the total population exceeded 20 % in 7 oblasts over a total of 44 oblasts considered in the study. The comparison showed that at the regional scale, the Facebook dataset contains 5 % less population with respect to the national census retrieved. At the national scale, the population in the Facebook dataset was also consistently lower than in the national census, with a difference of 1.5 %, 4 %, 5 % and 8 % for Kazakhstan, Uzbekistan, Turkmenistan and the Kyrgyz Republic, respectively. We noticed that larger discrepancies were associated with the presence of older census data (e.g., for Turkmenistan), while smaller differences are found in Kazakhstan and Uzbekistan, with the exception of the Kyrgyz Republic, where discrepancies were high despite the census being relatively recent. The estimated difference was then used to refine the Facebook dataset, under the assumption that updated country-based data are more reliable than regional datasets. For Tajikistan, given that the retrieved data were older than the Facebook dataset and were available only for selected towns, we did not correct the Facebook layer, assuming it to be more reliable. The correction was performed on a cell-by-cell basis and proportionally to the estimated difference between the two datasets. The same procedure was applied at the city scale to a number of cities in the Kyrgyz Republic, Kazakhstan and Turkmenistan for which population data were available. Gender and age percentages were also corrected, with the exception of the elderly fraction because the data at the national scale were only available for different age thresholds (e.g., 70 for the Kyrgyz Republic and Uzbekistan, 63 for Kazakhstan). The population layer was validated using data collected by local partners for specific cities. The final dataset was produced at a resolution of 100 m.
3.2 Development of residential-building exposure layers
The exposure assessment of residential buildings consists in defining dominant building typologies (codified by taxonomies). For residential buildings, pre-defined typologies were available from a previous project, EMCA (Earthquake Model Central Asia). Typologies were defined based on national-scale surveys, in particular in the Kyrgyz Republic and Tajikistan, and extended to the entire Central Asian region (Wieland et al., 2015). EMCA typologies are described based on the Global Earthquake Model (GEM) building taxonomy (Silva et al., 2022) In this work we updated the existing typologies with the information collected at a national scale by local partners and their associated taxonomy (Table 1). In particular, country-based census data for 2020 were collected for Kazakhstan and Uzbekistan, for which the building census provided the number of buildings per typology aggregated at the oblast level. A correspondence was defined between the national census typologies and the ones in the EMCA classification based on the typology description, pictures and input provided by local partners.
Table 1Building typologies defined for residential buildings in Central Asia, based on the previous work of Wieland et al. (2015) and Pittore et al. (2020). Each EMCA typology and sub-typology is associated with age and story number (expressed in ranges), average floor area, number of households, and average occupancy. The taxonomy in the GEM format (Silva et al., 2022) is also provided. Definitions for the ECMA sub-typologies: URM, unreinforced masonry (1, wooden floors; 2, concrete floors); CM, confined masonry; RM-L, reinforced masonry (low rise); RM-M, reinforced masonry (medium rise); RC, reinforced concrete (1, frame without earthquake-resistant design (ERD); 2, frame with moderate ERD; 3, frame with high level of ERD; 4, walls without ERD); RCPC, reinforced concrete walls (1, with moderate ERD; 2, with high level of ERD); ADO, adobe; WOOD, timber structure (1, load-bearing braced frames; 2, wooden frame and mud infill); STEEL, steel.
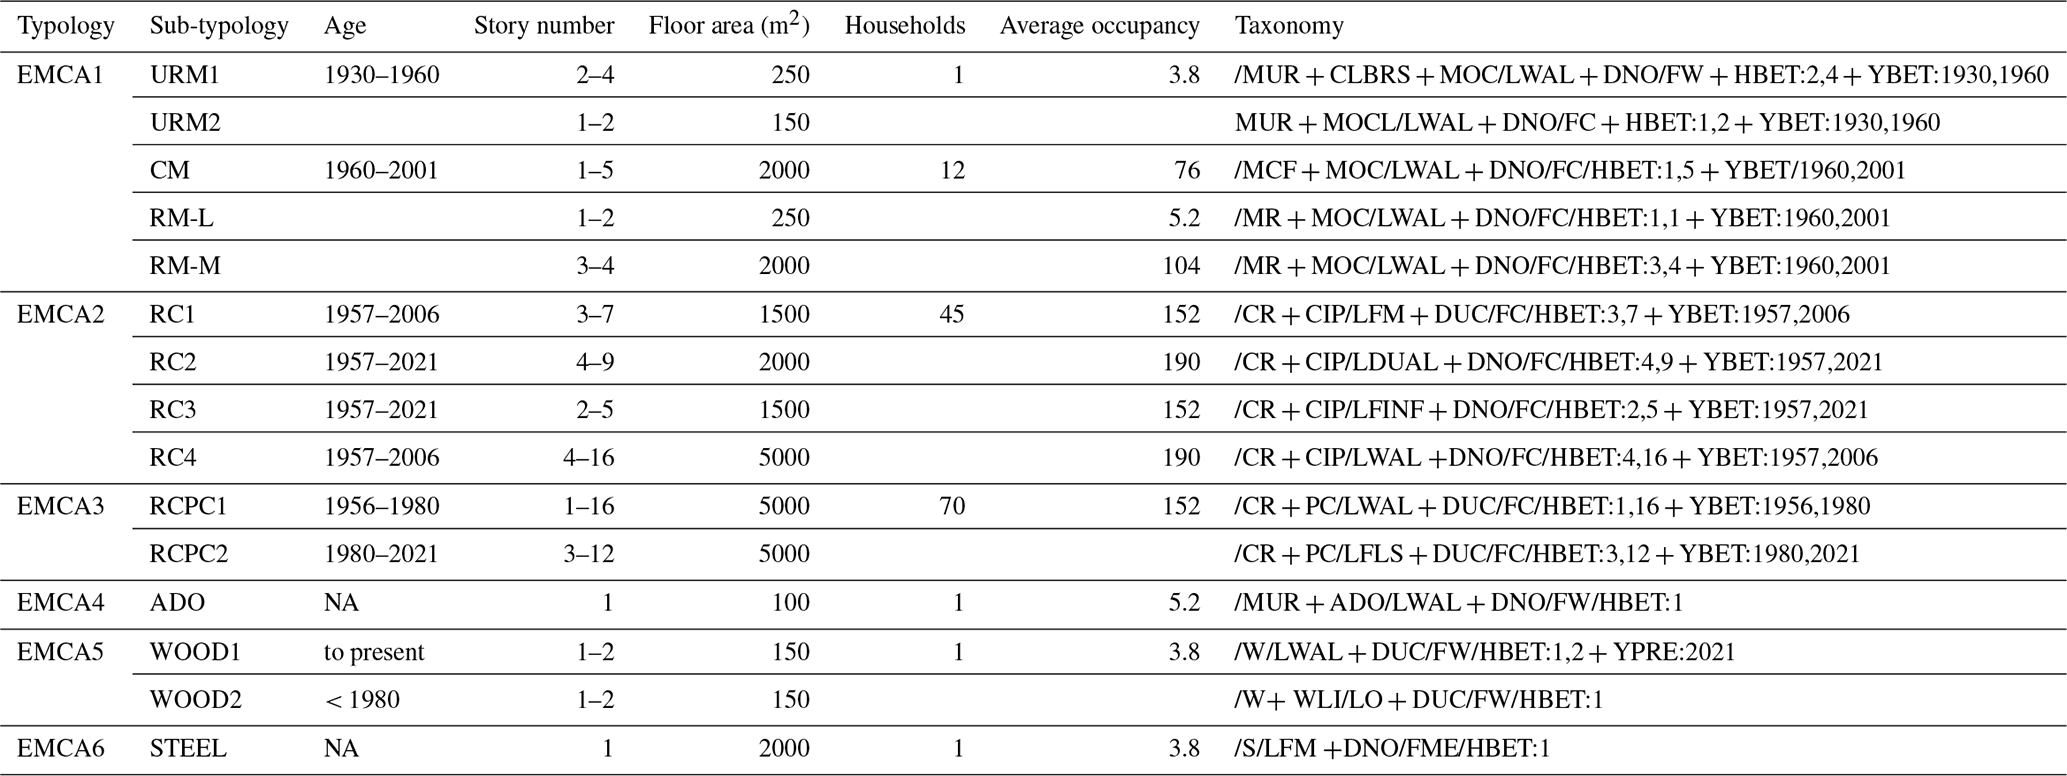
NA: not available.
The spatial distribution of building typologies was derived from the layer provided by Pittore et al. (2020), which collects all the previous information generated by the EMCA project. The original layer has a variable resolution ranging from a few hundred meters in urban areas to several kilometers in rural areas and was developed specifically for earthquake risk assessment purposes. First, the layer of Pittore et al. (2020) was updated using recent census data at the oblast level, available for Kazakhstan and Uzbekistan. Then, the spatial resolution was increased to produce a residential-building exposure layer on a 500 m resolution grid and support risk assessment for flood hazard. The procedure, exemplified in Fig. 1 for Kazakhstan. comprised three main steps:
-
Each cell of the variable-resolution layer was identified as urban or rural based on the 2015 Global Human Settlement Layer (JRC, 2021). GHSL cells associated with a city code were classified as urban, while urbanized areas without a city code, which correspond to villages, were assumed to be rural. Each urban/rural area was associated with a distribution of EMCA building typologies, provided by Wieland et al. (2015) for each Central Asian country.
-
The collected country-based information for Kazakhstan and Uzbekistan was integrated in the layer of Pittore et al. (2020) maintaining its original spatial resolution. The number of buildings in each EMCA typology and in each oblast was distributed on the variable-resolution grid, using the total population in each cell (included in the layer of Pittore et al., 2020) as a proxy for their spatial distribution. The procedure was performed for each EMCA typology and accounted for the different building type distribution in urban and rural areas identified in the previous step.
-
The distribution of residential buildings was on a regular grid of 500 m. This was done in two steps. First, the buildings in each variable-resolution cell were distributed on a new, regular grid of 30 m resolution based on the Facebook population layer. Population density in the 30 m layer was therefore used as a proxy for the building presence. The final residential-building exposure layer was assembled by aggregating the values at 500 m resolution. A few simple checks were performed in order to make sure that no points were associated with a null population and non-null number of buildings, or vice versa, and that the average number of occupants per building was consistent with the average occupancy defined for Central Asian typologies (Table 1).
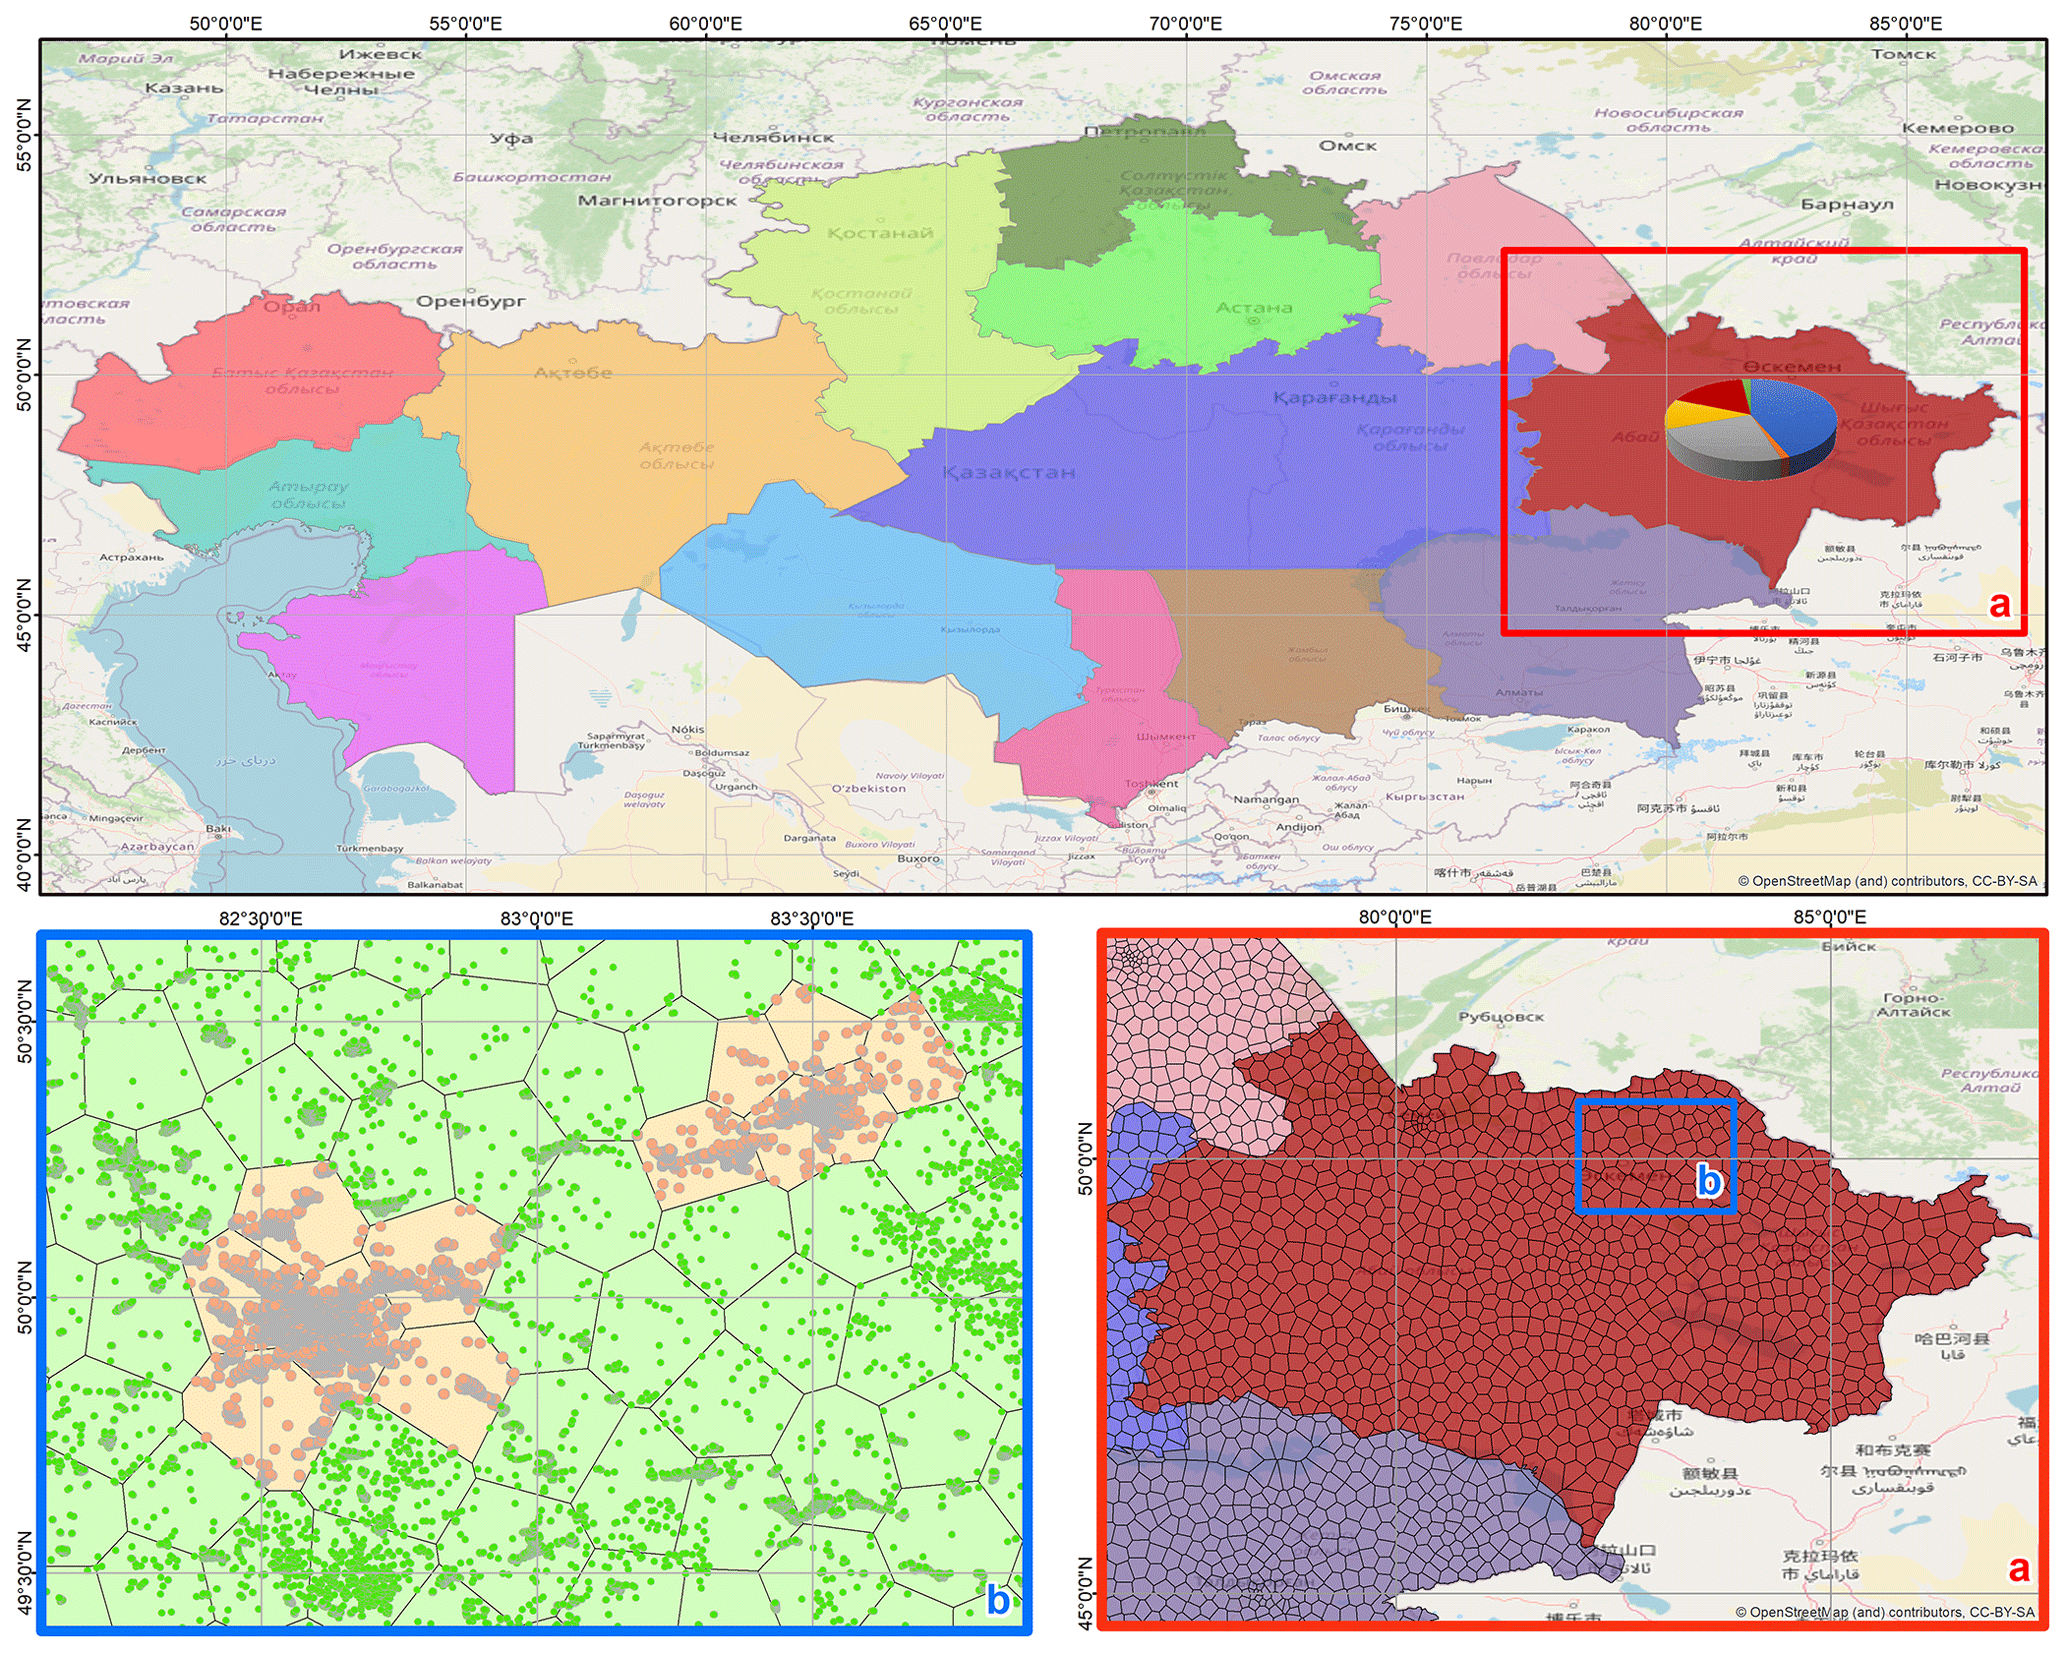
Figure 1Methodology for obtaining the exposure layer of residential buildings at 500 m resolution, exemplified for Kazakhstan. First, the existing exposure layer of Pittore et al. (2020) is integrated with country-based information provided by local partners for each oblast (a). Secondly, the information is disaggregated on a regular 500 m grid (b). The different distribution of building typologies in urban and rural areas was accounted for following Wieland et al. (2015). Background map data extracted from OpenStreetMap are available from https://www.openstreetmap.org (last access: 16 January 2024) (© OpenStreetMap contributors 2023; distributed under the Open Data Commons Open Database License (ODbL) v1.0.).
Replacement costs were defined based on country-based values provided by local partners for each building typology. Costs were provided in USD per square meter or, when provided in local currency, converted following the conversion rate at the time of the calculation (fall 2021). In order to reduce discrepancies between country-specific costs and to provide a regionally consistent dataset of replacement costs, we made the following assumptions.
-
Given the wide range of replacement cost values collected for EMCA1, we distinguished between two sub-typologies: the lower range was associated with the URM and the upper range with RM or CM.
-
For the other EMCA typologies, if a range of values was provided, we took as reference the average value.
-
In the case of Turkmenistan, where costs were provided per unit of volume, we converted into cost per unit area assuming a 3 m inter-story height.
-
In the absence of other data, i.e., for adobe and steel typologies, we used the costs estimated by Pittore et al. (2020).
Based on these considerations, we harmonized costs, making sure that the relative cost ratio between less costly constructions (e.g., URM) and more expensive ones (e.g., RC frames or shear walls) were reasonable. In particular, the cost ratio between EMCA2 and EMCA1 (averaged across the two sub-typologies) does not exceed the value of 3, with the exception of Turkmenistan, where the ratio is much lower. The typology for which there are larger discrepancies across countries is EMCA5 (wood), likely because of the different availability and cost of the material. This is very evident in particular for Turkmenistan, where wood buildings are the most expensive.
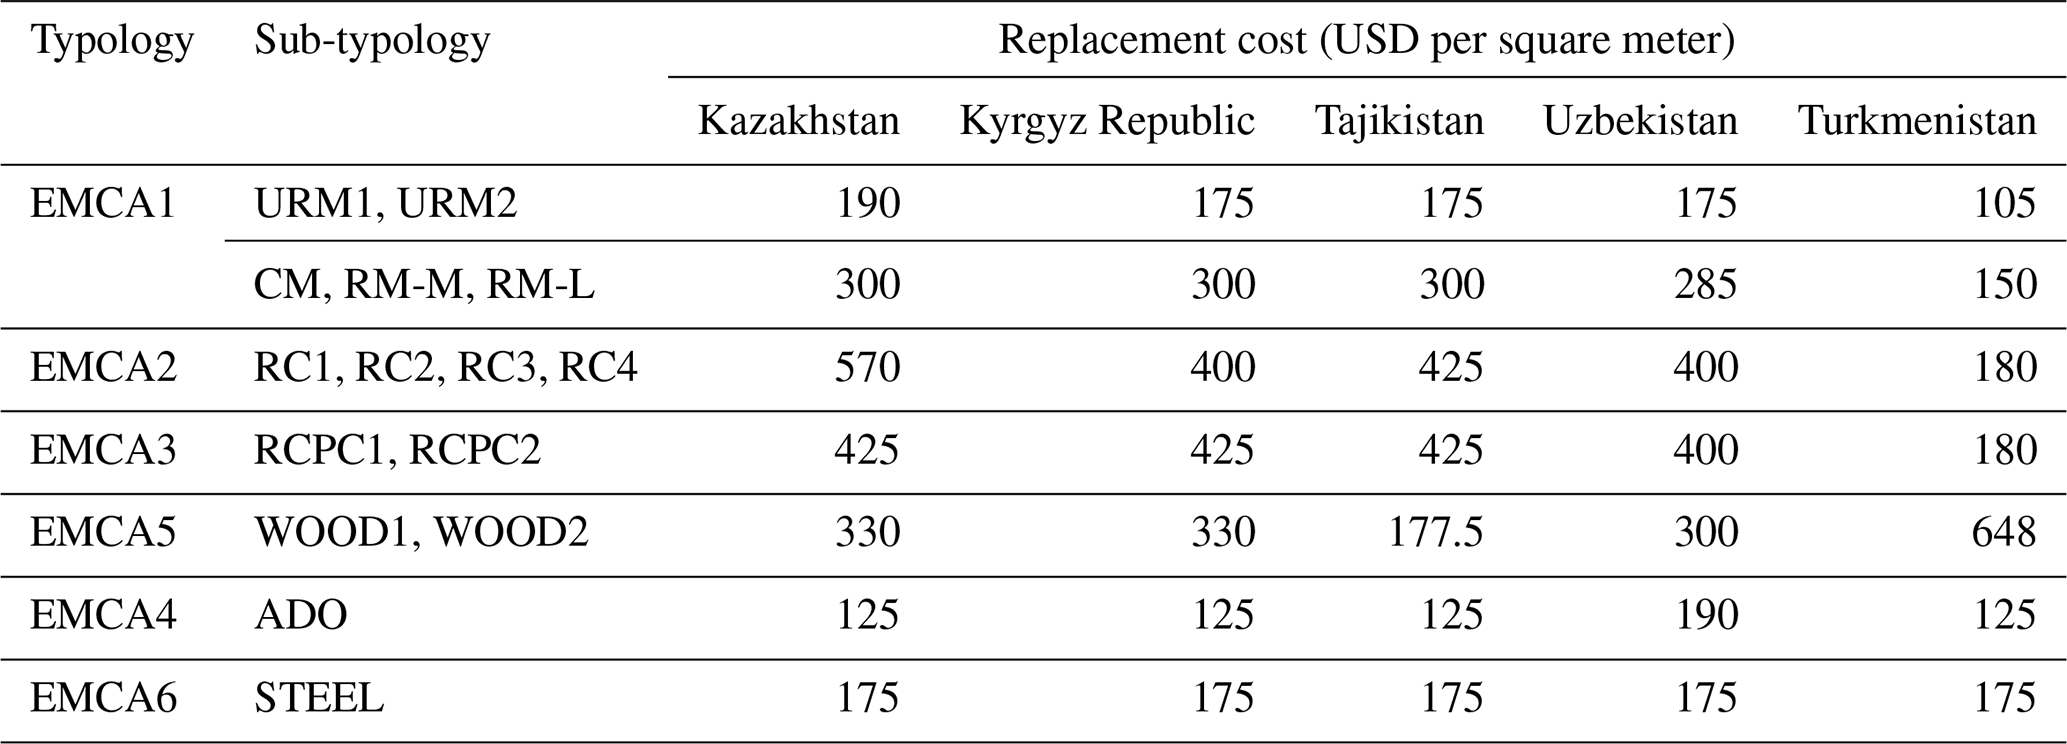
Table 2 shows the residential-building typologies and the country-based costs. For the case of EMCA1, given the strong differences between URM and CM/RM, two sub-typologies were identified. Replacement costs here refer to the structural cost, while the content costs were estimated as 50 % of the building structural cost, following the procedure described in the HAZUS inventory technical manual (FEMA, 2021). Costs for each building unit are then found by multiplying the average reconstruction cost by the average building area for each typology, similarly to Arup (2016).
Table 2Country-based replacement costs expressed in USD per square meter for each building typology and sub-typology in Central Asia.
Residential-building exposure layers were validated for each country based on data provided by local partners for specific cities. Such data were not used in the development of the exposure layer because they only contained the total number of households and not the building types. Differences were lower for the Kyrgyz Republic and Tajikistan (which are the countries where Pittore et al., 2020, deployed most field surveys) and larger in Uzbekistan, for which the country-based building census showed the largest discrepancies with the previously available information. A comparison of the fraction of building types was made for the city of Ashgabat (Turkmenistan), for which the approximate percentage of buildings of each type was available. Of the buildings, 65 % are composed of load-bearing masonry, while 35 % are reinforced concrete (pre-cast or cast in situ). The comparison with the exposure dataset developed here shows a good agreement with differences smaller than 5 % between building fractions.
3.3 Development of exposure layers for 2080
Exposure layers for 2080 were developed based on three SSPs defined for Central Asia (Pedde et al., 2019). The three selected scenarios envisage socio-economic development based, respectively, on three main drivers: sustainability, unequal investments and economic disparities, and exploitation of fossil fuels together with increased energy consumption (SSP1, SSP4 and SSP5, respectively). The choice of the aforementioned SSPs was taken within the working group with the intention to highlight the larger variations expected and to create an upper and lower bound for expected exposure changes with respect to more “middle of the road” scenarios (e.g., SSP2). The choice of SSP1 was also motivated by the willingness to highlight the role of governance and international cooperation, which was promoted by national-scale and international workshops during the onset of the research project (Peresan et al., 2023). The projected exposure layers are developed starting from the population and residential-building exposure layers developed in this work (Sect. 2.1 and 2.2). In particular, SSPs are used to inform changes in population and allocation of residential buildings.
The projected population is estimated by decreasing/increasing the population according to the future population trends expected under each scenario. Expected population trends were extracted from the IIASA SSP database (https://tntcat.iiasa.ac.at/SspDb/dsd?Action=html pagepage=about, last access: 11 March 2024), which provides country-based indicators based on the studies of Dellink et al. (2017), Crespo Cuaresma (2017) and Samir et al. (2017). According to these studies, the population is expected to decrease in the three considered SSPs by up to more than 50 %, with the exception of Tajikistan where, for the SSP4 scenario, population is expected to increase. In order to obtain the projected population layer, the country-based increase or decrease was applied on a cell-by-cell basis to the total population value, keeping the gender and age fractions constant.
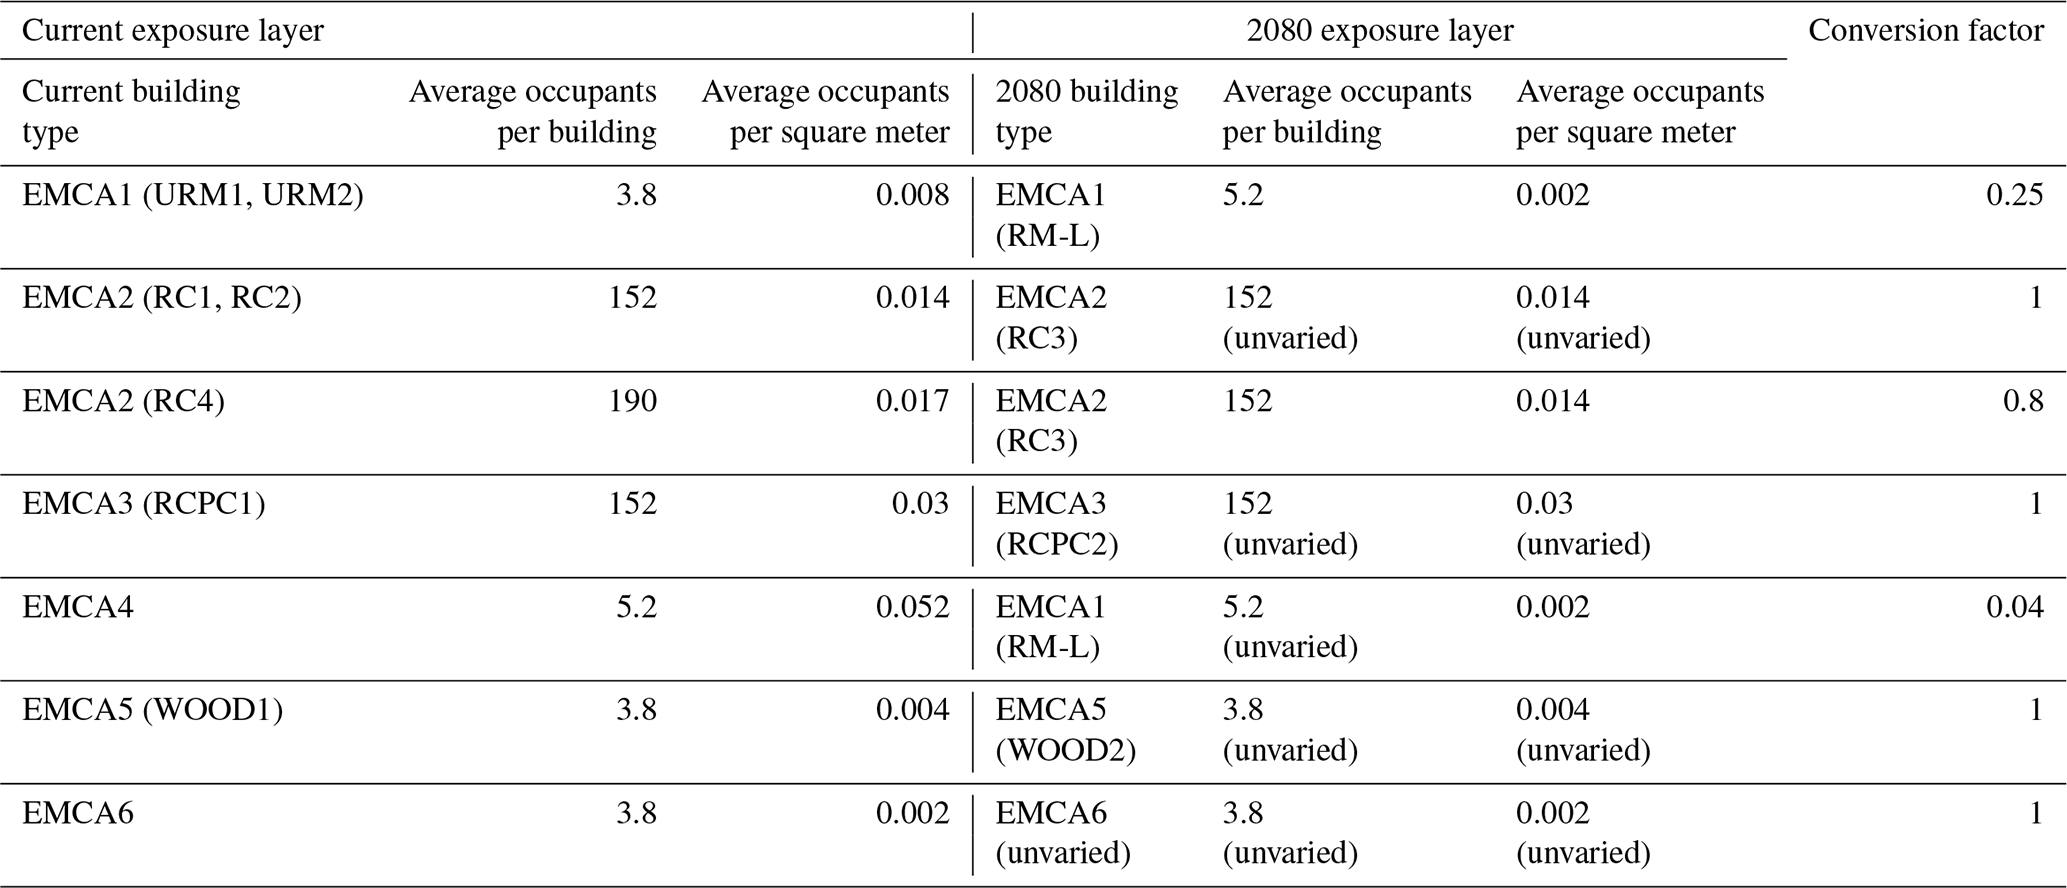
Despite the expected population decrease, Central Asia is expected to undergo progressive urbanization (Chen et al., 2020), associated with a strong GDP increase (see the IIASA SSP database for details). This process had already started in the 2000s with an average city growth rate of 9 % to 11 % (UNESCAP, 2013). Future urbanization is also assumed to be associated with a modification of building typologies, with the progressive substitution of deprecated building types in favor of modern ones. The projected residential-building layer is thus developed by modifying the number and typology of buildings. This process was simulated using simple rules, defined based on expert judgment provided by practitioners during five country-based capacity-building workshops organized in Central Asia (Peresan et al., 2023, this special issue). In particular, unreinforced masonry and adobe buildings will be progressively replaced with modern masonry houses (in particular, low-rise family houses). As for new multi-family apartments, they are expected to be both reinforced concrete frames or wall-type buildings but with a high level of earthquake-resistant design (RC3 and RCPC2, Table 1). Wood buildings are expected to be constructed with modern techniques (WOOD2, Table 1), while steel buildings are assumed to remain unvaried. The conversion between the number of old and new buildings was performed using conversion factors (Table 3), obtained as the ratio between the occupants per square meter in the new and the old building types. The occupants per square meter for each typology are computed based on the average building area (Table 1). Not all types are substituted with modern ones: some are left unvaried (e.g., EMCA6) or converted into a modern typology with a conversion factor of 1 (which means their number is unvaried, e.g., EMCA3, EMCA5). The same replacement rules were adopted in the whole region and for all SSPs. Building replacement costs are kept constant and equal to the ones in the current exposure layer. Estimating the costs in 2080 equivalent to the current ones would be associated with a large uncertainty, given the large variability in inflation rates in the region, and could lead to unrealistic values.
Table 3Conversion factors between the number of old and new EMCA building types and sub-typologies (columns 1 and 4, respectively), characterized by different occupation values, used to develop the 2080 residential-building exposure layers.
The exposed value of residential buildings in Central Asia is therefore expected to vary due to the population variation and the progressive building replacement. The calculation is done for each point of the 500 m regular grid. First, the number of buildings in the current exposure layer is converted into the corresponding buildings to accommodate the 2080 projected population. Then, deprecated typologies are converted into modern ones based on conversion factors. The calculation was performed making sure that the population and residential-building values in the projected database are realistic and, in particular, that no points are associated with negative population.
The modification of the building stock is assumed to happen only in areas which are expected to be urban by 2080, while no changes are applied to the building stock in rural areas. Current urban areas were extracted from the GHSL dataset (JRC, 2021) for the latest available year (2015). The dataset comprises seven classes that were simplified into three main ones: rural, sub-urban (which includes sub-urban and peri-urban areas) and dense urban areas. Urban areas in 2080 were identified based on the urban development trends provided by Chen et al. (2020) under the three different SSPs and using spatial layers of projected urban extension (Gao and O'Neill, 2020; Gao, 2020).
Table 4Urban area in 2015 (derived from the GHSL database) and 2080 (derived from the Chen et al., 2020, database) and percentage difference in each country and under each SSP.
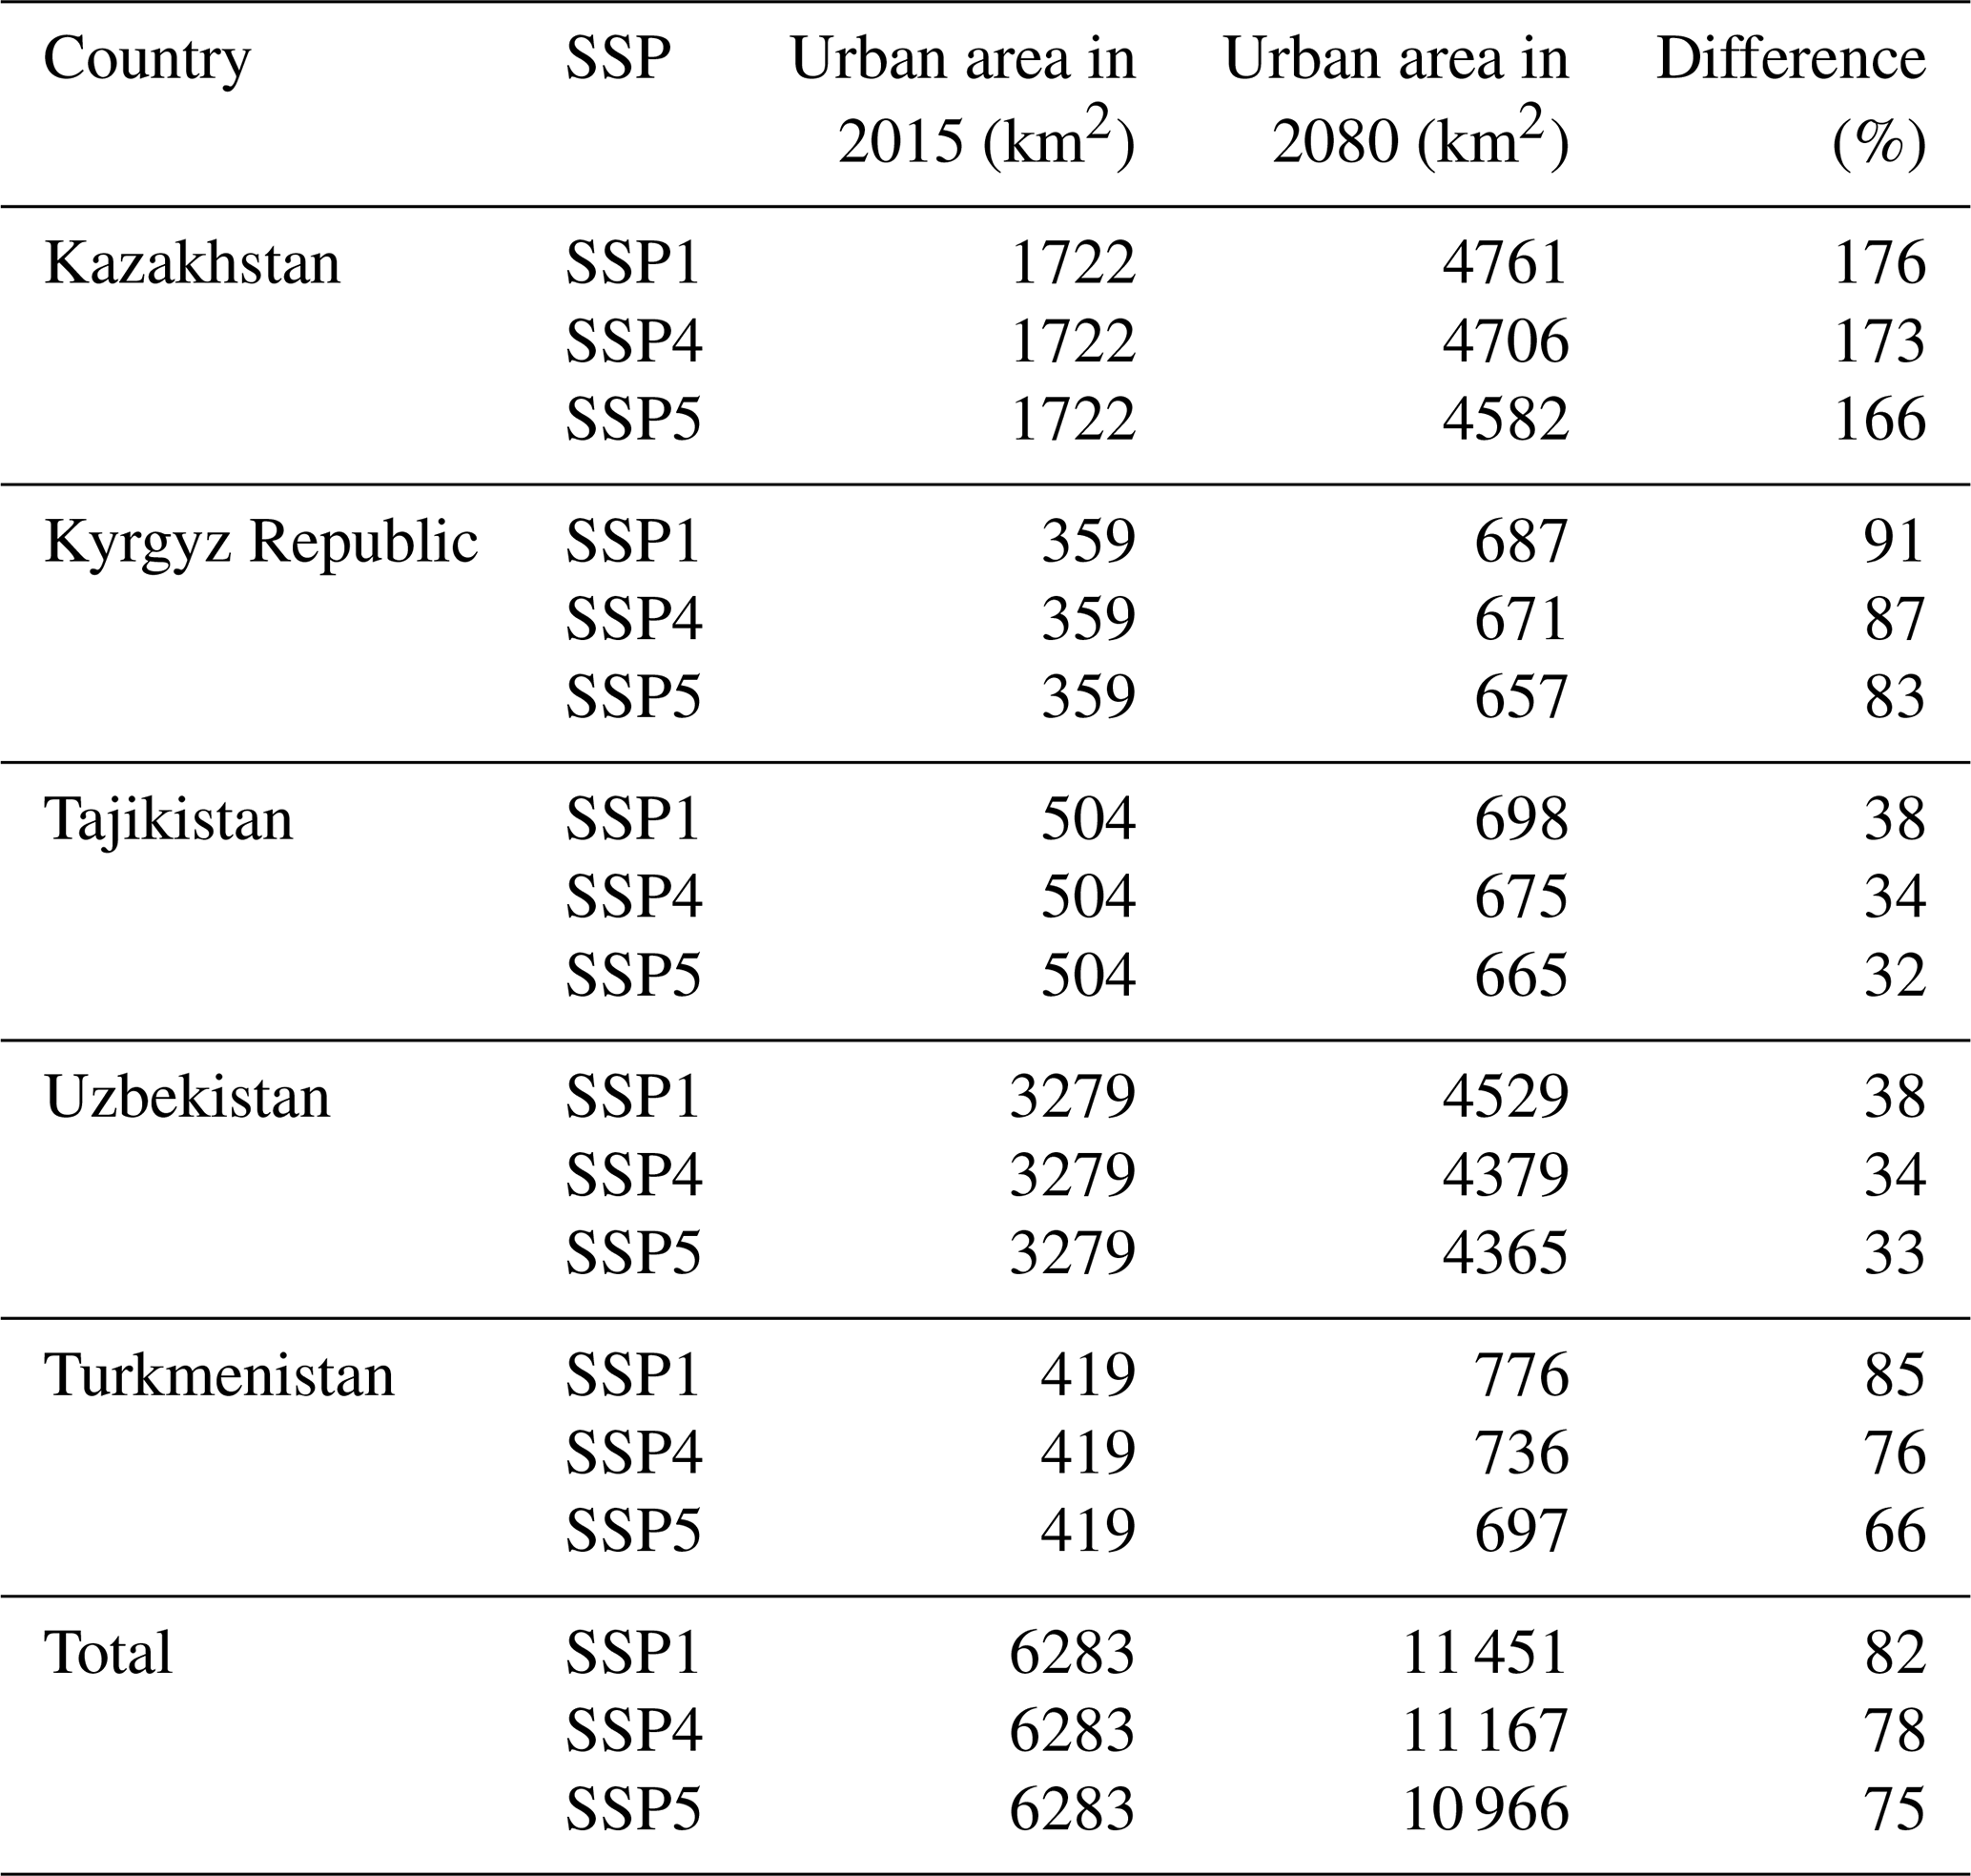
Table 4 shows that a strong urbanization is expected in all Central Asian countries between 2020 and 2080. The largest variations are expected in Kazakhstan, where the urban area is expected to increase by more than 160 % under the three SSPs. Substantial changes are also expected in the Kyrgyz Republic (between 80 % and 90 %) and Turkmenistan (between 65 % and 85 %). Lower percentages are found in Tajikistan and Uzbekistan, ranging between 30 % and 40 %. Comparing sub-urban and urban areas in 2015 with the ones for 2080, we identified areas which, under the three different SSPs, are expected to be urban in 2080. This includes not only areas that were already classified as urban in 2015, but also areas that are expected to become so between 2015 and 2080 and where the building stock will undergo progressive replacement. In urban areas, abandoned or unoccupied structures are assumed to be demolished during the building replacement process. In rural areas the deprecated building types are maintained in the 2080 exposure layer in order to avoid underestimating the risk related to weak typologies which might still be in use, or not demolished, despite their age.
4.1 Population exposure
Figure 2 shows the population layer produced at 100 m resolution at the regional scale for an urbanized area in Aktobe (Kazakhstan). At each point of the grid, the total population and the numbers of men, women, elderly and young people (over 60 and under 5 years old, respectively) are provided. Total values were also computed for each country and oblast.
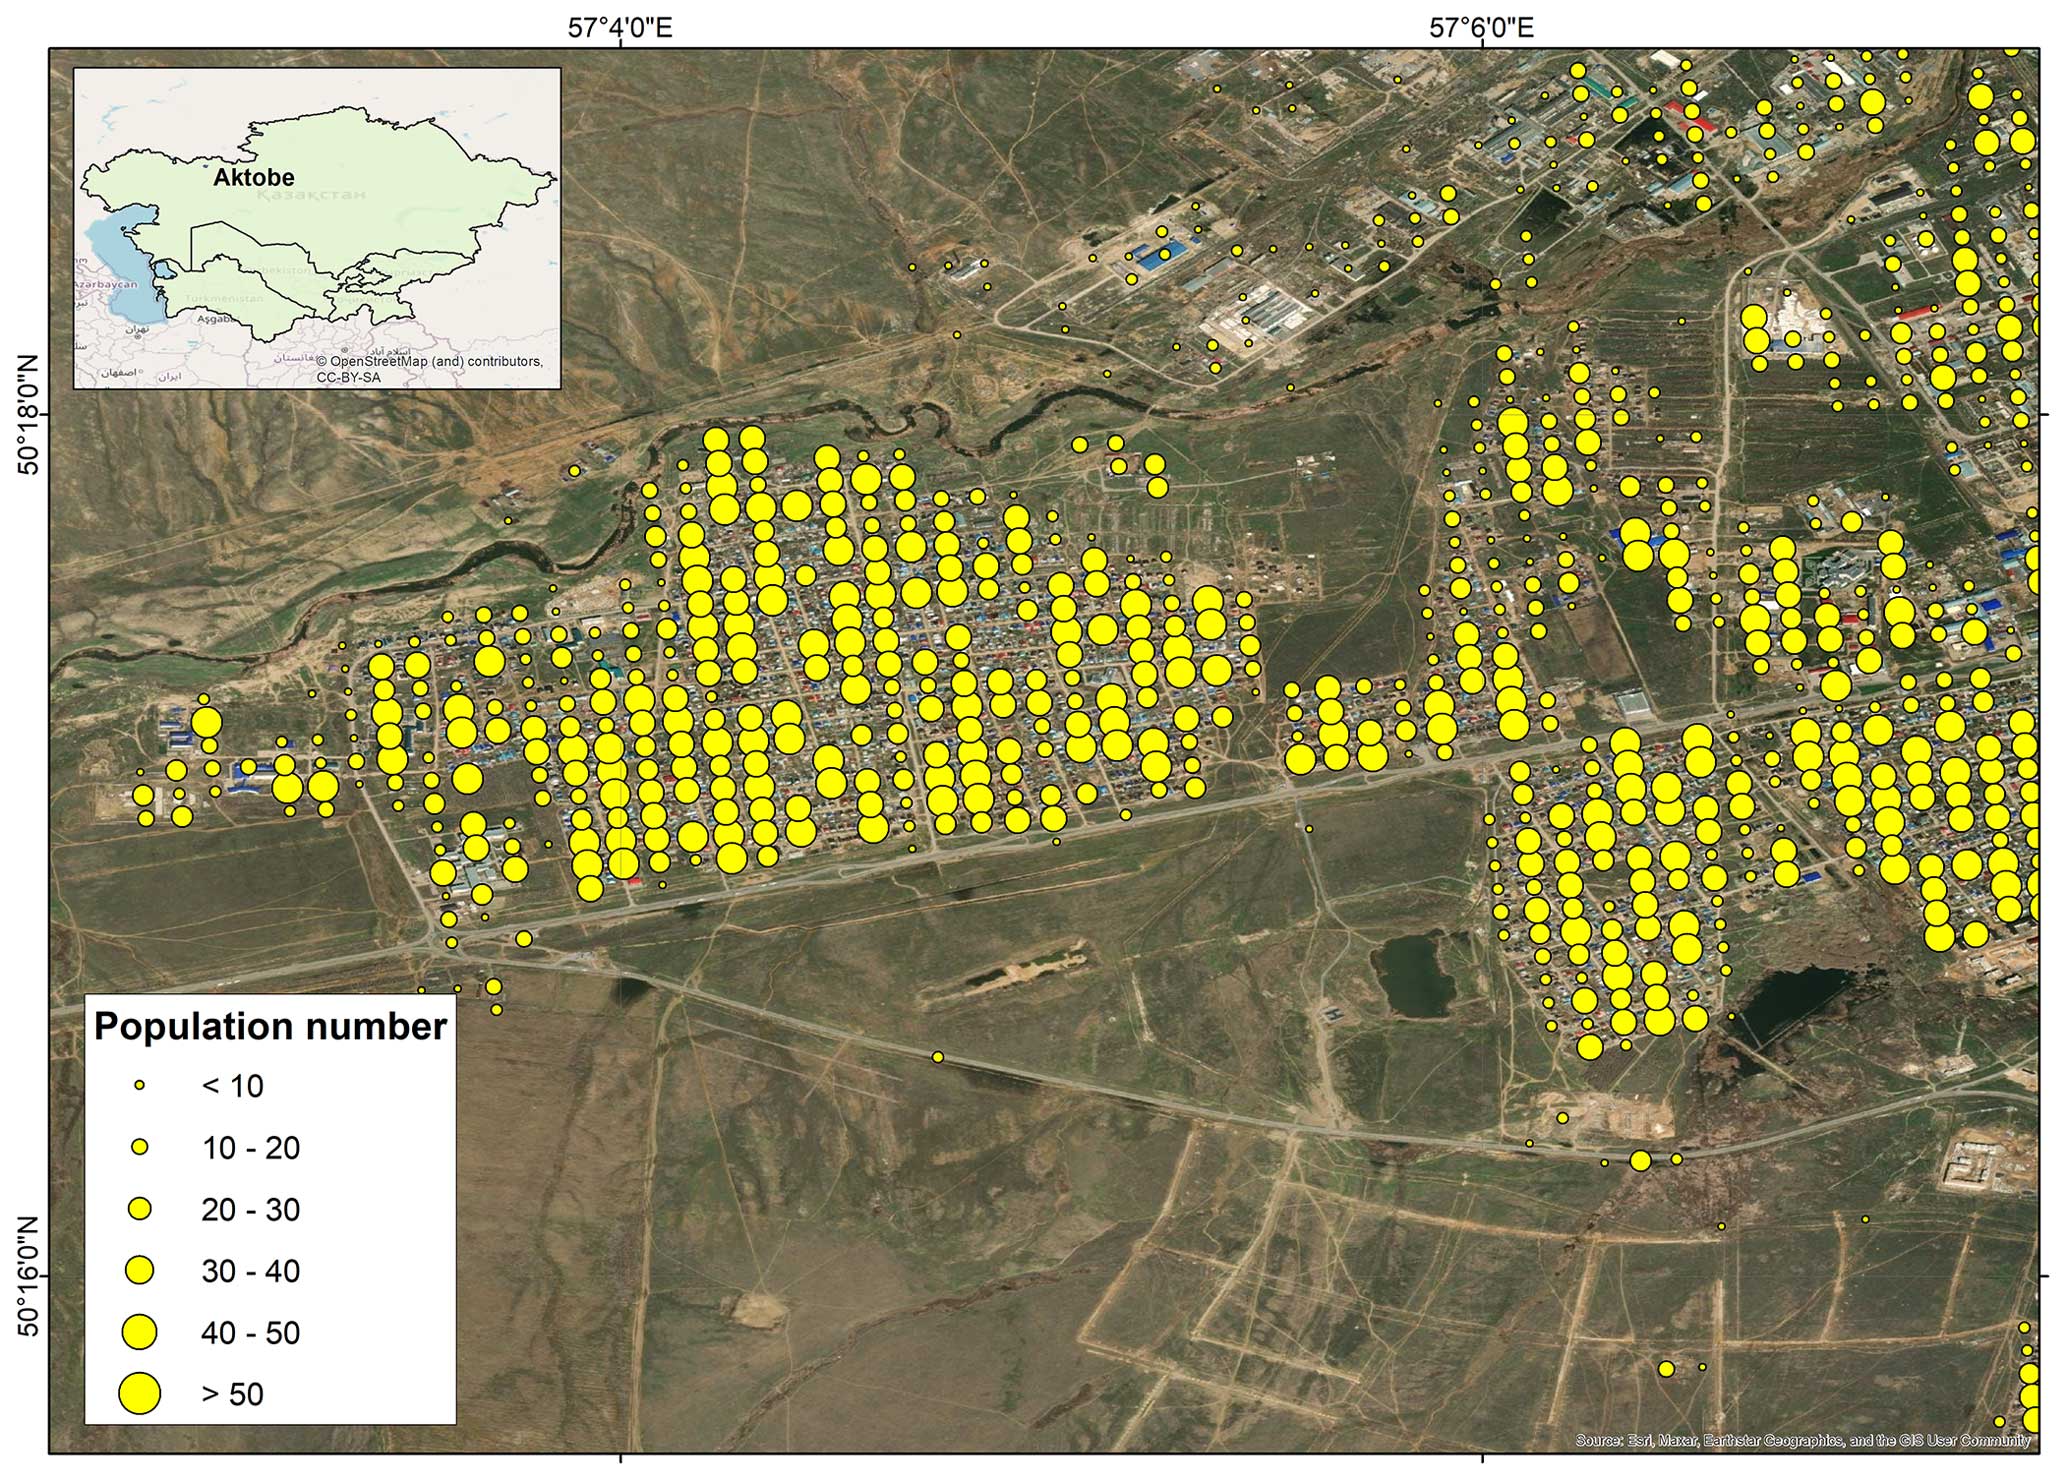
Figure 2Example of the population layer produced at 100 m resolution for a selected area in the town of Aktobe in Kazakhstan. The figure shows an urbanized area with different uses (industrial, at the top of the image; residential, in the center of the image; and rural with low or null population density). Background map data extracted from OpenStreetMap are available from https://www.openstreetmap.org (last access: 16 January 2024) (© OpenStreetMap contributors 2023; distributed under the Open Data Commons Open Database License (ODbL) v1.0.).
4.2 Residential-building exposure
Figure 3 shows the spatial distribution of (panel a) one sub-typology of the EMCA1 typology (Table 1), unreinforced masonry (URM); (panel b) one sub-typology of the EMCA2 typology (Table 1), low-rise reinforced concrete buildings constructed before 2006 (RC1); and (panel c) one sub-typology of the EMCA3 typology (Table 1), precast reinforced concrete buildings constructed before 1980 (RCPC1). The map shows the spatial distribution of buildings in the entire Central Asian region and for one selected study area, at 500 m resolution. Similar maps can be produced for other building typologies.
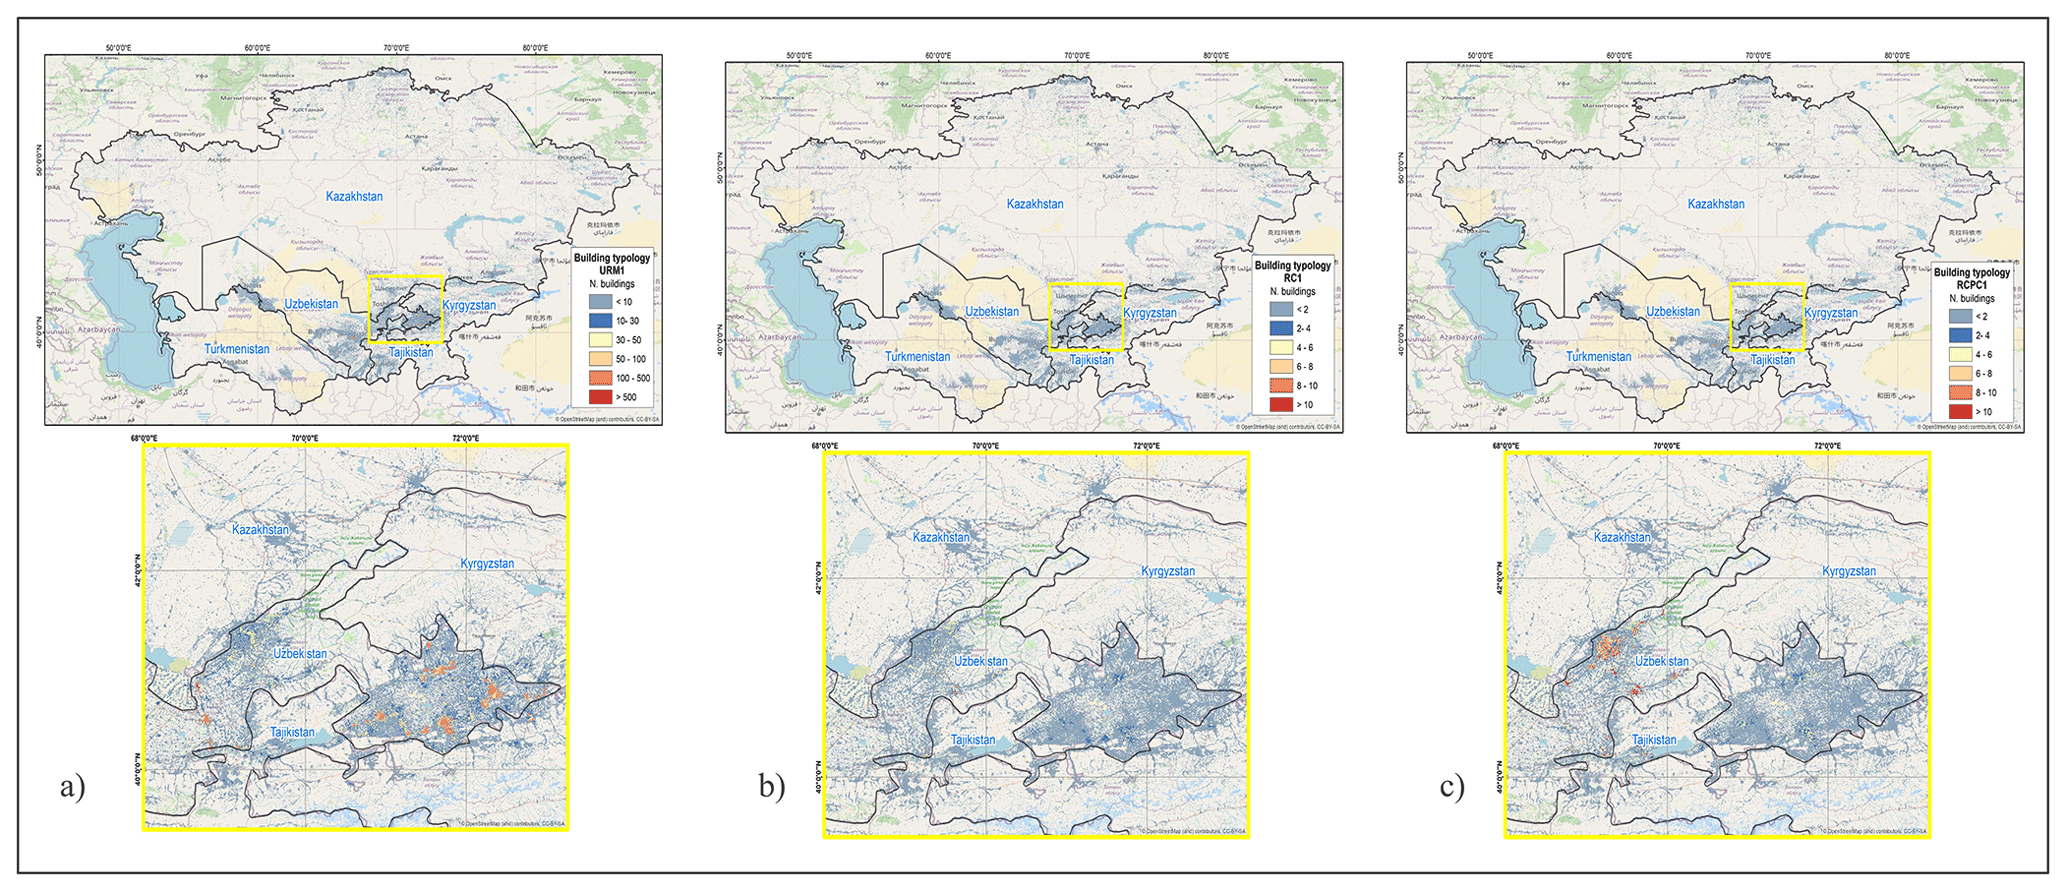
Figure 3Number of buildings in each 500 m cell belonging to (a) the URM1 sub-typology of EMCA1, (b) the RC1 sub-typology of EMCA2 and (c) the RCPC1 sub-typology of EMCA3. Each map is displayed for the entire Central Asian region (top) and for a selected area (bottom). Map data from OpenStreetMap available from https://www.openstreetmap.org (last access: 16 January 2024) (© OpenStreetMap contributors 2023; distributed under the Open Data Commons Open Database License (ODbL) v1.0.).
Table 5 provides the total number of exposed buildings per typology and country and their associated structural cost expressed in billion USD. The total structural cost of residential buildings in Central Asia is approximately USD 1200 billion, and the higher fraction is associated with Uzbekistan and Kazakhstan (62 % and 29 %, respectively).
Table 5Total number of residential buildings in each EMCA typology and the total structural cost for each country and for Central Asia (in billion USD).
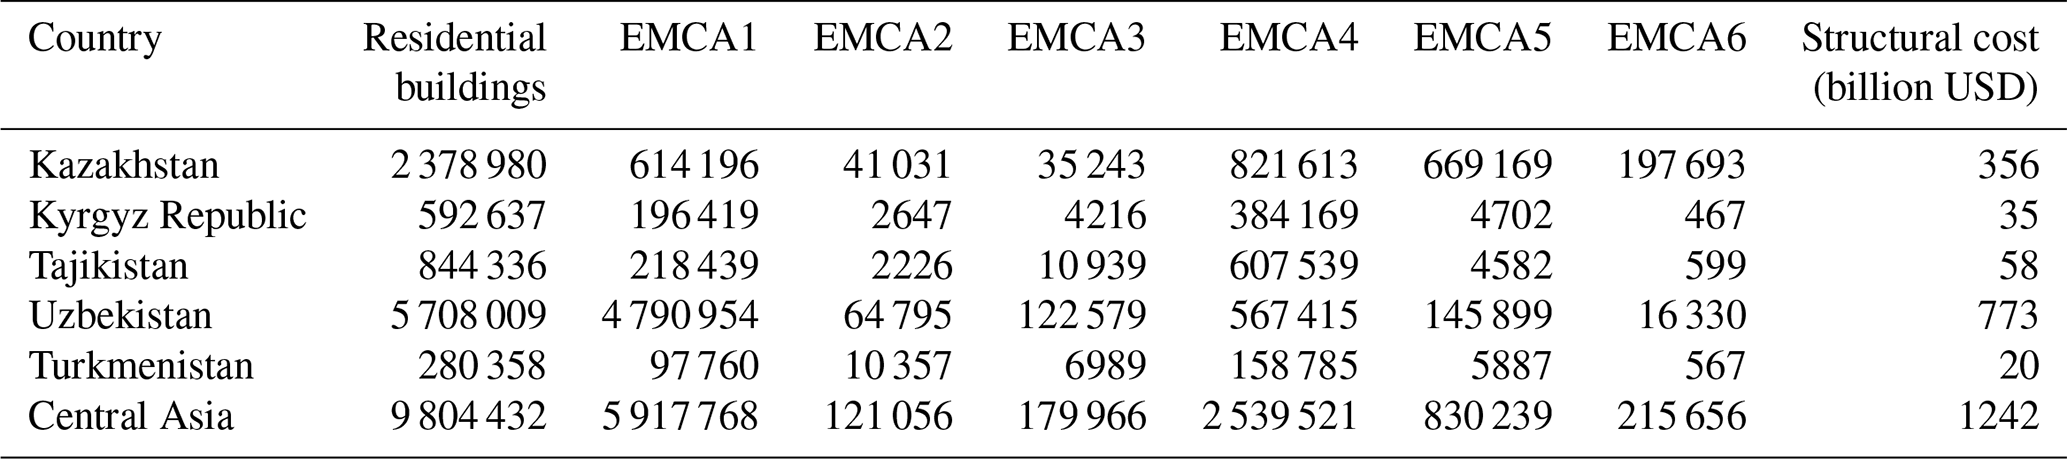
Figure 4 shows the structural replacement cost fraction of building typologies in the five countries considered. The greatest contribution to the total costs comes from EMCA1 (masonry) followed by EMCA3 (precast reinforced concrete) in all countries.
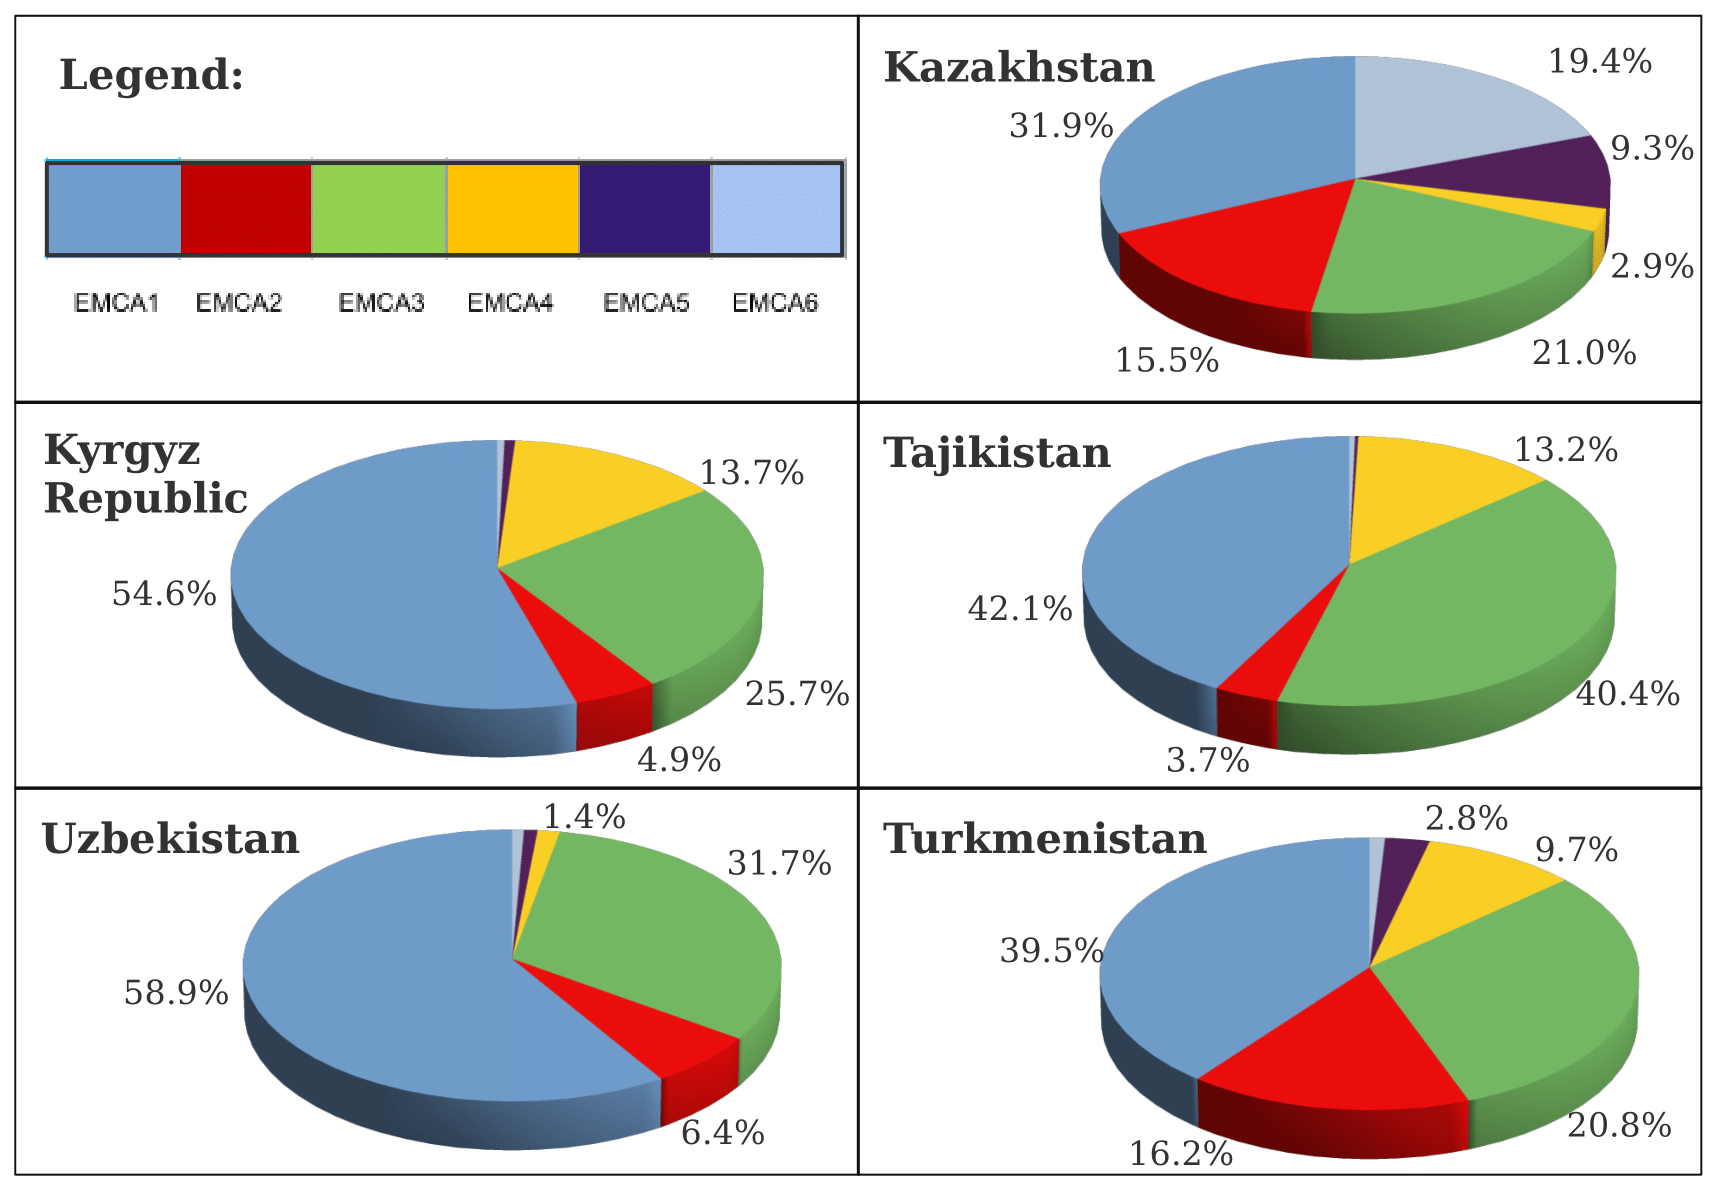
Figure 4Fraction of replacement costs (expressed in percentage of the total replacement costs) associated with each building typology (EMCA1 to EMCA6) in the five Central Asian countries.
4.3 Exposure layers for 2080
Table 6 provides the total projected buildings number and the associated replacement costs for 2080 and the percent variation (total and per capita) with respect to the layer developed for the present time (2021). Figure 5a shows the percentage cost variation with respect to the current total replacement costs for each scenario considered. Costs are expected to decrease for Kazakhstan and Uzbekistan and increase in the Kyrgyz Republic and Turkmenistan. The Kyrgyz Republic and Tajikistan show both increase and decrease, depending on the considered scenario. The average replacement cost per capita in each country is nonetheless expected to increase for most countries and scenarios due to the population decrease and the adoption of building types associated with a higher replacement cost. The higher residential-building replacement cost per capita is expected in Tajikistan under the SSP5 scenario (which is associated with stronger population decrease). Note that the overall number of buildings is expected to decrease under all scenarios due to the fact that unoccupied buildings are not maintained in urban areas, where they are replaced with other building typologies.
The replacement cost associated with some typologies, in particular EMCA1 and EMCA2, is expected to increase (Fig. 5b). This is due to the progressive replacement of buildings belonging to deprecated typologies with more recent ones. In particular, URM buildings are replaced with RM, which has higher costs per square meter. Similarly, EMCA2 buildings of type RC4 are replaced with RC3 with a conversion factor of 0.8, for which there is a larger number of buildings and subsequently a higher total replacement cost. The expected increase is larger in the Kyrgyz Republic and Tajikistan. The only typology associated with a negative cost variation is EMCA4 because parts of the buildings are replaced with EMCA1 typology. EMCA types 5 and 6 are not included as they are not expected to undergo changes.
Table 6Total residential buildings and expected percentage variation (columns 3 and 4, respectively) and total replacement costs estimated for 2080 and expected replacement cost percent variation between 2080 and current exposure layer, total and per capita (column 5, 6 and 7, respectively). Values are shown for the three SSPs considered.
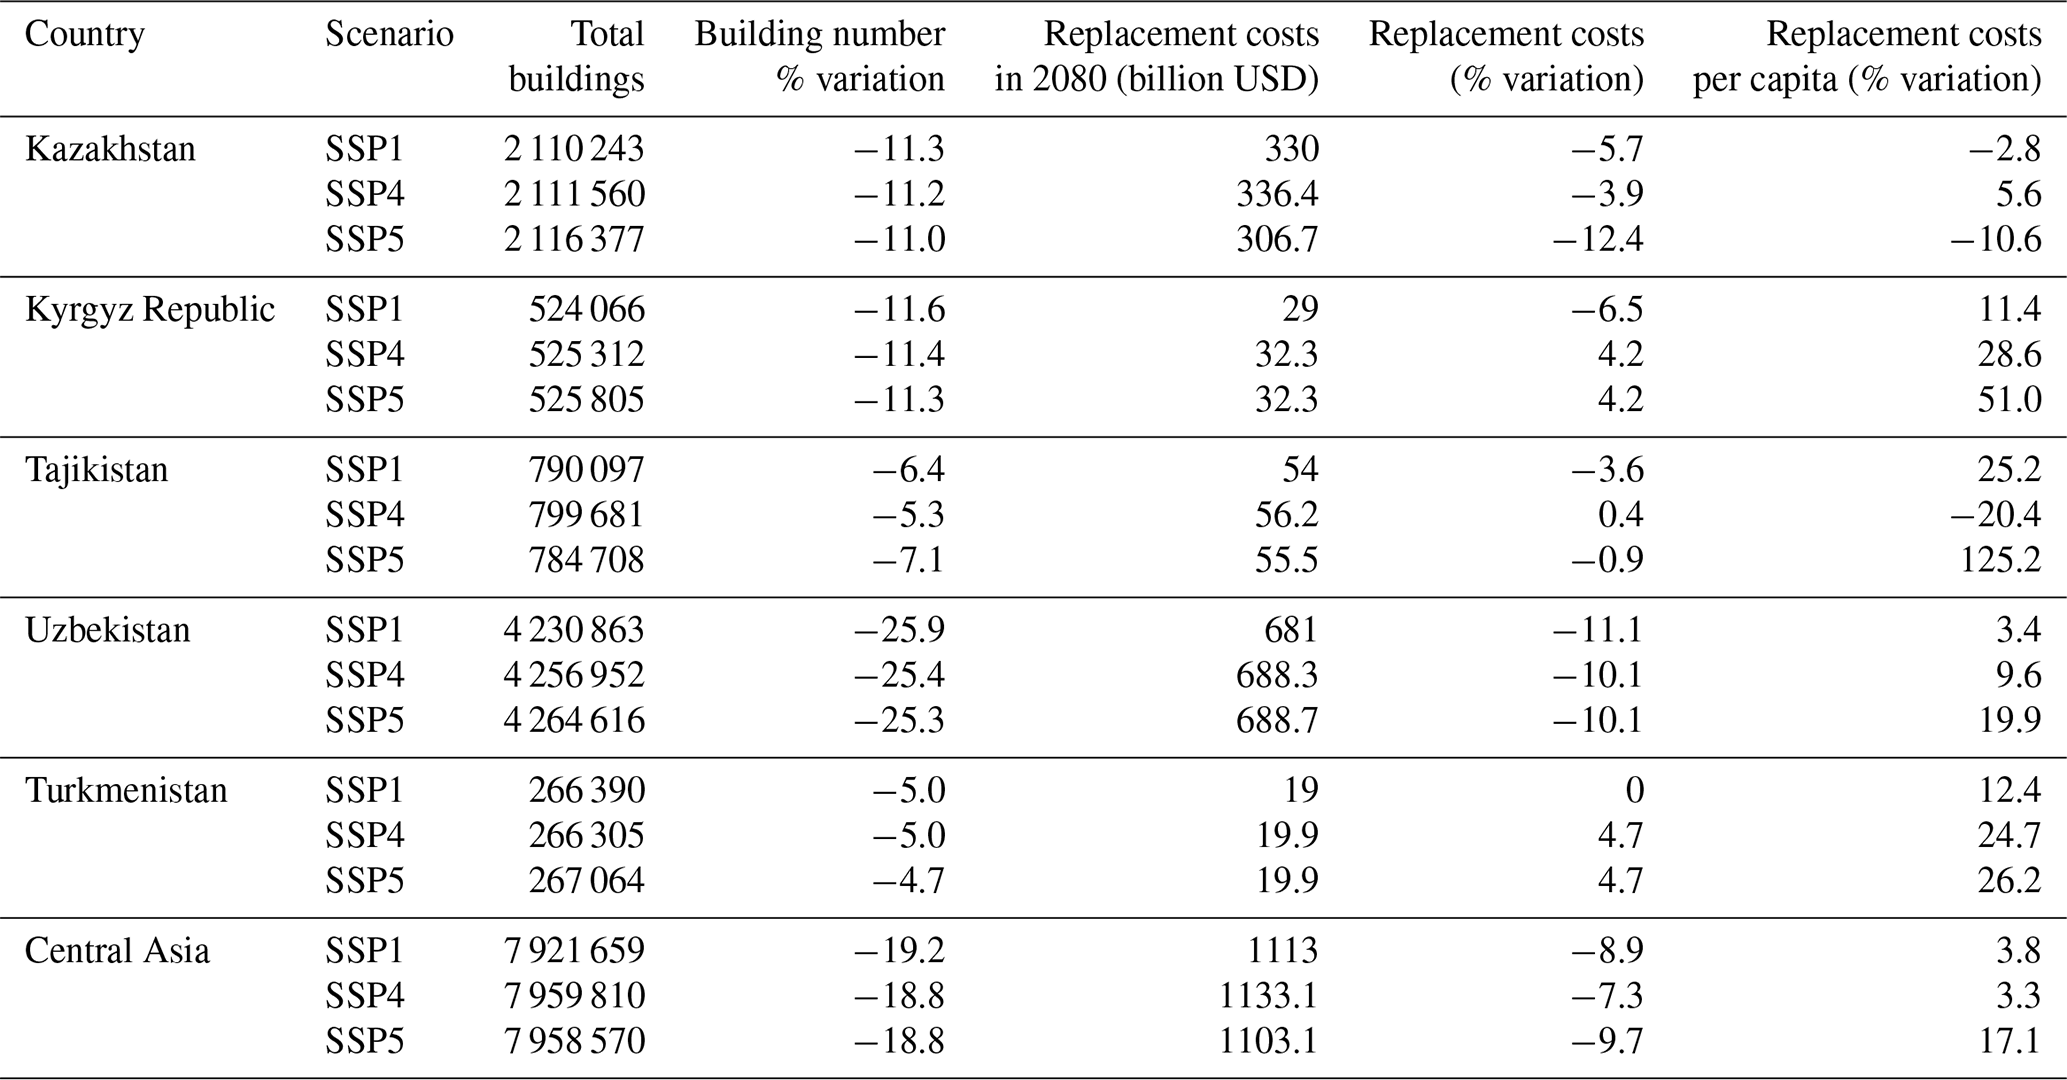
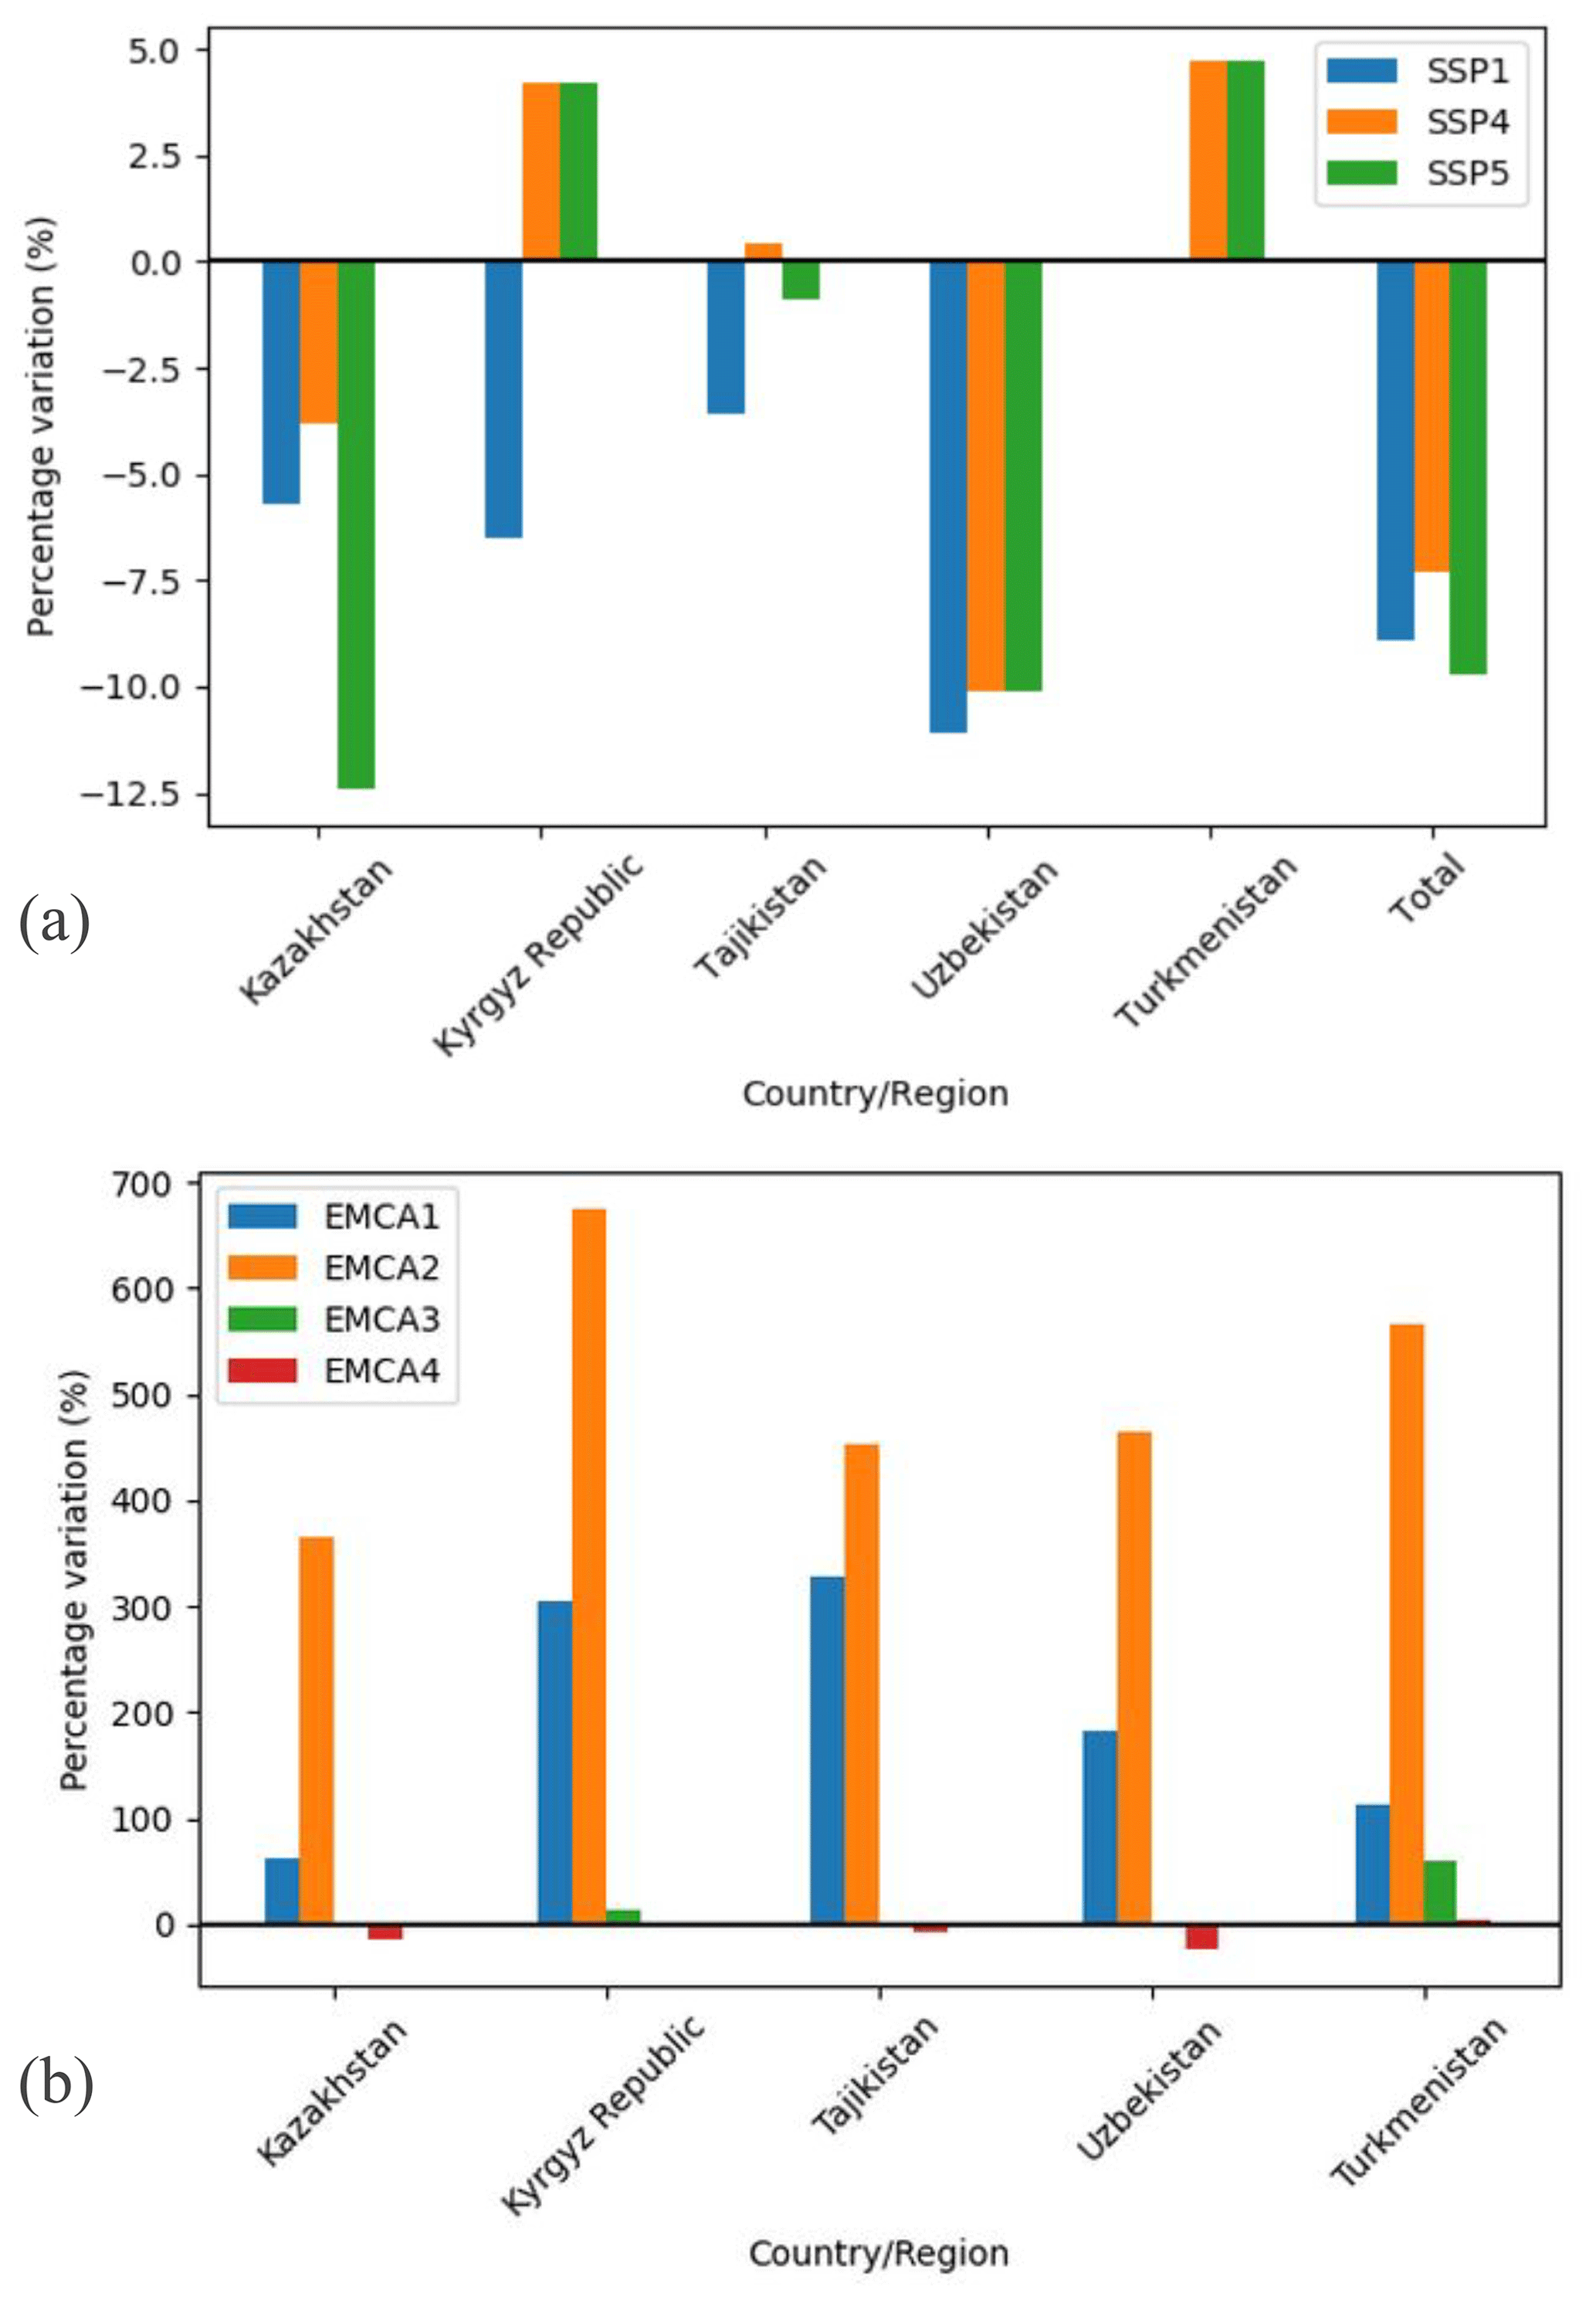
Figure 5Building replacement cost variation (expressed in percentage variation with respect to the replacement cost in the current exposure layer) estimated (a) for the total replacement costs in each considered scenario (SSP1, SSP4 and SSP5) and (b) for the total replacement cost of each EMCA typology averaged across the three SSPs.
The regionally consistent exposure database presented here is based on a combination of global and regional layers and data collected at national and sub-national scale. Performing a regionally consistent exposure development requires the harmonization of the exposed assets characteristics, which might vary within the study area. There are nonetheless several challenges associated with the definition of a regionally consistent exposure database, in particular related to the scattered and inhomogeneous information available (e.g., different time coverage or spatial resolution for the five countries in the region). In particular, the spatial disaggregation process, if based on datasets from different years, can introduce inconsistencies which can be identified by consistency checks among the variables which have a known relation (e.g., building occupancy and population). In this work we tried to achieve an optimum balance between the different data availability and reliability in order to grasp the differences and peculiarities of the five countries. Population layers were developed at 100 m resolution, while residential buildings were aggregated at 500 m resolution. Both layers can be resampled for the purpose of more specific analyses, but this should be done carefully and include integrating specific information which might become available in the future. Final data, together with metadata and description, are provided in the GED4ALL format (Global Exposure Database for Multi-Hazard Risk Analysis; Silva et al., 2022) developed by the Global Facility for Disaster Reduction and Recovery (GFDRR) in order to support risk analyses.
With regards to population and building data, further efforts should be devoted to identify procedures to automatically collect and update census data, reducing the effort of in-the-field surveying. In addition, our analysis does not account for many aspects, such as night–day occupation patterns and socio-economic exposure, which can be included in future in the analysis (e.g., Freire and Aubrecht, 2012). Note that this information is already envisaged in the GED4ALL taxonomy but is scarcely available for many areas at risk worldwide.
As for residential buildings, common but broad typologies were defined, also based on previous projects, so that they are valid across the entire region. Such typologies are associated with sub-typologies that can be analyzed further in the future. In addition, emerging building typologies should be included (e.g., new type of construction based on lightweight insulated panels). The fraction of building typologies within the building stock was extracted from national censuses, when available. However, some census only provided the number of households and it was required to convert these into buildings, assuming an equivalent number of households per building type. In addition, building typologies are defined by different classes in country-based censuses (e.g., some distinguish between material of walls and of the load-bearing structure, while others do not). The process of combining different censuses can nonetheless lead to discrepancies. Finally, sub-typologies can be quite different in the Central Asian countries due to multiple factors, including different constructive traditions, climatic zones and other cultural aspects, that should be taken into account in future work. For this reason, a common protocol of data collection could be extremely beneficial both for single countries and for regional-scale approaches.
Despite the overall generalization required to develop a regional-scale exposure database, relevant differences were maintained using country-based building replacement costs. A comparison with costs provided by Arup (2016) for the Kyrgyz Republic shows that costs of EMCA1, EMCA2 and EMCA3 are quite similar but replacement costs of other typologies such as timber and steel have varied, which is probably due to the variations in the raw-material price. This is the first attempt to collect construction costs for each of the five countries of Central Asia, but any financial assessment should be carried out based on detailed and updated information. The difficulty of gathering unit costs (e.g., material costs, labor costs) and costs associated with the reconstruction process (e.g., debris removal) was also subject of discussion during the workshops organized with local stakeholders (Peresan et al., 2023). Future work in the region can benefit from a similar process, with specific workshops involving academics, practitioners and other stakeholders to assess replacement and reconstruction costs. As for content costs, they were estimated following the HAZUS methodology (FEMA, 2021) as a function of the structural cost of each building typology. HAZUS is widely adopted and, in the absence of regionally specific or country-specific data on content costs, was assumed to be applicable to Central Asia.
In this work, we provided a projection for 2080 based on the combination of three SSPs defined for Central Asia (Pedde et al., 2019). The choice of the SSPs was taken by the working group and subjected to both subjective and practical considerations (e.g., the number of risk scenarios to be performed based on that) but should be integrated in the future with other SSPs. The development of such projections is based on a number of assumptions, the main ones being that the population decrease is assumed to happen homogeneously in each country, that the renovation of building stock follows the same rules in all urban areas of Central Asia and that replacement costs do not vary, as well as that deprecated buildings remain in the building stock only in rural areas, while they are replaced in urban areas, which partially justifies why the overall number of buildings is decreasing, However, this might lead to an overall underestimation of exposure and subsequent risk because abandoned buildings can suffer damage and cause direct and indirect losses to society (e.g., by collapsing and blocking a road). This results in a simple projection that does not account for the complex dynamics behind socio-economic development. In fact, our procedure regarding the choice of SSPs only influences few indicators related to exposure (e.g., population and number of buildings). The uncertainties related to the projection of economic indicators to 2080 should be taken into account when using such projections for assessing risk. These projections are in fact intrinsically associated with a large uncertainty widely discussed in the academic literature (e.g., Dellink et al., 2017). Also, according to Dellink et al. (2017), despite GDP being expected to grow overall at the global scale, the GDP growth rates and income growth rates are expected to decrease sometime between 2030 and 2040 for all SSPs. Thus, the GDP growth values do not necessarily provide a realistic economic growth indicator for the region. In addition, different SSPs would favor different economic systems (e.g., based on fossils fuels rather than on sustainable technologies), which in their turn would influence the type and number of buildings and their location. The proposed projections should therefore be improved in the future by including national and regional strategies and development plans and by updating exposure layers accordingly. More sophisticated analyses should also account for the different economic system envisaged in each SSP and the socio-economic consequences of its adoption, as well as potentially assess the deeper implications of different SSPs for exposure assessment. Finally, the SSPs presented here rely on indicators such as population change, the urbanization rate and GDP, which are not independent. Future work should explore the interplay between the population change and the urbanization process and how this affects exposure and risk indicators. The projections might also be complemented by urban simulation modeling for selected cities or oblasts.
The regional-scale dataset of population and residential buildings provided here can support further analyses on the expected damage and risks caused by hazardous phenomena such as earthquakes and floods. However, the building typologies included in this exposure model were originally defined for earthquakes and do not account for all the characteristics deemed relevant for flood vulnerability. The use of this exposure model for the assessment of flood-induced risks should therefore be done carefully, especially when using it at a sub-national scale. A classical multi-hazard approach (i.e., using different vulnerability functions for each building class in the exposure model, such as in Coccia et al., 2023) could be complemented with other approaches that account for cumulative damage such as that caused by earthquakes and tsunami (Gomez Zapata et al., 2021). Residential buildings are very relevant for disaster risk reduction as they host a large fraction of the population, in particular during the nighttime, and are responsible for a large fraction of life losses during earthquakes. Also from the financial point of view, a comparison between the exposed value of residential buildings with respect to other types (commercial, industrial, healthcare and educational) shows that residential buildings account for the largest fraction (between 47 % and 76 %) of replacement costs of all building types. The 2080 layers presented here offer a starting point for the definition of risk mitigation strategies. For example, they can help in identifying the typologies that are more prone to generate losses and/or to generate financial risk. Under these considerations, they might be replaced in the future with less vulnerable residential-building typologies, as envisaged by many experts and practitioners in the region during exposure development workshops (Peresan et al., 2023).
The work presented here relies on assumptions that are needed in order to produce results at the regional scale. In particular, country-based data are paramount in order to enhance the regional-scale datasets with the specific characteristics of exposed assets. In addition to official data sources, expert opinion was collected on a number of aspects for which data were not available or were incomplete. For example, experts provided information on census building typologies and their correspondence with EMCA typologies and on their construction costs. They also gave information about which building typologies are being gradually replaced in the building stock, supporting the development of future exposure layers. This was made possible by the organization of five country-based exposure workshops (Peresan et al., 2023) which enhanced interactions with local experts, practitioners and representatives of governments. Interactions with local experts are indispensable in order to identify, gather and interpret correctly the different data sources that aid in the development of reliable exposure layers.
This work produces the first high-resolution regionally consistent exposure database of population and residential buildings exposed to floods, earthquakes and landslides in Central Asia. The dataset comprises exposure layers for 2020 and 2080, developed under different SSPs. Results of the exposure assessment show that the residential buildings in Central Asia are distributed heterogeneously, with large differences between urban and rural areas. We also assessed the value of exposed buildings in Central Asia, of which a large fraction are located in the larger and more populated countries of Uzbekistan and Kazakhstan, in terms of replacement costs. The 2080 exposure projections show that, despite a general population decrease, strong urbanization and economic growth are expected in Central Asia, with a subsequent increase in the replacement cost per capita. The regional-scale exposure database produced during this project can act as a starting point for current and future disaster risk mitigation activities devoted to reducing physical, socio-economic and financial impacts of natural hazards in Central Asia.
The exposure datasets for each of the five Central Asian countries developed as part of the Strengthening Financial Resilience and Accelerating Risk Reduction in Central Asia program (https://www.gfdrr.org/en/program/SFRARR-Central-Asia, GFDRR, 2024) are available at the World Bank data portal under the Creative Commons Attribution 4.0 license.
The population dataset is available at https://datacatalog.worldbank.org/search/dataset/0064250/Central-Asia-exposure-dataset---Population (The World Bank, 2023a) and is titled “Central Asia exposure layers – Population” followed by the country abbreviation (KAZ for Kazakhstan, KGZ for the Kyrgyz Republic, TJK for Tajikistan, TKM for Turkmenistan, UZB for Uzbekistan).
The residential-building dataset is available at https://datacatalog.worldbank.org/search/dataset/0064251/Central-Asia-exposure-dataset---Residential-buildings (The World Bank, 2023b) and is titled “Central Asia exposure layers – Residential Buildings” followed by the country abbreviation (KAZ for Kazakhstan, KGZ for the Kyrgyz Republic, TJK for Tajikistan, TKM for Turkmenistan, UZB for Uzbekistan).
The projected residential exposure dataset is available at https://datacatalog.worldbank.org/search/dataset/0064254/Central-Asia-exposure-dataset---Projected-residential-exposure (The World Bank, 2023c) and is titled “Central Asia projected (2080) residential exposure – All countries, oblast level” followed by the country abbreviation of the considered Shared Socioeconomic Pathway (SSP1, SSP4 and SSP5).
CS, AT and EF developed the exposure assessment methodology, and CS and AT carried out the analyses. All co-authors contributed to the data collection and to the discussion of results. CS prepared the manuscript with contributions from all co-authors.
The contact author has declared that none of the authors has any competing interests.
Publisher’s note: Copernicus Publications remains neutral with regard to jurisdictional claims made in the text, published maps, institutional affiliations, or any other geographical representation in this paper. While Copernicus Publications makes every effort to include appropriate place names, the final responsibility lies with the authors.
This article is part of the special issue “Regionally consistent risk assessment for earthquakes and floods and selective landslide scenario analysis in Central Asia”. It is not associated with a conference.
The project was developed within the project Strengthening Financial Resilience and Accelerating Risk Reduction in Central Asia (SFRARR), funded by the European Union, managed by the Global Facility for Disaster Reduction and Recovery (GFDRR), and implemented by the World Bank. We sincerely thank all the project team members, in particular Sergey Tyagunov, Paola Ceresa, Antonella Peresan, Gabriele Coccia, Denis Sandron and Stefano Parolai, and the World Bank specialists, in particular Stuart Alexander Fraser and Madina Nizamitdin, for their constructive contributions to the project. We are grateful for the suggestions and feedback from the editor and the two reviewers, which substantially improved the manuscript.
This research has been supported by the World Bank Group (consulting services contract no. 8006611 – Regionally consistent risk assessment for earthquakes and floods and selective landslide scenario analysis for strengthening financial resilience and accelerating risk reduction in Central Asia).
This paper was edited by Valerio Poggi and reviewed by Massimiliano Pittore and one anonymous referee.
ARUP: Measuring Seismic Risk in Kyrgyz Republic – Seismic Risk Reduction Strategy, Ove Arup & Partners International Ltd, 13 Fitzroy Street, London, W1T 4BQ, United Kingdom, Public report, https://documents1.worldbank.org/curated/en/689251517034023 101/pdf/Measuring-seismic-risk-in-Kyrgyz-Republic-seismic-risk-reduction-strategy.pdf (last access: 11 March 2024), 2016.
CACDRMI (Central Asia and Caucasus Disaster Risk Management Initiative): Risk Assessment for Central Asia and Caucasus Desk Study Review (CAC DRMI): Risk Assessment for Central Asia and Caucasus Desk Study Review, desk study review, https://www.undrr.org/publication/central-asia-and-caucasus-disaster-risk-management-initiative-cac-drmi (last access: 11 March 2024), 2009.
Chen, G., Li, X., Liu, X. Chen, Y., Liang, X., Leng, J., Xu, X., Liao, W., Qiu, Y., Wu, Q., and Huan, K.: Global projections of future urban land expansion under shared socioeconomic pathways, Nat. Commun., 11, 537, https://doi.org/10.1038/s41467-020-14386-x, 2020.
Coccia, G., Ceresa, P., Bussi, G., Denaro, S., Bazzurro, P., Martina, M., Fagà, E., Avelar, C., Ordaz, M., Huerta, B., Garay, O., Raimbekova, Z., Abdrakhmatov, K., Mirzokhonova, S., Ismailov, V., and Belikov, V.: Large-scale flood risk assessment in data scarce areas: an application to Central Asia, Nat. Hazards Earth Syst. Sci. Discuss. [preprint], https://doi.org/10.5194/nhess-2023-157, in review, 2023.
Crespo Cuaresma, J.: Income projections for climate change research: A framework based on human capital dynamics, Global Environ. Chang., 42, 226–236, https://doi.org/10.1016/j.gloenvcha.2015.02.012, 2017.
Dellink, R., Chateau, J., Lanzi, E., and Magné, B.: Long-term economic growth projections in the Shared Socioeconomic Pathways, Global Environ. Chang., 42, 200–214, https://doi.org/10.1016/j.gloenvcha.2015.06.004, 2017.
Facebook Connectivity Lab and Center for International Earth Science Information Network – CIESIN – Columbia University: Kazakhstan: High Resolution Population Density Maps + Demographic Estimates, Humanitarian Data Exchange (HDX) repository [data set], https://data.humdata.org/dataset/kazakhstan-high-resolution-population-density-maps-demographic-estimates (last access: 7 December 2023), 2023a.
Facebook Connectivity Lab and Center for International Earth Science Information Network – CIESIN – Columbia University: Kyrgyzstan: High Resolution Population Density Maps + Demographic Estimates, Humanitarian Data Exchange (HDX) repository [data set], https://data.humdata.org/dataset/kyrgyzstan-high-resolution-population-density-maps-demographic-estimates (last access: 7 December 2023), 2023b.
Facebook Connectivity Lab and Center for International Earth Science Information Network – CIESIN – Columbia University: Tajikistan: High Resolution Population Density Maps + Demographic Estimates, Humanitarian Data Exchange (HDX) repository [data set], https://data.humdata.org/dataset/tajikistan-high-resolutionpopulation-density-maps-demographic-estimates (last access: 7 December 2023), 2023c.
Facebook Connectivity Lab and Center for International Earth Science Information Network – CIESIN – Columbia University: Turkmenistan: High Resolution Population Density Maps + Demographic Estimates, Humanitarian Data Exchange (HDX) repository [data set], https://data.humdata.org/dataset/turkmenistan-high-resolutionpopulation-density-maps-demographic-estimates (last access: 7 December 2023), 2023d.
Facebook Connectivity Lab and Center for International Earth Science Information Network – CIESIN – Columbia University: Uzebekistan: High Resolution Population Density Maps + Demographic Estimates, Humanitarian Data Exchange (HDX) repository [data set], https://data.humdata.org/dataset/uzbekistan-high-resolution-population-density-maps-demographic-estimates (last access: 7 December 2023), 2023e.
FEMA (United States Federal Emergency Management Agency): HAZUS inventory technical manual, https://www.fema.gov/sites/default/files/documents/fema_hazus-inventory-technical-manual-4.2.3.pdf (last access: 20 October 2021), 2021.
Freire, S. and Aubrecht, C.: Integrating population dynamics into mapping human exposure to seismic hazard, Nat. Hazards Earth Syst. Sci., 12, 3533–3543, https://doi.org/10.5194/nhess-12-3533-2012, 2012.
Gao, J.: Global 1/8-Degree Urban Land Fraction Grids, SSP-Consistent Projections and Base Year, v1 (2000–2100), Harvard Dataverse [dataset], https://doi.org/10.7910/DVN/ZHMI1L, 2020.
Gao, J. and O'Neill, B. C.: Mapping global urban land for the 21st century with data-driven simulations and Shared Socioeconomic Pathways, Nat. Commun., 11, 2302, https://doi.org/10.1038/s41467-020-15788-7, 2020.
GFDRR: Strengthening Financial Resilience and Accelerating Risk Reduction in Central Asia, GFDRR, https://www.gfdrr.org/en/program/SFRARR-Central-Asia, 2024.
Gomez-Zapata, J. C., Brinckmann, N., Harig, S., Zafrir, R., Pittore, M., Cotton, F., and Babeyko, A.: Variable-resolution building exposure modelling for earthquake and tsunami scenario-based risk assessment: an application case in Lima, Peru, Nat. Hazards Earth Syst. Sci., 21, 3599–3628, https://doi.org/10.5194/nhess-21-3599-2021, 2021.
JRC: Joint Research Centre – European Commission, and Center for International Earth Science Information Network – CIESIN – Columbia University, Global Human Settlement Layer, Population and Built-Up Estimates, and Degree of Urbanization Settlement Model Grid, https://sedac.ciesin.columbia.edu/data/set/ghsl-population-built-up-estimates-degree-urban-smod, (last access: 11 March 2024), 2021.
Palisades, New York: NASA Socioeconomic Data and Applications Center (SEDAC), https://doi.org/10.7927/h4154f0w, last access: 1 September 2021.
Libert, B. and Trombitcaia, I.: Advancing Dam Safety in Central Asia: The Contribution of the UNECE Water Convention, in: The UNECE Convention on the Protection and Use of Transboundary Watercourses and International Lakes, Its Contribution to International Water Cooperation, International Water Law Series, Brill Nijhoff, Vol. 4, 394–407, https://doi.org/10.1163/9789004291584_028, ISBN 9789004291584, 2015
O'Neill, B. C., Kriegler, E., Riahi, K., Ebi, K. L., Hallegatte, S., Carter, T. R., Mathur, R., and van Vuuren, D. P: A new scenario framework for climate change research: the concept of shared socioeconomic pathways, Clim. Change, 122, 387–400, https://doi.org/10.1007/s10584-013-0905-2, 2014.
OpenStreetMap contributors: Planet dump retrieved from https://planet.openstreetmap.org (last access: 1 December 2022). Data licensed under the Open Data Commons Open Database License (ODbL) by the OpenStreetMap Foundation (OSMF), 2023.
Pedde, S., Kok, K., Hölscher, K., Oberlack, C., Harrison, P. A., and Leemans, R.: Archetyping shared socioeconomic pathways across scales: an application to central Asia and European case studies, Ecol. Soc., 24, 30, 10.5751/ES-11241-240430, 2019.
Peresan, A., Scaini, C., Tyagunov, S., and Ceresa, P.: Capacity Building Experience for Disaster Risk Reduction in Central Asia, Nat. Hazards Earth Syst. Sci. Discuss. [preprint], https://doi.org/10.5194/nhess-2023-156, in review, 2023.
Pittore, M., Wieland, M., and Fleming, K.: Perspectives on global dynamic exposure modelling for geo-risk assessment, Nat. Hazards, 86, 7–30, https://doi.org/10.1007/s11069-016-2437-3, 2017 (data available at: https://github.com/GFZ-Centre-for-Early-Warning/EMCA-Exposure).
Pittore, M., Haas, M., and Silva, V.: Variable resolution probabilistic modeling of residential exposure and vulnerability for risk applications', Earthq. Spectra, 36, 321–344, https://doi.org/10.1177/8755293020951582, 2020.
Samir, K. C. and Lutz, W.: The human core of the shared socioeconomic pathways: Population scenarios by age, sex and level of education for all countries to 2100, Global Environ. Chang., 42, 181–192, https://doi.org/10.1016/j.gloenvcha.2014.06.004, 2017.
Saponaro, A., Pilz, M., Wieland, M., Bindi, D., Moldobekov, B., and Parolai, S.: Landslide susceptibility analysis in data-scarce regions: the case of Kyrgyzstan, B. Eng. Geol. Environ., 74, 1117–1136, https://doi.org/10.1007/s10064-014-0709-2, 2014.
Seitz, W.: Where They Live: District-Level Measures of Poverty, Average Consumption, and the Middle Class in Central Asia, Policy Research Working Papers, The World Bank, https://doi.org/10.1596/1813-9450-8940, 2019.
Silva, V., Brzev, S., Scawthorn, C.. Yepes, C., Dabbeek, J., and Crowley, H.: A Building Classification System for Multi-hazard Risk Assessment, Int. J. Disast. Risk Sc., 13, 161–177, https://doi.org/10.1007/s13753-022-00400-x, 2022.
Strom, A. and Abdrakhmatov, K.: Large-Scale Rockslide Inventories: From the Kokomeren River Basin to the Entire Central Asia Region WCoE 2014–2017, IPL-106-2, in: Workshop on World Landslide Forum. Springer, Cham, 339–346, https://doi.org/10.1007/978-3-319-59469-9_28, 2017.
The World Bank: Central Asia exposure dataset – Population, The World Bank [data set], https://datacatalog.worldbank.org/search/dataset/0064250/Central-Asia-exposure-dataset---Population, 2023a.
The World Bank: Central Asia exposure dataset – Residential buildings, The World Bank [data set], https://datacatalog.worldbank.org/search/dataset/0064251/Central-Asia-exposure-dataset---Residential-buildings, 2023b.
The World Bank: Central Asia exposure dataset – Projected residential exposure, The World Bank [data set], https://datacatalog.worldbank.org/search/dataset/0064254/Central-Asia-exposure-dataset---Projected-residential-exposure, 2023c.
UNECE (United Nations Economic Commission for Europe): Strengthening Water ManageMent and tranSboundary Water Cooperation in Central aSia: the role of unEcE Environmental conventions, Printed at United Nations, Geneva, ECE/MP.WAT/35, https://unece.org/DAM/env/water/publications/documents/Water_Management_En.pdf (last access: 11 March 2024), 2011.
UNESCAP – United Nations Economic and Social Commission for Asia and the Pacific: Urbanization in Central Asia: challenges, issues and prospects, https://hdl.handle.net/20.500.12870/3879 (last access: 11 March 2024), 2013.
Wieland, M., Pittore, M., Parolai, S., Zschau, J., Moldobekov, B., and Begaliev, U.: Estimating building inventory for rapid seismic vulnerability assessment: Towards an integrated approach based on multi-source imaging, Soil Dyn. Earthq. Eng., 36, 70–83, 2012.
Wieland, M., Pittore, M., Parolai, S., Begaliev, U., Yasunov, P., Niyazov, J., Tyagunov, S., Moldobekov, B., Saidiy, S., Ilyasov, I., and Abakanov, T.: Towards a cross-border exposure model for the Earthquake Model Central Asia, Ann. Geophys., 58, 1, https://doi.org/10.4401/ag-6663, 2015.
Yepes-Estrada, C., Calderon, A., Costa, C., Crowley, H., Dabbeek, J., Hoyos, M. C., Martins, L., Paul, N., Rao, A., and Silva, V.: Global building exposure model for earthquake risk assessment, Earthq. Spectra, 39, 2212–2235, https://doi.org/10.1177/87552930231194048, 2023.
Yuyu, Z. L., Xuecao, J. E., Sha, Y., and Ghassem, A.: Global urban area projection under five SSPs, figshare [data set], https://doi.org/10.6084/m9.figshare.7817624.v1, 2019.