the Creative Commons Attribution 4.0 License.
the Creative Commons Attribution 4.0 License.
 | 07 Mar 2024
Study on seismic risk assessment model of water supply systems in mainland China
Tianyang Yu
Banghua Lu
Hui Jiang
Zhi Liu
Using the peak ground acceleration (PGA) under four exceedance probabilities calculated via a probabilistic seismic hazard analysis method for China, the probability density function of PGA was obtained by fitting with the Cornell seismic hazard exceedance probability PGA function model. Combined with the seismic fragility function of the water supply system calculated on the basis of the empirical matrix of actual earthquake damage and the exposure of fixed assets, the expected seismic loss and expected loss rate models of the water supply system were established, and the classification standard with the expected seismic loss rate of the water supply system as the index was proposed. The seismic fragility of the water supply system was classified, and the exposure of the water supply system was analyzed. The total fixed assets in the Statistical Yearbook of Urban Water Supply, henceforth called Water Supply Yearbook, were taken as the exposure to earthquake in the region. The accuracy of the fragility model in this paper was verified through the actual earthquake damage losses in Deyang. Taking the water supply system of 720 cities in mainland China as an example, the distribution maps of expected seismic loss and expected loss rate were calculated and drawn. The expected loss rate model was verified by the key earthquake prevention areas in mainland China. The assessment model based on the expected loss and expected loss rate was taken as the seismic risk assessment model of water supply systems in mainland China.
- Article
(8343 KB) - Full-text XML
- BibTeX
- EndNote


Today, with the advancements in modern society and the steady development of infrastructure systems, the increasing number of earthquake disasters around the world poses a huge threat to urban water supply systems. An estimated 40 % of the main cities in China are located near major earthquake zones, with 17 % facing high risk; overall, 55 % of cities may suffer serious disasters (Gao, 2020). The urban water supply system, as an important component of civil engineering, and the emergency rescue system in lifeline engineering are called “lifelines”. Therefore, to ensure the normal operation of lifelines after an earthquake, governments should increase investment in and management of these lifelines (Nigg, 1998). Once the water supply system is damaged by an earthquake, not only can it not meet the normal water supply for residents, but also it cannot provide water for emergency rescue departments and for the prevention of the spread of fires. At the same time, the inability of enterprises to use production water can also lead to indirect economic losses. In 1994, the 6.6 magnitude Northridge earthquake in the United States caused widespread rupture of over 1400 Los Angeles water supply pipelines, of which 100 were located on the main water supply network (Han, 2002). In 1995, the 7.3 magnitude Kobe earthquake in Japan caused damage to 1610 of the main water supply systems in the earthquake area, resulting in water supply interruptions for 80 % of users in nine cities, damaging 90 % of water supply facilities in the Kobe area of Osaka and causing leaks in 120 000 underground water supply pipelines. At the same time, the interruption of the water supply also seriously hindered firefighting work (He, 2009). The power failure of the Fukushima nuclear power plant caused by the 11 March 2011 earthquake in Japan led to the failure of the water supply system, which caused a nuclear reactor meltdown. The 1976 Tangshan earthquake resulted in the paralysis of the city's water supply system, with a pipeline damage rate of 4 per kilometer. A total of 332 main networks in Tanggu District were damaged, and after half a month of emergency repair, only 50 % of the water supply capacity was restored (Han, 2002). The water supply system of Mianzhu suffered devastating damage in the 2008 Wenchuan earthquake of 8.0 magnitude (Institute of Engineering Mechanics and CEA, 2009). Research has shown that the indirect economic losses caused by water supply interruptions are often dozens of times greater than the direct economic losses caused by earthquake damage in the water supply system (Brozovic et al., 2007). Therefore, it is a matter of importance and urgency to build a seismic risk assessment model for regional and urban water supply systems in order to provide a decision-making basis for both government and business sectors.
In the 1984 UNESCO research plan (Jiang et al., 2022), Varnes proposed a definition of natural disasters and risks, which has been widely recognized by experts in the field of natural disaster research, both domestically and internationally. The basic model of earthquake (disaster) risk assessment also conforms to this definition. At present, scholars at home and abroad have different definitions of the concept of earthquake disaster risk. The commonly used term of “earthquake disaster risk” refers to (i) the possibility of damage and loss to buildings (structures) or lifeline projects in specific areas within a certain time limit in the future, as well as (ii) the possibility of loss of life and/or property and losses for the national economy, etc., which can be expressed as
Considering the impact of the site conditions, the above equation can be further expressed as
where R is the risk of earthquake (disaster), referring to the potential losses caused by future earthquakes; H is the seismic hazard, which refers to the probability of future earthquakes occurring within a certain region and within a specific period of time; E is the value of the disaster-bearing body or social wealth, which refers to the exposure level of the disaster-bearing body (including buildings, lifeline engineering, population, property, etc.) threatened by earthquakes in a given area; V is the vulnerability of the disaster-bearing body under earthquake action, or the loss rate of the disaster-bearing body under different earthquake intensities, which can be represented by a number between 0 and 1 (0 represents no loss; 1 represents complete loss); and S is the site impact coefficient.
The risk assessment research in this paper was based on three elements of earthquake disaster risk – seismic hazard, vulnerability of disaster-bearing body, and asset exposure – to establish a risk assessment model based on the expected loss rate of the water supply system. Based on this approach, we carry out data collection, organization, modeling and other work. The flowchart of seismic risk assessment for water supply systems is shown in Fig. 1.
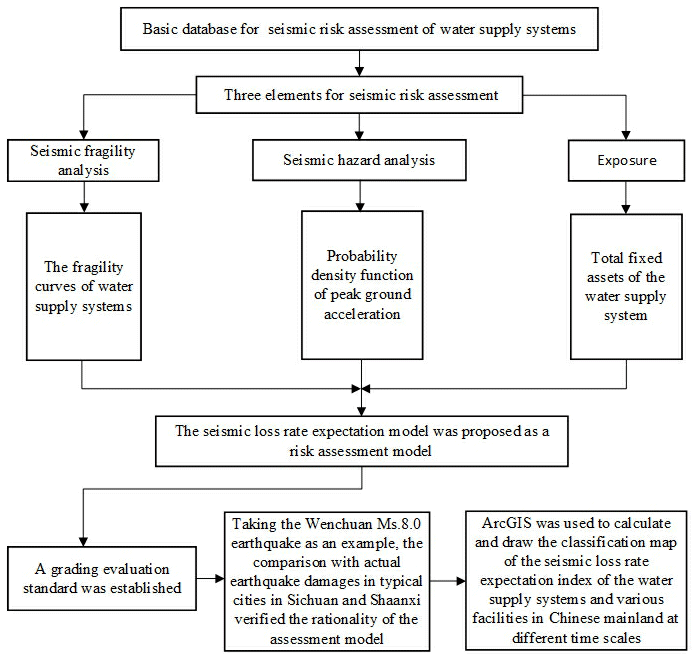
The risk assessment data involved in this study include regional basic data of the water supply system, including five categories. The first category is the material of the water supply pipeline network extracted from the Water Supply Yearbook (China Urban Water Supply and Drainage Association, 2009–2018). The second category is the urban basic fortification intensity extracted from the “Seismic Code” (GB50011-2010 Code for seismic design of buildings, 2010). The third category is the urban population, the GDP and other data extracted from the national census (National Bureau of Statistics of China, 2011), which have been processed to provide an urban classification. The fourth category is site classification. The fifth category is seismic hazard data extracted from the “Fifth-Generation Zonation Map” (GB18306-2015 Seismic ground motion parameter zonation map of China, 2015). These basic data cover 720 cities in 31 provinces and autonomous regions excluding Taiwan, Hong Kong SAR and Macau SAR.
(1) Water supply systems
This paper is mainly based on the pipeline material data from the 2018 Water Supply Yearbook and collects data on the length of five pipeline materials, namely, ductile cast iron pipe, steel pipe, cast iron pipe, prestressed reinforced concrete pipe and plastic pipe. At present, data from a total of 720 cities have been compiled. Although the data cover 31 provinces and cities in mainland China, there are differences in data coverage for each province. The western region does not have as complete data as the eastern region, e.g., Qinhai and Tibet, which only have data for one city each.
(2) Fortification intensity data
This paper extracts the seismic fortification intensities of 720 cities that have been organized in the “Seismic Code”.
(3) City category data (population and GDP)
We extracted urban category data based on the urban population and GDP data from the Sixth National Population Census released by the national statistics department. The city categories of 720 cities were determined through data processing methods.
(4) Site category data
In the national site classification database established using the back propagation (BP) neural network site classification method (Allen and Wald, 2007; Shi, 2009; Yu and Ma, 2020), 720 site categories representing the water supply system of cities were extracted.
(5) Seismic hazard data
According to the potential source area division scheme, the seismicity parameter scheme and the ground motion parameter attenuation relationship that were determined, the peak acceleration aEI under four different exceedance probability levels of basic ground motion, frequent ground motion, rare ground motion and extremely rare ground motion in the I1 site category of grid-averaged distribution sites nationwide was given using the probabilistic seismic hazard analysis method and the basic database of the Fifth-Generation Zonation Map. The grid density is 0.1°×0.1°. This paper extracted seismic hazard data for government residences in 720 cities from the database. Taking the city of Heyuan as an example, raw data on seismic hazard are presented in Table 1. The probability density function of the peak ground acceleration (PGA) of 720 cities was calculated by the piecewise fitting method of the seismic hazard curve.
Table 1Seismic hazard data for the city of Heyuan (raw data of four probability control points).
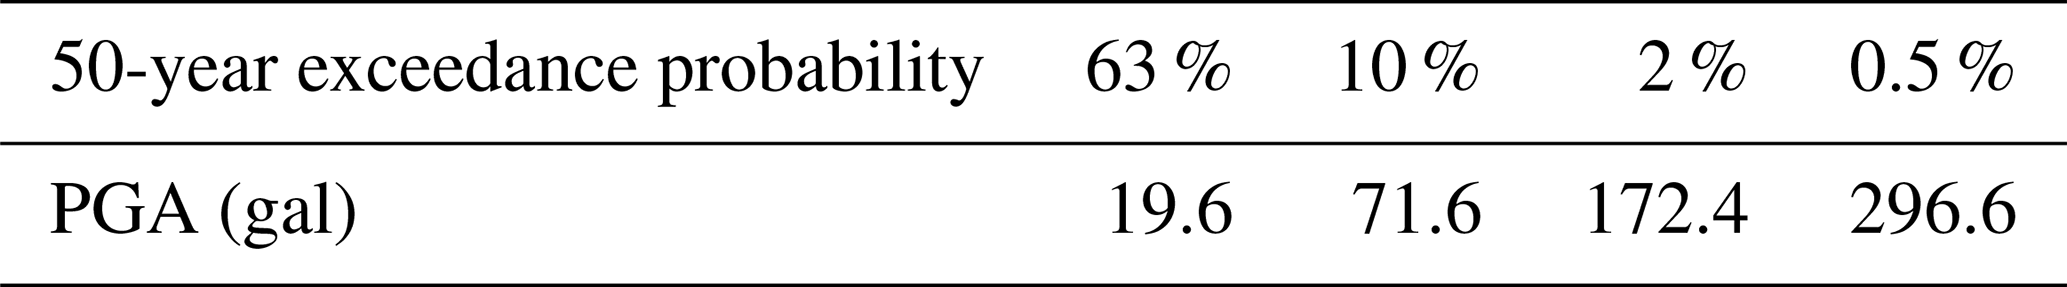
Table 2Basic data of water supply network in the city of Heyuan.
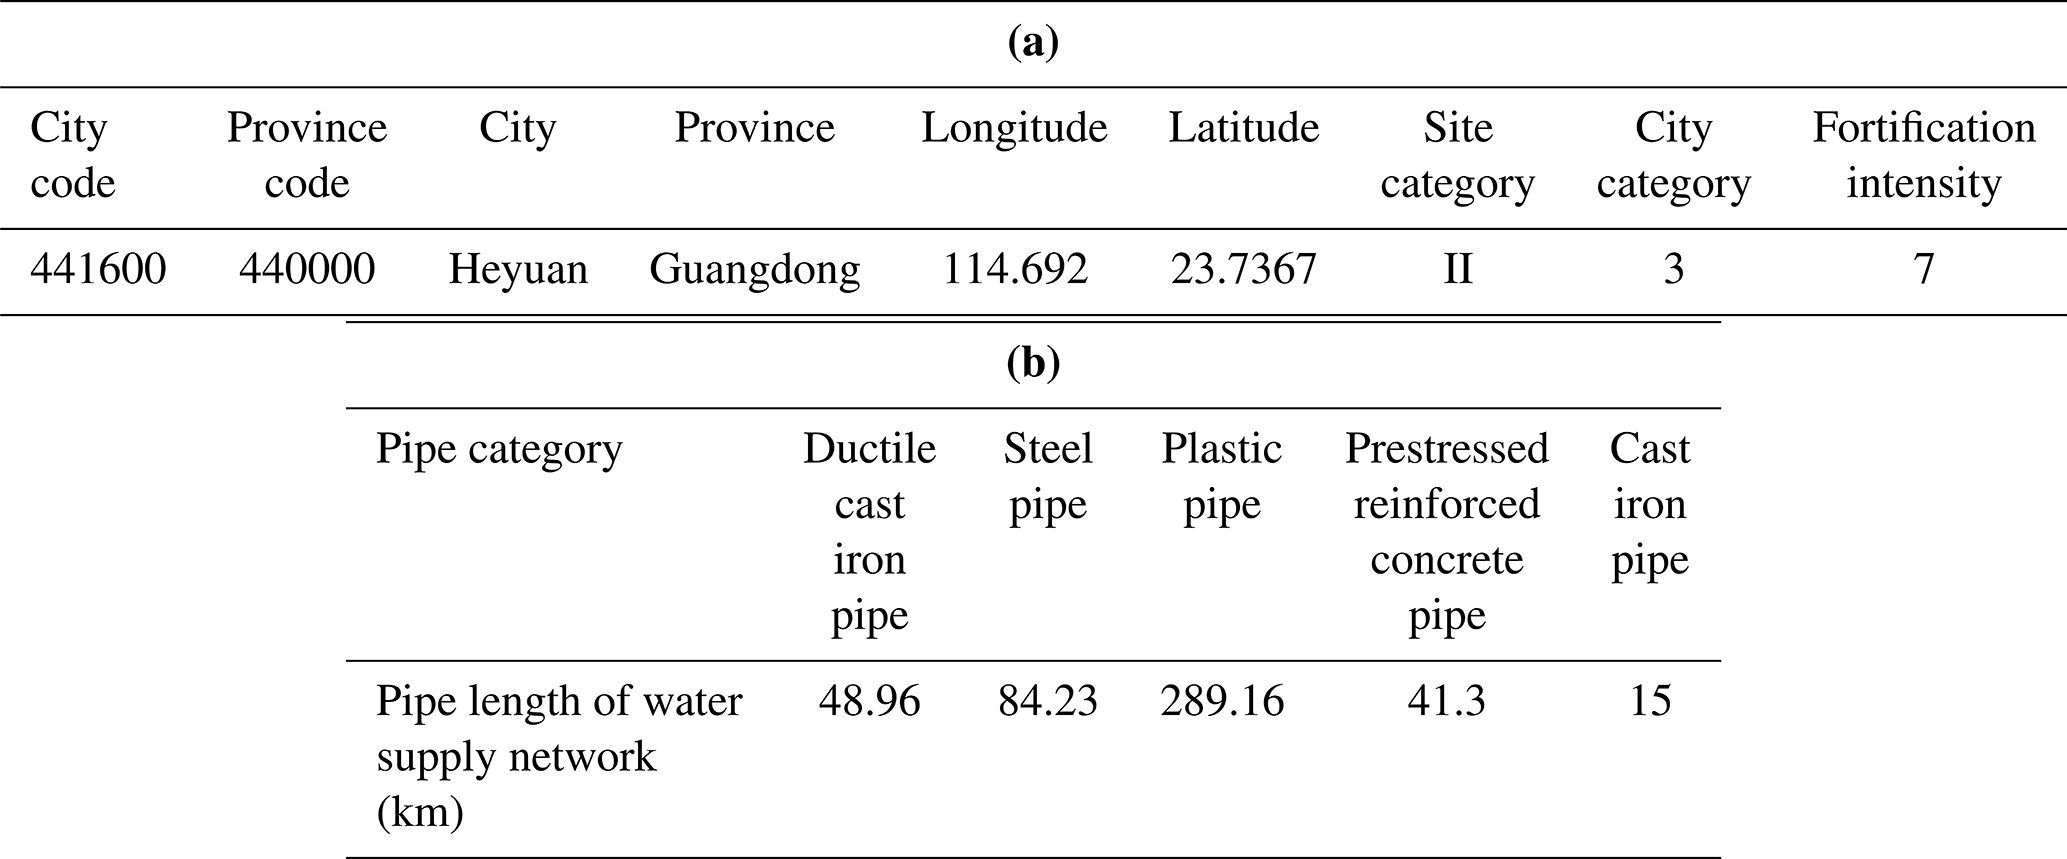
Among the five types of data in the aforementioned databases, the water supply network data from the Water Supply Yearbook, the seismic fortification intensity of the seismic code, and the population and GDP data from the census do not require complex processing for this study. However, the site category data need to be analyzed for accuracy and usability, and the seismic hazard data need to be processed using seismic hazard analysis methods for this study. Taking the basic data of Heyuan as an example, the database structure is shown in Tables 1 and 2.
This study collected seismic damage data from cities such as Haicheng, Tangshan and Wenchuan (Institute of Engineering Mechanics and CEA, 1979; Institute of Engineering Mechanics, 2009) and classified, organized and calculated the seismic damage matrices of water supply pipelines, water tanks and pump houses according to the city classification and seismic damage data. A database of seismic damage data for water supply systems was then established.
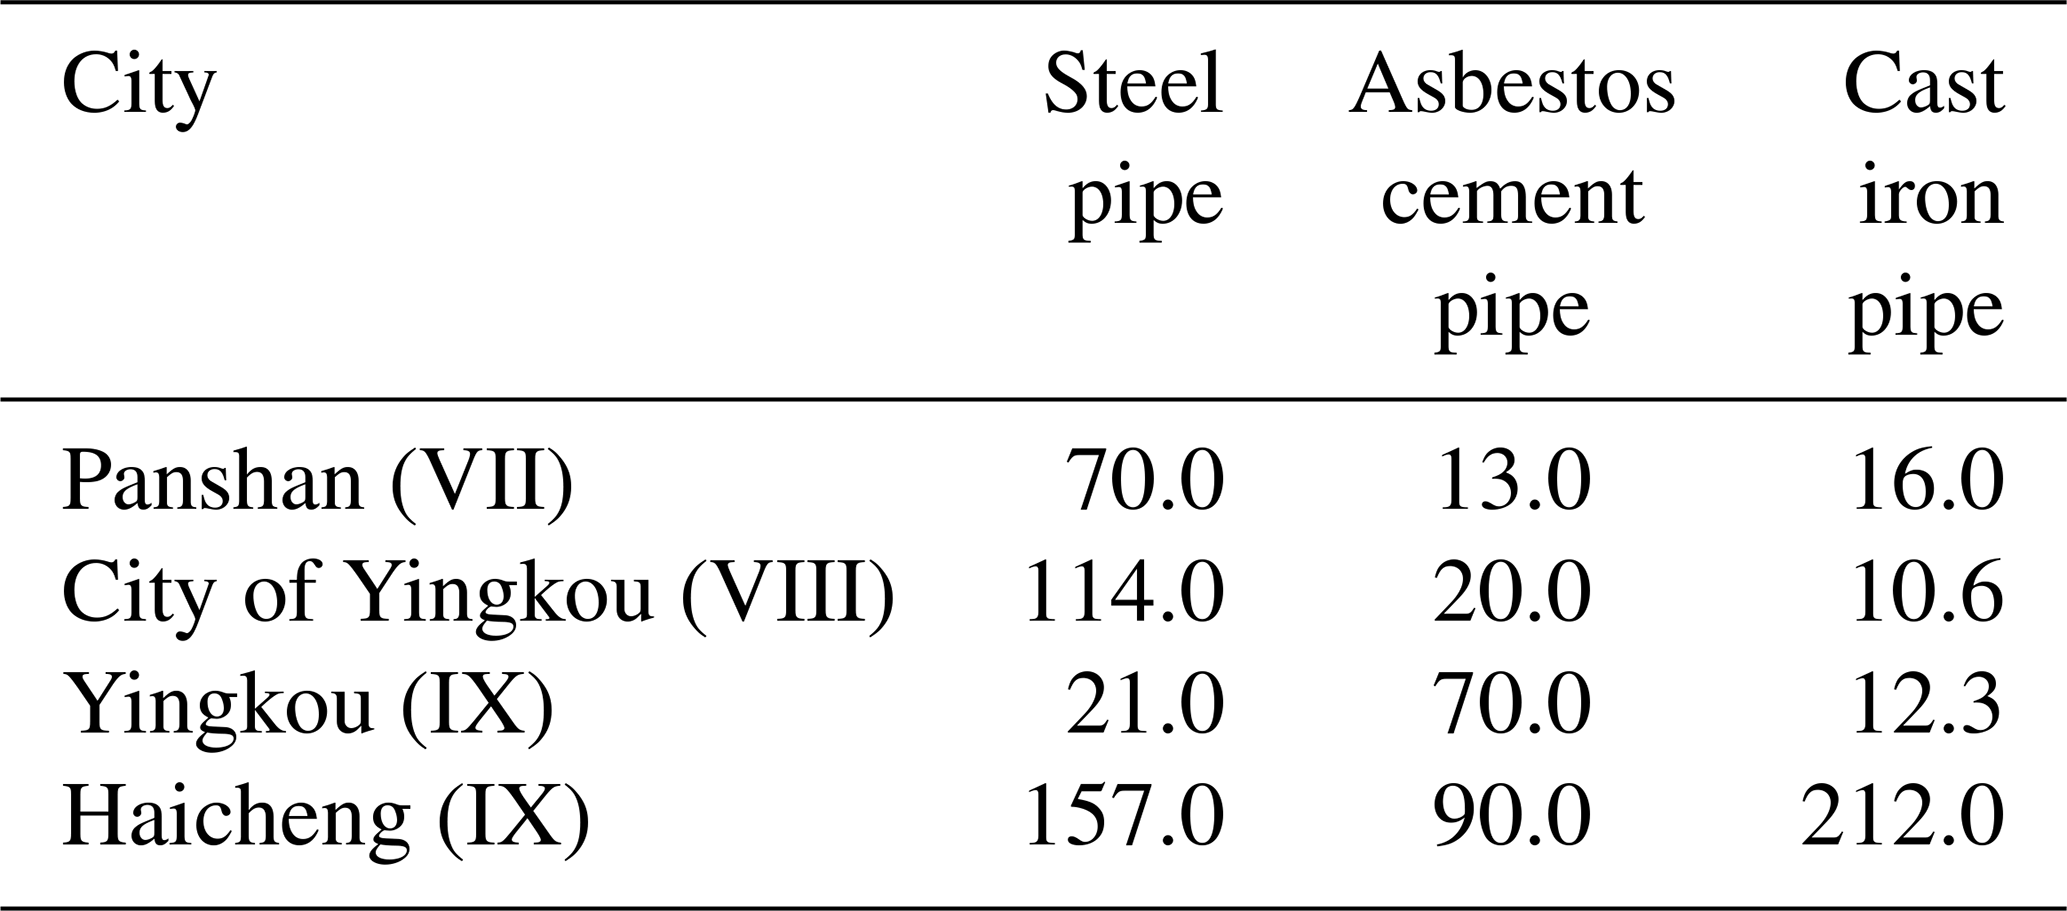
After sorting, the seismic damage rates of different materials of water supply pipelines in the Haicheng earthquake are shown in Table 3. The water supply pipeline materials are mainly cast iron pipes.
Table 3Seismic damage rates of different pipeline materials in the Haicheng earthquake (location per 10 km).
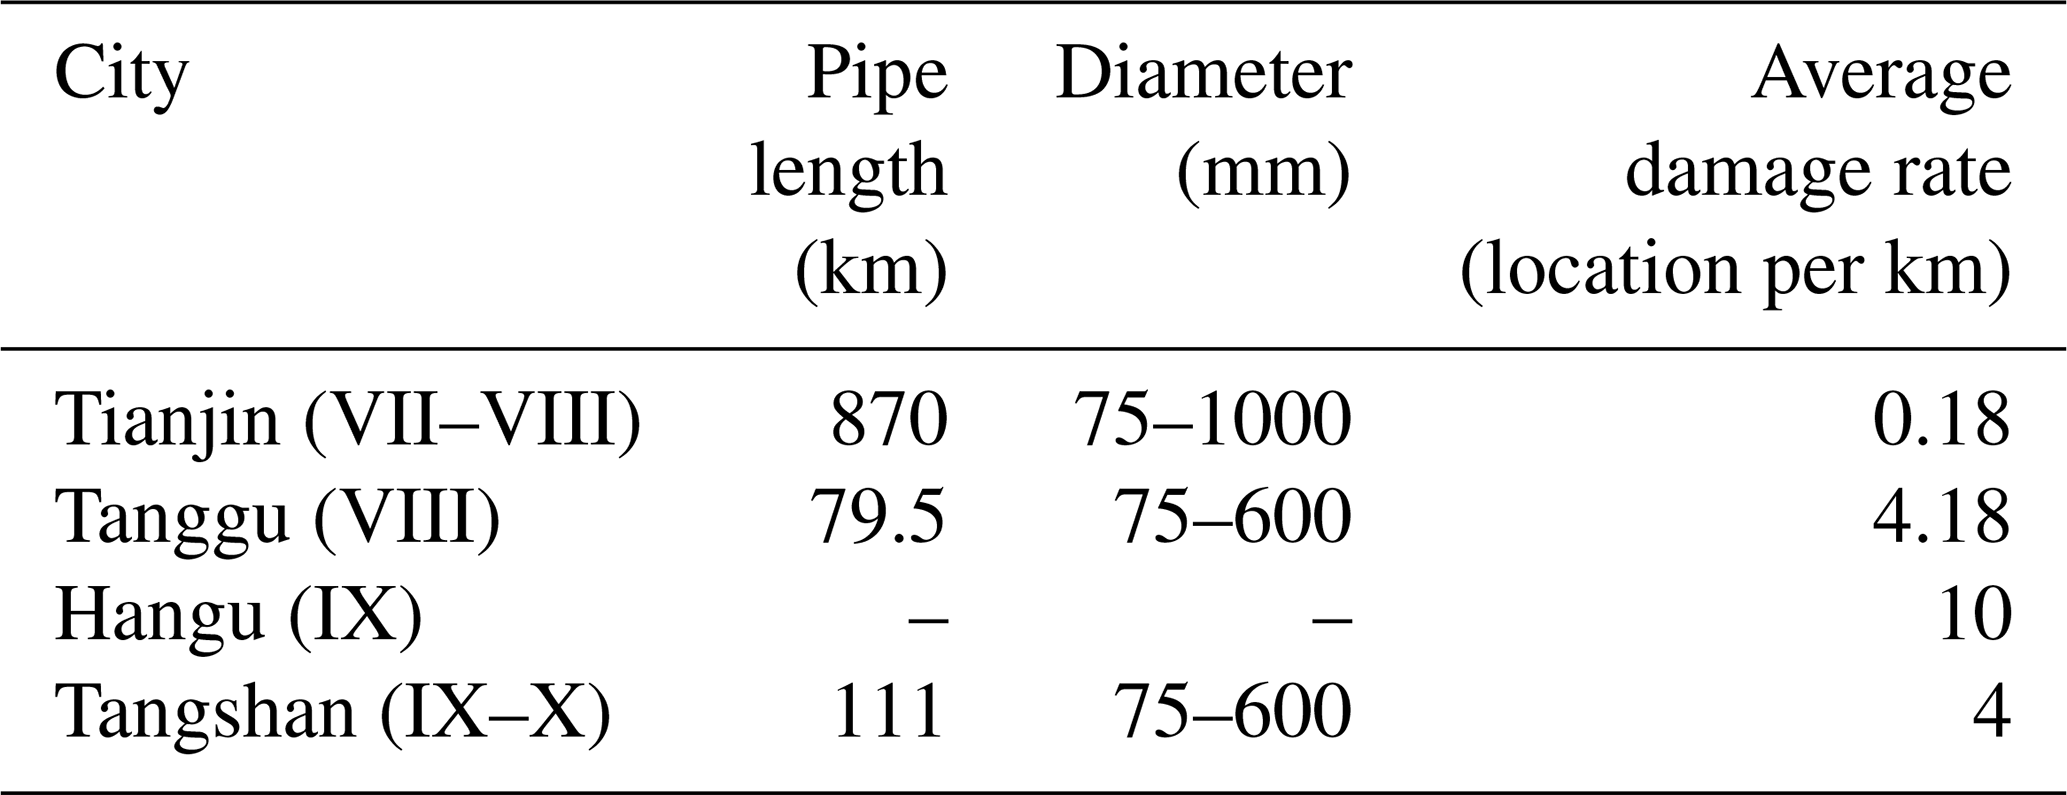
The seismic damage rates of the water supply pipelines in the Tangshan earthquake are summarized in Table 4. Water supply pipelines include cast iron pipes, prestressed reinforced concrete pipes, steel pipes and self-stressing reinforced concrete pipes, with cast iron pipes accounting for the largest proportion.
Table 4Seismic damage rates of water supply network in the Tangshan earthquake (location per km).
After sorting, the seismic damage rates of various pipes in the water supply network in the Wenchuan earthquake are shown in Table 5.
Table 5Seismic damage rates of water supply pipelines in the Wenchuan earthquake (location per 10 km).
2.1 Water reservoirs (clean water reservoirs and water treatment reservoirs)
We compiled seismic damage data for 200 clean water reservoirs and 124 water treatment reservoirs in the Haicheng earthquake, the Tangshan earthquake, the west Baotou earthquake, the Yutian–Cele earthquake in Xinjiang, the Wenchuan earthquake and the Yushu earthquake (Gao et al., 2012). The seismic damage statistics are shown in Tables 6 and 8; the seismic damage matrix of the clean water reservoirs and of the water treatment reservoirs is shown in Tables 7 and 9.
Table 6Statistics for seismic damage of clean water reservoirs.
Table 8Statistics for seismic damage of water treatment reservoirs.
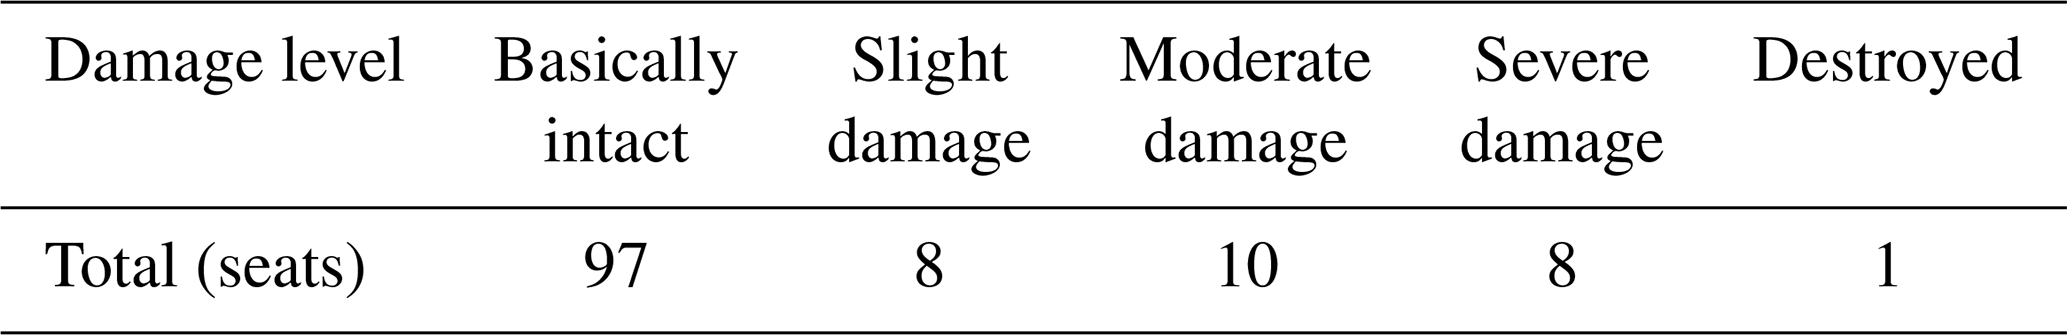
Table 9Seismic damage matrix of water treatment reservoirs (%).
2.2 Pump station buildings
This paper uses the seismic damage matrix of pump station buildings obtained through actual seismic damage statistical analysis as the basic seismic damage data for the fragility curves. The seismic damage matrix of pump station buildings can be found in the literature in the publication Research on New Techniques for Evaluating the Loss of Large Earthquake Disasters in Water Supply Systems (Institute of Engineering Mechanics and China Earthquake Administration, 2013).
The above data constitute the basic database for seismic risk assessment of water supply systems.
The expected seismic loss is expressed by the coupling of three factors: seismic hazard, structural vulnerability and social wealth (Chen et al., 1999); as an expression of earthquake disaster risk, the expected seismic risk loss (rate) refers to the intersection of seismic hazard, structural vulnerability of water supply system facilities and total fixed assets of water supply systems in a certain region during a specific period of time in the future.
3.1 Seismic hazard
The process of seismic hazard probability analysis includes complex earthquake repetition models and earthquake motion prediction models, but the expression of seismic hazard analysis results is not complex and is generally represented by seismic hazard curves. The seismic hazard curve should provide an exceedance probability curve for the ground motion parameters, which is the probability of exceeding the given ground motion parameter value on the probability distribution curve. The seismic hazard curve is determined by the potential source and the attenuation law of ground motion parameters. In this paper, the probability density function of peak ground acceleration (PGA) was calculated by using the piecewise fitting method of seismic hazard curves.
The relationship between the seismic hazard function Ht(a) of the engineering site and the PGA a is (Cornell, 1968)
where a is the PGA, t is time (year), and kb and kH are the parameters of the seismic hazard curve.
This paper used certain designated control points for piecewise fitting of the seismic hazard curve, while the exceedance probability of the other PGA parameters was obtained from the seismic hazard curve.
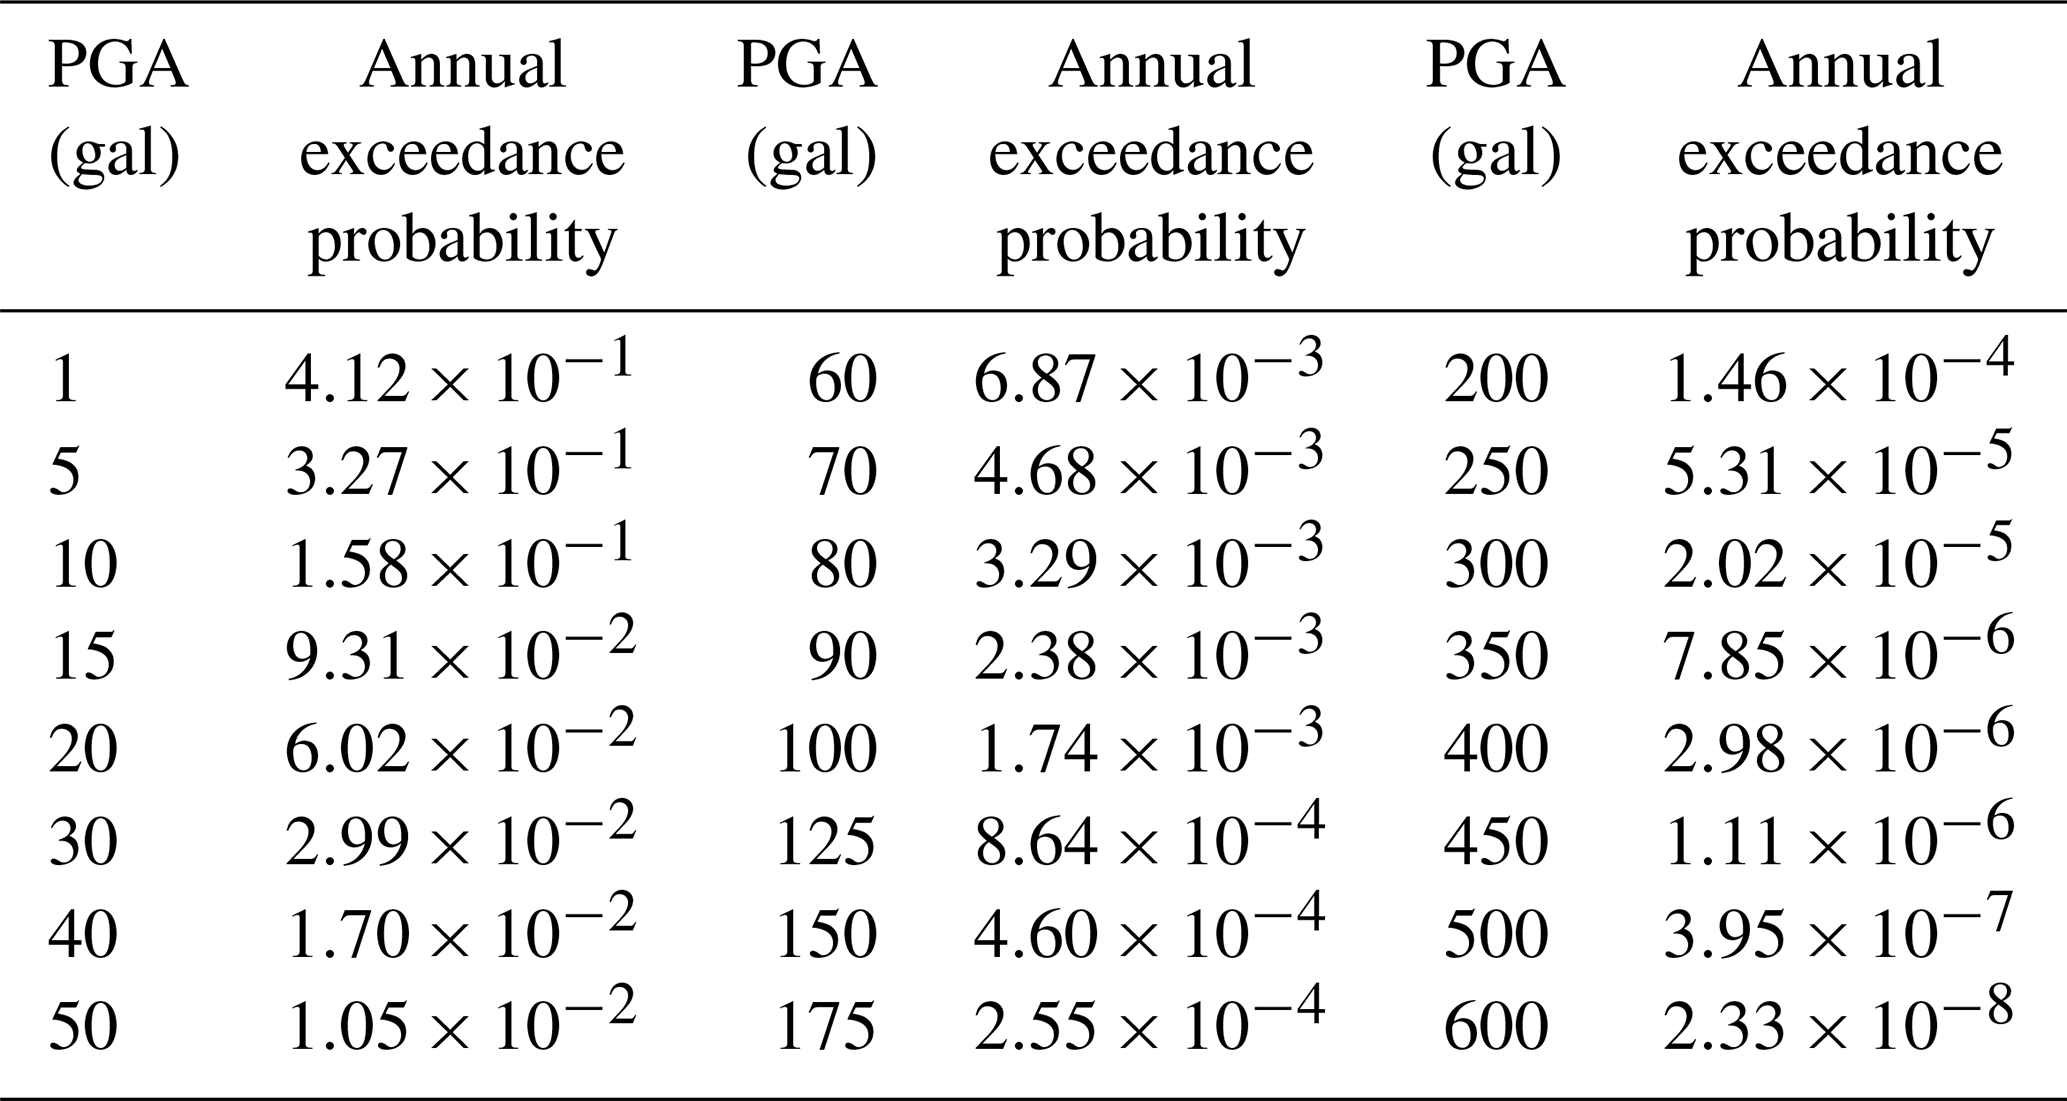
The probability seismic hazard analysis method compiled by the Fifth-Generation Zonation Map was used to calculate the annual exceedance probability of the PGA of the rock site in Mengzi, Yunnan Province (Wen, 2017), as shown in Table 10.
Table 10Peak ground acceleration (PGA) of a rock site in the city of Mengzi: annual exceedance probabilities.
The corresponding relationship between the PGA of four control points of a rock site in Mengzi and the exceedance probability in different timescales is shown in Table 11.
Table 11Peak ground acceleration (PGA) of a specific rock site in the city of Mengzi: exceedance probabilities.
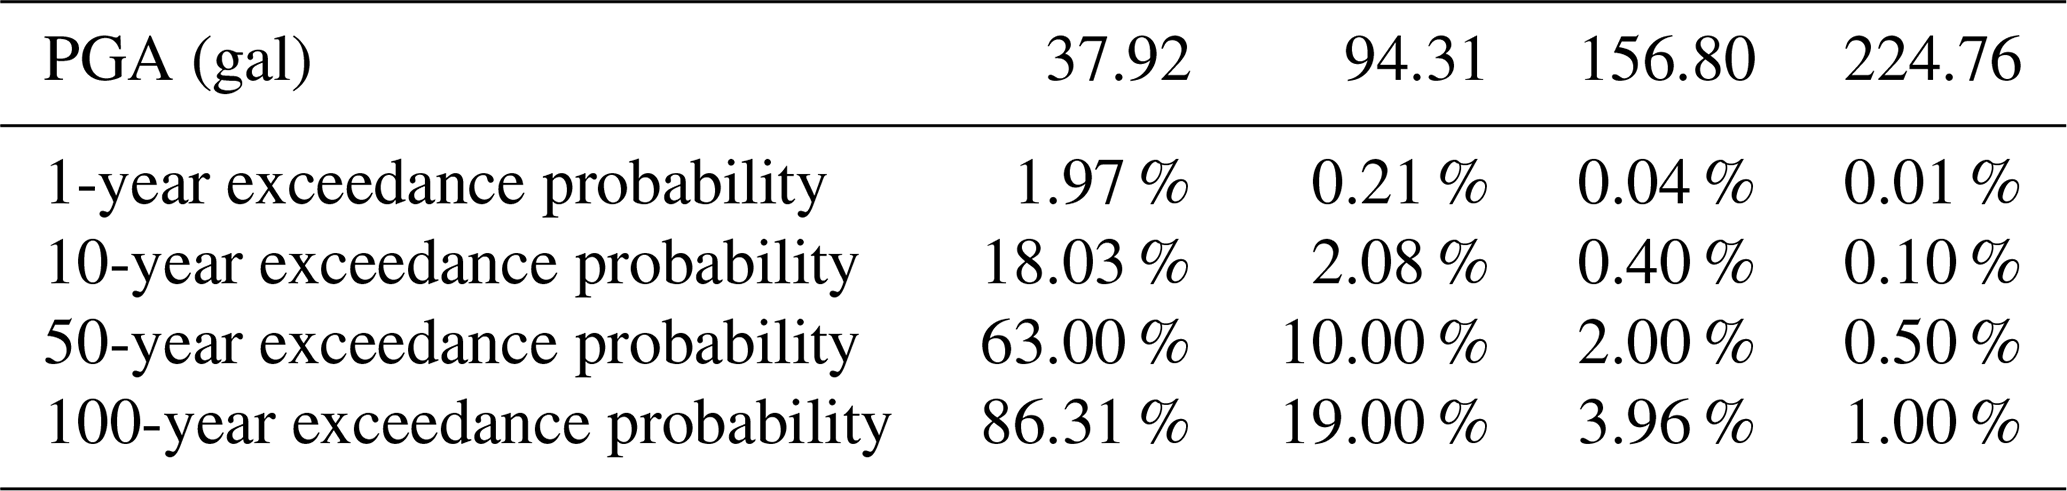
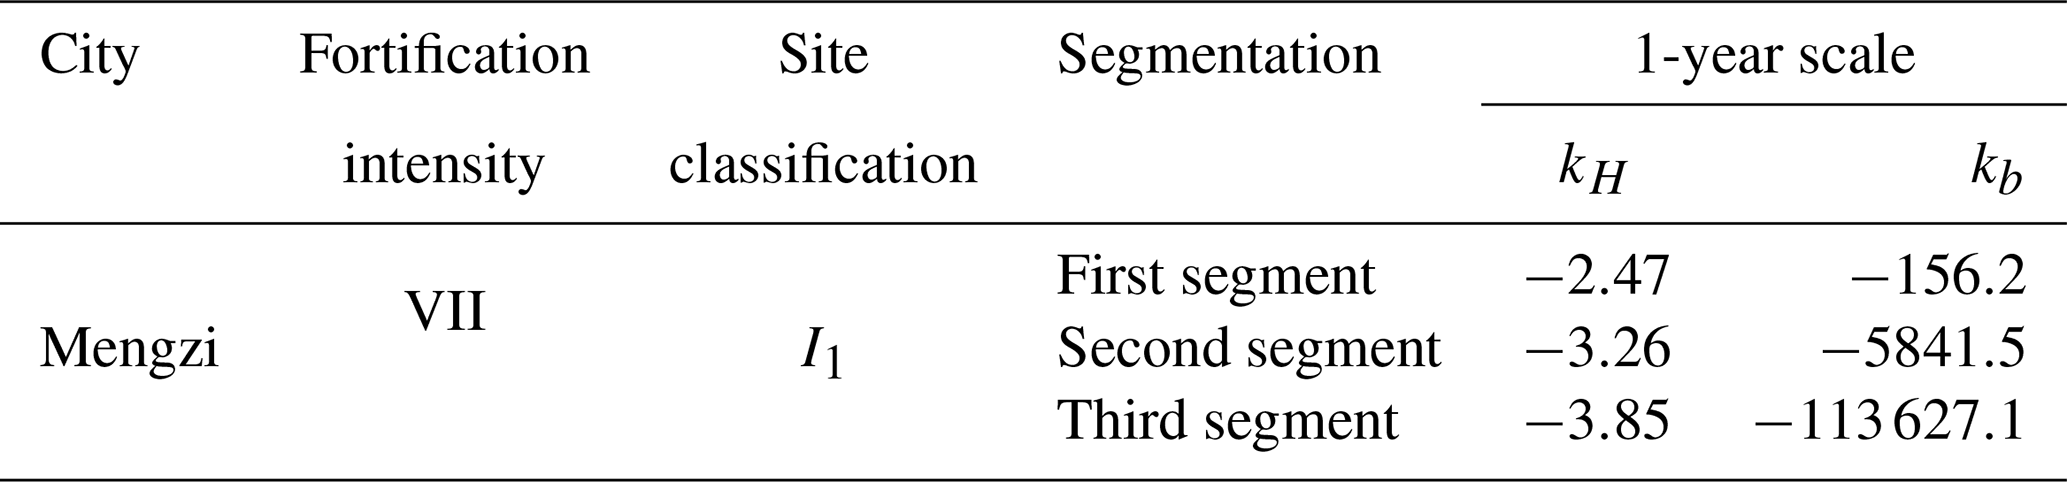
According to Table 11, the parameters of the 1-year segmented seismic hazard function for the rock site in Mengzi were fitted using the least squares method, as shown in Table 12. The data in Table 10 and the fitted 1-year seismic hazard curve for the rock site were plotted in the same coordinate system, as shown in Fig. 2.
Table 12Parameters of seismic hazard function in the city of Mengzi.
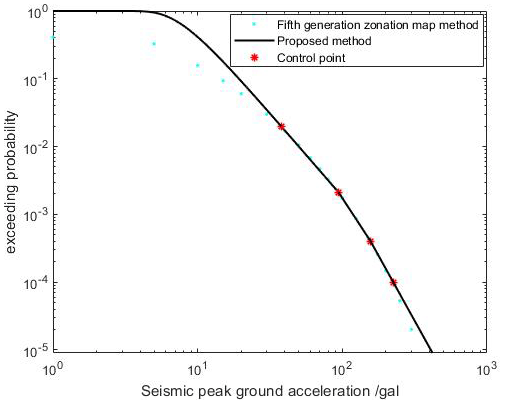
From Fig. 2, it can be seen that the seismic hazard curve obtained by the piecewise fitting method is basically consistent with the seismic hazard calculation points obtained by the Fifth-Generation Seismic Zonation Map method. When the PGA is small, the annual exceedance probability will be overestimated. In fact, when the PGA is small, the water supply system is basically in good condition, and its loss ratio is 0. Even if the exceedance probability is overestimated, the accuracy of the seismic risk analysis results of the water supply system will not be affected. Therefore, it is feasible to obtain seismic risk curve parameters in different regions of mainland China by piecewise fitting of four control points given in the Fifth-Generation Zonation Map (GB18306-2015 Seismic ground motion parameters zonation map of China, 2015).
The ratio relationship between the PGA corresponding to the 50-year exceedance probability of 63 %, the 50-year exceedance probability of 2 %, and the annual exceedance probability of 10−4 and the basic ground motion PGA (50-year exceedance probability of 10 %) is very complex, and its spatial distribution has a strong correlation with the distribution of potential source areas, which is mainly affected by the seismotectonics environment, and the ratios in different regions vary greatly (Gao and Lu, 2006; Lei et al., 2010). Therefore, it is not possible to directly use the PGA (0.05, 0.1, 0.15, 0.2 0.3 g) corresponding to the 50-year exceedance probability of 10 % of the specific sites in the Fifth-Generation Zonation Map to calculate the PGA under the other three exceedance probabilities in a fixed proportion. Instead, based on the basic database of the Fifth-Generation Zonation Map, further analysis and processing are conducted on the actual calculated seismic hazard data (using China's Probabilistic Seismic Hazard Analysis (CPSHA) method) extracted from the database.
Since the PGA provided in the Fifth-Generation Zonation Map is under a specific site category, it is necessary to obtain the PGA under the corresponding site category by interpolation and transformation according to the actual site category of the city using the method provided in the Fifth-Generation Zonation Map. This paper collected seismic hazard data (four control points) and actual site categories of 720 cities in mainland China.
By using the relationship between the cumulative distribution function (CDF) and the exceedance probability, the functional relationship between the CDF Ct(a) and the PGA a can be obtained as follows:
The probability density function (PDF) of PGA can be obtained by calculating the first derivative of the CDF; that is, the functional relationship between ft(a) and the PGA a is
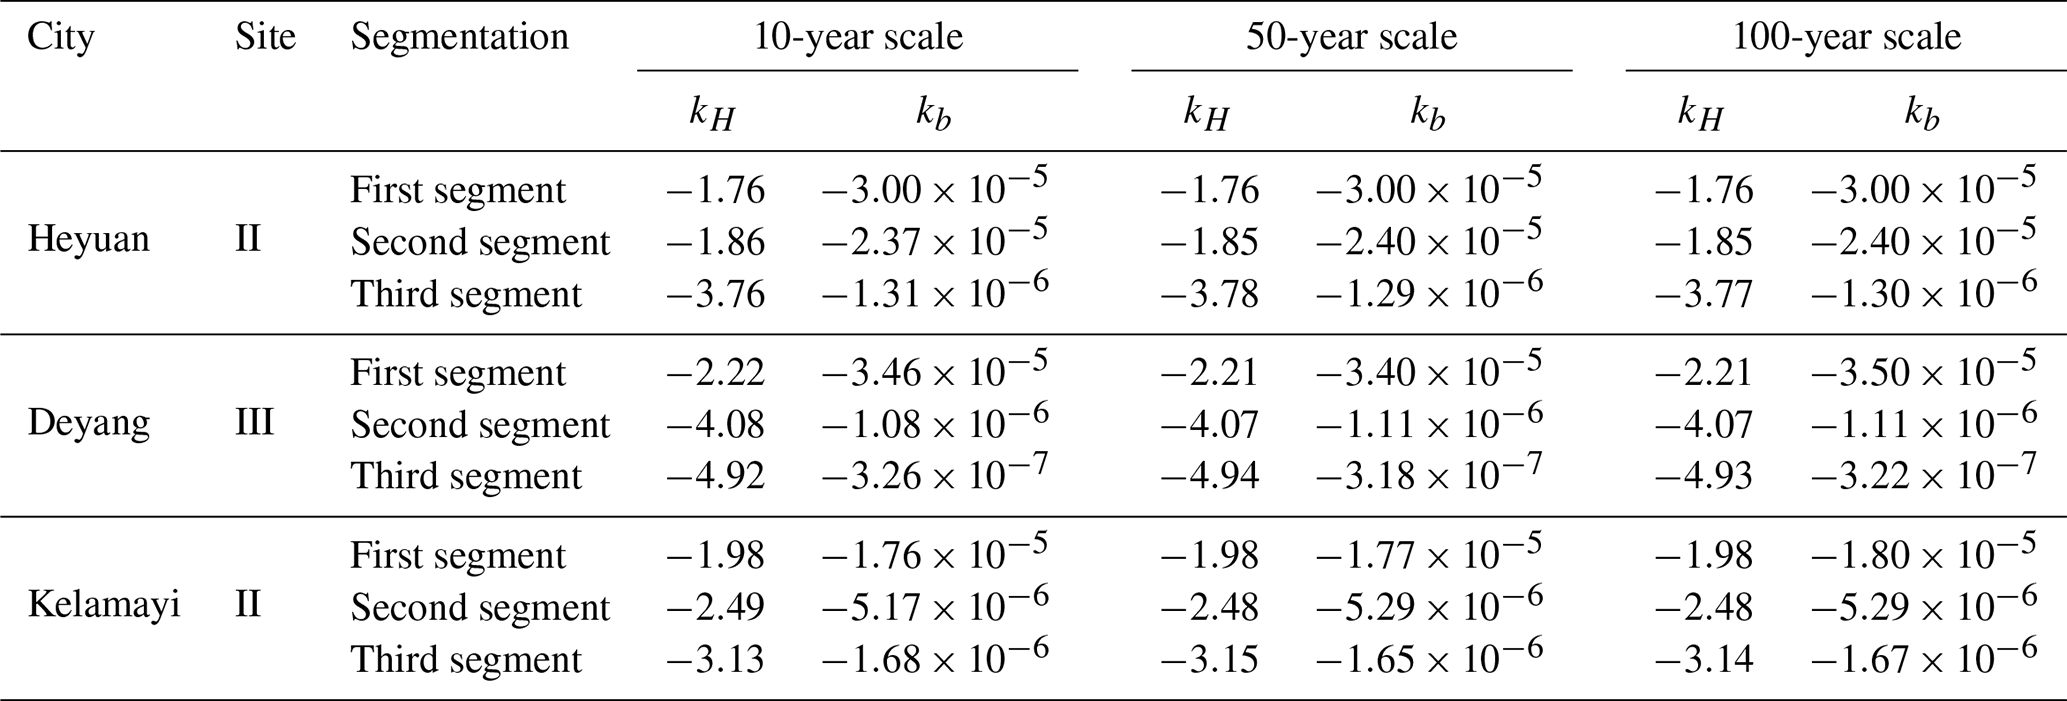
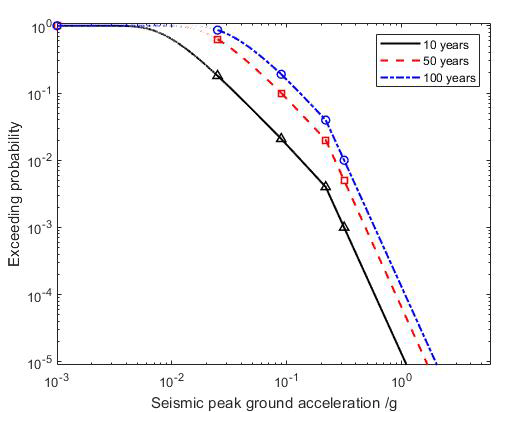
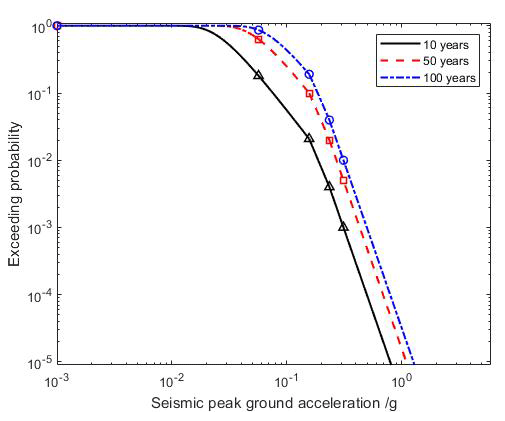
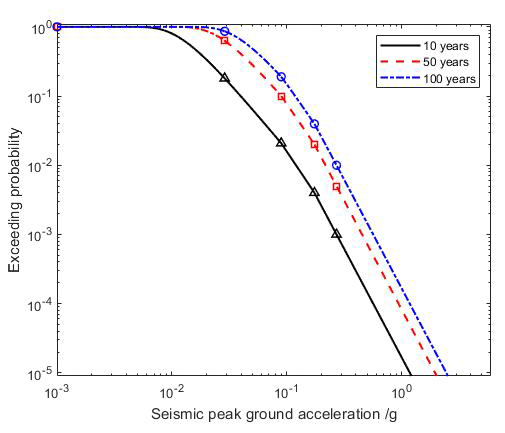
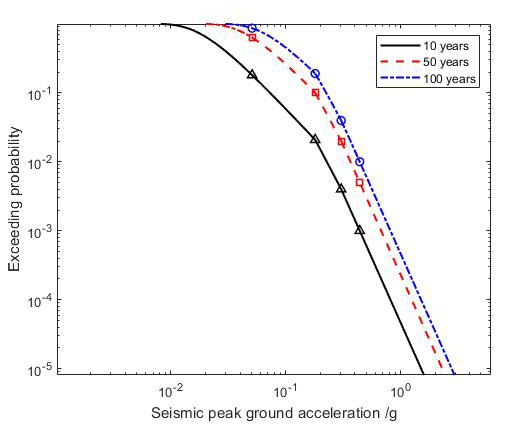
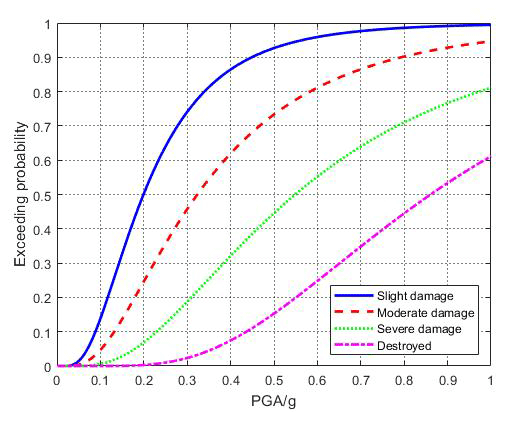
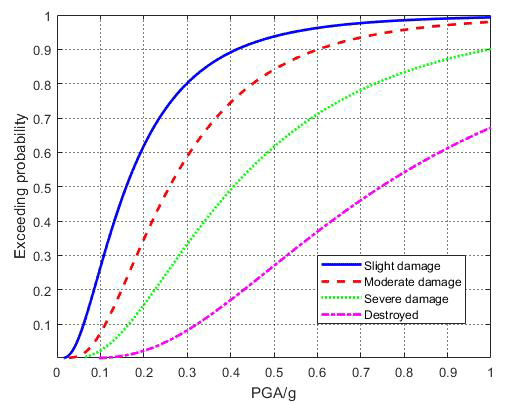
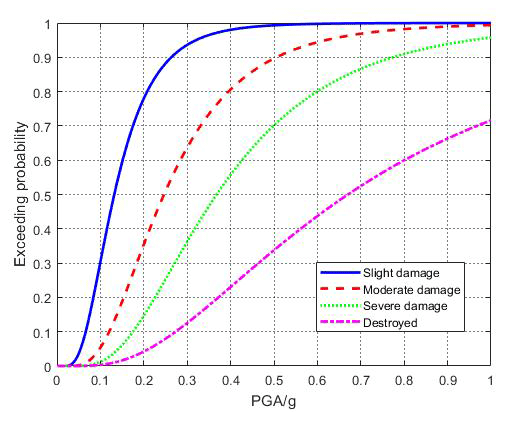
Based on the above method, the relevant parameters of the PDF ft(a) of the PGA of 720 cities at 10-, 50- and 100-year scales under the actual site categories are calculated, and a seismic hazard database that can be used for the seismic risk assessment model is formed. This paper lists the parameters of segmented seismic hazard functions at 10-, 50-, and 100-year scales for the actual site categories of three typical cities, as shown in Table 13. The seismic hazard curves of four typical cities are plotted in Figs. 3–6.
Table 13Parameters of seismic hazard function for example cities.
3.2 Seismic fragility analysis of water supply facilities
The main purpose of seismic fragility analysis is to establish the relationship between the probability of water supply system facilities reaching or exceeding different seismic damage levels and ground motion parameters (intensity or PGA). The main methods include earthquake damage investigation, theoretical analysis and experimental analysis.
The water supply system facilities mainly include the water supply pipeline network, the water pool and the pump station buildings. In this paper, the water supply pipeline network was divided into five types according to the material: ductile cast iron pipe, steel pipe, plastic pipe, reinforced concrete pipe and cast iron pipe. Each pipe is divided into five different types of seismic capacity zones according to the pipeline city category; that is, each pipe has a total of five types of fragility curves. For the calculations, the corresponding pipe fragility curve must be selected according to the seismic capacity zone of the pipeline city. The water pool and pump station buildings are divided into two categories based on the seismic capacity zone.
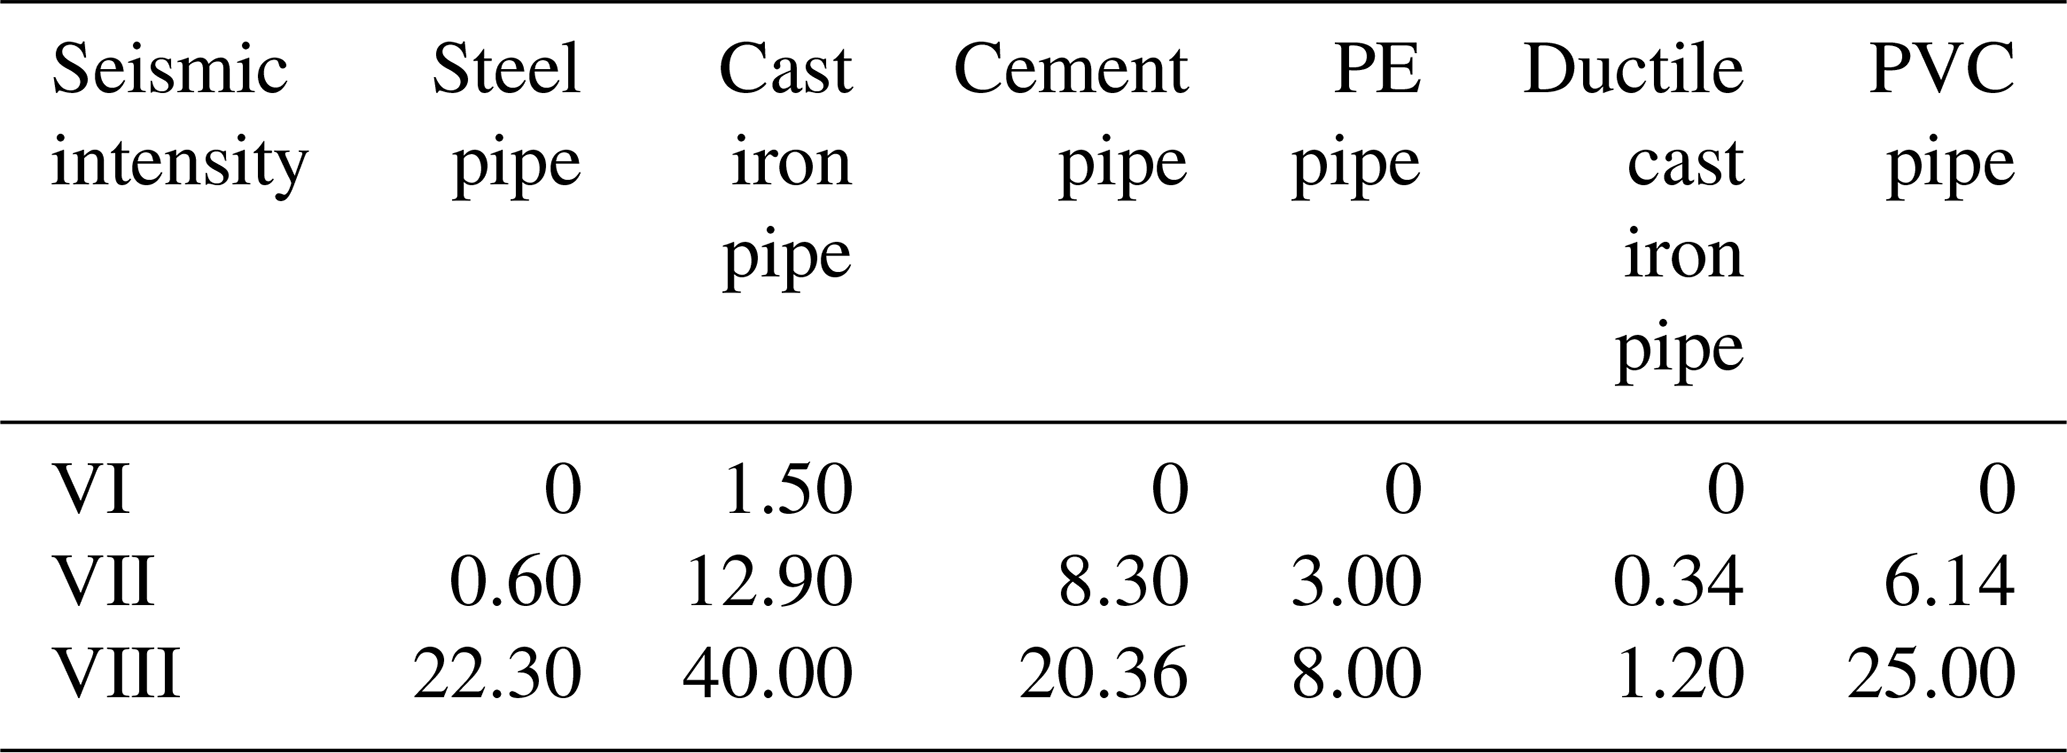
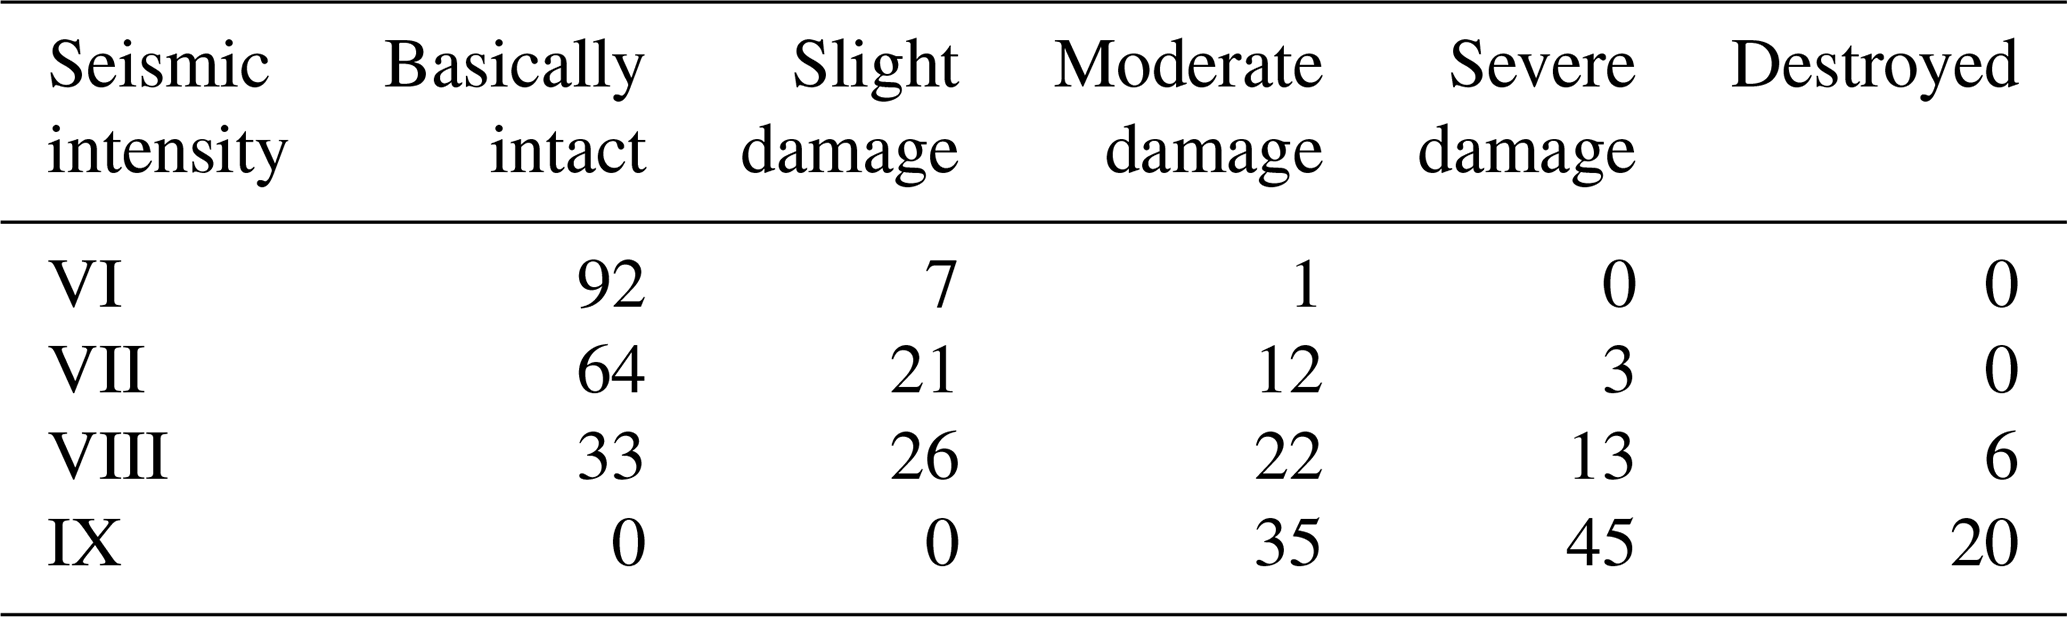
Based on the seismic damage data collected in this paper and the Classification of Earthquake Damage Levels for Lifeline Engineering (GB/T24336-2009, 2009) specification, the seismic damage level of pipelines is determined by the pipeline seismic damage rate. The proportion of pipeline damage levels under the same seismic intensity (see Fig. 7) obtained from seismic damage sample data is the damage ratio in the seismic damage matrix, which then forms the seismic damage matrix for pipelines of various materials.
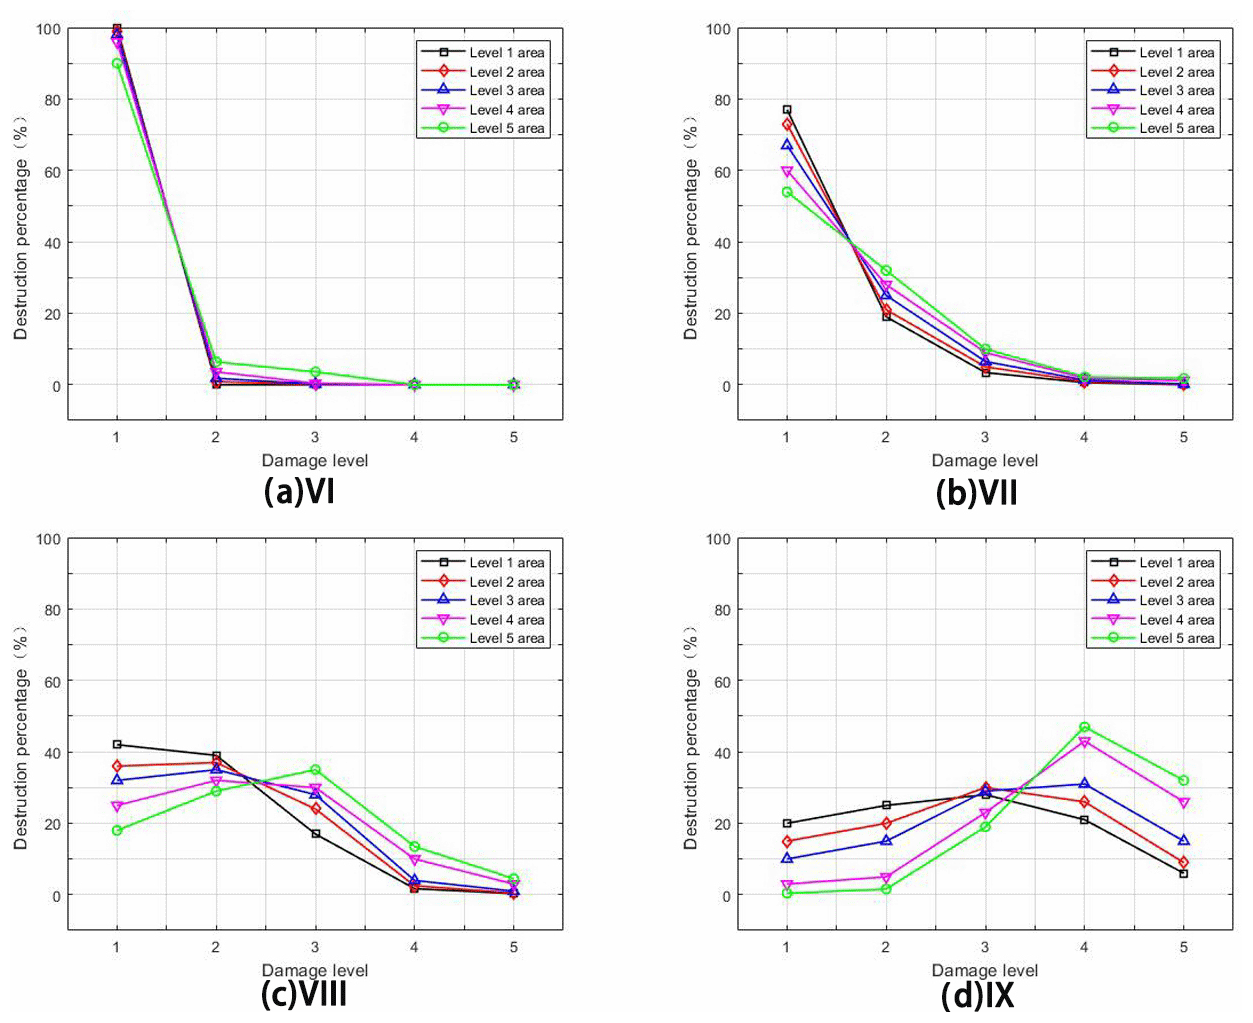
Figure 7Damage ratio of PE pipe under different seismic intensities (level-1 area to level-5 area).
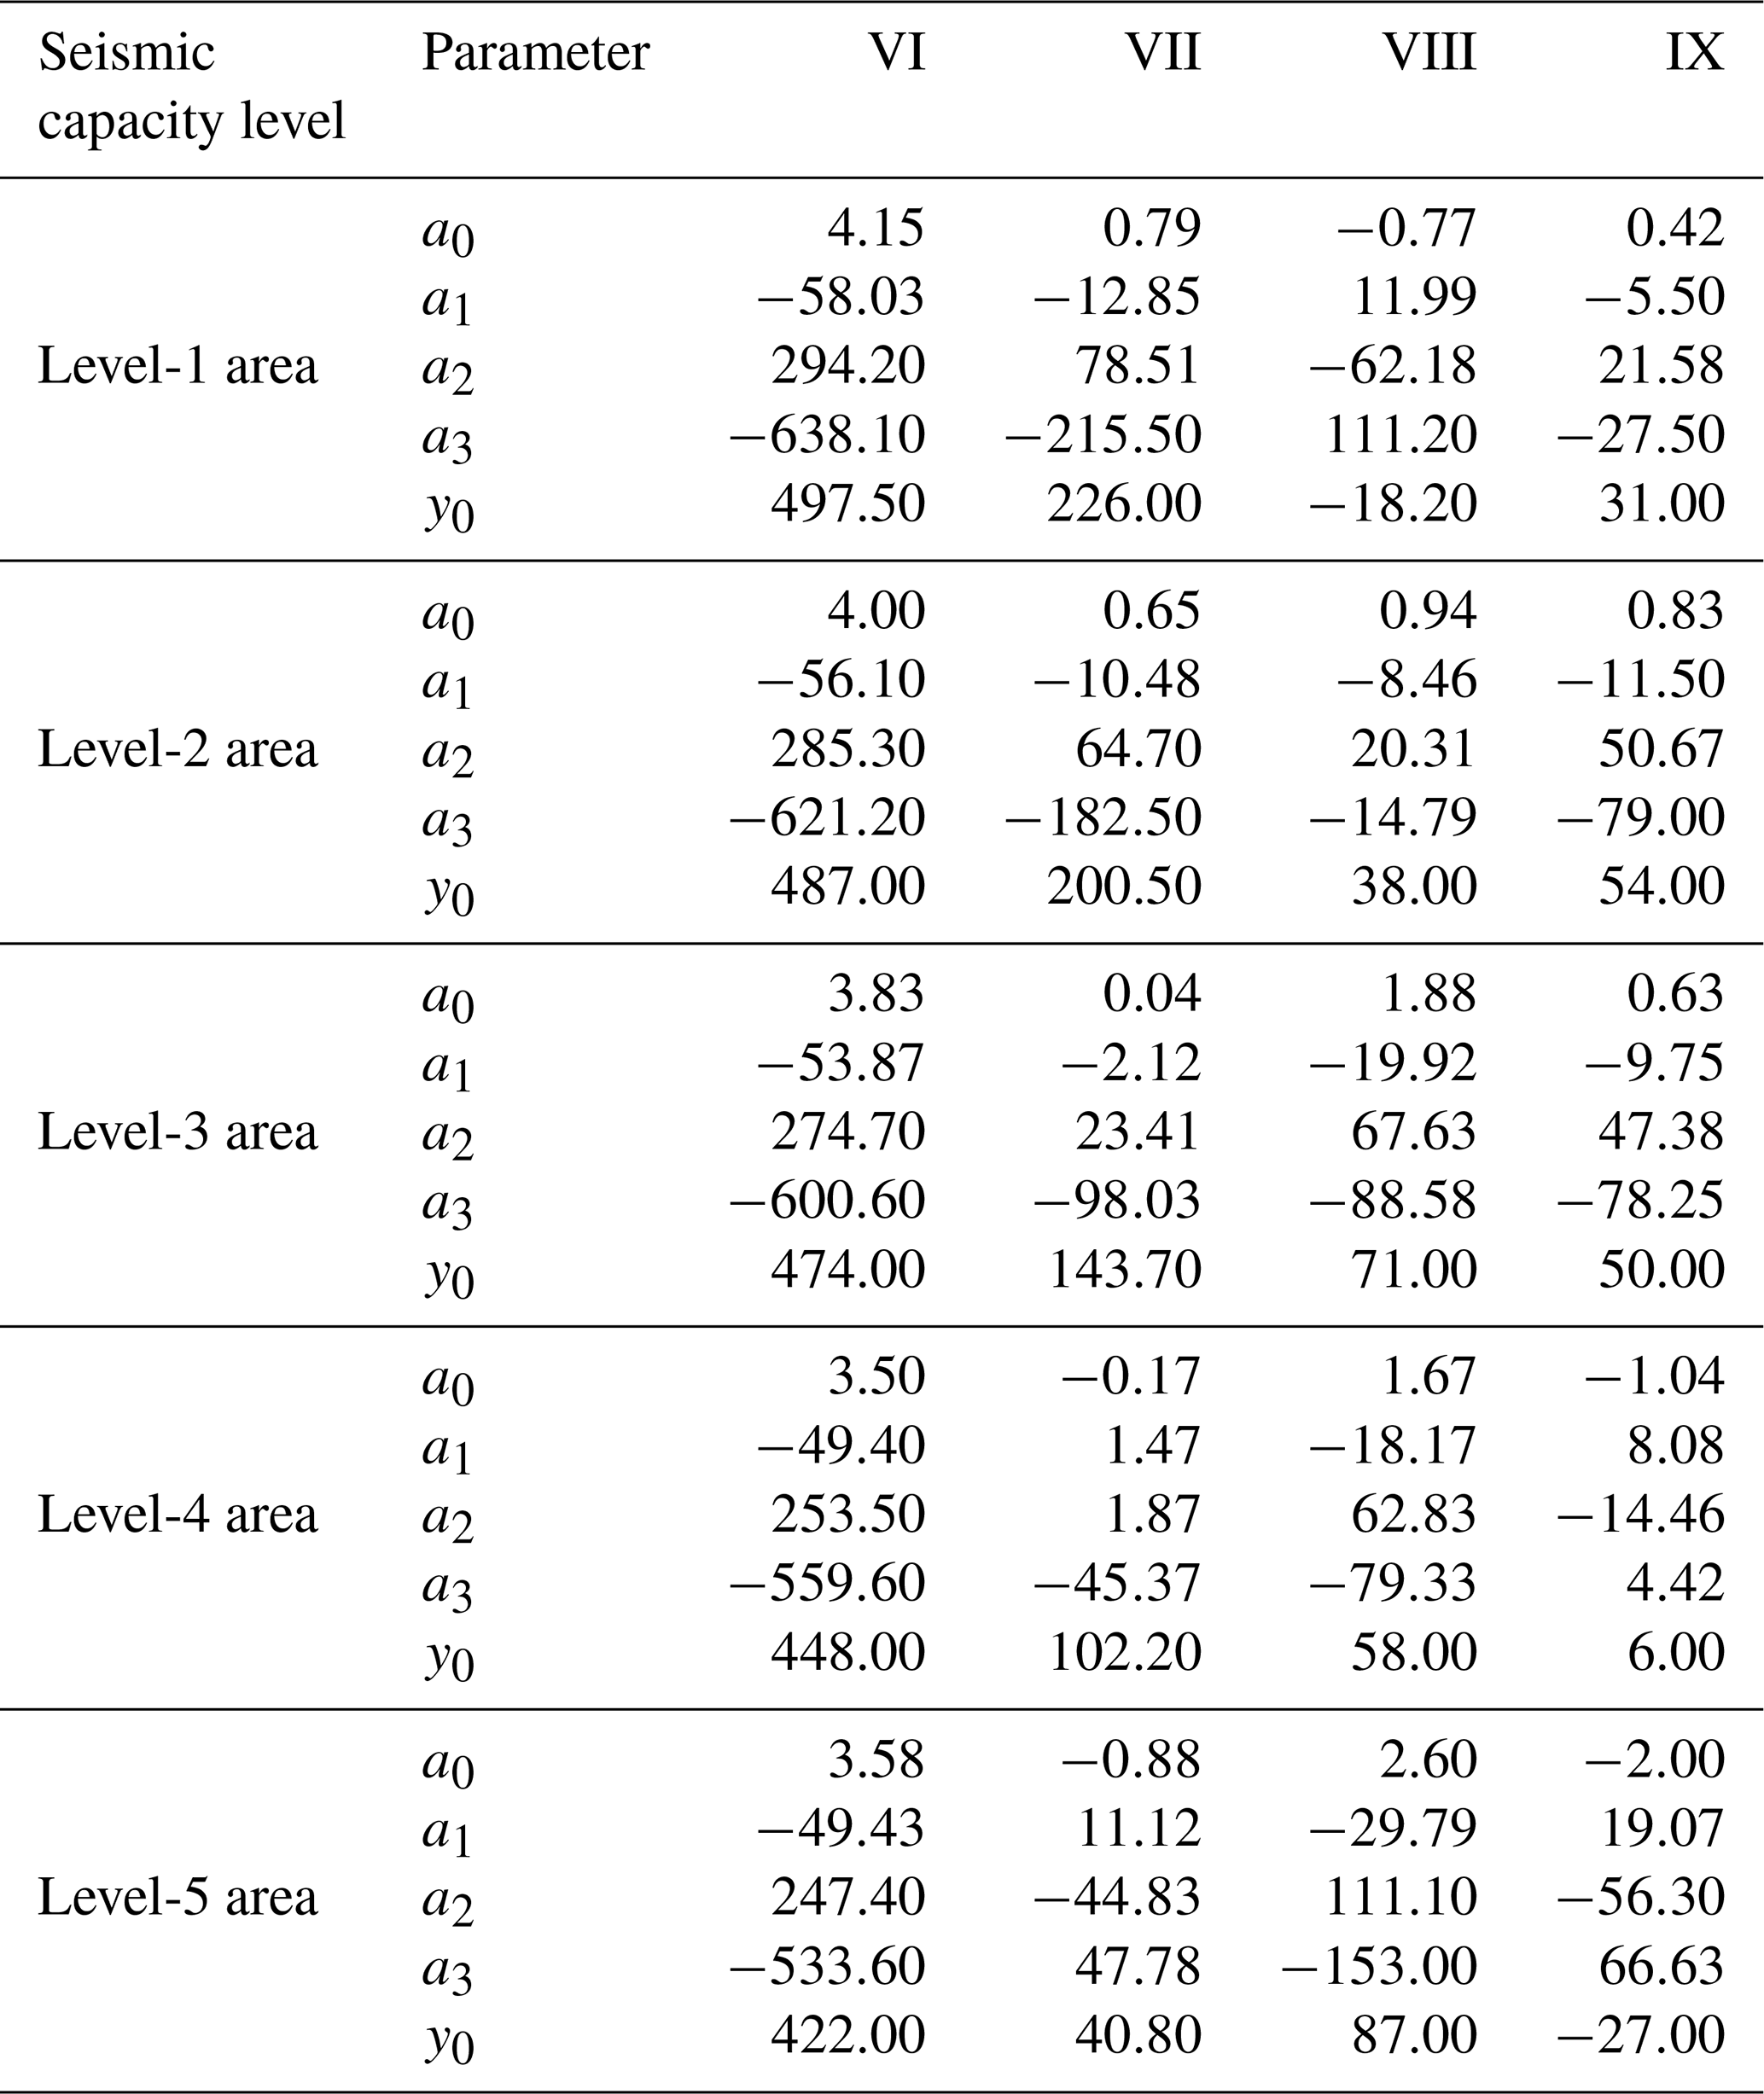
Based on the seismic damage matrix of the pipeline, the distribution of different damage ratios under different intensities was obtained, and a fitting curve for the damage ratios of different damage levels under different intensities of the water supply pipeline network in five levels was established. The results from fitting show that its distribution follows the trend of polynomial function distribution:
where Pi is the damage ratio of the ith level (a total of five different seismic capacity zones); dj is the jth damage level (basically intact – 1, slight damage – 2, moderate damage – 3, severe damage – 4, destroyed – 5); and a0, a1, a2, a3 and y0 are parameters.
We obtained parameters (a0, a1, a2, a3, y0) through polynomial fitting. The goodness-of-fit results showed that the R2 value of the polynomials for all pipes is greater than 0.98.
The seismic risk assessment model for water supply systems proposed in this paper involves at least five types of pipeline materials, namely, ductile iron pipes, cast iron pipes, steel pipes, polyethylene (PE) pipes and prestressed reinforced concrete pipes. The pipeline fragility curve of each material will be divided into five categories according to the seismic capacity zones of cities in mainland China because the seismic capacity of mainland China is divided into five zones according to seismic fortification intensity, site classification and the economic condition of the city in this paper. Due to the fact that the research subject of this study is a large-scale water supply network, which represents a macro-perspective, this paper to some extent considers the seismic disaster risk of pipelines caused by fault dislocations. The urban fortification intensity is obtained from the zonation map, which considers factors such as the seismic geology of the city, including the impact of faults on urban facilities reflected in seismic fortification. The fragility curves in this paper are calculated by fitting the actual seismic damage of pipelines, which includes the damage caused by seismic fault dislocations. As shown here in the example of the PE pipe fragility curves, each pipeline material involved in the model in this study will have similar data to the parameters of the PE pipe fragility curve. Due to space limitations, only the fragility curves of the PE pipe will be presented here.
The fitting parameters of the damage ratio curve of the seismic damage matrix for PE pipelines are shown in Table 14.
Table 14Parameter values of damage ratio curves for different damage levels of PE pipes under different intensities.
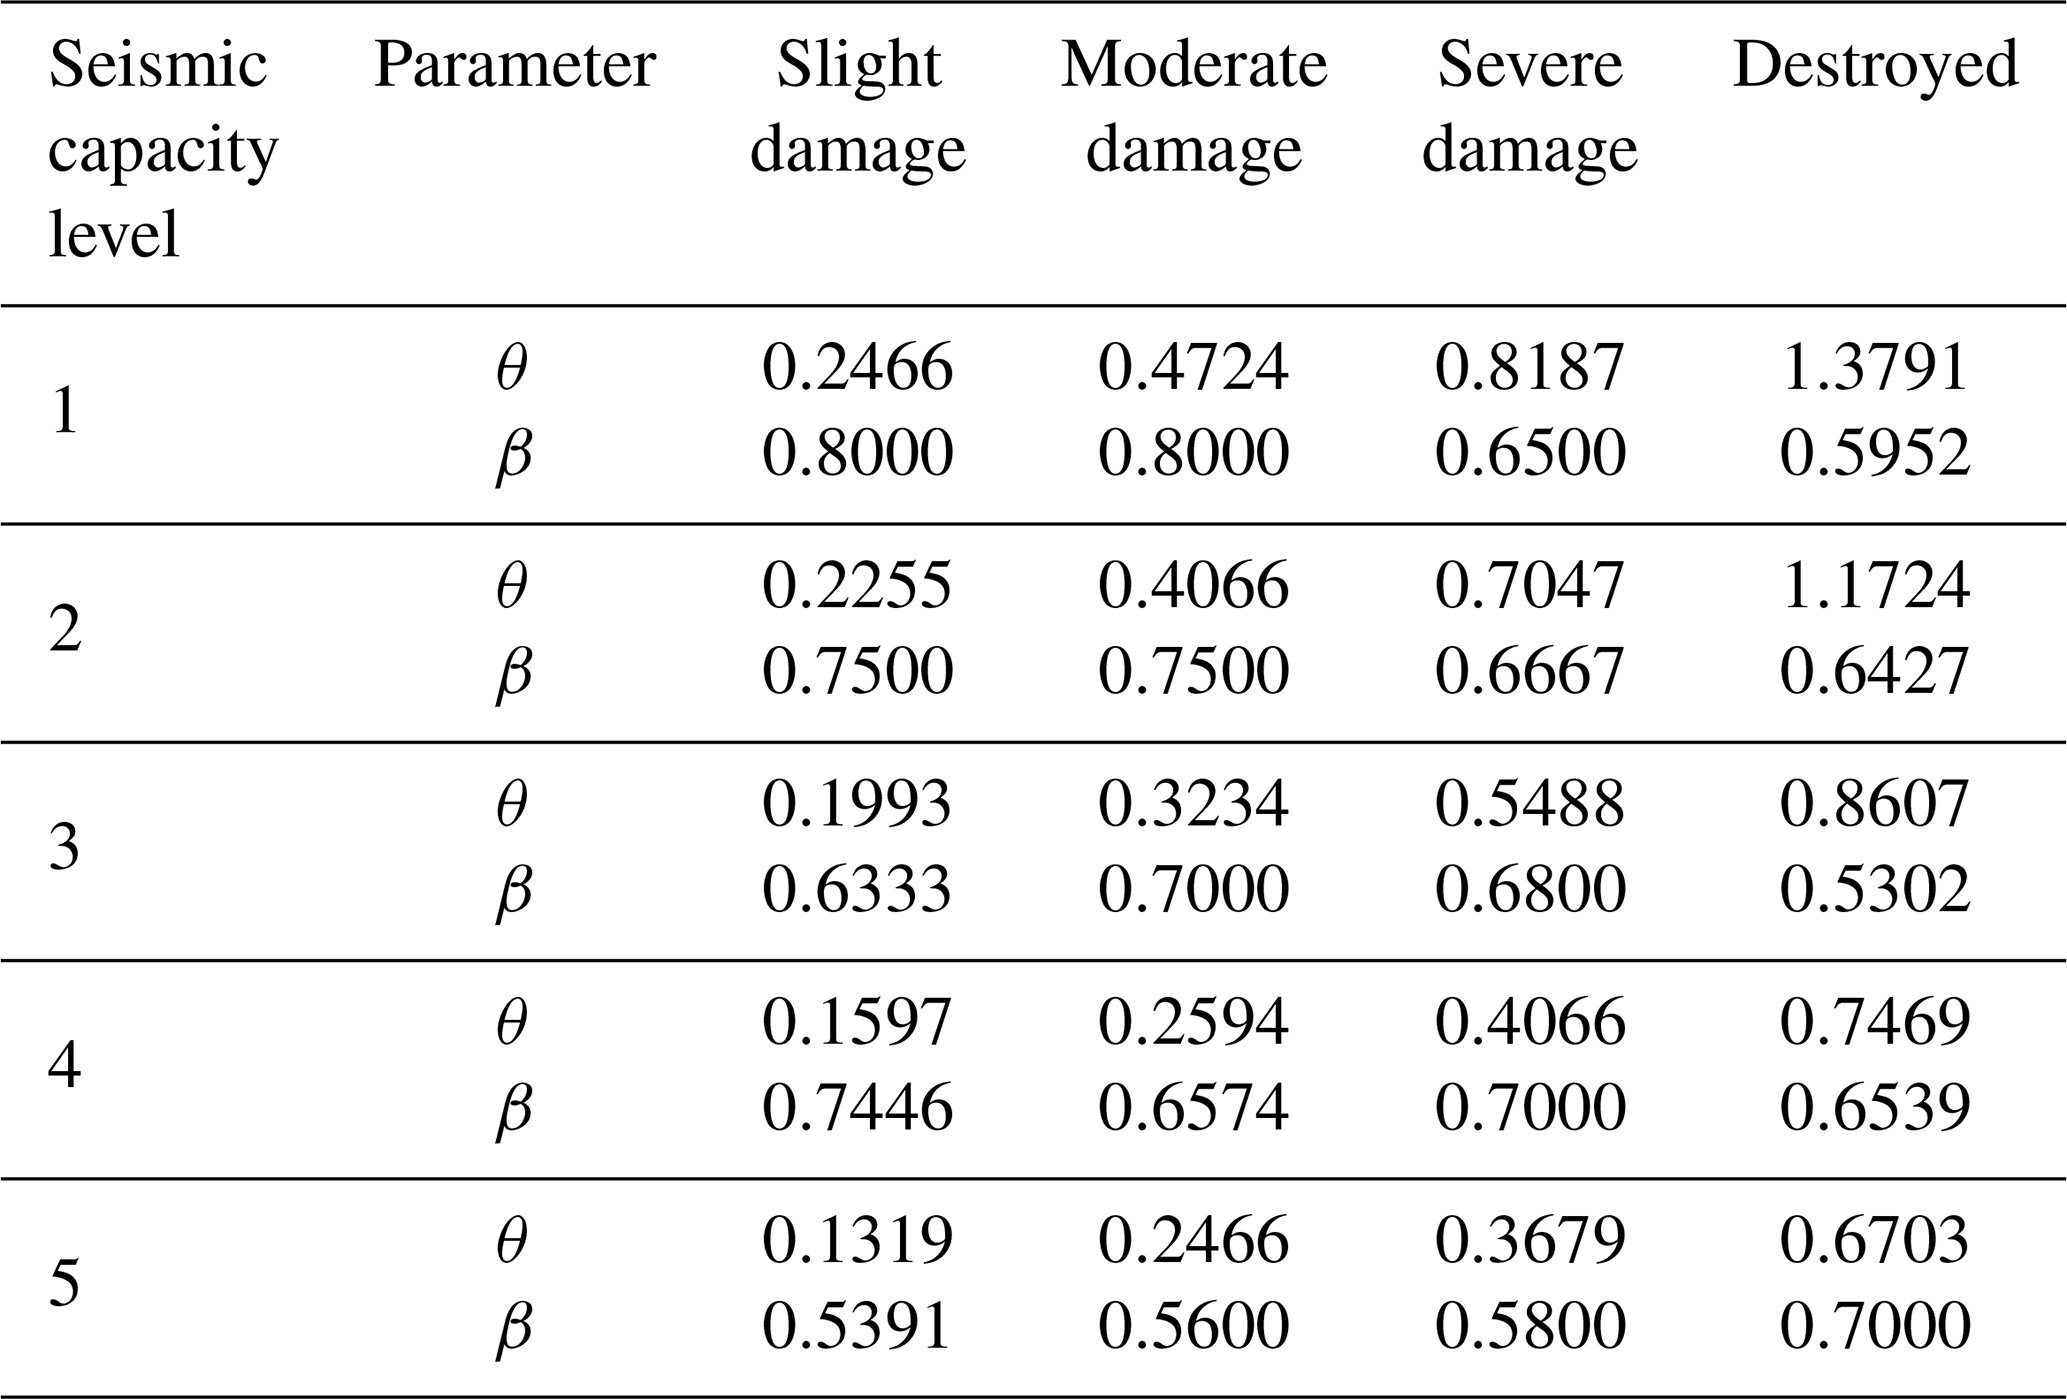
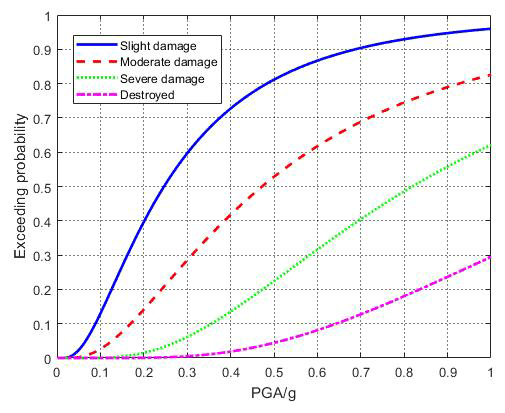
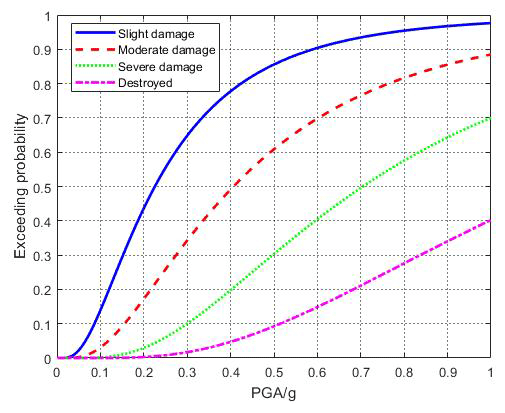
This study established a seismic fragility function model with the input parameter of seismic PGA. The seismic fragility analysis results can generally be represented by the seismic fragility curve or the seismic damage exceedance probability matrix. Therefore, it is necessary to convert the seismic damage matrix based on the PGA into the exceedance probability matrix that reaches or exceeds a certain limit state.
In this paper, the logarithmic normal distribution function model (Chen et al., 2012, 2018) is used as the seismic fragility function Fm(a). Fm(a) is the function of the PGA a:
where a is the PGA; m is the seismic damage level; m=1, 2, 3, 4 and 5 represent damage levels of basically intact, slight damage, moderate damage, severe damage and destroyed, respectively; Φ is the standard normal distribution function; θm is the median value of the seismic fragility curve for the mth damage level; and βm is the logarithmic standard deviation of the seismic fragility curve for the mth damage level.
The probability of being at the mth damage level can be calculated using the following formulas:
The two parameters of the seismic fragility function Fm(a) in Eq. (5), θm and βm, are obtained by first converting from the pipe seismic damage matrix to the exceedance probability matrix and then by fitting using the least squares method.
We use the PE pipe as an example and list the parameters of the seismic fragility function in Table 15. The fragility curves are shown in Figs. 8–12.
Table 15Seismic fragility function parameters of PE pipes under different seismic capability levels.
3.3 Water supply system exposure
Before assessing the seismic risk in the water supply system, it is necessary to know the exposure of the water supply system. The total fixed assets of the water supply system, as the quantitative characteristics of the expected loss caused by the possible earthquake disaster in the region, can represent its exposure. Using the Water Supply Yearbook to collect the total fixed assets of the regional water supply system, it is necessary to know the proportion of water supply network, pool and pump station building assets in the total fixed assets. Based on statistics and analyses from the literature, this study determined that in the water supply system, pipeline assets account for 70 %, pool assets account for 22 % (with clean water pools and water treatment pools each accounting for 50 % of pool assets) and pump station buildings account for 8 % (Fan, 2020; Nong, 2006; China Urban Water Supply and Drainage Association, 2009–2018).
3.4 Comparison with actual earthquake damage losses
When the water supply system encounters a seismic PGA of a, the loss is (Yin and Yang, 2004)
where L(a) is the loss of the water supply system when encountering a seismic peak ground acceleration of a, Ws is the total replacement cost of Class-S water supply system facilities, rms is the loss ratio of Class-S water supply system facilities in the M damage level and Pms(D|a) is the probability of Class-S water supply system facilities experiencing M damage level when PGA is a.
According to the seismic hazard curve of Deyang, combined with the seismic fragility of various facilities of the water supply system and the distribution of the assets of these facilities, 50-year exceedance probabilities of 63 %, 10 % and 2 %, respectively, were predicted, corresponding to the earthquake disaster losses of the water supply system in Deyang when the intensity was VI, VII and VIII. The actual earthquake losses and predicted losses are shown in Table 16.
Table 16Earthquake disaster loss prediction for the Deyang water supply system.
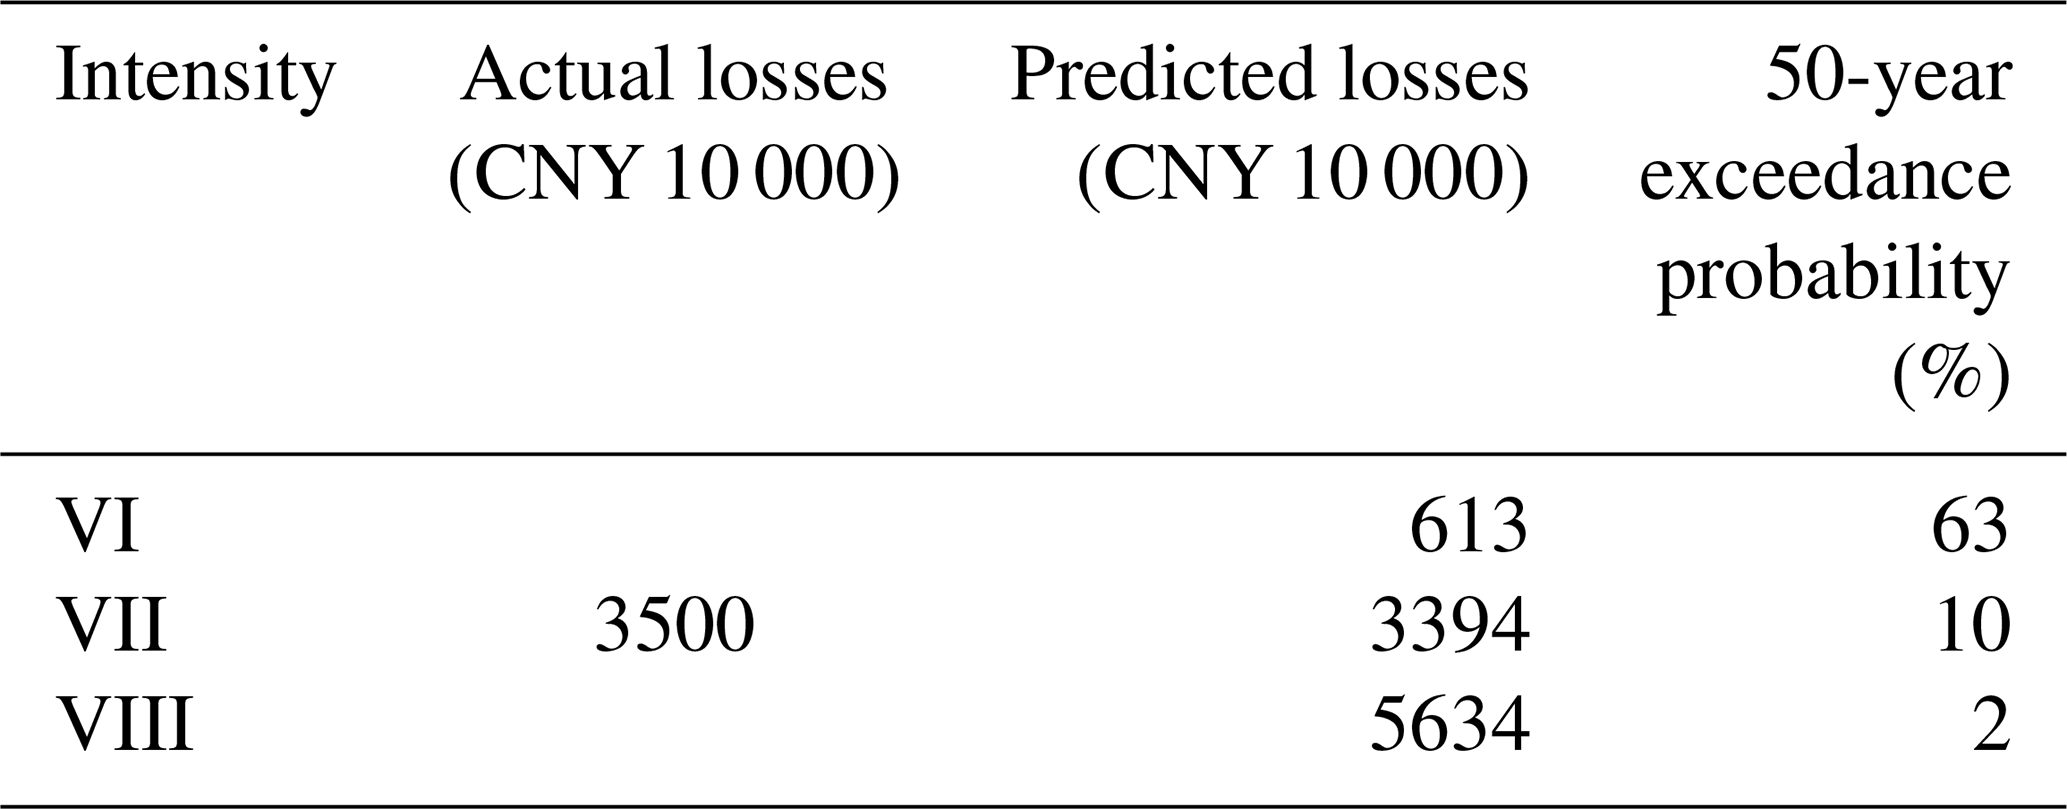
The probability of occurrence of a seismic event of intensity VI and VII in Deyang is 39.24 % and 24.63 %, respectively, which is 1–2 orders of magnitude higher than the probability of occurrence of other intensities. This indicates that the seismic intensity threat in Deyang in the next 50 years is mainly of events of intensity VI and VII. Although the exceedance probability of intensity VI is 63 %, which belongs to the level of frequent seismic motion, the predicted loss for intensity VI is less than that of intensity VII by 1 order of magnitude, and the destructive effect is relatively small. Although the predicted loss for intensity VIII is greater than that of intensity VII, the exceedance probability for intensity VIII is only 2 %, which belongs to the level of rare seismic motion. Therefore, the seismic risk faced by Deyang is mainly the earthquake losses caused by intensity VII. The predicted loss for intensity VII in Deyang is CNY 33.94 million, which is more consistent with the actual loss of CNY 35 million caused by the Wenchuan earthquake. This confirms the reliability of the seismic fragility function proposed in this paper.
Using the seismic hazard analysis method, the seismic fragility model of water supply systems and the distribution of fixed assets introduced in Sect. 2, the expected loss and the expected loss rate of earthquake disasters in a certain area at different timescales were calculated. At the scale of t years in the future, the full probability of the Class-S water supply system facilities experiencing M damage level is
where PDfms is the full probability of Class-S water supply systems facilities experiencing M damage level in t years in the future, Pms(D|a) is the probability of Class-S water supply system facilities experiencing M damage level when PGA is a, and ft(a) is the PDF of PGA at a future t-year scale.
At the scale of t years in the future, the expected loss of water supply system facilities caused by the PGA of various intensities that may occur in the local area is expressed as the sum of the product of direct loss when the Class-S water supply system facilities experience M damage level and the full probability. The calculation model is
where E[Lt] is the expected loss of the water supply system in t years in the future, Ws is the total replacement cost of Class-S water supply system facilities (Class-S total fixed assets) and rms is the loss ratio of Class-S water supply system facilities experiencing M damage level.
For example, let us assume that the probability of a specific damage level occurring at the PGA a of Class-S water supply facilities is Pms(D|a), and this specific damage level is assumed to be m (a total of five damage levels, with a sum of 1 at the same peak acceleration). The economic loss when a specific damage level m occurs is the product of the total asset cost Ws and the loss ratio rms. Due to the fact that under a specific PGA a, the probability of m damage level occurring is not 1, but Pms(D|a). Therefore, under a peak acceleration a, the loss of a water supply facility with m damage level occurring is WsrmsPms(D|a) (Eq. 1). According to seismic hazard analysis, the exceedance probability of PGA a at a certain timescale can be converted into the cumulative distribution probability of peak acceleration a. The PDF ft(a) of the peak acceleration a can be obtained by calculating the first derivative of the cumulative distribution probability function. Due to the fact that the PDF is a continuous function rather than a step function, the probability of the occurrence of peak acceleration a can be considered ft(a)da. For a complete seismic risk assessment, the possibility of the earthquake itself should be considered. The loss caused by damage level m of s-type water supply facilities should be multiplied by the probability of the occurrence of peak acceleration a based on Eq. (1), that is, WsrmsPms(D|a)ft(a)da (Eq. 2). Due to the uncertainty of earthquake occurrence, each peak acceleration a has a certain probability of occurrence. Therefore, Eq. (2) is summed in the direction of acceleration a: . The total expected loss caused by various damage levels and types of water supply facilities is . At the scale of t years in the future, the expected loss of water supply system facilities caused by PGAs of various intensities that may occur in the local area divided by the total cost of resetting the water supply system facilities in the local area is the expected loss rate:
China's capital circle, southern Liaoning, the north–south seismic belt, northwestern Xinjiang, and the Yangtze River Delta and Pearl River Delta regions, as well as most provincial capital cities, have high expected seismic loss rates. The high level of seismicity and the high seismic hazard risk are the main reasons for the high seismic loss expected in Xinjiang and the north–south seismic belt; for the eastern region it is due to the developed economy, the high level of urbanization, the abundant water supply system facilities and the high exposure of disaster-bearing bodies. The high seismic loss expected for the capital circle and the southern Liaoning region is the result of the combination of seismic hazard and the exposure of disaster-bearing bodies. The top 10 cities in descending order of expected loss are Beijing, Kunming, Tianjin, Shanghai, Guangzhou, Guyuan, Shenyang, Chengdu, Ningbo and Xi'an. Among them, megacities, such as Shanghai and Guangzhou, may not necessarily be in seismic hazard areas, mainly due to the large stock of water supply networks in megacities and the high asset value affecting the expected loss. Cities with a high expected loss rate are generally located in seismic hazard areas or have high seismic fragilities and are not only affected by the large stock of water supply networks and high assets. Moreover, the expected loss rate is anticipated to have exponential characteristics, which can be used as a regional seismic risk index to compare the seismic risk between cities.
Considering the difference between the expected seismic loss rate of the water supply system or a certain facility at different timescales due to the seismic hazard probabilities, the 10-year scale (see Figs. 13 and 16) and 100-year scale (see Figs. 15 and 18) standards adopt the 50-year scale for the classification standard of the expected seismic loss rate index.
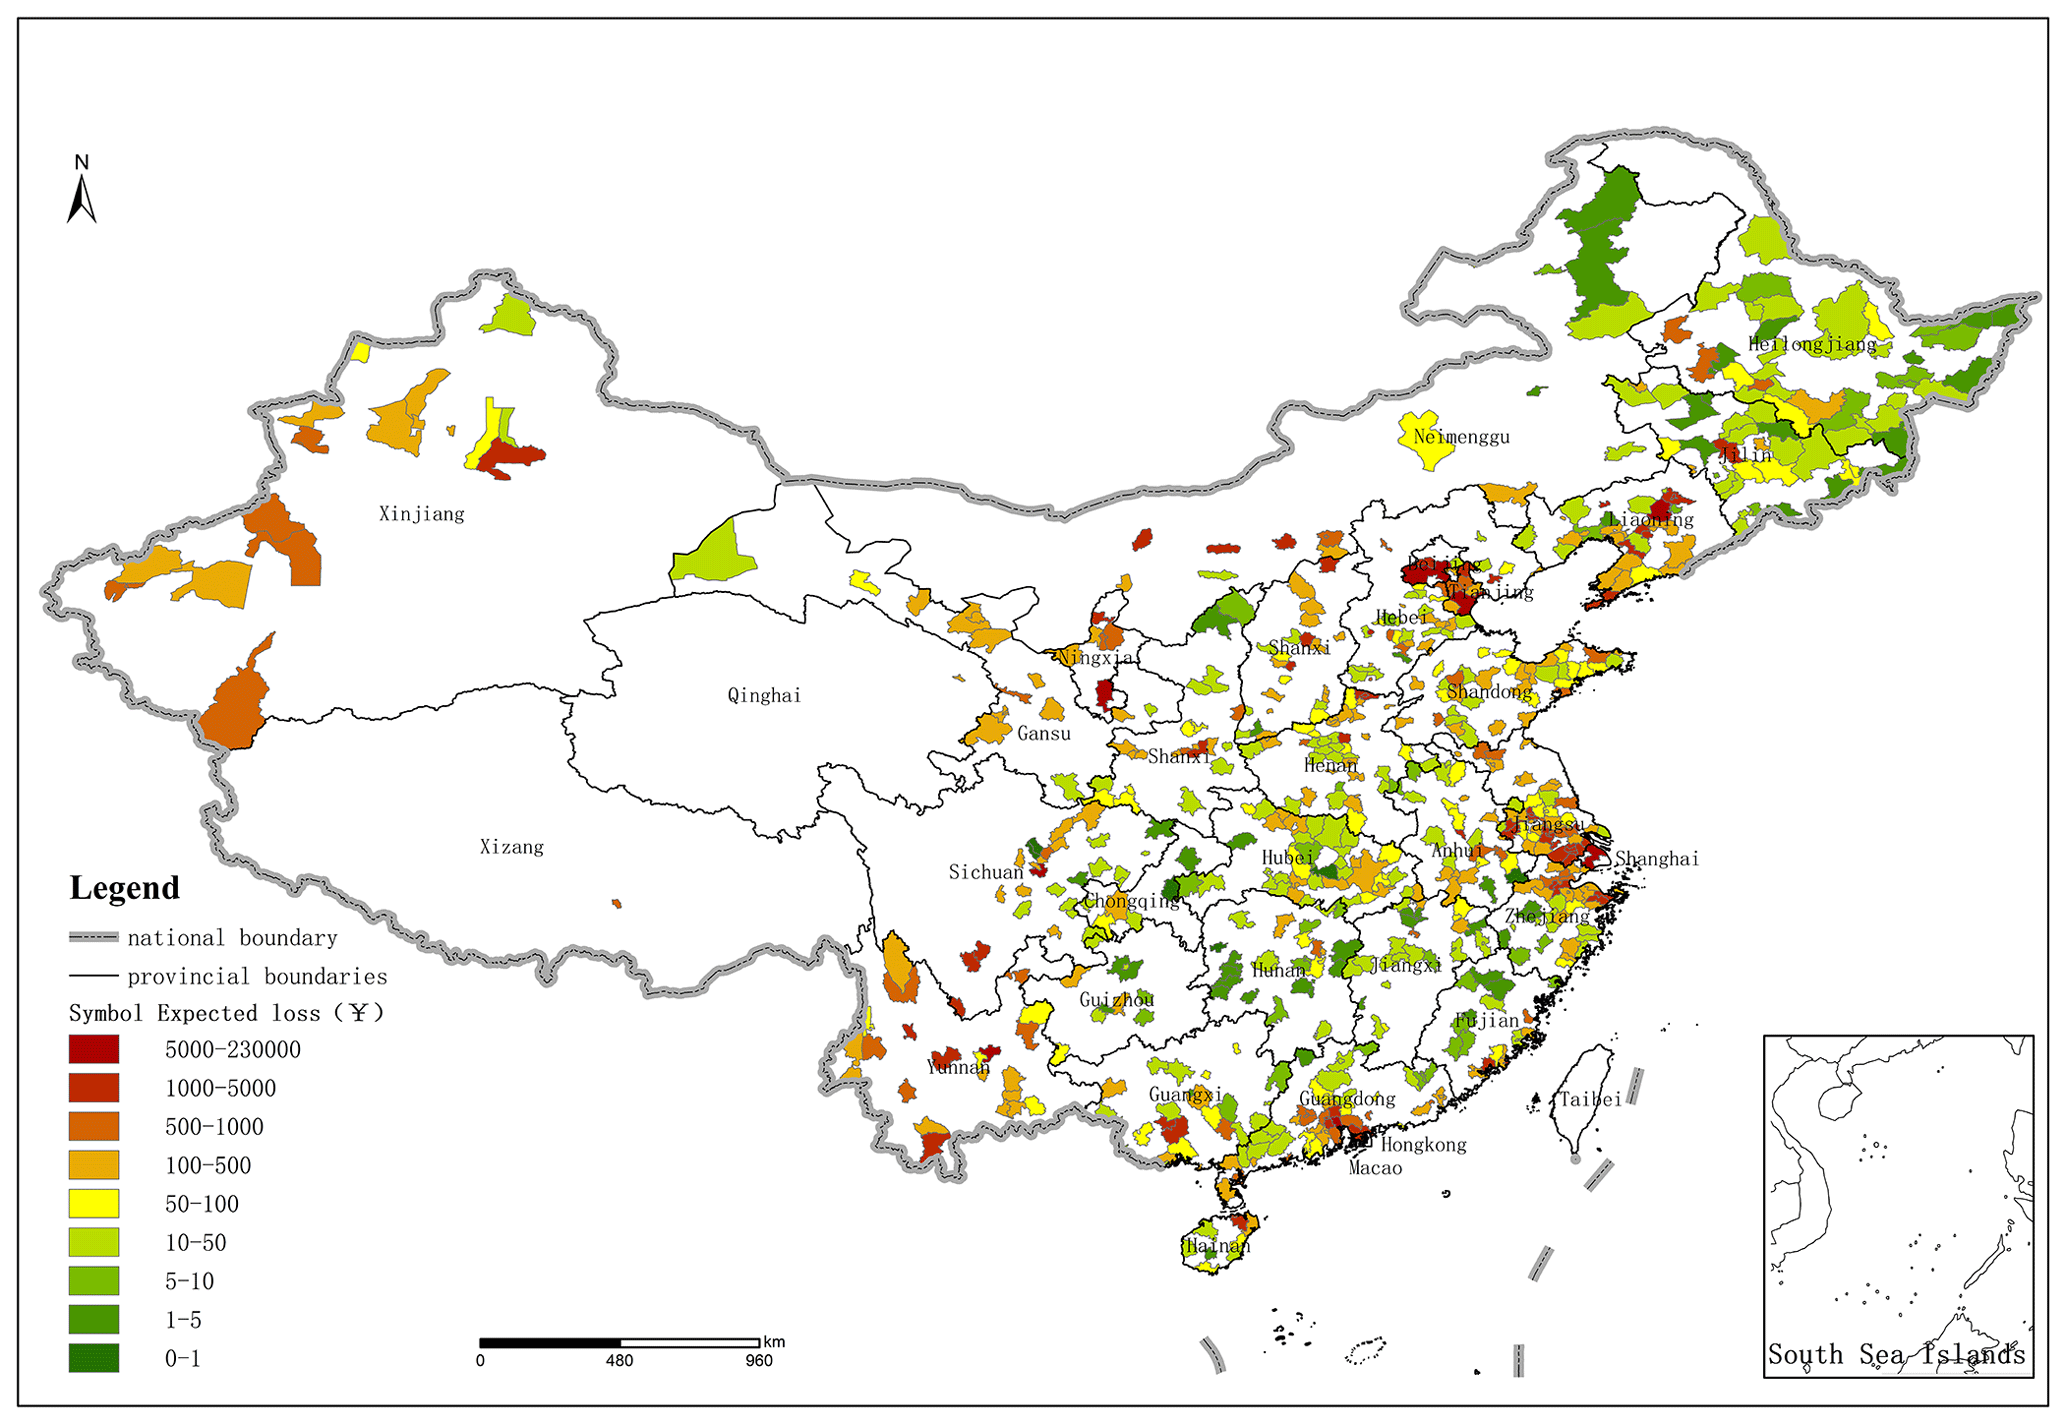
Figure 13Distribution map of 10-year expected seismic loss of the water supply systems in 720 cities in mainland China.
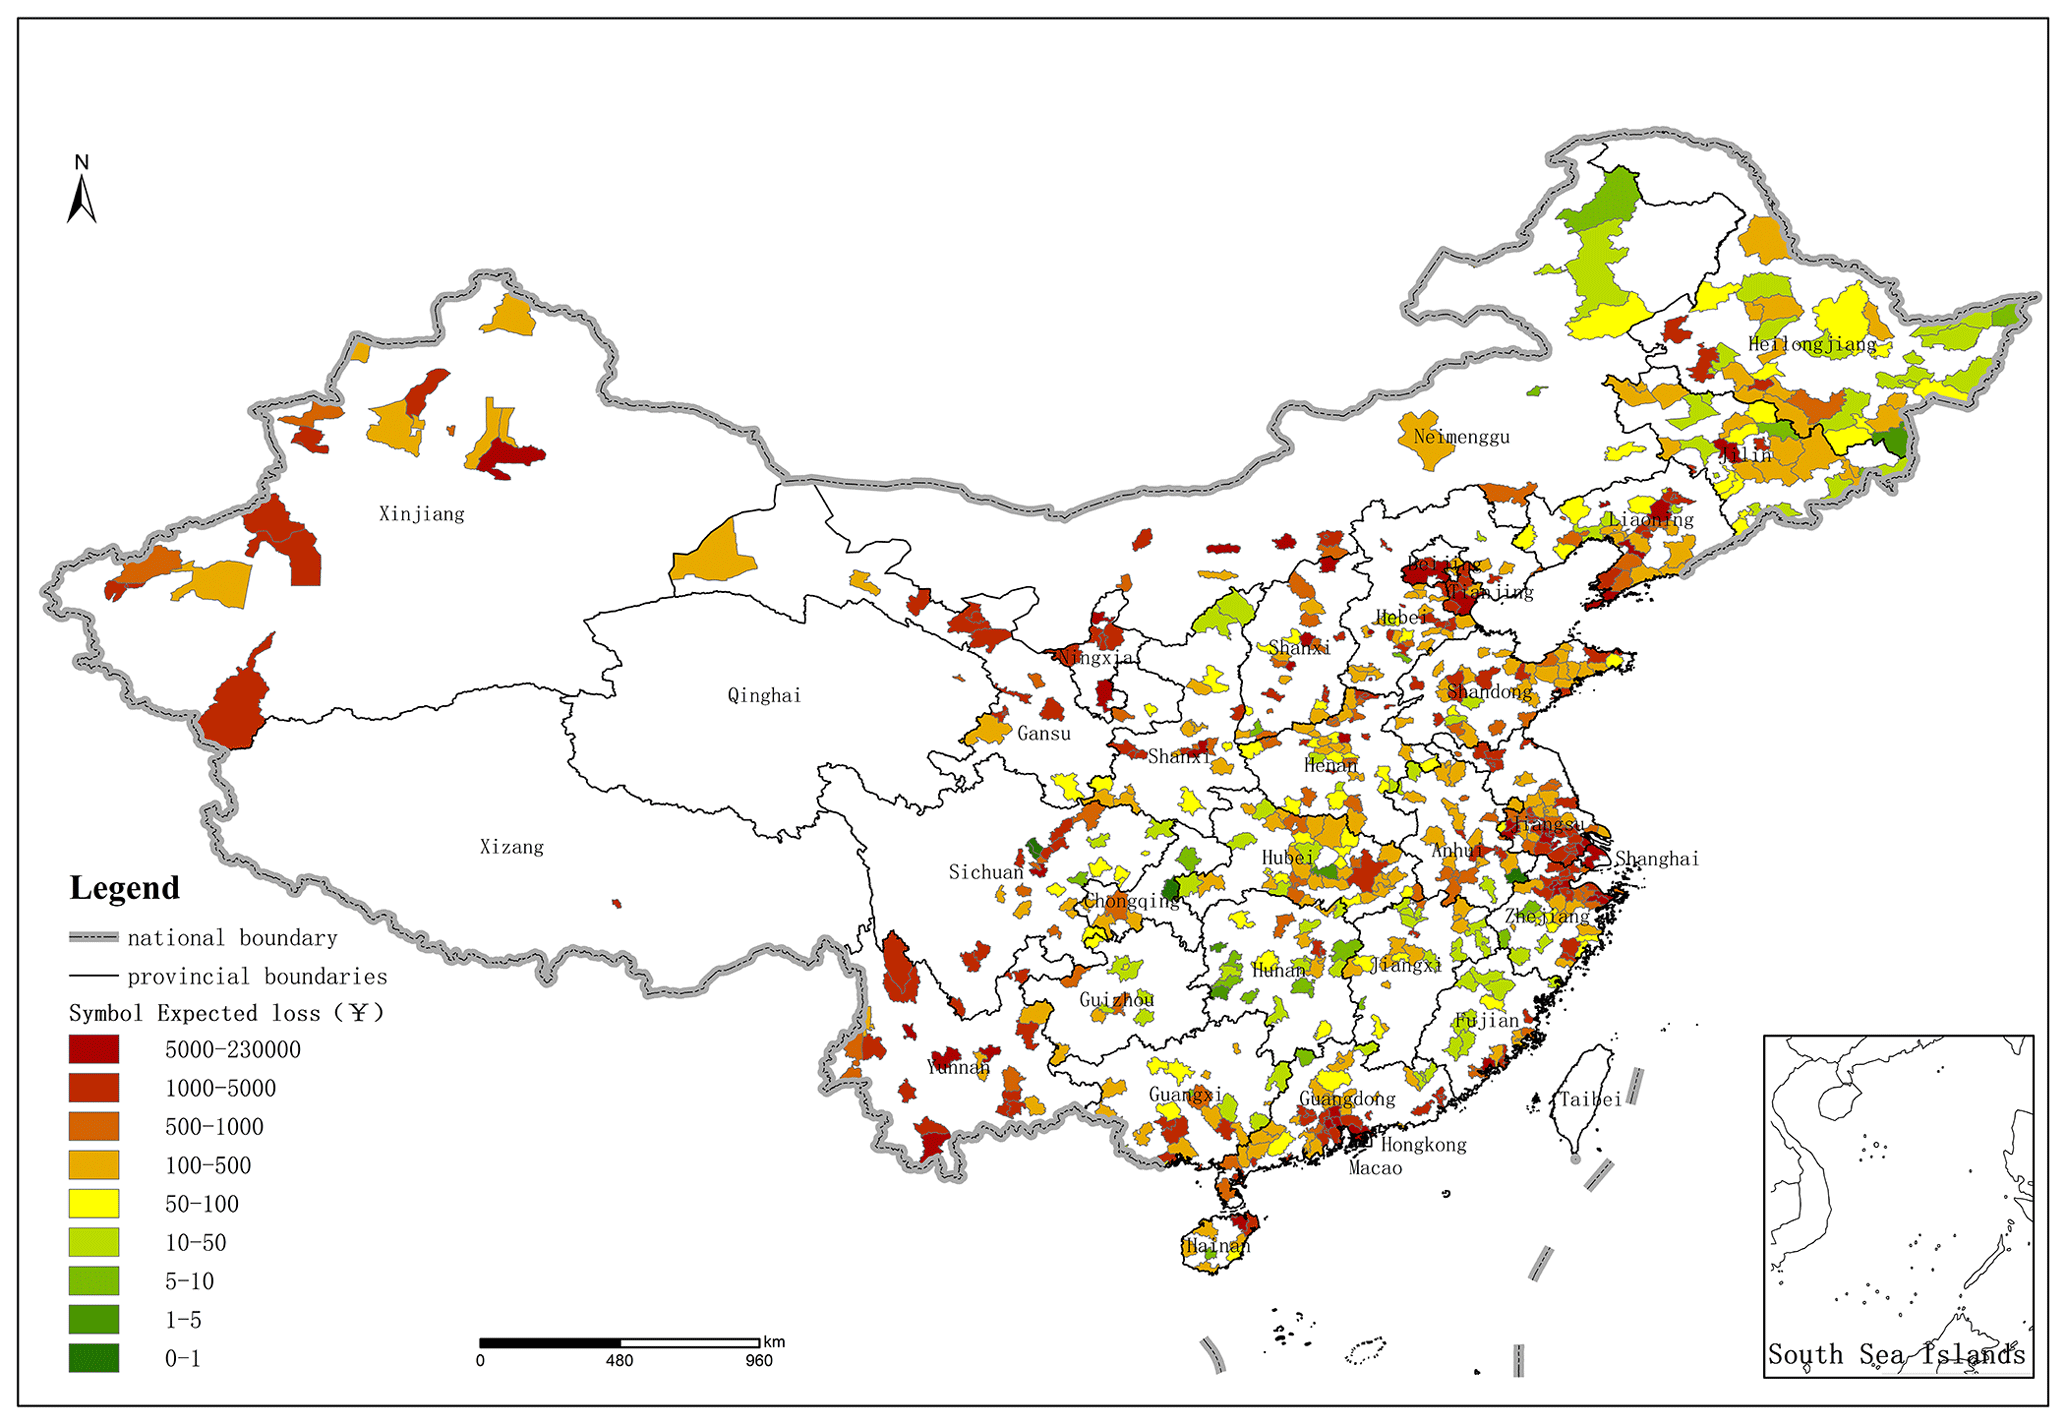
Figure 14Distribution map of 50-year expected seismic loss of water supply systems in 720 cities in mainland China.

Figure 15Distribution map of 100-year expected seismic loss of water supply systems in 720 cities in mainland China.
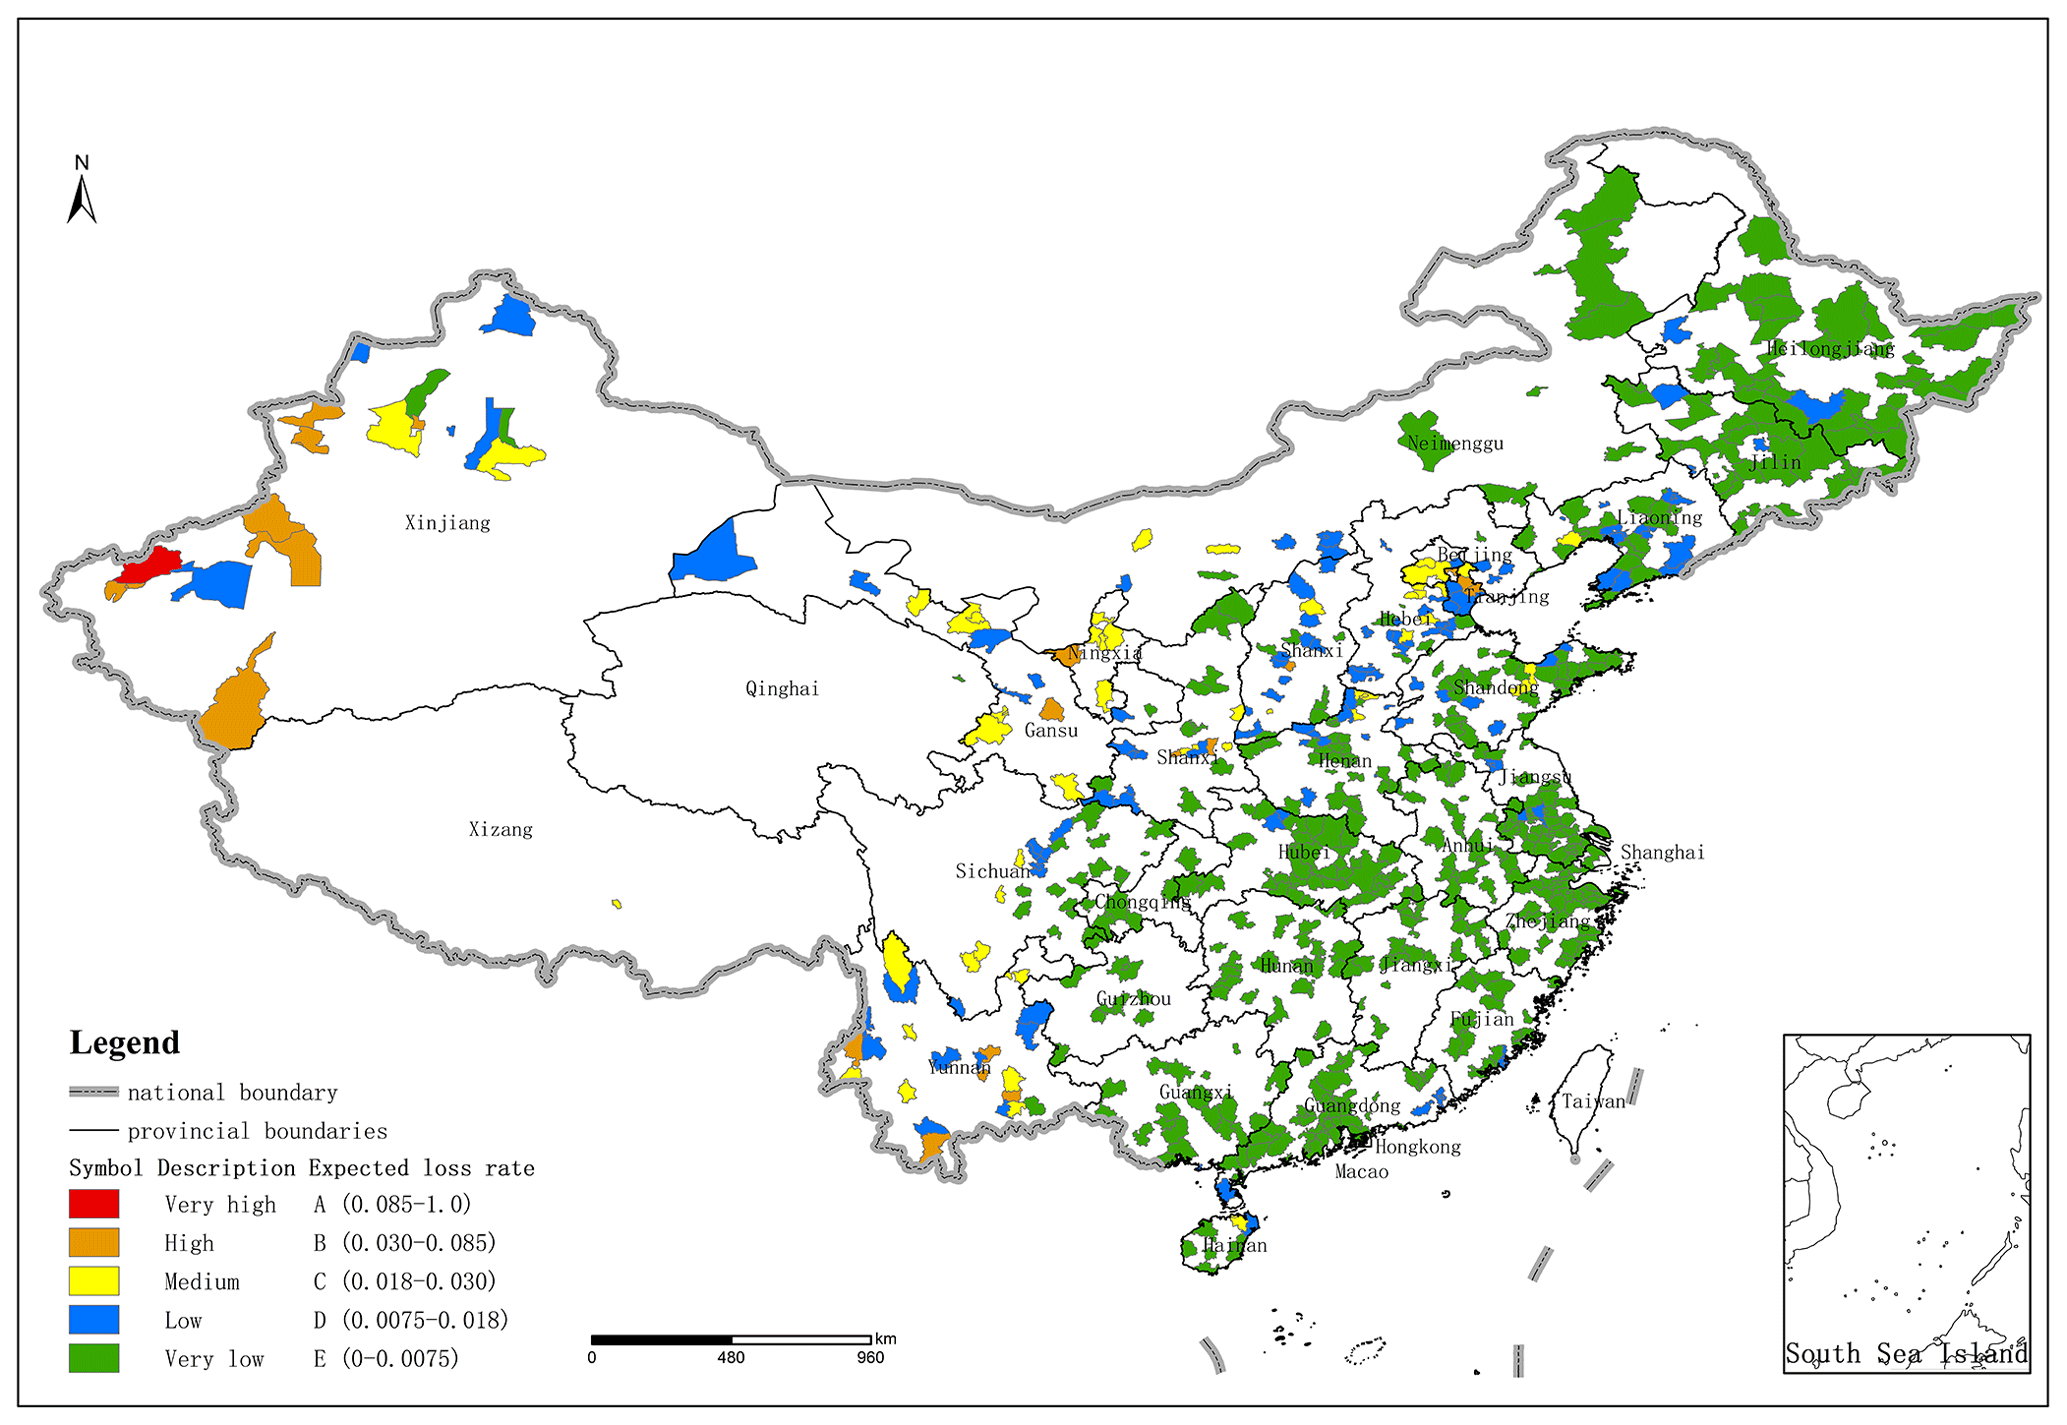
Figure 16Distribution map of 10-year expected seismic loss rate of water supply systems in 720 cities in mainland China.
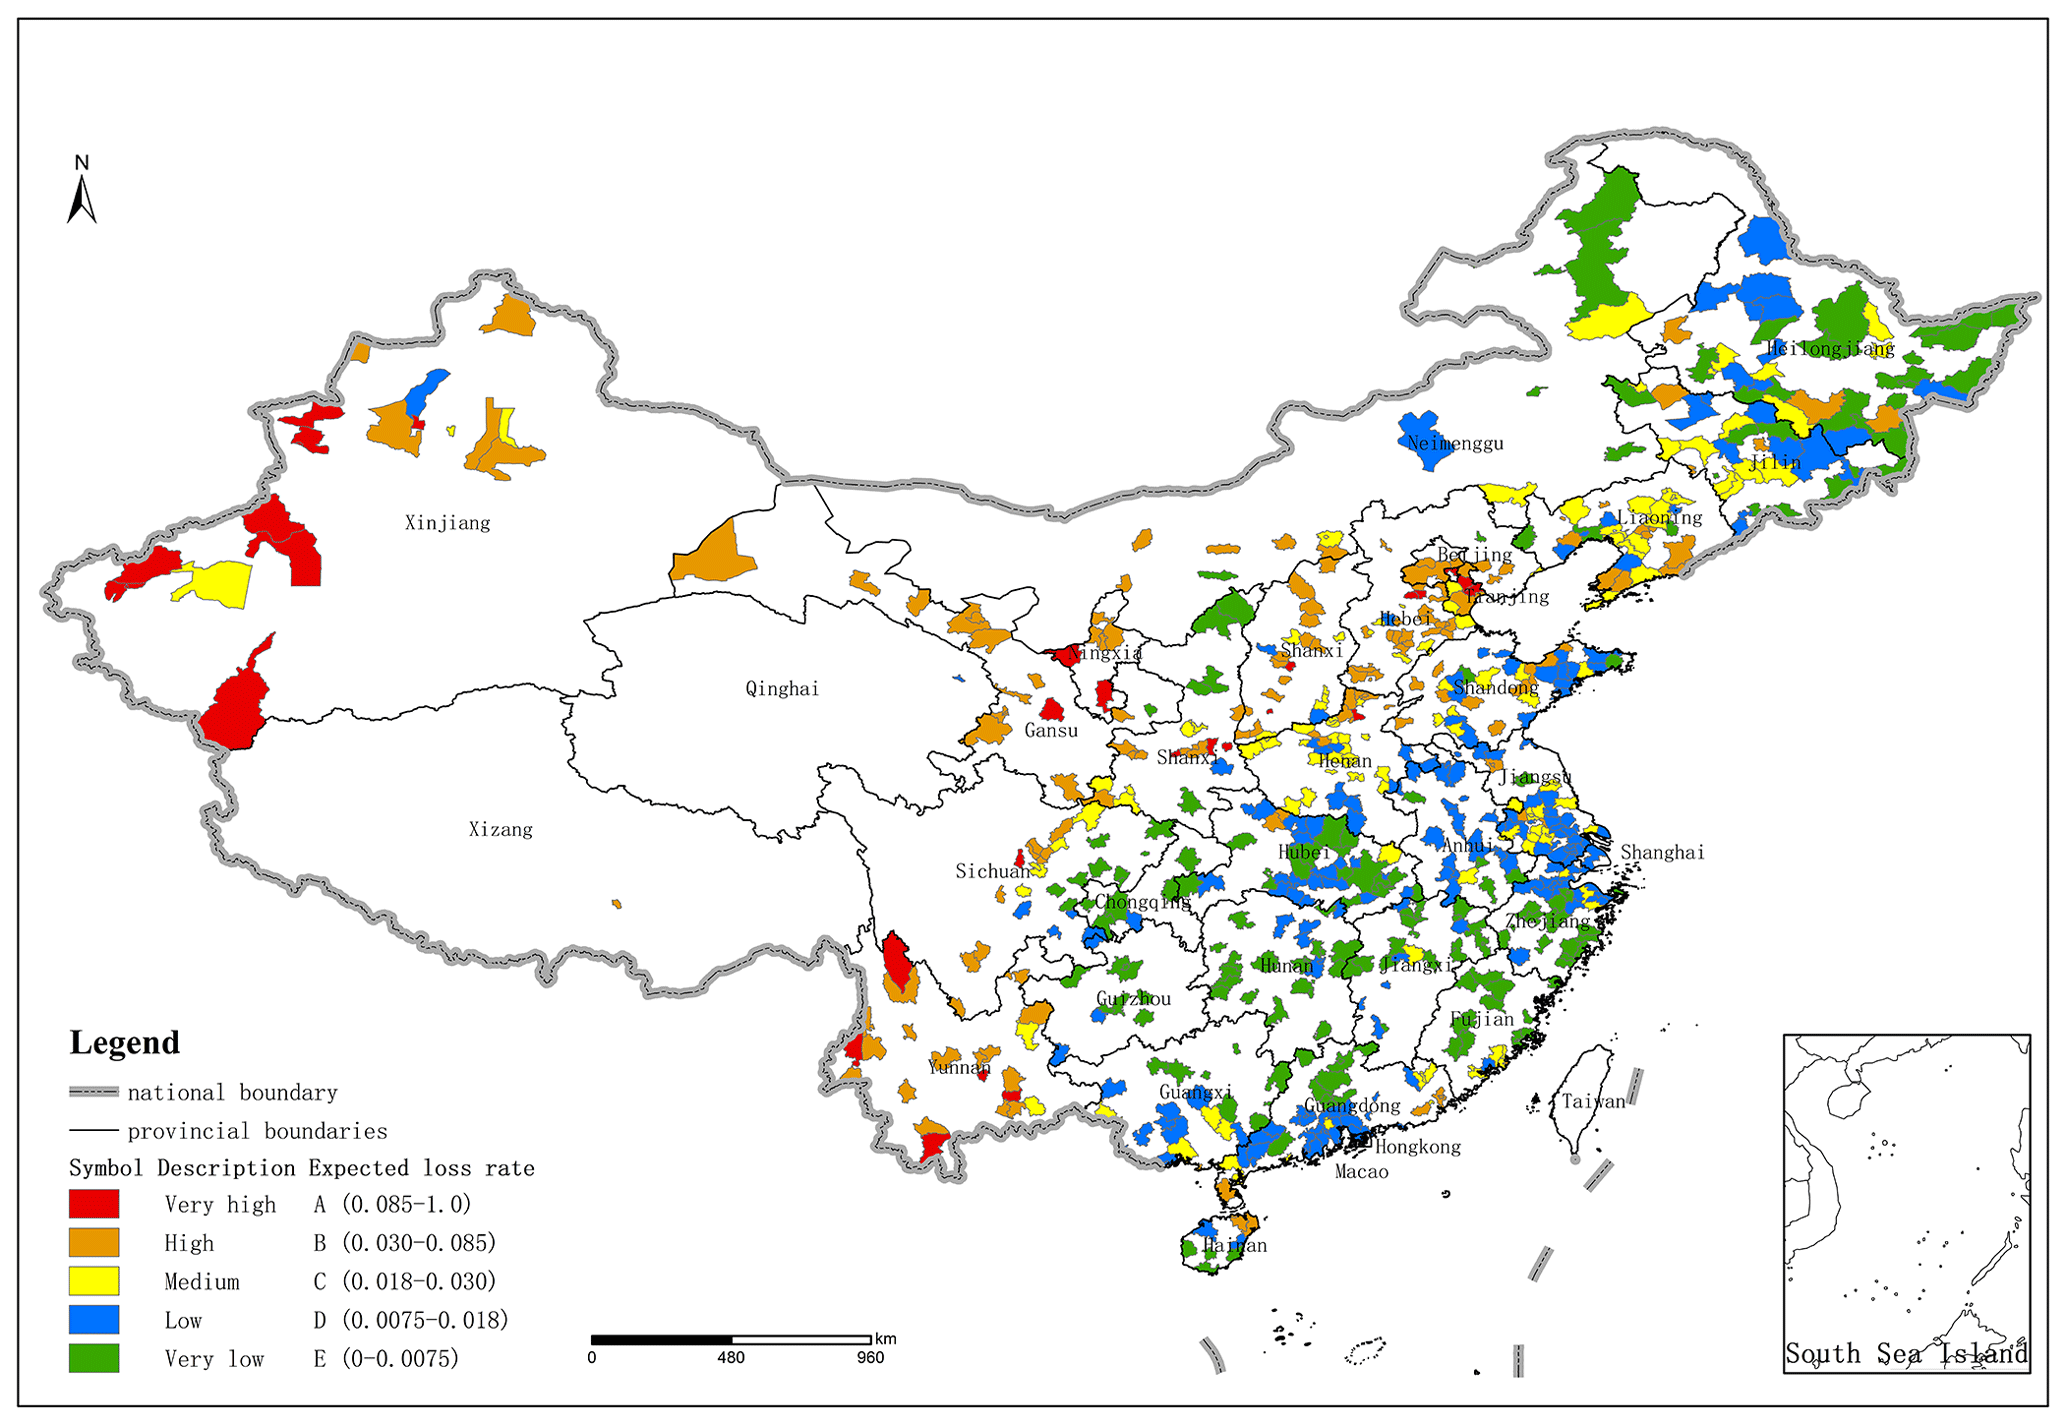
Figure 17Distribution map of 50-year expected seismic loss rate of water supply systems in 720 cities in mainland China.
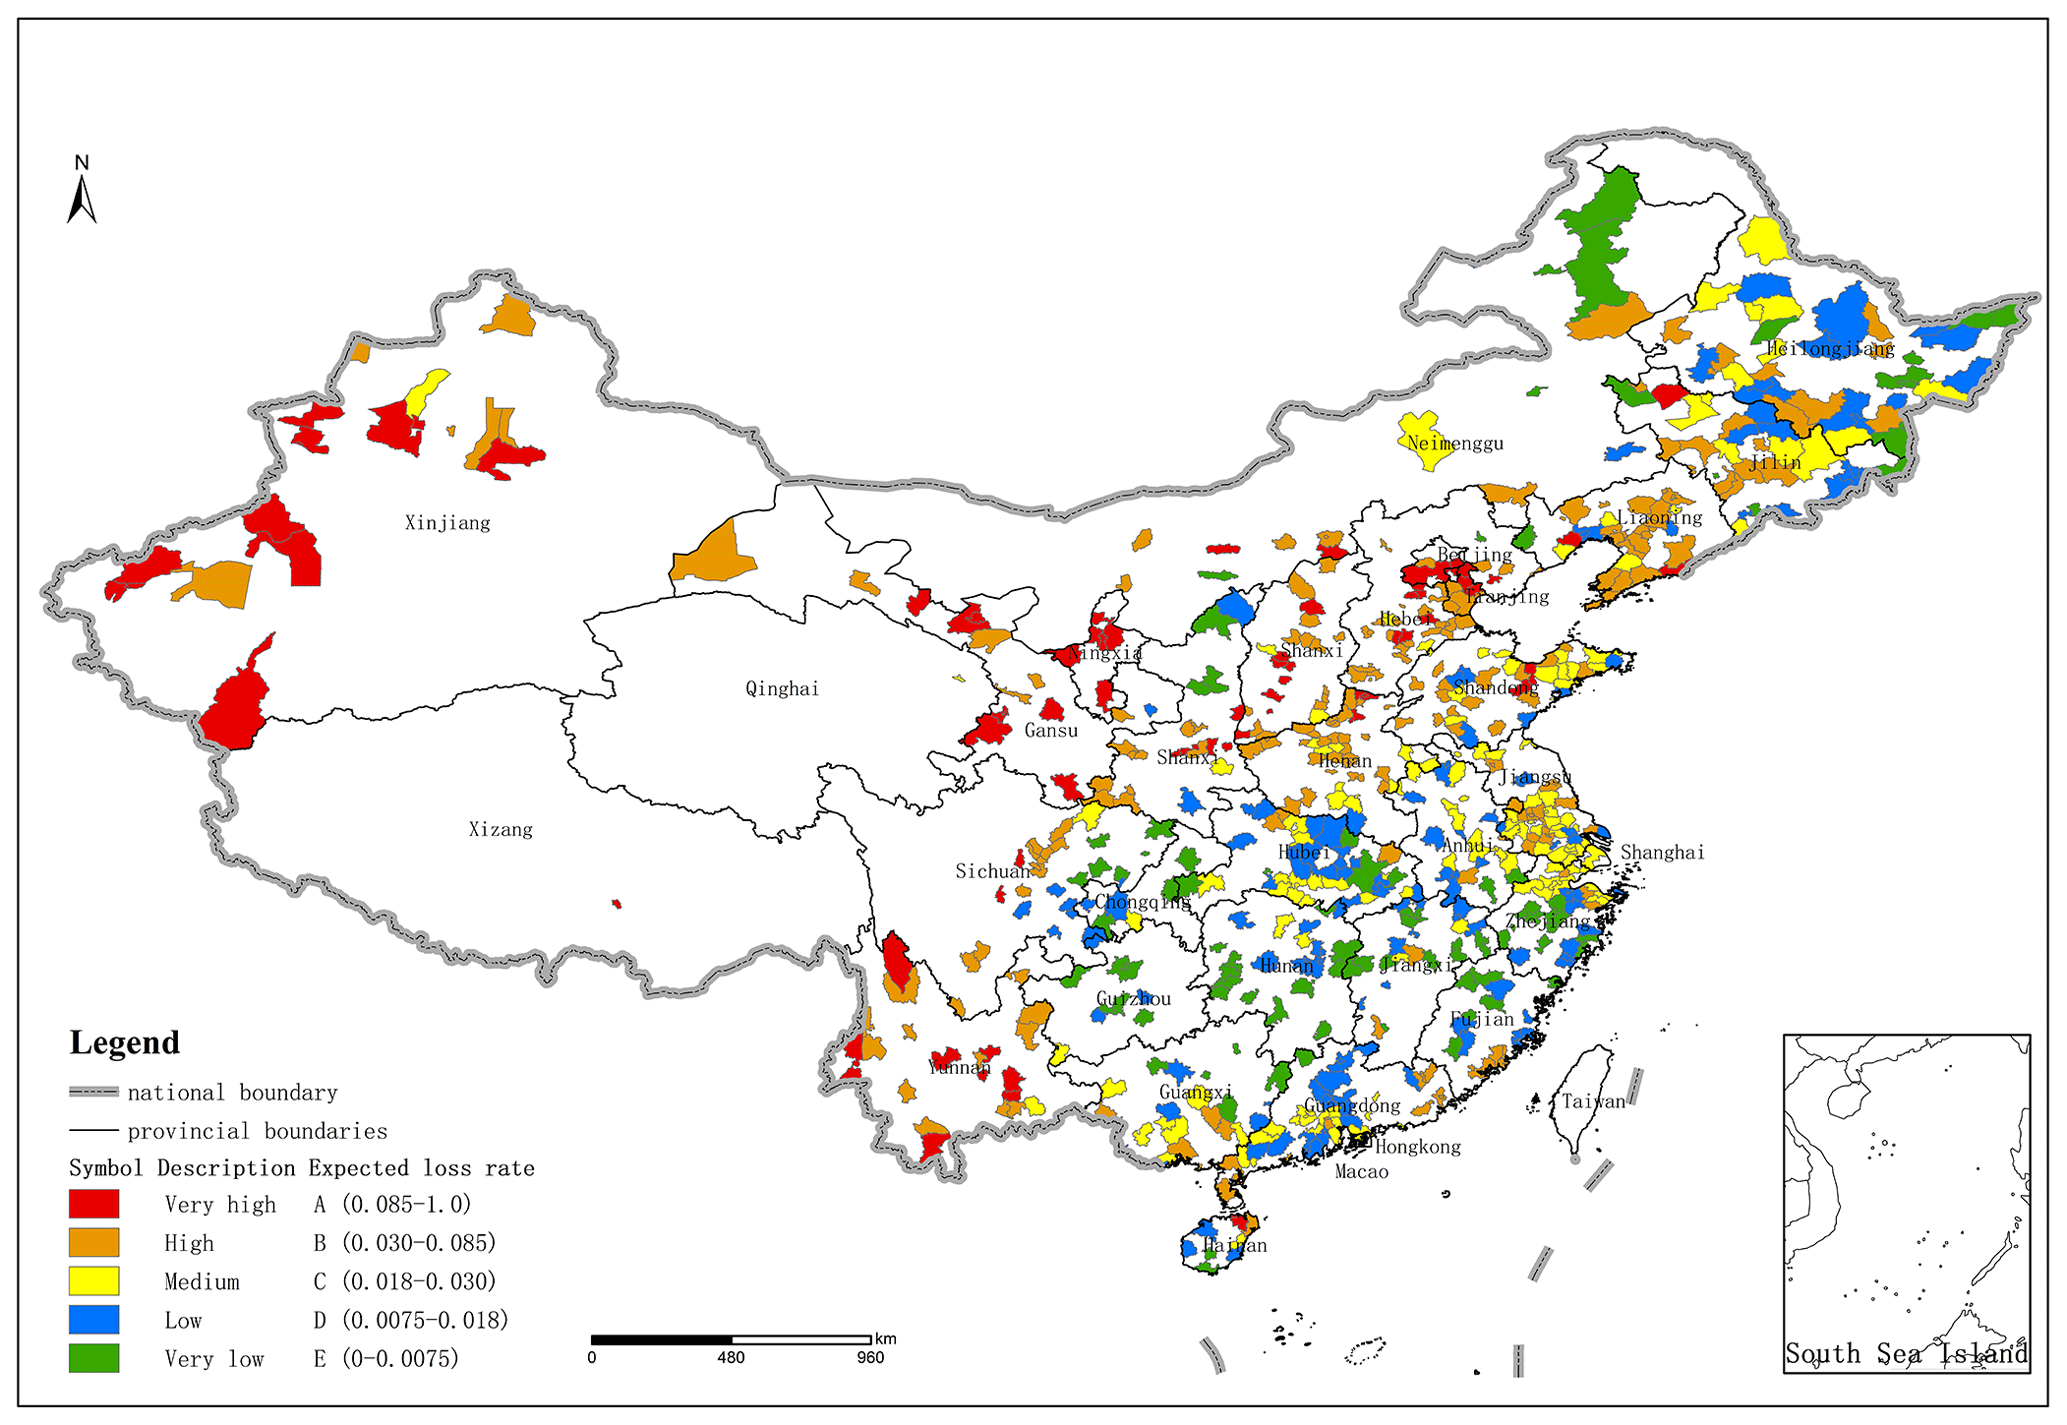
Figure 18Distribution map of 100-year expected seismic loss rate of water supply systems in 720 cities in mainland China.
For the 50-year scale (see Figs. 14 and 17), considering that the expected seismic loss rate of the water supply system is independent, when determining the classification standard of the expected seismic loss rate index of the water supply system, we divided the classification standard of the expected seismic loss rate index of the water supply system according to the principle that the number of cities in all categories accounts for basically the same proportion. The classification standard can be seen in Table 17.
Table 17Classification standard of the expected seismic loss rate index of regional water supply systems.
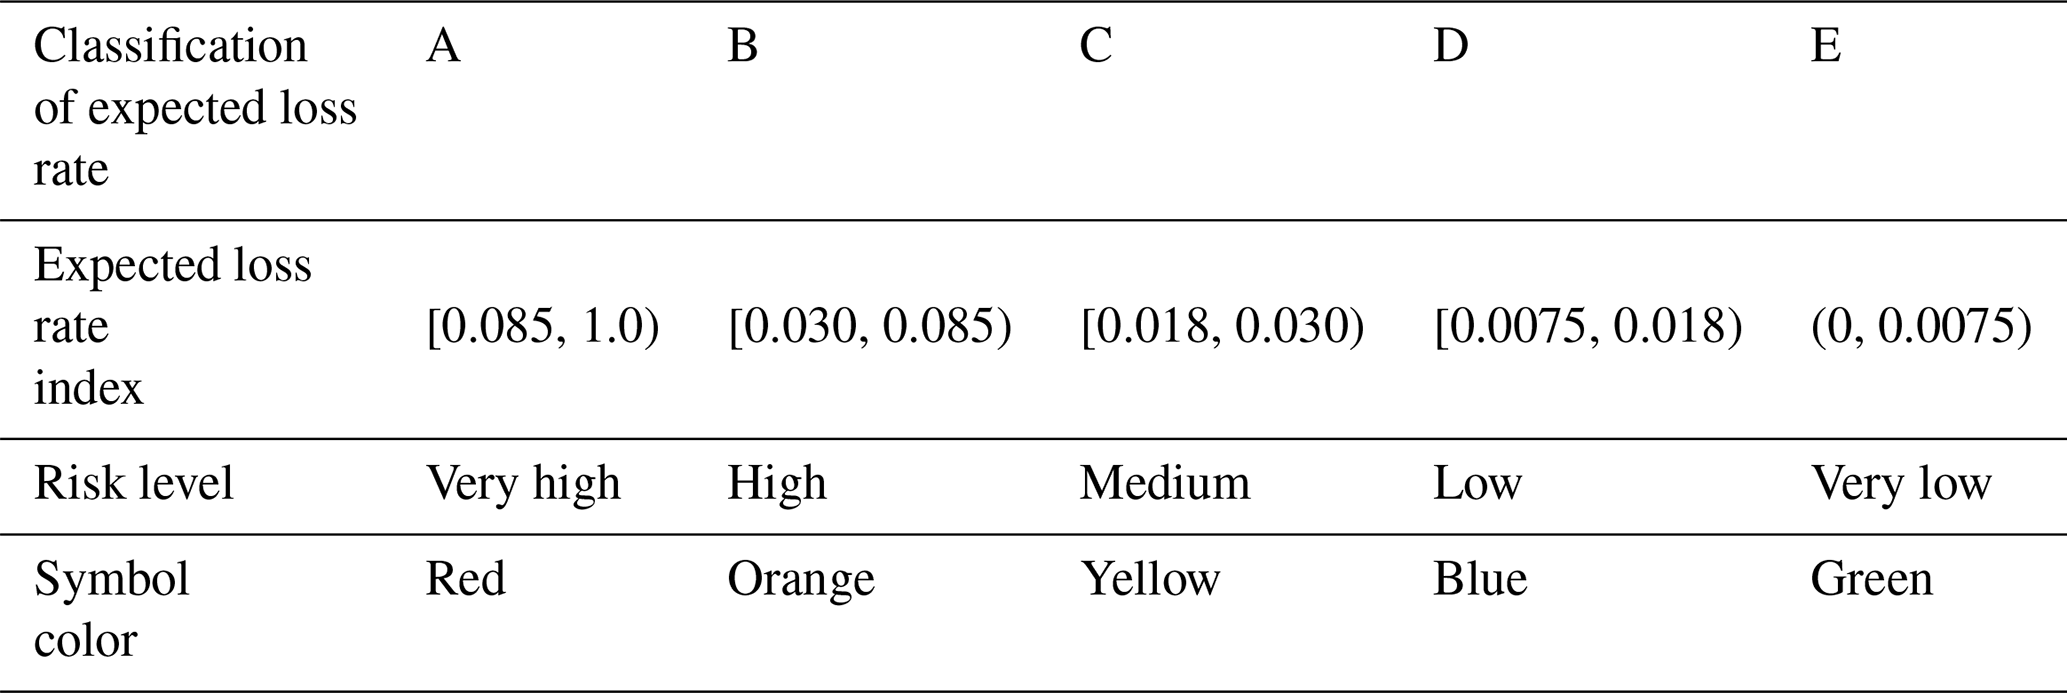
The expected seismic loss rate of the water supply system can be used as the regional seismic risk index to compare the seismic risk between cities, so as to carry out the seismic risk assessment for the regional water supply systems.
Table 18Comparison between the Wenchuan 8.0 magnitude earthquake damage and predicted seismic risk levels.
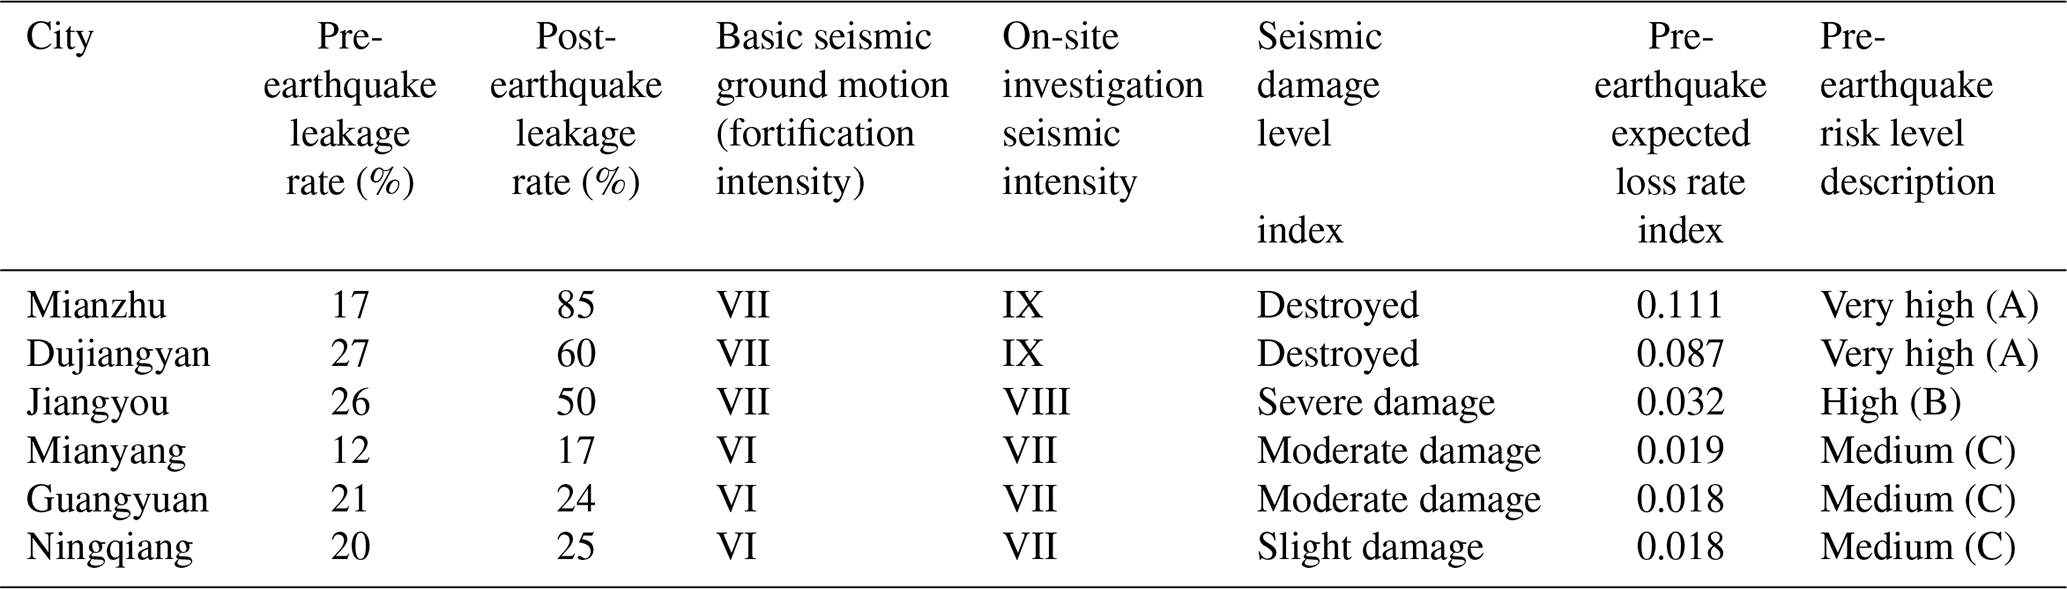
The seismic disaster risk assessment model for water supply systems proposed in this paper is an assessment of the uncertainty of the occurrence of seismic disasters in water supply systems, and model validation should adopt a qualitative approach. This model covers the levels of ground motion at the probability levels of frequent, basic, rare and extremely rare occurrences. Therefore, taking the Wenchuan 8.0 magnitude earthquake that occurred on 12 May 2008 as an example, this study used the model to calculate the expected seismic loss rate and risk levels of water supply systems in five cities in Sichuan Province and one city in Shaanxi Province before the earthquake, as shown in Table 11. For the convenience of verifying the rationality of the model, Table 18 lists the leakage rates of the water supply systems before and after the earthquake, the basic seismic ground motion (pre-earthquake fortification intensity), the on-site investigation seismic intensity, and the evaluated earthquake damage degree (Institute of Engineering Mechanics, China Earthquake Administration, 2009). It can be seen from Table 18 that the post-earthquake on-site investigation intensities of the listed cities are to varying degrees greater than the pre-earthquake fortification intensities. Among them, the post-earthquake intensity of Mianzhu and Dujiangyan exceeded the pre-earthquake intensity by 2°, and the pre-earthquake predicted seismic risk levels are the highest (Grade A). The post-earthquake intensity of Jiangyou, Mianyang, Guangyuan and Ningqiang exceed the pre-earthquake intensity by 1°. The pre-earthquake predicted seismic risk levels are Grade B and Grade C, although they are lower than that of the first two cities; however, they are still at high and medium risk levels, respectively. In addition, cities with a predicted seismic risk level of A for water supply systems before the earthquake correspond to the earthquake intensity of “IX” and the earthquake damage level of “destruction” surveyed on site after the earthquake. Cities with a seismic disaster risk level of B correspond to the seismic intensity of “VIII” and seismic damage level of “severe damage” in the post-earthquake on-site investigation. Cities with a seismic disaster risk level of C correspond to the seismic intensity of “VII” and the seismic damage level of “moderate damage” or “slight damage” according to the on-site investigation after the earthquake. The validation results indicate that the proposed risk model for the water supply systems can accurately predict the level of seismic risk faced by urban water supply systems in China.
In order to illustrate the rationality of the classification of the expected seismic loss rate index of the water supply systems in mainland China, the research results of China's seismic hazard and key monitoring and defense areas from 2006 to 2020 (Wang et al., 2006) are introduced. The key hazard areas and seismic damage prediction results are the main basis for determining the key monitoring and defense areas in China from 2006 to 2020. The key monitoring and defense areas are determined based on a comprehensive consideration of the earthquake situation, disaster situation and social development. Among them, the prediction results of earthquake-related loss of life and economic losses are the most important basis for determining the key monitoring and defense areas.
As shown in Fig. 19, the country is divided into four seismic hazard areas and key monitoring and defense areas (areas surrounded by the blue line in the figure): 1 represents north China (Beijing, Tianjin, Hebei, Shanxi, southern Liaoning); 2 represents the north–south belt (Gansu, Qinghai, Ningxia, Shaanxi, Sichuan, Yunnan); 3 represents the northwest region of Xinjiang; 4 represents the southeast coastal region (Fujian–Guangdong border area, the Taiwan Strait, city of Haikou, Hainan Province).
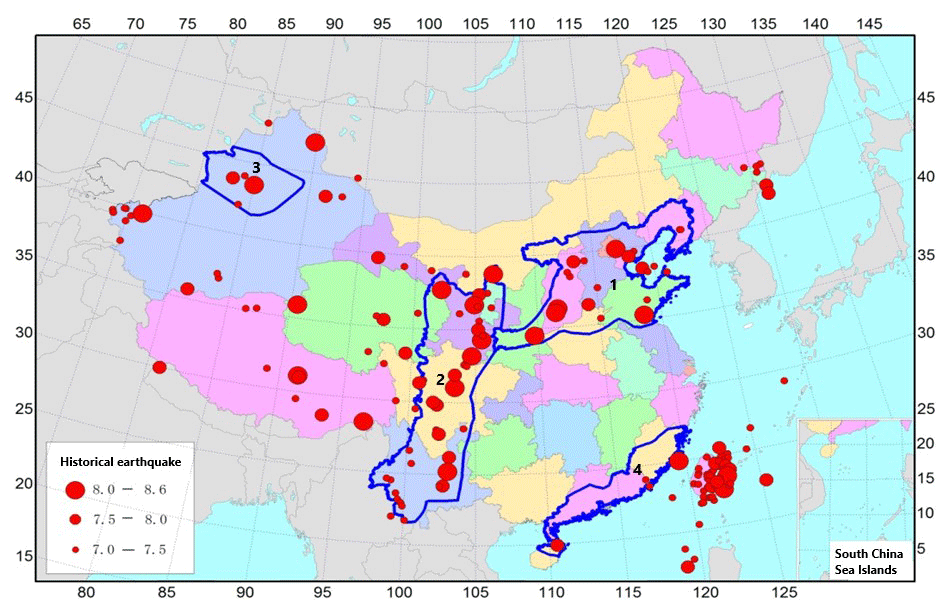
Figure 19Seismic hazard and key monitoring and defense areas in China from 2006 to 2020.
The expected loss rate index and seismic risk levels of the water supply systems are relatively high in the four seismic hazard and key monitoring and defense areas mentioned above. This result is consistent with the research results of seismic hazard and key monitoring and defense areas in China from 2006 to 2020. As shown in Fig. 19, because the above areas are located in the seismic zone, seismicity is frequent and the seismic hazard is high.
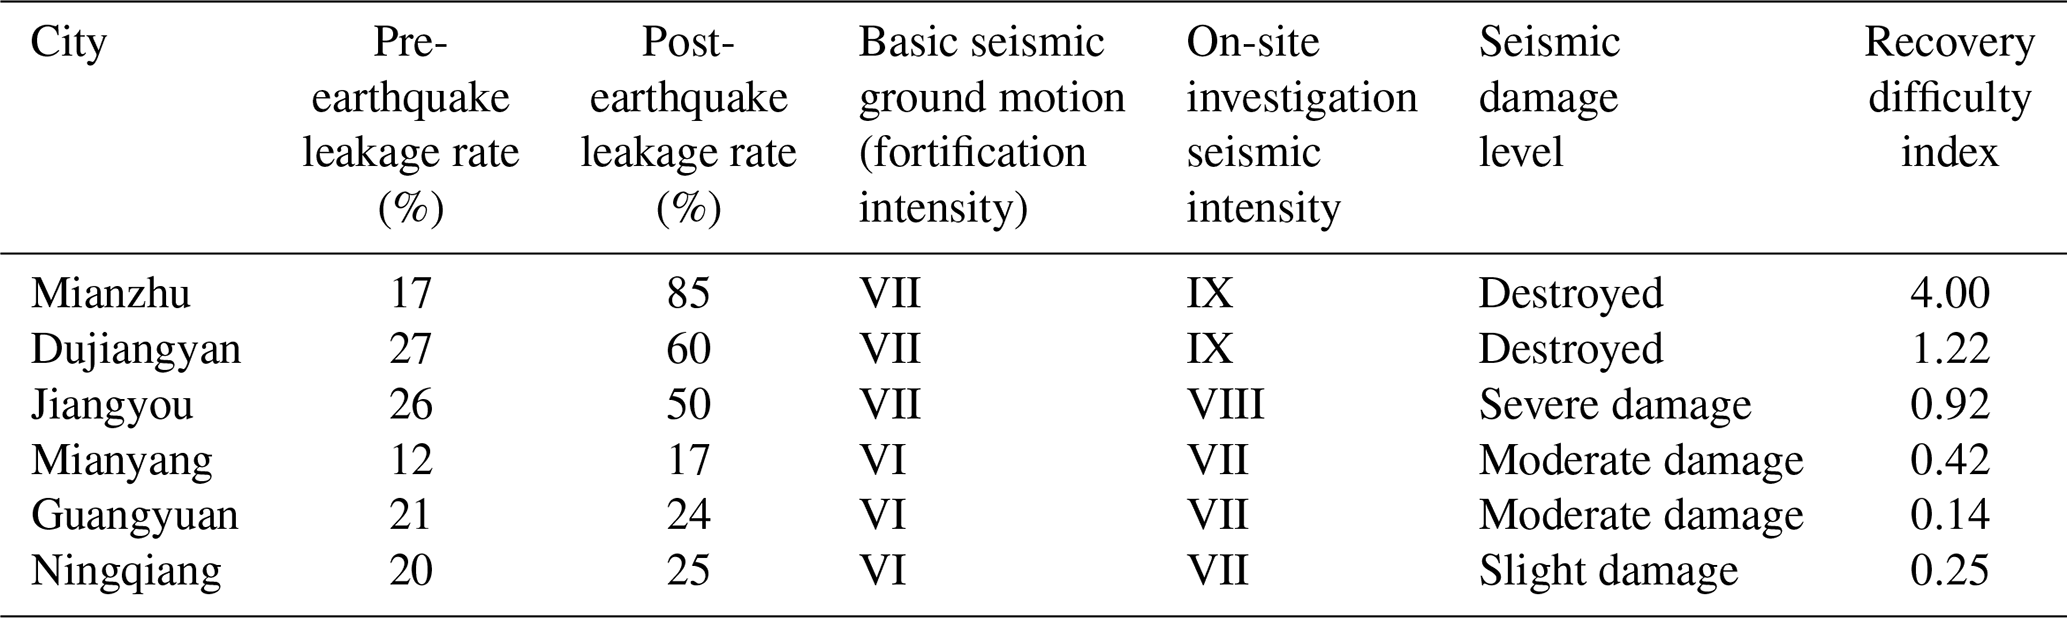
In terms of the research on the resilience of post-earthquake water supply networks, this paper introduced the concept of recovery difficulty to evaluate the resilience of water supply networks after earthquakes. The recovery difficulty index can be calculated as follows:
where QLa is the post-earthquake leakage rate (%) and QLb is the pre-earthquake leakage rate (%).
This indicator has low requirements for the completeness of statistical data in practical operation, and therefore it has practical engineering value. The changes in the leakage rate of water supply pipelines before and after an earthquake can reflect the damage situation of the pipeline network. The greater the leakage rate of the pipeline network after an earthquake, the more severe the damage to the pipeline network and the greater the difficulty of recovery.
It can be seen from Table 19 that Mianzhu and Dujiangyan – where the seismic intensity was 9, the network fortification intensity was 7 and the water supply network damage level was destroyed – were the most difficult to recover. Second was Jiangyou, with a seismic intensity of 8, network fortification intensity of 7 and water supply network damage level of severe damage. The seismic intensity of Mianyang, Guangyuan and Ningqiang was 7, and the seismic fortification intensity of the networks was 6; the difficulty of recovering the water supply networks after the earthquake was relatively low.
Table 19Damage and recovery difficulty index of water supply networks in the Wenchuan earthquake.
This paper proposed an assessment model based on the expected loss and expected loss rate for seismic risk assessment of water supply systems in mainland China. This model solves the different needs of government sectors for the assessment of seismic risk levels in the water supply system and provides technical support for the risk zonation and risk mapping of earthquake disasters in the water supply system. The specific conclusions obtained through this study are as follows:
-
Based on multi-source basic data such as an urban industry yearbook, seismic zonation, seismic code, population GDP and historical earthquake damage data, a basic database for seismic risk assessment of 720 urban water supply systems in mainland China was established. The PDFs of PGA were calculated by using the seismic hazard analysis method, and the parameters of the seismic risk curves of 720 cities were calculated. The seismic damage matrix of pipelines and facilities was obtained based on the actual seismic damage through statistical analysis, and the seismic fragility curves of various facilities in the water supply system were given based on the logarithmic normal distribution model.
-
The risk index of earthquake disasters is the result of the joint action of earthquake occurrence probability, vulnerability and exposure. The expected seismic loss rate index is used as the seismic risk assessment index to evaluate the water supply systems. The grading evaluation criteria of the risk index (A–E) were established, and the distribution maps of expected seismic loss and the classification maps of the expected loss rate index of 720 urban water supply systems in mainland China in the medium term and long term were given.
-
According to the conclusion that the region where the cities with risk levels of A and B are located is more consistent with the research results of China's seismic hazard and key monitoring and defense areas from 2006 to 2020, the seismic risk assessment of regional water supply systems is highly correlated with the medium- and long-term earthquake prediction results, which is suitable for medium- and long-term risk assessment and verifies the rationality and applicability of the model proposed in this paper. In particular, we should strengthen the prevention and control of seismic risk in key cities in north China, northwest China, southwest China and southern northeast China, and improve the seismic capacity of water supply systems and facilities in these key risk cities.
The datasets used in the study were derived from the following resources available in the public domain: Communiqué of the National Bureau of Statistics of the People's Republic of China on Major Figures of the 2010 Population Census, Statistical Yearbook of Urban Water Supply (2009002018), GB50011-2010 Code for seismic design of buildings (2010), Institute of Engineering Mechanics (2009) and GB18306-2015 Seismic ground motion parameters zonation map of China (2015). Site category data were calculated through the BP neural network method. Seismic hazard control points were calculated using the CPSHA method. Both site category and seismic hazard control point data are classified and could not be made available in the public domain (GB18306-2015 Seismic ground motion parameters zonation map of China, 2015).
TY initiated the research. TY and BL gathered the data. TY analyzed the data and plotted the maps and graphs. TY wrote the manuscript draft. HJ and ZL reviewed the manuscript.
The contact author has declared that none of the authors has any competing interests.
Publisher's note: Copernicus Publications remains neutral with regard to jurisdictional claims made in the text, published maps, institutional affiliations, or any other geographical representation in this paper. While Copernicus Publications makes every effort to include appropriate place names, the final responsibility lies with the authors. Regarding the maps used in this paper, please note that Figs. 13–19 contain disputed territories.
This research has been supported by the National Natural Science Foundation of China (grant no. U1901602) and the Seismological Research Foundation for Youths of the Guangdong Earthquake Agency (grant no. GDDZY202308).
This paper was edited by Maria Ana Baptista and reviewed by Zoran Stojadinovic and one anonymous referee.
Allen, T. I. and Wald, D. J.: Topographic slope as a proxy for seismic site-conditions (Vs30) and amplification around the globe, Bull. Seismol. Soc. Am., 97, 1379–1395, https://doi.org/10.1785/0120060267, 2007.
Brozovic, N., Sunding, D. L., and Zilberman, D.: Estimating business and residential water supply interruption losses from catastrophic events, Water Resour. Res., 43, 1–14, https://doi.org/10.1029/2005WR004782, 2007.
Chen, B., Wen, Z. P., and Zhao, W. Z.: Curve Fitting Approach to Obtain Fragility Curve from Building Damage Matrix Based on the Seismic Ground Motion Parameters, J. Seismol. Res., 41, 613–620, 2018.
Chen, L. B., Zheng, K. F., and Zhuang, W. L.: Analytical Investigation of Bridge Seismic Vulnerability in Wenchuan Earthquake, J. SW Jiaotong Univers., 47, 558–565, 2012.
Chen, Y., Chen, Q. F., and Chen, L. : Vulnerability Analysis in Earthquake Loss Estimate, Earthquake Research in China, Springer, https://doi.org/10.1023/A:1011181803564, 1999.
China Urban Water Supply and Drainage Association: Statistical Yearbook of Urban Water Supply, Beijing, ISBN 50132001, 2009–2018.
Cornell, C. A.: Engineering seismic risk analysis, Bull. Seismol. Soc. Am., 58, 1583–1606, https://doi.org/10.1785/BSSA0580051583, 1968.
Fan, W. T.: Investment budget and economic evaluation of Toutun River pipeline water supply project, Water Sci. Eng. Technol., 1, 48–49, 2020.
Gao, L., Guo, E. D., and Wang, X. J.: Earthquake damage analysis of pools in water supply system, J. Nat. Disast., 10, 120–126, 2012.
Gao, M. T.: Urban Earthquake Catastrophe Insurance – Opportunities and Challenges, Keynote Speech at the Fourth China Reinsurance Summit Forum on Catastrophe Risk and Insurance, 5 November 2020, Beijing, China, 2020.
Gao, M. T., and Lu, S. D.: The Discussion on Principles of Seismic Zonation of the Next Generation, Tecchnology for Earthquake Disaster Prevention, 1, 1–6, 2006.
GB18306-2015 Seismic ground motion parameters zonation map of China: General Administration of Quality Supervision, Inspection and Quarantine of the People's Republic of China, Beijing, ISBN GB183062015, 2015.
GB50011-2010 Code for seismic design of buildings: Ministry of Housing and Urban-Rural Development of the People's Republic of China, Beijing, ISBN 1511228896, 2010.
GB/T24336-2009: Classification of Earthquake Damage Levels for Lifeline Engineering, China Standard Press, Beijing, ISBN 155066138976, 2009.
Han, Y.: Study on seismic reliability of urban Buried pipeline network systems, Doctor's Degree Thesis, Dalian University of Technology, http://kns.cnki.net.https.gzlib.proxy.chaoxing.com/kcms2/article (last access: 4 March 2024), 2002.
He, W. H.: Reflection on the Damage of Water Supply Networks Induced by the Wenchuan “5.12” Earthquake, Urban Water Supply Drain., 35, 7–11, https://doi.org/10.13789/j.cnki.wwe1964.2009.12.012, 2009.
Institute of Engineering Mechanics: Summary report on scientific investigation of earthquake damage in Wenchuan earthquake, CEA, Harbin, 2009.
Institute of Engineering Mechanics and CEA: Earthquake damage in Haicheng, Seismological Press, Beijing, 1979.
Institute of Engineering Mechanics and China Earthquake Administration: Technical Report on Earthquake Damage Investigation of Wenchuan Earthquake, Harbin, 2009.
Institute of Engineering Mechanics and China Earthquake Administration: Research on New Techniques for Evaluating the Loss of Large Earthquake Disasters in Water Supply Systems, Harbin, 2013.
Jiang, H., Guo, E. D., and Lin, X. C.: A new exploration of the risk assessment method of earthquake disasters in urban agglomerations: Taking the Guangdong-Hong Kong-Macao Greater Bay Area as an example, Acta Seismolog. Sin., 44, 868–877, https://doi.org/10.11939/jass.20220096, 2022.
Lei, J. C., Gao, M. T., and Lv, H. S.: Ratios between peak ground accelerations under different hazard levels in Sichuan and adjacent region, Acta Seismol. Sin., 32, 588–599, 2010.
National Bureau of Statistics of China: Communiqué of the National Bureau of Statistics of the People's Republic of China on Major Figures of the 2010 Population Census, Beijing Rev., 54, 4–6, 2011.
Nigg J.: Perceptions of earthquake impacts and loss-reduction policy preferences among community residents and option leaders, Delaware: Disaster Research Center, University of Delaware, 1998.
Nong, W. W.: Selection of Pipe Materials for Urban Water Supply Pipeline, Coast. Enterpris. Sci. Technol., 8, 75–77, 2006.
Shi, D. C.: Study on New Methods of Site Classification Based on GIS, IEM, Harbin, http://kns.cnki.net.https.gzlib.proxy.chaoxing.com/kcms2/article (last access: 4 March 2024), 2009.
Wang, X. Q., Zhang, G. M., Fu, Z. X., and Liu, G. P.: Introduction of the Program `Studies for the Seismic Prone Regions and Prediction of Seismic Losses in These Regions During 2006–2020', Recent Dev. World Seismol., 9, 88–93, 2006.
Wen, M. H.: Application Practice of Mapping Method of Seismic Ground Motion Parameter Zonation Map of China (GB18306-2015) in Yunnan Area, J. Seismol. Res., 40, 257–263, 2017.
Yin, Z. Q. and Yang, S. W.: Earthquake loss analysis and fortification standards, Earthquake Publishing House, Beijing, ISBN 9787502853341, 2004.
Yu, H. Y. and Ma, W. X.: Research on site classification method based on BP neural network, in: Proceedings of the 2020 4th International Conference on Electronic Information Technology and Computer Engineering (EITCE 2020), Association for Computing Machinery, New York, NY, USA, 681–686, https://doi.org/10.1145/3443467.3443835, 2020.
- Abstract
- Introduction
- Basic database for risk assessment
- Seismic risk assessment model based on expected loss (rate)
- Seismic risk distribution based on expected loss (rate) in water supply systems
- Discussion
- Conclusion
- Data availability
- Author contributions
- Competing interests
- Disclaimer
- Financial support
- Review statement
- References