the Creative Commons Attribution 4.0 License.
the Creative Commons Attribution 4.0 License.
 | 06 Mar 2024
Linkages between atmospheric rivers and humid heat across the United States
Anamika Shreevastava
Emily Slinskey
Duane Waliser
The global increase in atmospheric water vapor due to climate change tends to heighten the dangers associated with both humid heat and heavy precipitation. Process-linked connections between these two extremes, particularly those which cause them to occur close together in space or time, are of special concern for impacts. Here we investigate how atmospheric rivers relate to the risk of summertime humid heat in the United States. We find that the hazards of atmospheric rivers and humid heat often occur in close proximity, most notably across the northern third of the United States. In this region, high levels of water vapor – resulting from the spatially organized horizontal moisture plumes that characterize atmospheric rivers – act to amplify humid heat, generally during the transition from dry high-pressure ridge conditions to wet low-pressure trough conditions. In contrast, the US Southeast, Southwest, and Northwest tend to experience atmospheric rivers and humid heat separately, representing an important negative correlation of joint risk.
- Article
(5197 KB) - Full-text XML
-
Supplement
(5385 KB) - BibTeX
- EndNote


Hot and humid weather – prime conditions for heat stress – is increasing in occurrence and severity over most of the globe, a consequence of both rising temperature and specific humidity (Raymond et al., 2020; Buzan and Huber, 2020). Several recent studies have found that wet and hot conditions can occur in rapid sequence, posing the compound threat of infrastructure damage followed by a public-health crisis to which response capacities are diminished (Zhang and Villarini, 2020; Liao et al., 2021; Gu et al., 2022; Sauter et al., 2023a) and more generally the challenge of enhanced impacts due to resource limitations from two damaging events happening close together in space or time (de Ruiter et al., 2020).
The joint wet–hot risk is underlain by physical connections in the form of both atmospheric circulation patterns and land–surface feedbacks. Soil moisture is a particularly important modulator, with high-humid-heat days being favored after wet days in arid areas of the subtropics (Liu et al., 2019; Speizer et al., 2022). Conversely, high temperatures are followed by an increased likelihood of precipitation in situations where there is a mechanism that facilitates or forces ascent, whether large-scale as in northern China, central Europe, or the US Midwest (Deng et al., 2020; You and Wang, 2021; Sauter et al., 2023a; Zhang and Villarini, 2020) or mesoscale as in the US state of Florida (Raghavendra et al., 2019). In the former cases, moisture convergence occurs due to the same circulation regime that favors subsidence, positive anomalies of net near-surface radiation, and southerly flow. Similarly, the occurrence of successive heat and flood events on the Australian east coast has been attributed to a slight geographic shift in position of a ridge east of Queensland, with warm and humid onshore flow rapidly transitioning to hot and dry offshore flow that raises temperatures while moisture levels are already high (Sauter et al., 2023b; Boschat et al., 2015). However, of the aforementioned studies, only Zhang and Villarini (2020) investigate humid heat, rather than high temperatures alone. Consideration of mechanisms for tripartite heat–vapor–precipitation connections is also underdeveloped.
Atmospheric rivers (ARs) are broadly defined as long-distance conveyors of water vapor, serving to effect poleward moisture transport and also favoring high winds and heavy precipitation (Ralph et al., 2020, 2018; Guan and Waliser, 2015; Neiman et al., 2008). Related terms from the literature which more precisely locate and describe vapor-transport features include warm conveyor belts (Madonna et al., 2014) and moist low-level jets (Ralph et al., 2018; Stensrud, 1996). ARs have been almost exclusively discussed phenomenologically (Gimeno et al., 2021), and consequently a wide diversity of meteorological patterns may be categorized as ARs, even within the same region and season. ARs are most closely related to maxima of moisture transport, otherwise known as integrated vapor transport (IVT), which occur principally in connection with extratropical cyclones but also with deep monsoon-related flow and continental low-level jets, among other systems (de Vries, 2021; Gimeno et al., 2021; Corringham et al., 2019). Notable instances of the latter two phenomena are located in the US Midwest, northern India, and southern South America (de Vries, 2021; Higgins et al., 1997). ARs can be further divided along dimensions including moisture- versus wind-dominated (Gonzales et al., 2020), transient versus quasi-stationary (Park et al., 2023), and tropical versus extratropical (Reid et al., 2022), as well as according to other distinct regional characteristics – all differences which affect ARs themselves and their impacts (Park et al., 2021; Guan and Waliser, 2019; Nayak and Villarini, 2017). This variety of systems falling under a single broad heading is also the case for other important climate phenomena, such as droughts (Haile et al., 2019). Although the first-described and best-known AR types occur in the extratropical cold season, warm-season varieties can have a substantial imprint on regional hydroclimate (Slinskey et al., 2020). To take North America as an illustrative case, about half of summer extreme-precipitation days in the Eastern and Central United States are caused by ARs. Summer ARs over the United States originate from the Pacific Ocean or (especially) the Gulf of Mexico and tend to be weaker but wetter than their cold-season counterparts due to the higher temperatures and associated background water-vapor quantities (Slinskey et al., 2020; Neiman et al., 2008).
Recognizing this state of existing literature and the weather-system perspective that ARs offer with respect to ensuring the physical meaningfulness of risk relationships, we investigate here the spatiotemporal patterns of humid heat and ARs across the contiguous United States and in doing so explore the potential for ARs to encapsulate a strong and process-based link between humid heat, precipitation, and moisture transport.
2.1 Time period and regions
Our analysis spans 1980–2020, for the extended warm season of May–September, and relies primarily on variables from the Modern-Era Retrospective analysis for Research and Applications, Version 2 (MERRA-2) reanalysis (Gelaro et al., 2017) as described further below. We consider both the grid-cell level and spatial means across seven regions of the contiguous United States defined by the US National Climate Assessment: Northwest (NW), Southwest (SW), Northern Great Plains (NGP), Southern Great Plains (SGP), Midwest (MW), Southeast (SE), and Northeast (NE) (Jay et al., 2018). These regions are included in Fig. 1.
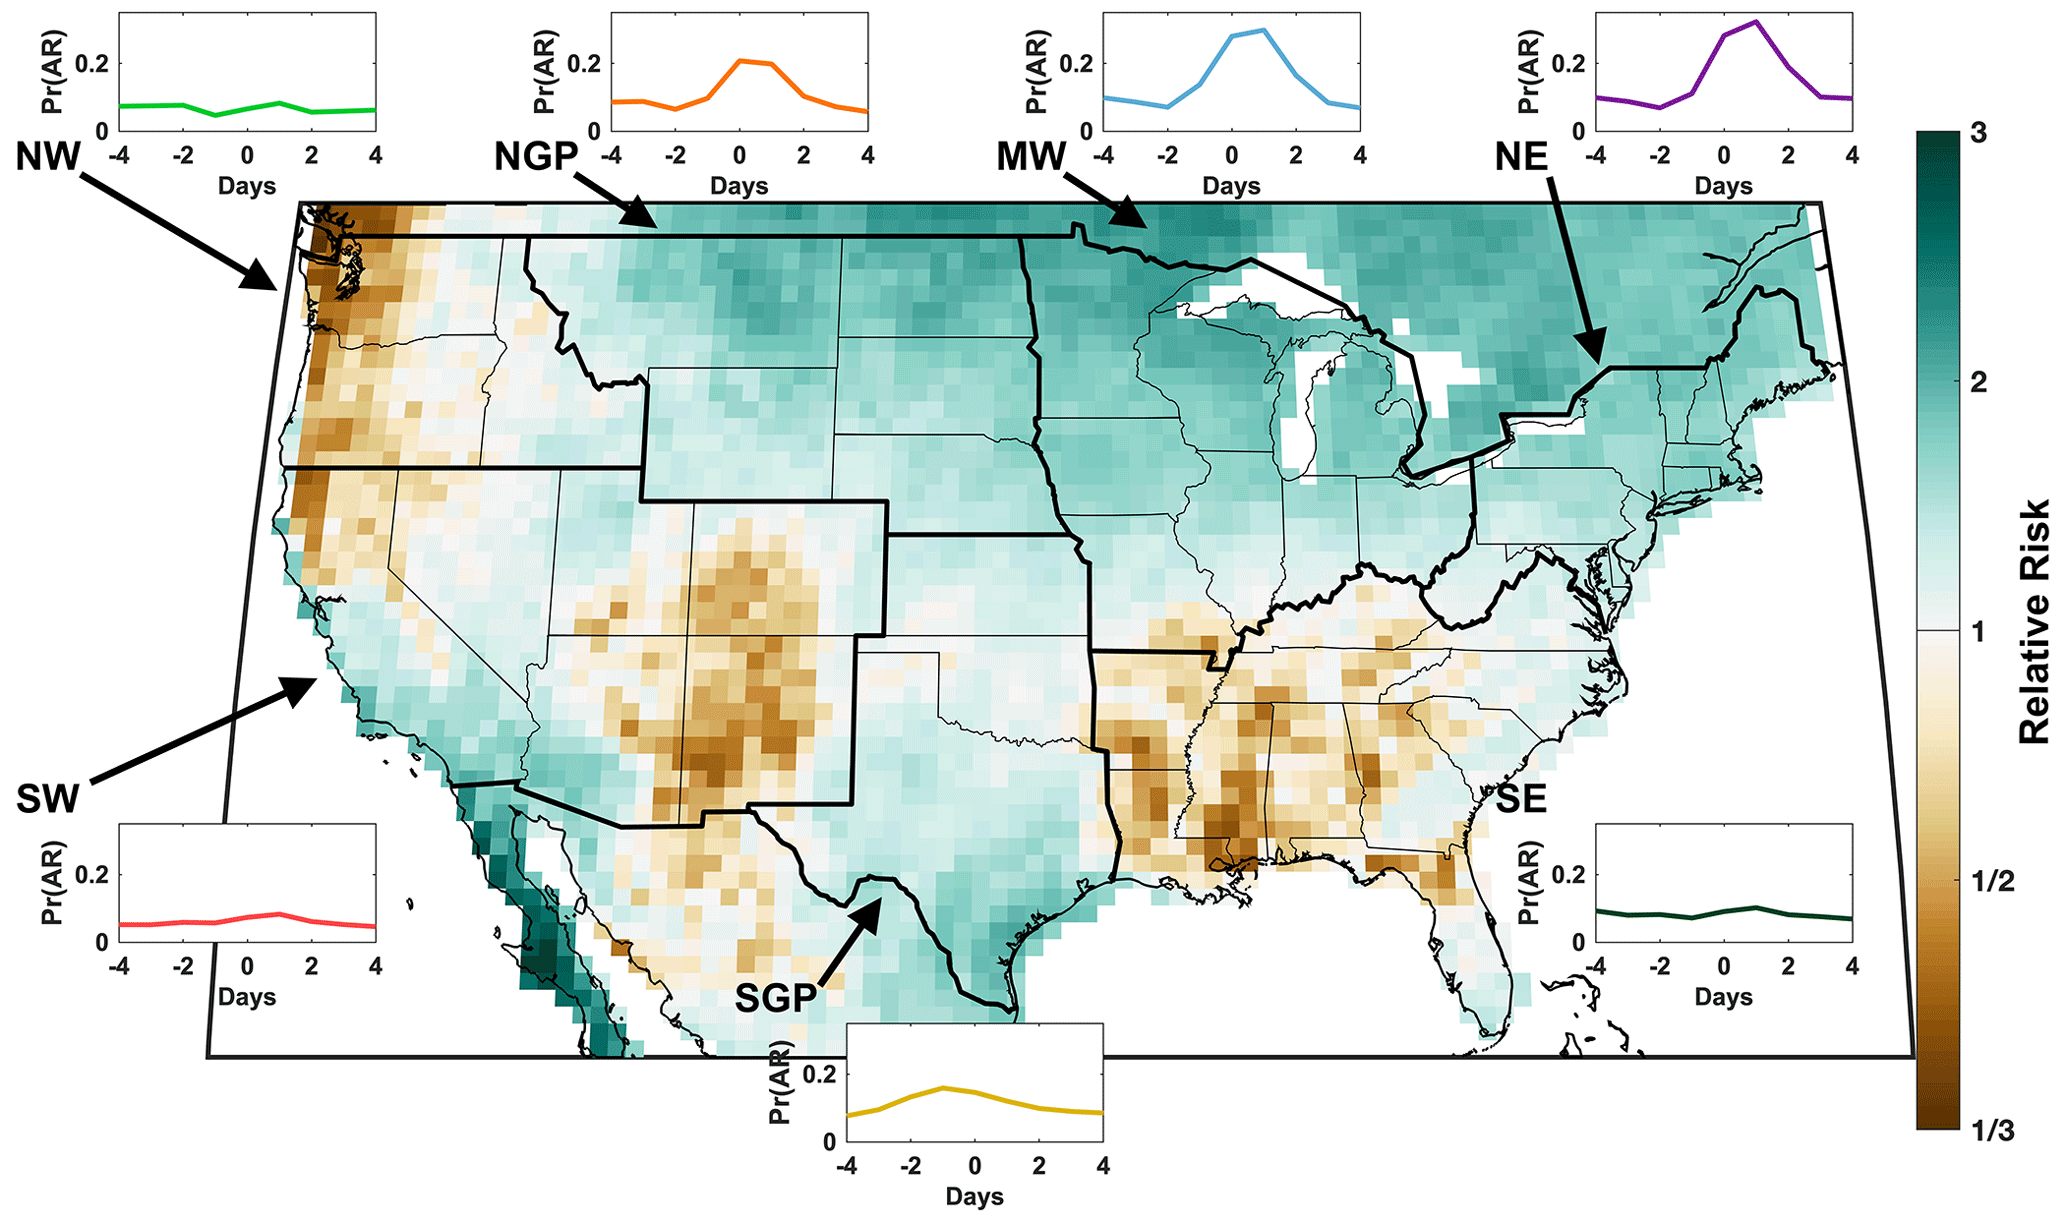
Figure 1AR–humid-heat interaction statistics. Map: relative risk of an AR occurring in close proximity (within 1 d and 100 km) to a humid-heat day at each grid cell. Relative risk >1 corresponds to a risk larger than that expected by chance. Inset plots: for each region (thick black outlines), composite AR probability for the 9 d surrounding peak humid-heat days.
2.2 Atmospheric rivers
For ARs, we use the MERRA-2-based Guan–Waliser AR-detection algorithm (Guan and Waliser, 2019). This algorithm incorporates a percentile-based thresholding of IVT, as well as geometric and direction-of-motion criteria, to define AR presence/absence at each grid cell and 6 h time step. Using the Guan–Waliser AR catalogue, we subsequently define AR grid cell days as those for which an AR is present at a grid cell for at least two of that day's four time steps. The entire AR need not fall within the US domain, as the catalogue is defined globally, and we evaluate AR occurrence grid cell by grid cell. Each AR is also assigned a single intensity category for each day based on a scale of 1 (weak) to 5 (strong) (Ralph et al., 2019); we consider strong ARs to correspond to categories 4 and 5.
2.3 Humid heat
To characterize humid heat, we use daily maxima of 2 m wet-bulb temperature (Tw), calculated from hourly MERRA-2 reanalysis dry-bulb temperature and dewpoint temperature (Davies-Jones, 2008). We compute Tw percentiles for each day at each grid cell against the climatology of the surrounding 30 d and then define a “humid-heat day” as a day with Tw above the 95th percentile. A “peak humid-heat day” is a humid-heat day that satisfies the additional constraints of having the highest Tw value within 3 d on either side as well as Tw having been below the 90th percentile within the preceding 3 d (see Fig. S1 in the Supplement). This “peak” framing is intended to capture sequences associated with high humid heat that has recently and notably intensified, as we wish to examine most closely the processes that exacerbate humid heat rather than those that prolong it. Lastly, “regional humid-heat days” and “regional peak humid-heat days” are fully analogous to their individual-grid-cell equivalents but with each criterion applied instead to the mean of all grid cells in a region. We find that 1.6 % of all May–September days are peak humid-heat days, or approximately 2.5 d yr−1 on average; regional peak humid-heat days range in frequency from 1.1 d yr−1 (Southwest) to 2.8 d yr−1 (Northeast). Composites are then constructed as the mean across all days in a particular category.
2.4 Interaction between atmospheric rivers and humid heat
We define “interaction” between ARs and humid heat as those cases where humid-heat days at a grid cell occur within 1 d and 100 km of an AR. Spatially, this means a grid cell could be included within an AR, or the edge of an AR is no more than 100 km away; temporally, it means the spatial criterion is satisfied on the day before, the day after, or the same day as a humid-heat day. Purely to avoid excessive repetition of terms, interaction is also described in the text as an AR occurring “nearby” or in “close proximity” to humid heat. According to these definitions, 2.4 % of all May–September grid cell days across the United States exhibit AR–humid-heat interaction. Relative risk in general refers to the risk of an event of interest in a certain case relative to its risk in a control case; here, it refers to the computed probability of ARs near peak humid-heat days (i.e., of AR–humid-heat interaction) versus the probability which would be expected if ARs and humid heat were randomly distributed relative to one another throughout the warm season. We analogously compute relative risk for precipitation–humid heat and IVT–humid heat, using the thresholds of 1 mm d−1 for precipitation and the local 75th percentile for IVT. As an additional metric for assessing how ARs and humid heat are connected, we compare two sets of days: one comprising all regional-humid-heat days and the other comprising a random selection of non-regional-humid-heat warm-season days with identical regional-mean 500 hPa geopotential height (Z500) anomalies. In other words, normalized by Z500 anomalies, we ask whether days with larger AR extents are more likely to experience humid heat within 1 d before or after.
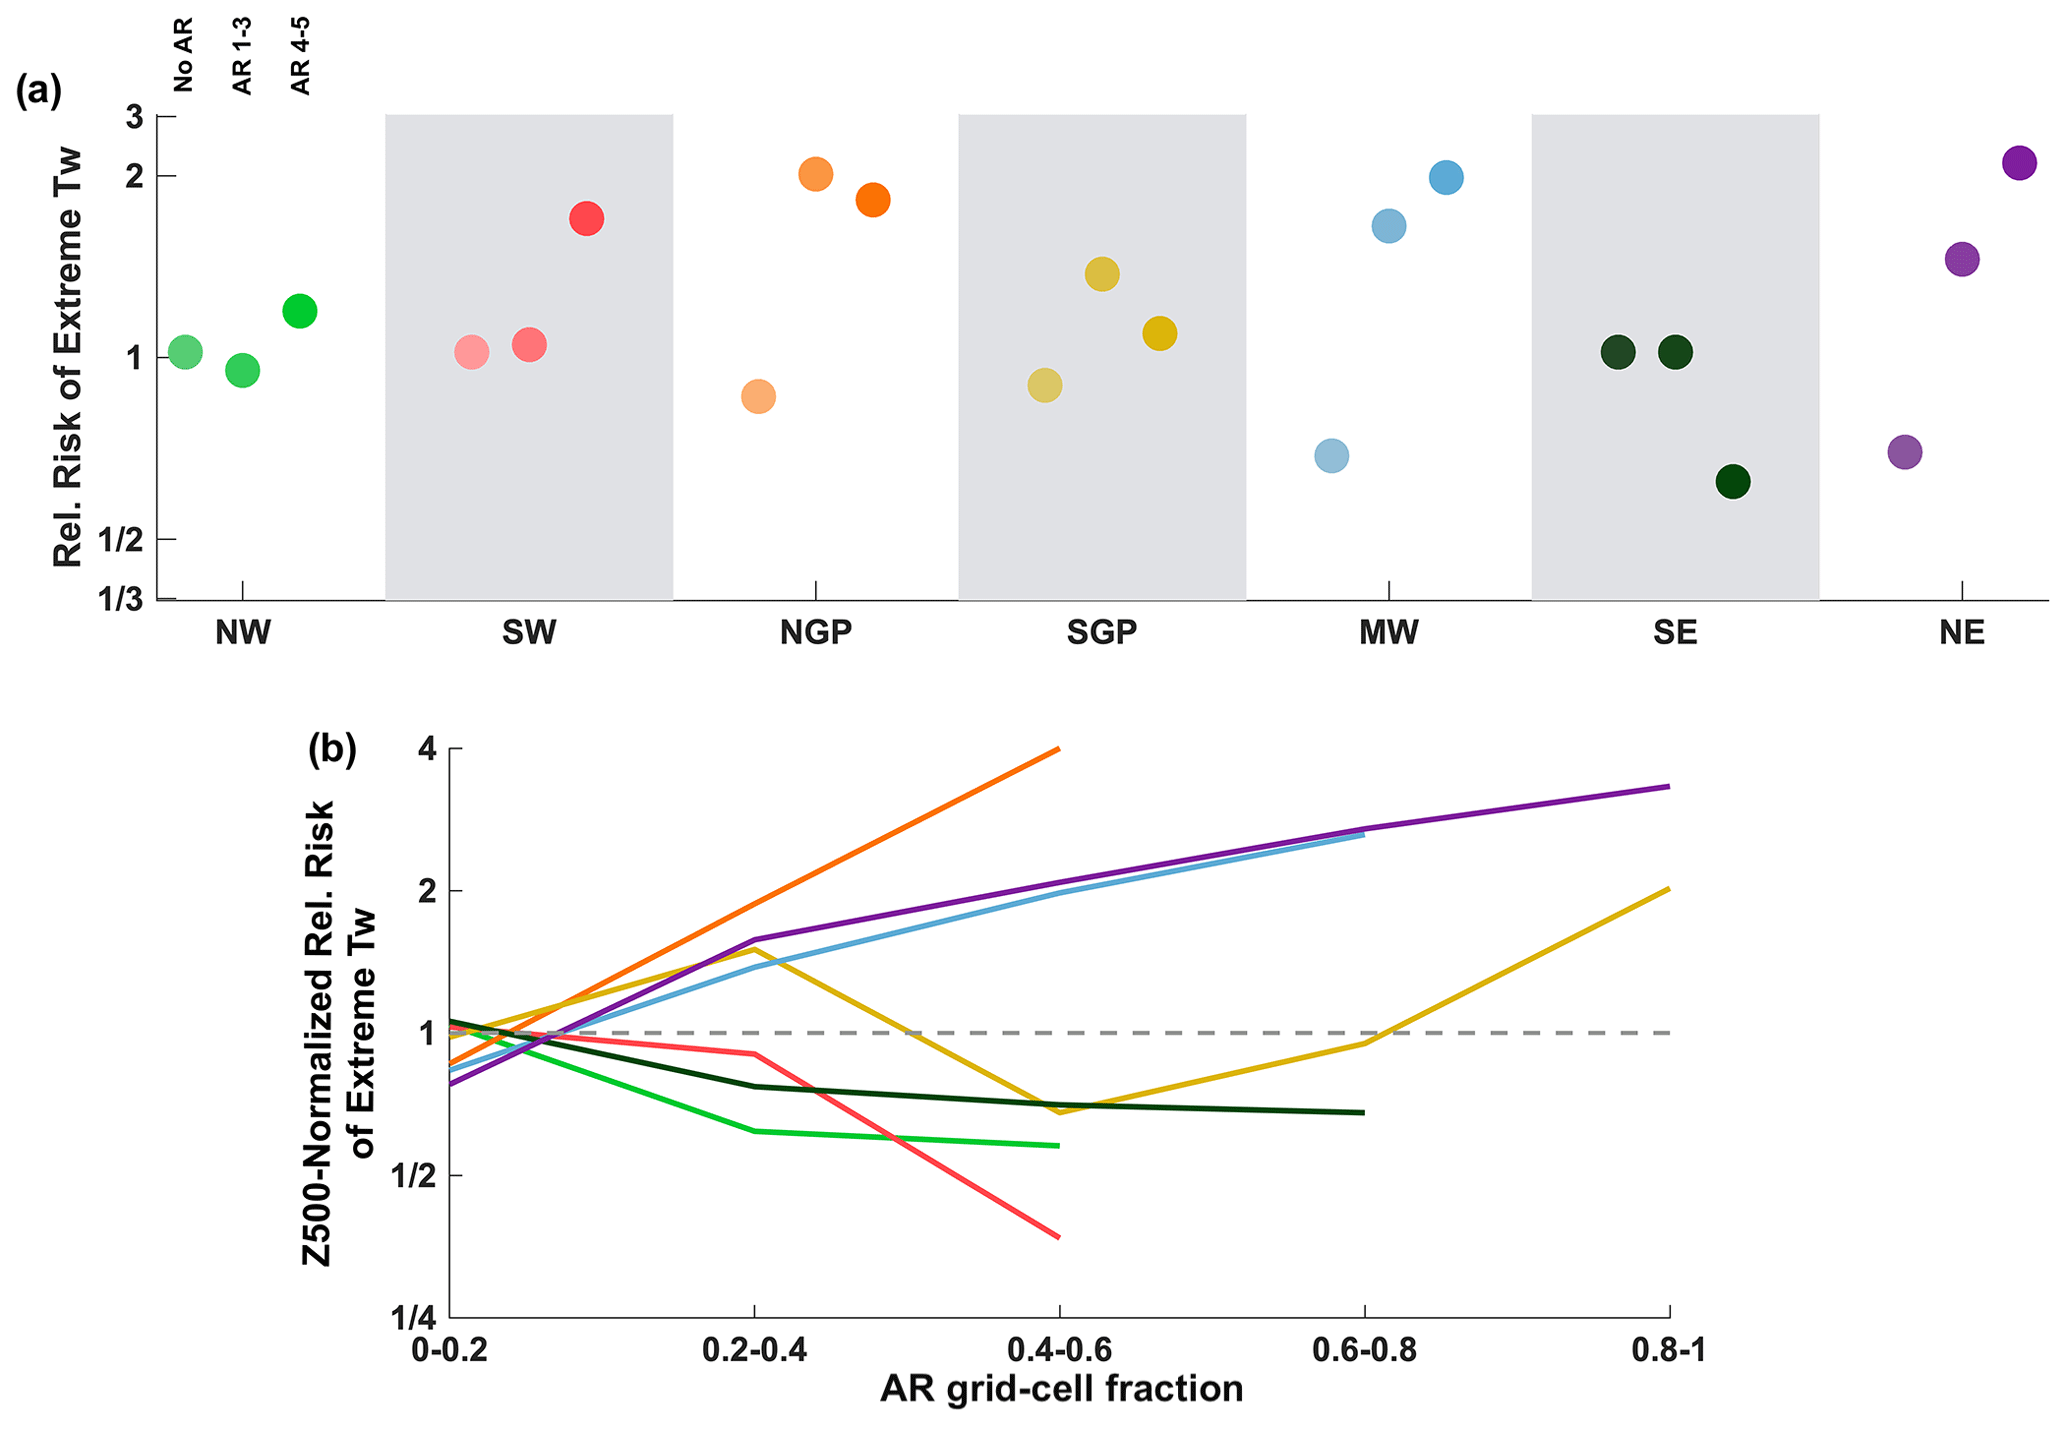
Figure 2Relative risk of humid heat by AR intensity and extent. (a) For each region, the relative risk of a humid-heat day that has no AR within 1 d and 100 km (“nearby”); with an AR of category 1–3 nearby; and with an AR of category 4–5 nearby. (b) Relative risk of humid heat, normalized by regional Z500 anomalies (see Methods), for different AR extents. Note that most regions lack any days with >80 % regional AR coverage.
3.1 Region-specific AR–humid-heat interaction statistics
We find three primary areas where ARs and humid heat tend to interact: the northern tier of the United States from Montana eastward, southeastern Texas, and the low elevations between central California and Arizona (Fig. 1). In each area, conditioned on humid-heat days, the probability of a nearby AR is at least doubled relative to chance. For brevity, in this study we henceforth consider only the first area, which is the largest and bears the most relevance to existing literature. Other parts of the country such as the Southeast, coastal Northwest, and high-mountain Southwest show a notable reduction in joint risk, with AR–humid-heat interactions approximately half as likely as they would be if the two hazards were unrelated. Where they occur, these interactions follow a clear temporal signature: relative to peak humid heat, ARs are typically present on the same day or the following day for all regions except the Southern Great Plains, where ARs precede humid heat by about a day (Fig. 1, inset plots).
Separating strong ARs from weak-to-moderate ones shows an enhancement of AR–humid-heat interaction probability with increasing AR intensity for the Southwest, Midwest, and Northeast, though with some uncertainty due to sample-size effects (Fig. 2a). Conversely, the absence of an AR translates to lower than normal humid-heat risk in the Northern Great Plains, Midwest, and Northeast, while a risk reduction is also seen for the case of strong ARs in the Southeast. We then test the meaningfulness of the AR–humid-heat interaction more rigorously by comparing AR extent on regional peak humid-heat days to that on a set of days with identical 500 hPa geopotential-height (Z500) anomalies – in other words, we control for the possibility that strong ARs simply occur in tandem with amplified ridges. With this effect accounted for, more extensive coverage of ARs over a region is still found to be associated with a higher probability of humid heat for the same three northern regions that stand out by other measures: the Northern Great Plains, Midwest, and Northeast (Fig. 2b). ARs that extend over 50 % or more of these regions are at least 2 times as likely to occur in close proximity to humid heat, for the same Z500 anomaly, versus no- or small-AR situations. Spatially extensive ARs are rare in the Northwest and Southwest but correlate negatively with humid-heat occurrence in those regions.
To better visualize the meteorology leading to the summary statistics presented above, we map AR and Tw composites for regional peak humid-heat days, thus aiming to illuminate the centroids of AR–humid-heat interaction for each region. Coherent large areas with high AR probabilities are again seen in association with humid heat, especially across the entire Great Plains, Midwest, and Northeast (Fig. 3). The latter two also have highly spatially correlated humid heat, with most of each region exceeding the Tw 90th percentile simultaneously. Maximum anomalies of humid heat are generally located several hundred kilometers from the AR center points, except in the Southeast and Southwest where the two are nearly co-located.
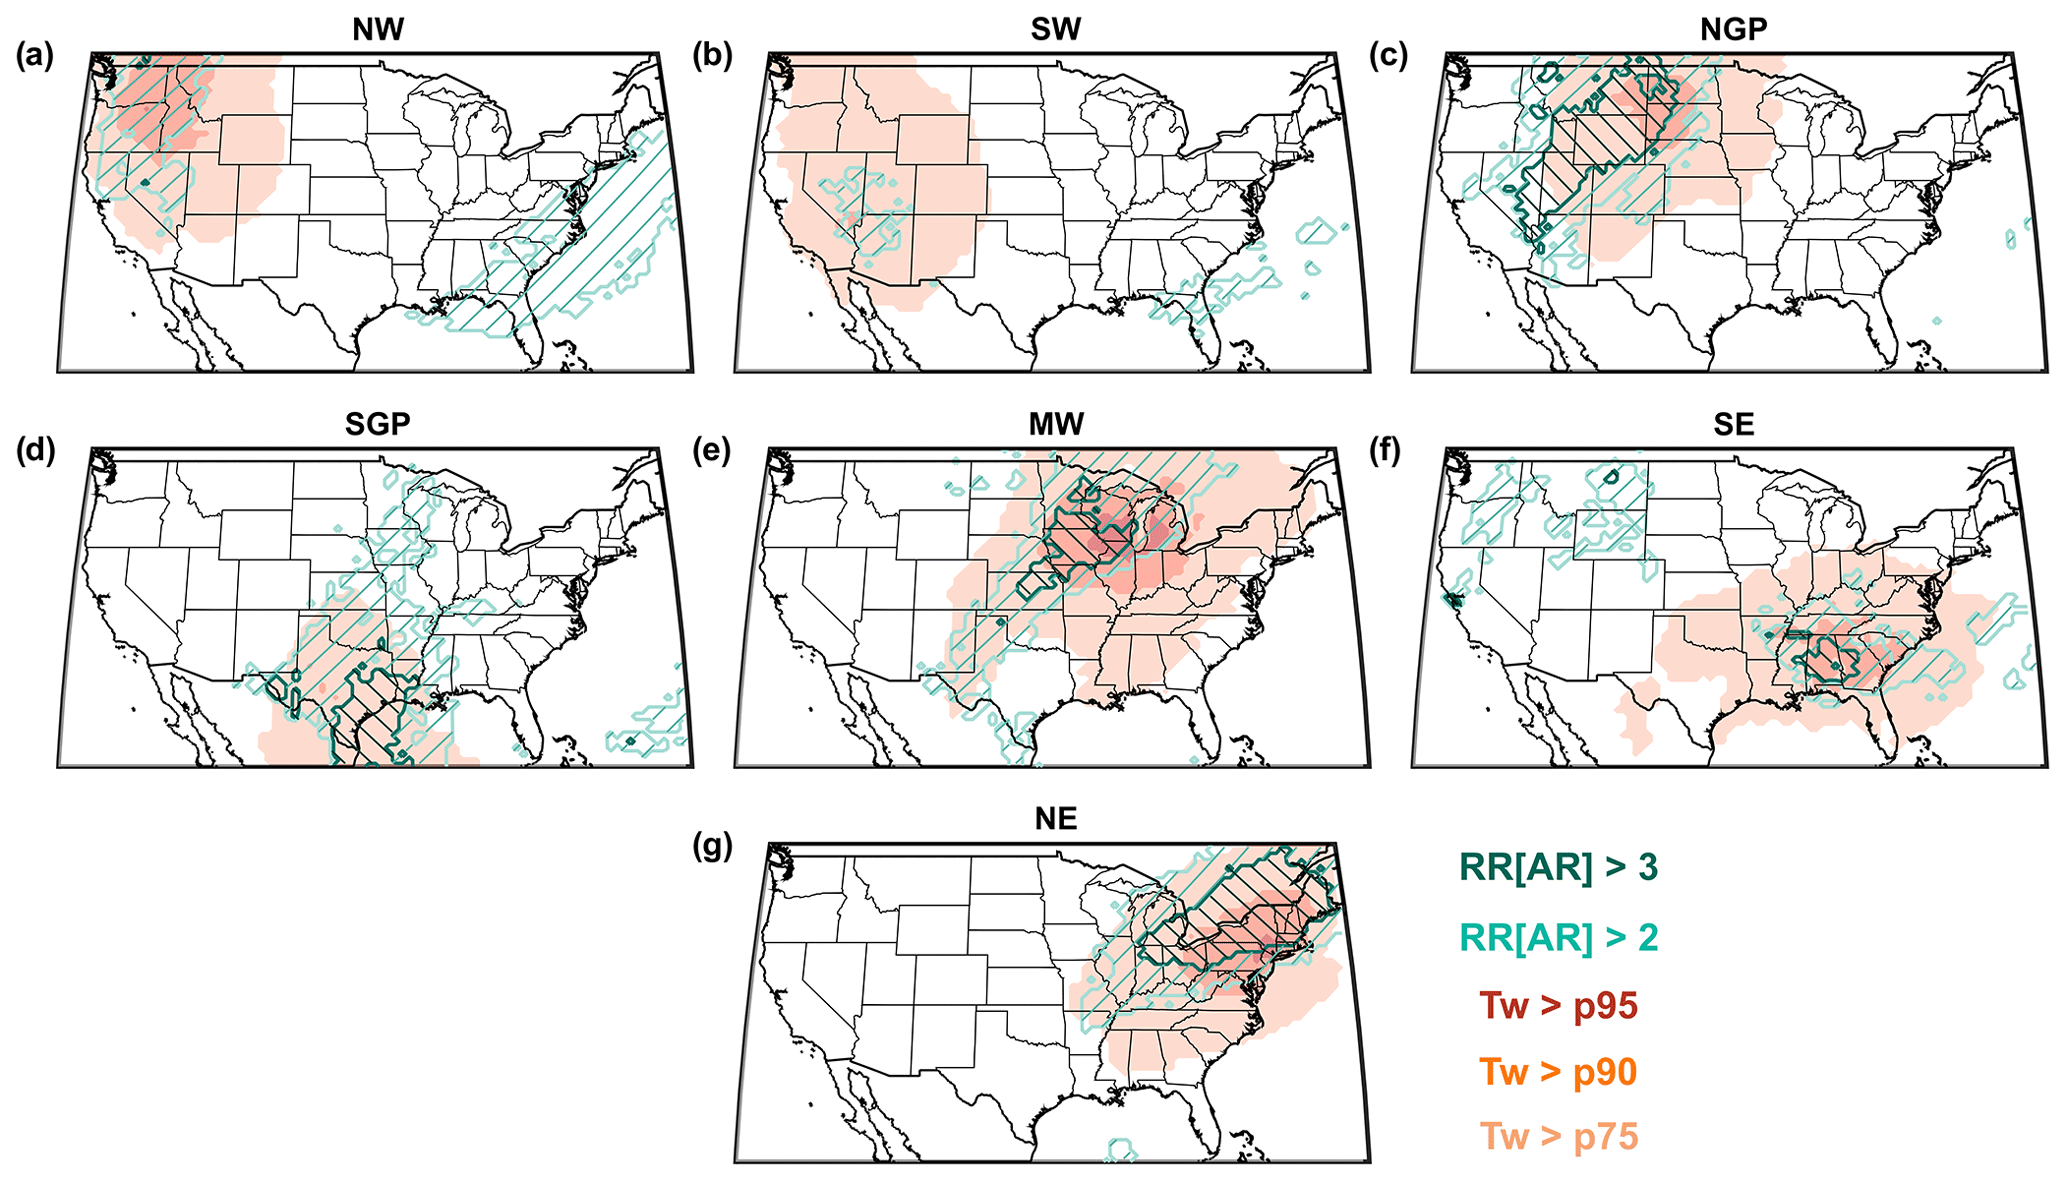
Figure 3AR–humid-heat interaction maps. AR–humid-heat interactions for each region: (a) Northwest, (b) Southwest, (c) Northern Great Plains, (d) Southern Great Plains, (e) Midwest, (f) Southeast, and (g) Northeast. Shading shows where mean humid heat, for the composite humid-heat days, exceeds the MJJAS 95th percentile (dark red), 90th percentile (red), or 75th percentile (light red). Contours indicate where the AR relative risk within 1 d of these composite events exceeds 3 (dark teal) or 2 (light teal). Grid cells with mean AR probability <10 % are masked for reliability.
Lastly, because ARs typically involve positive anomalies of both precipitation and IVT, it is natural to ask whether the interactions we describe can be satisfactorily explained by either of the latter variables alone. Repeating the humid-heat risk-ratio analysis for precipitation and extreme IVT separately (Fig. 4) indicates that where interaction probabilities are largest (and especially in the northern tier of the United States from Montana to Maine), ARs have an additional explanatory power for humid-heat risk; in other words, the relative risk of AR–humid-heat interaction is significantly greater than that of either precipitation–humid heat or IVT–humid heat interactions. Also notable in Fig. 4a is the important humid-heat role played by precipitation from storms in the arid Southwest (Speizer et al., 2022), much of which is connected to the slow, broad (i.e., non-AR) intrusion of moisture and related enhanced convection of the North American monsoon (Adams and Comrie, 1997).
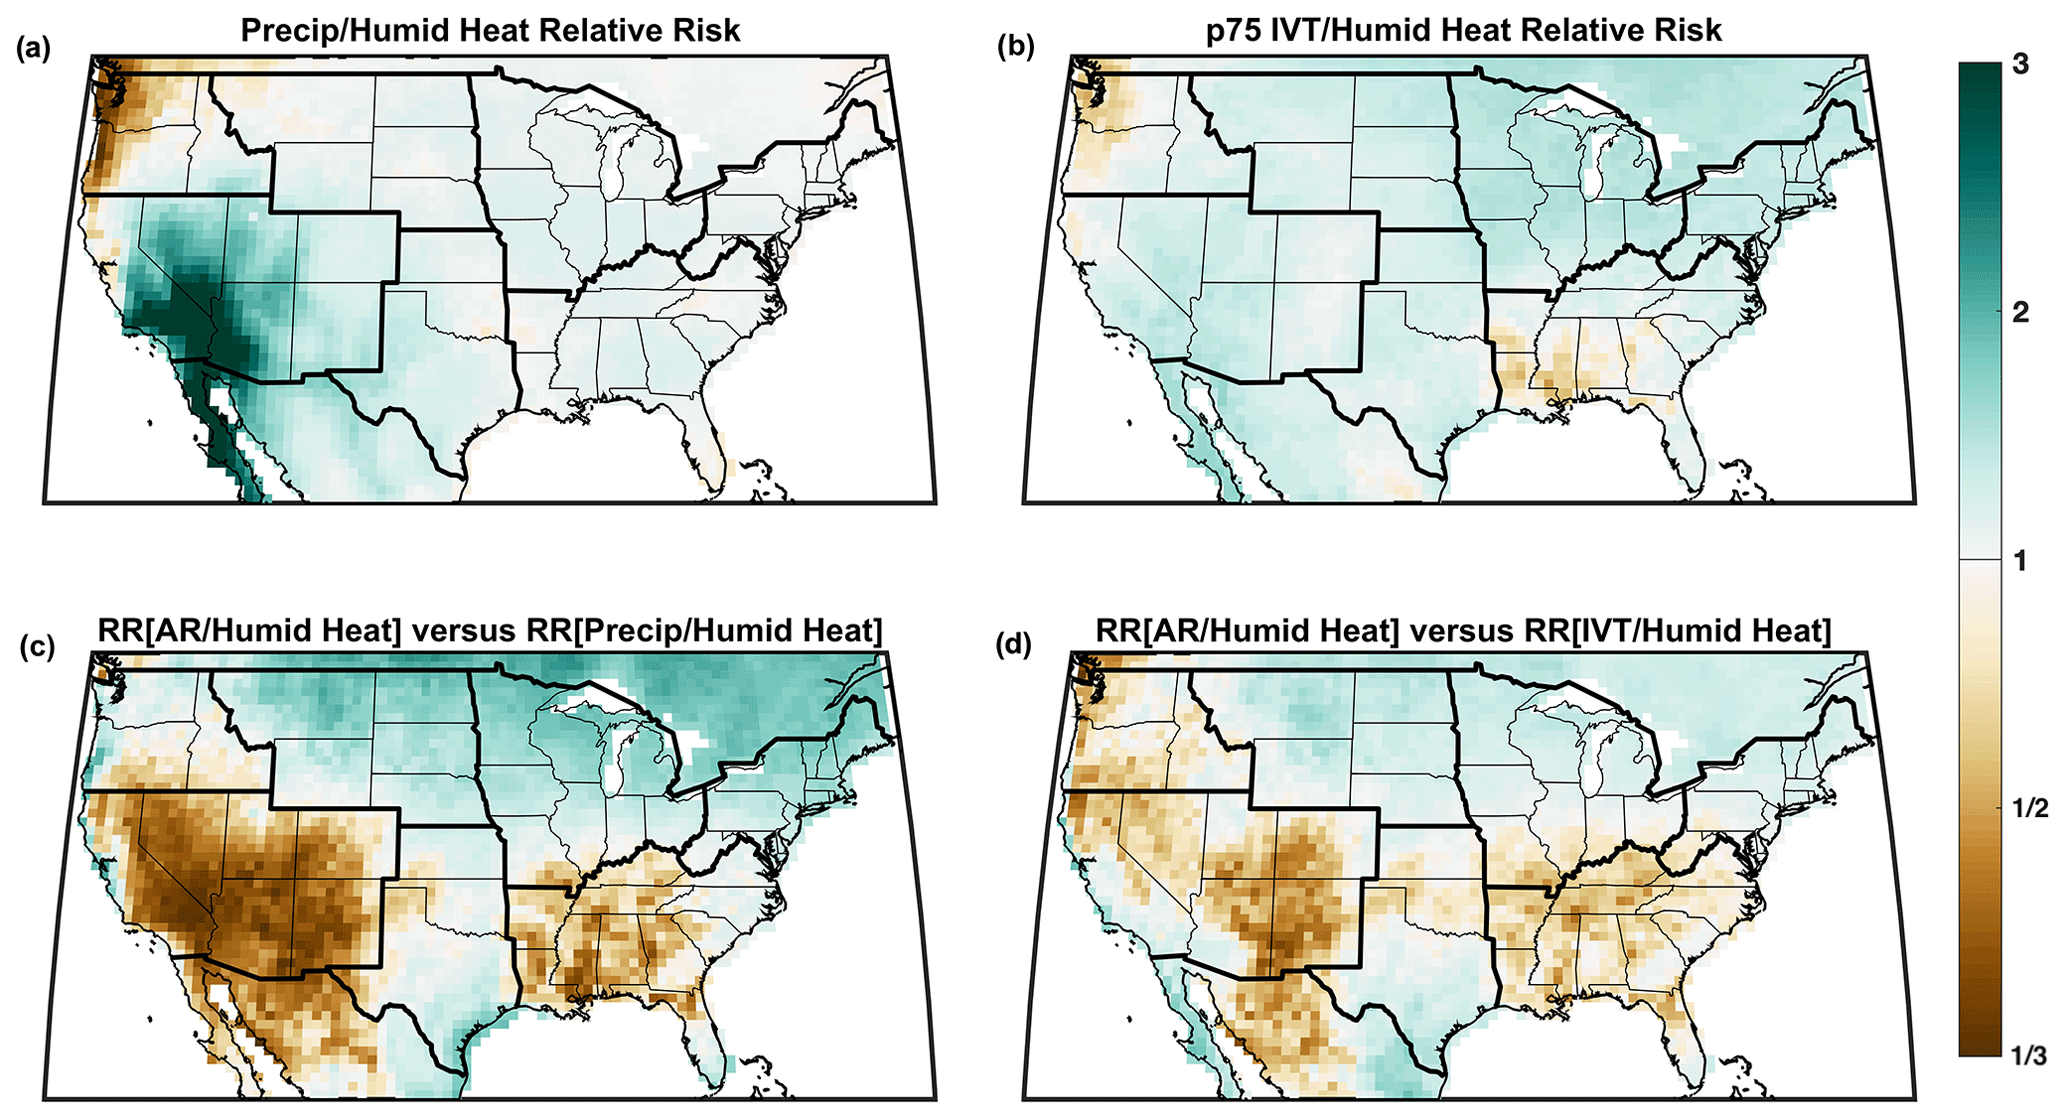
Figure 4Relative risk of humid heat conditioned on precipitation and extreme integrated vapor transport. (a) Relative risk of >1 mm daily precipitation occurring within 1 d and 100 km of a humid-heat day at each grid cell. (b) As in (a) but for 75th-percentile IVT occurring near humid heat. (c) Ratio of AR–humid-heat relative risk (Fig. 1) to precipitation–humid heat relative risk. (d) As in (c) but for IVT.
3.2 Multivariate time series for the Midwest
Motivated by the intra-regional coherence and high probability of AR–humid-heat interaction in the Midwest, we now focus more closely on the timeline and variables involved therein (Fig. 5), with analogous figures for other regions in the Supplement (Figs. S2–S7). First, expanding upon Fig. 3, we examine composites 1 d before and 1 d after regional peak humid-heat days. As components of humid heat, we plot daily maximum temperature and specific humidity, and as AR signatures, we plot daily mean precipitation and IVT (Fig. 5). We observe here the simultaneous development of the AR and Tw anomalies as they shift eastward, with the Tw maximum anomaly always slightly ahead of the AR, echoing Fig. 1. A coherent AR structure extends into the Midwest from Texas, suggesting long-range (>1000 km) vapor transport, indicated also by Fig. 5c, f, and i and agreeing with previous AR case studies in this vicinity (Gimeno et al., 2021; Lavers and Villarini, 2013). The greatest relative risk of precipitation is observed several hundred kilometers from the maximum humid-heat anomaly, in a poleward direction perpendicular to the AR axis.
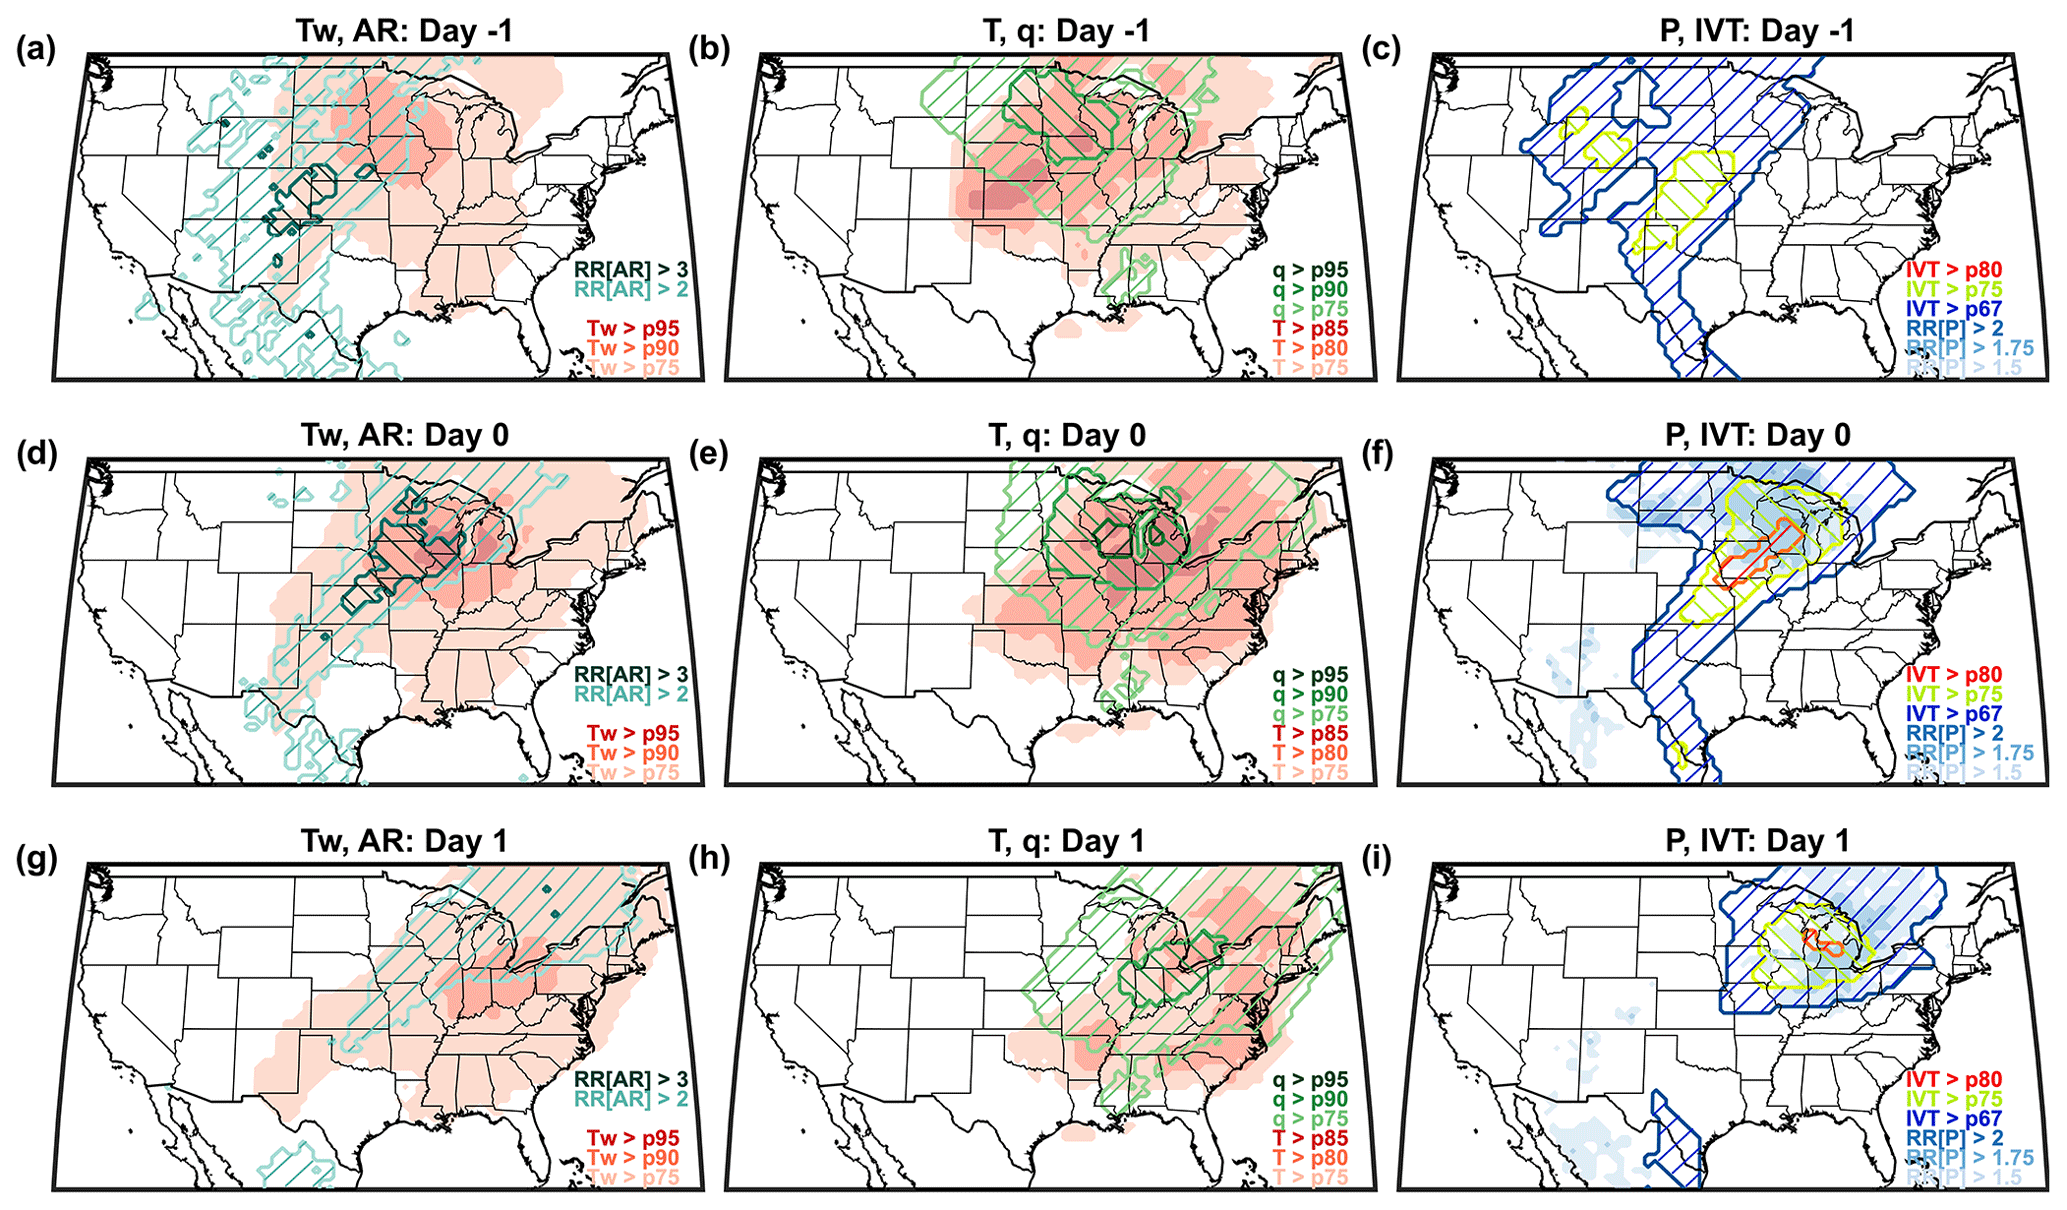
Figure 5Spatiotemporal progression of Midwest AR- and humid-heat-related quantities. (a, d, and g) Tw percentiles (shaded) and AR relative risks (hatched contours) for the Midwest for 1 d prior to a peak humid-heat day, the peak day, and 1 d afterward. Shading shows where composite mean Tw exceeds the May–September 95th percentile (dark red), 90th percentile (red), or 75th percentile (light red). Hatched contours indicate where the relative risk of a nearby AR on composite humid-heat days exceeds 3 (dark teal) or 2 (light teal). (b, e, and h) As in (a, d, and g) but for temperature (T) and specific humidity (q), each with shaded intervals representing the 95th, 90th, and 75th percentiles. (c, f, and i) As in (a, d, and g) but for precipitation (P) and integrated vapor transport (IVT), with intervals for the former representing a relative risk of 2, 1.75, and 1.5 on composite humid-heat days and for the latter the 80th, 75th, and 67th percentiles. These specific thresholds were chosen for visual clarity. Grid cells with mean May–September precipitation probability <10 % (primarily in California) are masked for reliability.
All of the above relationships are finally distilled, in a regional-average sense, into time series of multiple variables for the Midwest (Fig. 6). We find that although peak values of AR probability and IVT amount are sustained for two consecutive days, dry-bulb temperature decreases on the second day of the pair due to the shifting position of the ridge–trough system, while specific humidity remains nearly as high as on the first day. A positive anomaly of net surface longwave radiation on the peak Tw day more than compensates for a decrease in net surface shortwave radiation, presumably due to cloudiness and/or water-vapor feedback associated with the growing humidity and likelihood of precipitation.
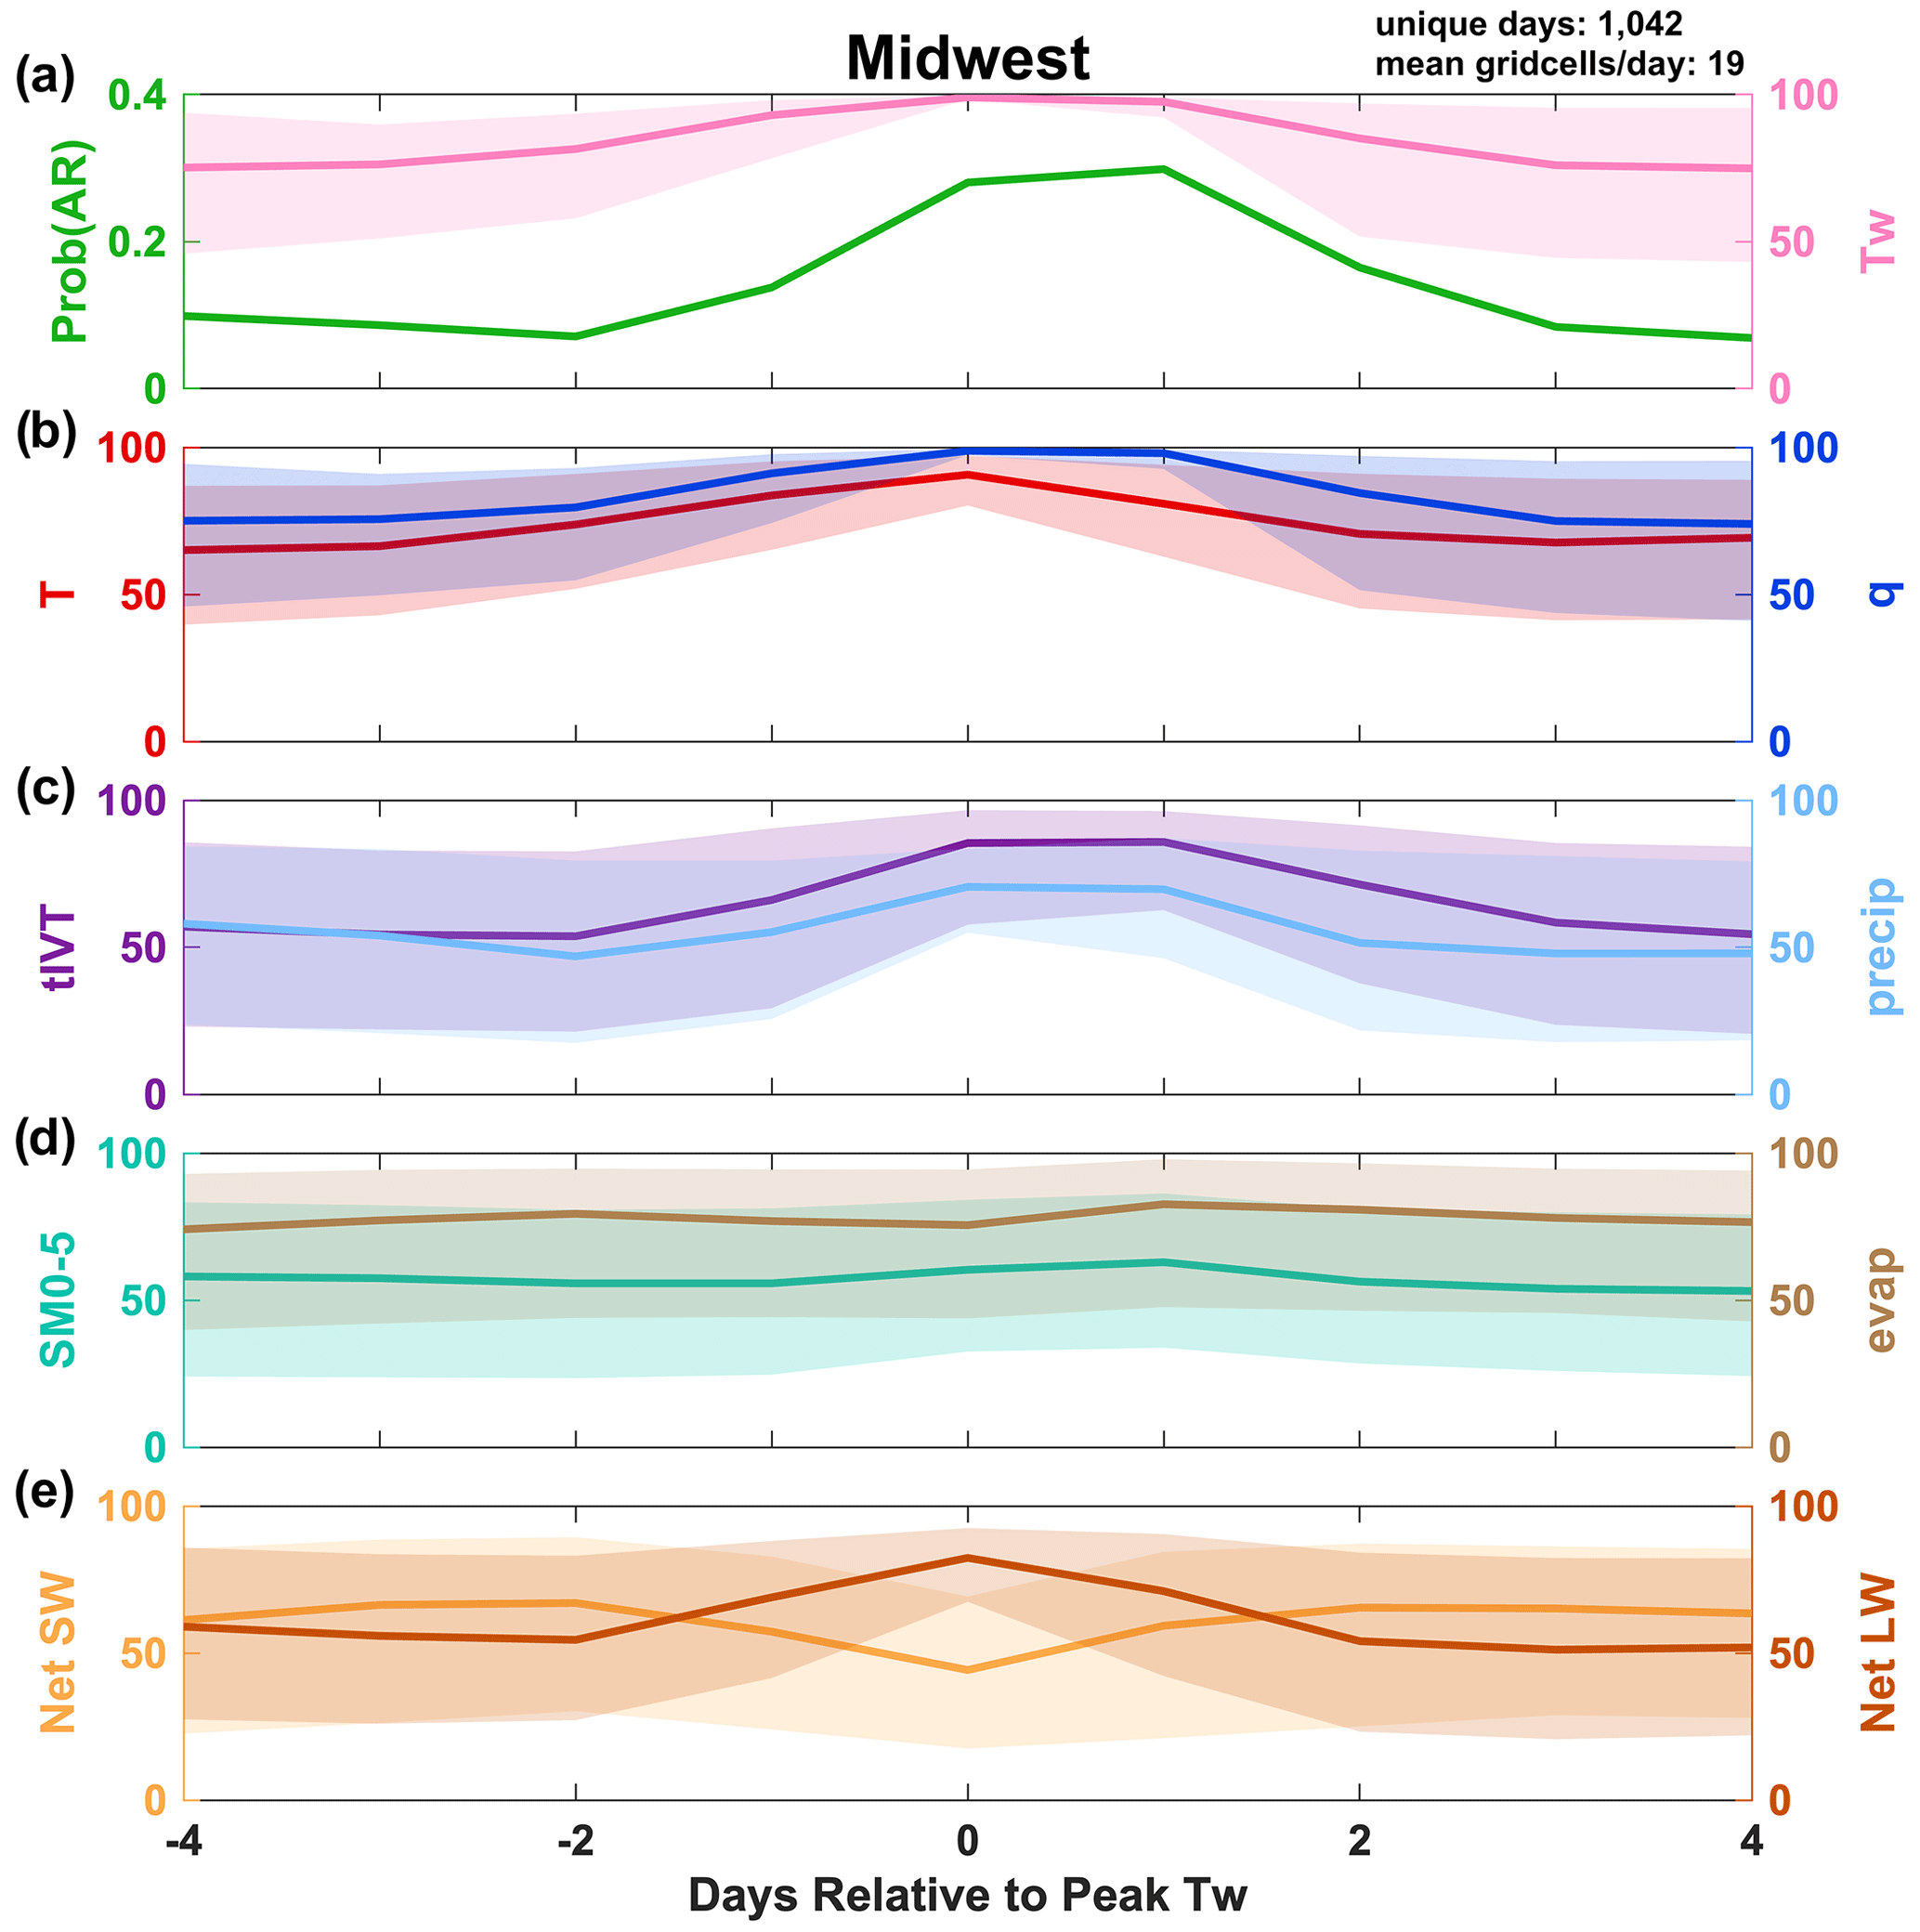
Figure 6Midwest multivariate time series. For Midwest peak humid-heat days, composite daily time series of (a) AR probability and May–September percentiles of wet-bulb temperature and May–September percentiles of (b) temperature and specific humidity, (c) integrated vapor transport and precipitation, (d) 0–5 cm soil moisture and evaporation, and (e) surface net downward shortwave and net longwave radiation.
In much of the United States, we find that warm-season ARs are often associated with preceding humid heat and more specifically with a heat-then-flood timeline – a relationship that derives from the typical orientations and trajectories of mid-latitude synoptic weather systems, with AR-related IVT progressing from southwest to northeast between a surface low and high (Ralph et al., 2020). Heat followed by heavy precipitation is consistent with earlier results for multiple seasons and for several temperate climate zones including the Midwest (Zhang and Villarini, 2020; Sauter et al., 2023a). Our analysis also suggests that the AR–humid-heat connection is due more to ARs' water-vapor transport than to their precipitation effects, at least east of the Rocky Mountains (Fig. 4), where spatially widespread Tw extremes are likeliest to co-occur with high IVT but moderate precipitation (Fig. S8).
Focusing on the Midwest, broader hemispheric context reveals that southerly low-level flow over the region – which has a previously demonstrated humid-heat importance (Raymond et al., 2017) – is attributable to quasi-stationary planetary waves of wavenumber 5, which increase both temperature and moisture through a combination of advective and radiative processes (Lin and Yuan, 2022). Simultaneously, this flow also can manifest as an amplified state of the warm-season Great Plains low-level jet, itself often enhanced by proximity to the North Atlantic subtropical high (Zhou et al., 2020; Budikova et al., 2010). Our work ties this mechanistic view to the detailed regional statistics of Zhang and Villarini (2020) by showing that southerly low-level flow in the Midwest is frequently classified as an AR, and that these ARs mostly occur on the western or northern flank of a ridge, resulting in precipitation that tends to lag behind humid heat because of the usual eastward motion of mid-latitude weather systems (Fig. 5). Intense IVT and precipitation adjacent to a ridge may even contribute to ridge amplification via ascent and condensational warming (Pfahl et al., 2015), and indeed this was found by several recent papers to be an important factor in the 2021 Western North America heat wave (Mo et al., 2022; Loikith and Kalashnikov, 2023). In that case, an AR landfalling in southern Alaska transported anomalous heat and moisture to the nascent ridge over British Columbia, amplifying it through both a sensible-heat effect and a water-vapor radiative feedback effect.
The tendency for ARs and humid heat to be distinct hazards in certain regions (Fig. 1) can be understood through analyses of this sort. Considering first the Northwest, humid-heat days there are in fact mostly hot and dry, driven by processes (sensible heating, warm-air advection) antithetical to those associated with ARs (Raymond et al., 2017). Despite the exceptional anomalies involved, the above example, specifically the geographic offset between landfall location and peak temperature anomaly, may be illustrative in this regard. A valuable reduction of joint risk is also apparent for the Southeast and Southwest. In the Southeast, it may be linked to the dynamics of the summertime westward expansion of the North Atlantic subtropical high (Luo et al., 2021), which would also explain why humid heat is most unlikely near strong ARs there; in the Southwest, this joint-risk reduction may stem from the diffuse and sporadic nature of North American monsoon moisture incursions generally not meeting the Guan–Waliser AR definition (Slinskey et al., 2020; Guan and Waliser, 2019; Adams and Comrie, 1997). A more in-depth study could consider these sorts of subregional variations apparent in Fig. 1 in more detail, adjusting definitions to create customized AR compendia.
While warm-season ARs are relatively common across much of the Midwestern and Eastern United States, their contribution to extreme precipitation is mostly lower than that of cold-season ARs when assessed as a fraction of the seasonal total (Slinskey et al., 2020; Nayak and Villarini, 2017). Nonetheless, they have been tied to major flood events in the Midwest, including in 2008 and 1993, the latter of which caused USD 31 billion (2022) in damages (Budikova et al., 2010; Lavers and Villarini, 2013). Many sites in the Midwest had half or more of their 1980–2011 annual-maxima flood events associated with ARs (Lavers and Villarini, 2013). An important area for future work will be interrogating this AR-mediated humid heat–precipitation connection more directly, including at the sub-daily timescale, as well as the extent to which it can be considered a direct signature of the Great Plains low-level jet (Higgins et al., 1997). However, uncertainties related to the hourly ordering of humid heat and precipitation are embedded in Figs. 5 and 6 and present a key challenge for high-temporal-resolution precipitation analysis: MERRA-2 reanalysis suggests that in a composite sense, precipitation and maximum humid heat precisely coincide, while in station data precipitation is most likely to occur 6–12 h after the humid-heat peak (Fig. S9). MERRA-2 reanalysis hydrological variables, including observation-corrected precipitation, in fact fare well in comparisons against other gridded products (Reichle et al., 2017). Relative to station observations, MERRA-2 reanalysis also has the advantage of self-consistently representing how humid heat and precipitation line up against each other and evolve in space and time, particularly with respect to related quantities such as water vapor and its transport.
Our results emphasize distinct regional patterns across the United States in the nature and strength of AR–humid-heat interactions. In much of the country, and most notably in the northern tier, humid heat is closely linked to warm-season ARs in a spatiotemporally coherent, process-based way. Additionally, this linkage cannot be fully explained by either IVT or precipitation, two of ARs' signature features (Fig. 4). Alternatively stated, in these regions, ARs integrate high IVT and a positioning on the trailing side of high-pressure systems to contribute to increasing humid heat in the hours to days before the temperature fall of an arriving trough (frequently accompanied by convective precipitation) (Kunkel et al., 2012). This integration of likely nonlinear humidity effects also helps explain why the interaction signal tends to be larger for stronger ARs, even when controlling for ridge amplitude. However, the exact physical mechanisms involved remain uncertain and a worthy subject for exploration. We thus argue that consideration of AR dynamics can provide a valuable perspective for future humid-heat and multi-hazard studies in this and other mid-latitude regions, particularly those studies aiming to validate models, diagnose processes, or improve humid-heat predictions at weather-system timescales.
All code needed to replicate the findings of this study is available at https://doi.org/10.5281/zenodo.10628209 (Raymond, 2024). MERRA-2 reanalysis data can be obtained from the NASA Global Modeling and Assimilation Office [GMAO]: https://doi.org/10.5067/7mcpbj41y0k6 (GMAO, 2015). Self-describing code for detecting ARs using the Guan–Waliser algorithm is available at https://doi.org/10.25346/s6/b89kxf (Guan, 2021).
The supplement related to this article is available online at: https://doi.org/10.5194/nhess-24-791-2024-supplement.
CR initiated the study, performed the data analysis, and wrote the manuscript. AS, ES, and DW revised the manuscript.
The contact author has declared that none of the authors has any competing interests.
Publisher's note: Copernicus Publications remains neutral with regard to jurisdictional claims made in the text, published maps, institutional affiliations, or any other geographical representation in this paper. While Copernicus Publications makes every effort to include appropriate place names, the final responsibility lies with the authors.
The authors would like to thank Bin Guan for assistance in reviewing the atmospheric-river literature. A portion of the work for this study was carried out at the Jet Propulsion Laboratory, California Institute of Technology, under a contract with the National Aeronautics and Space Administration (80NM0018D0004).
This research has been supported by the Regional Climate Model Evaluation System grant from the National Aeronautics and Space Administration (grant no. 106029 281945.02.03.03.67).
This paper was edited by Maria-Carmen Llasat and reviewed by two anonymous referees.
Adams, D. K. and Comrie, A. C.: The North American Monsoon, B. Am. Meteorol. Soc., 78, 2197–2213, https://doi.org/10.1175/1520-0477(1997)078<2197:tnam>2.0.co;2, 1997.
Boschat, G., Pezza, A., Simmonds, I., Perkins, S., Cowan, T., and Purich, A.: Large scale and sub-regional connections in the lead up to summer heat wave and extreme rainfall events in eastern Australia, Clim. Dynam., 44, 1823–1840, https://doi.org/10.1007/s00382-014-2214-5, 2015.
Budikova, D., Coleman, J. M. S., Strope, S. A., and Austin, A.: Hydroclimatology of the 2008 Midwest floods, Water Resour. Res., 46, w12524, https://doi.org/10.1029/2010wr009206, 2010.
Buzan, J. R. and Huber, M.: Moist heat stress on a hotter Earth, Annu. Rev. Earth Pl. Sc., 48, 623–655, https://doi.org/10.1146/annurev-earth-053018-060100, 2020.
Corringham, T. W., Ralph, F. M., Gershunov, A., Cayan, D. R., and Talbot, C. A.: Atmospheric rivers drive flood damages in the western United States, Sci. Adv., 5, eaax4631, https://doi.org/10.1126/sciadv.aax4631, 2019.
Davies-Jones, R.: An efficient and accurate method for computing the wet-bulb temperature along pseudoadiabats, Mon. Weather Rev., 136, 2764–2785, https://doi.org/10.1175/2007mwr2224.1, 2008.
Deng, K., Jiang, X., Hu, C., and Chen, D.: More frequent summer heat waves in southwestern China linked to the recent declining of Arctic sea ice, Environ. Res. Lett., 15, 074011, https://doi.org/10.1088/1748-9326/ab8335, 2020.
de Ruiter, M. C., Couasnon, A., van den Homberg, M. J. C., Daniell, J. E., Gill, J. C., and Ward, P. J.: Why we can no longer ignore consecutive disasters, Earths Future, 8, e2019ef001425, https://doi.org/10.1029/2019ef001425, 2020.
de Vries, A. J.: A global climatological perspective on the importance of Rossby wave breaking and intense moisture transport for extreme precipitation events, Weather Clim. Dynam., 2, 129–161, https://doi.org/10.5194/wcd-2-129-2021, 2021.
Gelaro, R., McCarty, W., Suárez, M. J., Todling, R., Molod, A., Takacs, L., Randles, C. A., Darmenov, A., Bosilovich, M. G., Reichle, R., Wargan, K., Coy, L., Cullather, R., Draper, C., Akella, S., Buchard, V., Conaty, A., Da Silva, A. M., Gu, W., Kim, G.-K., Koster, R., Lucchesi, R., Merkova, D., Nielsen, J. E., Partyka, G., Pawson, S., Putman, W., Rienecker, M., Schubert, S. D., Sienkiewicz, M., and Zhao, B.: The Modern-Era Retrospective Analysis for Research and Applications, Version 2 (MERRA-2), J. Climate, 30, 5419–5454, https://doi.org/10.1175/jcli-d-16-0758.1, 2017.
Gimeno, L., Algarra, I., Eiras-Barca, J., Ramos, A. M., and Nieto, R.: Atmospheric river, a term encompassing different meteorological patterns, WIREs Water, 8, e1558, https://doi.org/10.1002/wat2.1558, 2021.
GMAO – Global Modeling and Assimilation Office: MERRA-2 tavg1_2d_flx_Nx: 2d, 1-Hourly, Time-Averaged, Single-Level, Assimilation, Surface Flux Diagnostics V5.12.4, Greenbelt, MD, USA, Goddard Earth Sciences Data and Information Services Center (GES DISC) [data set], https://doi.org/10.5067/7mcpbj41y0k6, 2015.
Gonzales, K. R., Swain, D. L., Barnes, E. A., and Diffenbaugh, N. S.: Moisture- versus wind-dominated flavors of atmospheric rivers, Geophys. Res. Lett., 47, e2020gl090042, https://doi.org/10.1029/2020gl090042, 2020.
Gu, L., Chen, J., Yin, J., Slater, L. J., Wang, H.-M., Guo, Q., Feng, M., Qin, H., and Zhao, T.: Global increases in compound flood-hot extreme hazards under climate warming, Geophys. Res. Lett., 49, e2022gl097726, https://doi.org/10.1029/2022gl097726, 2022.
Guan, B.: Tracking atmospheric rivers globally as elongated targets, version 3, UCLA Dataverse, [data set], https://doi.org/10.25346/s6/b89kxf, 2021.
Guan, B. and Waliser, D. E.: Detection of atmospheric rivers: Evaluation and application of an algorithm for global studies, J. Geophys. Res.-Atmos., 120, 12514–12535, https://doi.org/10.1002/2015jd024257, 2015.
Guan, B. and Waliser, D. E.: Tracking atmospheric rivers globally: Spatial distributions and temporal evolution of life cycle characteristics, J. Geophys. Res.-Atmos., 124, 12523–12552, https://doi.org/10.1029/2019jd031205, 2019.
Haile, G. G., Tang, Q., Li, W., Liu, X., and Zhang, X., Drought: Progress in broadening its understanding, WIREs Water, 7, e1407, https://doi.org/10.1002/wat2.1407, 2019.
Higgins, R. W., Yao, Y., Yarosh, E. S., Janowiak, J. E., and Mo, K. C.: Influence of the Great Plains Low-Level Jet on summertime precipitation and moisture transport over the Central United States, J. Climate, 10, 481–507, https://doi.org/10.1175/1520-0442(1997)010<0481:iotgpl>2.0.co;2, 1997.
Jay, A., Reidmiller, D. R., Avery, C. W., Barrie, D., DeAngelo, B. J., Dave, A., Dzaugis, M., Kolian, M., Lewis, K. L. M., Reeves, K., and Winner, D.: Overview, in: Impacts, Risks, and Adaptation in the United States: Fourth National Climate Assessment, Vol. II, edited by: Reidmiller, D. R., Avery, C. W., Easterling, D. R., Kunkel, K. E., Lewis, K. L. M., Maycock, T. K., and Stewart, B. C., U. S. Global Change Research Program, Washington, DC, 33–71, https://doi.org/10.7930/nca4.2018.ch1, 2018.
Kunkel, K. E., Easterling, D. R., Kristovich, D. A. R., Gleason, B., Stoecker, L., and Smith, R.: Meteorological causes of the secular variations in observed extreme precipitation events for the conterminous United States, J. Hydrometeorol., 13, 1131–1141, https://doi.org/10.1175/jhm-d-11-0108.1, 2012.
Lavers, D. A. and Villarini, G.: Atmospheric rivers and flooding over the Central United States, J. Climate, 26, 7829–7836, https://doi.org/10.1175/jcli-d-13-00212.1, 2013.
Liao, Z., Chen, Y., Li, W., and Zhai, P.: Growing threats from unprecedented sequential flood-hot extremes across China, Geophys. Res. Lett., 48, e2021gl094505, https://doi.org/10.1029/2021gl094505, 2021.
Lin, Q. and Yuan, J.: Linkages between amplified quasi-stationary waves and humid heat extremes in Northern Hemisphere midlatitudes, J. Climate, 35, 4645–4658, https://doi.org/10.1175/jcli-d-21-0952.1, 2022.
Liu, X., Tang, Q., Liu, W., Yang, H., Groisman, P., Leng, G., Ciais, P., Zhang, X., and Sun, S.: The asymmetric impact of abundant preceding rainfall on heat stress in low latitudes, Environ. Res. Lett., 14, 044010, https://doi.org/10.1088/1748-9326/ab018a, 2019.
Loikith, P. C. and Kalashnikov, D. A.: Meteorological analysis of the Pacific Northwest June 2021 heatwave, Mon. Weather Rev., 151, 1303–1319, https://doi.org/10.1175/mwr-d-22-0284.1, 2023.
Luo, H., Adames, Á. F., and Rood, R. B.: A Northern Hemispheric wave train associated with interannual variations in the Bermuda High during boreal summer, J. Climate, 34, 6163–6173, https://doi.org/10.1175/jcli-d-20-0608.1, 2021.
Madonna, E., Wernli, H., Joos, H., and Martius, O.: Warm conveyor belts in the ERA-Interim dataset (1979–2010). Part I: Climatology and potential vorticity evolution, J. Climate, 27, 3–26, https://doi.org/10.1175/jcli-d-12-00720.1, 2014.
Mo, R., Lin, H., and Vitart, F.: An anomalous warm-season trans-Pacific atmospheric river linked to the 2021 western North America heatwave, Nat. Commun. Earth Environ., 3, 127, https://doi.org/10.1038/s43247-022-00459-w, 2022.
Nayak, M. A. and Villarini, G.: A long-term perspective of the hydroclimatological impacts of atmospheric rivers over the central United States, Water Resour. Res., 53, 1144–1166, https://doi.org/10.1002/2016wr019033, 2017.
Neiman, P. J., Ralph, F. M., Wick, G. A., Lundquist, J. D., and Dettinger, M. D.: Meteorological characteristics and overland precipitation impacts of atmospheric rivers affecting the west coast of North America based on eight years of SSM/I satellite observations, J. Hydrometeorol., 9, 22–47, https://doi.org/10.1175/2007jhm855.1, 2008.
Park, C., Soon, S.-W., and Kim, H.: Distinct features of atmospheric rivers in the early versus late East Asian Summer Monsoon and their impacts on monsoon rainfall, J. Geophys. Res.-Atmos., 126, e2020jd033537, https://doi.org/10.1029/2020jd033537, 2021.
Park, C., Son, S.-W., and Guan, B.: Multiscale nature of atmospheric rivers, Geophys. Res. Lett., 50, e2023gl102784, https://doi.org/10.1029/2023gl102784, 2023.
Pfahl, S., Schwierz, C., Croci-Maspoli, M., Grams, C. M., and Wernli, H.: Importance of latent heat release in ascending streams for atmospheric blocking, Nat. Geosci., 8, 610–615, https://doi.org/10.1038/ngeo2487, 2015.
Raghavendra, A., Dai, A., Milrad, S. M., and Cloutier-Bisbee, S. R.: Floridian heatwaves and extreme projections: Future climate projections, Clim. Dynam., 52, 495–508, https://doi.org/10.1007/s00382-018-4148-9, 2019.
Ralph, F. M., Dettinger, M. D., Cairns, M. M., Galarneau, T. J., and Eylander, J.: Defining “atmospheric river”: How the Glossary of Meteorology helped resolve a debate, B. Am. Meteorol. Soc., 99, 837–839, https://doi.org/10.1175/bams-d-17-0157.1, 2018.
Ralph, F. M., Rutz, J. J., Cordeira, J. M., Dettinger, M., Anderson, M., Reynolds, D., Schick, L. J., and Smallcomb, C.: A scale to characterize the strength and impacts of atmospheric rivers, B. Am. Meteorol. Soc., 100, 269–289, https://doi.org/10.1175/bams-d-18-0023.1, 2019.
Ralph, F. M., Dettinger, M. D., Rutz, J. J., and Waliser, D. E. (Eds.): Atmospheric Rivers, Springer, 252 pp., https://doi.org/10.1007/978-3-030-28906-5, 2020.
Raymond, C.: Code for “Linkages between atmospheric rivers and humid heat across the United States”, v1.0, Zenodo [code], https://doi.org/10.5281/zenodo.10628209, 2024.
Raymond, C., Singh, D., and Horton, R. M.: Spatiotemporal patterns and synoptics of extreme wet-bulb temperature in the contiguous United States, J. Geophys. Res.-Atmos., 122, 13108–13124, https://doi.org/10.1002/2017jd027140, 2017.
Raymond, C., Matthews, T. K., and Horton, R. M.: The emergence of heat and humidity too severe for human tolerance, Sci. Adv., 6, 1–8, https://doi.org/10.1126/sciadv.aaw1838, 2020.
Reichle, R. H., Draper, C. S., Liu, Q., Girotto, M., Mahanama, S. P. P., Koster, R. D., and De Lannoy, G. J. M.: Assessment of MERRA-2 land surface hydrology estimates, J. Climate, 30, 2937–2960, https://doi.org/10.1175/jcli-d-16-0720.1, 2017.
Reid, K. J., King, A. D., Lane, T. P., and Hudson, D.: Tropical, subtropical, and extratropical atmospheric rivers in the Australian region, J. Climate, 35, 2697–2708, https://doi.org/10.1175/jcli-d-21-0606.1, 2022.
Sauter, C., Fowler, H. J., Westra, S., Ali, H., Peleg, N., and White, C. J.: Compound extreme hourly rainfall preconditioned by heatwaves most likely in the mid-latitudes, Wea. Clim. Extr., 40, 100563, https://doi.org/10.1016/j.wace.2023.100563, 2023a.
Sauter, C., White, C. J., Fowler, H. J., and Westra, S.: Temporally-compounding heatwave-heavy rainfall events in Australia, Int. J. Climatol., 43, 1050–1061, https://doi.org/10.1002/joc.7872, 2023b.
Slinskey, E. A., Loikith, P. C., Waliser, D. E., Guan, B., and Martin, A.: A climatology of atmospheric rivers and associated precipitation for the seven U. S. National Climate Assessment regions, J. Hydrometeorol., 21, 2439–2456, https://doi.org/10.1175/jhm-d-20-0039.1, 2020.
Speizer, S., Raymond, C., Ivanovich, C., and Horton, R. M.: Concentrated and intensifying humid heat extremes in the IPCC AR6 regions, Geophys. Res. Lett., 49, e2021gl097261, https://doi.org/10.1029/2021gl097261, 2022.
Stensrud, D.: Importance of low-level jets to climate: A review, J. Climate, 9, 1698–1711, 1996.
You, J. and Wang, S.: Higher probability of occurrence of hotter and shorter heat waves followed by heavy rainfall, Geophys. Res. Lett., 48, e2021gl094831, https://doi.org/10.1029/2021gl094831, 2021.
Zhang, W. and Villarini, G.: Deadly compound heat stress-flooding hazard across the central United States, Geophys. Res. Lett., 47, e2020GL089185, https://doi.org/10.1029/2020gl089185, 2020.
Zhou, W., Leung, L. R., Song, F., and Lu, J.: Future changes in the Great Plains Low-Level Jet governed by seasonally dependent pattern changes in the North Atlantic Subtropical High, Geophys. Res. Lett., 48, e2020gl090356, https://doi.org/10.1029/2020gl090356, 2020.