the Creative Commons Attribution 4.0 License.
the Creative Commons Attribution 4.0 License.
 | 17 Jan 2024
Spatial accessibility of emergency medical services under inclement weather: a case study in Beijing, China
Yuting Zhang
Kai Liu
Xiaoyong Ni
Ming Wang
Jianchun Zheng
Mengting Liu
Dapeng Yu
The accessibility of emergency medical services (EMSs) is not only determined by the distribution of emergency medical facilities but is also influenced by weather conditions. Inclement weather could affect the efficiency of the city's traffic network and further affect the response time of EMSs, which could therefore be an essential impact factor on the safety of human lives. This study proposes an EMSs-accessibility quantification method based on selected indicators, explores the influence of inclement weather on EMSs accessibility, and identifies the hotspots that have difficulty accessing timely EMSs. A case study was implemented in Beijing, which is a typical megacity in China, based on the ground-truth traffic data of the whole city in 2019. The results show that inclement weather has a general negative impact on EMSs accessibility. Under an inclement weather scenario, the area in the city that could get EMSs within 15 min would decrease by 13 % compared with a normal scenario (the average state of weekdays without precipitation), while in some suburban townships, the population that could get 15 min EMSs would decrease by 40 %. We found that snowfall has a greater impact on the accessibility of EMSs than rainfall. Although on the whole, the urban area would have more traffic speed reduction, towns in suburban areas with lower baseline EMSs accessibility are more vulnerable to inclement weather. Under the worst scenario in 2019, 12.6 % of the population (about 3.5 million people) could not get EMSs within 15 min, compared with 7.5 % with normal weather conditions. This study could provide a scientific reference for city planning departments to optimize traffic under inclement weather and the site selection of emergency medical facilities.
- Article
(13661 KB) - Full-text XML
- BibTeX
- EndNote


Emergency medical services (EMSs) are a pivotal part of the public health system, and the response time of EMSs is a vital factor in decreasing morbidity and improving survival (Blackwell and Kaufman, 2002). In China, the EMSs system is mainly composed of prehospital emergency services and in-hospital emergency services. Prehospital emergency service refers to on-site emergency treatment, guardianship in transit, and handover with in-hospital emergency institutions. The efficiency of emergency services is highly vulnerable to inclement weather conditions such as rain, snow, and fog. The reason why inclement weather conditions would reduce the efficiency of emergency services is that inclement weather conditions would reduce road capacity, increase transfer time, and sometimes block roads completely (Agarwal et al., 2006; Chang et al., 2013; Cools et al., 2010; Suarez et al., 2005; Zhang and Chen, 2019), which would lead to a reduction in spatial accessibility and a delay in response time. In addition, accidents such as traffic accidents and lightning accidents are more prone to occur in inclement weather, which increases the demand for EMSs (Edwards, 1996; Ramgopal et al., 2021). For example, on 21 July 2012, Beijing was hit by a rainstorm, with the average cumulative rainfall reaching 170 mm, which caused 63 roads to be seriously flooded. This rainfall event led to a one-third increase in the number of calls to the emergency center, and the transfer time of ambulances was significantly prolonged, taking approximately 1.5–2 h for each evacuation during the rainstorm. Usually, the transfer time would not be more than 1 h (Wang et al., 2013; Beijing Evening, 2012). On 6 February 2022, in Cleveland, USA, an ambulance got stuck in the snow causing a long delay in getting the patient to the hospital (Fox 8 News, 2022). On 3 August 2021, in Chattogram, Bangladesh, a daily rainfall of 190.6 mm caused many ambulances with patients to get stuck in different areas of the city (Business Standard, 2021). In the context of global climate change and rapid urbanization, extreme inclement weather events strike cities more frequently (Huber and Gulledge, 2011; Stott, 2016; Stott et al., 2016), and the problem of urban rainstorms and waterlogging (the phenomenon of a stagnant water disaster in an urban area due to heavy rainfall or continuous precipitation) has become increasingly prominent. It is therefore of great importance to investigate the influence of inclement weather on the spatial accessibility of EMSs.
The spatial accessibility of EMSs is defined by the travel impedance (distance or time) between service locations and the scene (Guagliardo, 2004). A large body of research on spatial accessibility is concerned with access to hospitals (Luo and Wang, 2003; Mao and Nekorchuk, 2013; Pan et al., 2018; Yang et al., 2020; Yin et al., 2021) and first-aid stations (Hashtarkhani et al., 2020; Jones and Bentham, 1995; Shin and Lee, 2018). To measure the EMSs accessibility, the two-step floating catchment area (2SFCA) method is one of the common methods (Chen and Jia, 2019; Kanuganti et al., 2016; Li et al., 2021; Luo and Qi, 2009). The 2SFCA method considers accessibility to be mediated by not only the distance decay but also the interactions between supply and demand (Chen and Jia, 2019), which is more suitable for normal scenarios. While in the studies focusing on the influence of inclement weather on EMSs, people are more concerned about the transportation situation, instead of the interaction between supply and demand. The coverage analysis method (Coles et al., 2017; Green et al., 2017; Yu et al., 2020) or shortest path analysis method (Albano et al., 2014; Andersson and Stålhult, 2014) are more widely used. These methods could better characterize the reduction in accessibility caused by the road service degradation. For example, Yu et al. (2020) analyzed the accessibility of emergency service in England and identified vulnerability hotspots by quantifying the EMSs coverage of area and population within different time radii under different flood scenarios, Coles et al. (2017) measured the travel time and service area coverage of EMSs in York, UK, under flood scenarios by using FloodMap-HydroInundation2D to model flood inundation, and Yin et al. (2021) assessed the vulnerability of EMSs to surface water flooding in Shanghai, China, by quantifying accessibility in terms of service area, population coverage, and response time. They simulated urban waterlogging scenarios under different rainfall intensities and set traffic speed based on recorded average traffic speed under normal conditions, which did not consider the traffic speed variations induced by precipitation. Andersson and Stålhult (2014) used network analysis methods to generate the shortest paths from hospitals to various administrative areas in Manila, Philippines, and evaluated the impact of different flood events on these paths. Most of these studies assumed that roads are impassable or traffic speed has a certain degree of reduction when the flooded water depth reaches a specific depth, and further evaluated the impact of rainstorm on EMSs accessibility. Due to insufficient recorded traffic data, relatively few studies have been performed to analyze the impact of road access capacity on EMSs accessibility according to actual traffic speed variation.
In this study, we explore the impact of inclement weather on traffic and EMSs accessibility based on ground-truth traffic data. Beijing, the capital of China, is used as a case study. The reductions in EMSs accessibility of Beijing under inclement weather in 2019 are quantified and the urban–rural disparities in the distribution of emergency medical facilities are further analyzed. Our study provides an approach for evaluating the effectiveness and fairness of EMSs based on ground-truth traffic data, and the results can not only provide reference for the optimization of EMSs in Beijing but also provide reference cases for other cities, which has a great practical significance.
2.1 Study area
Beijing, with a total area of 16 410.54 km2, is located in the northern part of the North China Plain (Fig. 1a). According to the seventh national census (National Bureau of Statistics, 2021), Beijing has a population of 21.89 million people. As one of the largest metropolises in the world, Beijing has a monsoon-driven humid continental climate with an average annual precipitation of approximately 600 mm, 80 % of which is concentrated from June to September (Song et al., 2014). The terrain of Beijing is high in the northwest and low in the southeast, which is conducive to the formation of heavy rain and triggers strong convective weather. Beijing has a typical monocentric urban structure and the area within the Six Ring Road is generally recognized as the urban core area. It is obvious that the density of the transportation network and medical facilities in the urban area of Beijing are much higher than those in the suburbs (Fig. 1b).
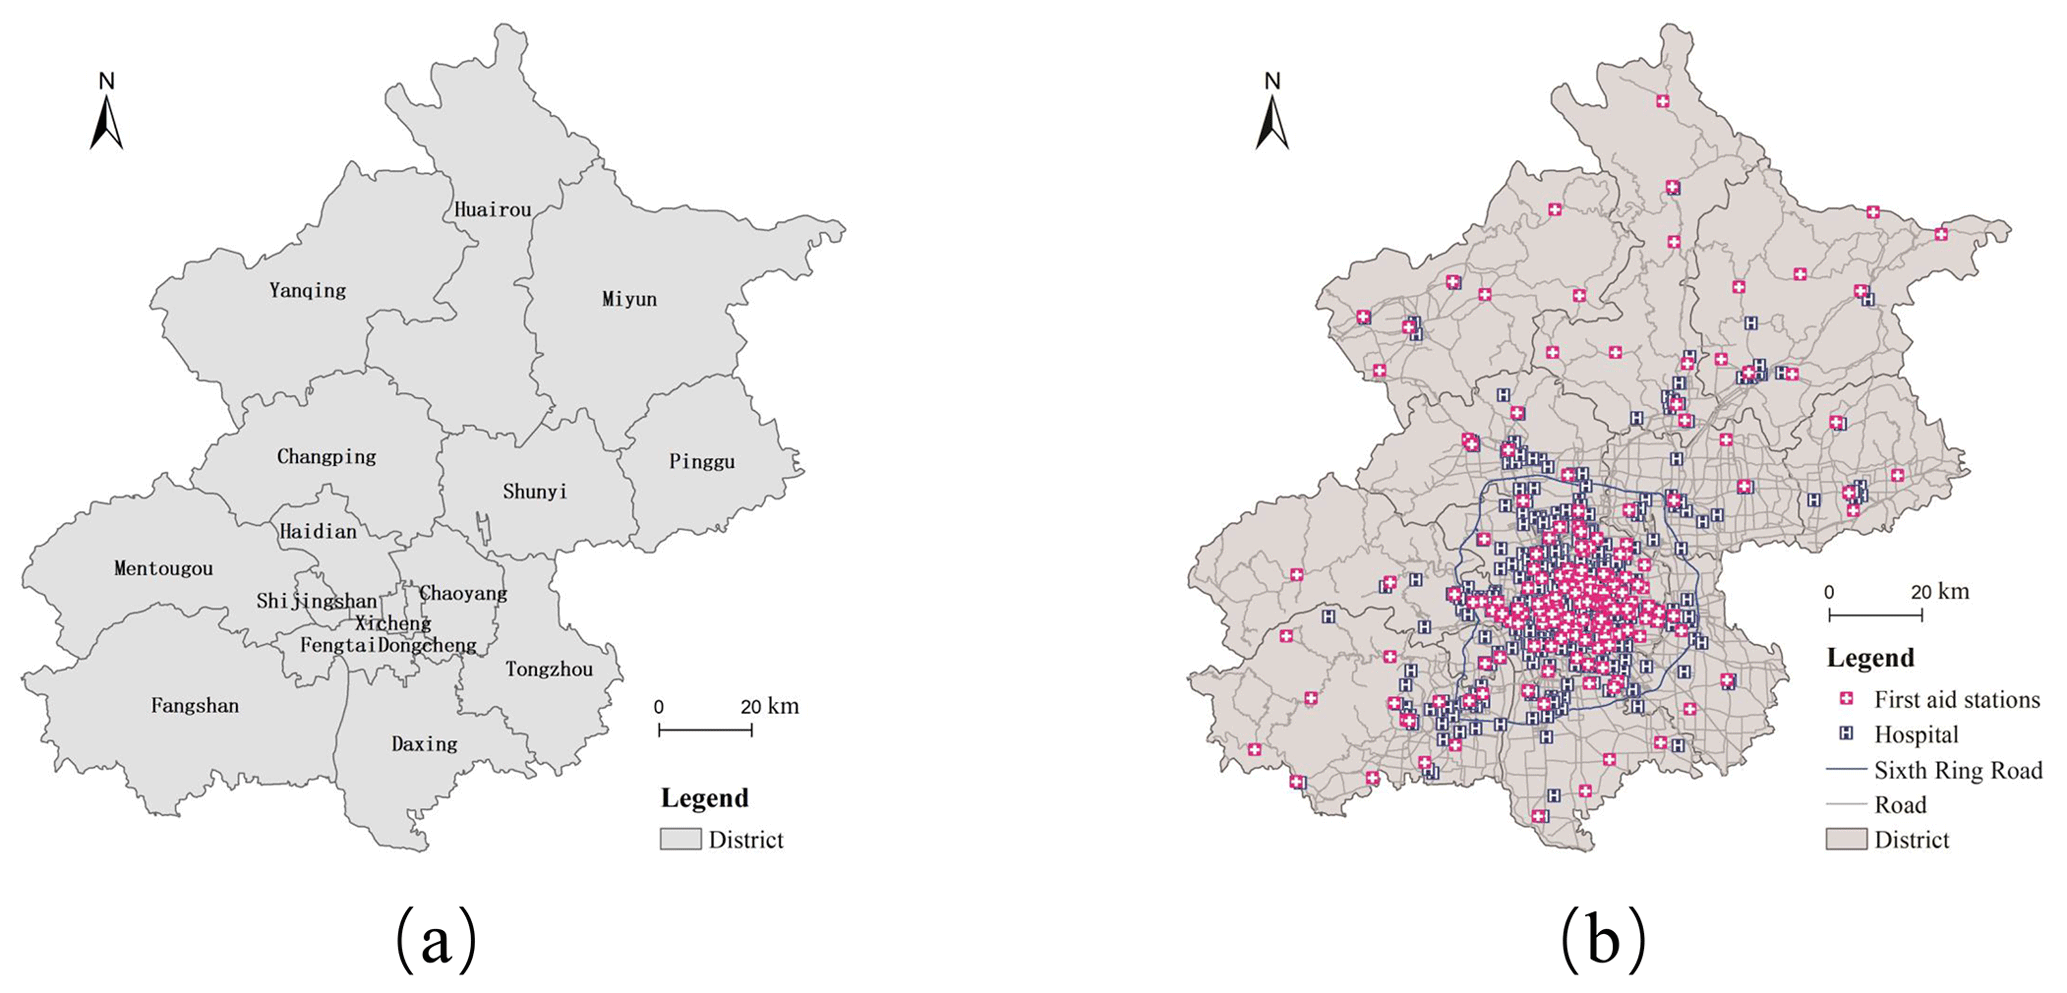
Figure 1Panel (a) shows the administrative division of Beijing and (b) shows EMSs facility locations (produced using ArcGIS 10.8).
2.2 Dataset
The data involved in this paper mainly include traffic data, meteorological data, EMSs data, and demographic data. Based on traffic data and meteorological data, we could build a topology road network (using node and edge primitives to describe interconnected linear features (roads) and points (roads junctions) on a map) with transfer time as an impedance under inclement weather conditions and corresponding normal weather conditions. Combining the topology road network with medical facility locations and the distribution of the population by ArcGIS 10.8, we could further analyze the spatial accessibility of EMSs.
2.2.1 Traffic and road network data
The traffic data of Beijing are obtained from the Beijing Municipal Commission of Transport. The data span is from 1 January to 31 December 2019, including the average traffic speed (in meters per second) of each road section, updated every 2 min. The road network data contain 71 188 nodes and 81 523 edges, which can basically cover all the main roads in the whole Beijing area.
2.2.2 Meteorological data
The meteorological data utilized in this paper are TRMM (Tropical Rainfall Measuring Mission) precipitation data obtained from NASA, with a spatial resolution of 0.1∘ × 0.1∘ (approximately 10 km × 10 km) and a temporal resolution of 30 min. The whole city of Beijing is covered by 175 grids.
According to the classification of precipitation, moderate rain is defined as the rainfall that is 5.0–14.9 mm 12 h−1 (China Meteorological Administration, 2012). We chose the intermediate value of the interval and averaged it to each hour. In this study, we set a rule that if the precipitation of more than 10 grids (over 5 % area of the city) in Beijing is greater than 1.5 mm in 2 h, it is considered a precipitation event. This amount of precipitation may not be high enough to cause the rainfall-runoff to exceed the drainage capacity of the sewer network in Beijing (DB11/685–2021 and DB11/T1575–2018). But the precipitation would cause slippery roads and decrease in drivers' visibility, which would lead to a reduction in traffic efficiency and accessibility (Chu and Fwa, 2018; Katz et al., 2012). The average precipitation of the whole city on each date is averaged by the precipitation of all grids. In 2019, 19 working days of rainfall and 3 working days of snowfall were selected.
2.2.3 Medical facilities data
The medical facilities mentioned in this paper mainly refer to two categories: first-aid stations and hospitals, as shown in Fig. 1b. The locations of these first-aid stations were obtained from the distribution map of first-aid stations (Beijing Emergency Medical Center, 2021), including 72 stations in the downtown area and 98 stations in the suburbs. The hospital point data were extracted from the online map point of interest (POI) data of Beijing in 2019 (Gaode Maps, 2021). After coordinate correction and de-duplication, it contains a total of 630 general hospitals, 76 of which are third-level grade-A hospitals (the highest level in the evaluation system of hospitals in mainland China).
2.2.4 Demographic data
The demographic data of 2019 were obtained from WorldPop (2018) with a spatial resolution of 100 m × 100 m. The data records present the population size.
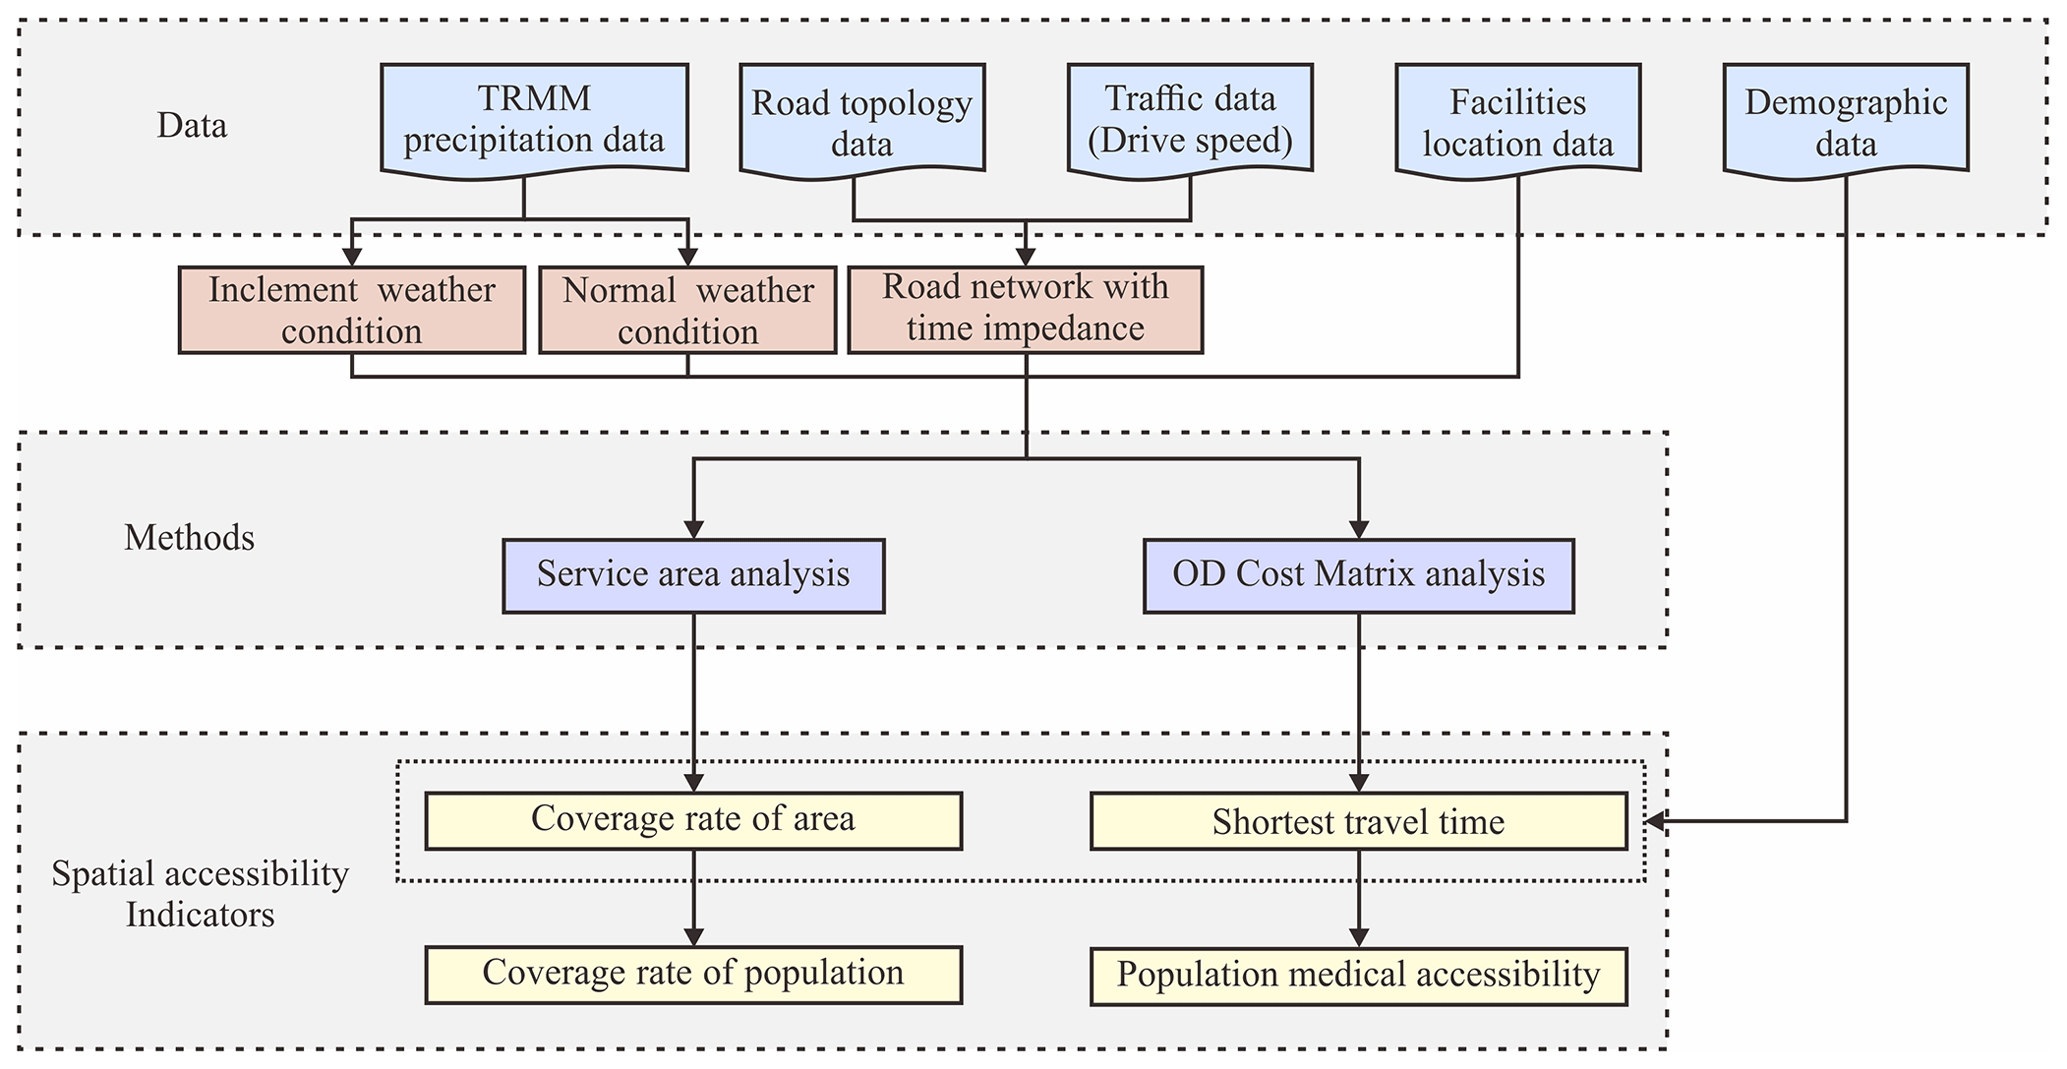
Figure 2 illustrates the methodology of this study. We first divide the weather conditions into two categories, inclement weather conditions and normal weather conditions, according to precipitation data. Second, the time impedance of each road section is analyzed based on the road network and traffic speed for both inclement and normal weather conditions, and the respective coverage rate of first-aid stations and the shortest transfer time to hospitals are calculated. Finally, the spatial accessibility to the population is calculated and hotspots are identified. Both the service area analysis and the OD cost matrix analysis are GIS based and were done in ArcGIS 10.8. In this study, we made the following assumptions:
-
The ambulances move at the average speed all the time and would always take the shortest path in space.
-
In network analysis, the location of facilities is approximately considered to be on the nearest road point vertically.
-
In OD analysis, we use the centroid as the origin point to represent the whole grid, and the shortest path to the hospital of all points within the grid is the same.
-
The prehospital EMSs are divided into two parts: the ambulances depart from the first-aid station to the scene and from the scene to the nearest hospital.
-
The proper limitation of EMSs response time is 15 min. (The case where a patient is transferred directly from the scene to an EMSs facility via private transportation is not considered in this study.)
-
The hospitals' carrying capacity is not considered in this study and we assume that the demand of EMSs would not exceed the first-aid stations' and hospitals' carrying capacity.
3.1 Fluctuation of traffic speed under inclement weather
For each weekday with precipitation, the traffic speed data of the selected period are extracted and averaged. To avoid the inherent temporal variations in traffic speed resulting from the day-of-week effects, holiday effects (Cools et al., 2007), season, and other non-meteorological-related factors, we introduce baseline days for inclement weather days in this study to calculate the traffic speed fluctuation. For a given precipitation day, we search for the same day of the week in the 2 weeks forward and backward to obtain the corresponding baseline days without precipitation. Only non-holidays without precipitation events are selected as baseline days; otherwise, we would continue to look forward or backward until four baseline days are found. The average speed data of the four baseline days in the selected period were then averaged as the baseline speed for the given precipitation day, and the traffic speed reduction rate was calculated by Eqs. (1) and (2):
where rc is the traffic speed reduction rate in the selected period of the precipitation day to its corresponding baseline day, vp is the traffic speed in the selected period of the given precipitation day and is the average of the real-time traffic speed during every 2 min during the selected time period in that day, and vb is the traffic speed in the selected period of the baseline precipitation days, which is calculated by Eq. (2):
where is the traffic speed in the selected period of a baseline day and is the average of the real-time traffic speed during every 2 min during the selected time period of that day, and m is the number of baseline days. In this case, m equals 4. The average traffic speed reduction rate is obtained by averaging the reduction rates of all roads with reduced speed in the city.
3.2 Analysis of coverage rate
3.2.1 Coverage rate of area
A service area is a region that encompasses all roads that are accessible within a specified impedance. Either distance or time can be used as impedance. In this study, the time needed to pass through the road is calculated by the length of each road divided by its corresponding traffic speed, and the service area analysis is carried out with time as the impedance. In different scenarios, the time impedance varies, since the traffic speed of each road is set according to the real-time traffic speed record of the chosen date and chosen period. The core idea of the service area analysis function is to generate service area polygons by setting each first-aid station as the starting point and the traveling time as the driving radius. Under the inclement weather conditions and their corresponding baseline conditions, the service area analysis of the 15 min (Yin et al., 2021) arrival time was carried out. The total area of the obtained service area polygon is calculated to obtain the EMSs coverage. The coverage rate of area is calculated by Eq. (3):
In Eq. (3), ra is the coverage rate of the area, A is the total area of the city, and As is the area of the service area.
3.2.2 Coverage rate of population
To analyze the matching degree between the EMSs coverage and the population distribution and identify the hotspots whose EMSs coverage of the population is most affected in inclement weather, we downscaled the calculation to the township scale. Based on the grid population data of WorldPop and the coverage areas of EMSs under different scenarios analyzed by service areas, we calculated the coverage rates of EMSs of the population for each township. In each scenario, the polygon of the service area obtained from the result of service area analysis is used to mask the population grid, and the covered population divided by the total population is the population coverage of the township (Eq. 4):
In Eq. (4), rp is the coverage rate of the population, P is the total population of the township, and Ps is the population that is covered by the service area.
3.3 Spatial accessibility to hospitals
The spatial accessibility to hospitals is quantified by two indicators: the shortest transfer time and the total transfer time. The shortest transfer time is calculated by the origin-to-destination (OD) cost matrix analysis method, which can find and measure the minimum cost path from multiple starting points to single or multiple destinations in the network. In this study, we calculate the minimum transfer time odi required for each population grid centroid to reach the nearest hospital. To reduce the calculation cost, the population grid data with 100 m resolution are aggregated and converted into 1000 m resolution. This could be interpreted as a sampling method, because we use the centroid point of the grid to represent the other possible starting points in the grid, and we ignore the tolerance caused by the travel time inside the grids.
The total transfer time is introduced to quantify the cumulative transfer time for each population grid based on its population size, which is the number of potential users of EMSs. The total transfer time is defined in this study by the shortest transfer time of each population grid to the nearest hospital multiplied by its population. The numerical value has no practical significance and is only used for comparing the spatial differences among regions. For each population grid centroid i, its total transfer time (T) is calculated by Eq. (5):
In Eq. (5), odi is the minimum transfer time and Pi is the population of the grid.
Based on the characteristics of morning and evening rush traffic flow on weekdays, the diurnal variation in traffic can be divided into four periods: morning rush hours (07:00–09:00), daily regular hours (09:00–17:00), evening rush hours (17:00–19:00), and evening regular hours (19:00–22:00). We compared EMSs coverage at different periods of the day and the results show that the period of morning rush hours has the most significant negative impact on the accessibility of EMSs. We divided the city into the inner city and suburban areas along the Sixth Ring Road. Taking the average 15 min coverage of the area of all Mondays in November as an example, we determined that (1) in the whole city (both inner city and suburban), the coverage rate of EMSs is 38.72 % in morning rush hours, compared with 40 % (±0.3 %) in the remaining periods; and (2) in the inner city, the coverage rate is 77.37 % in morning rush hours, compared with 83 % (±0.6 %) in the remaining periods. Therefore, the accessibility of EMSs during the morning rush period deserves more attention. Hence, our subsequent analysis is mainly concentrated on the morning rush period.
4.1 Impact of inclement weather on the traffic and EMSs coverage
4.1.1 Correlation between precipitation and traffic speed
Figure 3 shows the relationship between average precipitation during morning rush hours in the city and the average traffic speed reduction rate of all roads that have speed loss in the city on weekdays. The unit of precipitation data is mm 2 h−1, which indicates the total precipitation in the 2 h of morning rush hours. The negative values indicate that the traffic speed decreases in inclement weather conditions. We could see that the average traffic speed would decrease 10 %–15 % on most precipitation days. The average speed decreases most on 1 and 9 July, 10 September, and 16 December, and reached 18 %–25 %. The dates 1 July (Party's Day) and 10 September (Teachers Day) are special days in China and the traffic speed is affected by both the inclement weather and traffic control. On 16 December it was a snowy day with a precipitation of 0.13 mm 2 h−1, and snowfall has a greater impact on traffic than rainfall with the same precipitation (Agarwal et al., 2005). Figure 4 illustrates the spatial difference of traffic speed reduction and distribution of precipitation on precipitation days. A large number of red roads (with traffic speed reduction over 10 km h−1) can be observed on the 4 d mentioned above. By comparing the distribution of precipitation and traffic speed reduction on different dates in Fig. 4, it can be seen that the precipitation in the 4 d with the most severe speed reduction was moderate, and the precipitation distribution of the whole city was relatively uniform. Compared with other rainy days, although the precipitation on 5 July, 9 August, and 19 September was larger and concentrated in the inner city, the traffic speed reduction of the whole city was not as serious as on the 4 d mentioned above, which may have been caused by the decrease in people's willingness to travel with the increase in rain.
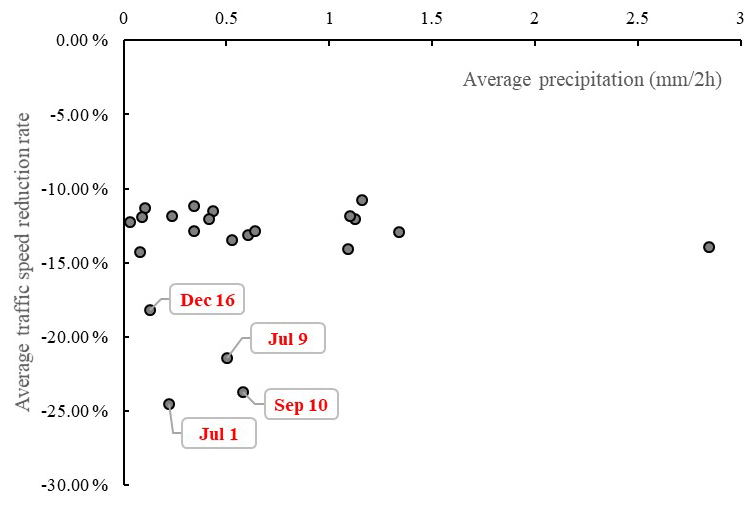
Figure 3The correlation between average precipitation and average traffic speed reduction rate (produced using Excel 2016).
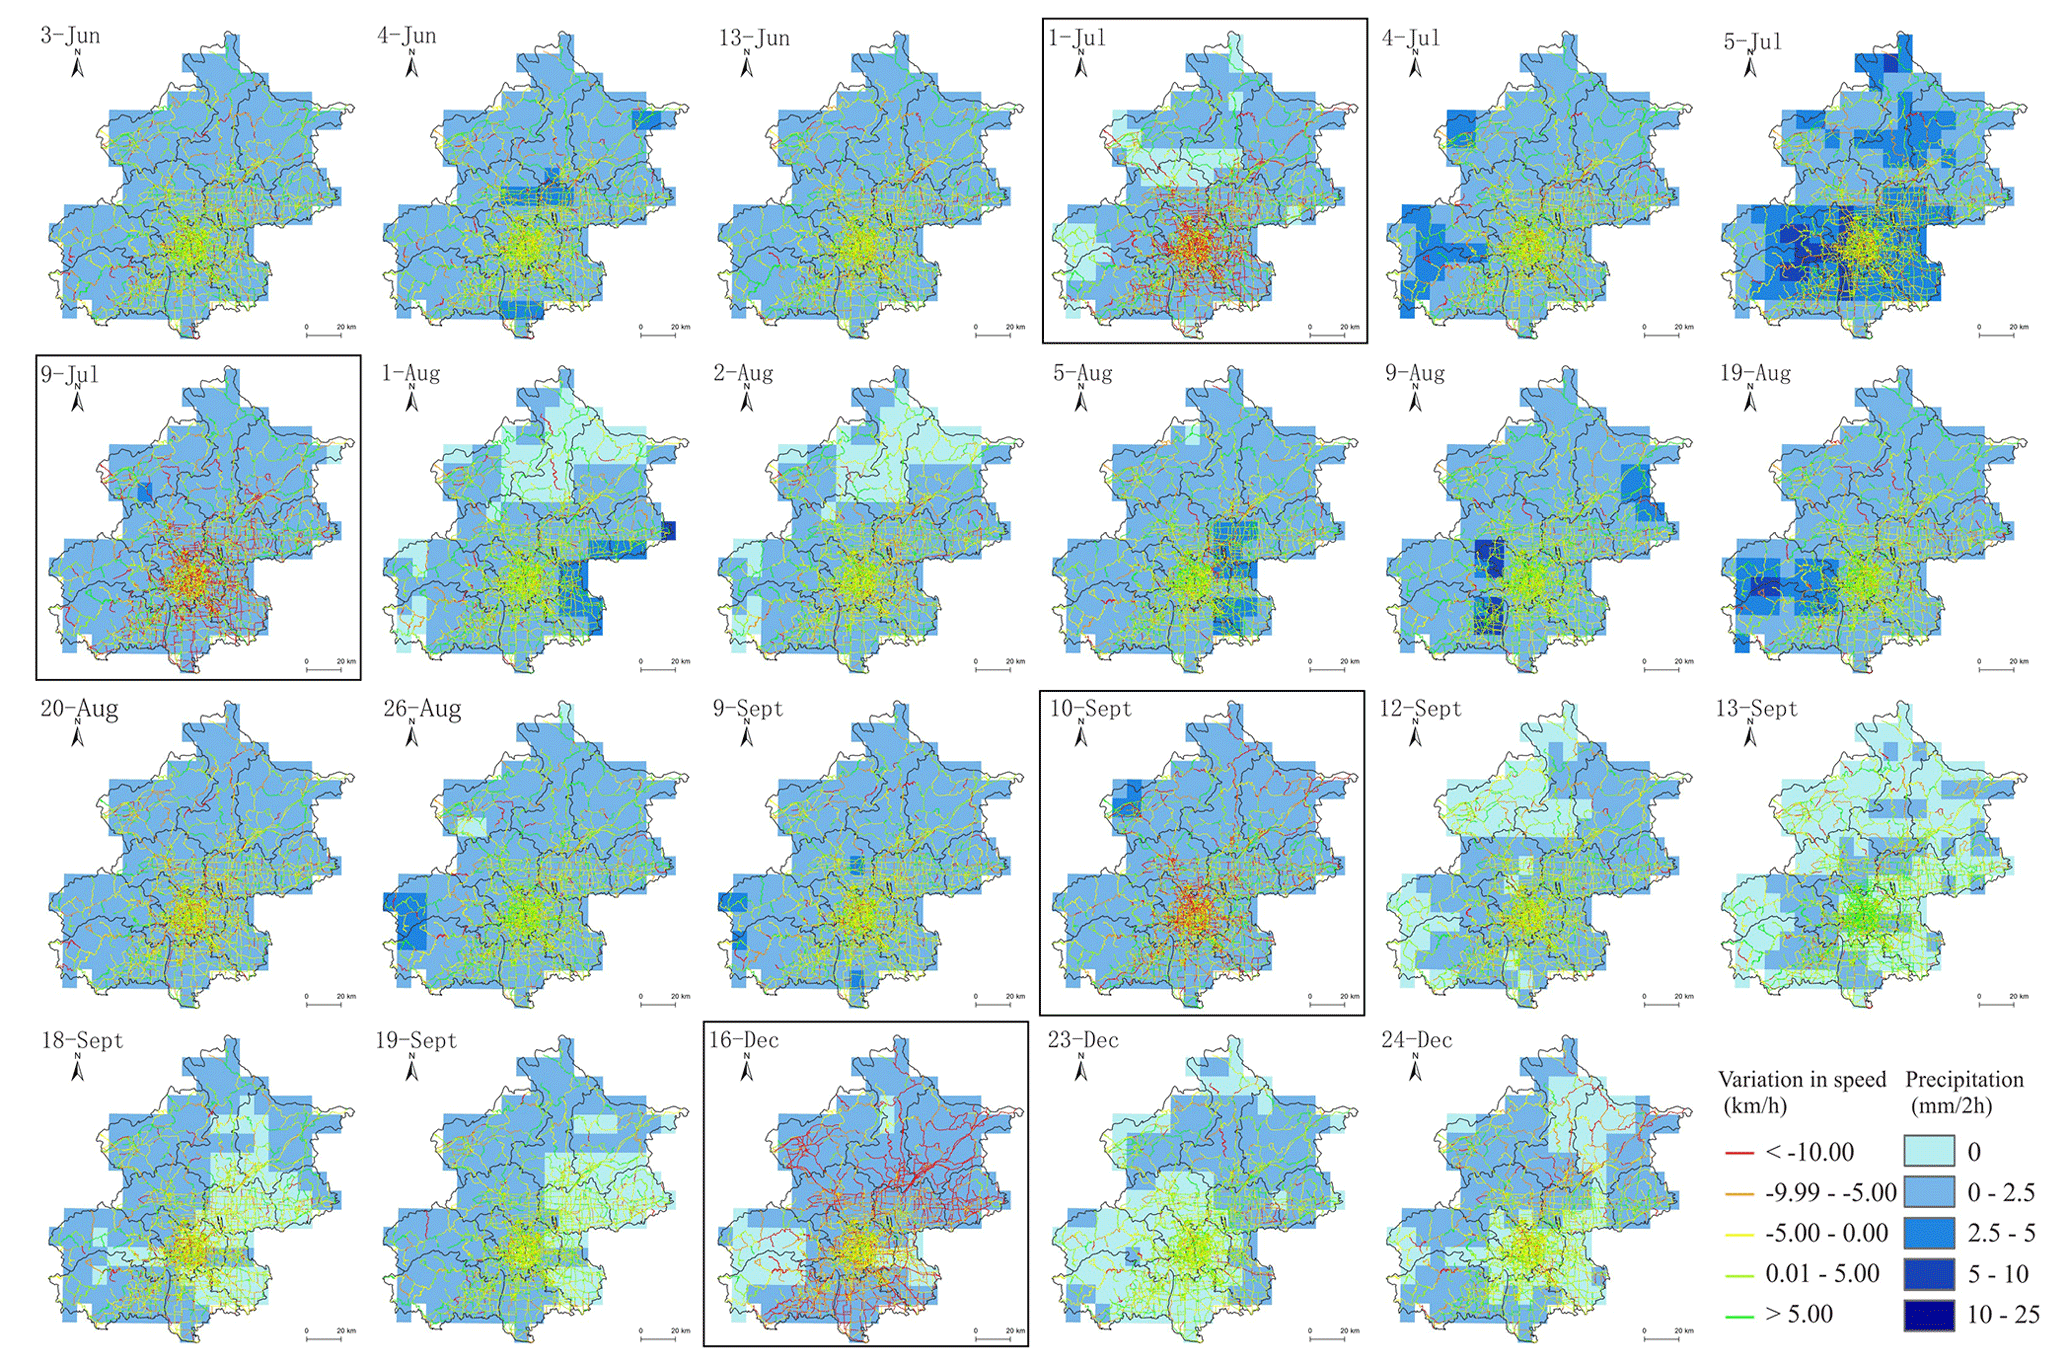
Figure 4Variation in drive speed and distribution of precipitation on selected precipitation days (the four subfigures with black borders show the four most affected scenarios; figure produced using ArcGIS 10.8 and CorelDraw 2019).
4.1.2 Correlation between precipitation and EMSs coverage rate
The change in the coverage rate of EMSs was calculated by subtracting the coverage rate under the inclement weather condition from that under the corresponding baseline condition. Figure 5 shows the correlation between the average precipitation during morning rush hours and the relative change values of the EMSs coverage rate of the area. The negative values indicate that the coverage of EMSs decreases in inclement weather conditions. Consistent with the pattern of the traffic speed reduction, the worst loss of coverage rate also occurred on 3 rainy days, i.e., 1 July (Mon), 9 July (Tue), and 10 September (Tue), and 1 snowy day, i.e., 16 December (Mon), during which the 15 min EMSs coverage rate decreased by an average of 4.6 %, 5.6 %, 4.2 %, and 13.3 %. Combined with the spatial distribution of precipitation and traffic variation (Fig. 4), the snowfall on 16 December caused a large traffic speed reduction on the suburban roads, which led to a significant reduction in overall EMSs coverage. Therefore, we chose these 4 d as the worst weather scenario of the year and analyzed the spatial differences of medical accessibility in the whole city.
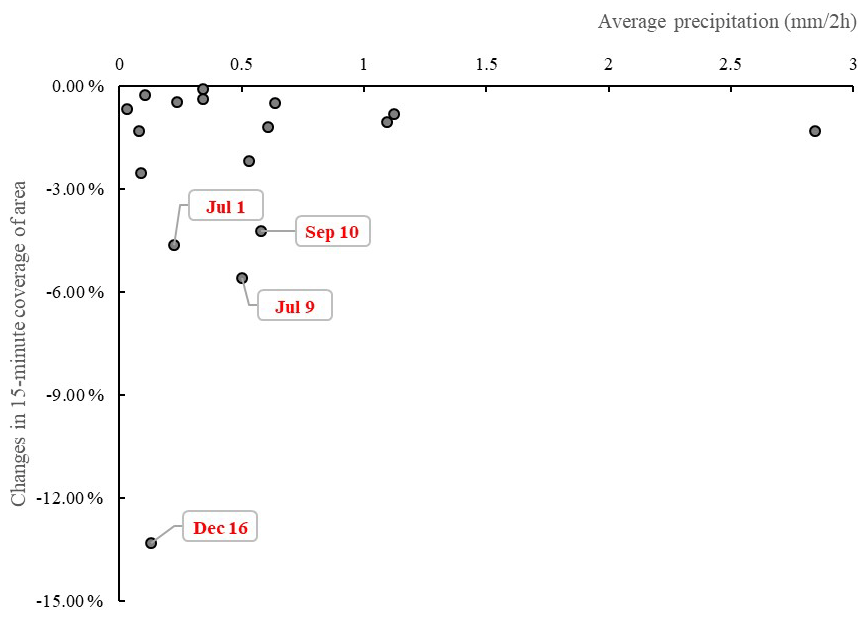
Figure 5The correlation between the average precipitation and the relative change in the EMSs coverage rate of the area (produced using Excel 2016).
4.2 Spatial distribution of EMSs accessibility under the worst scenario
4.2.1 EMSs coverage rate of population
We calculated the 15 min EMSs coverage rate of the population under the four most severely affected inclement weather conditions of 1 and 9 July, 10 September, and 16 December, and their corresponding baseline conditions at the township scale in Beijing (Fig. 6). The results demonstrate that most parts of downtown areas, including the districts of Dongcheng, Xicheng, Haidian, and Chaoyang, could have 90 %–100 % population coverage of EMSs, regardless of the weather conditions. In the large area of suburbs, the coverage rate of the population varied from lower than 30 % to 90 %. Under inclement weather conditions, the coverage rate in some towns in the suburbs would drop sharply, with the worst townships having a 40 % reduction. The reason behind this difference is that the distribution of first-aid stations in Beijing is similar to the distribution of the road network, which is dense in the central urban area and sparse in the suburbs.
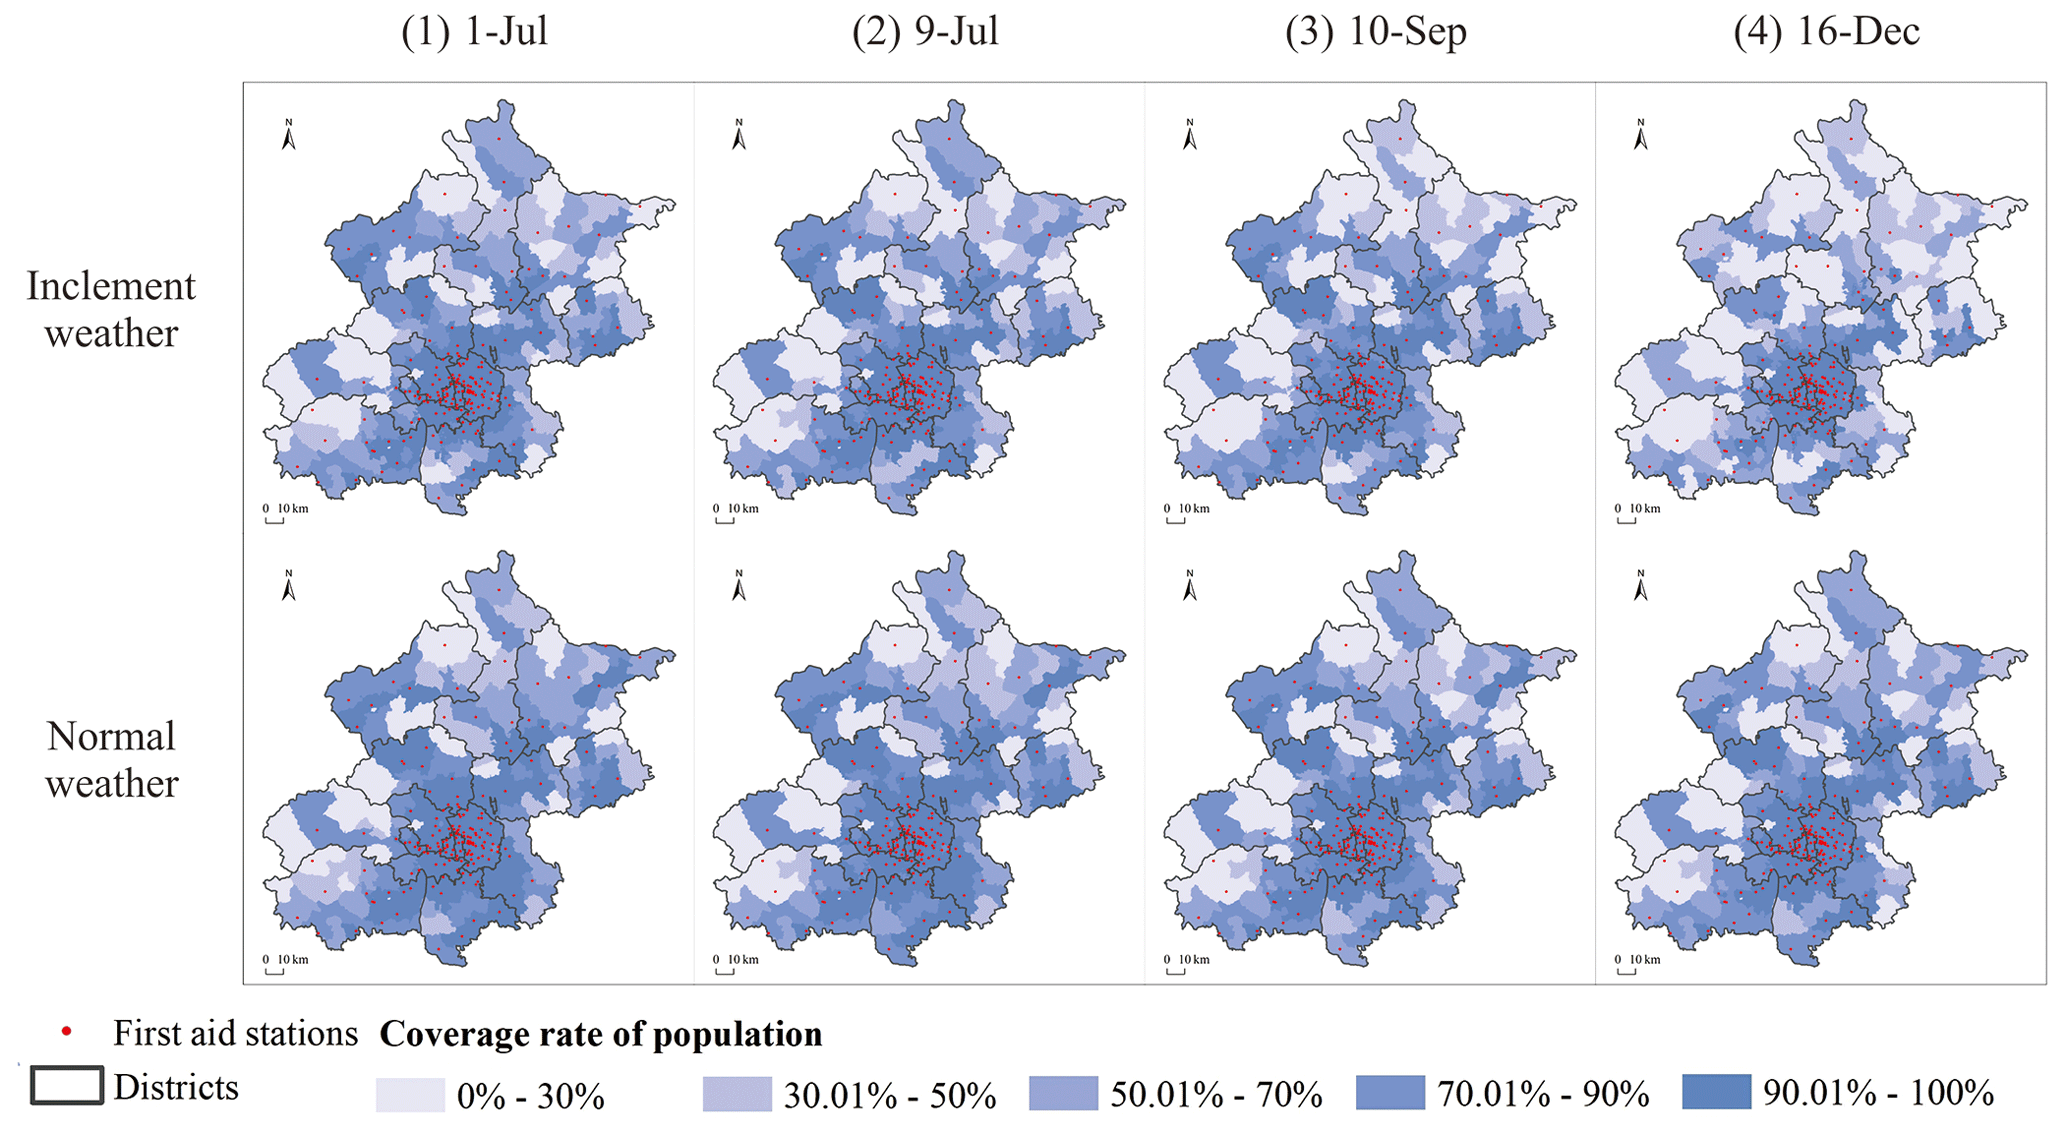
Figure 6The EMSs coverage rate of the population in townships under the inclement weather condition and normal weather condition on 1 and 9 July, 10 September, and 16 December (produced using ArcGIS 10.8 and CorelDraw 2019).
To illustrate the impact of inclement weather on the EMSs coverage rate of the population more clearly, Fig. 7 shows the change in the EMSs coverage rate of the population in townships in inclement weather relative to normal weather on the 4 d. The results identify several townships in the outer suburbs (Miyun, Huairou, Pinggu, and Yanqing districts) that would experience the most severe decrease in population coverage under inclement weather conditions, with a maximum reduction of more than 40 %. These areas are hotspots that need to draw attention in EMSs construction planning. The suburban areas, such as Shunyi, Daxing, and Tongzhou, are more vulnerable to inclement weather because they have less distribution of medical facilities and sparser road networks, as well as a relatively higher proportion of population over the age of 80 years. The average proportion of elderly people is 1.88 % in the whole city, 1.37 % in the inner suburbs, and 2.04 % in the outer suburbs. On 16 December, 12.6 % of the population (3.5 million) could not get EMSs within 15 min, compared with 7.5 % with the baseline condition.
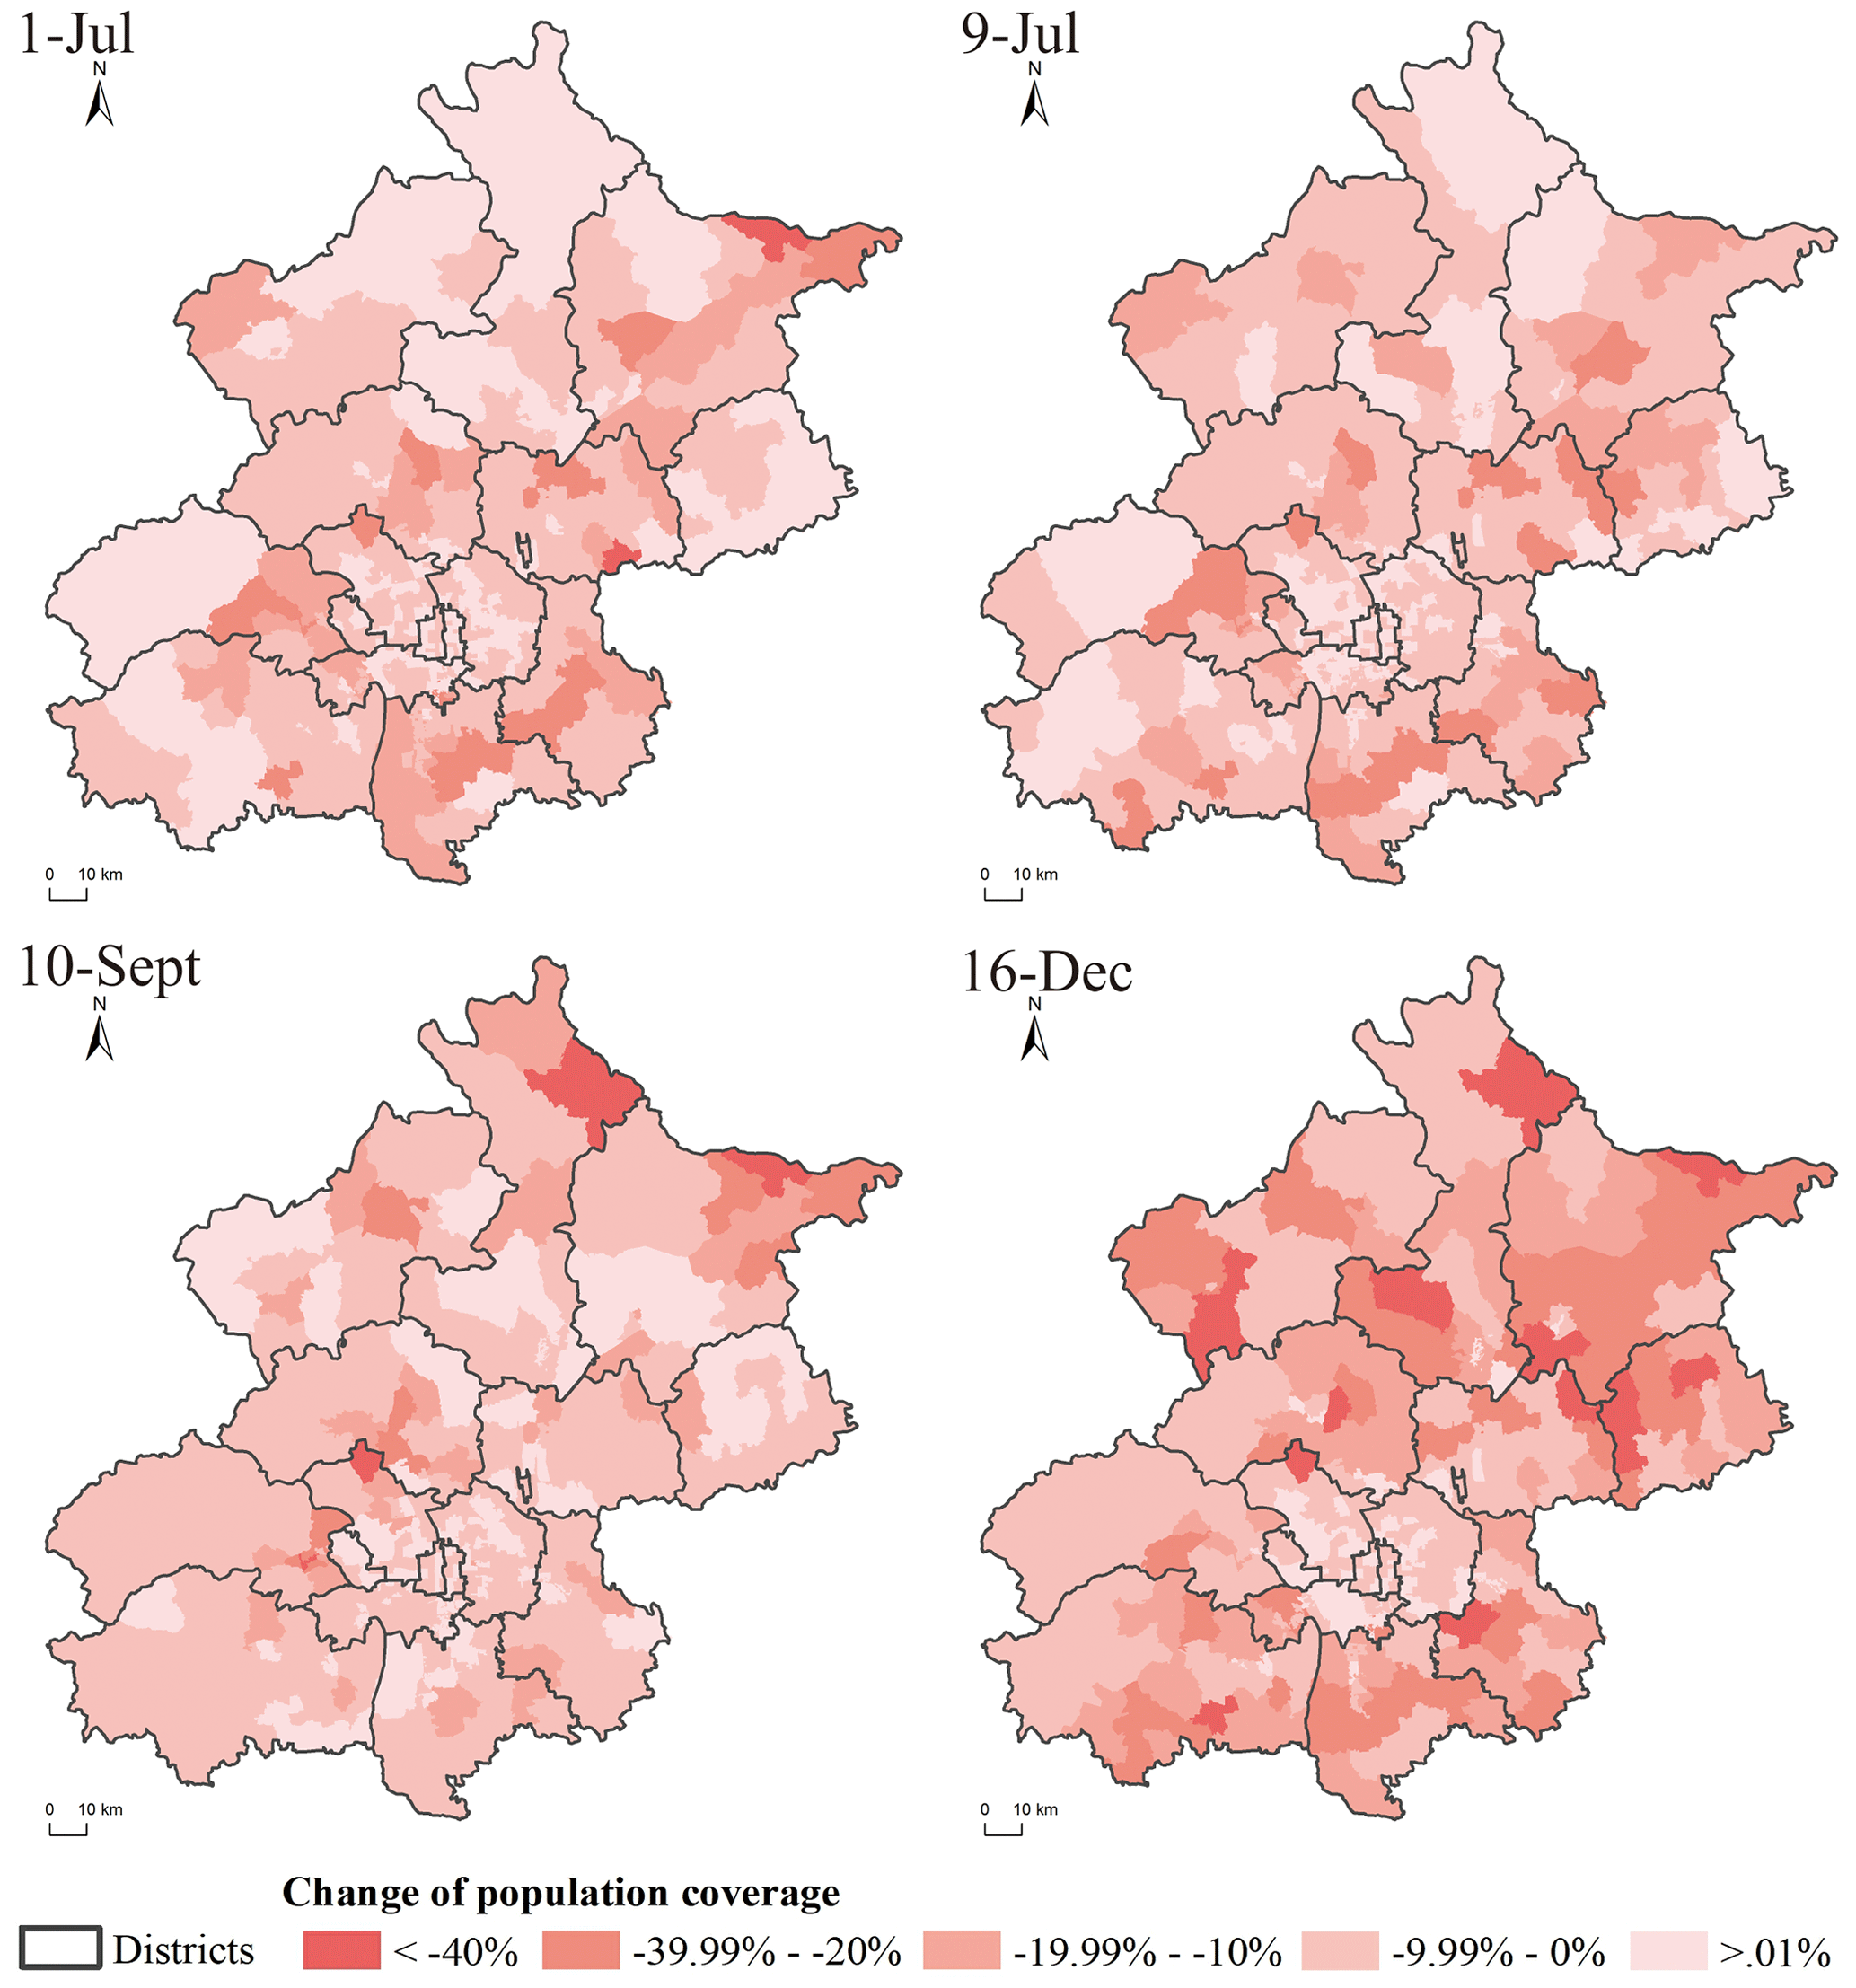
Figure 7The change in EMSs coverage rate of the population in townships in inclement weather relative to normal weather on 1 and 9 July, 10 September, and 16 December (produced using ArcGIS 10.8 and CorelDraw 2019).
Figure A1 shows the correlation between the baseline EMSs coverage rate of the population of each township and its reduction under inclement weather. The results reveal that the population of the towns with low baseline EMSs coverage rate would lose more EMSs coverage under inclement weather, especially on snowy days. The average traffic speed reduction in the urban area (within the Sixth Ring Road) was −26.64 %, −23.27 %, −25.20 %, and −15.77 % on 1 and 9 July, 10 September, and 16 December, while that in the suburban areas (outside the Sixth Ring Road) was −19.59 %, −19.08 %, −17.27 %, and −23.21 %. Based on the results, we analyzed the reasons why the suburban areas would become more vulnerable under inclement weather. Combined with the traffic speed reduction and the EMSs coverage reduction, on rainy days, although the urban area has more traffic speed loss, the suburban areas still experiences more EMSs coverage loss. Once the inclement weather affects the traffic on some roads, the urban areas still have many other roads than can bypass it, but not in the suburbs. On snowy days, the suburban areas has more traffic speed reduction, and with the sparser road network, the EMSs coverage in the suburban areas would shrink much more than on rainy days.
4.2.2 Accessibility to hospitals
Figure 8 shows the increased transfer time from each population grid to the nearest hospital under the four inclement weather conditions of 1 and 9 July, 10 September, and 16 December relative to the baseline condition. The value indicates the impact of inclement weather on accessibility to hospitals. The situation is slightly different on rainy days and snowy days. On rainy days, the shortest time to reach the nearest hospital generally could increase by 0–10 min in most parts of Beijing due to slower traffic speed on the roads caused by rain. Although in some small parts of suburban areas, the shortest time to the nearest hospital would be slightly shortened upon an indication that the traffic will be smoother in some areas when it rains, which may be due to the reduction in traffic demand (Maze et al., 2006). On the other hand, on 16 December, affected by snow, the whole city's road traffic generally slowed down and the transfer time to the nearest hospital increased by 10–40 min. The western part of Mentougou district and a small part of the northern Yanqing district were the most affected, with the time needed to reach the nearest hospital prolonged by more than 30 min, up to 45 min. In Huairou district, the eastern part of Yanqing district, and the northern part of Miyun district, the transfer time was also prolonged by 11–30 min.
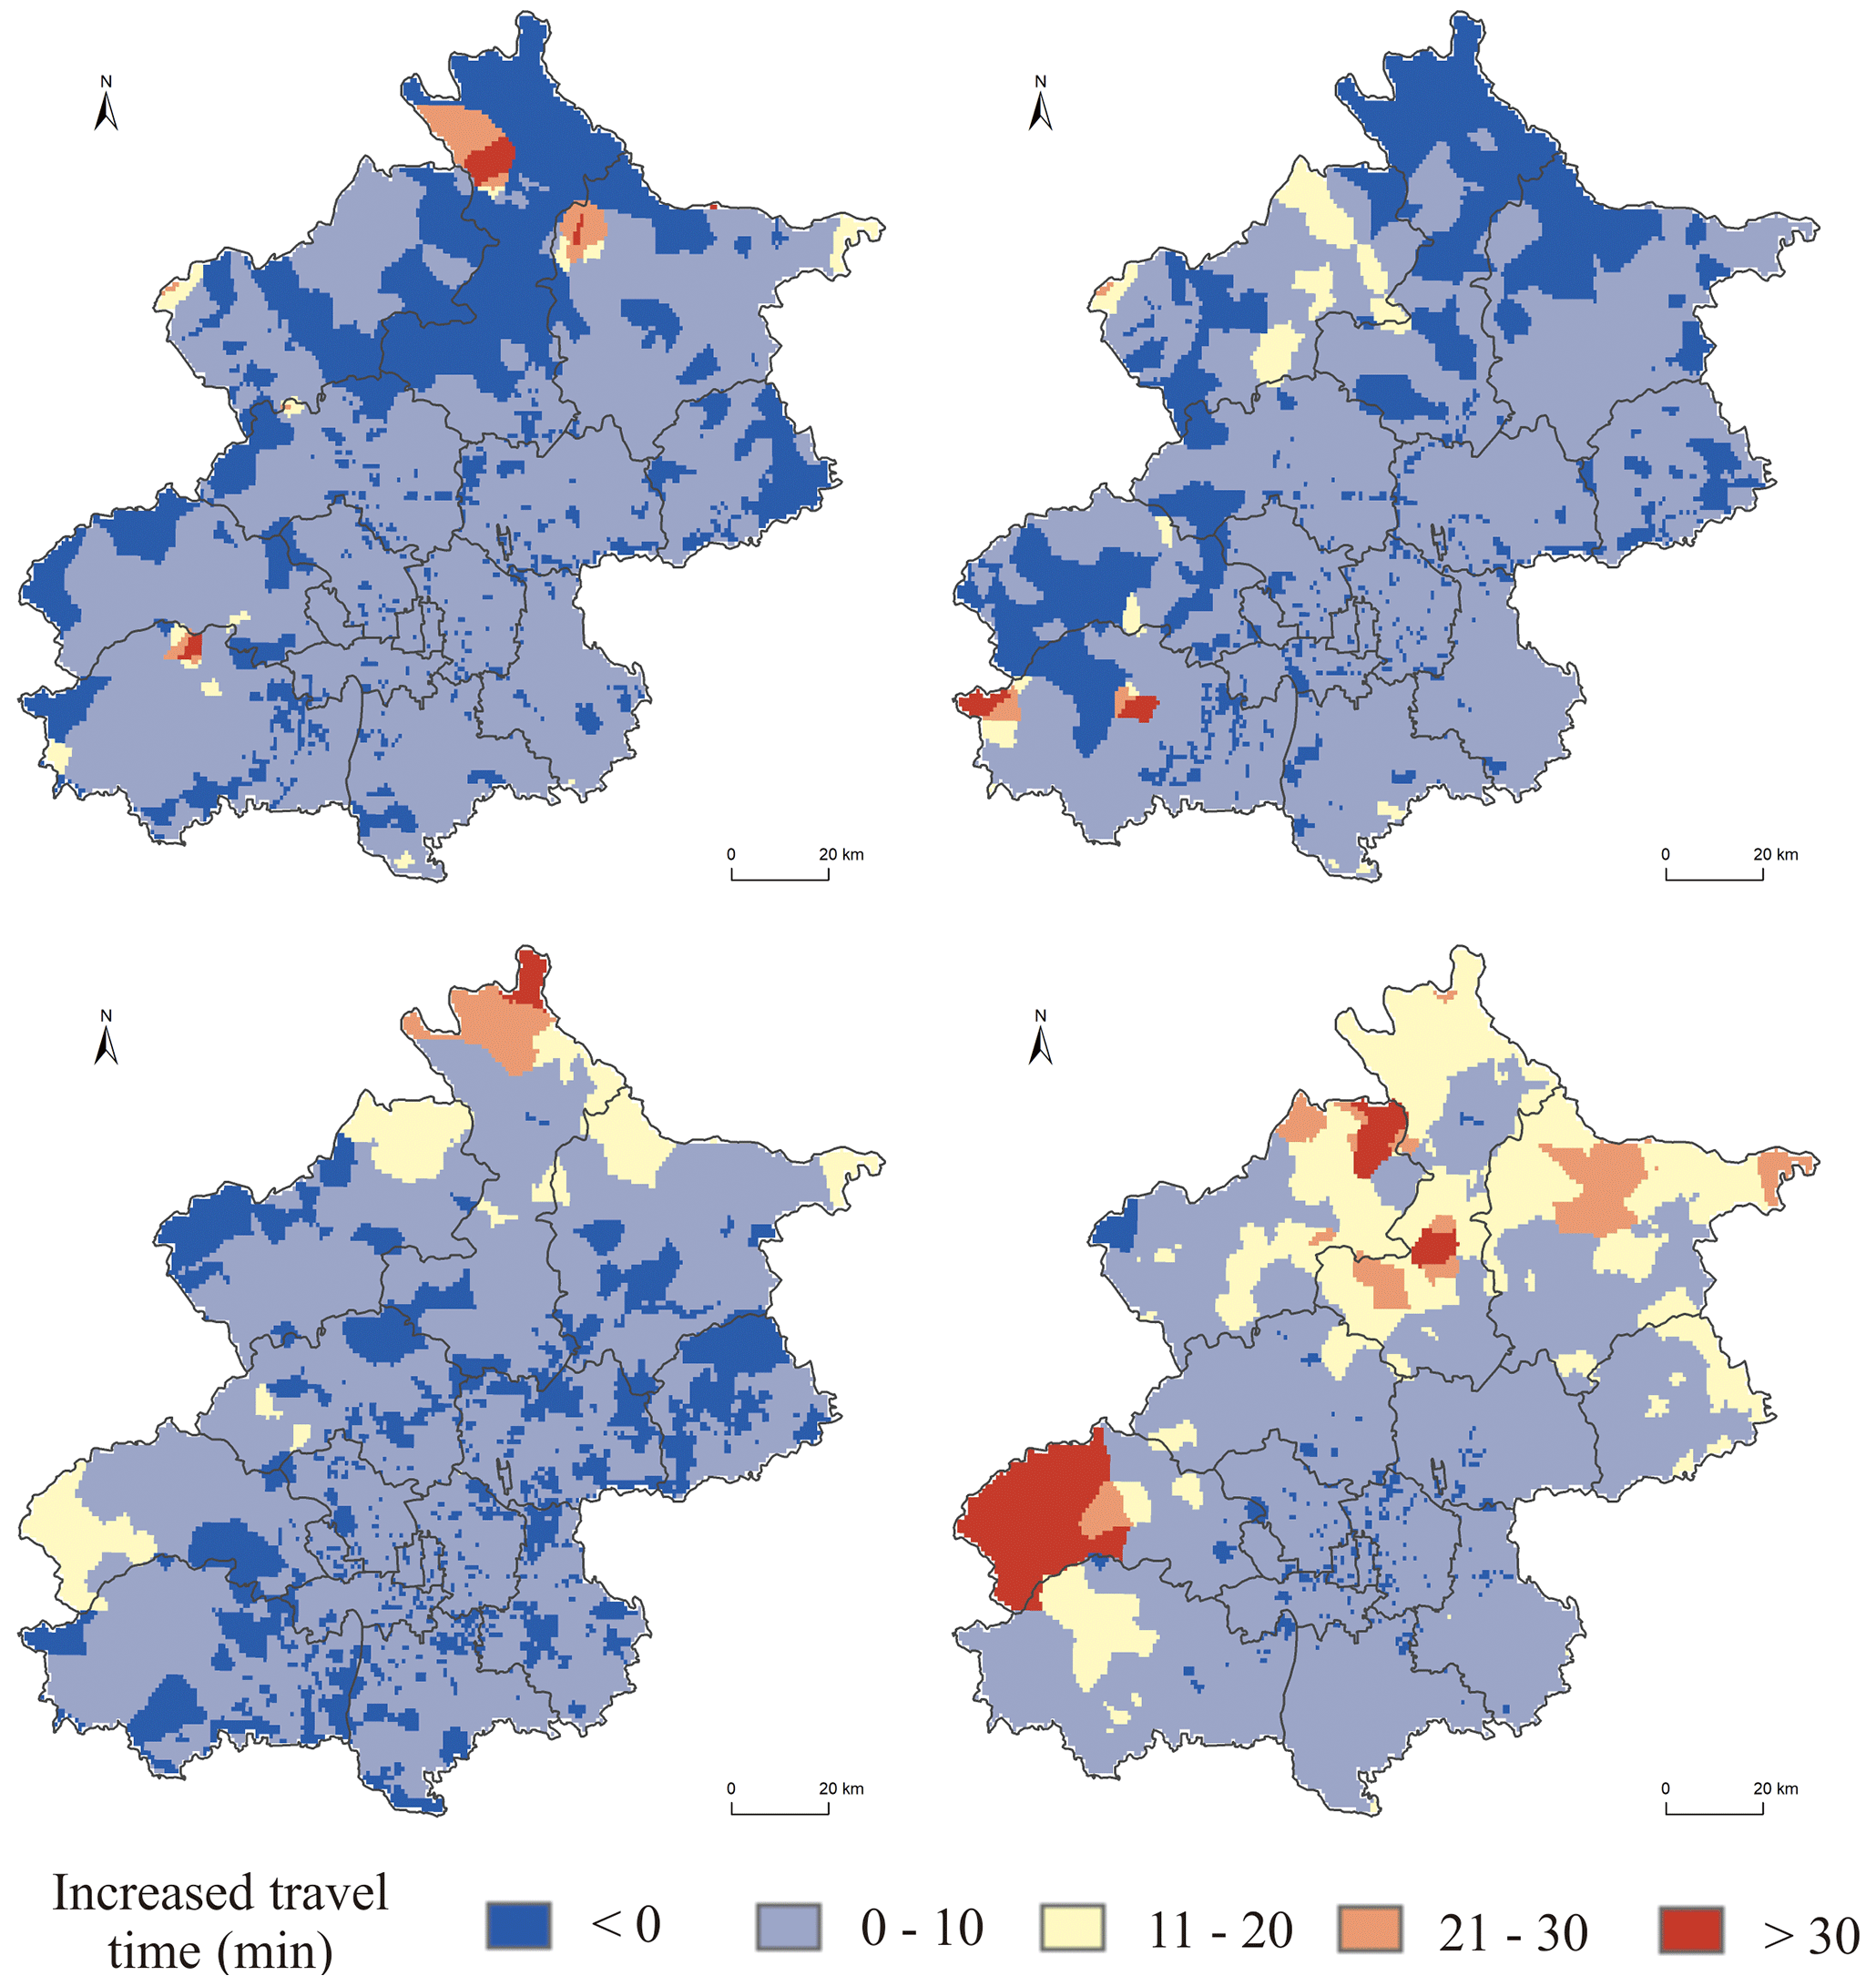
Figure 8Increased travel time to hospitals on 1 and 9 July, 10 September, and 16 December (produced using ArcGIS 10.8 and CorelDraw 2019).
We did a zonal statistic of the average baseline transfer time to the nearest hospital and the average increased transfer time to hospitals in each town, and the correlation between the two indicators shown in Fig. A2 indicate a similar pattern to that with the EMSs coverage, that is, the towns with low baseline accessibility to hospitals would also be more affected by inclement weather.
Overlaying the demographic grid data, the size of the population affected by a delay of over 10 min would be 0.02 million on 1 July, 0.03 million on 9 July, 0.05 million on 10 September, and 0.3 million on 16 December.
Figure 9 shows the change in the total transfer time under inclement weather conditions on 1 and 9 July, 10 September, and 16 December, relative to the baseline conditions. The results show that on 3 rainy days – 1 and 9 July, and 10 September – within the Sixth Ring Road extent, the total transfer time increased significantly under inclement weather, which means that, although the transfer time would not increase much in urban areas, due to the high population density, the cumulative delay time for total potential demand would be significant. In the suburbs, the total transfer time would increase slightly or even decrease, especially in some areas of Huairou, Yanqing, and Miyun districts, which means that, although the transfer time would increase greatly, due to its low population density, the cumulative delay time for total potential demand would not be serious. However, due to the influence of snowfall on 16 December, the total transfer time in the whole city was slightly or moderately increased, and there were almost no regions where the total transfer time decreased, which means snowfall would cause an even cumulation of delay time for total potential demand across the whole city, both urban and suburban.
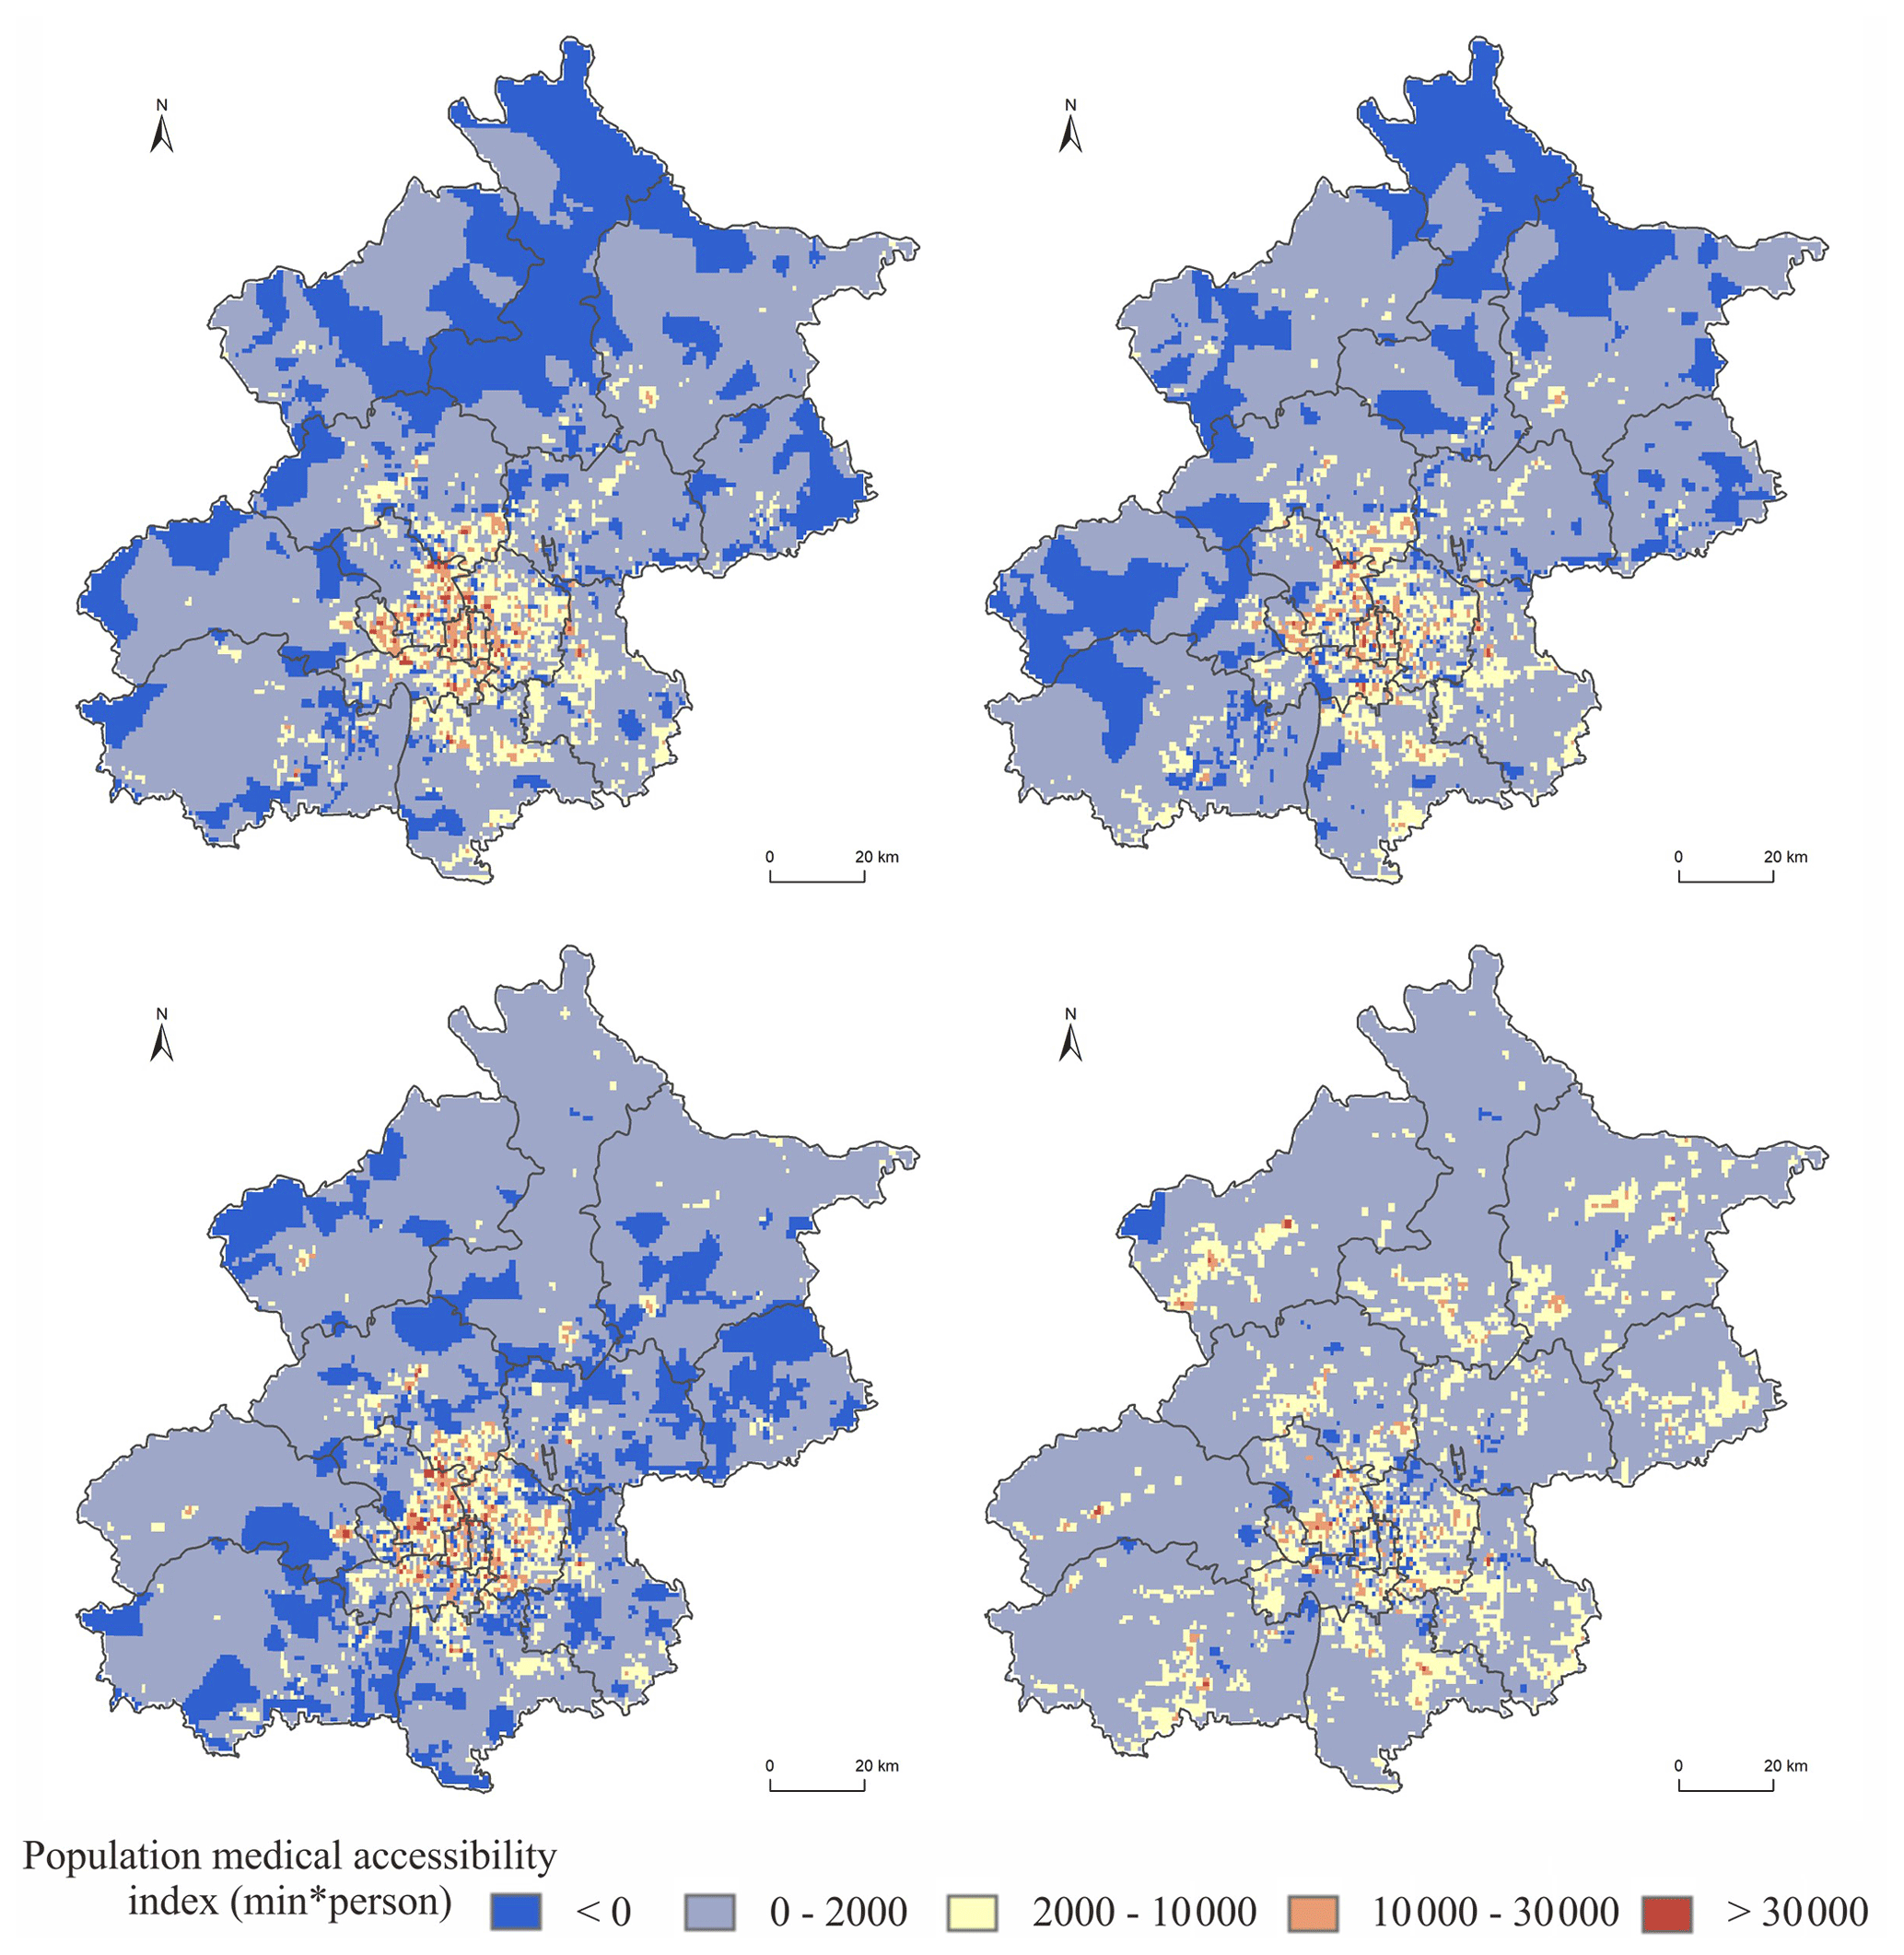
Figure 9The change in the total transfer time on 1 and 9 July, 10 September, and 16 December (produced using ArcGIS 10.8 and CorelDraw 2019).
Our study evaluates the spatial accessibility of EMSs in Beijing under different weather conditions in 2019 based on city-scale ground-truth traffic data updated every 2 min. The spatial accessibility of EMSs was quantified by the coverage rate of the first-aid stations' service area, the coverage rate of the first-aid stations' service population, and the shortest transfer time to the nearest hospital. Our study reveals the influence of precipitation on the accessibility and equity of EMSs, which could help guide EMSs construction planning in cities, get prepared for extreme weather conditions, and finally assist the decision-making of the corresponding government departments. The main conclusions are as follows:
First, the results show that inclement weather, such as rainfall and snowfall, could have a negative impact on the accessibility of EMSs overall. Precipitation reduces the driving speed of vehicles on the road, thus reducing EMSs coverage. In severe cases, the EMSs coverage rate of the area can be reduced by more than 10 %. Besides, snowfall has a greater impact on EMSs accessibility than rainfall.
Second, the EMSs accessibility is more affected by inclement weather in places with low baseline accessibility to EMSs. In addition, the results reveal a serious rural–urban disparity in emergency medical facilities distribution in Beijing: the EMSs accessibility of the population in some townships of the outer suburbs is very low and would also greatly decrease under inclement weather.
Third, some specific days may affect the traffic flow, which has an amplification effect on the traffic congestion caused by inclement weather. When they encounter the inclement weather, there are potential risks of a decrease in traffic efficiency and EMSs accessibility, which should be given sufficient attention.
To the best of our knowledge, there were no studies performed to analyze the impact of road access capacity on EMSs accessibility under inclement weather according to actual traffic speed variation. Our study provides an attempt to analyze the spatial accessibility of EMSs under inclement weather based on city-scale ground-truth traffic data and meteorological data, where the former is usually difficult to obtain. In previous literature (Yin et al., 2021; Coles et al., 2017; Albano et al., 2014), simulation methods were widely used on the research on EMSs accessibility or traffic capacity under inclement weather; however, the ground-truth traffic data, which covers every road in the whole city under precipitation scenarios, was hardly used in the previous studies of the impact of weather on traffic and accessibility. Our study could be a good empirical verification in this field of study. We also found that snowfall may have a greater impact, which is hard to determine using flood simulation methods. The results from this study provide a scientific reference for city planning departments in Beijing to optimize the site selection of emergency service facilities and get prepared for traffic dispersion on inclement weather. The relevant methods mentioned in this paper are also suitable for both holidays and workdays and can be easily applied to other cities once traffic data or empirical formulas regarding the impact of inclement weather on road traffic can be obtained.
There are also some parts in our research that can be improved in future research. First, we averaged the traffic speed reduction rate of all the roads in the city, as well as the precipitation data, which could have concealed congestion hotspots. Besides, all the calculation was done by the 2 h selected period, which may have neglected the delayed responses of rainfall runoff and temporal variation of rainfall. In further studies, with higher resolution precipitation, along with corresponding traffic data, we could narrow the scale to blocks, pay more attention to local congestions, and analyze the correlation of precipitation and traffic speed on a finer scale. Second, due to the data limitation, we could only analyze the EMSs accessibility in 2019, and the precipitation intensity in that year was not quite high enough. If we had longer time series precipitation and traffic data, we could analyze the impact of precipitation magnitude on the traffic and accessibility, instead of simply dividing the days in a binary manner into inclement and non-inclement weather days. Under such precipitation conditions, the EMSs accessibility has been affected to a certain extent, and it would be much more difficult to get timely EMSs under even more extreme inclement weather conditions. In a previous study, Yin et al. (2021) found that surface water flooding could result in non-linear impacts on EMS spatial coverage in Shanghai: 5- and 20-year pluvial flooding both exerted very minor effects, and the effect of 100-year surface water flooding appears to be more pronounced. Future studies should take extreme precipitation events into account. Third, due to the lack of high-resolution digital surface model data, we did not run a hydrological flood simulation in Beijing which could reveal the relationship between precipitation and the actual amount of water on the streets. This could be improved in future studies with more high-resolution topographic data. Fourth, we used the “15 min arrival time” as a main boundary in this study; however, the proper response time would vary in different countries or cities. Therefore, the setting of the response time boundary should be adjusted considering the actual situation of the city when the method in this paper is applied to other cities. Fifth, we aggregated the population grid evenly in the city. If a varying resolution could have been applied with a finer grid in the heavily populated center, and a coarser grid towards the outskirts, it may have captured more of the dynamics in a metropolis with varying population and infrastructure densities.
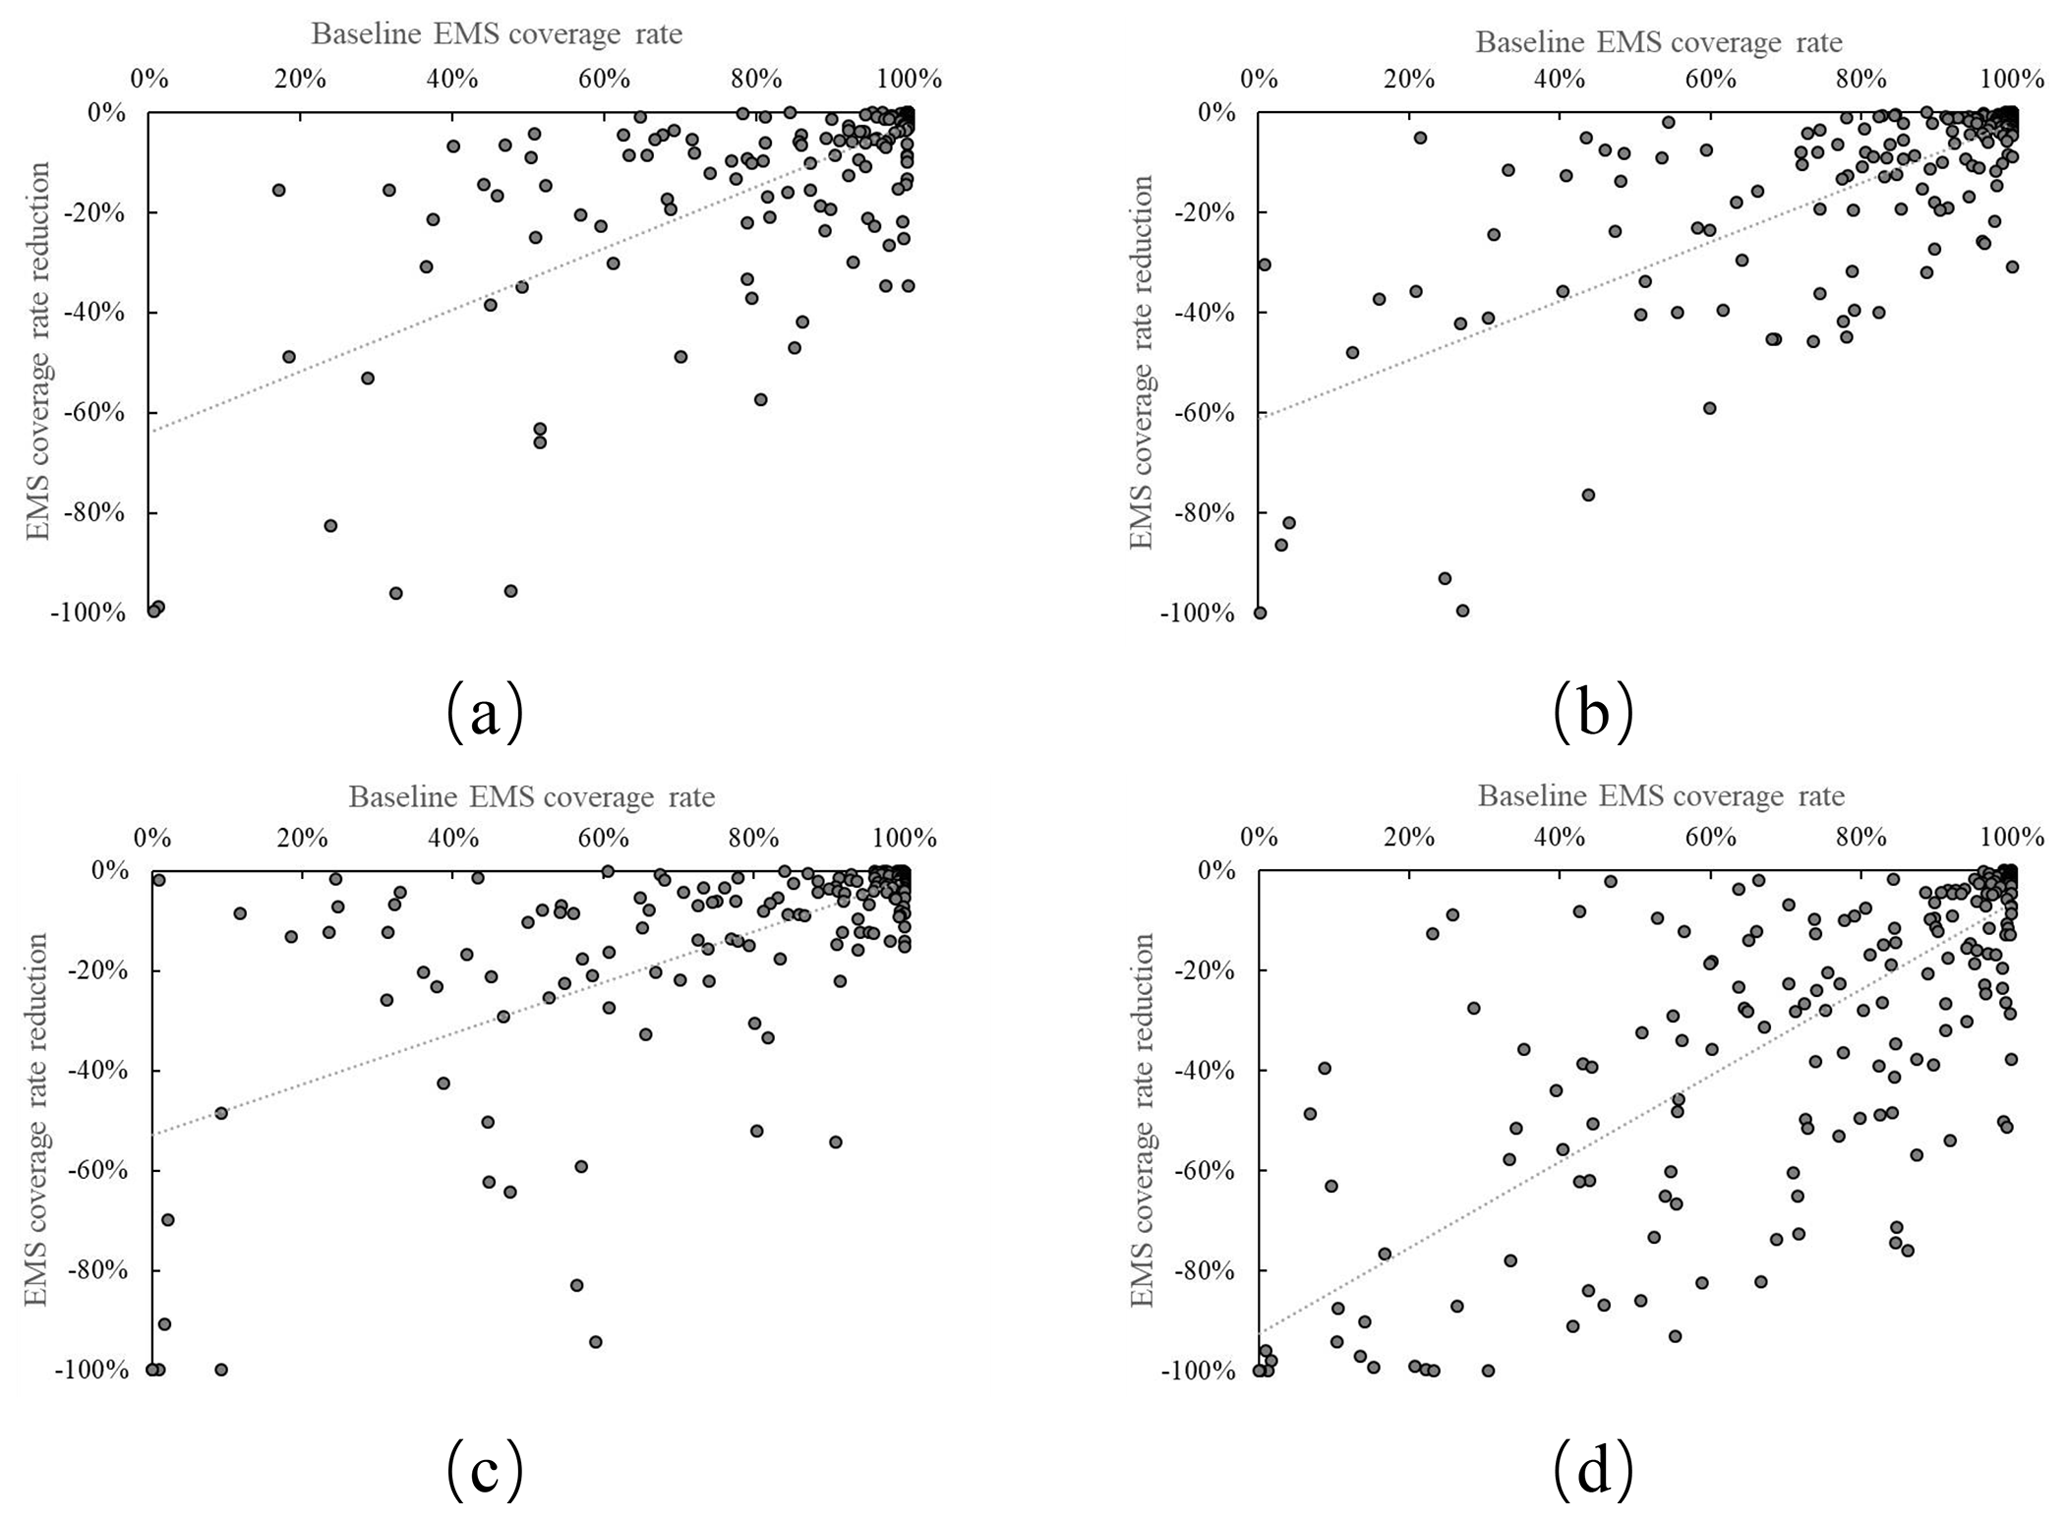
Figure A1The correlation between the baseline EMSs coverage rate of the population and its reduction percentage in inclement weather: (a) 1 July, (b) 9 July, (c) 10 September, and (d) 16 December (produced using Excel 2016).
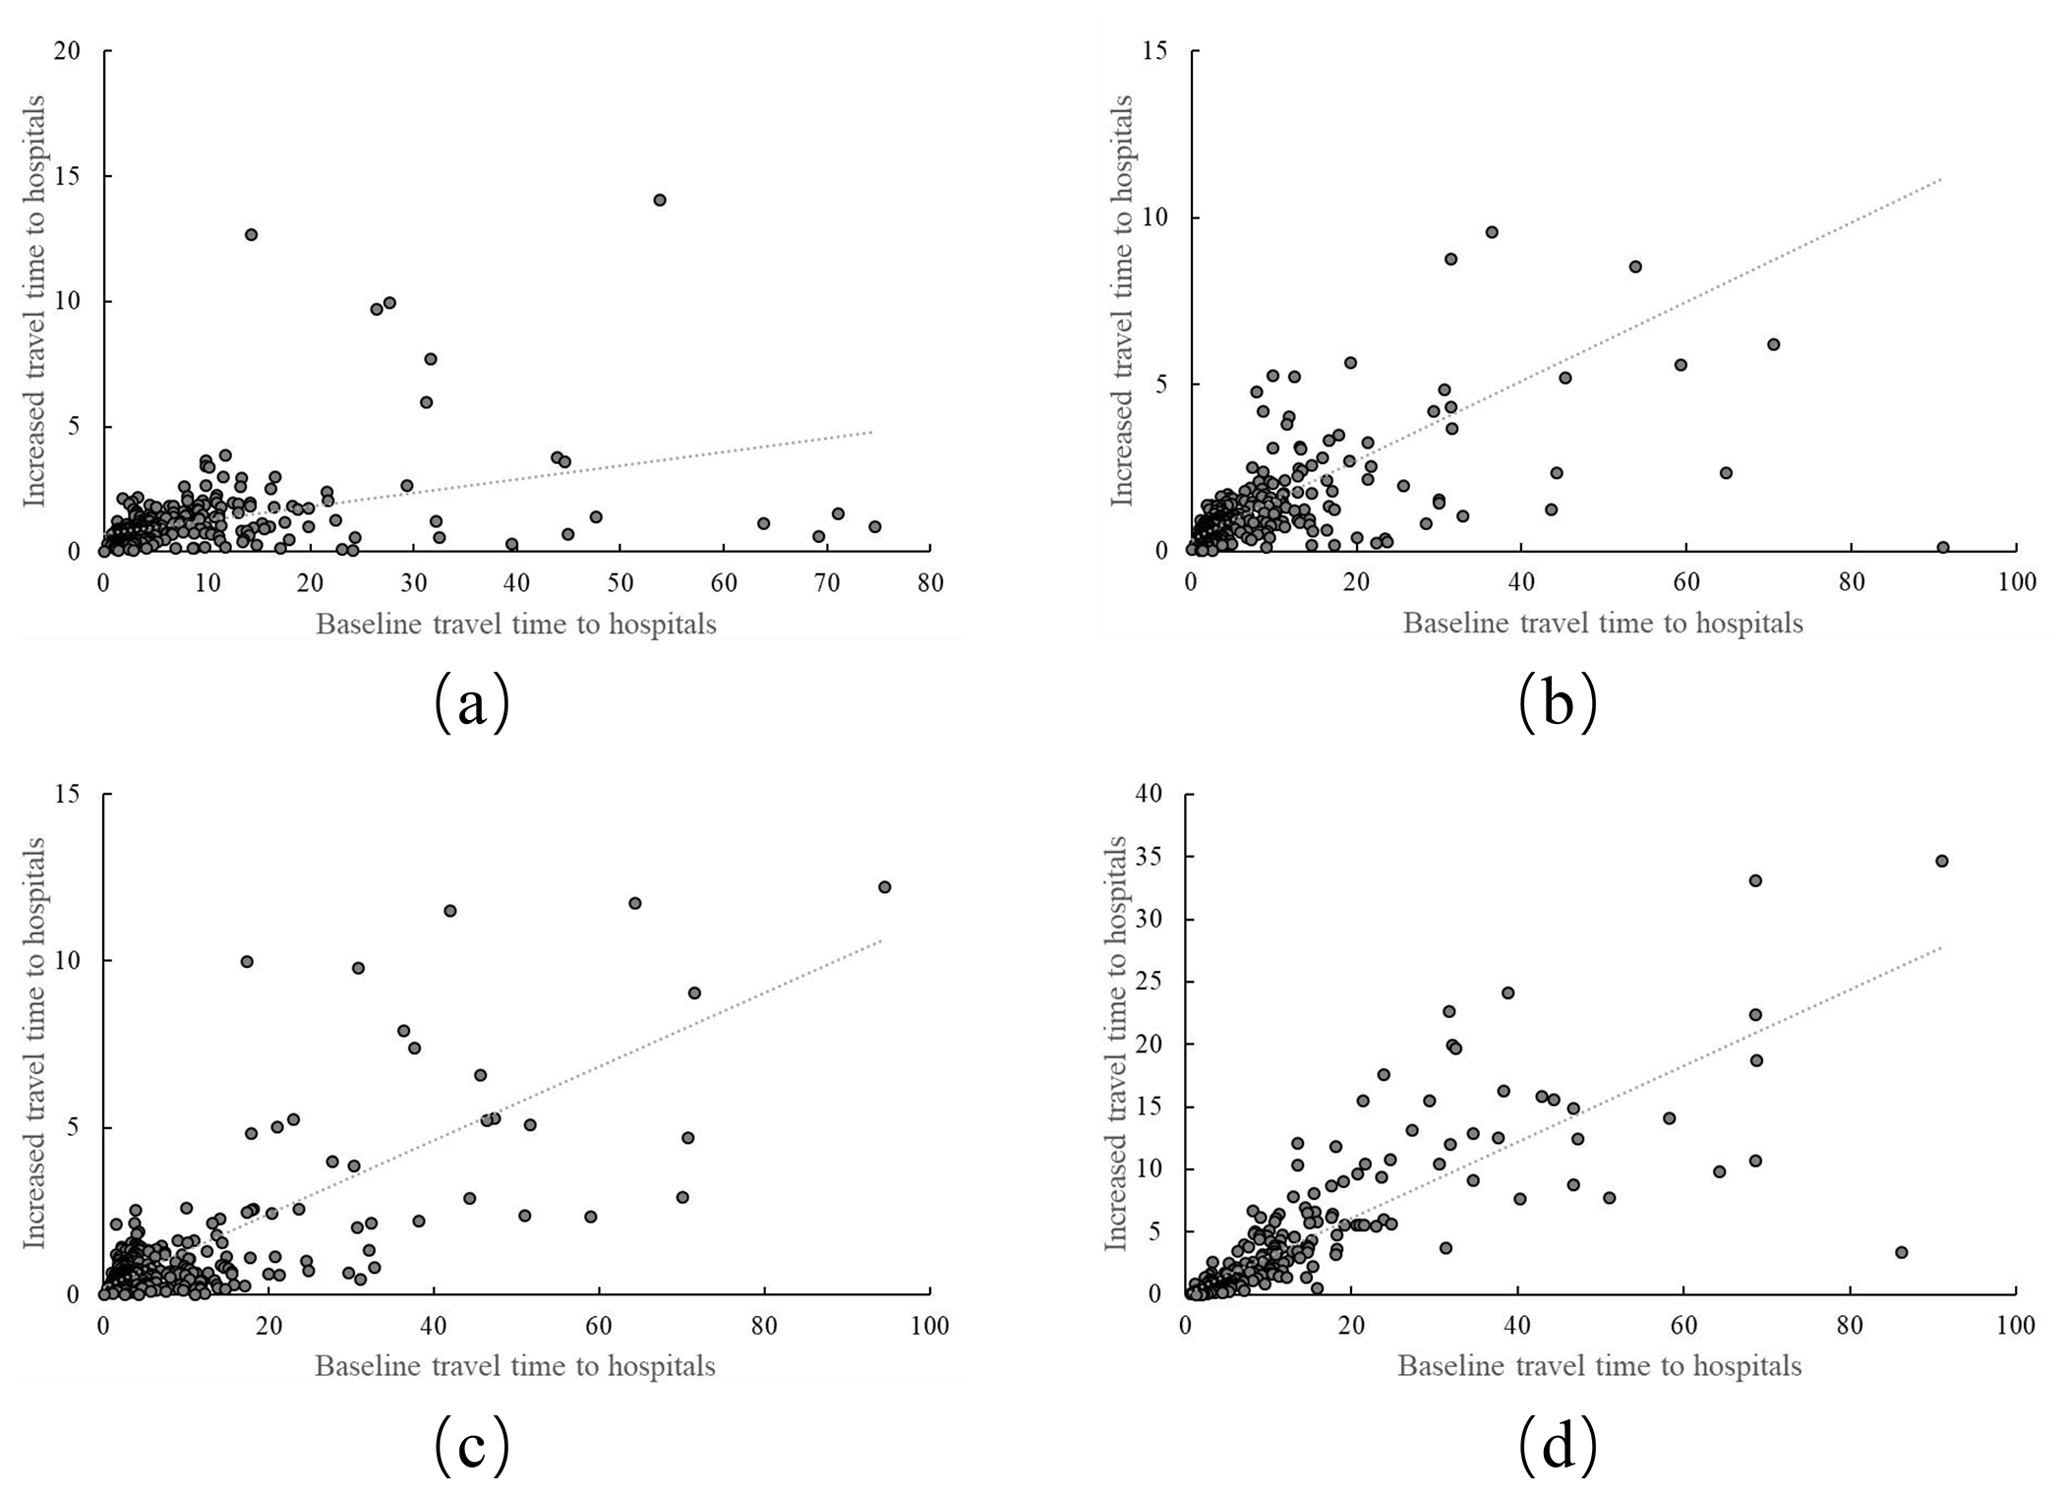
Figure A2The correlation between the baseline travel time to hospitals and the increased travel time in inclement weather: (a) 1 July, (b) 9 July, (c) 10 September, and (d) 16 December (produced using Excel 2016).
All raw data can be provided by the corresponding author upon request (Kai Liu, liukai@bnu.edu.cn).
KL planned the research. JZ and ML provided the traffic data. YZ and KL analyzed the data. YZ wrote the manuscript draft. KL, XN, MW, and DY reviewed and edited the manuscript.
The contact author has declared that none of the authors has any competing interests.
Publisher’s note: Copernicus Publications remains neutral with regard to jurisdictional claims made in the text, published maps, institutional affiliations, or any other geographical representation in this paper. While Copernicus Publications makes every effort to include appropriate place names, the final responsibility lies with the authors.
This article is part of the special issue “Hydro-meteorological extremes and hazards: vulnerability, risk, impacts, and mitigation”. It is a result of the European Geosciences Union General Assembly 2022, Vienna, Austria, 23–27 May 2022.
We greatly appreciate the financial support from the Major Program of National Natural Science Foundation of China and the National Natural Science Foundation of China.
This study was supported by the National Natural Science Foundation of China (grant nos. 42377467).
This paper was edited by Lindsay Beevers and reviewed by Evelyn Mühlhofer and three anonymous referees.
Agarwal, M., Maze, T. H., and Souleyrette, R.: Impacts of weather on urban freeway traffic flow characteristics and facility capacity, in: Proceedings of the 2005 mid-continent transportation research symposium, Ames, Iowa, US, 18–19 August 2005, https://www.researchgate.net/profile/Reginald-Souleyrette/publication/228720996_Impact_of_Weather_on_ Urban_Freeway_Traffic_Low_Characteristics_and_Facility_ Capacity/links/0f31752f8fd061ea14000000/Impact-of-Weather -on-Urban-Freeway-Traffic-Low-Characteristics-and-Facility-Capacity.pdf (last access: 7 January 2024), 2005.
Agarwal, M., Maze, T. H., and Souleyrette, R.: The weather and its impact on urban freeway traffic operations. Proceedings of the 85nd annual meeting of the Transportation Research Board, Washington, D.C., US, 22–26 January 2006, https://www.researchgate.net/profile/Reginald-Souleyrette/publication/265887296_The_Weather_and_Its_ Impact_on_Urban_Freeway_Traffic_Operations/links/55ada 9d808aee079921e2f1c/The-Weather-and-Its-Impact-on-Urban-Freeway-Traffic-Operations.pdf (last access: 7 January 2024), 2006.
Albano, R., Sole, A., Adamowski, J., and Mancusi, L.: A GIS-based model to estimate flood consequences and the degree of accessibility and operability of strategic emergency response structures in urban areas, Nat. Hazards Earth Syst. Sci., 14, 2847–2865, https://doi.org/10.5194/nhess-14-2847-2014, 2014.
Andersson, S. and Stålhult, S.: Hospitals exposed to flooding in manila city, philippines: gis analyses of alternative emergency routes and allocation of emergency service and temporary medical centre, URN: urn:nbn:se:kau:diva-33042, OAI: oai:DiVA.org:kau-33042, DiVA: diva2:730984, 2014.
Beijing Emergency Medical Center: https://beijing120.com/channel/184, last access: 30 August 2021.
Beijing Evening: Beijing rainstorm, 120 calls increased by , trauma and car accident injury increased significantly, http://news.sohu.com/20120722/n348746024.shtml (last access: 30 August 2021), 2012.
Blackwell, T. H. and Kaufman, J. S.: Response time effectiveness: comparison of response time and survival in an urban emergency medical services system, Acad. Emerg. Med., 9, 288–295, 2002.
Business Standard: Ambulances stuck in torrential rain drowning Ctg roads, https://www.tbsnews.net/bangladesh/ambulances-stuck-torrential-rain-drowning-ctg-roads-283114 (last access: 1 December 2022), 2021.
Chang, H., Lafrenz, M., Jung, I., Figliozzi, M., Platman, D., and Pederson, C.: Potential impacts of climate change on flood-induced travel disruptions: a case study of portland, oregon, usa, Geography of Climate Change, Routledge, https://doi.org/10.1080/00045608.2010.497110, 2013.
Chen, X. and Jia, P.: A comparative analysis of accessibility measures by the two-step floating catchment area (2sfca) method, Int. J. Geogr. Inf. Sci., 33, 1739–1758, 2019.
China Meteorological Administration: Classification of precipitation, https://www.cma.gov.cn/2011xzt/2012zhuant/20120928_1_1_1_1/2010052703/201212/t20121212_195616.html (last access: 11 February 2023), 2012.
Chu, L. J. and Fwa, T. F.: Pavement skid resistance consideration in rain-related wet-weather speed limits determination, Road Mater. Pavement, 19, 334–352, 2018.
Coles, D., Yu, D., Wilby, R. L., Green, D., and Herring, Z.: Beyond “flood hotspots”: modelling emergency service accessibility during flooding in York, UK, J. Hydrol., 546, 419–436, 2017.
Cools, M., Moons, E., and Wets, G.: Investigating effect of holidays on daily traffic counts: time series approach, Transport Res. Rec., 2019, 22–31, 2007.
Cools, M., Moons, E., and Wets, G.: Assessing the impact of weather on traffic intensity, Weather, Clim. Soc., 2, 60–68, 2010.
Edwards, J. B.: Weather-related road accidents in england and wales: a spatial analysis, J. Transp. Geogr., 4, 201–212, 1996.
Fox8 News: Cleveland ambulance stuck in snow leads to long delay in emergency: I-Team, https://fox8.com/news/i-team/cleveland-ambulance-stuck-in-snow-leads-to-long-delay-in-emergency-i-team/ (last access: 1 December 2022), 2021.
Gaode Maps: https://lbs.amap.com/api/webservice/guide/api/search, last access: 30 August 2021.
Green, D., Yu, D., Pattison, I., Wilby, R., Bosher, L., Patel, R., Thompson, P., Trowell, K., Draycon, J., Halse, M., Yang, L., and Ryley, T.: City-scale accessibility of emergency responders operating during flood events, Nat. Hazards Earth Syst. Sci., 17, 1–16, https://doi.org/10.5194/nhess-17-1-2017, 2017.
Guagliardo, M. F.: Spatial accessibility of primary care: concepts, methods and challenges, Int. J. Health Geogr., 3, 1–13, 2004.
Hashtarkhani, S., Kiani, B., Bergquist, R., Bagheri, N., VafaeiNejad, R., and Tara, M.: An age-integrated approach to improve measurement of potential spatial accessibility to emergency medical services for urban areas, Int. J. Health Plan. M., 35, 788–798, 2020.
Huber, D. G. and Gulledge, J.: Extreme weather and climate change: understanding the link, managing the risk, Pew Center on Global Climate Change Arlington, https://www.patarnott.com/atms790/pdf_atms790/papers2022/ExtemeWeatherAndClimate.pdf (last access: 7 January 2024), 2011.
Jones, A. P. and Bentham, G.: Emergency medical service accessibility and outcomefrom road traffic accidents, Public Health, 109, 169–177, 1995.
Kanuganti, S., Sarkar, A. K., and Singh, A. P.: Quantifying accessibility to health care using two-step floating catchment area method (2sfca): a case study in rajasthan, Transp. Res. Proc., 17, 391–399, 2016.
Katz, B., O'Donnell, C., Donoughe, K., Atkinson, J. E., Finley, M. D., Balke, K. N., Kuhn, B. T., and Warren, D.: Guidelines for the use of variable speed limit systems in wet weather, No. FHWA-SA-12-022, United States, Federal Highway Administration, Office of Safety, https://rosap.ntl.bts.gov/view/dot/42613 (last access: 7 January 2024), 2012.
Li, M., Kwan, M., Chen, J., Wang, J., Yin, J., and Yu, D.: Measuring emergency medical service (ems) accessibility with the effect of city dynamics in a 100-year pluvial flood scenario, Cities, 117, 103314, https://doi.org/10.1016/j.cities.2021.103314, 2021.
Luo, W. and Qi, Y.: An enhanced two-step floating catchment area (e2sfca) method for measuring spatial accessibility to primary care physicians, Health Place, 15, 1100–1107, 2009.
Luo, W. and Wang, F.: Measures of spatial accessibility to health care in a gis environment: synthesis and a case study in the chicago region, Environ. Plann. B, 30, 865–884, 2003.
Mao, L. and Nekorchuk, D.: Measuring spatial accessibility to healthcare for populations with multiple transportation modes, Health Place, 24, 115–122, 2013.
Maze, T. H., Agarwal, M., and Burchett, G.: Whether weather matters to traffic demand, traffic safety, and traffic operations and flow, Transp. Res. Record, 1948, 170–176, 2006.
Moglia, M., Frantzeskaki, N., Newton, P., Pineda-Pinto, M., Witheridge, J., Cook, S., and Glackin, S.: Accelerating a green recovery of cities: lessons from a scoping review and a proposal for mission-oriented recovery towards post-pandemic urban resilience, Developments in the Built Environment, 7, 100052, https://doi.org/10.1016/j.dibe.2021.100052, 2021.
National Bureau of Statistics: Bulletin of the National Population Census, https://www.stats.gov.cn/sj/tjgb/rkpcgb/qgrkpcgb/ (last access: 11 February 2023), 2021.
Pan, X., Kwan, M., Yang, L., Zhou, S., Zuo, Z., and Wan, B.: Evaluating the accessibility of healthcare facilities using an integrated catchment area approach, Int. J. Environ. Res. Pu., 15, 2051, https://doi.org/10.3390/ijerph15092051, 2018.
Ramgopal, S., Siripong, N., Salcido, D. D., and Martin-Gill, C.: Weather and temporal models for emergency medical services: an assessment of generalizability, Am. J. Emerg. Med., 45, 221–226, 2021.
Shin, K. and Lee, T.: Improving the measurement of the korean emergency medical system's spatial accessibility, Appl. Geogr., 100, 30–38, 2018.
Song, X., Zhang, J., AghaKouchak, A., Sen Roy, S., Xuan, Y., Wang, G., He, R., Wang, X., and Liu, C.: Rapid urbanization and changes in spatiotemporal characteristics of precipitation in beijing metropolitan area, J. Geophys. Res.-Atmos., 119, 11250–11271, 2014.
Stott, P.: How climate change affects extreme weather events, Science, 352, 1517–1518, 2016.
Stott, P. A., Christidis, N., Otto, F. E., Sun, Y., Vanderlinden, J. P., van Oldenborgh, G. J., Vautard, R., von Storch, H., Walton, P., and Yiou, P.: Attribution of extreme weather and climate-related events, Wires Clim. Change, 7, 23–41, 2016.
Suarez, P., Anderson, W., Mahal, V., and Lakshmanan, T. R.: Impacts of flooding and climate change on urban transportation: a systemwide performance assessment of the boston metro area, Transport. Res. D-Tr. E., 10, 231–244, 2005.
Wang, K., Wang, L., Wei, Y., and Ye, M.: Beijing storm of July 21, 2012: observations and reflections, Nat. Hazards, 67, 969–974, 2013.
WorldPop: Center for International Earth Science Information Network (CIESIN), Columbia University, Global High Resolution Population Denominators Project – Funded by The Bill and Melinda Gates Foundation (OPP1134076), https://doi.org/10.5258/SOTON/WP00645, 2018.
Yang, Y., Yin, J., Ye, M., She, D., and Yu, J.: Multi-coverage optimal location model for emergency medical service (EMS) facilities under various disaster scenarios: a case study of urban fluvial floods in the Minhang district of Shanghai, China, Nat. Hazards Earth Syst. Sci., 20, 181–195, https://doi.org/10.5194/nhess-20-181-2020, 2020.
Yin, J., Yu, D., and Liao, B.: A city-scale assessment of emergency response accessibility to vulnerable populations and facilities under normal and pluvial flood conditions for shanghai, china, Environ. Plann. B-Urban, 48, 2239–2253, 2021.
Yu, D., Yin, J., Wilby, R. L., Lane, S. N., Aerts, J. C., Lin, N., Liu, M., Yuan, H., Chen, J., and Prudhomme, C.: Disruption of emergency response to vulnerable populations during floods, Nature Sustainability, 3, 728–736, 2020.
Zhang, X. and Chen, M.: Quantifying the impact of weather events on travel time and reliability, J. Adv. Transport., 2019, 8203081, https://doi.org/10.1155/2019/8203081, 2019.