the Creative Commons Attribution 4.0 License.
the Creative Commons Attribution 4.0 License.
 | 12 Jan 2024
Estimating emergency costs for earthquakes and floods in Central Asia based on modelled losses
Emilio Berny
Carlos Avelar
Mario A. Salgado-Gálvez
Mario Ordaz
Estimating the emergency costs for disasters is of high relevance in the design of any comprehensive disaster risk management strategy. These costs usually include the ones associated with the immediate response aimed to provide the required safety and emergency attention, and those of debris removal and disposal. Over the time, and in different regions of the world, several research efforts have been carried out for the quantification of the emergency costs and have been usually associated with those of the direct losses. Also, previous studies have been typically carried out in the aftermath of large disasters, and to the best of our knowledge, no specific quantification of the emergency costs has been carried out in Central Asia. This paper presents a methodology, which has been applied in five countries in Central Asia using historical and synthetic events, to estimate the emergency costs as a function of modelled direct losses for earthquakes and floods, taking into account the demographic and building characteristics. The methodology allows the prospective estimation of the total emergency costs, so that they can be considered in the planning and budgeting of the emergency and recovery phases, as well as in disaster risk financing initiatives. It was found that the average emergency response costs for earthquakes and floods in Central Asia show good agreement with those previously estimated at other locations as a function of the direct losses; however, this methodology allows differentiating between different types of events allowing a better description and understanding of these needs.
- Article
(849 KB) - Full-text XML
- BibTeX
- EndNote


A comprehensive disaster risk management strategy is often described as a cycle consisting of four main stages: mitigation, preparedness, response, and recovery, as schematically shown in Fig. 1. The disaster risk management cycle illustrates the ongoing process by which governments, businesses, and civil society in general can plan for, and mitigate, the impact of disasters, as well as the actions that allow us to react during and immediately following a disaster, besides taking the necessary steps to recover after a disaster has occurred.
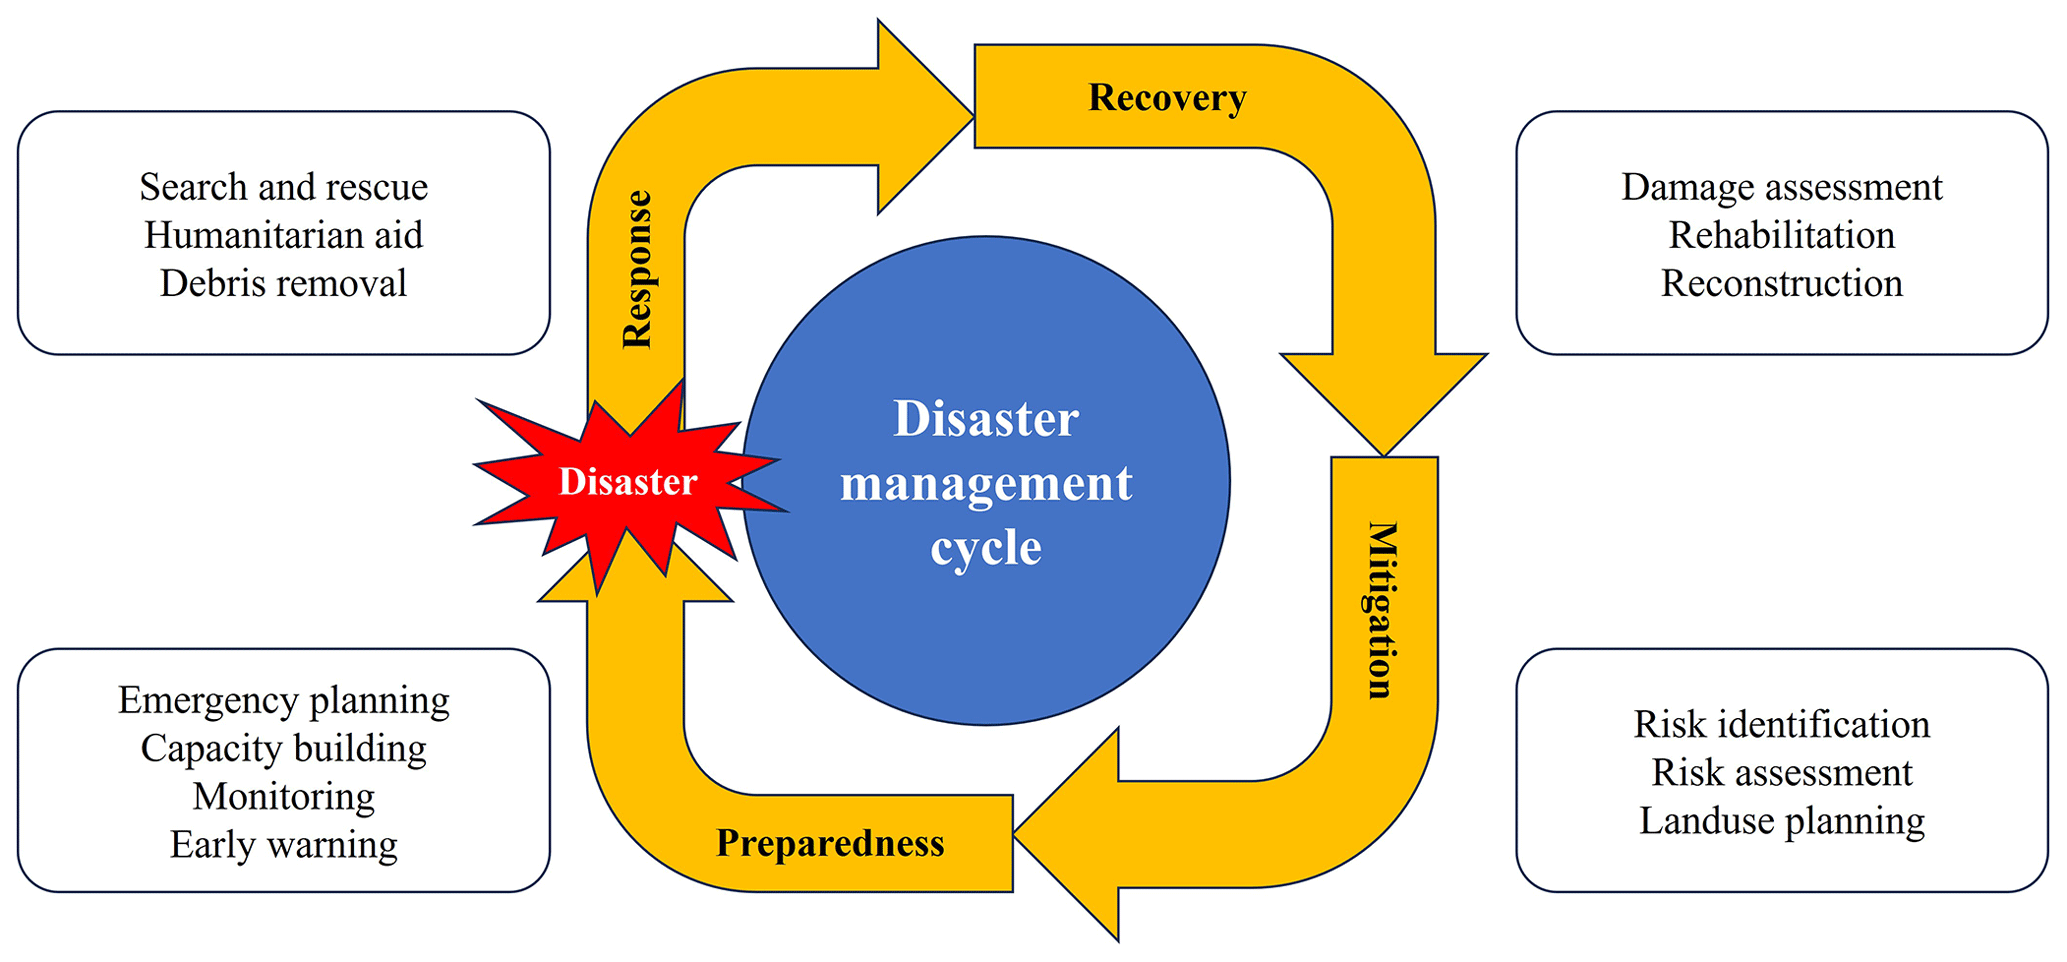
In the aftermath of a disaster, the immediate response measures aim at maintaining and/or re-establishing public safety by performing search and rescue operations and by adopting the necessary measures to cover the basic humanitarian needs of the affected population (Poser and Dransch, 2010). As per the definition by the World Bank (2021) the emergency response costs can be defined as “those costs incurred by the responders (in this case the government) immediately after a disaster occurs; they are associated with immediate relief activities, debris removal, etc.” In general, the costs for emergency response are substantial and important for the choice and definition of comprehensive disaster risk management strategies (e.g. identifying equipment needs), although they have been largely under-researched (Pfurtscheller and Schwarze, 2008) and have not, generally, been estimated in a forward-looking manner. This paper describes a methodology to estimate the emergency costs for earthquakes and floods based on the population and building characteristics as well as the modelled losses obtained in the framework of the Strengthening Financial Resilience and Accelerating Risk Reduction in Central Asia (SFRARR) project, whose details, methodology, and complete results are described in depth by Salgado-Gálvez et al. (2023) and Coccia et al. (2023).
Despite that different researchers and initiatives have attempted to estimate the emergency costs for different regions of the world and for different hazards, no previous analyses of this type are available for Central Asia, which is the main motivation for this study. The methodology was applied to five countries in Central Asia (Kazakhstan, the Kyrgyz Republic, Tajikistan, Turkmenistan, and Uzbekistan), making use of historical and synthetic earthquakes and floods, considering the building characteristics and a set of demographic indicators, together with the modelled direct damages on the building stock.
Among the different research efforts that have been carried out in the past, usually in the aftermath of large disasters, to quantify the emergency costs, the following are to be highlighted because of the major findings. French (1993) investigated the damages to public properties caused by the 1989 Loma Prieta and the 1987 Whittier Narrows earthquakes in California, USA, finding that emergency response costs accounted for 13 % of the total damages for the Whittier Narrows earthquake and 31 % for the Loma Prieta earthquake, concluding that emergency response costs are proportionally larger for more severe earthquakes, especially if the hardest hit areas are densely populated.
Penning-Rowsell and Wilson (2006) assessed the severe 2000 autumn floods in the United Kingdom and according to the results of their analysis, the emergency costs amounted to 15 % of the direct economic flood losses. Similarly, the rapid assessment method (RAM) for floodplain management used in Australia estimated the emergency response costs as 49.5 % of the indirect losses, which are assumed to be equivalent to 30 % of the direct losses (AIDR, 2002).
As indicated with the previous examples, the emergency response costs have been often associated with a percentage of the total economic losses, and following that approach, in an analysis carried out by the World Bank to assess the macro-fiscal impacts of earthquakes and floods in the European Union Member States (World Bank, 2021), the emergency response costs were added to those of direct asset losses, as a percentage of the total ground-up losses to residential, commercial, industrial, and public buildings, as well as schools and hospitals. The final percentages used by the World Bank were 20 % for the case of earthquakes and to 15 % for floods, regardless of the country, the size of the event, and the damage extent in the study area.
In Mexico, it was established that the emergency response costs in the state of Oaxaca after the 2017 Mw 8.2 earthquake were approximately 18 % of the total losses and 4.6 % for the state of Chiapas. On the other hand, for the 2017 Mw 7.1 Puebla earthquake these costs were estimated at approximately 4 % of the total losses in Mexico City (CENAPRED, 2019). Much of these costs were associated with demolition activities and debris removal and disposal of damaged or collapsed residential units and did not quantify the expenses incurred by police, army, and navy forces to deliver supplies to communities that live in mountainous areas of the Oaxaca–Chiapas region, which is of difficult access and for which logistical costs were significant.
The methodology presented in this paper does not consider external human factors such as mismanagement of the available resources and corruption: topics relevant in disaster risk management but beyond the scope of our research and cannot be modelled with the approach presented herein.
The proposed methodology in this paper explicitly accounts for the particularities of the region, including its building stock characteristics, population density, and the way that a given earthquake or flood may affect each region (i.e. size of the event and extent of the damages). This methodology is intended to be used as part of a comprehensive risk assessment, so data for the hazard, vulnerability, and exposure components are required. The methodology accounts for debris disposal costs based on modelled building damages and approximates the emergency services and immediate relief cost requirements based on the population that lives in each damaged building. The way the methodology is defined allows for a better estimation of emergency response costs depending on the intensity of an event, and as part of a fully probabilistic risk model it allows for its use in a more comprehensive risk and budget planning strategies that include reserves or parametric insurance products that account for the immediate relief needs after a disaster. Also, it has the potential to be included in the framework of fully probabilistic risk assessments, such as the one developed by Ordaz (2000), which is implemented in R-CAPRA (ERN, 2022), the tool used to estimate the earthquake and flood losses in this project.
The proposed methodology aims at estimating the total emergency costs for earthquakes and floods in five countries of Central Asia, as a function of the modelled direct damages in the building stock that were obtained in the framework of a regional risk assessment funded by the European Union and implemented by the World Bank. The total emergency response costs are assumed to be representative of the costs for providing the first response to the affected communities in the aftermath of a disaster (i.e. safety and emergency services) and for debris removal and disposal. For this, the same idea proposed in previous studies elsewhere of linking the emergency costs for both hazards to the direct losses is followed, but it is tailored to the particularities of the region, such as the number and characteristics of the building, occupancy values, and population density, as well as explicitly accounting for the size of the event and the damage extent.
The methodology requires the same inputs as any probabilistic risk assessment, namely (1) hazard (in the form of synthetic earthquakes or floods); (2) an exposure database for the study area that includes attributes about the characteristics of the buildings (i.e. building classes/typologies), total built area, occupancy levels per building, and number of buildings (individually or grouped); and (3) physical vulnerability functions that provide a relationship between a given hazard intensity measure (e.g. ground acceleration or flood depth) and the expected losses (or damages). For this study, the earthquake and hazard data used were developed by Poggi et al. (2023) and Coccia et al. (2023) for earthquakes and floods, respectively. The exposure model for residential buildings is the one developed by Scaini et al. (2023), and the vulnerability functions for earthquakes and floods are the ones developed by RED (2023).
2.1 First response costs in the aftermath of a disaster (emergency and safety services)
The first response costs are those associated with the emergency and safety services required by the affected population because of the occurrence of a disaster. As such, the needed resources have a direct relationship to the size of the affected population. Physical vulnerability can be described using different approaches, such as fragility curves (Kircher and McCann, 1983) and vulnerability functions. The risk assessment carried out in Central Asia made use of the latter representation, given the possibility to provide a continuous, quantitative, and probabilistic relationship between the hazard intensity measure and the direct losses at each exposed asset. Because of this, the risk assessment carried out for earthquakes and floods in this project allowed estimating the mean damage ratio (MDR) for each exposed asset, which corresponds to the expected loss normalized by the replacement cost of the asset.
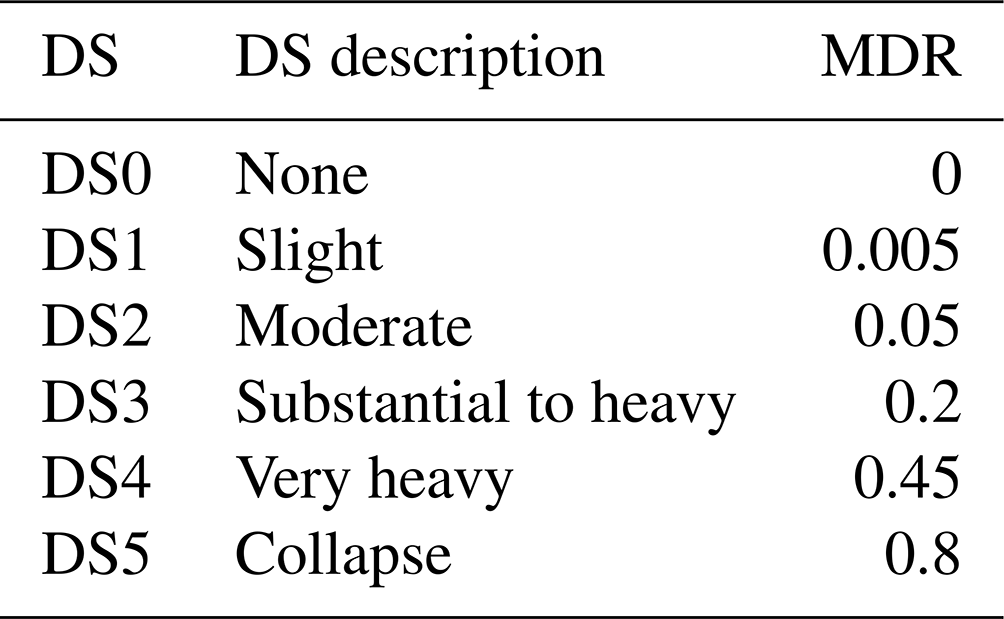
Since there is a close relationship between vulnerability functions and fragility curves (Ordaz, 2008), from the modelled MDR for the residential units in the earthquake and flood risk assessments, a damage state (DS) is assigned to each building, using the values shown in Table 1 and considering six possible DSs (from none to collapse). It is assumed that only people residing in buildings with a MDR of 0.20 or higher (equivalent to a building with substantial to heavy damage) are considered to require emergency and safety services immediately in the aftermath of the event. It is also assumed that all people residing in the same building are equally affected.
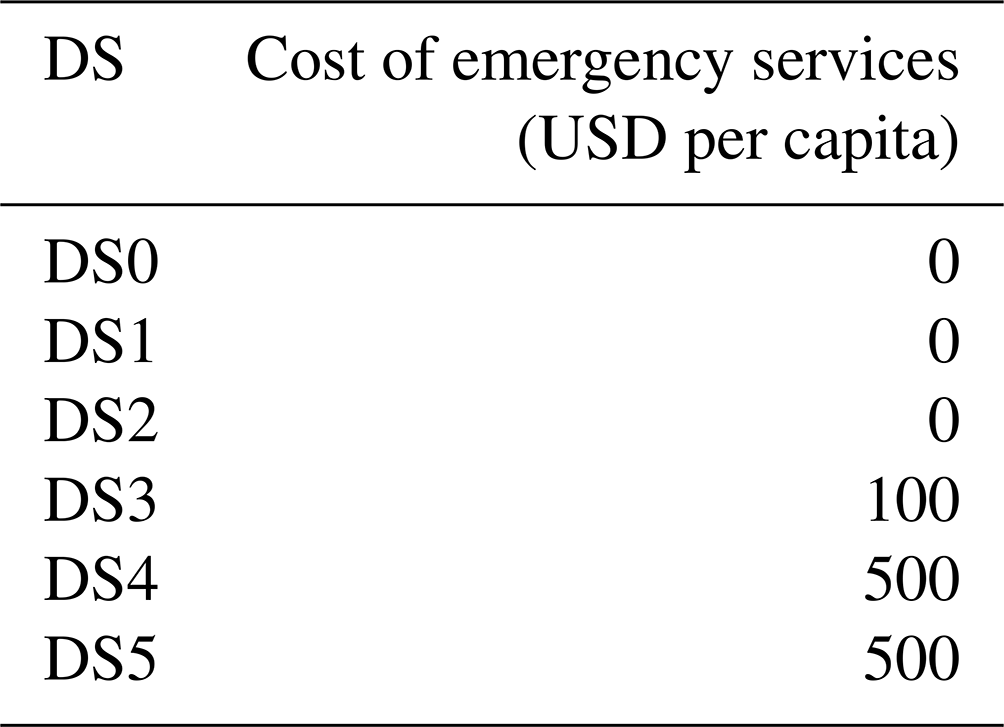
Depending on the DS of each building, the first response costs per capita, CR, are assigned, which are directly proportional to the damage level (i.e. as the damage in the building increases, so do the first response costs), as shown in Table 2. The values for these costs have been derived from a previous study by CENAPRED (2019), which used the 2017 Mexico earthquake as the primary source. This data source was used because the GDP per capita of Mexico is more similar to the Central Asian countries of this study, if compared to Europe or the USA, for which detailed emergency cost data are also available.
The expected costs of first response at each building, CFRB, in the study area are calculated as
where CR ∨ DS represents the first response costs per capita given a DS, and NR is the number residents at each building. The total cost of emergency and safety services (i.e. first response costs), TFR, due to the occurrence of the disaster, is equal to the sum of the individual values of emergency services and safety services for all affected buildings in the study area, which can be calculated as
2.2 Cost of debris removal and disposal
Debris removal and disposal can account for a significant portion of the total emergency response costs. Indeed, the collapse and damage of buildings after a disaster generates a great amount of debris and waste that not only could impede a quick emergency response on the affected areas, but also could represent a significant emergency response cost, as earthquake or flood debris can be too heavy to be managed by individuals and often requires specialized equipment and personnel. Major disasters can generate debris and waste equivalent to 5 to 15 times the annual waste generation of the affected community after a single event, overwhelming the existing capacity and impacting the recovery efforts (Brown et al., 2011). Determining the amount and type of debris is also relevant for the preparedness activities within the disaster management cycle to plan for the personnel and equipment needs.
Some major disasters that have generated large amount of debris include the 2010 Port au Prince (Haiti) earthquake, which generated 20×106 m3 of debris (DesRoches et al., 2011), the 2008 Sichuan (China) earthquake and the 1995 Kobe (Japan) earthquake that generated over 20×106 t of debris (Hirayama et al., 2010; Brown et al., 2011), the 2007 Pisco (Peru) earthquake that caused around 10×106 m3 of debris (Mesta et al., 2020), and 15 m3 of debris per affected household after the 2015 Gorkha (Nepal) earthquake (Khanal et al., 2021).
Previous work has been published with methodologies to estimate the amount of debris after a disaster (see for instance, FEMA, 2007; Hirayama et al., 2010; Xiao et al., 2012; Tabata et al., 2016; García-Torres et al., 2017; Poudel et al., 2018; Mesta et al., 2020), where most of these account for the quantity of debris and waste generated as a function of the DS of the building. Hence, a good estimation of debris removal and disposal cost requires an estimation of building damage in the study area, as DS will depend on the vulnerability of the building stock. For this project, region-specific vulnerability functions were developed to explicitly account for the building characteristics, local construction practices, and use of building codes (RED, 2023).
Besides the DS, the amount of debris (measured in weight) that a building generates after a disaster is a function of several building characteristics, such as the typology, the floor area, and the weight per floor area (or material intensity). Then, in this methodology, for a given typology the fraction of the building stock that turns into debris depends on the modelled DS.
The quantification of materials used in a building can only be empirically measured during the construction and demolition stages, whereas for the case of existing buildings these can only be estimated by assigning material intensity (MI) coefficients. Compiling MI data is resource intensive, and most estimates are based on a handful of data points only, resulting in large uncertainties that are hard to quantify. As physical attributes of buildings can vary as a function of local construction practices, preferences, and traditions, as well as budgetary constraints, building code level and enforcement, as well as the construction period, MI coefficients are virtually unique to every building. Therefore, the representativeness of MI values for building archetypes is limited (Sprecher et al., 2022).
Nevertheless, different efforts have been made to compile data of MI coefficients for different archetypes and for different regions, at different scales. For instance, Tanikawa and Hashimoto (2009) made this compilation for two cities of Japan and the UK; Wiedenhofer et al. (2015) for the 25 member states of the European Union; Condeixa et al. (2017) for Rio de Janeiro, Brazil; Kleemann et al. (2017) for Vienna, Austria; Ortlepp et al. (2018) for Germany; and Poudel et al. (2018) for the Kathmandu Valley in Nepal. Miatto et al. (2019) compiled these data for the city of Padua in Italy, Mesta et al. (2019) for Chiclayo in Peru, and Sprecher et al. (2022) for the Netherlands.
MI data for Central Asia were not found during the literature review carried out for this study, although after reviewing the MI values for different areas of the world, there appears to be consistency in the values between building typologies. As such, it was considered as reasonable to use the MI values proposed by HAZUS (FEMA, 2020). When a building typology included in the exposure model for Central Asia was not listed by HAZUS, the values were taken from other available references in the literature. For instance, this was the case for adobe buildings, which are not common in the USA, but have a non-negligible share in Central Asia and had been previously analysed in Peru by Mesta et al. (2020). For a given DS, a debris weight per floor area, known as debris intensity (DI), was estimated based on the building type and its MI. The DI values used in this study are shown in Table 3 and correspond to a weighted sum based on the values proposed by HAZUS (FEMA, 2020). The weights of the sum are assumed to be the percentage that each structural and non-structural components represent of the total MI.
Table 3DI values for the different building typologies in Central Asia*.
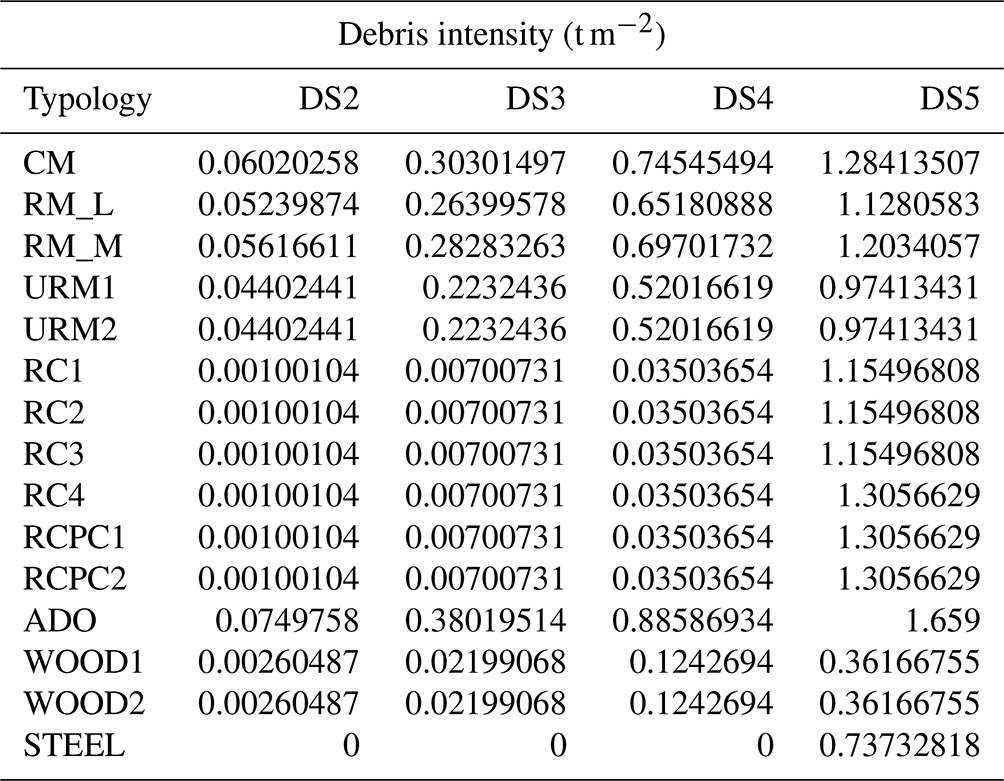
CM: confined masonry; RM: reinforced masonry; URM: unreinforced masonry; RC: reinforced concrete frames; RCPC: pre-cast reinforced concrete; ADO: adobe.
The exposure model for Central Asia groups multiple buildings into gridded cells. At each of them the number of buildings by building class and the total built areas are known. Therefore, the expected weight of the debris generated by each building for a given event, Wd, in tonnes, can be calculated as
where DI ∨ DS is the debris intensity for a given DS and building class, and FA corresponds to the total built area per building (in m2). The total weight of debris generated for a given event (TWd) is computed as the sum of weights in all the affected exposed assets (i.e. those with physical losses larger than zero) using the geolocated modelled damages per building, which can be calculated as
where p is the building of interest and np the total number of buildings simultaneously affected by a given event. The total cost of debris removal and disposal, TCD, for a single event is computed as the multiplication of the total weight of debris generated and the cost of debris removal and disposal, CD, per tonne of material, which is calculated as
where CD, per tonne of material, depends on several factors, including the cost of labour and distance to the disposal site. Because of the lack of information for the study area, a unique value of USD 30 per tonne was used, which is based on typical solid waste management costs, as a function of the income level of the five countries in the study area (Kaza et al., 2018).
This value was found to be consistent with the aggregated costs for debris removal and disposal reported after several disasters worldwide and could be considered an estimate of the debris removal and disposal costs as part of the emergency response. It should be noted however that debris removal and disposal costs can significantly increase immediately following a disaster due to the lack of personnel, machinery and resources available, particularly if the affected area is very large and densely populated. There is also a great variability on the costs of debris removal and disposal depending on the income level of the country, as this activity is very labour intensive.
2.3 Emergency response costs
The emergency response cost (ERC) is estimated as the sum of the first response costs (TFR) and the total cost of debris removal and disposal (TCD), for each event.
A final factor is included in this methodology, representing the population density (PD), since as observed in the two 2017 Mexican earthquakes, as well as in the analysis carried out by French (1993), ERC increases in areas where the affected population is higher, which is generally the case of densely populated areas. Therefore, the total emergency response cost (TERC) is computed as
where PD is a factor that amplifies the total costs in densely populated zones and indirectly covers the demand surges that are known to occur during large disasters. PD is assumed to be equal to 2 in areas with more than 15 000 people per square kilometres and 1 elsewhere.
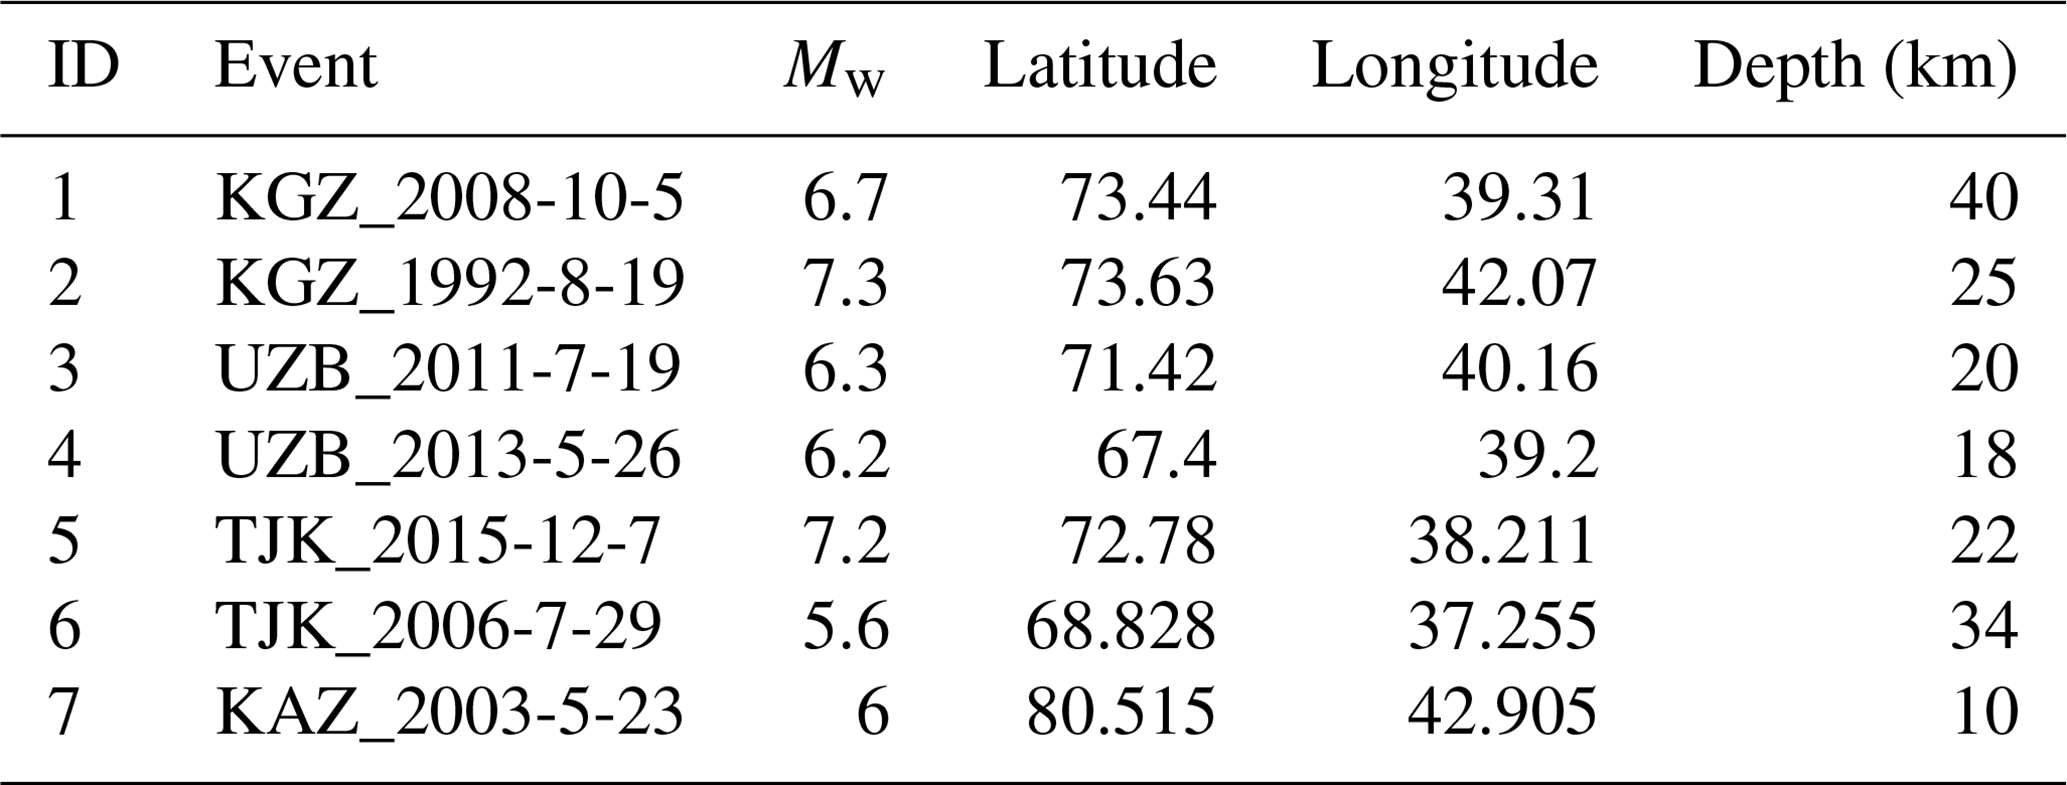
The methodology presented in this paper has been applied to Kazakhstan, the Kyrgyz Republic, Tajikistan, Turkmenistan, and Uzbekistan, for which emergency response costs for earthquakes and floods were estimated, using as a starting point the datasets for earthquake and flood hazard, built environment exposure, and earthquake and flood vulnerability functions developed in the framework of the Strengthening Financial Resilience and Accelerating Risk Reduction in Central Asia (SFRARR) project. To estimate the emergency costs, only buildings and population data were used from the exposure model. For the case of earthquakes, the emergency costs were estimated for the seven (7) events used in the validation and calibration procedure of the model (see full details in Salgado-Gálvez et al., 2023), the details of which are shown in Table 4. For the case of floods, since there were not enough data for historical events, the validation and calibration procedures were carried out using feasible events with given return periods and chosen from the synthetic flood catalogue (see full details in Coccia et al., 2023).
Table 4Historical earthquakes in the region of study used for validation.
3.1 Emergency response cost assessment
3.1.1 Earthquakes
Table 5 shows the results obtained for the emergency response costs for earthquakes in Central Asia. Results indicate that the lower total emergency response cost ratio, with respect to the modelled losses for the residential buildings, corresponds to the 2013 Uzbekistan event, whereas the largest ratio was found for the Tajikistan 2015 earthquake.
Table 5Direct losses and emergency cost estimates for seven historical earthquakes in Central Asia. KGZ: Kyrgyz Republic; UZB: Uzbekistan; TJK: Tajikistan; KAZ: Kazakhstan.
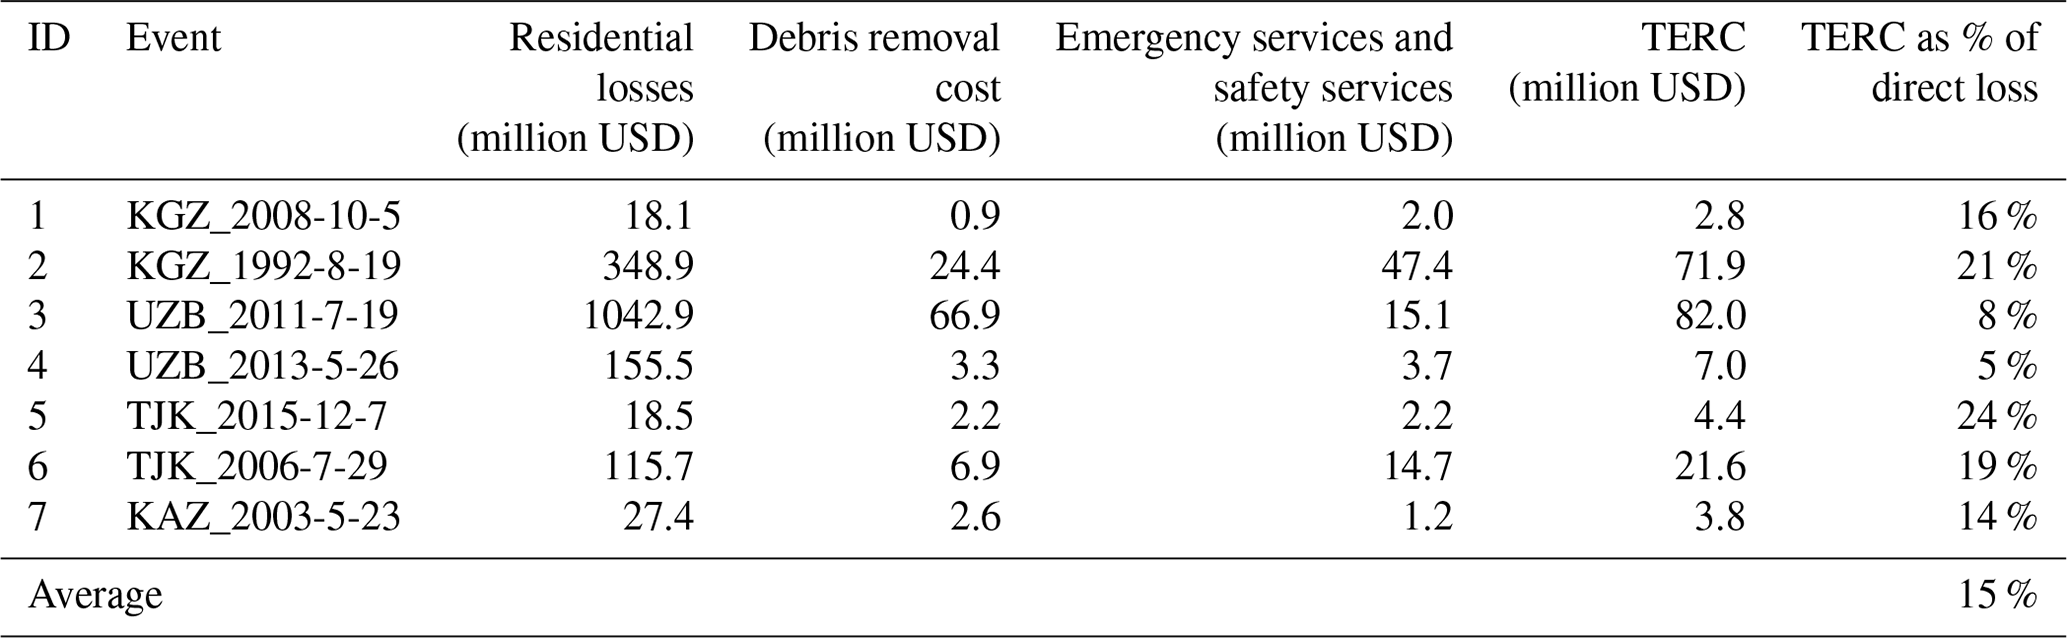
For the case of the historical events affecting the Kyrgyz Republic, it can be seen that the TERC is higher, both in terms of the total costs and relative to the direct losses for the 1992 event. For the 2008 event the affected population was relatively low, and the area with the highest modelled damages was relatively small (in line with the size of the event). For the case of the 1992 earthquake, and despite the sparsely populated area where it occurred, a significantly larger amount of population was affected as the area with significant shaking was also much larger if compared to the 2008 event.
For Uzbekistan, the relative TERC is considerably lower than for the other countries, which is explained not only by the larger exposure affected by the events, but also by the lower earthquake vulnerability in this country, which means that the debris generated by building damages and the population that requires emergency services in the aftermath of the event are also lower.
The 2015 earthquake in Tajikistan is the historical event with the highest relative TERC. This event, while affecting a sparsely populated area, produced very strong shaking that led to many buildings reaching higher DS, which consequently led to higher relative emergency response costs.
At regional level, after calculating these costs for the seven historical events shown in Table 5, it was found that, on average, TERC represents 15 % of the modelled residential losses, which is a value in line with those reported in the literature for other regions in the world. However, the methodology presented herein can differentiate the expected TERC depending on the intensity of the event and the characteristics of the affected population, besides having explicitly considered the hazard, exposure, and vulnerability characteristics of Central Asia.
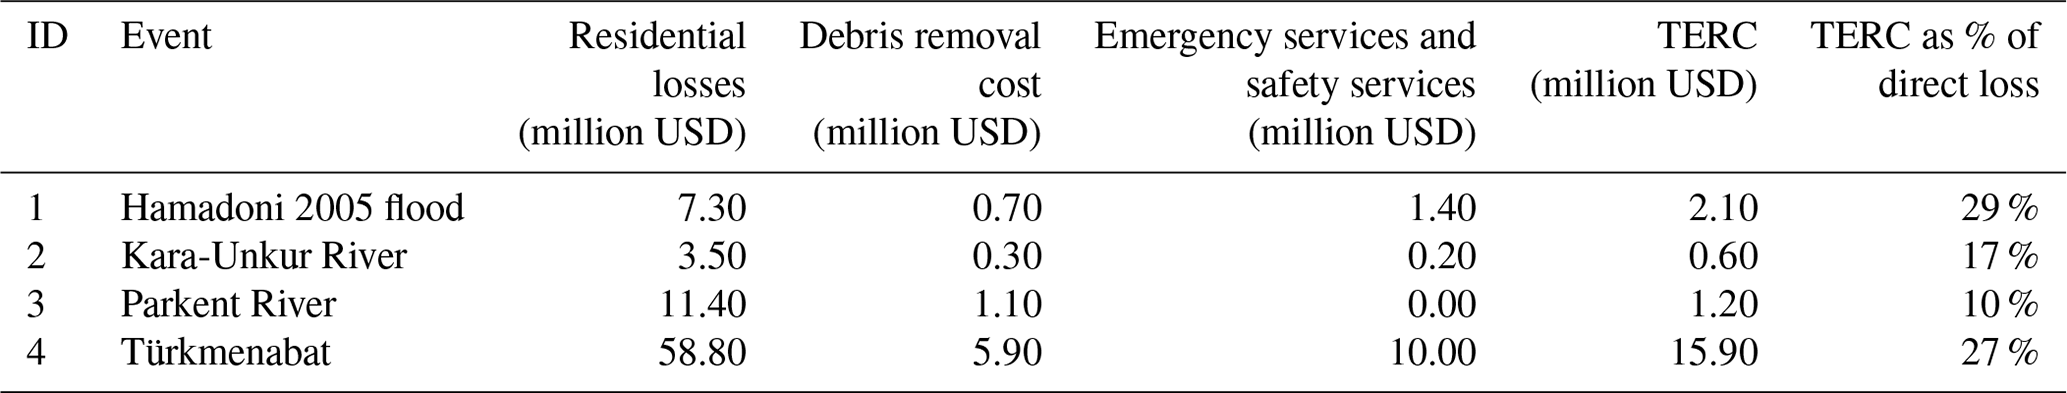
Table 6Estimation of emergency response cost for one historical and three possible floods.
3.1.2 Floods
TERC for floods was estimated for a recreation of the Hamadoni 2005 historical flood and the three synthetic scenarios defined for the Kara-Unkur River, the Parkent River, and the Türkmenabat region. Results are shown in Table 6 showing that, on average, the ratio between the TERC and the modelled losses was around 21 %.
It can be seen that the event with the highest TERC as a percentage of the direct residential losses corresponds to the Hamadoni flood, where a significant amount of the affected assets was located near the highest flood depths, which caused more serious damage and in turn produced larger TERC.
For the three synthetic scenarios, the one for the Türkmenabat region stands out with similar TERC percentages as the Hamadoni flood. In this case, a significant amount of exposure exists in the margins of the Amu Darya River, so for a significant flood event like the one represented by that event, with certain land zones reaching water depths of more than 3 m, a considerable amount of population would require emergency and safety services, as the expected DS of many buildings would be significant.
For the cases of the Parkent River and Kara-Unkur River flood scenarios, the highest flood depths reached for the events were not as high as those reached in the Türkmenabat scenario, or the Hamadoni flood, which in turn made it that the percentage of exposed assets that reached the DS that require the use of emergency and safety services was also lower. This is more evident for the case of the Parkent River: while total residential losses were higher than the Hamadoni flood, since a larger amount of assets were affected, the TERC was considerably lower since most of affected assets only suffered minor damages.
A methodology to estimate the emergency response costs for earthquakes and floods in Central Asia has been proposed, making use of the different components developed in the framework of a fully probabilistic multi-hazard risk assessment for five countries in the region. The methodology accounts for debris removal and disposal costs based on building damage levels and approximates the emergency services and immediate relief cost requirements based on the characteristics of the population that lives in each of the damaged buildings, for which values were obtained from a detailed exposure model specifically developed for this project.
Instead of using a flat percentage of the direct losses to estimate emergency response costs, regardless the characteristics of the event, this methodology accounts for the vulnerability of the exposed assets and the hazard extent in order to determine the total emergency response cost (TERC). While a larger population exposed to moderate shaking is expected to produce larger direct losses than a smaller population exposed to very intense shaking, the relative costs for the emergency services would be much higher in the second case as it would require the disposal of a larger amount of debris, besides a larger percentage of the population needing first response services.
The methodology was applied to five countries in Central Asia, where little to no information exists about the expected emergency response costs for disaster response. It can be seen that for the historical and synthetic events considered, the average TERC is in line with the values previously published in the literature for other regions in the world, although this approach offers the advantage of differentiating between events that produced different levels of overall damage: more destructive events have higher relative TERC than events with higher losses that affected less vulnerable building stock.
The total emergency cost estimates presented in this paper do not account for external human factors such as mismanagement of resources and corruption. These are beyond the scope of our research, although several publications have shown the relationship between corruption and disaster damages (see for instance Escaleras et al., 2007; Ambraseys and Bilham, 2011; Klomp, 2020; Masiero and Santarrosa, 2021; Sanderson et al., 2022; Gawronski et al., 2023; Zafar et al., 2023). Further research on the integration of these external factors in the total emergency cost estimates is needed by adopting a multidisciplinary approach.
While the results found in this work are promising, more data are needed to validate the results. There is a need for more and better-quality loss data in the region that disaggregates the expenses incurred by governments to attend the emergencies, more so in the case of flooding events. Region-specific data for some of the parameters could further help improve the TERC estimations, particularly those related to debris removal and disposal. Future work will include the use of the methodology as part of a fully probabilistic risk model, allowing the estimation of TERC, or any other of the variables considered for its quantification, in terms of exceedance probabilities, providing decision-makers and stakeholders better tools to allocate the needed resources (e.g. personnel and equipment) in disaster response and preparedness activities.
Data and results are available at https://datacatalog.worldbank.org/search?q=sfrarr central&start=0&sort= (World Bank, 2023).
EB: conceptualization, methodology, formal analysis, writing. CA: conceptualization, formal analysis, validation. MASG: conceptualization, validation, formal analysis, writing and editing. MO: conceptualization, risk assessment methodology, software, validation, formal analysis, writing review and editing.
The contact author has declared that none of the authors has any competing interests.
Publisher’s note: Copernicus Publications remains neutral with regard to jurisdictional claims made in the text, published maps, institutional affiliations, or any other geographical representation in this paper. While Copernicus Publications makes every effort to include appropriate place names, the final responsibility lies with the authors.
This article is part of the special issue “Regionally consistent risk assessment for earthquakes and floods and selective landslide scenario analysis in Central Asia”. It is not associated with a conference.
The Strengthening Financial Resilience and Accelerating Risk Reduction in Central Asia (SFRARR) project was funded by the European Union and was implemented by the World Bank. The authors are thankful to the World Bank specialists, in particular Chyi-Yun and Stuart Fraser for their contributions and constructive criticism during the development of the earthquake risk model. The authors are also thankful to Sergey Tyagunov for the assistance and support in the finding and validation of local data. The authors are also thankful to the two reviewers, who provided valuable feedback, which allowed improving the original version of the manuscript.
This paper was edited by Chiara Scaini and reviewed by Samar Momin and one anonymous referee.
AIDR – Australian Institute for Disaster Resilience: Disaster loss assessment guidelines, Australian Disaster Resilience Handbook Collection, Manual 27, 101 pp., https://knowledge.aidr.org.au/media/1967/manual-27-disaster-loss-assessment-guidelines.pdf (last access: 8 June 2022), 2002.
Ambraseys, N. and Bilham, R.: Corruption kills, Nature, 469, 153–155, 2011.
Brown, C., Milke, M., and Seville, E.: Disaster waste management: A review article, Waste Manage., 31, 1085–1098, 2011.
CENAPRED – Centro Nacional de Prevención de Desastres: Impacto socioeconómico de los principales desastres ocurridos en la República Mexicana, 269 pp., https://www.cenapred.unam.mx/es/Publicaciones/archivos/415-IMPACTO_SOCIOECONOMICO_2017.PDF (last access: 13 June 2022), 2019.
Coccia, G., Ceresa, P., Bussi, G., Denaro, S., Bazzurro, P., Martina, M., Fagà, E., Avelar, C., Ordaz, M., Huerta, B., Garay, O., Raimbekova, Z., Abdrakhmatov, K., Mirzokhonova, S., Ismailov, V., and Belikov, V.: Large-scale flood risk assessment in data scarce areas: an application to Central Asia, Nat. Hazards Earth Syst. Sci. Discuss. [preprint], https://doi.org/10.5194/nhess-2023-157, in review, 2023.
Condeixa, K., Haddad, A., and Boer, D.: Material flow analysis of the residential building stock at the city of Rio de Janeiro, J. Clean. Prod., 149, 1249–1267, 2017.
DesRoches, R., Comerio, M., Eberhard, M., Mooney, W., and Rix, G. J.: Overview of the 2010 Haiti Earthquake, Earthq. Spectra, 27, 1–21, 2011.
ERN – Evaluación de Riesgos Naturales: R-CAPRA. Program for probabilistic and multi-hazard risk assessment, Evaluación de Riesgos Naturales, Mexico City, Mexico, 2022.
Escaleras, M., Anbarci, N., and Register, C. A.: Public sector corruption and major earthquakes: A potentially deadly interaction, Public Choice, 132, 209–230, 2007.
FEMA – Federal Emergency Management Agency: Public Assistance. Debris Management Guide, FEMA-325, 260 pp., https://www.fema.gov/sites/default/files/2020-07/fema_325_public-assistance-debris-mgmt-plan_Guide_6-1-2007.pdf (last access: 3 June 2022), 2007.
FEMA – Federal Emergency Management Agency: Hazus Earthquake Model Technical Manual, Hazus 4.2 SP3, 436 pp., https://www.fema.gov/sites/default/files/2020-10/fema_hazus_earthquake_technical_manual_4-2.pdf (last accessed: 3 June 2022), 2020.
French, S. P.: Public property damage and emergency response costs: Comparing the Loma Prieta and Whittier Narrows Earthquakes, Earthq. Spectra, 9, 35–54, 1993.
García-Torres, S., Kahhat, R., and Santa-Cruz, S.: Methodology to characterize and quantify debris generation in residential buildings after seismic events, Resour. Coserv. Recy., 117, 151–159, 2017.
Gawronski, V. T., Levitt, B. S., and Olson, R. S.: Disasters and corruption: public expectations and tolerance-evidence from Mexico, Disasters, 47, 1118–1137, 2023.
Hirayama, N., Shimaoka, T., Fujiwara, T., Okayama, T., and Kawata, Y.: Establishment of disaster debris management based on quantitative estimation using natural hazard maps, WIT Trans. Ecol. Envir., 140, 167–178, 2010.
Kaza, S., Yao, L. C., Bhada-Tata, P., and Van Woerden, F.: What a Waste 2.0: A Global Snapshot of Solid Waste Management to 2050, Urban Development Series, The World Bank, 101–112, https://doi.org/10.1596/978-1-4648-1329-0, 2018.
Khanal, R., Subedi, P. U., Yadawa, R. K., and Pandey, B.: Post-earthquake reconstruction: Managing debris and construction waste in Gorkha and Sindhupalchok Districts, Nepal, Prog. Disaster Sci., 100151, https://doi.org/10.1016/j.pdisas.2021.100151, 2021.
Kircher, C. A. and McCann, M. W.: Appendix A: development of seismic fragility curves for sixteen types of structures common to cities of the Mississippi Valley Region, Jack Benjamin and Associates Inc., Mountain View, California, USA, 1983.
Kleemann, F., Lederer, J., Rechberger, H., and Fellner, J.: GIS-based analysis of Vienna's material stock in buildings, J. Ind. Ecol., 21, 368–380, 2017.
Klomp J.: Election or disaster support?, J. Dev. Stud., 56, 205–220, 2020.
Masiero, G. and Santarrosa, M.: Natural disasters and electoral outcomes, Eur. J. Polit. Econ., 67, 101983, https://doi.org/10.1016/j.ejpoleco.2020.101983, 2021.
Mesta, C., Kahhat, R., and Santa-Cruz, S.: Geospatial characterization of material stock in the residential sector of a Latin-American City, J. Ind. Ecol., 23, 280–291, 2019.
Mesta, C., Santa-Cruz, S., and Kahhat, R.: Probabilistic assessment of earthquake-induced debris generation using PBEE methodology, Proceedings of the 17th World Conference on Earthquake Engineering. Sendai, Japan, https://wcee.nicee.org/wcee/article/17WCEE/8b-0032.pdf (last access: 10 June 2023), 2020.
Miatto, A., Schandl, H., Forlin, L., Ronzani, F., Borin, P., Giordano, A., and Tanikawa, H.: A spatial analysis of material stock accumulation and demolition waste potential of buildings: A case study of Padua, Resour. Conserv. Recy., 142, 245–256, 2019.
Ordaz, M.: Metodología para la evaluación del riesgo sísmico enfocada a la gerencia de seguros por terremoto, technical report, Universidad Nacional Autónoma de México, Mexico City, Mexico, 2000.
Ordaz, M.: Relaciones entre curvas de fragilidad, matrices de probabilidad y funciones de vulnerabilidad, Technical Note, ERN-AL Consortium, Mexico City, Mexico, 2008.
Ortlepp, R., Gruhler, K., and Schiller, G.: Materials in Germany's domestic building stock: calculation model and uncertainties, Build. Res. Inf., 46, 164–178, 2018.
Penning-Rowsell, E. and Wilson, T.: Gauging the impact of natural hazards: the pattern and cost of emergency response during flood events, Trans. Inst. Br., 31, 99–115, 2006.
Pfurtscheller, C. and Schwarze, R.: Estimating the costs of emergency services during flood events, Proceedings of the 4th International Symposium on Flood Defence, Toronto, Canada, https://www.researchgate.net/publication/259479521_Estimating_the_costs_of_emergency_services_during_flood_events (last access: 2 June 2022), 2008.
Poggi, V., Parolai, S., Silacheva, N., Ischuk, A., Abdrakhmatov, K., Kobuliev, Z., Ismailov, V., Ibragimov, R., Karayev, J., Ceresa, P., Santulin, M., and Bazzurro, P.: Development of a regional probabilistic seismic hazard model for Central Asia, Nat. Hazards Earth Syst. Sci. Discuss. [preprint], https://doi.org/10.5194/nhess-2023-132, in review, 2023.
Poser, K. and Dransch, D.: Volunteered geographic information for disaster management with application to rapid flood damage estimation, Geomatica, 64, 89–98, 2010.
Poudel, R., Hirai, Y., Asari, M., and Sakai, S.: Establishment of unit generation rates of building debris in Kathmandu Valley, Nepal, after the Gorkha earthquake, J. Mater. Cycles Waste, 20, 1663–1675, 2018.
RED – Risk Engineering Development: Earthquake vulnerability for the regional consistent risk assessment for earthquakes and floods and selective landslide scenario analysis for strengthening financial resilience and accelerating risk reduction Central Asia, Technical Report Task 5a, World Bank, 2023.
Sanderson, D., Patel, S., Loosemore, M., Sharma, A., Greenwald, K., and Patel, R.: Corruption and disasters in the built environment: a literature review, Disasters, 46, 928–945, 2022.
Salgado-Gálvez, M. A., Ordaz, M., Huerta, B., Garay, O., Avelar, C., Fagà, E., Kohrangi, M., Ceresa, P., and Fasoulakis, Z.: Development of a regionally consistent and fully probabilistic earthquake risk model for Central Asia, Nat. Hazards Earth Syst. Sci. Discuss. [preprint], https://doi.org/10.5194/nhess-2023-137, in review, 2023.
Scaini, C., Tamaro, A., Adilkhan, B., Sarzhanov, S., Ismailov, V., Umaraliev, R., Safarov, M., Belikov, V., Karayev, J., and Fagà, E.: A new regionally consistent exposure database for Central Asia: population and residential buildings, Nat. Hazards Earth Syst. Sci. Discuss. [preprint], https://doi.org/10.5194/nhess-2023-94, in review, 2023.
Sprecher, B., Verhagen, T. J., Sauer, M. L., Baars, M., Heintz, J., and Fishman, T.: Material intensity database for the Dutch building stock: Towards big data in material stock analysis, J. Ind. Ecol., 26, 272–280, 2022.
Tabata, T., Zhang, O., Yamanaka, Y., and Tsai, P.: Estimating potential disaster waste generation for pre-disaster waste management, Clean Technol. Envir., 18, 1735–1744, 2016.
Tanikawa, H. and Hashimoto, S.: Urban stock over time: spatial material stock analysis using 4d-GIS, Build. Res. Inf., 37, 483–502, 2009.
Wiedenhofer, D., Steinberger, J. K., Eisenmenger, N., and Haas, W.: Maintenance and Expansion: modelling material stocks and flows for residential buildings and transportation networks in the EU25, J. Ind. Ecol., 19, 538–551, 2015.
World Bank: Financial risk and opportunities to build resilience in Europe, 139 pp., https://doi.org/10.1596/35685, 2021.
World Bank: Data Catalog, https://datacatalog.worldbank.org/search?q=sfrarr central&start=0&sort=, last access: 15 October 2023.
Xiao, J., Xie, H., and Zhang, C.: Investigation on building waste and reclaim in Wenchuan earthquake disaster area, Resour. Conserv. Recy., 61, 109–117, 2012.
Zafar, S., Ur Rahman, I., and Ammara, S.: Disasters and corruption: An empirical analysis of 16 countries from Asia and the Middle East, Int. J. Disast. Risk Re., 90, 103678, https://doi.org/10.1016/j.ijdrr.2023.103678, 2023.