the Creative Commons Attribution 4.0 License.
the Creative Commons Attribution 4.0 License.
Examining the Eastern European extreme summer temperatures of 2023 from a long-term perspective: the role of natural variability vs. anthropogenic factors
Petru Vaideanu
Bogdan Antonescu
Catalin Roibu
Viorica Nagavciuc
Amidst unprecedented rising global temperatures, this study investigates the historical context of heat wave (HW) events in Eastern Europe. The record-breaking 2023 summer, featuring a HW lasting for 19 d in the southeastern part of Romania, extending up to Ukraine, necessitates a deeper understanding of past extreme events. Utilizing statistical methods on long-term station data spanning from 1885 to 2023, we aim to detect and analyze historical HWs, particularly focusing on events predating 1960. This extended time frame allows for a more comprehensive assessment of noteworthy extremes compared to recent decades. We used both a percentile-based threshold and a fixed absolute temperature threshold to identify HW events. Our analysis identifies two critical periods with increased HW frequency and intensity: 1920–1965 and 1980–2023, respectively, highlighting the most extreme events in August 1946, August 1952, July 2012, June 2019, and August 2023. Furthermore, reanalysis data show that historical HWs, similar to the 2023 event, were associated with large-scale European heat extremes linked to high-pressure systems, and they were accompanied by extreme drought, thus leading to compound extreme events. We find that while a clear trend emerges towards more frequent HWs from the 1980s onward, the analysis also uncovers substantial HW activity on daily timescales throughout the 1885–1960 period. Moreover, we highlight the intertwined impacts of climate change and multidecadal internal variability on HW patterns, with evidence suggesting that both contribute to the increasing frequency and intensity of these extreme events. Attribution analysis reveals that the extreme summer temperatures observed in 2023 would not have been possible in the absence of anthropogenic climate change. Regardless of future warming levels, such temperatures will occur every year by the end of the century. Our research highlights the value of extending the historical record for a more nuanced understanding of HW behavior and suggests that extreme heat events, comparable to those experienced in recent decades, have occurred throughout the analyzed period.
- Article
(20368 KB) - Full-text XML
-
Supplement
(5705 KB) - BibTeX
- EndNote
Global warming poses a significant threat, as indicated by the projected increase in the magnitude and frequency of heat wave (HW) events across Europe and globally (Fischer and Schär, 2010; IPCC, 2021a; Perkins and Alexander, 2013; Russo et al., 2019; Manning et al., 2019; Doshi et al., 2023). These events have devastating consequences, exemplified by the designation of HWs as the leading cause of weather-related fatalities in the USA by the National Weather Service (Robinson, 2001; IPCC, 2021a). Europe has also seen a marked increase in both the frequency and intensity of these events in the last few decades, with severe socio-economic consequences. For example, ∼70 000 lives were lost in the 2003 European HW (Robine et al., 2008; García-Herrera et al., 2010), while the 2022 summer HW in Europe and the UK caused an estimated 15 000 and 3200 deaths, respectively (Ballester et al., 2023). The impact of heat extremes is not equally distributed, with race, class, and gender disparities playing a significant role in vulnerability (Benz and Burney, 2021; Chakraborty et al., 2019). These disparities can be attributed to factors such as the urban heat island effect, varying levels of tree cover and green spaces across socioeconomic groups, and the density of the built environment. While a single hot day may not significantly increase mortality, consecutive days of extreme heat, particularly with high nighttime temperatures, can lead to a substantial rise (Perkins, 2015; Barriopedro et al., 2023; Ma et al., 2024).
Eastern Europe in particular, a region historically characterized by moderate temperatures, has witnessed a concerning rise in the frequency and magnitude of HWs in recent decades (Ionita et al., 2021; Nagavciuc et al., 2022b; Croitoru et al., 2016; Croitoru and Piticar, 2013). These extreme weather events pose a significant threat to human health, ecosystems, and infrastructure. Furthermore, in Eastern Europe, there are many urban areas with limited green spaces, which suffer disproportionately during HWs, demanding immediate attention and comprehensive mitigation strategies. Several factors contribute to the increasing prevalence of HWs in Eastern Europe. Climate change intensified by human activities such as the emission of greenhouse gases, alongside natural variability, plays a pivotal role in the occurrence, magnitude, and frequency of these events (Luo et al., 2023). Rising global temperatures create conducive conditions for the development and persistence of high-pressure systems, leading to stagnant air masses and amplifying HWs and droughts (Han et al., 2022; Bakke et al., 2023; Ma and Franzke, 2021). Additionally, regional factors like changes in the atmospheric and oceanic circulation patterns coupled with land use practices further exacerbate the issue (Vautard et al., 2023; Vaideanu et al., 2020). The consequences of HWs in Eastern Europe are far-reaching and multifaceted, demanding immediate attention and comprehensive mitigation strategies. The most immediate impact is on mortality and human health, with increased risks of heatstroke, dehydration, and cardiovascular complications, particularly among vulnerable populations like the elderly and young children (European Environment Agency, 2022; Vicedo-Cabrera et al., 2021). HWs also disrupt agricultural production, leading to crop failures and impacting food security (Malik et al., 2022). Furthermore, they exacerbate drought conditions, straining water resources and increasing the risk of wildfires (Zscheischler et al., 2018; Brando et al., 2019; Ionita and Nagavciuc, 2020; Laaha et al., 2017). Given these pressing challenges, this study delves into the multifaceted phenomenon of HWs in Eastern Europe, exploring their causes and impact.
Common definitions of HWs rely on exceeding fixed temperature thresholds or deviations from normal values, such as daily mean or maximum temperatures (Cowan et al., 2014; Barriopedro et al., 2023; Alexander, 2016). Understanding these definitions is important for accurately monitoring HWs and implementing effective response strategies. Here, we use a historical approach to analyze HW occurrences since the 19th century in the eastern part of Europe, with a particular emphasis on Romania. Examining past events offers valuable insights into the decadal variability of extreme events (e.g., HW frequency and magnitude, cold spells, storms) as documented by previous studies (Beckett and Sanderson, 2022; Hawkins et al., 2023; Lorrey et al., 2022; White et al., 2023). Analyzing past extreme events expands the temporal sample for future studies, fostering a deeper understanding of the underlying mechanisms driving such phenomena. This expanded knowledge base allows also for improved preparedness for similar events in the future, even those not readily captured by current climate models (Van Oldenborgh et al., 2022). Additionally, historical analysis transcends the limitations of solely studying present-day climate, enabling researchers to contextualize modern events like the recent European summer HWs (e.g., 2003, 2015, 2019, 2022) within a broader historical framework (Yule et al., 2023; Hegerl et al., 2019). Therefore, this research leverages the valuable information gained from past events to enrich our understanding of HW activity, ultimately contributing to improved preparedness and contextualization of contemporary extreme heat events over Europe.
This study focuses on analyzing HWs in Romania from the 19th century to the present, specifically from May through September. Individual historical HWs are compared to contemporary events, such as the one from 2023, to explore potential shifts in their characteristics (e.g., frequency, duration, and magnitude). Long-term daily maximum temperature data served as the foundation for identifying HWs in the target period. Here, we make use of both of the already available data, as well as newly digitalized data from old meteorological yearbooks (Ionita and Nagavciuc, 2024). A regionally specific definition of a HW is employed to optimize detection accuracy. Further, reanalysis data are used to analyze the spatial extent and synoptic conditions associated with historical HWs. This integrated approach provides a comprehensive assessment of the efficacy of long-term regional datasets in capturing large-scale HW events. Section 2 details the observational data and methodology employed in our study. Section 3 presents the main results. The discussion and the concluding remarks are presented in Sect. 4.
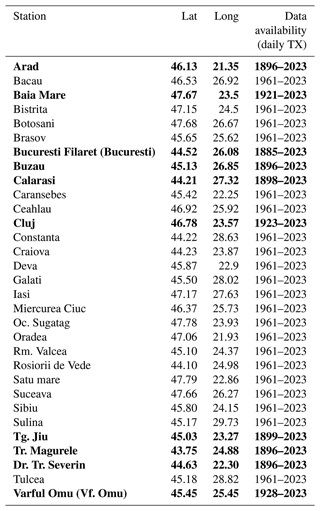
HWs can be defined either by utilizing a threshold-based methodology (Perkins, 2015) or by using the exceedance of a fixed absolute value (e.g., daily maximum temperature ≥30 °C) (Robinson, 2001). The threshold-based method identifies HWs as periods where the daily maximum temperature (TX) exceeds a specific percentile threshold for that calendar day, taking into account the regional temperature variations. The fixed temperature threshold method defines a summer as any day when the maximum temperature surpasses a fixed value (e.g., 30 °C). In our study, we used both the threshold-based method, specifically employing the 90th percentile of daily maximum temperatures within a 15 d window centered around each calendar day (Perkins and Alexander, 2013), and the fixed absolute method for the number of days with Tx≥30 °C (i.e., summer days). For the threshold-based method, we have tested different HW durations (3–6 consecutive days) and selected a 5 d period for our analysis. HW duration thresholds vary globally to reflect regional climates: for example, in Canada (2+ days), Hungary and France (3+ days), and China and Ukraine (5+ days). Our choice of a 5 d threshold is suitable for Romania's location in Eastern Europe and our emphasis on extreme events (Nagavciuc et al., 2022b). This aligns with the recommendations of the Expert Team on Climate Change Detection and Indices (ETCCDI) and allows us to focus on disastrous, extreme HW events. Our baseline for calculating the 90th percentile was the period of 1971–2000. We also used the fixed threshold method to count the number of summer days with the daily maximum temperature ≥30 °C (TX30). We used the daily maximum temperature records at 31 meteorological stations over the period 1961–2023 (Fig. 1) and a dataset of longer-term meteorological records covering the period 1885–2023. A detailed description of the long-term meteorological stations and the period covered by daily TX records is given in Table 1.
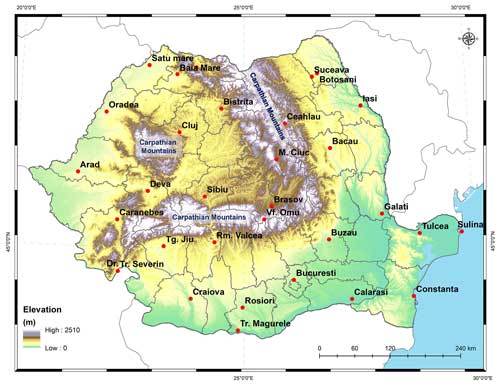
Figure 1Location of the meteorological stations used in this study and the location of the Carpathian Mountains.
Table 1Names, coordinates, and length of data availability for the stations used in this study. The stations in bold are the stations for which long-term observations exist. In the current study, we will use the term Bucuresti for the Bucuresti Filaret station and Vf. Omul for the Varful Omu station.
The daily maximum temperatures for the meteorological stations (see Table 1) are taken from the European Climate Assessment & Dataset (ECA&D) (Klein Tank et al., 2002). The long-term meteorological records are a combination of the time series extracted from ECA&D and newly digitalized daily meteorological records extracted from the yearly reports of the Romanian meteorological service (Hepites, 1899; Ionita and Nagavciuc, 2024), which have been homogenized using the climatol R package (Guijarro et al., 2023) in order to ensure data consistency and reliability. In addition to the station-based daily records from Romania (Table 1), we also use the gridded daily maximum temperature from the E-OBS dataset (Cornes et al., 2018). Additionally, the hourly data for the universal thermal climate index (UTCI), which in an indicator of the outdoor thermal comfort levels, have been computed based on the ERA5 dataset (Di Napoli et al., 2021). To analyze the large-scale atmospheric circulation pattern associated with the occurrence of HWs, we use the daily and monthly geopotential height anomalies at 500 mbar level (Z500) and the zonal and meridional wind at the same level. For the Z500 and the corresponding wind patterns associated with particular HW events (see Sect. 3), we made use of the ERA5 dataset (Hersbach et al., 2020), while for the long-term analysis (i.e., 1885–2023) we made use of the NOAA/CIRES/DOE 20th Century Reanalysis (V3) (NCEPV3) (Slivinski et al., 2019). The ERA5 dataset covers the period 1940–2023 and has a spatial resolution of 0.25°×0.25°, while the NCEPV3 covers the period 1885–2015 and has a spatial resolution of 1°×1°. In order to analyze the drought conditions associated with the occurrence of extreme HWs, we used the Standardized Precipitation Evapotranspiration Index (SPEI) for an accumulation period of 1 month (SPEI1) (Vicente-Serrano et al., 2010). The precipitation and evapotranspiration datasets needed to compute SPEI have been extracted from the E-OBS dataset (Cornes et al., 2018).
The large-scale anomaly patterns associated with long-term changes in the frequency of summer days are analyzed through composite map analysis (von Storch and Zwiers, 1999). The composite maps are computed for the years when a certain index is higher (lower) than +0.75 (−0.75) standard deviation. The difference between these averages is the composite map, where the differences are the anomalies. A simple t test determines the anomalies' statistical significance.
3.1 Variability, change, and drivers of summer days (TX30)
This subsection investigates the changes in extreme summer temperatures at the national level within Romania. A linear trend analysis was conducted on the number of summer days exceeding 30 °C (TX≥30 °C) at nine meteorological stations possessing long-term data (details in Table 1). The analysis considered both the entire data period (varying per station) and the common time frame of 1961–2023 (presented in Fig. 2). Figure 2 shows a statistically significant upward trend in the number of summer days at all stations, particularly during the 1961–2023 period. Notably, Bucuresti recorded the most substantial increase, with summer days rising by approximately 8.8 d per decade, followed by Calarasi, with a 7.6 d increase per decade. Looking at the broader period, starting from 1896, Tg. Magurele witnessed the most significant increase (∼3.1 d per decade), while Arad came in second with an increase of ∼2.9 d per decade over the same period. The identified trends consistently point towards an increase in summer days across Romania over the past 140 years. Analyzing the temporal evolution from a long-term perspective also reveals multidecadal variability. Two notable periods stand out: 1920–1970 and 1980 onwards, both characterized by a rise in summer day frequency.
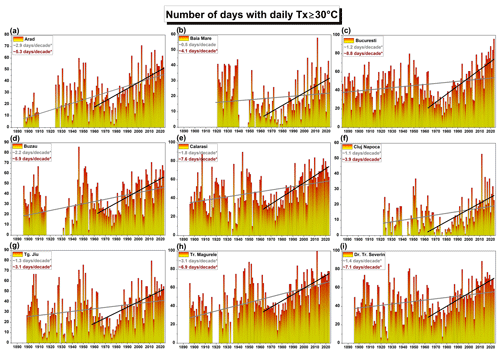
Figure 2The total number of days with daily maximum temperature above 30 °C over the period 1885–2023 and the linear trend over the period 1885–2023 (gray line) and over the period 1961–2023 (red line): (a) Arad, (b) Baia Mare, (c) Bucuresti, (d) Buzau, (e) Calarasi, (f) Cluj, (g) Tg. Jiu, (h) Tr. Magurele, and (i) Dr. Tr. Severin. Analyzed time frame: May–September. Yellow colors indicate smaller values, while red colors indicate higher values.
The 30-year probability density function (PDF) for some of the long-term meteorological stations shows a very clear pattern: the period 1991–2023 was the hottest one (e.g., in terms of frequency of summer days) over the observational record, while the period 1961–1990 was the least warm one (e.g., in terms of the frequency of summer days). The difference in the number of summer days, at Bucuresti station, between 1991–2023 and 1961–1990 is approximately 26 d (Fig. 3a), which is statistically significant (p<0.001, based on a two-sample Wilcoxon rank test). At Calarasi there is an increase of approximately 25 d (the highest one) in the frequency of summer days over the period 1991–2023 relative to the period 1961–1990. Overall, the period 1991–2023 is the time frame with the highest frequency of summer days at all stations, the period 1961–1990 is the time frame with the smallest number of summer days, and the periods 1901–1930 and 1931–1960 have a similar distribution in terms of summer days. The difference in the number of summer days between the periods 1991–2023 and 1961–1990 is statistically significant at all analyzed stations (Fig. 3).
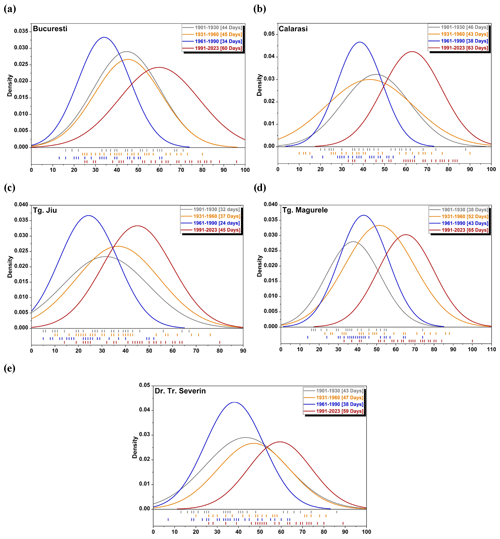
Figure 3The probability distribution function of the number of days with TX ≥ 30 °C for different periods (i.e., 1901–1930, 1931–1960, 1961–1990 and 1991–2023, respectively): (a) Bucuresti, (b) Calarasi, (c) Tg. Jiu, (d) Tr. Magurele, and (e) Dr. Tr. Severin. The numbers in brackets represent the mean values. Analyzed time frame: May–September.
Across all analyzed stations, a positive trend is evident for the summer days, with the strongest increase observed in the southeastern part of the Romania. However, considerable multidecadal variability is evident in the number of days with TX>30 °C. The dominant mode of multidecadal variability in the climate system is the Atlantic Multidecadal Oscillation (AMO; Kerr, 2000). In its positive phase, the AMO is characterized by warmer temperature anomalies over the North Atlantic (Enfield et al., 2001; Drinkwater et al., 2014; Knight et al., 2006), significantly affecting the Northern Hemisphere's climate (Dima and Lohmann, 2007), including precipitation (Vaideanu et al., 2018), land temperature (Knight et al., 2005; Ionita et al., 2013), and sea ice (Vaideanu et al., 2023). Therefore, variations in the sign and magnitude of the AMO could be responsible for modulating the summer days over Romania. To test this hypothesis, we applied the empirical orthogonal function (EOF) technique for the time series of TX30 at nine stations over a common period (i.e., 1923–2023), and we have looked at the first EOF and its corresponding temporal evolution (i.e., PC1) (Fig. 4a). We choose the first EOF (EOF1), as it captures 93 % of the total variance and extracts the common signal from each station. This mode captures an in-phase variability for all analyzed stations, and the corresponding eigenvalues for each station are shown in Table 2. This monopolar structure (positive values at all stations) suggests that mainly the large-scale atmospheric and oceanic circulation influences the multidecadal variability of the summer temperature over Romania. Its temporal evolution (PC1) smoothed with a 21-year running mean filter resembles the evolution of the summer (MJJAS) AMO index (Fig. 4a), and the correlation coefficient between the smoothed PC1 and the smoothed summer AMO index is 0.94 (99 % significance level). A period with an increased frequency of summer days (1925–1965) was followed by a prolonged period with a reduced number of summer days (1965–1990). The last ∼30 years of the analyzed interval are also characterized by a higher frequency of summer days. High (low) frequency of summer days occurs during the warm (cold) phase of the AMO index. This builds on our previous work (Ionita et al., 2013) where we have shown that the multidecadal variability of the summer mean temperature over Romania is mainly driven by the phase of the AMO.
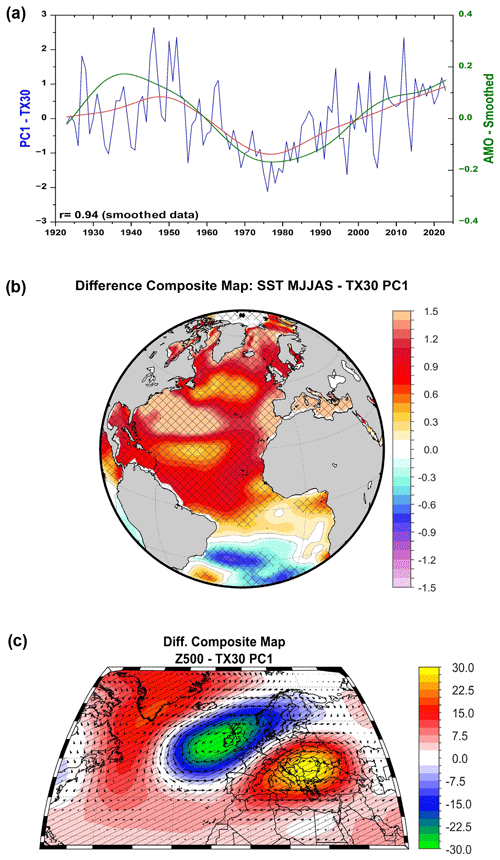
Figure 4(a) The time series of the raw PC1 (blue line), the smoothed PC1 (green line), and the smoothed time series of summer (MJJAS) AMO index (red line). The time series were smoothed using the Whittaker–Henderson approach. (b) The composite map (high–low) between PC1 and the normalized SST. Before the composite map analysis, a running mean of 5 years was applied to PC1 and the SST field, to focus on the decadal to multidecadal variability. (c) The composite map (high–low) between PC1 and the corresponding 500 mbar geopotential height (Z500) and wind vectors. The hatched areas indicate anomalies significant at the 95 % significance level based on a two-tailed t test. Units: Z500 [m].
In order to understand how the sea surface temperatures (SSTs) might influence the frequency of summer days in Romania, composite maps of summer (MJJAS) SST were created for the years with high (>1 SD) vs. low ( SD) PC1 values. The difference map (high–low, Fig. 4b) shows a quasi-monopolar North Atlantic signal, with positive SST anomalies across the basin during high PC1 years. This aligns with the PC1–AMO correlation and with well-known AMO-related SST patterns (Mestas-Nuñez and Enfield, 1999; Enfield et al., 2001; Knight et al., 2006; Drinkwater et al., 2014). Considering the structure of the composite map, we argue that during the warm (cold) phase of the AMO, Romania experiences an increase (decrease) in the frequency of summer extreme temperatures, which is in agreement with the evolution of the summer PC1 time series, presented in Fig. 4a. Additionally, we used Z500 anomalies and wind vectors for years marked by increased summer temperatures, identifying a pattern of positive Z500 anomalies over Europe. The composite map of the Z500 anomalies and the corresponding wind vectors for the years with increased frequency in summer days is characterized by a large center of positive (negative) Z500 anomalies over the central and eastern parts of Europe (central North Atlantic Ocean) (Fig. 4c). The spatial structure of the Z500 anomalies, with the positive center over the eastern part of Europe, favors the advection of dry and warm air from the east or southeastern part of Europe, reduced precipitation, and an increased frequency of high temperatures over the regions situated under the influence of the anticyclonic circulation. This can lead to the development or strengthening of HWs as they cause clear skies, cause calm winds, and allow the air to warm significantly, often through subsidence (Ma and Franzke, 2021; Ionita et al., 2022). This observation is consistent with previous research (Gao et al., 2019), which has shown that during the positive phase of AMO, a center with Z500 anomalies over the central and eastern part of Europe co-exists with a hot spot for extremely high temperatures over the same regions. Thus, we argue that the warm phase of AMO influences the frequency of HWs over the eastern part of Europe, including Romania, via the modulation of the large-scale atmospheric and oceanic patterns. In summary, a significant upward trend in summer days exceeding 30 °C in Romania is observed, with the most notable increases in the southeastern regions and during the period 1961–2023. The AMO also emerges as an important driver, influencing these temperature trends through its impact on sea surface temperatures and large-scale atmospheric patterns and underscoring its pivotal role in modulating Romania's climate extremes.
3.2 Variability and change in the occurrence of long-term summer HWs
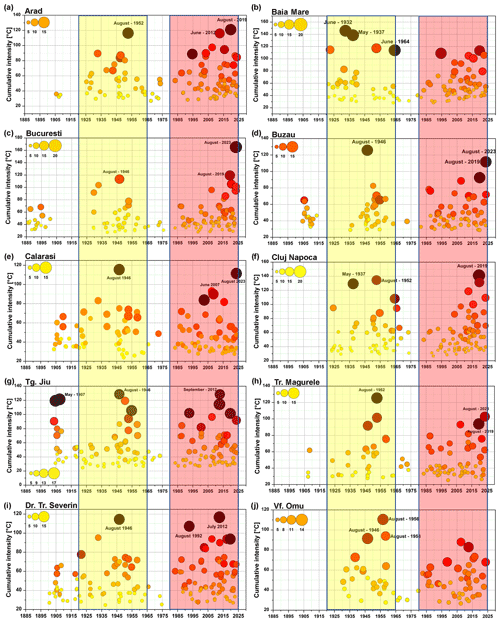
The strongest HWs, detected using the threshold-based method, are visualized using bubble plots, where the cumulative intensity (i.e., the sum of all the temperature anomalies throughout the duration of the HW) determines the rank. Figure 5 shows the cumulative intensity (the sum of daily maximum temperature anomalies throughout a HWs) plotted against its duration (represented by circle size) for 10 Romanian meteorological stations over the period 1885–2023. Some stations, like Arad (Fig. 5a) and Bucuresti (Fig. 5c), demonstrate a gradual increase in heat intensity over time. Others, like Calarasi (Fig. 5e) and Cluj Napoca (Fig. 5f), exhibit a mixed pattern with years of high and low heat intensity. Interannual variability is evident across all stations (e.g., Bucuresti (Fig. 5c), showing significantly higher cumulative heat intensity in 2019 and 2023 compared to surrounding years). Figure 5 suggests a positive correlation between HW duration and cumulative intensity; longer HWs tend to have higher cumulative intensity. However, there is considerable variability within the data, including short HWs with high cumulative intensity and long HWs with lower intensity. A striking feature of Fig. 5 is the clustering of HWs over two periods: 1920–1965 and 1980–2023. This indicates that alongside interannual variability, Eastern European HW frequency exhibits a multidecadal component, which can be influenced by the state of SSTs in the North Atlantic Basin, as shown in Sect. 3.1. As in the case of summer days, the clustering of HWs occurs over the same period when AMO was in its positive phase (i.e., 1920–1960 and 1990–present), while the periods with a reduced number of HWs occurred over the same time when AMO was in its negative phase (i.e., mainly between 1960 and 1990) (Fig. 4a – red line). Overall, the temporal evolution of cumulative intensity as a function of HW duration over the past 140 years further highlights a denser concentration of high-intensity HWs within the past 3 decades (Fig. 5).
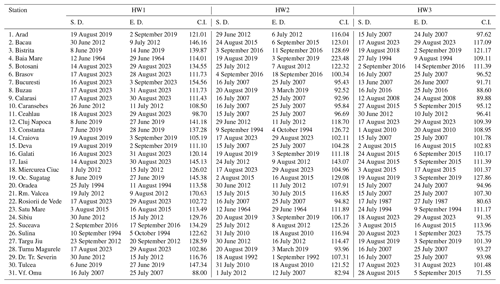
The 2023 HW emerged as the strongest event in terms of duration and cumulative intensity at 10 out of 31 stations analyzed, marking it as an exceptional event in recent decades (Table 3). In Bucuresti, this event was exceptional in both magnitude (cumulative intensity of 165.26 °C) and duration (19 d). The second-strongest HW was recorded in August 1946 (Fig. 4 and Table 4), lasting 15 d with cumulative intensities of 125.81 (Buzau), 128.73 (Tg. Jiu), and 115.55 °C (Calarasi). Additional long-lasting HWs of high magnitude occurred in August 1952, June/July 2012, and June 2019 (Tables 3 and 4). Section 3.4 will provide a detailed analysis of these specific HW events.
Table 3The starting and end date of the first three high-intensity HWs, based on their cumulative intensity, over the period 1961–2023 recorded at 31 stations over the Romanian territory. S.D. – starting date, E.D. – ending date, and C.I. (°C) – cumulative intensity.
3.3 Then vs. now
Based on the two HW-prone periods identified in Fig. 5, we have computed the temporal changes in the HWs metrics over two periods: 1920–1965 and 1980–2023. When looking at the distribution of the duration (Fig. 6a) and number of HWs (Fig. 6b) over these two periods, we notice significant increases in both metrics over the period 1980–2023 with respect to the period 1920–1965. The strongest increase (∼212 %/194 %) is found for the HW duration and number at Bucuresti station, followed by Arad (186 %/180 %) and Tg. Magurele (186 %/203 %). All analyzed stations indicate an increase both in the duration and the number of HWs between the two periods, an increase which is statistically significant (p<0.001, based on a two-sample Wilcoxon rank test). The increase in the overall duration of HWs varies between 141 % (i.e., Cluj Napoca) and 212 % (i.e., Bucuresti) and for the number of HWs from 136 % (i.e., Cluj Napoca) to 194 % (i.e., Bucuresti). The stations situated outside the Carpathian Arch (i.e., Bucuresti, Buzau, Calarasi, Tg. Jiu, Tg. Magurele, and Dr. Tr. Severin) show a higher increase in the duration and number of HWs compared to the station situated inside the Carpathian Arch (e.g., Arad, Baia Mare, Cluj Napoca, and Vf. Omu), emphasizing the strong influence the Carpathian Mountains have on the climate of Romania. In terms of cumulative intensity (Fig. 7), the same pattern can be observed: the strongest difference, between the two analyzed periods, for the cumulative intensity is found at Bucuresti Filaret station (215 %), followed by Tr. Magurele (184 %), while the smallest difference can be observed at Tg. Jiu (142 %) and Cluj Napoca (143 %).
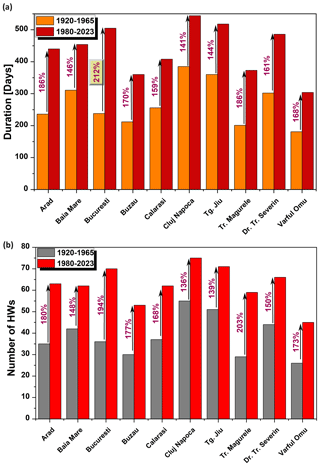
Figure 6(a) Distribution of the duration (i.e., sum of all days affected by a HW) over two periods, namely 1920–1965 (orange bars) and 1980–2023 (red bars), respectively. (b) Distribution of the number of HWs (i.e., sum of all HWs) over two periods, namely 1920–1965 (gray bars) and 1980–2023 (red bars), respectively. The black arrows in (a) and (b) indicate the rate of change (as %) between the two analyzed periods.
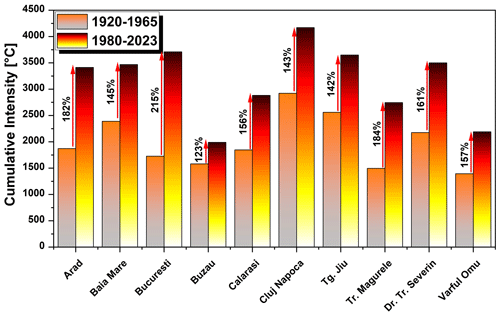
Figure 7Distribution of the cumulative intensity (i.e., sum of daily maximum temperature anomaly over all days affected by a HW) over two periods, namely 1920–1965 (gray-to-orange bars) and 1980–2023 (yellow-to-red bars), respectively. The black arrows indicate the rate of change (as %) between the two analyzed periods. Yellow (gray) colors indicate smaller values, while red (orange) colors indicate higher values.
If we consider only the period 1961–2023, when more meteorological stations are available and perform the same analysis by splitting the data into two parts, namely 1961–1990 and 1990–2023, the situation becomes even more critical (Figs. S1 and S2 in the Supplement). At Bucuresti station an increase in the HW duration of 461 % has been found, together with an increase of 400 % in the number of HWs and an increase of 492 % in the cumulative intensity. All analyzed stations (see Table 1) indicate an increase of at least 250 % in the duration, number, and cumulative intensity over the period 1991–2023 compared to the period 1961–1990, but the most affected ones are the stations situated in the south and eastern part of the country. Here we show only the 10 stations as in the previous subsection, but the analysis was performed at all 31 meteorological stations. This exceptional increase in the HW metrics (i.e., duration, number, and cumulative intensity) when considering only the period 1961–2023 indicates how misleading it is to quantify the real extent and change in the HWs metrics if one considers short periods. Although the difference is also statistically significant and reaches values of up to 200 %, it is valuable and indicated to perform HW-related statistics on long-term time series.
3.4 Large-scale drivers of extreme HWs
In this section, an in-depth analysis of the most extreme HWs (e.g., 1946, 1952, 2012, 2019, and 2023, respectively) observed for particular months, with respect to their large-scale drivers, is presented. We specifically examine case studies in August 1946, August 1952, June/July 2012, June 2019, and August 2023. An extended HW impacted Romania in August 1946, characterized by record-breaking temperatures and lasting up to 14 d in specific regions (particularly the south). The HW was first observed on 10 August in western Romania (Fig. S4a in the Supplement), spreading eastward across the country over subsequent days. Peak temperatures were observed on August 13 (Table 4, Figs. 8a and 4a). The cumulative HW intensity (CHI) reached values as high as 130 °C in southeastern Romania and even 160 °C over Ukraine (Fig. 8b). Regionally, Tg. Jiu exhibited the highest CI (128.73 °C), followed by Buzau (125.81 °C) and Calarasi (115.55 °C). This event coincided with approximately 200 h exceeding the heat stress index UTCI of 32 °C, signifying “very strong heat stress” (Fig. S5a in the Supplement) across most of the country (excluding mountainous areas). Summer 1946 also stands out as one of Romania's hottest and driest on record (Nagavciuc et al., 2022a). Drought severity ranged from moderate to extreme nationwide (Fig. 8d). A significant co-occurrence of intense heat and drought was observed over Romania and Ukraine (Fig. 8b–d). The anomalies in large-scale atmospheric circulation during the HW suggest the transport of warm air masses from Russia by northeasterly airflow, leading to the extreme temperatures (daily maximum anomalies up to ∼12 °C, Fig. S4a in the Supplement) and coinciding with drought conditions (Fig. 8d). In addition to the extreme HW event, the summer of 1946 and the following months were characterized by an excessive famine. The lingering effects of World War II, corroborated by extreme heat and dryness, severely compromised the agricultural capacity. Major grain-producing regions, encompassing Romania, Ukraine, Moldova, the lower and middle Volga basins, Rostov Oblast, and the Central Black Earth Region, experienced a crippling drought. This resulted in a precipitous decline in crop yields (Wheatcroft, 2012). For example, the grain harvest in the Soviet Union yielded only 39.6×10⁶ t, which represented a significant decline compared to the previous year's harvest of 47.3×10⁶ t and a dramatic reduction from the 95.5×10⁶ t harvested in 1940, the last full year before World War II (Ganson, 2009).
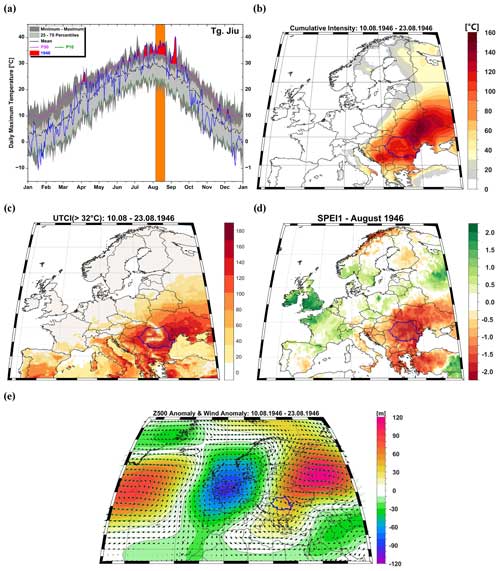
Figure 8(a) Daily maximum temperature at Tg. Jiu meteorological station for the year 1946. (b) The cumulative intensity of the HW occurring over the period 10–23 August 1946. (c) The number of hours with the universal thermal climate index>32 °C throughout the duration of the HW. (d) The 1-month Standardized Precipitation Evapotranspiration Index for August 1946. (e) The 500 mbar geopotential height anomaly and the associated winds averaged over the period 10–23 August 1946. In (a) the green line represents the 10th percentile (P10) of the daily maximum temperature. The dotted black line represents the mean of the daily maximum temperature, and the red line represents the 90th percentile (P90) of the daily maximum temperature. The period 1971–2000 was used to compute the daily maximum temperature climatology.
The year 1952 goes down in history for an astonishingly warm summer. On 16 August, it was 41 °C in Timişoara (western part of the country) and 39.4 °C in Satu Mare (northwestern part of the country), which marks the August records for these stations. At Arad meteorological station (Fig. 9a) the maximum daily temperature was also recorded on 16 August (i.e., 40.4 °C), and the HW lasted for 15 d (i.e., 03–17 August 1952). The maximum intensity of this event, on 16 August 1952, reached anomalies of up to 12 °C over the northwestern part of Romania and western Ukraine (Fig. S4b). This HW was mainly focused on the eastern part of Europe (Fig. S6 in the Supplement), with the most affected regions over Ukraine, Romania, Hungary, and Poland (Fig. S6). The cumulative intensity reached a value of up to 120 °C over the western part of Romania (Fig. 9b) corroborated by up to 200 h of UTCI>32 °C (Fig. 9c), indicating very strong heat stress over these regions. On the peak day of the HW (i.e., August 16), most of the western part of Romania was under “very strong heat stress” (Fig. S5b in the Supplement), while the eastern part was under “strong heat stress” conditions. As in the case of the August 1946 event, August 1952 was accompanied by extreme drought conditions, with a center over the eastern part of Europe (Fig. 9d), which led to the occurrence of a compound event with significant stress on the agriculture and society (Topor, 1963). The occurrence of the August 1952 compound hot and dry event was the consequence of an anomalous high-pressure center extending from Russia to the eastern part of Europe, which led to the advection (horizontal transport) of hot and dry air from Eurasia towards the eastern part of Europe (Fig. 9e).
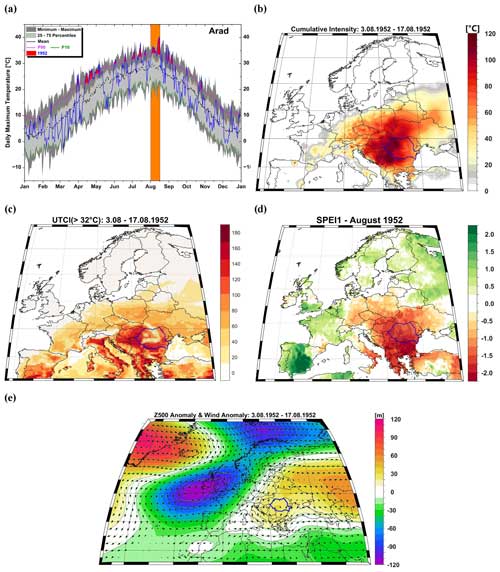
Figure 9(a) Daily maximum temperature at Arad meteorological station for the year 1952. (b) The cumulative intensity of the HW occurring over the period 3–17 August 1952. (c) The number of hours with the universal thermal climate index>32 °C throughout the duration of the HW. (d) The 1-month Standardized Precipitation Evapotranspiration Index for August 1952. (e) The 500 mbar geopotential height anomaly and the associated winds averaged over the period 3–17 August 1952. In (a) the green line represents the 10th percentile (P10) of the daily maximum temperature. The dotted black line represents the mean of the daily maximum temperature, and the red line represents the 90th percentile (P90) of the daily maximum temperature. The period 1971–2000 was used to compute the daily maximum temperature climatology.
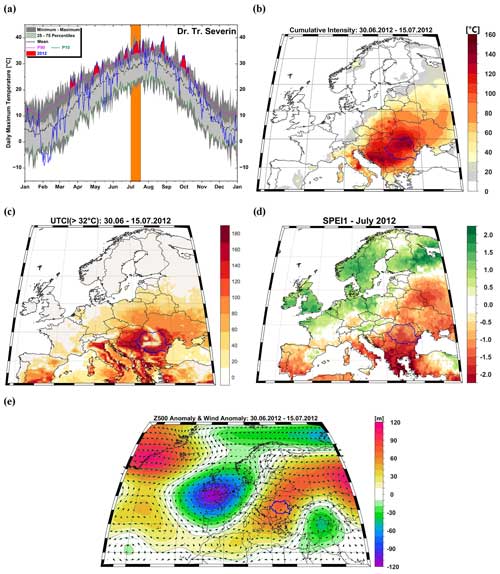
Figure 10(a) Daily maximum temperature at Dr. Tr. Severin meteorological station for the year 2012. (b) The cumulative intensity of the HW occurring over the period 30 June–15 July 2012. (c) The number of hours with the universal thermal climate index>32 °C throughout the duration of the HW. (d) The 1-month Standardized Precipitation Evapotranspiration Index for July 2012. (e) The 500 mbar geopotential height anomaly and the associated winds averaged over the period 30 June–15 July 2012. In (a) the green line represents the 10th percentile (P10) of the daily maximum temperature. The dotted black line represents the mean of the daily maximum temperature, and the red line represents the 90th percentile (P90) of the daily maximum temperature. The period 1971–2000 was used to compute the daily maximum temperature climatology.
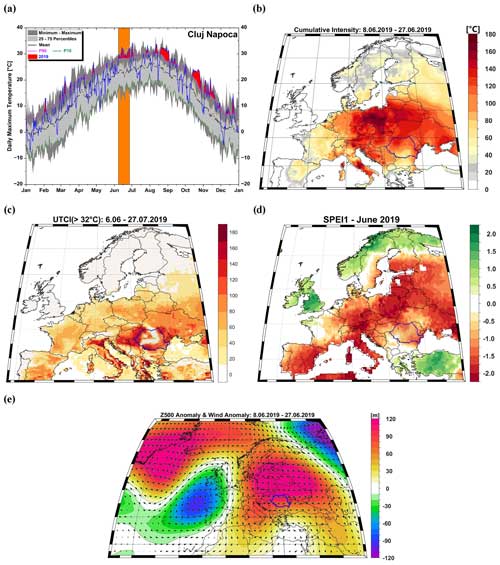
Figure 11(a) Daily maximum temperature at Cluj meteorological station for the year 1952. (b) The cumulative intensity of the HW occurring over the period 8–27 June 2019. (c) The number of hours with the universal thermal climate index>32 °C throughout the duration of the HW. (d) The 1-month Standardized Precipitation Evapotranspiration Index for June 2019. (e) The 500 mbar geopotential height anomaly and the associated winds averaged over the period 8–27 June 2019. In (a) the green line represents the 10th percentile (P10) of the daily maximum temperature. The dotted black line represents the mean of the daily maximum temperature, and the red line represents the 90th percentile (P90) of the daily maximum temperature. The period 1971–2000 was used to compute the daily maximum temperature climatology.
Summer 2012 was characterized by a series of HWs. The first one lasted for 7 d (i.e., 17–23 June), followed by the longest HW for this summer, which lasted for 16 d between 30 June and 15 July (Fig. 10a). Another two HW events occurred in August, lasting for 6 and 7 d, respectively, while the last HW was recorded in September and lasted for 10 d (Fig. 10a). The longest HW started at the end of June and finished in the middle of July, triggering exceptionally high temperatures, with daily maximum temperature anomalies reaching up to 12 °C in central Europe (Figs. S4c and S7 in the Supplement). The extremely hot conditions initially impacted the western part of Europe before also encompassing the eastern part of Europe, including Romania, with a particular emphasis on plains and plateaus. The cumulative intensity of the HW reached values up to 160 °C (Fig. 10b), with Romania being in the center of the HW. Also, the heat stress was extremely high throughout the duration of the HW, with up to 200 h of very strong heat stress and higher at country level, except for the Carpathian Mountains (Fig. 10c). On the day of the HW peak (i.e., 15 July), the southern part of the county reached a daily maximum temperature anomaly >12 °C (Fig. S4c) and was under “very strong heat stress” (Fig. S5c). The extreme heat was accompanied by extreme drought () over the southern part of the county and severe drought () over the northern part (Fig. 10d). In general, the spatial extent of the HW (e.g., the eastern part of Europe) is mirrored by dry conditions over the same regions (Fig. 10d). The dominant atmospheric circulation pattern during this period featured a northeasterly flow (Fig. 10e), which facilitated the advection (horizontal transport) of warm air masses originating from Russia towards the eastern and central part of Europe. At a national scale, this large-scale atmospheric pattern established anomalously high temperatures and a surge in the number of hot days (temperatures exceeding 35 °C), particularly in the southern and eastern regions (Nagavciuc et al., 2022b). The persistence of a high-pressure system positioned over Russia extending up to Romania was the primary driver of the excessive temperatures and dryness.
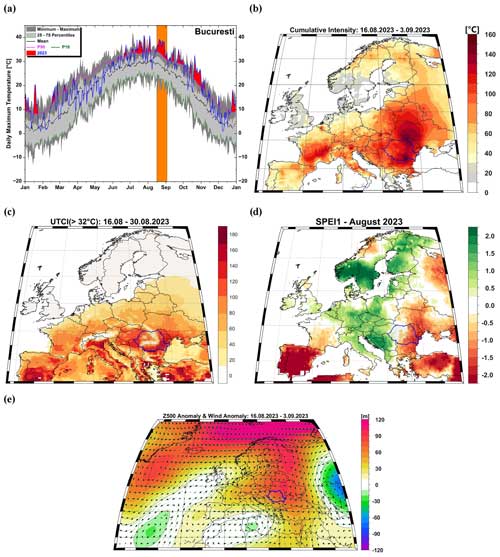
Figure 12(a) Daily maximum temperature at Bucuresti meteorological station for the year 2023. (b) The cumulative intensity of the HW occurring over the period 16 August–3 September 2023. (c) The number of hours with the universal thermal climate index>32 °C throughout the duration of the HW. (d) The 1-month Standardized Precipitation Evapotranspiration Index for August 2023. (e) The 500 mbar geopotential height anomaly and the associated winds averaged over the period 16 August–3 September 2023. In (a) the green line represents the 10th percentile (P10) of the daily maximum temperature. The dotted black line represents the mean of the daily maximum temperature, and the red line represents the 90th percentile (P90) of the daily maximum temperature. The period 1971–2000 was used to compute the daily maximum temperature climatology.
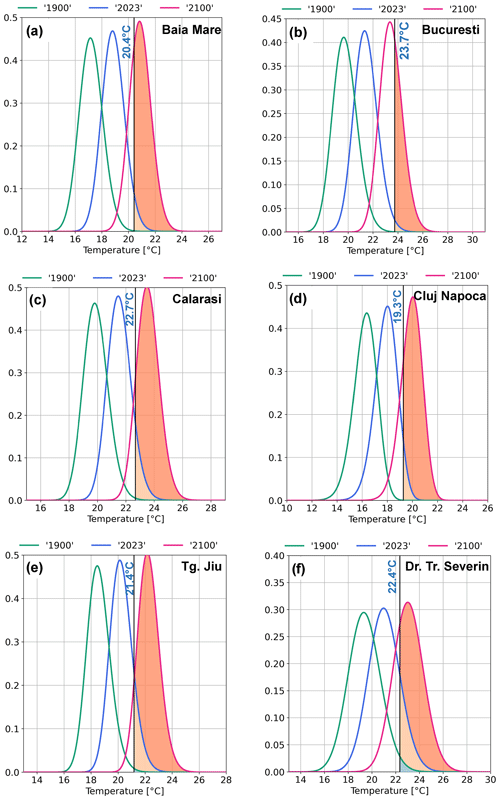
Figure 13Stochastically generated skewed (SGS) distributions of pseudo-observations for summer mean temperatures in 1900 (green line), 2023 (blue line), and 2100 (red line), for the SSP2-45 scenario. A vertical black line marks the observed summer (May–June–July–August–September) temperature in 2023: (a) Baia Mare, (b) Bucuresti, (c) Calarasi, (d) Cluj Napoca, (e) Tg. Jiu, and (e) Dr. Tr. Severin.
June 2019 saw one of the most extensive (in spatial coverage) and prolonged HW ever recorded over Europe at that time (Sánchez-Benítez et al., 2022; Xu et al., 2020; Nagavciuc et al., 2022b). The central and eastern parts of Europe experienced exceptional warmth through the duration of the HW, with daily temperature anomalies exceeding 12 °C for most of June (Fig. S8 in the Supplement). The June 2019 HW event started on 8 June (Fig. 11a) and lasted for 19 d until 27 June. Romania was affected by this event especially over the central and northern parts of the country, with a cumulative intensity of up to 160 °C in the northern part of the country and up to 180 °C over Poland (Fig. 11b). At country level, the meteorological stations with the highest cumulative intensity were Bistrita (139.87 °C), Cluj Napoca (141.18 °C), Constanta (137.28 °C), and Tulcea (147.34 °C) (see Table 3). The peak of the HW was on 14 June, when the daily maximum temperature anomalies exceeded more than 10 °C over large areas in Europe and up to 12 °C over the northwestern part of Romania (Figs. S4d and S8). Over the regions situated at low latitudes (i.e., out of the range of the Carpathian Mountains), the cumulative heat stress factor reached values up to 150 h over the duration of the HW (Fig. 11c), and on the day of the peak of the HW the same regions were affected by “strong heat stress” (Fig. S5d). Compared to previously described HW events (i.e., 1946, 1952, and 2012), the drought conditions in June 2019 prevailed over most of Europe, except for the British Isles, the northwestern part of Fennoscandia, and Türkiye, where wet conditions prevailed (Fig. 11d). The areas covered by severe to moderate drought in June 2019 are similar to the areas affected by the long-lasting HW event (Fig. 11b and d). The large-scale atmospheric circulation anomalies throughout the duration of the HW event were characterized by positive geopotential height anomalies over the central and eastern parts of Europe, flanked by negative Z500 anomalies over the central North Atlantic and northwestern Russia (Fig. 11e). The spatial structure of the Z500 anomalies resembles a classical omega blocking pattern, which promotes the advection of warm and dry Saharan air towards the southern and eastern part of Europe (Fig. 11e).
Summer 2023 was the warmest on record globally by a large margin, with an average temperature of 16.77 °C (i.e., 0.66 °C above global average relative to the climatological period 1971–2000), and a series of HWs were experienced in multiple regions of the Northern Hemisphere, including southern Europe, the southern United States, and Japan (https://climate.copernicus.eu/summer-2023-hottest-record). Over Romania there were three separate HW events that occurred between June until the end of September. The first events started on the 10 July and lasted for 13 d (Fig. 12a). The second event was much longer, lasting for 19 d between 16 August until 3 September (Fig. 12a), while the third HW occurred between 20 September and lasted until 1 October. The longest HW (i.e., 19 d) was characterized by unprecedented intensity and duration at 10 stations, out of the 31 analyzed in this study (Table 3). At Bucuresti Filaret, the August HW reached a cumulative intensity of 165.26 °C, which is the highest CHI since 1885 (Table 4). The peak of the HW was on 28 August, when the daily maximum temperature anomalies exceeded more than 12 °C over large areas in the eastern part of Europe (Figs. S4d and S9 in the Supplement). The cumulative intensity over the eastern part of Europe reached values up to 160 °C over Ukraine and the southern part of Romania (Fig. 12b), and the cumulative heat stress factor reached values up to 200 h over the duration of the HW over these regions, except the areas situated at higher altitudes (Fig. 12c). On the day of the peak of the HW, the southeastern part of Romania and western Ukraine were affected by “very strong heat stress” (Fig. S5e). The areas covered by severe to moderate drought in August 2023 (Fig. 12d) are similar to the areas affected by the long-lasting HW event (Fig. 12b). The large-scale atmospheric circulation anomalies throughout the duration of the HW event are similar to the previous cases, namely a center of positive Z500 anomalies over the central and eastern part of Europe and a center of negative G500 anomalies over western Russia, which leads to the advection of hot and dry air from the south (Fig. 12e).
3.5 Attribution of the 2023 extreme summer temperatures
The extended summer temperature anomalies (i.e., May–September) indicate that year 2023 was on average +3.1 °C warmer at Baia Mare station (i.e., relatively to the climatological period 1971–2000), +4.1 °C warmer at Bucuresti, +2.8 °C warmer at Calarasi station, +2.9 °C warmer at Cluj Napoca station, +2.6 °C warmer at Tg. Jiu station, and +3.8 °C warmer at Dr. Tr. Severin station. To assess the contribution of anthropogenic climate change to the extreme summer temperatures of 2023, we applied the methodology outlined by Rantanen et al. (2024). This approach allows meteorologists and researchers to quantify the climate change signal on mean temperatures at the country or station level, across different timescales: monthly, seasonal, and annual. It integrates observational monthly mean temperature data with simulations from the Coupled Model Intercomparison Project Phase 6 (CMIP6) climate models, and for this study, we focus on two shared socioeconomic pathways (SSPs): SSP2-4.5 and SSP5-8.5. A comprehensive description of the tool and the CMIP6 models employed is provided by Rantanen et al. (2024). We utilized this method due to its straightforward applicability, particularly for station-based observational data and because of the temperature record at some of our analyzed stations (i.e., Baia Mare, Bucuresti, Calarasi, Cluj Napoca, Tg. Jiu and Dr. Tr. Severin) spans a sufficiently long period (i.e., from 125 up to 167 years) to support this type of analysis. In the current study, we focused on the whole extended summer (i.e., the summer mean temperature averaged over the months May–June–July–August–September). This tool utilizes two widely used metrics in attribution studies: the probability ratio (PR) and the change in intensity (ΔI). The PR measures the increase in the likelihood of an event due to climate change, while ΔI represents the extent to which climate change has altered the event's intensity. To calculate ΔI, the observed temperature's percentile within the current climate distribution is first identified, and then the corresponding temperature for the same percentile is located within the climate distribution of the year 1900.
The attribution analysis suggests that the likelihood of experiencing an extended summer (i.e., May–September) as warm as the one in 2023 under the climate conditions of 1900 varies from 0.0 % at Baia Mare and Cluj Napoca (i.e., such a warm summer would have been impossible in the climate around the year 1900) to 0.3 % at Tg. Jiu station (Tables 5 and 6). In today's climate, the probability of the observed extended summer 2023 mean temperature is higher than in the past, with a likelihood from 0.1 % at Bucuresti Filaret to 16.3 % at Dr. Tr. Severin station (Tables 5 and 6). An extended summer that is at least as warm as that of 2023 will occur on average once every 6 to 82 years, depending on the station analyzed. For example, at Bucuresti and Baia Mare stations, the temperatures recorded in 2023 would have been impossible without the effect of climate change, while at Tg. Jiu and Dr. Tr. Severin stations the probability of such a warm extended summer has increased by a factor of 45.3 and 9.6, respectively.
Table 5Estimated annual probabilities, return periods, and intensities of the 2023 corresponding summer mean temperature (see the value in parentheses for each station) for the SSP2-45 scenario.
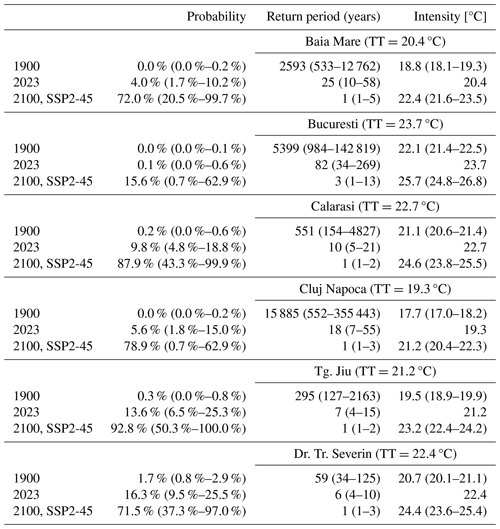
Table 6Estimated annual probabilities, return periods, and intensities of the 2023 corresponding summer mean temperature (see the value in the parentheses for each station) for the SSP5-85 scenario.
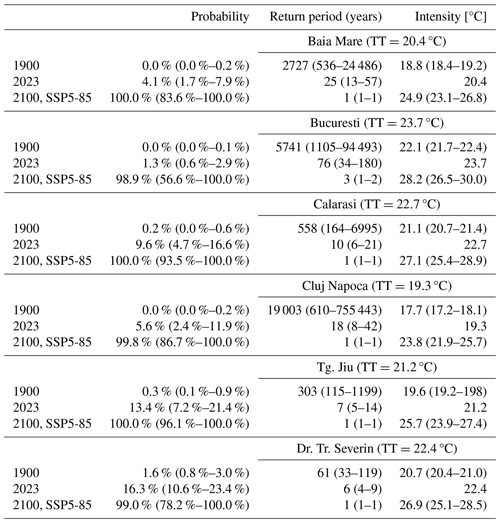
Based on CMIP6 projections under the SSP2-45 scenario, by 2100, an extended summer as warm as that of 2023 is expected to occur roughly once every year at all analyzed stations (Table 5), with the exception of Bucuresti station, where such a warm summer is expected to occur once every 3 years. The same holds true in the case of the SSP5-85 scenario (Table 6), including Bucuresti station. Under the SSP5-85 scenario, a summer as warm as the one in 2023 is expected to occur every year, at all analyzed stations. Thus, this implies that by the end of the 21st century, summers as warm as the one in 2023 will be the new normal (Figs. 13 and 14). This highlights the significant shift in temperature extremes anticipated by the century's end, as depicted in Figs. 13 and 14. Additionally, our analysis of intensity changes (ΔI) indicates that the extended summer of 2023 was approximately 1.6 °C warmer than it would have been without anthropogenic climate change at Baia Mare, Bucuresti, Calarasi, and Cluj and ∼1.7 °C warmer at Tg. Jiu and Dr. Tr. Severin.
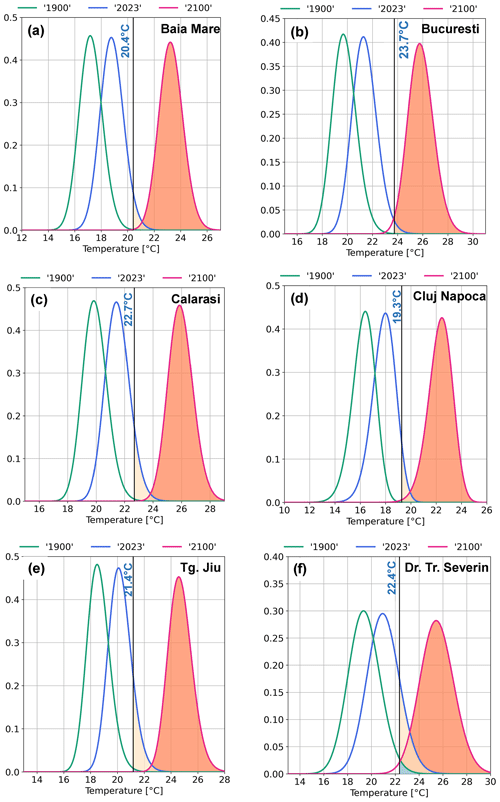
Figure 14Stochastically generated skewed (SGS) distributions of pseudo-observations for summer mean temperatures in 1900 (green line), 2023 (blue line), and 2100 (red line) for the SSP5-85 scenario. A vertical black line marks the observed summer (May–June–July–August–September) temperature in 2023: (a) Baia Mare, (b) Bucuresti, (c) Calarasi, (d) Cluj Napoca, (e) Tg. Jiu, and (e) Dr. Tr. Severin.
Eastern Europe has experienced a succession of extreme HWs in recent years, notably in June/July 2012, June 2019, and August 2023 (Nagavciuc et al., 2022b; Russo et al., 2019, 2015; Lhotka and Kyselý, 2022; Ionita et al., 2021). These HWs have surpassed historical records in intensity and duration, causing severe impacts on human health, ecosystems, and infrastructure, and have been driven mainly by persistent large-scale patterns (e.g., increased frequency of atmospheric blocking) (Bakke et al., 2023; Kautz et al., 2021; Rousi et al., 2023; Lau and Nath, 2012; Yang et al., 2019; Chan et al., 2022). In line with these studies here, we show that in all analyzed HW events (i.e., August 1946, August 1952, June/July 2012, June 2019, and August 2023), the area affected by the HW was under the influence of a persistent high-pressure system, which led to the advection of hot and dry air either from Eurasia or from the Sahara. This spatial structure in the Z500 intensifies incoming solar radiation, leading to extremely high temperature anomalies under the high-pressure center. These findings are in agreement with previous studies which have shown that hot and dry summers are usually accompanied by an increase in the frequency and persistence of atmospheric blocking (Bakke et al., 2023; Ionita et al., 2021; Kautz et al., 2021; Schubert et al., 2014; Ma and Franzke, 2021). Scientific analysis points to a combination of large-scale atmospheric patterns and the amplifying effects of climate change as the primary drivers of these events (Gao et al., 2019; Luo et al., 2023; Ma et al., 2024).
From a large-scale atmospheric–oceanic point of view, the AMO can favor, in its positive phase, an increase in the frequency of HWs over the eastern part of Europe (Gao et al., 2019). However, the remarkable increase in the HW frequency over the past 30 years extends beyond what can be attributed solely to AMO's influence. The rate of increase in the metrics of the HWs, varying between ∼200 % and 400 %, for all analyzed stations, especially since 1961 onwards, points to greenhouse-gas-induced warming as a significant contributor. This aligns with the findings of a recent study (Luo et al., 2023) indicating that ∼43 % of the recent increase in the HW frequency over the central and eastern part of Europe was driven by the positive phase of the AMO, while ∼57 % is related to greenhouse-gas-induced warming. The observed trend strongly suggests the influence of a combined effect from anthropogenic climate change and natural modes of internal variability.
We provide compelling evidence of the escalating intensity and frequency of HW patterns in Romania over the last century, with clear indications of climate change. The clustering of HWs also aligns with AMO phases, with more frequent and intense HWs occurring during its positive phase, underscoring the significant role of internal variability in modulating Eastern European HWs. We also show whether any past occurrences rival the intensity of modern events. Analysis of observational data from 1885 to 2023 revealed an increase in both the number of days exceeding the 90th percentile temperature threshold and the overall frequency of HW events. We found an increase of at least 200 % (depending on the station) in the HW metrics for the recent events (i.e., 1980–2023) compared to previous periods characterized by a high frequency of HWs (i.e., 1920–1965). This aligns with the observed warming trend in monthly average temperatures observed both globally and at European level (IPCC, 2021b). Despite the observed upward trend in the summer days and HW metrics over Romania, in this study we also found that certain historical HWs were comparable to recent events in terms of mean and maximum temperatures (i.e., August 1946 and August 1952 events). These past events offer valuable case studies and point in the direction that such intense HWs are not exclusive to the modern era, highlighting also the significant influence of natural variability, such as AMO. Over Romania, the most extreme HW on record occurred in August 2023, with a maximum daily temperature >35 °C for 13 consecutive days at Bucuresti Filaret meteorological station (i.e., 17–29 August 2023). The second most intense August HW, in terms of duration and intensity, occurred in 1946. Reanalysis data reveal that historical HWs often coincide with widespread heat and dry conditions across Europe under the influence of extensive high-pressure anomalies. Moreover, by employing a tool for attribution-based analysis, we have shown that the extended summer temperature recorded in 2023 would have been impossible without the contribution of anthropogenic warming, and such warm summers will become the new normal by the end of the 21st century.
The urgency for both reducing greenhouse gas emissions and implementing robust adaptation measures across Romania is irrefutable. Continued research and collaboration between scientists, policymakers, and stakeholders are essential to address this growing threat and build a more resilient future for the region. We also emphasize the need for further studies (e.g., by employing long-term meteorological time series) in other European regions to gain a broader understanding of escalating HW risks and strengthen pan-European preparedness efforts. Recognizing the gravity of this issue, various stakeholders must collaborate to develop effective mitigation and adaptation strategies. Implementing climate change mitigation measures to reduce greenhouse gas emissions is crucial for long-term solutions. This paper provides a comprehensive understanding of HWs in eastern Europe by examining their variability, trends, and causes from a long-term perspective.
The data that support the findings of this study are available from the corresponding author upon reasonable request.
The supplement related to this article is available online at: https://doi.org/10.5194/nhess-24-4683-2024-supplement.
MI conceived the ideas and designed the methodology together with VN. VN digitalized the unpublished data used in this article. MI analyzed the data and drafted and led the writing of the manuscript with significant input from PV, BA, CR, QM, and VN. All authors contributed critically to the writing of the manuscript.
The contact author has declared that none of the authors has any competing interests.
Publisher's note: Copernicus Publications remains neutral with regard to jurisdictional claims made in the text, published maps, institutional affiliations, or any other geographical representation in this paper. While Copernicus Publications makes every effort to include appropriate place names, the final responsibility lies with the authors.
Monica Ionita, Viorica Nagavciuc, Bogdan Antonescu, Petru Vaideanu, and Catalin Roibu were partially supported by a grant of the Ministry of Research, Innovation and Digitization, under “Romania's National Recovery and Resilience Plan – Founded by EU-NextGenerationEU” program, project “Compound extreme events from a long-term perspective and their impact on forest growth dynamics (CExForD)” grant no. 760074/23.05.2023, code 287/30.11.2022, within Pillar III, Component C9, Investment 8. Monica Ionita was also supported by the Helmholtz Association through the joint program “Changing Earth – Sustaining our Future” (PoF IV) of the AWI. Petru Vaideanu was also funded by project PN-III-P1-1.1-PD-2021-0505, Ctr. PD28/2022, CLIMATICFOOTPRINTS of the Romanian UEFISCDI. Bogdan Antonescu was also funded by the PNRR Project – DTEClimate no. 760008/30.12.2022. Qiyun Ma was supported by funding from the Federal Ministry of Education and Research (BMBF) and the Helmholtz Research Field Earth and Environment for the Innovation Pool Project SCENIC and the Helmholtz Climate Initiative REKLIM.
This paper was edited by Dan Li and reviewed by Zhao Yang and one anonymous referee.
Alexander, L. V: Global observed long-term changes in temperature and precipitation extremes: A review of progress and limitations in IPCC assessments and beyond, Weather and Climate Extremes, 11, 4–16, https://doi.org/10.1016/j.wace.2015.10.007, 2016.
Bakke, S. J., Ionita, M., and Tallaksen, L. M.: Recent European drying and its link to prevailing large-scale atmospheric patterns, Sci. Rep.-UK, 13, 21921, https://doi.org/10.1038/s41598-023-48861-4, 2023.
Ballester, J., Quijal-Zamorano, M., Méndez Turrubiates, R. F., Pegenaute, F., Herrmann, F. R., Robine, J. M., Basagaña, X., Tonne, C., Antó, J. M., and Achebak, H.: Heat-related mortality in Europe during the summer of 2022, Nat. Med., 29, 1857–1866, https://doi.org/10.1038/s41591-023-02419-z, 2023.
Barriopedro, D., García-Herrera, R., Ordóñez, C., Miralles, D. G., and Salcedo-Sanz, S.: Heat Waves: Physical Understanding and Scientific Challenges, Rev. Geophys., 61, e2022RG000780, https://doi.org/10.1029/2022RG000780, 2023.
Beckett, A. D. and Sanderson, M. G.: Analysis of historical heatwaves in the United Kingdom using gridded temperature data, Int. J. Climatol., 42, 453–464, https://doi.org/10.1002/joc.7253, 2022.
Benz, S. A. and Burney, J. A.: Widespread Race and Class Disparities in Surface Urban Heat Extremes Across the United States, Earths Future, 9, e2021EF002016, https://doi.org/10.1029/2021EF002016, 2021.
Brando, P. M., Paolucci, L., Ummenhofer, C. C., Ordway, E. M., Hartmann, H., Cattau, M. E., Rattis, L., Medjibe, V., Coe, M. T., and Balch, J.: Droughts, Wildfires, and Forest Carbon Cycling: A Pantropical Synthesis, Annu. Rev. Earth Pl. Sc., 47, 555–581, https://doi.org/10.1146/annurev-earth-082517-010235, 2019.
Chakraborty, T., Hsu, A., Manya, D., and Sheriff, G.: Disproportionately higher exposure to urban heat in lower-income neighborhoods: a multi-city perspective, Environ. Res. Lett., 14, 105003, https://doi.org/10.1088/1748-9326/ab3b99, 2019.
Chan, P. W., Catto, J. L., and Collins, M.: Heatwave–blocking relation change likely dominates over decrease in blocking frequency under global warming, npj Climate and Atmospheric Science, 5, 68, https://doi.org/10.1038/s41612-022-00290-2, 2022.
Cornes, R. C., Schrier, G. Van Der, Besselaar, E. J. M. Van Den, and Jones, P. D.: An Ensemble Version of the E-OBS Temperature and Precipitation Datasets, J. Geophys. Res.-Atmos., 123, 9391–9409, https://doi.org/10.1029/2017JD028200, 2018.
Cowan, T., Purich, A., Perkins, S., Pezza, A., Boschat, G., and Sadler, K.: More Frequent, Longer, and Hotter Heat Waves for Australia in the Twenty-First Century, J. Climate, 27, 5851–5871, https://doi.org/10.1175/JCLI-D-14-00092.1, 2014.
Croitoru, A.-E. E., Piticar, A., Ciupertea, A.-F. F., and Roşca, C. F.: Changes in heat waves indices in Romania over the period 1961–2015, Global Planet. Change, 146, 109–121, https://doi.org/10.1016/j.gloplacha.2016.08.016, 2016.
Croitoru, A. E. and Piticar, A.: Changes in daily extreme temperatures in the extra-Carpathians regions of Romania, Int. J. Climatol., 33, 1987–2001, https://doi.org/10.1002/joc.3567, 2013.
Dima, M. and Lohmann, G.: A Hemispheric Mechanism for the Atlantic Multidecadal Oscillation, J. Climate, 20, 2706–2719, https://doi.org/10.1175/JCLI4174.1, 2007.
Doshi, S. C., Lohmann, G., and Ionita, M.: Hotspot movement of compound events on the Europe continent, Sci. Rep.-UK, 13, 18100, https://doi.org/10.1038/s41598-023-45067-6, 2023.
Drinkwater, K. F., Miles, M., Medhaug, I., Otterå, O. H., Kristiansen, T., Sundby, S., and Gao, Y.: The Atlantic Multidecadal Oscillation: Its manifestations and impacts with special emphasis on the Atlantic region north of 60° N, J. Marine Syst., 133, 117–130, https://doi.org/10.1016/j.jmarsys.2013.11.001, 2014.
Enfield, D. B., Mestas-Nuñez, A. M., and Trimble, P. J.: The Atlantic Multidecadal Oscillation and its relation to rainfall and river flows in the continental U. S., Geophys. Res. Lett., 28, 2077–2080, https://doi.org/10.1029/2000GL012745, 2001.
European Environment Agency: Economic losses from climate-related extremes in Europe, https://www.eea.europa.eu/data-and-maps/indicators/direct-losses-from-weather-disasters-3 (last access: 17 January 2024), 2022.
Fischer, E. M. and Schär, C.: Consistent geographical patterns of changes in high-impact European heatwaves, Nat. Geosci., 3, 398–403, https://doi.org/10.1038/ngeo866, 2010.
Ganson, N.: The Soviet Famine of 1946–47 in Global and Historical Perspective, 1–218 pp., Palgrave Macmillan New York, ISBN 978-0-230-61333-1, https://doi.org/10.1057/9780230620964, 2009.
Gao, M., Yang, J., Gong, D., Shi, P., Han, Z., and Kim, S.-J.: Footprints of Atlantic Multidecadal Oscillation in the Low-Frequency Variation of Extreme High Temperature in the Northern Hemisphere, J. Climate, 32, 791–802, https://doi.org/10.1175/JCLI-D-18-0446.1, 2019.
García-Herrera, R., Díaz, J., Trigo, R. M., Luterbacher, J., and Fischer, E. M.: A Review of the European Summer Heat Wave of 2003, Crit. Rev. Env. Sci. Tec., 40, 267–306, https://doi.org/10.1080/10643380802238137, 2010.
Guijarro, J. A., López, J. A., Aguilar, E., Domonkos, P., Venema, V. K. C., Sigró, J., and Brunet, M.: Homogenization of monthly series of temperature and precipitation: Benchmarking results of the MULTITEST project, Int. J. Climatol., 43, 3994–4012, https://doi.org/10.1002/joc.8069, 2023.
Han, Q., Sun, S., Liu, Z., Xu, W., and Shi, P.: Accelerated exacerbation of global extreme heatwaves under warming scenarios, Int. J. Climatol., 42, 5430–5441, https://doi.org/10.1002/joc.7541, 2022.
Hawkins, E., Alexander, L. V, and Allan, R. J.: Millions of digitized historical sea-level pressure observations rediscovered, Geosci. Data J., 10, 385–395, https://doi.org/10.1002/gdj3.163, 2023.
Hegerl, G. C., Brönnimann, S., Cowan, T., Friedman, A. R., Hawkins, E., Iles, C., Müller, W., Schurer, A., and Undorf, S.: Causes of climate change over the historical record, Environ. Res. Lett., 14, 123006, https://doi.org/10.1088/1748-9326/ab4557, 2019.
Hepites, S.: Analele Institutului Meteorologic al României pe anul 1897, Institutul Meteorologic al Romaniei, Bucuresti, 1899.
Hersbach, H., Bell, B., Berrisford, P., Hirahara, S., Horányi, A., Muñoz-Sabater, J., Nicolas, J., Peubey, C., Radu, R., Schepers, D., Simmons, A., Soci, C., Abdalla, S., Abellan, X., Balsamo, G., Bechtold, P., Biavati, G., Bidlot, J., Bonavita, M., De Chiara, G., Dahlgren, P., Dee, D., Diamantakis, M., Dragani, R., Flemming, J., Forbes, R., Fuentes, M., Geer, A., Haimberger, L., Healy, S., Hogan, R. J., Hólm, E., Janisková, M., Keeley, S., Laloyaux, P., Lopez, P., Lupu, C., Radnoti, G., de Rosnay, P., Rozum, I., Vamborg, F., Villaume, S., and Thépaut, J.-N.: The ERA5 global reanalysis, Q. J. Roy. Meteor. Soc., 146, 1999–2049, https://doi.org/10.1002/qj.3803, 2020.
Ionita, M. and Nagavciuc, V.: Forecasting low flow conditions months in advance through teleconnection patterns, with a special focus on summer 2018, Sci. Rep.-UK, 10, 13258, https://doi.org/10.1038/s41598-020-70060-8, 2020.
Ionita, M. and V. Nagavciuc: Shedding Light on the Devastating Floods in June 1897 in Romania: Early Instrumental Observations and Synoptic Analysis, J. Hydrometeor., 25, 1729–1745, https://doi.org/10.1175/JHM-D-23-0230.1, 2024.
Ionita, M., Rimbu, N., Chelcea, S., and Patrut, S.: Multidecadal variability of summer temperature over Romania and its relation with Atlantic Multidecadal Oscillation, Theor. Appl. Climatol., 113, 305–315, https://doi.org/10.1007/s00704-012-0786-8, 2013.
Ionita, M., Caldarescu, D. E., and Nagavciuc, V.: Compound Hot and Dry Events in Europe: Variability and Large-Scale Drivers, Frontiers in Climate, 3, 58, https://doi.org/10.3389/fclim.2021.688991, 2021.
Ionita, M., Nagavciuc, V., Scholz, P., and Dima, M.: Long-term drought intensification over Europe driven by the weakening trend of the Atlantic Meridional Overturning Circulation, Journal of Hydrology: Regional Studies, 42, 101176, https://doi.org/10.1016/j.ejrh.2022.101176, 2022.
IPCC: Climate Change 2021: The Physical Science Basis. Contribution of Working Group I to the Sixth Assessment Report of the Intergovernmental Panel on Climate Change, edited by: Masson-Delmotte, V., Zhai, P., Pirani, A., Connors, S. L., Péan, C., Berger, S., Caud, N., Chen, Y., Goldfarb, L., Gomis, M. I., Huang, M., Leitzell, K., Lonnoy, E., Matthews, J. B. R., Maycock, T. K., Waterfield, T., Yelekçi, O., Yu, R., and Zhou, B., Cambridge University Press, Cambridge, United Kingdom and New York, NY, USA, 2391 pp., https://doi.org/10.1017/9781009157896, 2021a.
IPCC: Summary for policymakers, in: Climate Change 2021: The Physical Science Basis. Contribution of Working Group I to the Sixth Assessment Report of the Intergovernmental Panel on Climate Change, edited by: Masson-Delmotte, V., Zhai, P., Pirani, A., Connors, S. L., Péan, C., Berger, S., Caud, N., Chen, Y., Goldfarb, L., Gomis, M. I., Huang, M., Leitzell, K., Lonnoy, E., Matthews, J. B. R., Maycock, T. K., Waterfield, T., Yelekçi, O., Yu, R., and Zhou, B., Cambridge University Press, Cambridge, United Kingdom and New York, NY, USA, 3–22, https://doi.org/10.1017/9781009157896.001, 2021b.
Kautz, L.-A., Martius, O., Pfahl, S., Pinto, J. G., Ramos, A. M., Sousa, P. M., and Woollings, T.: Atmospheric blocking and weather extremes over the Euro-Atlantic sector – a review, Weather Clim. Dynam., 3, 305–336, https://doi.org/10.5194/wcd-3-305-2022, 2022.
Kerr, R. A.: A North Atlantic Climate Pacemaker for the Centuries, Science, 288, 1984–1985, https://doi.org/10.1126/science.288.5473.1984, 2000.
Klein Tank, A. M. G., Wijngaard, J. B., Können, G. P., Böhm, R., Demarée, G., Gocheva, A., Mileta, M., Pashiardis, S., Hejkrlik, L., Kern-Hansen, C., Heino, R., Bessemoulin, P., Müller-Westermeier, G., Tzanakou, M., Szalai, S., Pálsdóttir, T., Fitzgerald, D., Rubin, S., Capaldo, M., Maugeri, M., Leitass, A., Bukantis, A., Aberfeld, R., van Engelen, A. F. V, Forland, E., Mietus, M., Coelho, F., Mares, C., Razuvaev, V., Nieplova, E., Cegnar, T., Antonio López, J., Dahlström, B., Moberg, A., Kirchhofer, W., Ceylan, A., Pachaliuk, O., Alexander, L. V, and Petrovic, P.: Daily dataset of 20th-century surface air temperature and precipitation series for the European Climate Assessment, Int. J. Climatol., 22, 1441–1453, https://doi.org/10.1002/joc.773, 2002.
Knight, J. R., Allan, R. J., Folland, C. K., Vellinga, M., and Mann, M. E.: A signature of persistent natural thermohaline circulation cycles in observed climate, Geophys. Res. Lett., 32, 1–4, https://doi.org/10.1029/2005GL024233, 2005.
Knight, J. R., Folland, C. K., and Scaife, A. A.: Climate impacts of the Atlantic Multidecadal Oscillation, Geophys. Res. Lett., 33, L17706, https://doi.org/10.1029/2006GL026242, 2006.
Laaha, G., Gauster, T., Tallaksen, L. M., Vidal, J.-P., Stahl, K., Prudhomme, C., Heudorfer, B., Vlnas, R., Ionita, M., Van Lanen, H. A. J., Adler, M.-J., Caillouet, L., Delus, C., Fendekova, M., Gailliez, S., Hannaford, J., Kingston, D., Van Loon, A. F., Mediero, L., Osuch, M., Romanowicz, R., Sauquet, E., Stagge, J. H., and Wong, W. K.: The European 2015 drought from a hydrological perspective, Hydrol. Earth Syst. Sci., 21, 3001–3024, https://doi.org/10.5194/hess-21-3001-2017, 2017.
Lau, N.-C. and Nath, M. J.: A Model Study of Heat Waves over North America: Meteorological Aspects and Projections for the Twenty-First Century, J. Climate, 25, 4761–4784, https://doi.org/10.1175/JCLI-D-11-00575.1, 2012.
Lhotka, O. and Kyselý, J.: The 2021 European Heat Wave in the Context of Past Major Heat Waves, Earth and Space Science, 9, e2022EA002567, https://doi.org/10.1029/2022EA002567, 2022.
Lorrey, A. M., Pearce, P. R., Allan, R., Wilkinson, C., Woolley, J.-M., Judd, E., Mackay, S., Rawhat, S., Slivinski, L., Wilkinson, S., Hawkins, E., Quesnel, P., and Compo, G. P.: Meteorological data rescue: Citizen science lessons learned from Southern Weather Discovery, Patterns (New York, N. Y.), 3, 100495, https://doi.org/10.1016/j.patter.2022.100495, 2022.
Luo, B., Luo, D., Zhuo, W., Xiao, C., Dai, A., Simmonds, I., Yao, Y., Diao, Y., and Gong, T.: Increased Summer European Heatwaves in Recent Decades: Contributions From Greenhouse Gases-Induced Warming and Atlantic Multidecadal Oscillation-Like Variations, Earths Future, 11, e2023EF003701, https://doi.org/10.1029/2023EF003701, 2023.
Ma, Q. and Franzke, C. L. E.: The role of transient eddies and diabatic heating in the maintenance of European heat waves: a nonlinear quasi-stationary wave perspective, Clim. Dynam., 56, 2983–3002, https://doi.org/10.1007/s00382-021-05628-9, 2021.
Ma, Q., Chen, Y., and Ionita, M.: European Summer Wet-Bulb Temperature: Spatiotemporal Variations and Potential Drivers, J. Climate, 37, 2059–2080, https://doi.org/10.1175/JCLI-D-23-0420.1, 2024.
Malik, A., Li, M., Lenzen, M., Fry, J., Liyanapathirana, N., Beyer, K., Boylan, S., Lee, A., Raubenheimer, D., Geschke, A., and Prokopenko, M.: Impacts of climate change and extreme weather on food supply chains cascade across sectors and regions in Australia, Nature Food, 3, 631–643, https://doi.org/10.1038/s43016-022-00570-3, 2022.
Manning, C., Widmann, M., Bevacqua, E., Van Loon, A. F., Maraun, D., and Vrac, M.: Increased probability of compound long-duration dry and hot events in Europe during summer (1950–2013), Environ. Res. Lett., 14, 094006, https://doi.org/10.1088/1748-9326/ab23bf, 2019.
Mestas-Nuñez, A. M. and Enfield, D. B.: Rotated Global Modes of Non-ENSO Sea Surface Temperature Variability, J. Climate, 12, 2734–2746, https://doi.org/10.1175/1520-0442(1999)012<2734:RGMONE>2.0.CO;2, 1999.
Nagavciuc, V., Ionita, M., Kern, Z., McCarroll, D., and Popa, I.: A ∼700 years perspective on the 21st century drying in the eastern part of Europe based on δ 18O in tree ring cellulose, Communications Earth and Environment, 3, 277, https://doi.org/10.1038/s43247-022-00605-4, 2022a.
Nagavciuc, V., Scholz, P., and Ionita, M.: Hotspots for warm and dry summers in Romania, Nat. Hazards Earth Syst. Sci., 22, 1347–1369, https://doi.org/10.5194/nhess-22-1347-2022, 2022b.
Di Napoli, C., Barnard, C., Prudhomme, C., Cloke, H. L., and Pappenberger, F.: ERA5-HEAT: A global gridded historical dataset of human thermal comfort indices from climate reanalysis, Geosci. Data J., 8, 2–10, https://doi.org/10.1002/gdj3.102, 2021.
Van Oldenborgh, G. J., Wehner, M. F., Vautard, R., Otto, F. E. L., Seneviratne, S. I., Stott, P. A., Hegerl, G. C., Philip, S. Y., and Kew, S. F.: Attributing and Projecting Heatwaves Is Hard: We Can Do Better, Earths Future, 10, e2021EF002271, https://doi.org/10.1029/2021EF002271, 2022.
Perkins, S. E.: A review on the scientific understanding of heatwaves – Their measurement, driving mechanisms, and changes at the global scale, Atmos. Res., 164–165, 242–267, https://doi.org/10.1016/j.atmosres.2015.05.014, 2015.
Perkins, S. E. and Alexander, L. V: On the Measurement of Heat Waves, J. Climate, 26, 4500–4517, https://doi.org/10.1175/JCLI-D-12-00383.1, 2013.
Rantanen, M., Räisänen, J., and Merikanto, J.: A method for estimating the effect of climate change on monthly mean temperatures: September 2023 and other recent record-warm months in Helsinki, Finland, Atmos. Sci. Lett., 25, e1216, https://doi.org/10.1002/asl.1216, 2024.
Robine, J. M., Cheung, S. L. K., Le Roy, S., Van Oyen, H., Griffiths, C., Michel, J. P., and Herrmann, F. R.: Death toll exceeded 70,000 in Europe during the summer of 2003, C. R. Biol., 331, 171–178, https://doi.org/10.1016/j.crvi.2007.12.001, 2008.
Robinson, P. J.: On the Definition of a Heat Wave, J. Appl. Meteorol., 40, 762–775, https://doi.org/10.1175/1520-0450(2001)040<0762:OTDOAH>2.0.CO;2, 2001.
Rousi, E., Fink, A. H., Andersen, L. S., Becker, F. N., Beobide-Arsuaga, G., Breil, M., Cozzi, G., Heinke, J., Jach, L., Niermann, D., Petrovic, D., Richling, A., Riebold, J., Steidl, S., Suarez-Gutierrez, L., Tradowsky, J. S., Coumou, D., Düsterhus, A., Ellsäßer, F., Fragkoulidis, G., Gliksman, D., Handorf, D., Haustein, K., Kornhuber, K., Kunstmann, H., Pinto, J. G., Warrach-Sagi, K., and Xoplaki, E.: The extremely hot and dry 2018 summer in central and northern Europe from a multi-faceted weather and climate perspective, Nat. Hazards Earth Syst. Sci., 23, 1699–1718, https://doi.org/10.5194/nhess-23-1699-2023, 2023.
Russo, A., Gouveia, C. M., Dutra, E., Soares, P. M. M., and Trigo, R. M.: The synergy between drought and extremely hot summers in the Mediterranean, Environ. Res. Lett., 14, 014011, https://doi.org/10.1088/1748-9326/aaf09e, 2019.
Russo, S., Sillmann, J., and Fischer, E. M.: Top ten European heatwaves since 1950 and their occurrence in the coming decades, Environ. Res. Lett., 10, 124003, https://doi.org/10.1088/1748-9326/10/12/124003, 2015.
Sánchez-Benítez, A., Goessling, H., Pithan, F., Semmler, T., and Jung, T.: The July 2019 European Heat Wave in a Warmer Climate: Storyline Scenarios with a Coupled Model Using Spectral Nudging, J. Climate, 35, 2373–2390, https://doi.org/10.1175/JCLI-D-21-0573.1, 2022.
Schubert, S. D., Wang, H., Koster, R. D., Suarez, M. J., and Groisman, P. Y.: Northern Eurasian heat waves and droughts, J. Climate, 27, 3169–3207, https://doi.org/10.1175/JCLI-D-13-00360.1, 2014.
Slivinski, L. C., Compo, G. P., Whitaker, J. S., Sardeshmukh, P. D., Giese, B. S., McColl, C., Allan, R., Yin, X., Vose, R., Titchner, H., Kennedy, J., Spencer, L. J., Ashcroft, L., Brönnimann, S., Brunet, M., Camuffo, D., Cornes, R., Cram, T. A., Crouthamel, R., Domínguez-Castro, F., Freeman, J. E., Gergis, J., Hawkins, E., Jones, P. D., Jourdain, S., Kaplan, A., Kubota, H., Blancq, F. Le, Lee, T.-C., Lorrey, A., Luterbacher, J., Maugeri, M., Mock, C. J., Moore, G. W. K., Przybylak, R., Pudmenzky, C., Reason, C., Slonosky, V. C., Smith, C. A., Tinz, B., Trewin, B., Valente, M. A., Wang, X. L., Wilkinson, C., Wood, K., and Wyszyński, P.: Towards a more reliable historical reanalysis: Improvements for version 3 of the Twentieth Century Reanalysis system, Q. J. Roy. Meteor. Soc., 145, 2876–2908, https://doi.org/10.1002/qj.3598, 2019.
von Storch, H. and Zwiers, F. W.: Statistical Analysis in Climate Research, Cambridge University Press, Cambridge, https://doi.org/10.1017/cbo9780511612336, 1999.
Topor, N.: Anii ploioşi şi secetoşi din Republica Populară Romînă, C. S. A. Institutul Meteorologic, Bucureşti, 1963.
Vaideanu, P., Dima, M., and Voiculescu, M.: Atlantic Multidecadal Oscillation footprint on global high cloud cover, Theor. Appl. Climatol., 134, 1245–1256, https://doi.org/10.1007/s00704-017-2330-3, 2018.
Vaideanu, P., Dima, M., Pirloaga, R., and Ionita, M.: Disentangling and quantifying contributions of distinct forcing factors to the observed global sea level pressure field, Clim. Dynam., 54, 1453–1467, https://doi.org/10.1007/s00382-019-05067-7, 2020.
Vaideanu, P., Stepanek, C., Dima, M., Schrepfer, J., Matos, F., Ionita, M., and Lohmann, G.: Large-scale sea ice–Surface temperature variability linked to Atlantic meridional overturning circulation, PLoS One, 18, 1–20, https://doi.org/10.1371/journal.pone.0290437, 2023.
Vautard, R., Cattiaux, J., Happé, T., Singh, J., Bonnet, R., Cassou, C., Coumou, D., D'Andrea, F., Faranda, D., Fischer, E., Ribes, A., Sippel, S., and Yiou, P.: Heat extremes in Western Europe increasing faster than simulated due to atmospheric circulation trends, Nat. Commun., 14, 6803, https://doi.org/10.1038/s41467-023-42143-3, 2023.
Vicedo-Cabrera, A. M., Scovronick, N., Sera, F., Royé, D., Schneider, R., Tobias, A., Astrom, C., Guo, Y., Honda, Y., Hondula, D. M., Abrutzky, R., Tong, S., Coelho, M. de S. Z. S., Saldiva, P. H. N., Lavigne, E., Correa, P. M., Ortega, N. V., Kan, H., Osorio, S., Kyselý, J., Urban, A., Orru, H., Indermitte, E., Jaakkola, J. J. K., Ryti, N., Pascal, M., Schneider, A., Katsouyanni, K., Samoli, E., Mayvaneh, F., Entezari, A., Goodman, P., Zeka, A., Michelozzi, P., de'Donato, F., Hashizume, M., Alahmad, B., Diaz, M. H., Valencia, C. D. L. C., Overcenco, A., Houthuijs, D., Ameling, C., Rao, S., Di Ruscio, F., Carrasco-Escobar, G., Seposo, X., Silva, S., Madureira, J., Holobaca, I. H., Fratianni, S., Acquaotta, F., Kim, H., Lee, W., Iniguez, C., Forsberg, B., Ragettli, M. S., Guo, Y. L. L., Chen, B. Y., Li, S., Armstrong, B., Aleman, A., Zanobetti, A., Schwartz, J., Dang, T. N., Dung, D. V, Gillett, N., Haines, A., Mengel, M., Huber, V., and Gasparrini, A.: The burden of heat-related mortality attributable to recent human-induced climate change, Nat. Clim. Change, 11, 492–500, https://doi.org/10.1038/s41558-021-01058-x, 2021.
Vicente-Serrano, S. M., Beguería, S., López-Moreno, J. I., Angulo, M., and El Kenawy, A.: A New Global 0.5° Gridded Dataset (1901–2006) of a Multiscalar Drought Index: Comparison with Current Drought Index Datasets Based on the Palmer Drought Severity Index, J. Hydrometeorol., 11, 1033–1043, https://doi.org/10.1175/2010JHM1224.1, 2010.
Wheatcroft, S. G.: The Soviet Famine of 1946–1947, the Weather and Human Agency in Historical Perspective, Europe-Asia Stud., 64, 987–1005, https://doi.org/10.1080/09668136.2012.691725, 2012.
White, S., Pei, Q., Kleemann, K., Dolák, L., Huhtamaa, H., and Camenisch, C.: New perspectives on historical climatology, WiRes Clim. Change, 14, e808, https://doi.org/10.1002/wcc.808, 2023.
Xu, P., Wang, L., Liu, Y., Chen, W., and Huang, P.: The record-breaking heat wave of June 2019 in Central Europe, Atmos. Sci. Lett., 21, e964, https://doi.org/10.1002/asl.964, 2020.
Yang, Z., Dominguez, F., and Zeng, X.: Large and local-scale features associated with heat waves in the United States in reanalysis products and the NARCCAP model ensemble, Clim. Dynam., 52, 1883–1901, https://doi.org/10.1007/s00382-018-4414-x, 2019.
Yule, E. L., Hegerl, G., Schurer, A., and Hawkins, E.: Using early extremes to place the 2022 UK heat waves into historical context, Atmos. Sci. Lett., 24, e1159, https://doi.org/10.1002/asl.1159, 2023.
Zscheischler, J., Westra, S., Van Den Hurk, B. J. J. M. J. M., Seneviratne, S. I., Ward, P. J., Pitman, A., AghaKouchak, A., Bresch, D. N., Leonard, M., Wahl, T., and Zhang, X.: Future climate risk from compound events, Nat. Clim. Change, 8, 469–477, https://doi.org/10.1038/s41558-018-0156-3, 2018.


