the Creative Commons Attribution 4.0 License.
the Creative Commons Attribution 4.0 License.
 | 08 Feb 2024
Understanding flow characteristics from tsunami deposits at Odaka, Joban Coast, using a deep neural network (DNN) inverse model
Rimali Mitra
Tomoya Abe
The 2011 Tohoku-oki tsunami inundated the Joban coastal area in the Odaka region of the city of Minamisoma, up to 2818 m from the shoreline. In this study, the flow characteristics of the tsunami were reconstructed from deposits using the DNN (deep neural network) inverse model, suggesting that the tsunami inundation occurred in the Froude supercritical condition. The DNN inverse model effectively estimated the tsunami flow parameters in the Odaka region, including the maximum inundation distance, flow velocity, maximum flow depth, and sediment concentration. Despite having a few topographical anthropogenic undulations that caused the inundation height to fluctuate greatly, the reconstructed maximum flow depth and flow velocity were reasonable and close to the values reported in the field observations. The reconstructed data around the Odaka region were characterized by an extremely high velocity (12.1 m s−1). This study suggests that the large fluctuation in flow depths on the Joban Coast compared with the stable flow depths in the Sendai Plain can be explained by the inundation in the supercritical flow condition.
- Article
(5682 KB) - Full-text XML
-
Supplement
(955 KB) - BibTeX
- EndNote


The 2011 Tohoku-oki tsunami of Mw 9.0 occurred on 11 March 2011, and it affected a large region of eastern Japan. With a significant number of fatalities and losses, this tsunami is considered one of the largest in Japan (Sato et al., 2014). It is becoming clear that tsunami inundation patterns vary significantly from place to place, even in areas adjacent to each other in the same tsunami event. Many studies of tsunami deposits have been conducted in and around the Sendai Plain (Naruse et al., 2012; Abe et al., 2012). Several field surveys, aerial video records, and satellite images were used to understand the flow conditions of the 2011 Tohoku-oki tsunami by reconstructing the inundated area and the size of the tsunami (Hayashi and Koshimura, 2013). The inundation height at the transect (Naruse and Abe, 2017; Mitra et al., 2020) of Sendai Plain was comparatively low (6.5 m above the mean sea level of Tokyo Bay) (Naruse and Abe, 2017), possibly caused by the divergence of wave reflection owing to the concave bathymetry and wide continental shelf (Sato et al., 2014). The flow velocity of 1.9–6.9 m s−1 was reported on the Sendai Plain using aerial video records (Hayashi and Koshimura, 2013). Furthermore, in the city of Rikuzentakata, the flow velocity of the 2011 Tohoku-oki tsunami was estimated to be larger than 2.4–2.7 m s−1, based on the flow reconstruction by Naruse et al. (2012). This reconstruction was achieved by considering the critical velocity required for bedload motion specifically related to the largest grain-size category found within the deposits.
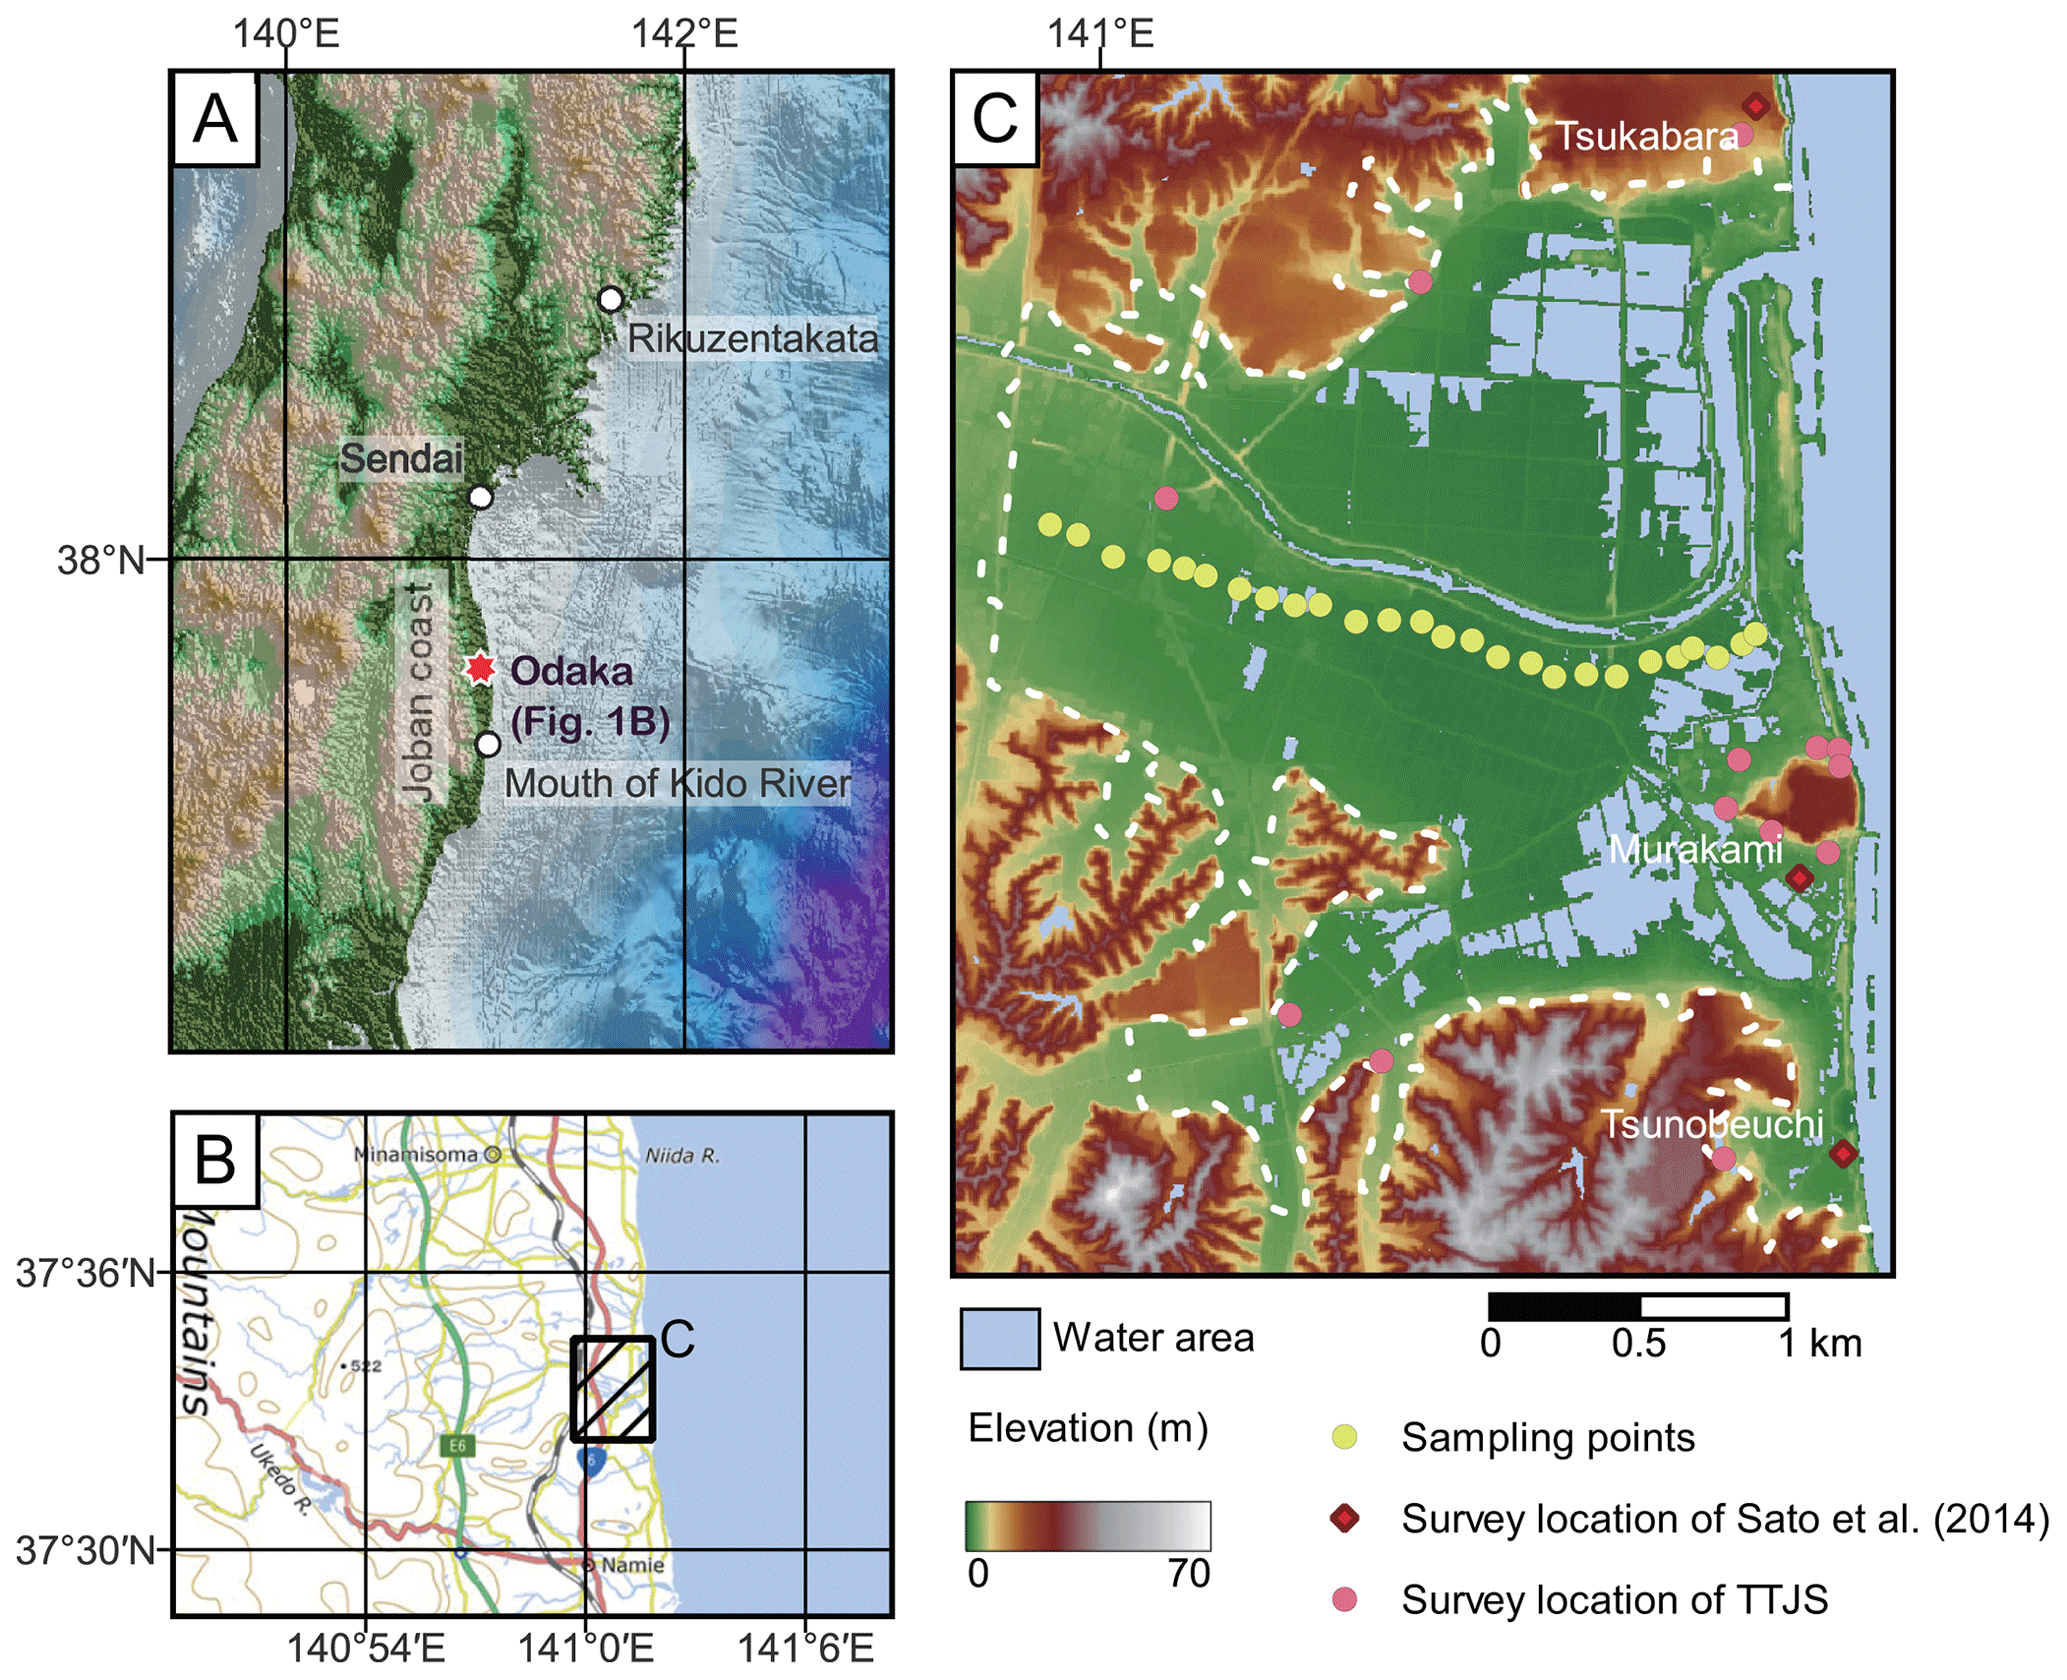
Figure 1Location of the study area and sampling points. (a, b) Location of study area. These maps are based on information from the Geospatial Information Authority of Japan and GEBCO 2023 grid (https://doi.org/10.5285/f98b053b-0cbc-6c23-e053-6c86abc0af7b). (c) The sampling points of this study. Study sites of Tsunami Joint Survey Group (TTJS) are also plotted. Dashed white line indicates the inundation limit of the 2011 Tohoku-oki tsunami (https://www.gsi.go.jp/kikaku/kikaku40014.html, last access: 31 January 2024). This map is based on 5 m grid digital elevation model published by the Geospatial Information Authority of Japan in 2012.
Compared to other regions, the Joban Coast is estimated to have experienced extremely high-velocity inundation (Sanuki et al., 2013; Sato et al., 2014; Iijima et al., 2021), even though they are located adjacent to the Sendai Plain (Fig. 1). The waves around the Odaka region destroyed or damaged nearly all seawalls because of the large inundation height and co-seismic land-level subsidence (Sato et al., 2014). Sanuki et al. (2013) estimated the inundation flow velocity from video images near the mouth of the Kido River in the Minamisoma region to be distinctively higher than that in the Sendai Plain, which was 10–15 m s−1 in the river and coastal plain. Sato et al. (2012a) and Sanuki et al. (2013) conducted a numerical simulation of tsunami inundation and also estimated high-velocity flows in the area. Sato et al. (2014) estimated a flow velocity higher than 11 m s−1 from the collapse of buildings. When the overtopping flow was generated from the elevated seawall crown, it led to a substantial increase in velocity (exceeding 11 m s−1 based on the principles of the Bernoulli theorem) as it encountered the formerly dry soil surface behind the seawall. This sudden surge in velocity was a direct consequence of the flow cascading over the seawall and impacting the ground. Therefore, it is conjectured that the coastal areas of the Fukushima region experienced supercritical, high-velocity inundation flows. However, due to the Fukushima Daiichi Nuclear Power Plant disaster (Mori et al., 2011; Mimura et al., 2011), the specific mode of tsunami inundation flows in that region has not been extensively investigated.
Within the Joban Coast, the Odaka area preserves a wide range of tsunami deposits, so this area is essential for studying the diversity of tsunami inundation flow characteristics and depositional effects of the high-velocity tsunami inundation flows. Recently, Iijima et al. (2021) performed a tsunami inundation simulation based on the fault model of Tohoku University (https://www.tsunami.irides.tohoku.ac.jp/hokusai3/J/events/tohoku_2011/model/dcrc_ver1.2.pdf, last access: 31 January 2024), suggesting that the inundation flow in this area reached 8.2 m s−1. In addition, they conducted a field study examining the influence of artificial structures on depositional characteristics. However, the influence of the high-velocity inundation flow on the tsunami behavior, which may be a Froude supercritical flow, requires further investigation in this area. Although the tsunami propagation pattern from the fault model of Tohoku University can be assumed to be reasonable on the whole, local topographic conditions may have altered flow characteristics, so it is desirable to independently verify whether the characteristics of the inundated flow in each area are calculated before the depositional analysis.
Here, we conducted an inverse analysis of tsunami deposits distributed in the Odaka region of the Minamisoma area, Fukushima Prefecture, to estimate the tsunami inundation flow conditions in the area. The tsunami deposits in this area have been well preserved because the restrictions prevented anthropogenic disturbances. Several inverse and forward models have been proposed to reconstruct flow conditions (Jaffe et al., 2012; Li et al., 2012; Sugawara and Goto, 2012; Johnson et al., 2016; Yoshii et al., 2018). Recently Mitra et al. (2020, 2021a) proposed a new one-dimensional inverse model using the deep neural network (DNN) and predicted reasonable flow conditions of the 2011 Tohoku-oki tsunami and the 2004 Indian Ocean tsunami from measured grain-size distributions and thickness at different locations, such as the Sendai Plain and island of Phra Thong, Thailand. This inverse model utilizes a forward model that incorporates the non-uniform, unsteady transport of suspended sediments with turbulent mixing. The DNN model can effectively quantify the maximum inundation distance, flow velocity, maximum flow depth, and sediment concentration. The major advantages of this model are that the hydrodynamic and sediment transportation settings of this model are more realistic than other models and the uncertainty calculation of the predicted results can be estimated using a jackknife method. The results of the inverse analysis were verified by field observations. Utilizing this approach for the 2011 Tohoku-oki tsunami deposit in the Sendai Plain, Mitra et al. (2020) reconstructed the inundation length, run-up flow velocity, and the maximum flow depth of the tsunami. Reconstructed flow conditions closely approximated the values measured in situ from the Sendai Plain. The method was also applied to the 2004 Indian Ocean tsunami at the island of Phra Thong in Thailand (Mitra et al., 2021a). The reconstructed inundation distance, velocity, and flow depth fell in the range of the actual measurements.
In this study, despite the complex topography of the region, we successfully reconstructed the flow properties of the 2011 Tohoku-oki tsunami, and the results were corroborated by field observations. This provided a better understanding of tsunami inundation flow in Froude supercritical and subcritical conditions, which vary depending on the region and topographical settings. There are few studies that deal with the supercritical or subcritical conditions of tsunami inundation flows (Qi et al., 2014; Sakakiyama, 2014) quantitatively. This study focuses on the ability of the DNN model to estimate the flow conditions, such as flow velocity and depth, and how those parameters can be used to delineate the Froude number (Fr) to understand the type of prevailing flow, such as subcritical (Fr<1) or supercritical (Fr>1), during tsunami inflow in different regions. Hence, the DNN inverse analysis results could be used to construct appropriate preventive structural measures for tsunami and mitigation strategies around the Minamisoma area (Shuto, 2019).
This study used the samples from the Odaka region of the city of Minamisoma (Fig. 1), which is located 25 km north of the Fukushima Daiichi Nuclear Power Plant (Koff et al., 2012). The tsunami flooded a wide area with the river, which caused major damage to the properties in the Odaka lowland (Koff et al., 2012). The topographical features of the area include the gentle slope of the coastal plain, beach ridges, marshes, lagoons, and sea dikes (Sawai et al., 2012; Koff et al., 2012). A co-seismic subsidence of 0.5–0.8 m has been reported from a few places in the Odaka region (Sato et al., 2012b, 2014), and this event caused a reduction in the sea-wall heights. The shoreline along Minamisoma was convex with the presence of alternating coastal bluffs and plains (20 m) which were associated with a terrace-like seafloor consisting of steeper ascending slopes near the coastline (Tsuruta et al., 2017).
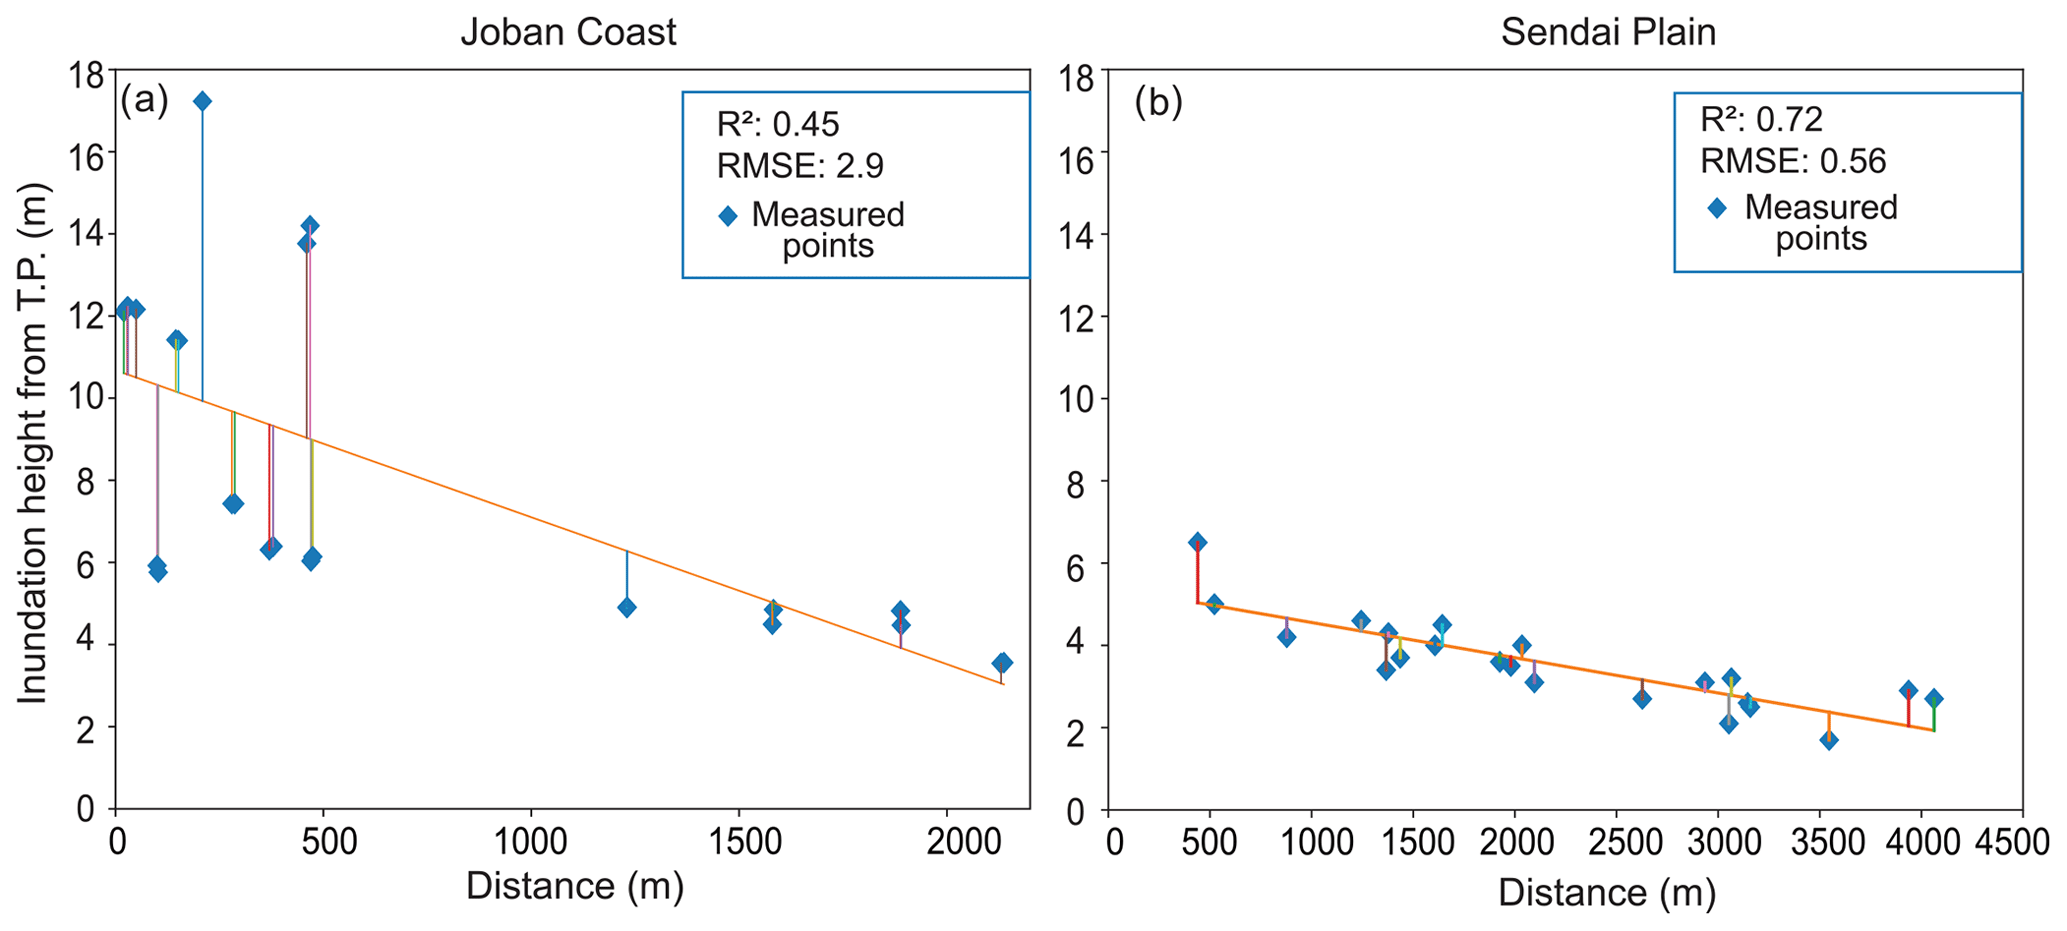
Figure 2(a) Measured inundation heights of the 2011 Tohoku-oki tsunami around the Joban Coast: root mean square error (RMSE) and R2 values indicate that the data points deviate from the best-fit line. (b) Measured inundation heights in Sendai Plain show the measured flow depth of the 2011 Tohoku-oki tsunami around the Sendai Plain: root mean square error (RMSE) and R2 values show that the data points are close to the best-fit line (Naruse and Abe, 2017). The data of inundation heights around the Odaka region were collected from the TTJS group and Sato et al. (2014).
A precise tsunami flow velocity measurement is absent in this area. The inundation heights were measured by Sato et al. (2014) and the TTJS (The 2011 Tohoku Earthquake Tsunami Joint Survey) group (http://www.coastal.jp/tsunami2011/, last access: 31 January 2024) in the Odaka region around the Joban Coast. Large variations in inundation heights along the coastal line were observed within short distances in the region (Sato et al., 2014). This variation in inundation heights was caused by the complex coastal topography of the city of Minamisoma. Figure 2a and b show the measured tsunami inundation heights as the distance from the shoreline increases along the Joban Coast and the Sendai Plain, and it is evident that the former shows a poor correlation with the best-fit regression line, whereas the latter shows a strong correlation. The topographic elevation for the TTJS group datasets was calculated with a 5 m mesh DEM (the Geospatial Information Authority of Japan) using several methods, such as adding surface information from a three-dimensional analyst tool and spatial analyst tool. Finally, the values were used to calculate a measured flow depth from the measured inundation height.
In our study, the post-tsunami survey was conducted along the sampling transect (Fig. 1c), perpendicular to the shoreline, and the samples were collected from 26 locations along the transect as shown in Fig. 1. This survey was conducted shortly after the site restriction was lifted (June 2012). The sampling was done every 100–200 m, and the thickness of the deposits was measured accordingly at each site. Grain-size analysis was performed using settling tubes with the STube application program (Naruse, 2005). The procedures for the cleaning and pretreatment of samples followed the methods described in Naruse and Abe (2017).
3.1 Forward model
The DNN inverse model incorporates the FITTNUSS forward model (Naruse and Abe, 2017), which is based on layer-averaged, one-dimensional shallow-water equations. This model calculates the spatial variation in the thickness and grain-size distribution of the tsunami deposits using the maximum inundation distance, flow velocity, maximum flow depth, and sediment concentration as the input values.
The fluid dynamics and sediment transport calculations encompass layer-averaged equations pertaining to the conservation of fluid mass, momentum, and sediment mass. The model operates under the quasi-steady-flow assumption, positing that the velocity of tsunami run-up remains constant. At the same time, the inundation depth experiences a consistent increase until it attains its maximum value at the seaward boundary. Furthermore, it is postulated that the suspended sediment solely interacts with the bed sediment situated within the active layer on the surface of the bed, as proposed by Hirano (1971). The model necessitates the incorporation of several empirical closure equations related to fluid dynamics and sediment transport, including the entrainment rate of basal sediment, bed friction, and stratification of sediment concentration, as delineated by Naruse and Abe (2017).
The measured grain-size distributions, spanning from 0 to 3 phi, were divided into six distinct grain-size categories. To enable easier comparisons, these phi classes were converted into micrometers. In this study, the grain-size distribution was discretized into six specific classes, each characterized by representative diameters of 841, 595, 420, 297, 210, and 149 µm. The corresponding phi-scale values for these diameters are 0.25, 0.75, 1.25, 1.75, 2.25, and 2.75, respectively. The tsunami sedimentation was calculated using the Exner equation of bed sediment continuity of the ith grain-size classes, and the time variation in the grain-size distribution in the active layer was considered in the model (Hirano, 1971).
This model assumed that sediment entrainment and deposition occur during the run-up phase and that all the suspended sediment settled during the stagnant phase after the inundation. The coordinate transformation was applied for the efficiency and stability of the calculation of the fluid dynamics. The finite difference method was employed to obtain the numerical solutions in our model. The in-depth details of all the equations are provided in Naruse and Abe (2017) and Mitra et al. (2020).
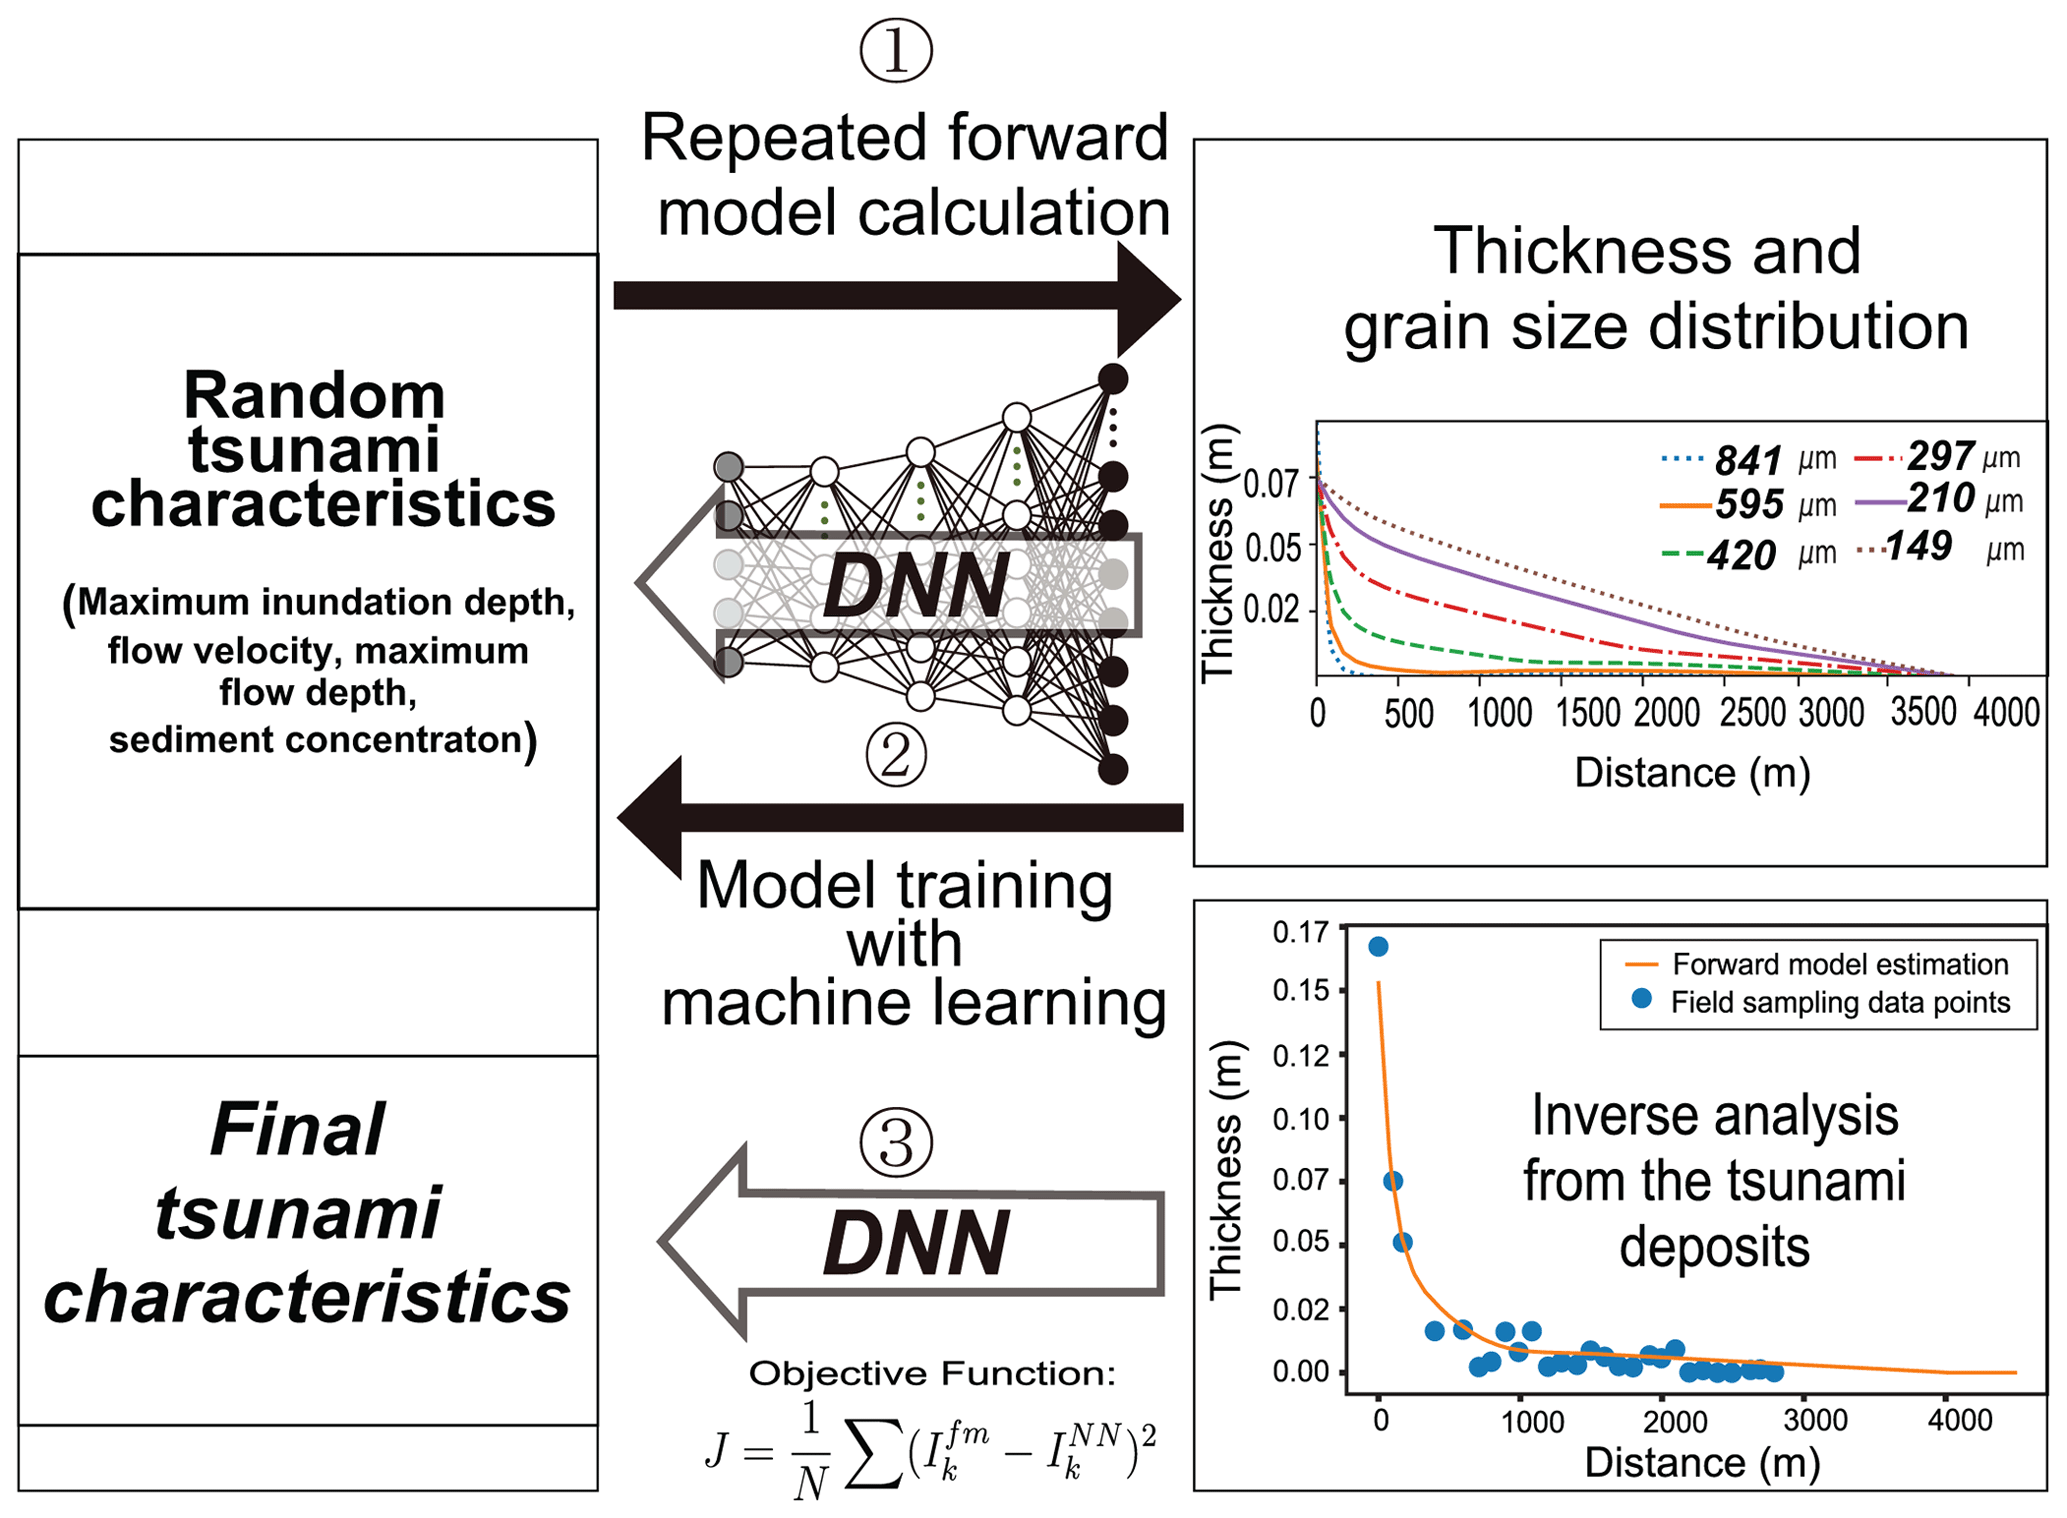
Figure 3Workflow of DNN inverse model (modified from Mitra et al., 2020).
3.2 Inverse model
The DNN inverse model is composed of an artificial neural network featuring a total of five layers, including three hidden layers. The input layer accommodates the values corresponding to the volume per unit area of specific grain-size classes at designated spatial grids. The volume values per unit area of sediment were calculated by multiplying the fraction of each grain-size class in the grain-size distribution by the deposit thickness. Here, the grain-size distribution was obtained by averaging the measurements taken from samples at regular vertical intervals. The quantity of nodes and other hyperparameters remain consistent with those employed in Mitra et al. (2020, 2021a). Ultimately, the neural network's output layer generates predictions pertaining to flow conditions, such as maximum inundation distance, flow velocity, maximum flow depth, and sediment concentration.
Figure 3 shows the workflow of the DNN inverse model, which was trained using the artificial dataset of depositional characteristics, such as thickness and grain-size distribution produced by random and repetitive forward model calculations. This was followed by validating the performance using the artificial test datasets. A sampling window around the proximal part was used on the entire volume per unit area distribution to apply the inverse model. The distal part may contain large errors owing to the thinning of the deposits and field measurements potentially not covering the entire distribution of the deposits. The performance of the model is provided in Appendix A (Fig. A1) and the Supplement, as the performance results were almost similar to the results provided in Mitra et al. (2020) and Mitra et al. (2021a).
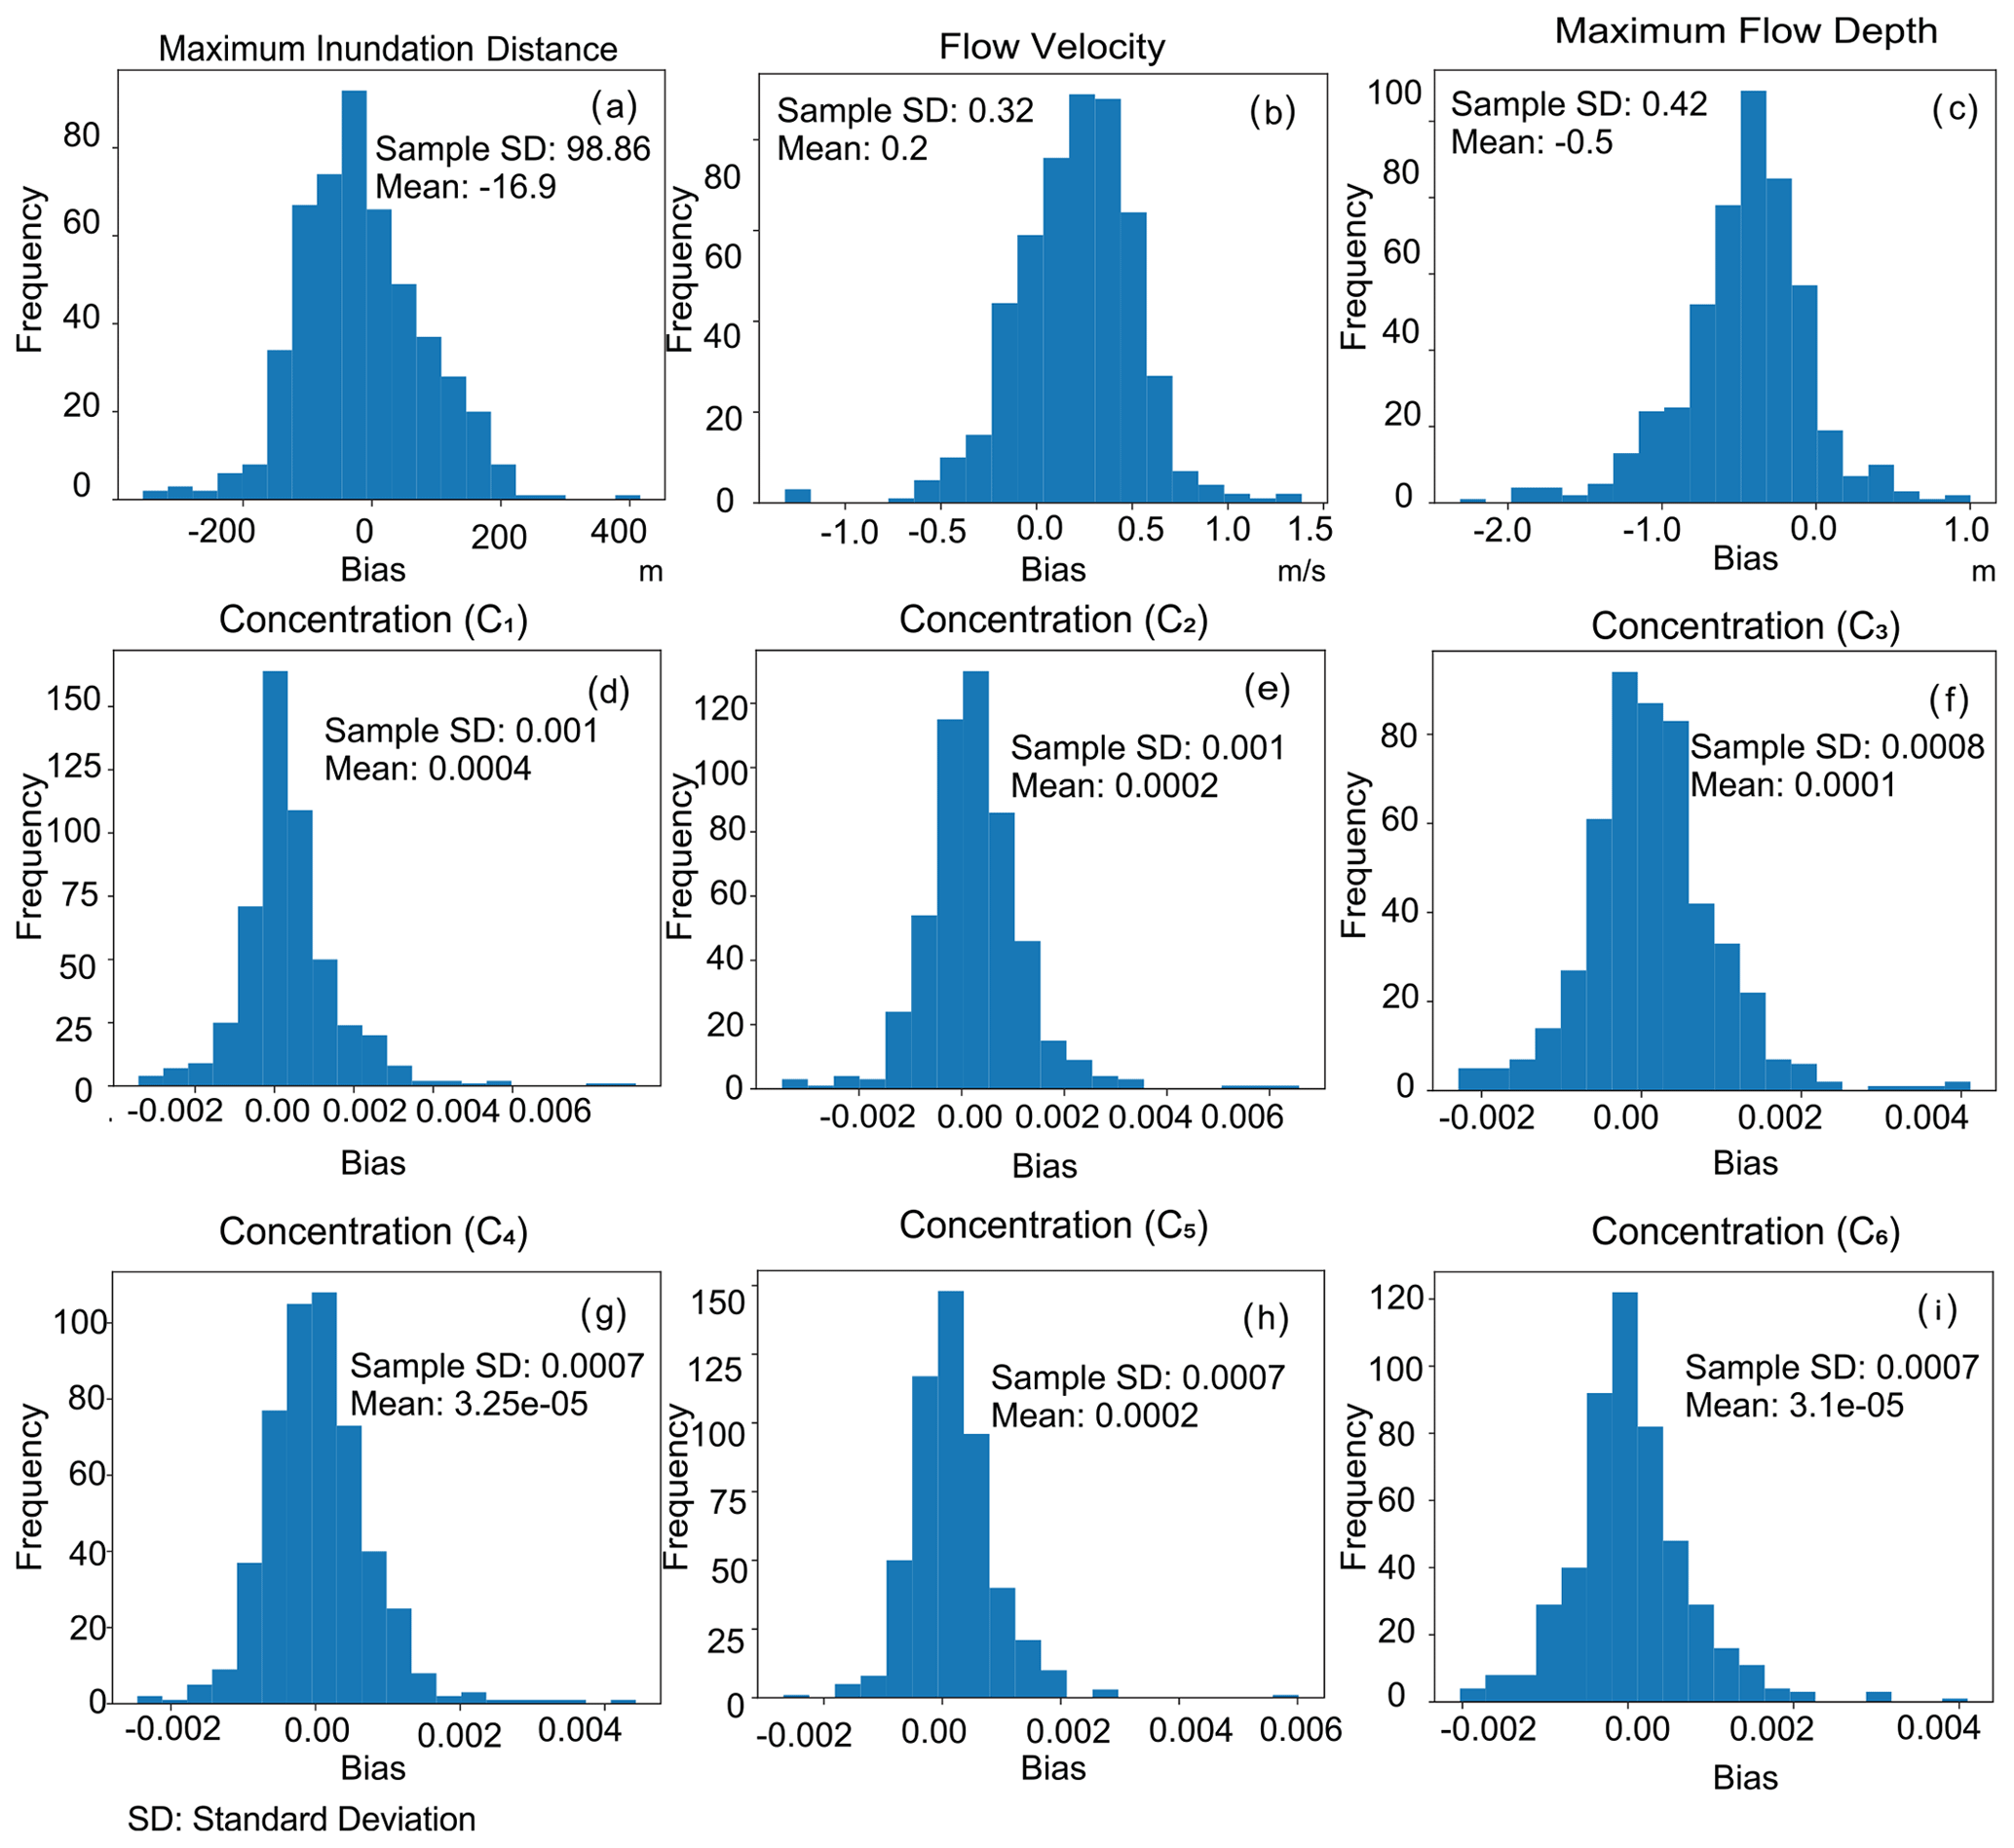
Figure 4Histograms showing the variance and bias of predictions from the test datasets subsampled at the sampling locations of the transect in the Odaka region.
After training and validation, the model was ready to be applied to the field dataset from the Odaka region to reconstruct the flow condition of the 2011 Tohoku-oki tsunami. For this investigation, we selected a sampling window size of 1800 m, determined based on comparative results procured from tests employing varying sampling window sizes, as delineated in the results section. Within this study area, the grid spacing in fixed coordinates was set at 15 m, utilizing 120 spatial grids for the inversion process. Following the model's training, test datasets were subsampled at the sampling locations of the Odaka region (Fig. 4 a–i). In this examination, sediment volume per unit area at the sampling locations was estimated via one-dimensional cubic interpolation. The subsampled data were subsequently re-interpolated at the forward model grids. The inversion was then applied to the subsampled dataset. Consequently, the model's predictive accuracy was assessed by comparing the true values and the inversion results using the original test datasets to evaluate the bias induced by spatial distribution irregularities in the sampling locations.
3.3 Training and testing of the inverse model
The training and testing of the DNN inverse model have already provided evidence that the model has the promising ability to reconstruct tsunami flow characteristics. The final loss function values for the training and validation were 0.0039 and 0.0013, respectively, which were close to the previously reported values in Mitra et al. (2020) and Mitra et al. (2021a). The sample standard deviation for the predicted and true values for the maximum inundation distance was small, 81.82 m, and it was only 0.26 m for flow velocity (Fig. A1). There were no large deviations for any parameter. However, for the maximum flow depth, the model tended to estimate approximately 0.4 m lower than the original values on average, which is also very similar to 0.4 and 0.5 m bias in Mitra et al. (2021a) and Mitra et al. (2020), respectively. Correcting the final results by adding this bias to the model-estimated values, the reconstructed results were compared with the field measurements. Before applying the model to the actual field datasets, the test datasets of the model were subsampled at the outcrop locations to investigate the bias that was caused by the effect of interpolation on irregularly spaced sampling locations. Consequently, the mean bias and sample standard deviation, attributable to irregular sampling spacing, were −16.9 and 98.86 m for the maximum inundation distance, respectively. The bias and standard deviation for flow velocity were determined to be 0.2 and 0.32 m s−1, respectively. The maximum flow depth exhibited a mean negative bias of 0.5 m (Fig. 4). Given that the parameter already possessed a bias of 0.4 m in the inversion outcomes of the original test datasets, the supplementary bias induced by the incompleteness of datasets amounted to 0.1 m. The mean bias in sediment concentrations was approximately 0.01 % (Fig. 4d–i).
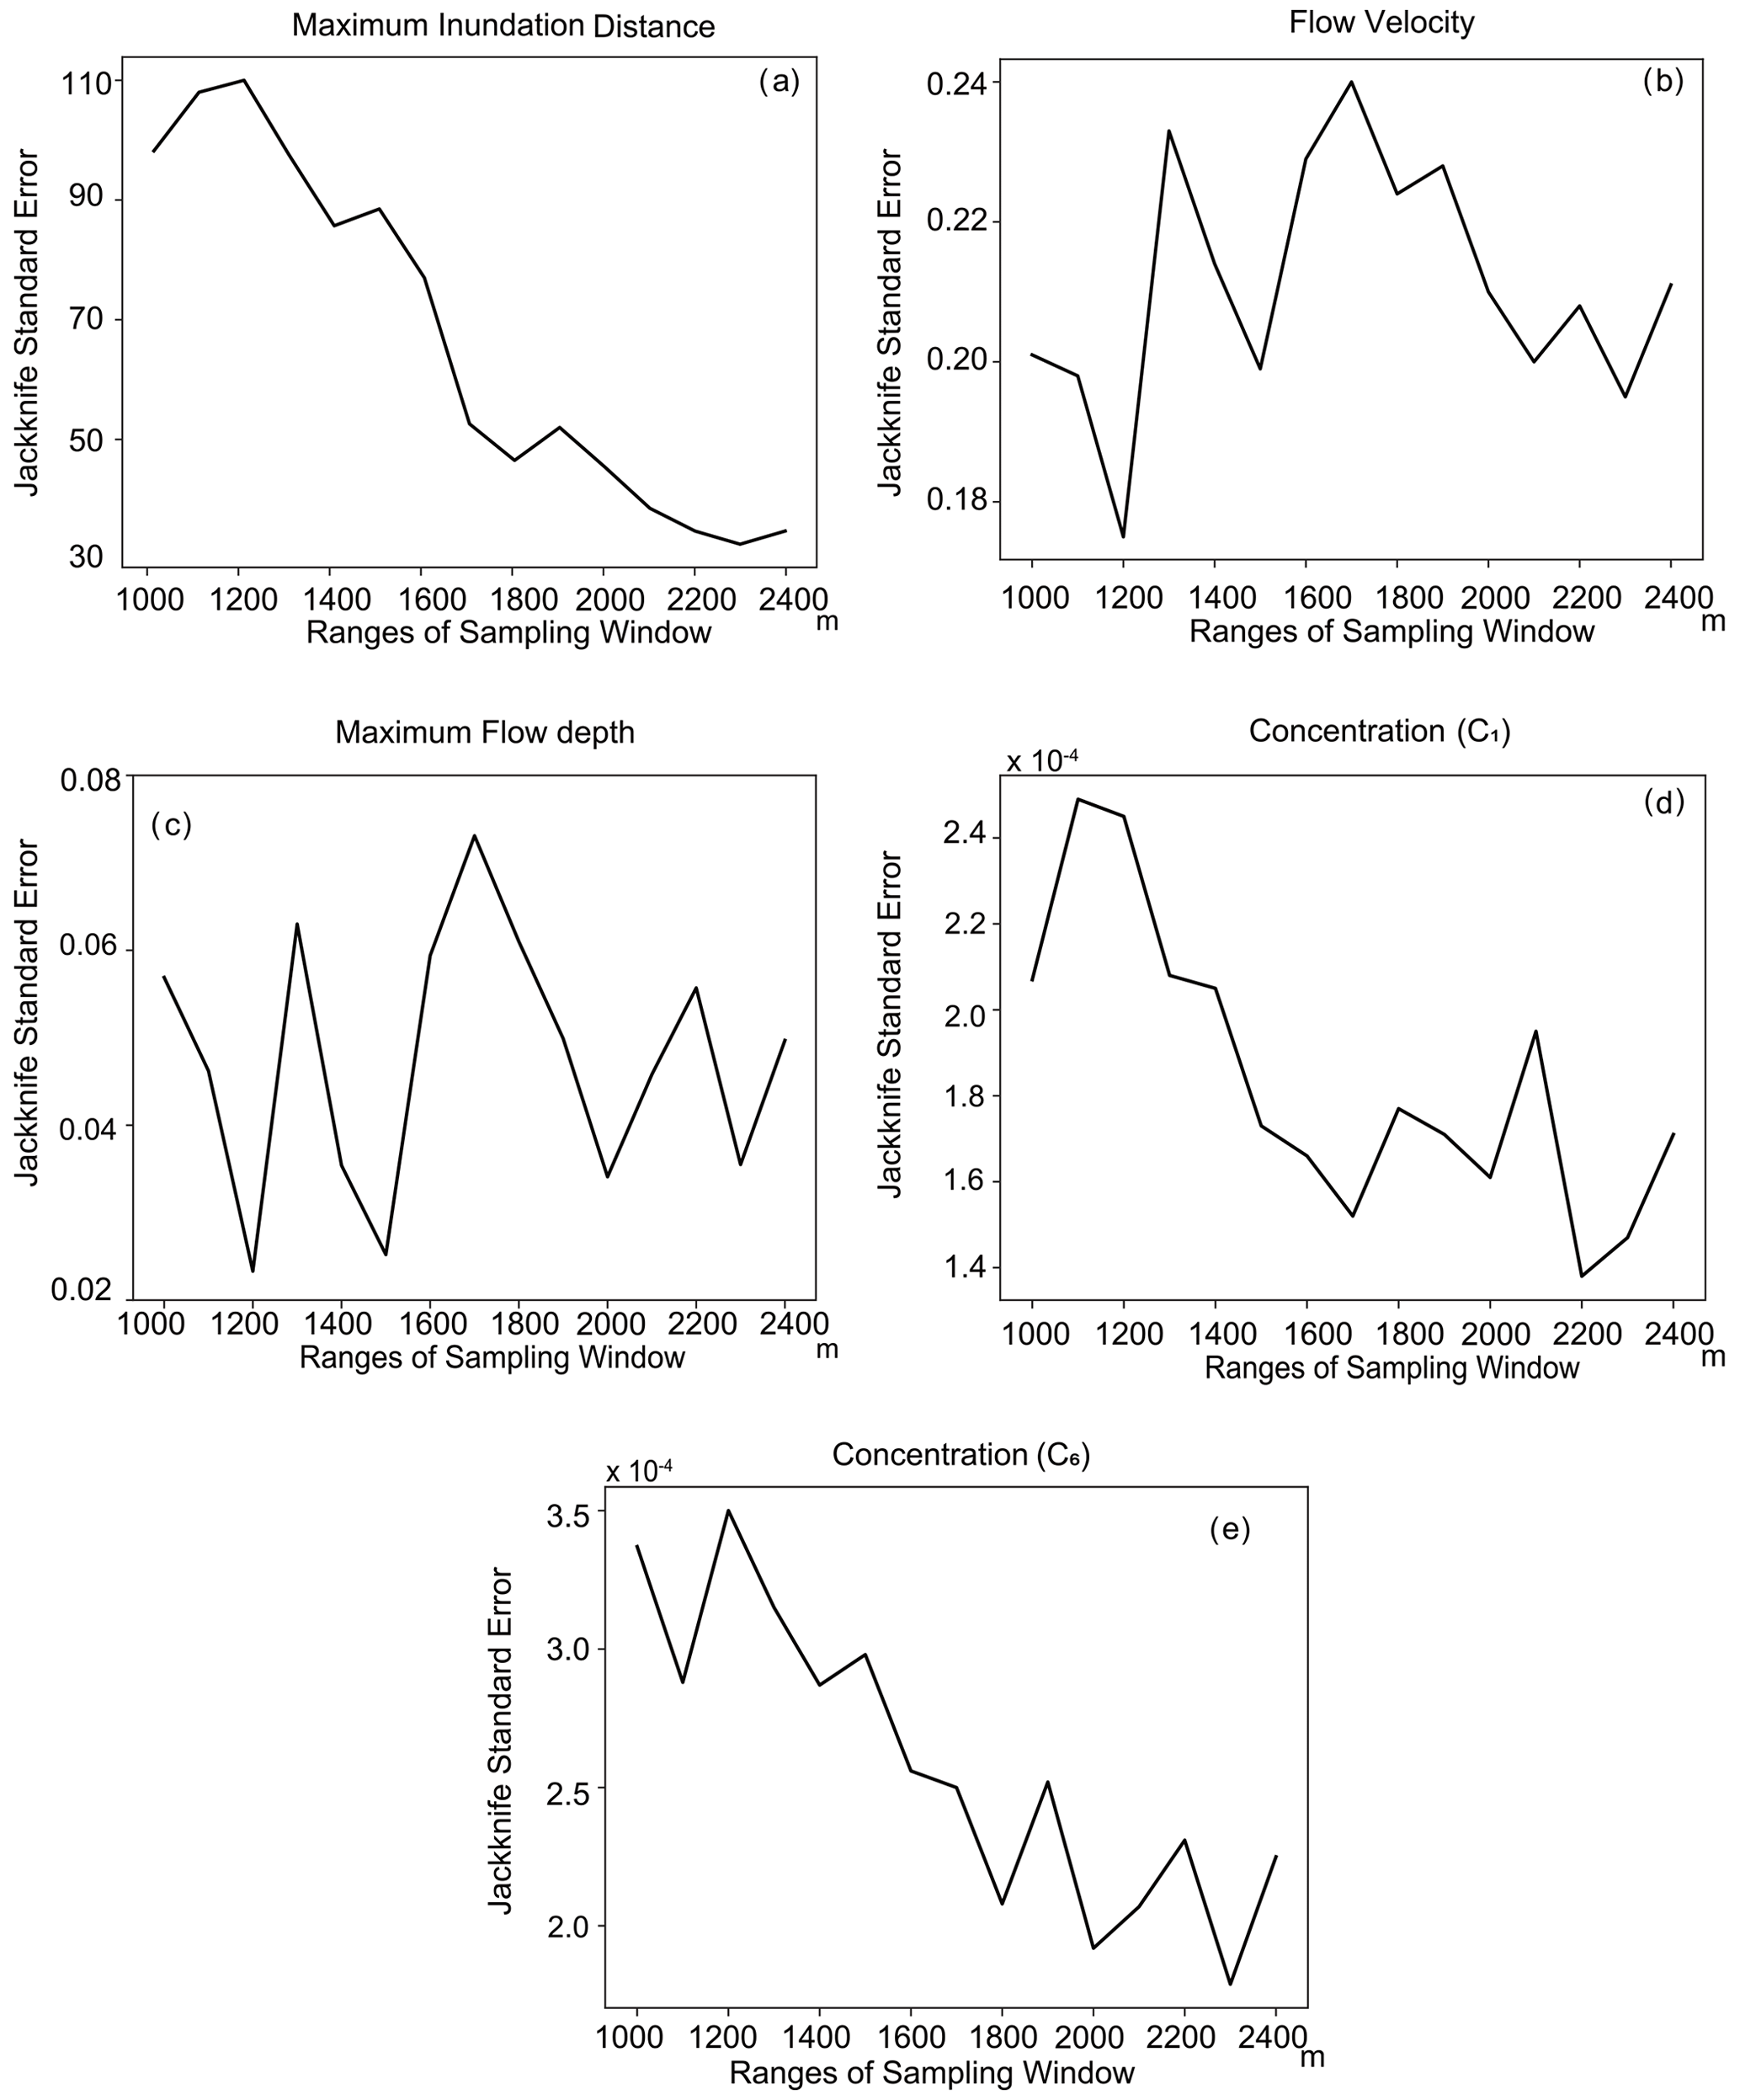
Figure 5Changes in jackknife standard error with different sampling windows for different parameters.
The jackknife error variations were checked for different sampling window sizes. We chose a sampling window of 1800 m for our study. Maximum inundation distance (Fig. 5a), maximum flow depth, and concentration (Fig. 5c–e) show a decreasing trend with the sampling window size. However, the flow velocity showed an increasing trend (Fig. 5b). The change in the estimation error was very small after the sampling window size of 1700 m.
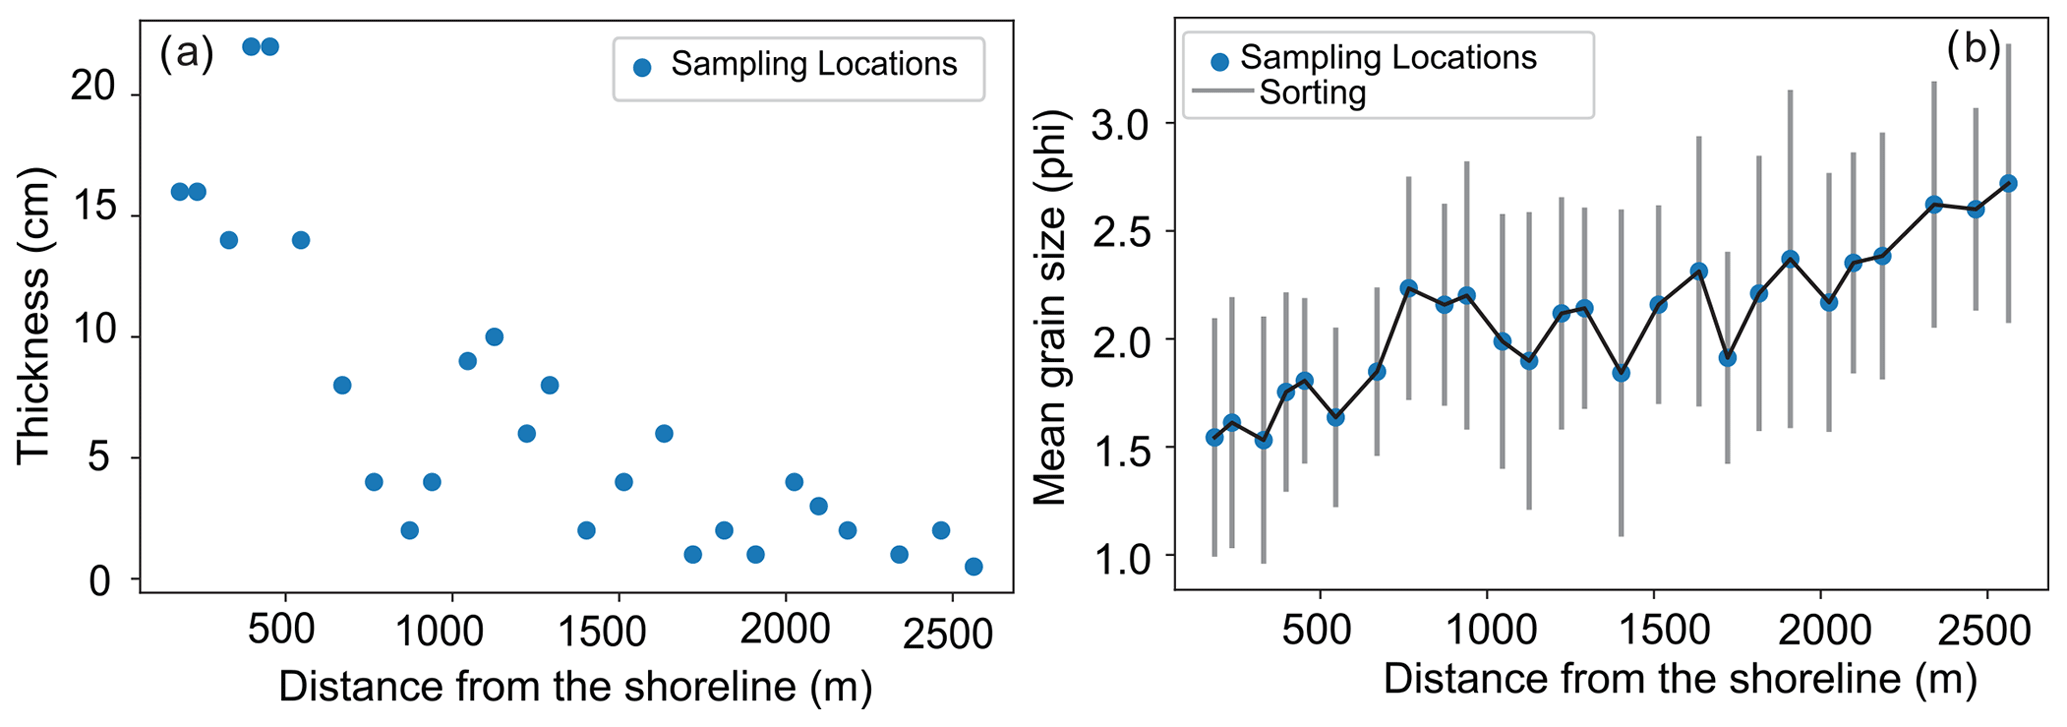
Figure 6(a) Thickness of the deposits from the shoreline measured along the transect at Odaka. (b) Mean grain-size distribution and sorting of the deposits along the transect.
4.1 Grain size and thickness of tsunami deposits
The maximum inundation distance in this study area was observed 2818 m from the shoreline along the survey transect, and tsunami deposits were present from 183 to 2563 m from the shoreline. The tsunami deposits consisted primarily of sand-sized particles with an overlying mud layer. Mud layers ranged in thickness from 0.2 to 13.5 cm, and the sand thickness ranged from 0.5 to 22 cm. Sand layers were primarily composed of coarse to fine sand, with rip-up clasts and broken roots of vegetation. The spatial variation in grain-size distribution in the tsunami deposit was characterized by landward fining and thinning (Fig. 6). The tsunami deposits had a 22 to 6 cm thickness from the shoreline to around 1600 m, whereas thinning of the deposits was observed after 1600 m, ranging from 2 to 0.5 cm to the maximum extent of the deposit at the landward side (Fig. 6a). The mean grain-size distribution from this region varies from 1.5 to 2.6 phi around the study area at Odaka (Fig. 6b). Regarding sedimentary structures, the tsunami deposits in this area were characterized by a single layer of a fining upward sequence with parallel lamination showing a prominent color variation. The columnar sections and outcrop photographs are available in the supplementary material (Figs. S1 and S2 in the Supplement).
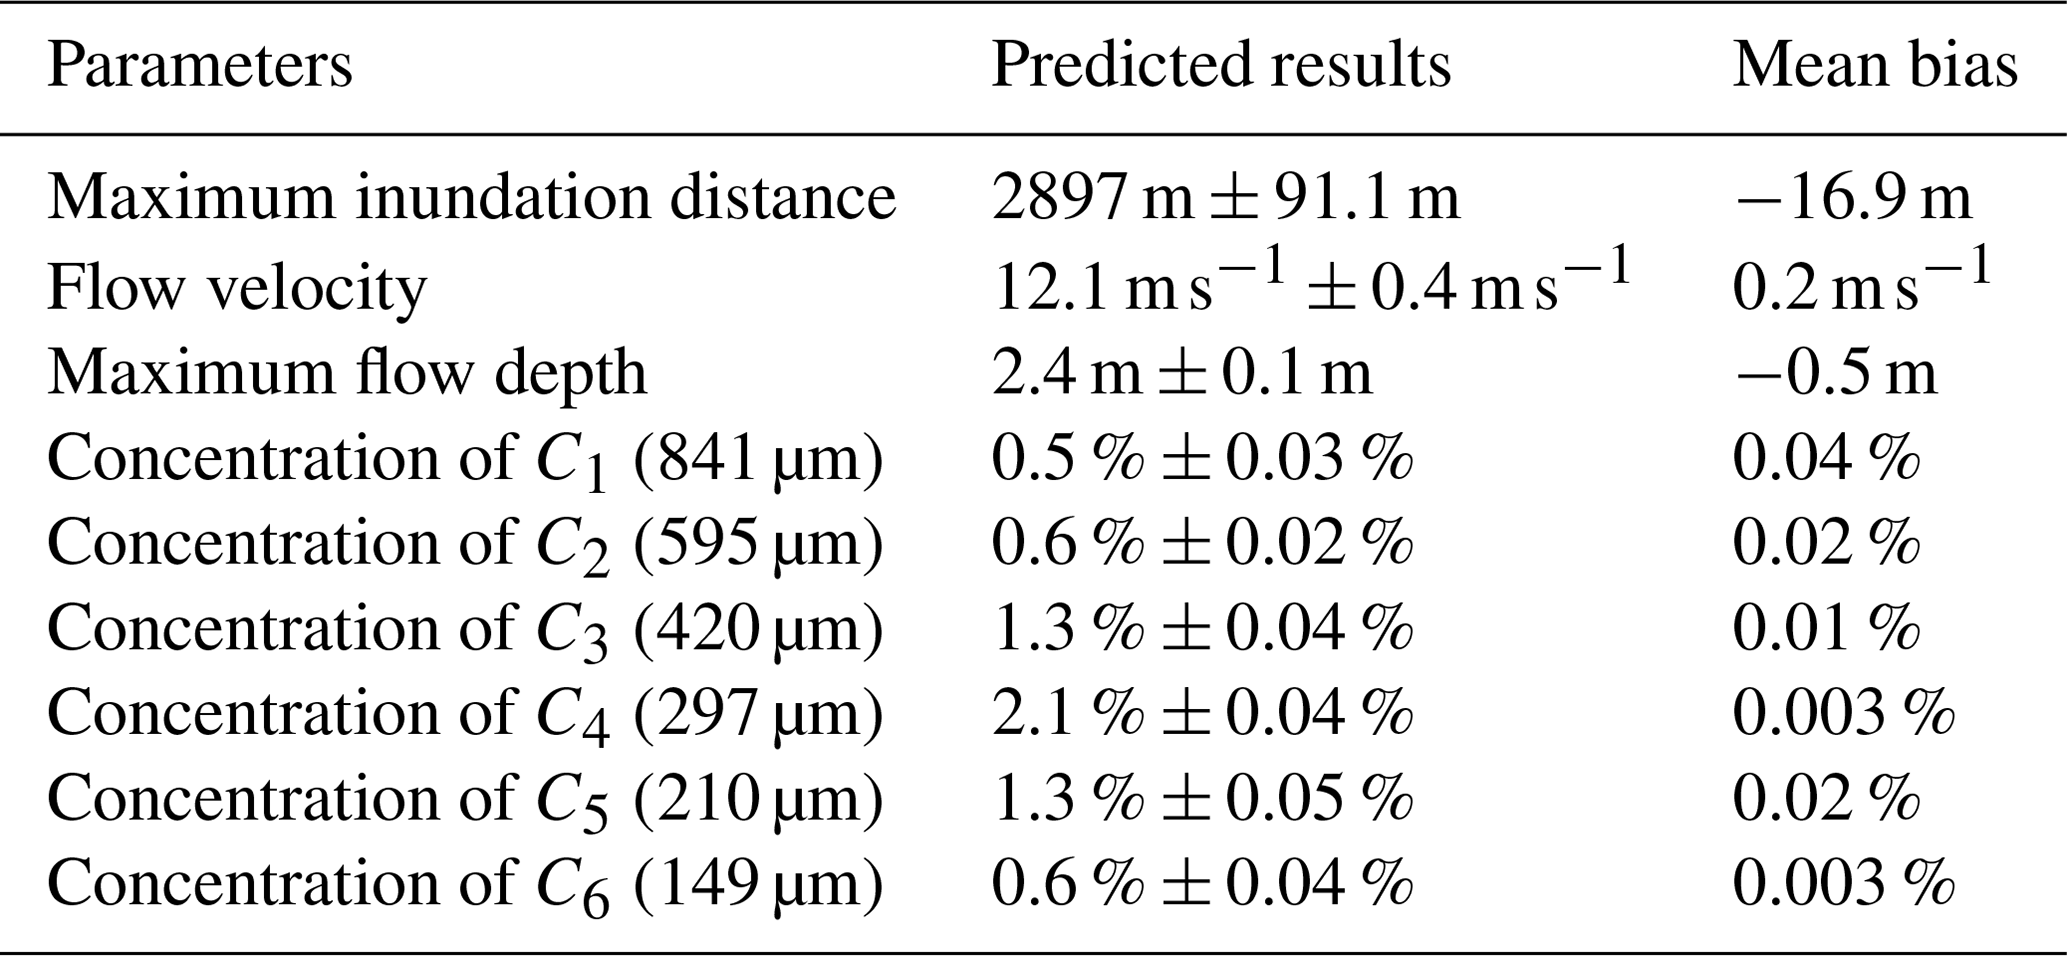
Table 1Predicted results from the inverse model when applied to the 2011 Tohoku-oki tsunami data obtained from Odaka, Joban Coast. All reported standard error calculations were performed using a 95 % confidence interval.
4.2 Inverse analysis of the 2011 Tohoku-oki tsunami deposits at Odaka
The maximum inundation distance at Odaka was reconstructed to be 2897 m with a mean subsampling bias of −16.9 m (Table 1). The predicted flow velocity and maximum flow depth were 12.1 m s−1 and 2.4 m, respectively, with the mean subsampling bias of 0.2 m s−1 and −0.5 m. The total concentration of the sediment was 6.4 %, with the concentrations of the coarsest-grain- and finest-grain-size classes being 0.5 % and 2.1 %, respectively (Table 1). Figure 7 shows the jackknife error estimates for different parameters, which the DNN model predicted. For example, the 2σ estimation error in the maximum inundation distance was 91.1 m. The estimation error for the flow velocity was 0.4 m s−1, and that for the maximum flow depth was 0.1 m (Fig. 7a–c). The jackknife error estimates for sediment concentration were all very small, ranging around 0.02 %–0.05 % (Fig. 7d–e).
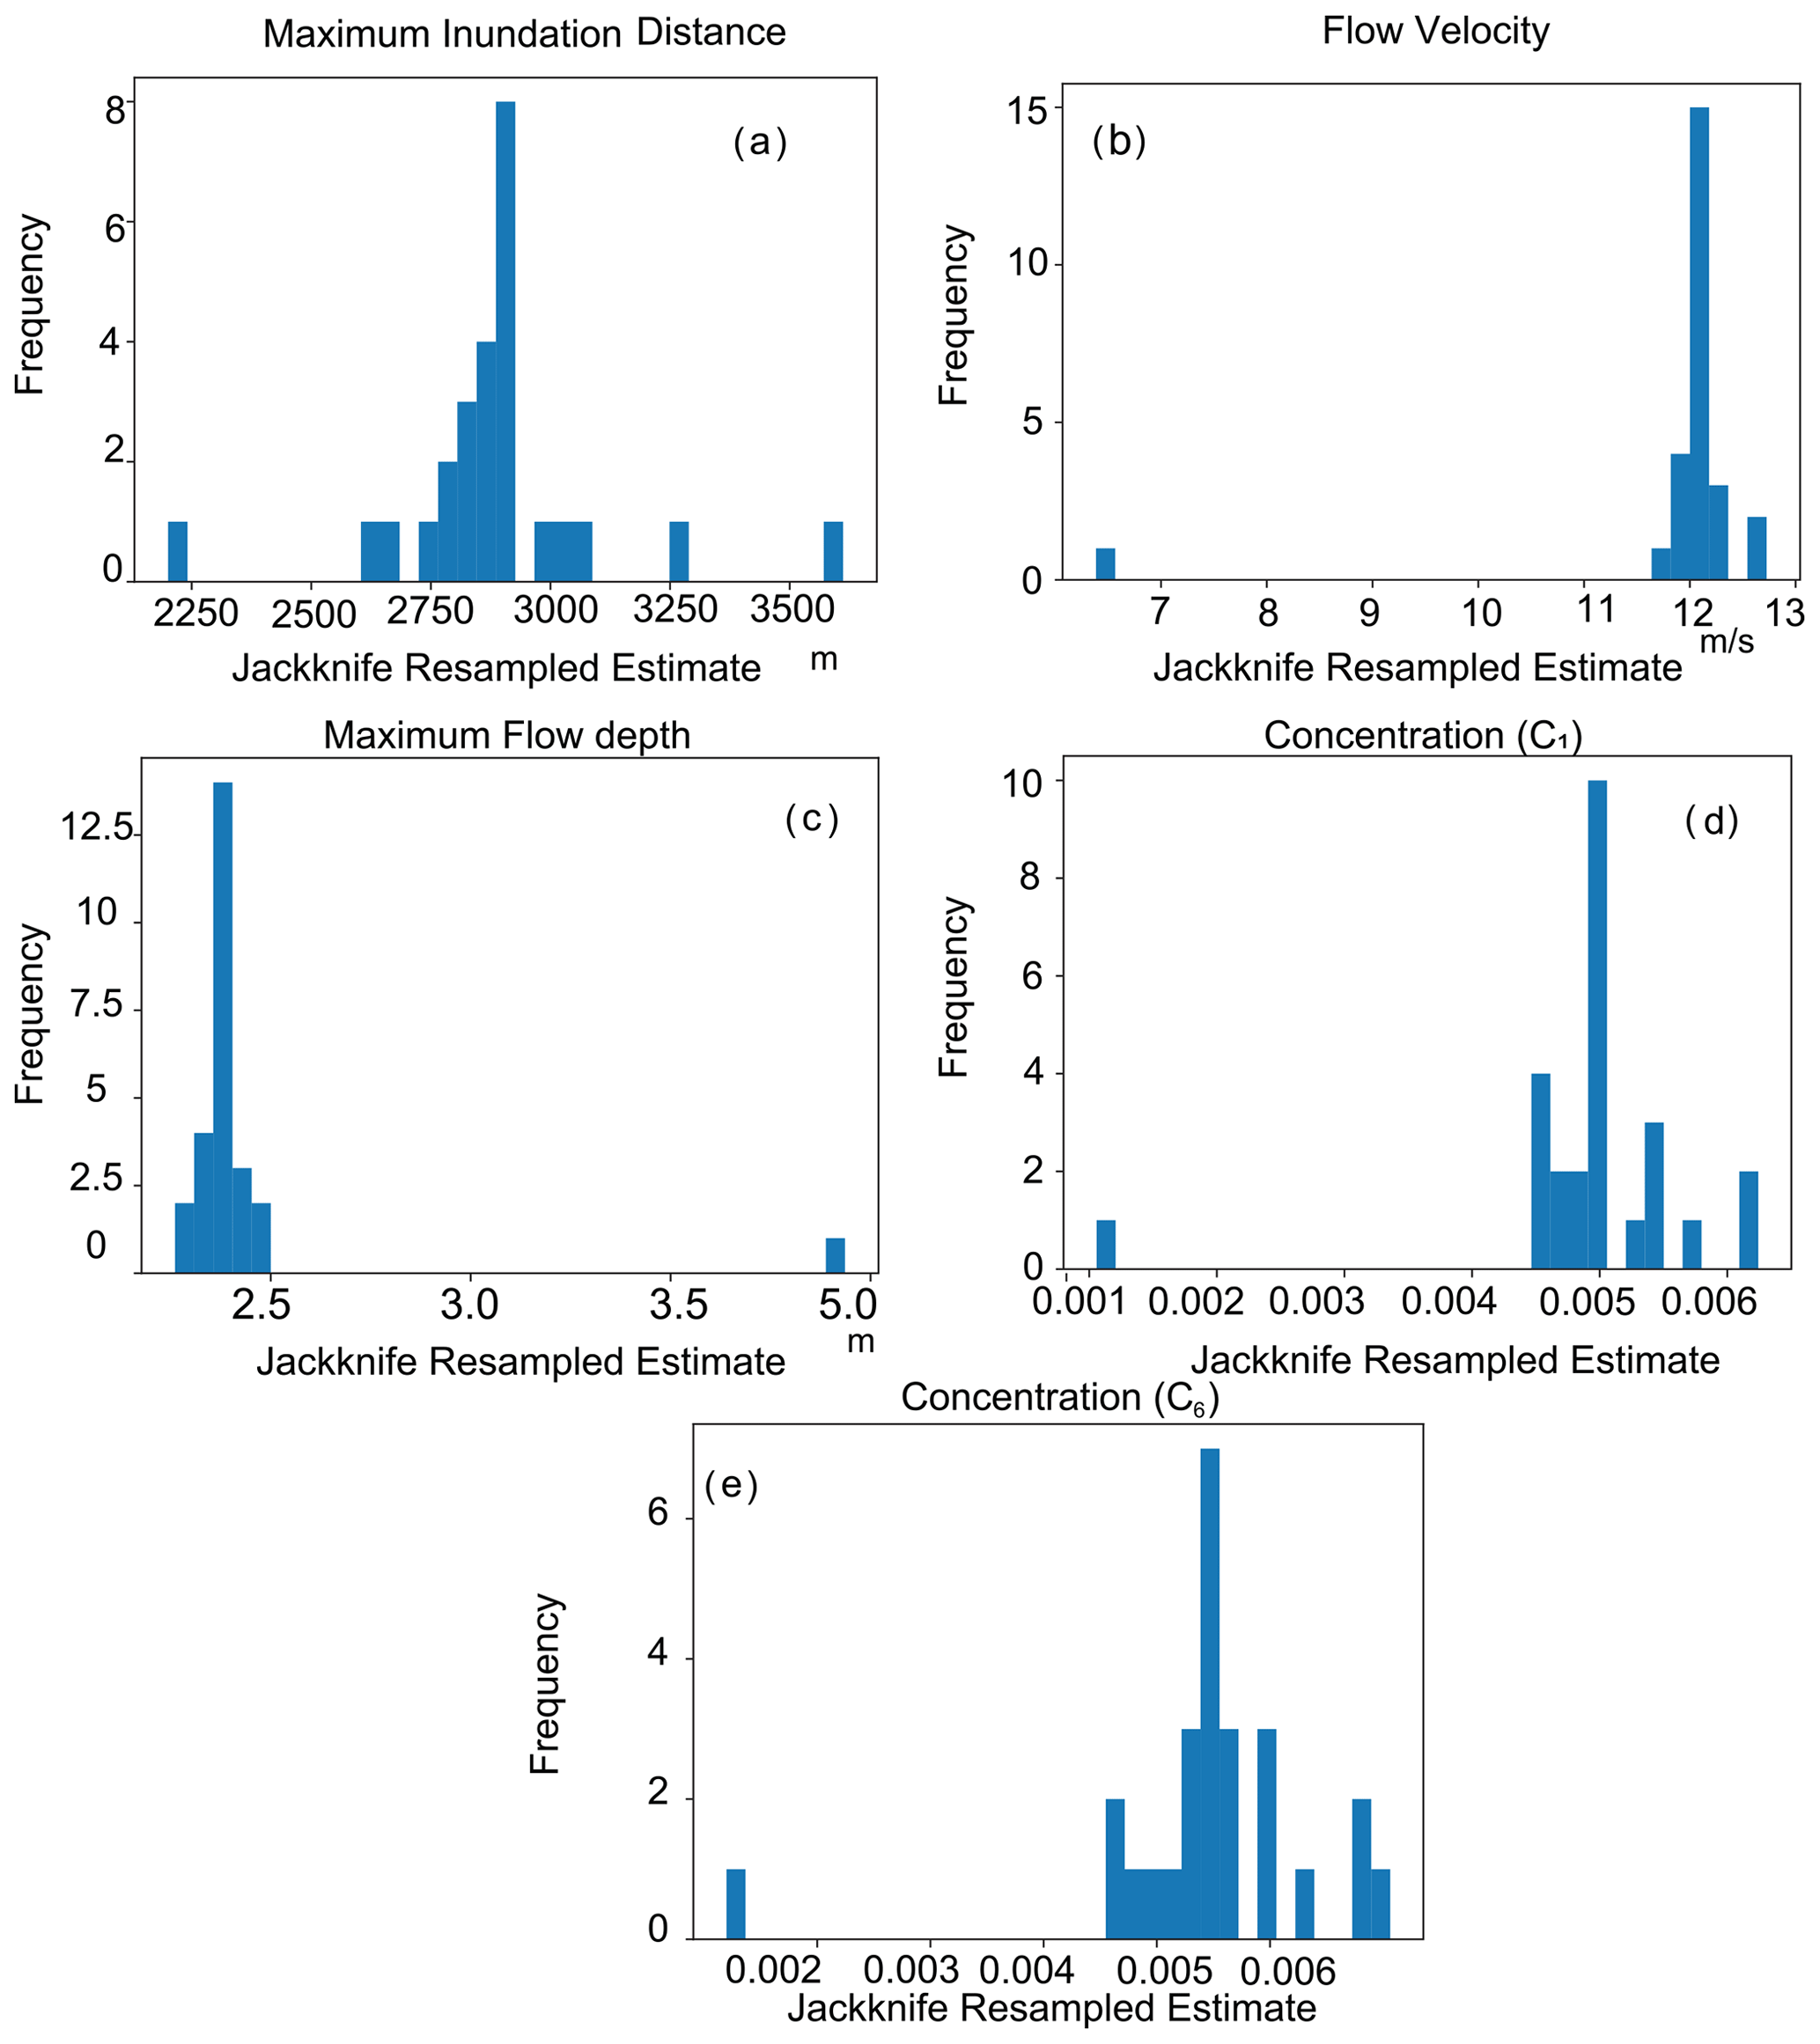
Figure 7Jackknife resampled estimates for a sampling window size of 1800 m for different parameters.
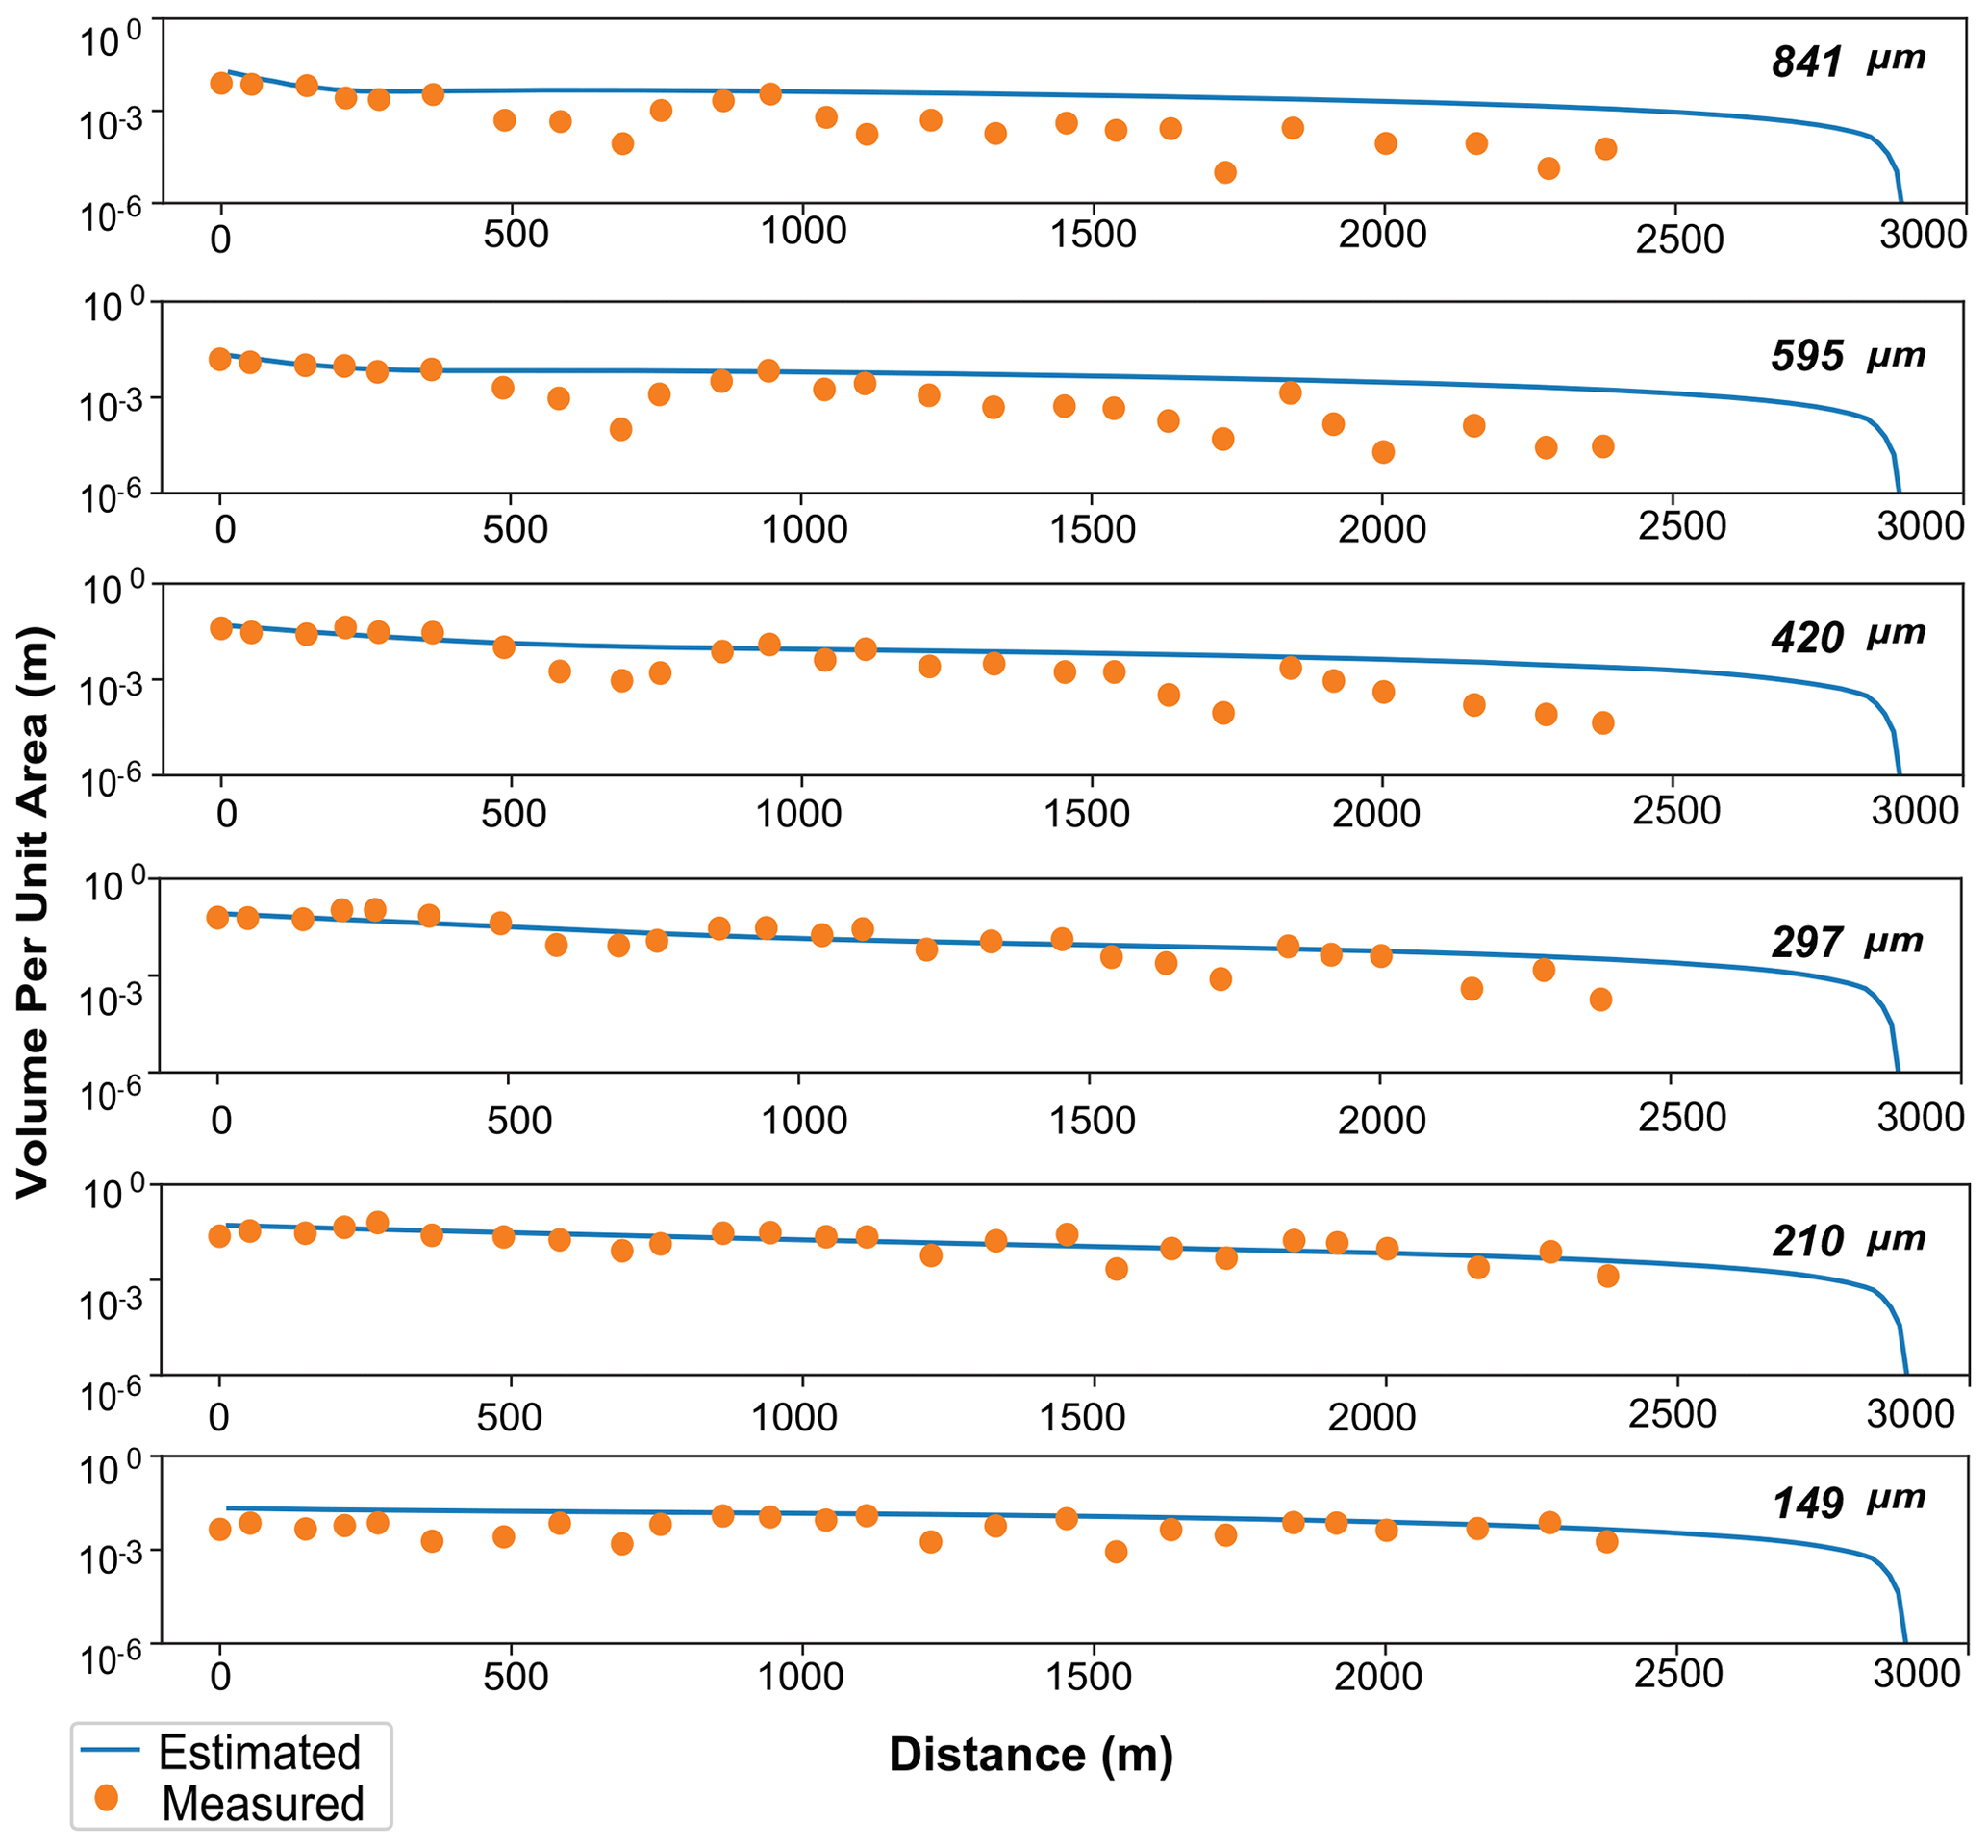
Figure 8Spatial distribution of the volume per unit area of five grain-size classes. Solid circles indicate the values measured from the study area at Odaka, and lines indicate the results of the forward model calculation obtained using parameters predicted by the DNN inverse model.
Using the reconstructed flow conditions of the tsunami by the DNN inverse model, the forward model was used to calculate the spatial distribution of the thickness and grain-size composition, and the measured distribution was compared with the calculated distribution. Figure 8 shows the volume per unit area and the grain-size distribution of measured and estimated values. The measured volume values per unit area for each grain-size class matched the predicted results for all grain-size classes.
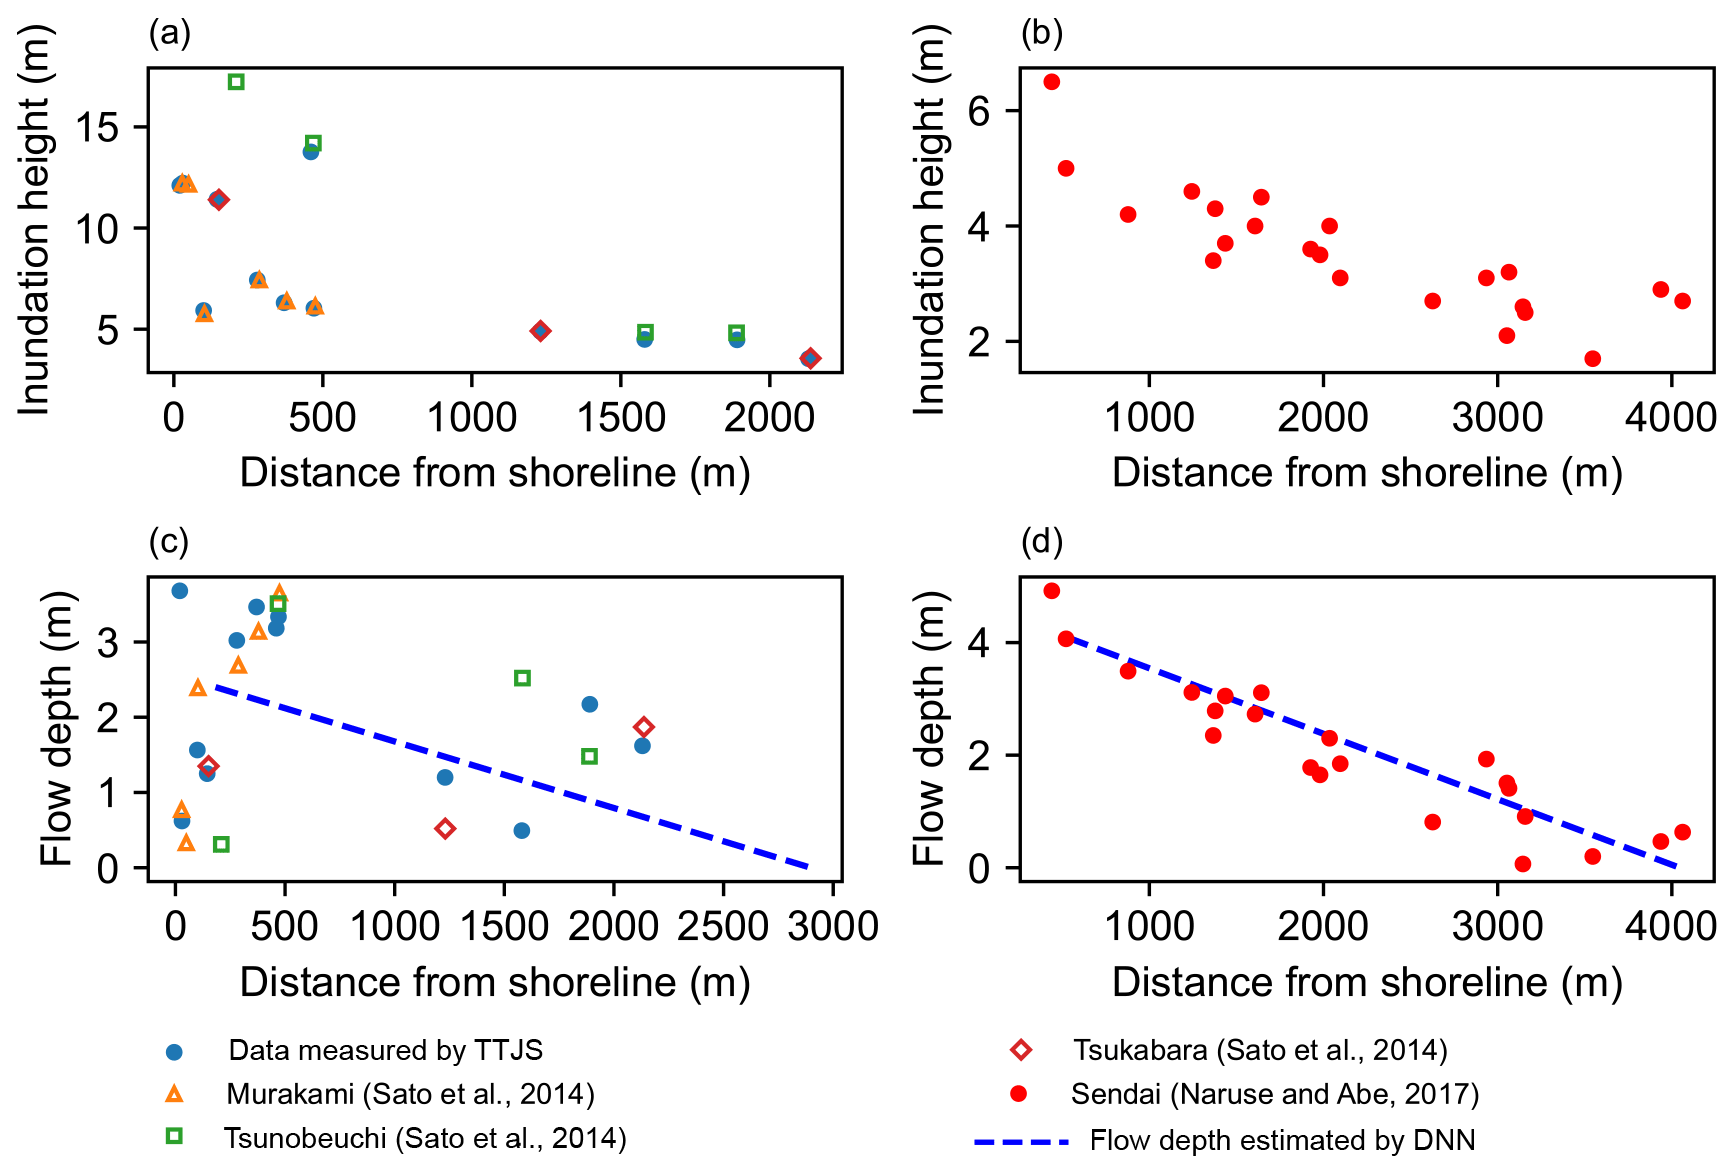
Figure 9Measured maximum inundation heights and flow depths in the Odaka and Sendai regions. Data were measured by TTJS group (Mori et al., 2011), Sato et al. (2014), and Naruse and Abe (2017). (a) Maximum inundation heights measured in neighboring areas of the study sites (Fig. 1c). (b) Maximum inundation heights measured in Sendai Plain (Naruse and Abe, 2017). (c) The flow depth measured in neighboring areas of the study sites (Fig. 1c). The flow depth reconstructed by DNN is marked by the dashed blue line. (d) The flow depth measured in Sendai Plain (Naruse and Abe, 2017). The flow depth reconstructed by DNN is marked by the dashed blue line (Mitra et al., 2020).
5.1 Verification of the tsunami characteristics reconstructed by the DNN inverse model with measurements
To verify our results, we compared the maximum flow depth reconstructed by the DNN inverse model with the measured values by TTJS group and Sato et al. (2014) (Fig. 9a and b). The locations measured by the TTJS group widely covered the study area (Fig. 2a). Sato et al. (2014) surveyed the surrounding areas around our field location: Murakami, Tsunobeuchi, and Tsukabara. The Murakami and Tsunobeuchi areas are approximately 870 m and 1600 m south, respectively, from the transect of this study, whereas Tsukabara is approximately 1560 m north from our field location. Sato et al. (2012b) measured the inundation height using mudlines and damage marks on the artificial structures and trees. TTJS group also measured the height using watermarks soon after the event and before anthropogenic disturbances occurred from recovery. Figure 9a shows that the value of the predicted maximum flow depth approximated the average of the measured flow depth around Tsunobeuchi, Murakami, and Tsukabara, where the variability in the measured values was extremely large around the surveyed field locations of the study area (Fig. 2a). In contrast, the reconstructed maximum inundation distance was 2897 ± 91.1 m, which was close to the observed extent of tsunami propagation that was around 2818 m. Thus, although there was large variability in the measured values of the inundation depth, the reconstructed results approximately reproduced the measured values.
Regarding the flow velocity, the estimated velocity by the DNN inverse model was 12.1 m s−1, which was higher compared to the reconstruction in the Sendai Plain (Mitra et al., 2020). The flow velocities of the 2011 Tohoku-oki tsunami run-up flow were measured at 4.2 m s−1 on average, ranging from 1.9 to 6.9 m s−1 from the aerial video records of the Sendai Plain (Hayashi and Koshimura, 2013). In the 2004 Indian Ocean tsunami, flow velocities of 6–8 m s−1 in the Khao Lak area, 3–4 m s−1 at Kamala Beach, 4 m s−1 at Phuket, and 9 m s−1 at Khao Lak were observed (Rossetto et al., 2007; Karlsson et al., 2009; Szczuciński et al., 2012). The velocity measured from the survivors' videos of the 26 December 2004 Indian Ocean tsunami at Banda Aceh, Indonesia, was in the range of 2–5 m s−1 (Fritz et al., 2006).
No direct observations of the flow velocity were made in this study area; however, the velocity was comparable with the values reported near the study area. Sanuki et al. (2013) used video footage analysis around the mouth of the Kido River, which is located 30 km south of the field location of this study but along the Joban coastline. They reported that the inundation flow was 11–14 m s−1 inside the river channel, whereas it was around 10–15 m s−1 in the coastal plain. Moreover, Sato et al. (2014) estimated that the overtopping flow on the seawall crown reached 11–17 m s−1 in velocity at the Idagawa area, which is located approximately 3 km south of the study area, based on the Bernoulli theorem. Hence, the reconstruction of the flow velocity by the DNN inverse model is conformable in values measured on the Joban Coast, suggesting that the exceptionally high flow velocity occurred in this area.
As a study of an area adjacent to this study area, our results are comparable with those estimated by Iijima et al. (2021). The forward model employed in this study approximates the behavior of tsunami inundation flows by two stages: the stage in which deposition occurs while the flooding current is flowing and the stage in which deposition occurs gradually after the flow has ceased (Naruse and Abe, 2017). The velocity of the actual tsunami inundation flow temporarily varies and is known to be very fast at the beginning but to decay rapidly. From past studies, the velocity in the first stage estimated in this study approximately reproduces the initial rapid inundation velocity of the actual tsunami inundation flow (Naruse and Abe, 2017; Mitra et al., 2020, 2021a). Iijima et al. (2021) performed numerical simulations for an area approximately 1 km south of this study area and estimated that the inundation flow velocity in the coastal area (0.1 km from the levee) was 8.1 m s−1 at its maximum. In addition, their calculations estimated a flow behavior in which the flooded flow rapidly decelerates inland (4.0 m s−1) and then accelerates again to 8.3 m s−1. Although these velocity values are relatively smaller than those estimated as the first-stage velocity in this study, their results also support our assumption that the flow in this area was faster than the tsunami inundation flow measured in the Sendai Plain. The large spatial variation in velocity in their reconstructions is probably due to the presence of artificial structures (roads) in the study area. While the flow slowed down significantly when overcoming the unevenness, the study area is a flat area with fields (Fig. 1), so it is predicted that the inundation flow did not slow down and the area was inundated at high speed.
It should be noted, however, that their perspective on the research approach differs from that of this study because Iijima et al. (2021) performed tsunami inundation calculations using a forward model according to an existing fault model. Although they conducted a field survey of the sediments, they did not estimate the flow conditions from the sediments by inverse analysis. Even if the fault model is correct, tsunami inundation predictions by forward modeling are not always accurate due to local topography and model assumptions. This study provides new information on the behavior of tsunami inundation flows to the Joban coastal area from a new perspective of tsunami deposit inversion.
5.2 Influence of inundation by Froude supercritical flows
The reconstructed tsunami characteristics in the Odaka region using the DNN inverse model suggested that the type of inundation flow was a Froude supercritical condition. Here, the Froude number is defined as Fr = , which represents the ratio of inertia to gravity forces. U denotes the layer-averaged flow velocity as defined above. The parameters g and h are the gravitational acceleration and flow depth, respectively. The DNN inverse model for the Joban Coast suggested that the flow velocity U and the depth h are 12.1 m s−1 and 2.4 m, respectively, with the result that Fr is 2.5 (Table 1). This Fr value clearly indicates that the flow condition in the study area was the supercritical condition (). On the other hand, for the 2011 Tohoku-oki tsunami in the Sendai Plain, the flow velocity and depth were 5.4 m s−1 and 4.1 m, respectively, in the reconstruction by Mitra et al. (2020), indicating that the flow type was subcritical ().
In general, Fr<1 indicates subcritical flows (Fr<1) that are relatively slow in velocity or thick in flow depth, and the water surfaces of the subcritical flows are flat and stable. The undulation of a subcritical flow surface exhibits an out-of-phase relationship with the shape of topography. In contrast, Fr>1 indicates supercritical flows (Fr>1), which behave as a rapid or thin and unstable flow (Charvet et al., 2017), with low flow resistance and high sediment transport (Phantuwongraj and Choowong, 2012). A higher flow velocity with a lower flow depth is the main characteristic of a supercritical flow, and in some cases, a supercritical flow can result in a hydraulic jump that causes the local dissipation of high flow energy (Muste and Hoitink, 2017; Retsinis and Papanicolaou, 2020). The water surfaces of supercritical flows exhibit an in-phase relationship with the topography, and the shape of the flow surface shows a large fluctuation that emphasizes the shape of the bottom surface. Therefore, if the tsunami inundated the area as a supercritical flow, the flow depth could be high locally because of topographic influences.
The inundation flows of large-scale tsunamis, such as the 2004 Indian Ocean tsunami, have been observed, and other tsunamis show that the tsunami inundation flow can be subcritical or supercritical, with the range of the reported Froude number varying from 0.7 to 2.0, depending on the place (Matsutomi et al., 2005). Choowong et al. (2008) report that deposits of the 2004 Indian Ocean tsunami indicate cross-lamination of anti-dunes as a supercritical flow condition, and this flow regime was dominant during the inflow. The occurrence of anti-dunes at the Andaman coast of Thailand suggested a supercritical flow condition at the depositional area, and the bed maintains an in-phase relationship with the free water surface (Simons et al., 1965; Middleton and Hampton, 1973; Kennedy, 1963). Thus, judging from the sedimentary structure, the supercritical flow condition was maintained in this area during the inundation of the tsunami.
Hayashi and Koshimura (2013) measured the velocity of the 2011 Tohoku-oki tsunami in the Sendai Plain from the video records and reported that the 2011 Tohoku-oki tsunami was a supercritical flow in the area close to the coast. However, when they calculated the Froude number, the flow thickness was set to only 1 or 2 m because they were interested in the behavior of the frontal part of the inundation flow. Nevertheless, the Froude number of the tsunami inundation flow exceeded unity in the Sendai Plain only up to 1200 m from the shoreline. Considering that the central part of the flow reached a depth of 3–4 m, the Froude number is half of the value for the 1 m depth setting, indicating that the tsunami inundation flow was Froude subcritical in most of the area in the Sendai Plain (Hayashi and Koshimura, 2013).
The difference in flow conditions between Odaka and Sendai is shown clearly in the measurements of inundation heights. Figure 2a indicates that the measured inundation heights fluctuate largely along the transect at Odaka, compared with those at Sendai (Fig. 2b). This difference can be interpreted as the result of supercritical flow conditions with topographical complexities in the Odaka region. Since the inundation flow was presumably subcritical in the Sendai Plain, the water surface would have been stable even if there were local topographic changes. In the Odaka region, the water surface of the inundation flow fluctuated largely in response to local topographic variations because of its Froude supercritical condition. The inundation heights also varied to a great extent, such as in Idagawa, where they were exceptionally high (Sato et al., 2014).
Other possible reasons for local fluctuations in flow depths could be the formation of hydraulic jumps, particularly in the Odaka region. The fluctuations in the tsunami inundation depths in the Odaka region in the Minamisoma area could be due to the presence of a lagoon in that area, which caused the transition from a supercritical to a subcritical flow resulting in a hydraulic jump (Matsutomi et al., 2001; Yamaguchi and Sekiguchi, 2015; Ali Hasan Muhammad and Tanaka, 2019).
The reason for the significant differences in tsunami characteristics between Odaka and Sendai has not been determined yet, but several possibilities may explain it. First, it could be due to the steeper offshore bathymetry in the Odaka region than that in the Sendai Plain (Tsuruta et al., 2017; Ikehara et al., 2014; Abe et al., 2012) and the convex-shaped shoreline, which possibly decreased tsunami energy dissipation (Sato et al., 2014). In contrast, the offshore bathymetry of the Sendai Plain is gentle, and the possible reason for the subcritical flow in the Sendai Plain could be the presence of a coastal forest, which reduced the flow velocity significantly (Kusumoto et al., 2020). In some cases, the flow velocity becomes extremely high behind the coastal dikes near the shoreline, and the energy decreases gradually due to different obstacles along the way (Sugawara, 2020). However, in the case of Odaka or the Joban Coast the supercritical flow has been observed in the depositional area, similar to the Andaman coast in Thailand (Choowong et al., 2008).
In this study, we reconstructed the flow conditions, such as the maximum inundation distance, flow velocity, maximum flow depth, and sediment concentration, of the 2011 Tohoku-oki tsunami, around the Odaka region, Minamisoma, on the Joban Coast. Despite having a complex topography, the DNN inverse model successfully predicted the flow conditions of the tsunami. The maximum inundation distance was 2897 ± 91.1 m, close to the observed extent of 2818 m by field investigations. The flow velocity was 12.1 ± 0.4 m s−1, similar to the values reported from the video image analysis and numerical simulation results by different researchers. The maximum flow depth was 2.4 ± 0.1 m, which also matched the reported measured values of the maximum flow depth around the field study area. The flow condition along the transect was determined to be supercritical based on the results of the DNN inverse model, and the reason behind that might be the topographical undulations or a hydraulic jump. The fact that different flow characteristics of the 2011 Tohoku-oki tsunami varied depending on the location is the key feature of this study. Thus, the DNN model involves a reasonable inverse analysis for different locations despite having complex topography, and this model can be used as a tool for tsunami hazard mitigation and disaster management.
Our study incorporates the flow-type characterization phenomenon along with the reconstruction of the tsunami flow conditions for the area. Especially for the Odaka region, it showed high flow velocity with shallow flow depth, which is a typical phenomenon of a supercritical flow type. However, a detailed investigation of such a high flow velocity around the Joban Coast must be conducted in future studies, as supercritical flows with hydraulic jumps can cause extensive damage to artificial structures and livelihoods. For future studies, there is a need for considerable research on the influence of supercritical inundation flows of tsunamis in coastal areas.
After training the model, using the test datasets, the deviation of the predicted values from the original values was plotted on a histogram to check the model performance. There was no large bias except the maximum flow depth, which showed that the predicted values for this parameter were approximately 0.4 m lower than the input values.
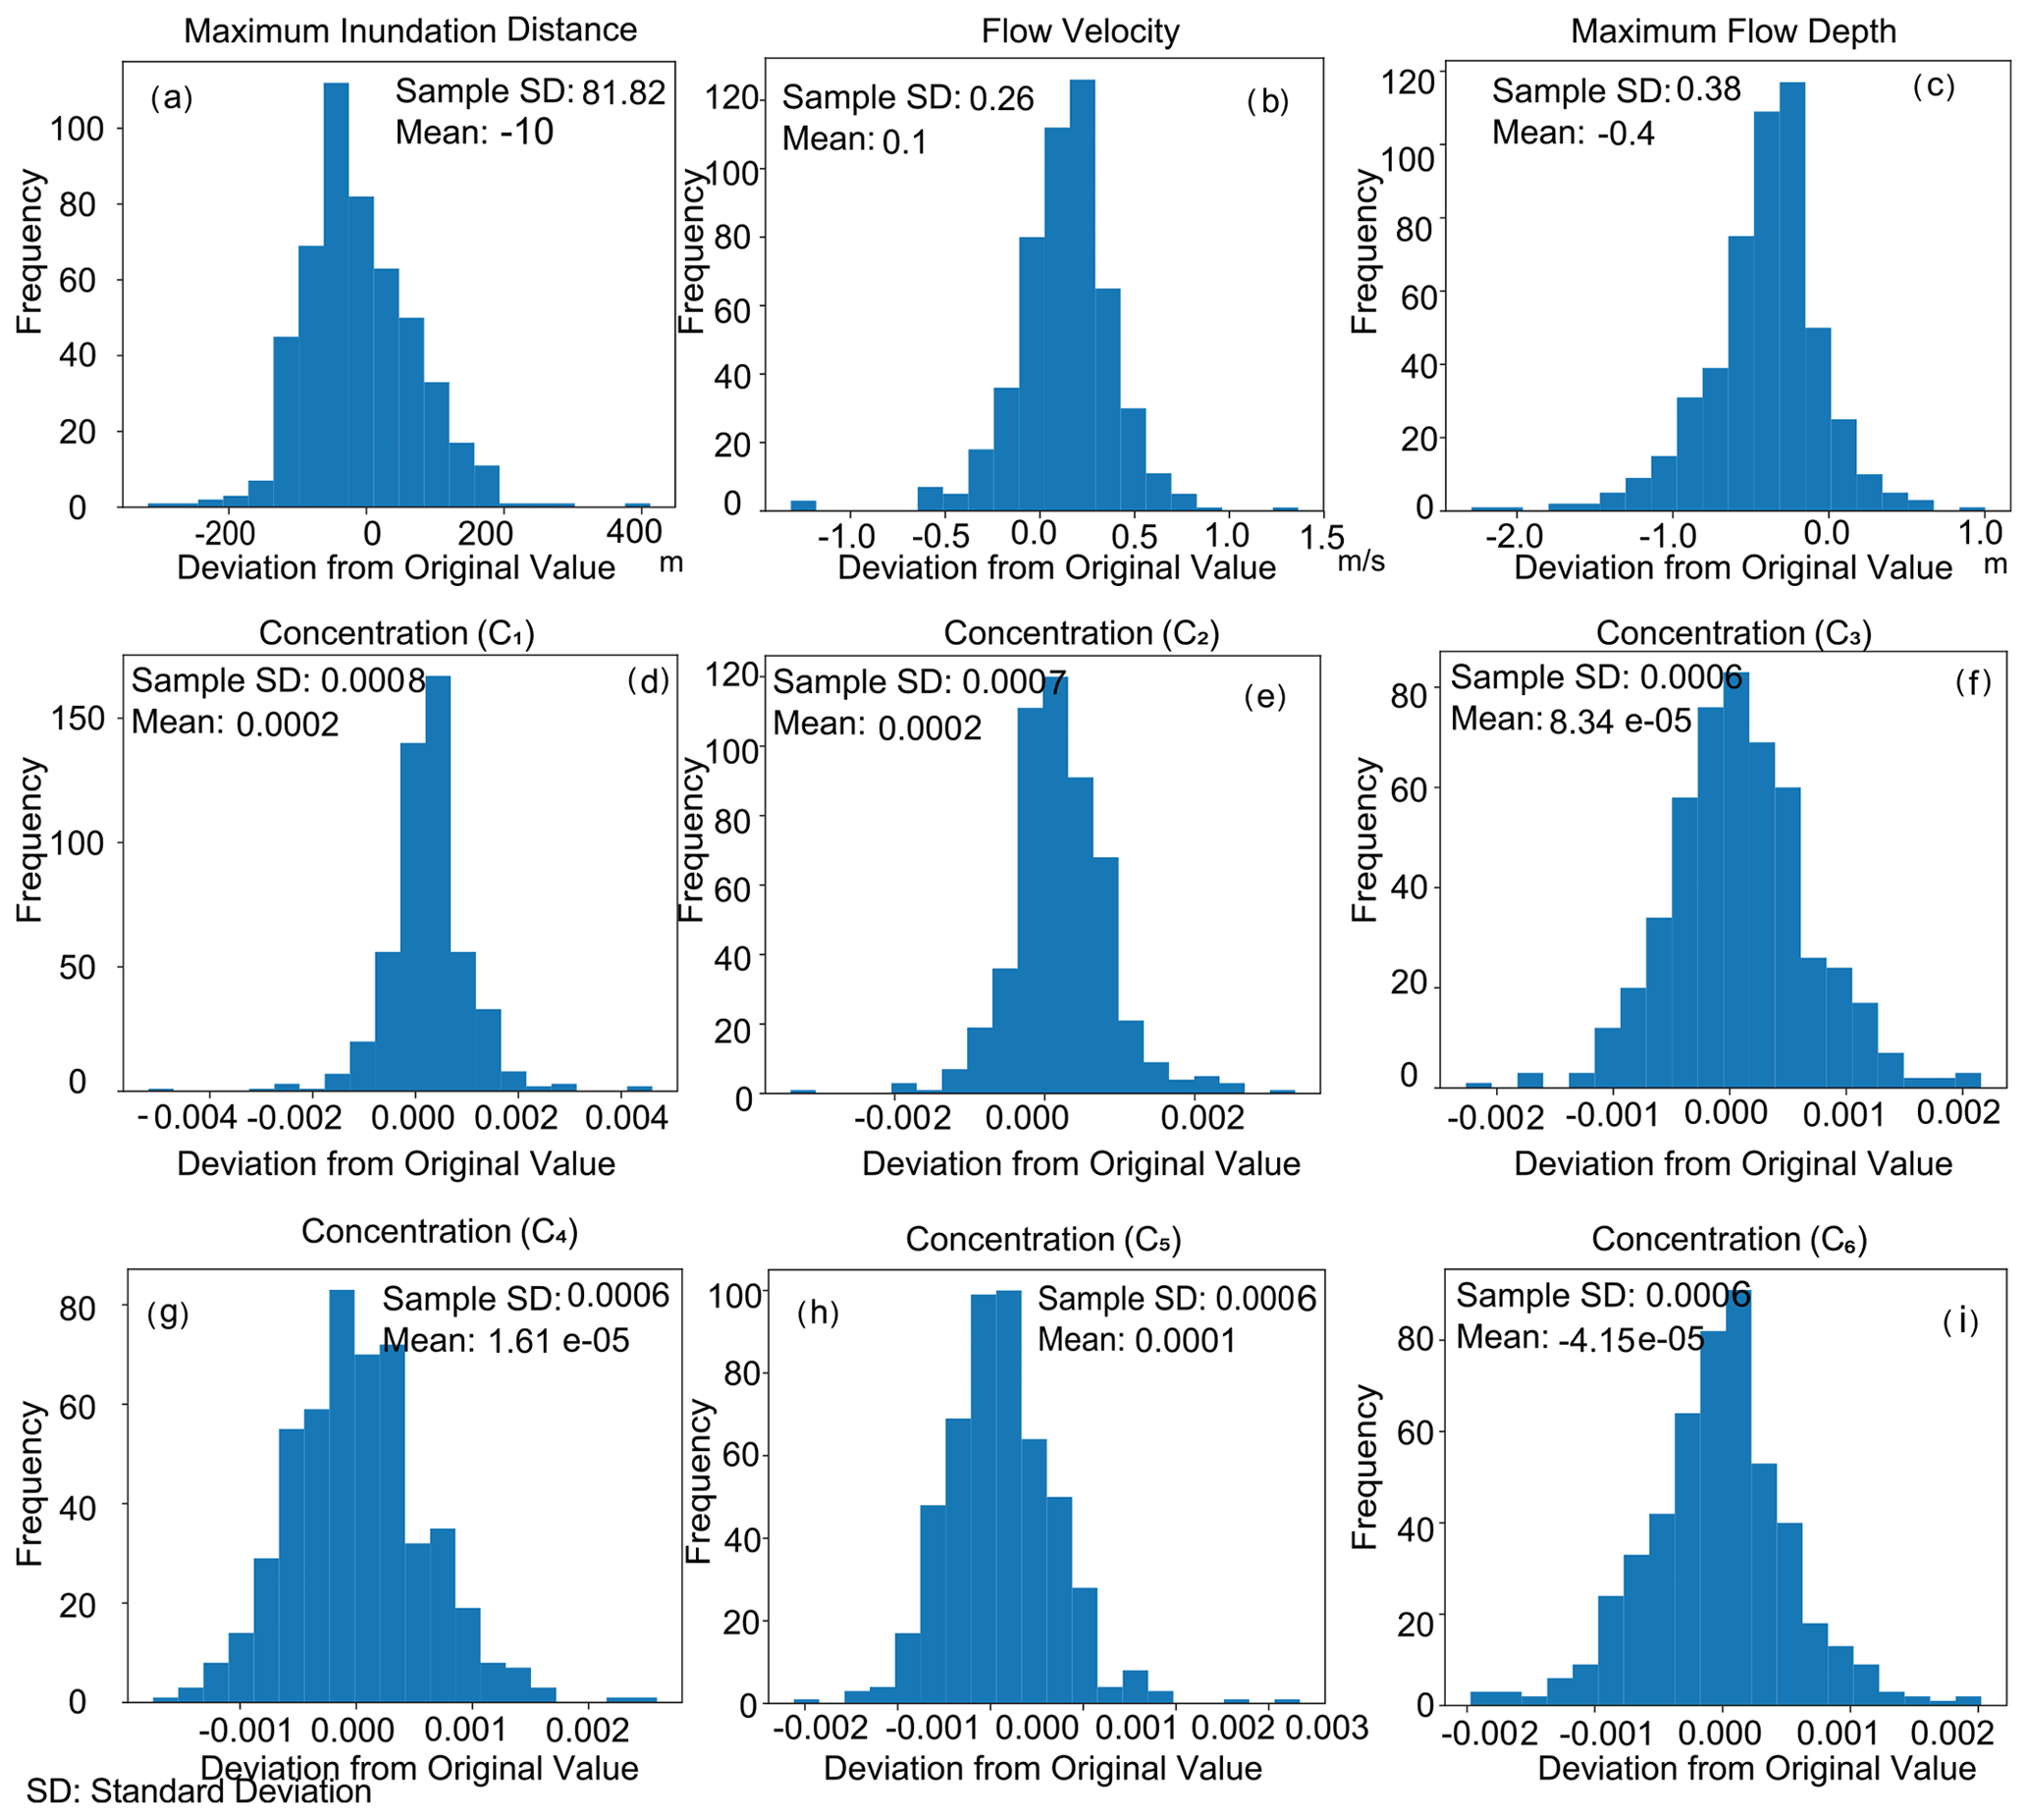
Figure A1Histograms showing the deviation of the predicted results from the original values of the artificial test datasets.
All codes and data employed in this study have been deposited in the Zenodo repository, accessible via DOI https://doi.org/10.5281/zenodo.4764153. Other information is available in Mitra et al. (2021b). Supplementary figures are also available in the Zenodo repository with DOI https://doi.org/10.5281/zenodo.10027887 (Mitra et al., 2023).
The supplement related to this article is available online at: https://doi.org/10.5194/nhess-24-429-2024-supplement.
RM: methodology, software, writing, and field observation. HN: conceptualization, methodology, software, writing, reviewing, and editing. TA: field survey, description of deposits, sampling, and grain-size analysis.
The contact author has declared that none of the authors has any competing interests.
Publisher's note: Copernicus Publications remains neutral with regard to jurisdictional claims made in the text, published maps, institutional affiliations, or any other geographical representation in this paper. While Copernicus Publications makes every effort to include appropriate place names, the final responsibility lies with the authors.
We thank the Sediment Dynamics Research Consortium (sponsored by INPEX, JOGMEC, JX Nippon Oil and Gas Exploration Corporation, JAPEX), Advanced Industrial Science and Technology (AIST), Japan, for the funding. We also thank the Ministry of Education, Culture, Sports, Science and Technology, Japan, for providing the permission and scholarship for conducting this collaborative research in Japan. We acknowledge Kazuki Kikuchi, a post-doctoral fellow of Kyoto University, for performing the grain-size analysis of the sediments from the tsunami deposits from the Odaka region.
This research has been supported by the JSPS KAKENHI Grants-in-Aid for Scientific Research (B) (grant no. 20H01985) and the Sediment Dynamics Research Consortium (grant no. 200180500003).
This paper was edited by Rachid Omira and reviewed by Masaki Yamada and one anonymous referee.
Abe, T., Goto, K., and Sugawara, D.: Relationship between the maximum extent of tsunami sand and the inundation limit of the 2011 Tohoku-oki tsunami on the Sendai Plain, Japan, Sediment. Geol., 282, 142–150, https://doi.org/10.1016/j.sedgeo.2012.05.004, 2012. a, b
Ali Hasan Muhammad, R. and Tanaka, N.: Energy reduction of a tsunami current through a hybrid defense system comprising a sea embankment followed by a coastal forest, Geosci., 9, 247, https://doi.org/10.3390/geosciences9060247, 2019. a
Charvet, I., Macabuag, J., and Rossetto, T.: Estimating tsunamiinduced building damage through fragility functions: critical review and research needs, Front. Built Environ., 3, 36, 2017. a
Choowong, M., Murakoshi, N., Hisada, K. I., Charusiri, P., Charoentitirat, T., Chutakositkanon, V., Jankaew, K., Kanjanapayont, P., and Phantuwongraj, S.: 2004 Indian Ocean tsunami inflow and outflow at Phuket, Thailand, Mar. Geol., 248, 179–192, https://doi.org/10.1016/j.margeo.2007.10.011, 2008. a, b
Fritz, H. M., Borrero, J. C., Synolakis, C. E., and Yoo, J.: 2004 Indian Ocean tsunami flow velocity measurements from survivor videos, Geophys. Res. Lett., 33, https://doi.org/10.1029/2006GL026784, 2006. a
Hayashi, S. and Koshimura, S.: The 2011 Tohoku tsunami flow velocity estimation by the aerial video analysis and numerical modeling, Journal of Disaster Research, 8, 561–572, https://doi.org/10.20965/jdr.2013.p0561, 2013. a, b, c, d, e
Hirano, M.: River bed degradation with armoring, Proceedings of Japan Society of Civil Engineers, 55–65, 1971. a, b
Iijima, Y., Goto, K., Sugawara, D., and Abe, T.: Effect of artificial structures on the formation process of the 2011 Tohoku-oki tsunami deposits, Sediment. Geol., 423, 105978, https://doi.org/10.1016/j.sedgeo.2021.105978, 2021. a, b, c, d, e
Ikehara, K., Irino, T., Usami, K., Jenkins, R., Omura, A., and Ashi, J.: Possible submarine tsunami deposits on the outer shelf of Sendai Bay, Japan resulting from the 2011 earthquake and tsunami off the Pacific coast of Tohoku, Mar. Geol., 358, 120–127, https://doi.org/10.1016/j.margeo.2014.11.004, 2014. a
Jaffe, B. E., Goto, K., Sugawara, D., Richmond, B. M., Fujino, S., and Nishimura, Y.: Flow speed estimated by inverse modeling of sandy tsunami deposits: results from the 11 March 2011 tsunami on the coastal plain near the Sendai Airport, Honshu, Japan, Sediment. Geol., 282, 90–109, https://doi.org/10.1016/j.sedgeo.2012.09.002, 2012. a
Johnson, J. P., Delbecq, K., Kim, W., and Mohrig, D.: Experimental tsunami deposits: Linking hydrodynamics to sediment entrainment, advection lengths and downstream fining, Geomorphology, 253, 478–490, https://doi.org/10.1016/j.geomorph.2015.11.004, 2016. a
Karlsson, M. J., Skelton, A., Sanden, M., Ioualalen, M., Kaewbanjak, N., Pophet, N., Asavanant, J., and von Matern, A.: Reconstructions of the coastal impact of the 2004 Indian Ocean tsunami in the Khao Lak area, Thailand, J. Geophys. Res.-Oceans, 114, C10023, https://doi.org/10.1029/2009JC005516, 2009. a
Kennedy, J. F.: The mechanics of dunes and antidunes in erodible-bed channels, J. Fluid Mech., 16, 521–544, https://doi.org/10.1017/S0022112063000975, 1963. a
Koff, G., Borsukova, O., Popova, O., and Sidorin, A. Y.: On the causes of the great damage from the tsunami of March 11, 2011 on the northeast coast of Honshu Island, Seismic Instruments, 48, 105–123, https://doi.org/10.3103/S0747923912020053, 2012. a, b, c
Kusumoto, S., Imai, K., Gusman, A. R., and Satake, K.: Reduction effect of tsunami sediment transport by a coastal forest: Numerical simulation of the 2011 Tohoku tsunami on the Sendai Plain, Japan, Sediment. Geol., 407, 105740, https://doi.org/10.1016/j.sedgeo.2020.105740, 2020. a
Li, L., Qiu, Q., and Huang, Z.: Numerical modeling of the morphological change in Lhok Nga, west Banda Aceh, during the 2004 Indian Ocean tsunami: understanding tsunami deposits using a forward modeling method, Nat. Hazards, 64, 1549–1574, https://doi.org/10.1007/s11069-012-0325-z, 2012. a
Matsutomi, H., Shuto, N., Imamura, F., and Takahashi, T.: Field survey of the 1996 Irian Jaya earthquake tsunami in Biak Island, Nat. Hazards, 24, 199–212, https://doi.org/10.1023/A:1012042222880, 2001. a
Matsutomi, H., Sakakiyama, T., Tsuji, Y., Tanioka, Y., Nishimura, Y., Kamataki, T., Murakami, Y., Matsuyama, M., and Kurizuka, K.: Challenges from the perspective of the 2004 Indian Ocean tsunami and damage estimates in and around Banda Aceh, Coastal Engineering Treatises, 52, 1366–1370, ISSN 9167897, 2005. a
Middleton, G. V. and Hampton, M. A.: Sediment Gravity Flows: Mechanics of Flow and Deposition, in Turbidites and Deep-Water Sedimentation, Soc. Econ. Paleont. Miner. (Pacific Sect.), Short Course Lect. Notes, 1–38, 1973. a
Mimura, N., Yasuhara, K., Kawagoe, S., Yokoki, H., and Kazama, S.: Damage from the Great East Japan Earthquake and Tsunami-a quick report, Mitig. Adapt. Strat. Gl., 16, 803–818, https://doi.org/10.1007/s11027-011-9297-7, 2011. a
Mitra, R., Naruse, H., and Abe, T.: Estimation of Tsunami Characteristics from Deposits: Inverse Modeling using a Deep-Learning Neural Network, J. Geophys. Res.-Earth, 125, e2020JF005583, https://doi.org/10.1029/2020JF005583, 2020. a, b, c, d, e, f, g, h, i, j, k, l, m
Mitra, R., Naruse, H., and Fujino, S.: Reconstruction of flow conditions from 2004 Indian Ocean tsunami deposits at the Phra Thong island using a deep neural network inverse model, Nat. Hazards Earth Syst. Sci., 21, 1667–1683, https://doi.org/10.5194/nhess-21-1667-2021, 2021a. a, b, c, d, e, f, g
Mitra, R., Naruse, H., and Abe, T.: Odaka_DNN_inverse_2011_tsunami: DNN inverse model for 2011 Tohoku-oki tsunami at Odaka, Japan, Zenodo [data sets], https://doi.org/10.5281/zenodo.4764153, 2021b. a
Mitra, R., Naruse, H., and Abe, T.: Columnar sections and field photographs, Zenodo [data set], https://doi.org/10.5281/zenodo.10027887, 2023. a
Mori, N., Takahashi, T., Yasuda, T., and Yanagisawa, H.: Survey of 2011 Tohoku earthquake tsunami inundation and run-up, Geophys. Res. Lett., 38, 7, https://doi.org/10.1029/2011GL049210, 2011. a, b
Muste, M. and Hoitink, T.: Measuring flood discharge, Oxford Research Encyclopedia of Natural Hazard Science, Oxford University Press, Oxford, UK, https://doi.org/10.1093/acrefore/9780199389407.013.121, 2017. a
Naruse, H.: Usage and advantages of an application program “STube” for settling tube grain-size analysis, Journal of the Sedimentological Society of Japan, 62, 55–61, https://doi.org/10.4096/jssj1995.62.55, 2005. a
Naruse, H. and Abe, T.: Inverse Tsunami Flow Modeling Including Nonequilibrium Sediment Transport, With Application to Deposits From the 2011 Tohoku-Oki Tsunami, J. Geophys. Res.-Earth, 122, 2159–2182, https://doi.org/10.1002/2017JF004226, 2017. a, b, c, d, e, f, g, h, i, j, k, l
Naruse, H., Arai, K., Matsumoto, D., Takahashi, H., Yamashita, S., Tanaka, G., and Murayama, M.: Sedimentary features observed in the tsunami deposits at Rikuzentakata City, Sediment. Geol., 282, 199–215, https://doi.org/10.1016/j.sedgeo.2012.08.012, 2012. a, b
Phantuwongraj, S. and Choowong, M.: Tsunamis versus storm deposits from Thailand, Nat. Hazards, 63, 31–50, https://doi.org/10.1007/s11069-011-9717-8, 2012. a
Qi, Z., Eames, I., and Johnson, E. R.: Force acting on a square cylinder fixed in a free-surface channel flow, J. Fluid Mech., 756, 716–727, https://doi.org/10.1017/jfm.2014.455, 2014. a
Retsinis, E. and Papanicolaou, P.: Numerical and Experimental Study of Classical Hydraulic Jump, Water, 12, 1766, https://doi.org/10.3390/w12061766, 2020. a
Rossetto, T., Peiris, N., Pomonis, A., Wilkinson, S., Del Re, D., Koo, R., and Gallocher, S.: The Indian Ocean tsunami of December 26, 2004: observations in Sri Lanka and Thailand, Nat. Hazards, 42, 105–124, https://doi.org/10.1007/s11069-006-9064-3, 2007. a
Sakakiyama, T.: Tsunami pressure on structures due to tsunami inundation flow, Coastal Eng. Proc., 1, 42, 2014. a
Sanuki, H., Takemori, R., Tajima, Y., and Sato, S.: Study on tsunami flooding in river based on video images and numerical simulation, Proceedings of Coastal Engineering, JSCE, 69, 196–200, https://doi.org/10.2208/kaigan.69.I_196, 2013. a, b, c, d
Sato, S., Liu, H., Takewaka, S., Nobuoka, H., and Aoki, S.-i.: Tsunami damages of Nakoso Coast due to the 2011 Tohoku Tsunami, Coast. Eng. Proc., 1, 33, https://doi.org/10.9753/icce.v33.currents.2, 2012a. a
Sato, S., Mizuhashi, K., Yeh, H., Isobe, M., Aizawa, H., and Ashino, H.: Coastal and nearshore behaviors of the 2011 Tohoku Tsunami along the central Fukushima Coast, Doboku Gakkai Ronbunshu B2, Kaigan Kogaku (Online), 68, 1–346, https://doi.org/10.2208/kaigan.68.I_346, 2012b. a, b
Sato, S., Okayasu, A., Yeh, H., Fritz, H. M., Tajima, Y., and Shimozono, T.: Delayed survey of the 2011 Tohoku Tsunami in the former exclusion zone in Minami-Soma, Fukushima Prefecture, Pure Appl. Geophys., 171, 3229–3240, https://doi.org/10.1007/s00024-014-0809-8, 2014. a, b, c, d, e, f, g, h, i, j, k, l, m, n, o
Sawai, Y., Namegaya, Y., Okamura, Y., Satake, K., and Shishikura, M.: Challenges of anticipating the 2011 Tohoku earthquake and tsunami using coastal geology, Geophys. Res. Lett., 39, 21, https://doi.org/10.1029/2012GL053692, 2012. a
Shuto, N.: Tsunami hazard mitigation, P. Jpn. Acad. B-Phys., 95, 151–164, https://doi.org/10.2183/pjab.95.012, 2019. a
Simons, D. B., Richardson, E., and Nordin Jr., C.: Sedimentary structures generated by flow in alluvial channels, Primary Sedimentary Structures and Their Hydrodynamic Interpretation, SEPM Spec. Publ., https://doi.org/10.2110/pec.65.08.0034, 1965. a
Sugawara, D.: Trigger mechanisms and hydrodynamics of tsunamis, Geological Records of Tsunamis and Other Extreme Waves, Elsevier, 47–73, https://doi.org/10.1016/B978-0-12-815686-5.00004-3, 2020. a
Sugawara, D. and Goto, K.: Numerical modeling of the 2011 Tohoku-oki tsunami in the offshore and onshore of Sendai Plain, Japan, Sediment. Geol., 282, 110–123, https://doi.org/10.1016/j.sedgeo.2012.08.002, 2012. a
Szczuciński, W., Rachlewicz, G., Chaimanee, N., Saisuttichai, D., Tepsuwan, T., and Lorenc, S.: 26 December 2004 tsunami deposits left in areas of various tsunami run up in coastal zone of Thailand, Earth Planets Space, 64, 843–858, https://doi.org/10.5047/eps.2012.07.007, 2012. a
Tsuruta, T., Harada, H., Misonou, T., Matsuoka, T., and Hodotsuka, Y.: Horizontal and vertical distributions of 137Cs in seabed sediments around the river mouth near Fukushima Daiichi Nuclear Power Plant, J. Oceanogr., 73, 547–558, https://doi.org/10.1007/s10872-017-0439-8, 2017. a, b
Yamaguchi, N. and Sekiguchi, T.: Effects of tsunami magnitude and terrestrial topography on sedimentary processes and distribution of tsunami deposits in flume experiments, Sediment. Geol., 328, 115–121, https://doi.org/10.1016/j.sedgeo.2015.08.008, 2015. a
Yoshii, T., Tanaka, S., and Matsuyama, M.: Tsunami inundation, sediment transport, and deposition process of tsunami deposits on coastal lowland inferred from the Tsunami Sand Transport Laboratory Experiment (TSTLE), Mar. Geol., 400, 107–118, https://doi.org/10.1016/j.margeo.2018.03.007, 2018. a
- Abstract
- Introduction
- Topographic setting and tsunami characteristics in study area
- Methodology
- Results
- Discussion
- Conclusions
- Appendix A: Test of the inverse model using the artificial datasets
- Code and data availability
- Author contributions
- Competing interests
- Disclaimer
- Acknowledgements
- Financial support
- Review statement
- References
- Supplement