the Creative Commons Attribution 4.0 License.
the Creative Commons Attribution 4.0 License.
Regional modelling of extreme sea levels induced by hurricanes
Alisée A. Chaigneau
Melisa Menéndez
Marta Ramírez-Pérez
Alexandra Toimil
Coastal zones are increasingly threatened by extreme sea level events, with storm surges being among the most hazardous components, especially in regions prone to tropical cyclones. This study aims to explore the factors influencing the performance of numerical models in simulating storm surges in the tropical Atlantic region. The maxima, durations, and time evolutions of extreme storm surge events are evaluated for four historical hurricanes against tide gauge records. The Advanced Circulation (ADCIRC) and Nucleus for European Modelling of the Ocean (NEMO) ocean models are compared using similar configurations in terms of domain, bathymetry, and spatial resolution. These models are then used to perform sensitivity experiments on oceanic and atmospheric forcings, physical parameterizations of wind stress, and baroclinic/barotropic modes. NEMO and ADCIRC demonstrate similar abilities in simulating storm surges induced by hurricanes. Storm surges simulated with ERA5 atmospheric reanalysis forcing are generally more accurate than those simulated with parametric wind models for the simulated hurricanes. The inclusion of baroclinic processes improves storm surge amplitudes at some coastal locations, such as along the southeastern Florida peninsula (USA). However, experiments exploring different implementations of wind stress and interactions among storm surges, tides, and mean sea level have shown minimal impacts on hurricane-induced storm surges.
- Article
(11033 KB) - Full-text XML
- BibTeX
- EndNote
Coastal zones are among the most densely populated and urbanized areas in the world. A total of 10 % of the global population lives in low-lying coastal regions, with 35 million people living in North America, Central America, and the Caribbean region (Neumann et al., 2015; McMichael et al., 2020). These regions are increasingly threatened by extreme sea levels, during which major damage to the waterfront and infrastructure is likely to occur (Hicke et al., 2022; Castellanos et al., 2022).
Table 1Information about the selected hurricanes from the tropical cyclone reports of the National Hurricane Center (Pasch et al., 2006, for Wilma; Stewart, 2017, for Matthew; Cangialosi et al., 2021, for Irma; Pasch et al., 2023, for Maria).
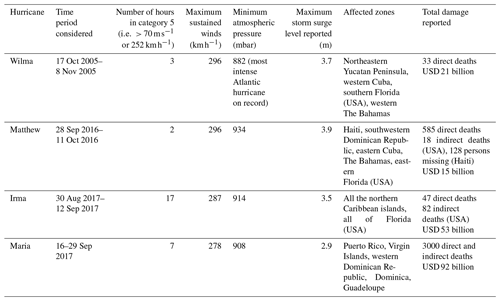
Tropical cyclones are major drivers of these extreme sea levels due to large storm surges, which are rises in the sea level due to the combined effects of low atmospheric pressure and strong winds (Woodworth et al., 2019). This phenomenon can drive coastal hazards such as flooding and erosion (Dullaart et al., 2021; Jamous et al., 2023). The present study focuses on four historical severe tropical cyclones (hurricanes) that have occurred in the northwestern Atlantic region in the last 20 years and have severely impacted coasts: Wilma (2005), Matthew (2016), Irma (2017), and Maria (2017). As category 5 hurricanes, all of them are major hurricanes for the region, in terms of both the storm surge amplitudes reached and the total damage estimated, as presented in Table 1.
Therefore, monitoring the spatiotemporal evolution of storm surges, particularly in the context of climate change, where the frequency and intensity of tropical cyclones may change, is important (Roberts et al., 2020; Cattiaux et al., 2020; Knutson et al., 2020; Bloemendaal et al., 2022; van Westen et al., 2023). Historical records, such as tide gauge data, are valuable for this purpose. However, these records are often scarce and sometimes unavailable during the most severe events (Haigh et al., 2023). Hydrodynamic models (e.g. Advanced Circulation (ADCIRC), SCHISM, GTSM, and Mike21) can be used to overcome the limitation of scarce historical records. These models are often run in a 2D barotropic mode, enabling fine resolution along coastlines while minimizing computational costs. In recent years, they have been widely used in operational systems to forecast storm surge hazards (Dietrich et al., 2018; Fernández-Montblanc et al., 2019) and generate regional (Haigh et al., 2014; Marsooli and Lin, 2018; Muis et al., 2019; Toomey et al., 2022; Gori et al., 2023; Parker et al., 2023; Martín et al., 2023) and global hindcasts (Muis et al., 2016; Dullaart et al., 2021). More recently, hydrodynamic models have also been employed to derive projections of storm surges at both regional (Camelo et al., 2020; Makris et al., 2023; Wood et al., 2023) and global (Vousdoukas et al., 2018; Muis et al., 2020, 2023) scales, driven by climate model data.
The primary drivers for hydrodynamic models are atmospheric forcings such as winds and atmospheric surface pressure. The use of a global or regional atmospheric reanalysis (e.g. ERA5, CFSR, and JRA-55) provides a consistent hourly 2D forcing field across the entire domain. However, these datasets face limitations due to unresolved processes and insufficient spatial resolution (Roberts et al., 2020). Additionally, their limited temporal coverage poses a challenge for hindcast production, given the rarity of tropical cyclones (Dullaart et al., 2021; Wood et al., 2023). Parametric wind models represent the wind field distributions of tropical cyclones using a limited number of observations or statistical methods. The simplicity and computational efficiency of these models make them powerful tools for performing many simulations, thereby enhancing the robustness of storm surge evaluations (Haigh et al., 2014; Toomey et al., 2022; Martín et al., 2023). The origin of the parametric wind models started with C. E. Deppermann (1947), who adopted the mathematical equations of the Rankine vortex model (Rankine, 1882) to depict the tropical cyclone atmospheric structure. Since then, numerous parametric models have been developed, becoming more sophisticated and complex with advancements in observational technologies. Despite these advancements, parametric models often simplify cyclone behaviour, such as by adopting an axisymmetric cyclone model, which can potentially introduce biases (Dietrich et al., 2018), as for example with the widely used dynamic Holland model (Holland, 1980; Fleming et al., 2012).
In addition to atmospheric forcing, oceanic drivers are also important for storm surge modelling. Factors such as tides and the regional mean sea level can significantly interact with and modify storm surges (Marsooli and Lin, 2018; Idier et al., 2019). For example, neglecting tide–surge interactions can significantly reduce the accuracy of the storm surge prediction (Fernández-Montblanc et al., 2019), potentially overestimating extreme sea levels by up to 30 % (Arns et al., 2020). Other studies emphasize the importance of considering the sea level baroclinic response to tropical cyclones (Ezer, 2018; Zhai et al., 2019; Pringle et al., 2019; Ye et al., 2020). Three-dimensional baroclinic ocean general circulation models, such as the Nucleus for European Modelling of the Ocean (NEMO) and ROMS, can be used for this purpose, as they explicitly resolve storm surges (Chaigneau et al., 2022; Irazoqui Apecechea et al., 2023). However, these models have relatively high computational costs, limiting their application in tropical-cyclone-induced storm surge modelling (Kodaira et al., 2016; Hsu et al., 2023). Additionally, recent research underscores the significant impact of wind stress parameterization on storm surge modelling, including the choice of parameterization, parameter tuning, and the consideration of processes such as waves (O'Neill et al., 2016; Pineau-Guillou et al., 2020).
This study aims to investigate different factors influencing the performance of numerical models in simulating storm surges caused by hurricanes. The focus is on the tropical Atlantic region, including the Caribbean Sea, the Gulf of Mexico, and the eastern coast of Florida (USA). Four historical hurricanes known for their severe coastal impacts are simulated (Table 1). The ability of the simulations to reproduce the storm surge contribution to extreme sea levels is evaluated against tide gauge records. The validation involves analysing both the peak surge maxima and the hourly time series during these extreme events. Two ocean models (ADCIRC and NEMO) are compared using a similar configuration: domain, a spatial resolution of 9 km, bathymetry, and a 2D barotropic mode. Sensitivity experiments are then conducted with these models to assess the impacts of various factors. This study evaluates the sensitivity of storm surge to different atmospheric forcings by comparing simulations driven by ERA5 reanalysis data with those using parametric wind models typically used for hurricanes. It also examines the effects of nonlinear interactions with astronomical tides and variations in the mean sea level, as well as the sensitivity to different wind stress schemes. Additionally, this study explores the baroclinic contributions to storm surges using a 3D configuration that simulates the effects of temperature and salinity on ocean circulation.
The remainder of the paper is organized as follows. The met-ocean data are presented in Sect. 2. The methods are described in Sect. 3, with details of the numerical models, configurations developed, and sensitivity experiments performed, as well as the statistical metrics used to analyse the simulations. The results are presented in Sect. 4, first with a comparison of the models with equivalent settings and then with an analysis of the sensitivity experiments. Notably, we examine the influence of atmospheric forcing using ADCIRC and the effects of oceanic drivers using NEMO. The results are discussed in Sect. 5, and general conclusions of the study are drawn in Sect. 6.
2.1 Tide gauge data
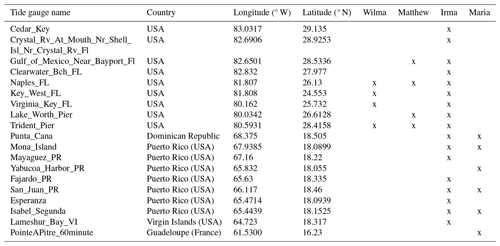
The modelled storm surges are validated against tide gauge records extracted from the Global Extreme Sea Level Analysis (GESLA) dataset version 3 (Haigh et al., 2023). The selected tide gauge stations provide high-frequency tide gauge records with a minimum hourly resolution. For this study, tide gauges within a 300 km radius of the hurricanes are selected for analysing the modelled storm surges, and their locations are listed in Table 2. Tide gauges located in onshore areas, such as estuaries, channels, bays, and lagoons, are excluded because of the horizontal resolution of the regional models used. Additionally, tide gauges recording storm surges of less than 15 cm are not included in the analysis. Tidal harmonic constituents are extracted from the time series with the Python utide package (Codiga, 2011). In this context, storm surges refer hereinafter to nontidal residuals.
2.2 Atmospheric pressure and wind fields
Storm surges induced by hurricanes are simulated using surface wind and atmospheric pressure fields as forcings. In this study, data from a reanalysis product and parametric wind models are used. The selected reanalysis product is ERA5 (Fig. 1b), provided by the European Centre for Medium-Range Weather Forecasts (ECMWF) (Hersbach et al., 2020). ERA5 has a horizontal resolution of 0.25 degrees (∼ 31 km) and an hourly temporal resolution, spanning 1950 to the present. The reanalysis benefits from satellite data assimilation starting in 1980, which enhances the representation of tropical cyclones. Compared with its predecessor ERA-Interim (∼ 79 km, 6-hourly), the higher spatial and temporal resolutions of ERA5 allow for an improved resolution of tropical cyclones, including a lower central pressure (Hersbach et al., 2020). Additionally, ERA5 benefits from an improved data assimilation procedure, notably incorporating satellite observations from the Advanced Scatterometer (ASCAT) for wind speed (Dullaart et al., 2020). Consequently, when used for atmospheric forcing, ERA5 offers improved accuracy in representing storm surges induced by tropical cyclones (Dullaart et al., 2020) and has been used in large-scale studies simulating storm surges (Muis et al., 2020, 2023; Dullaart et al., 2021; Gori et al., 2023; Parker et al., 2023).
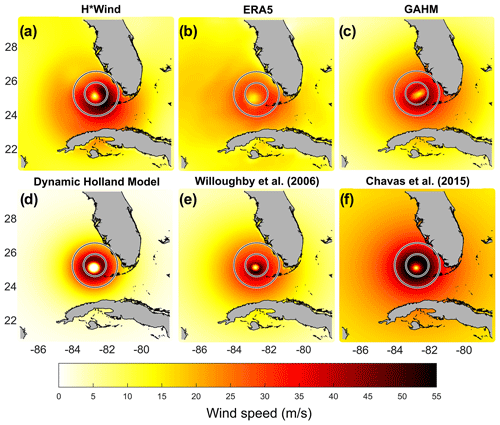
Figure 1Example of the synoptic wind field for the different atmospheric forcings used in the study during Hurricane Wilma before landfall in Florida (USA). (a) H∗Wind real-time hurricane wind analysis system developed as part of the National Oceanic and Atmospheric Administration (NOAA) Hurricane Research Division (Powell et al., 1998), which is regarded here as the reference. (b) ERA5 reanalysis data. (c–f) The four different parametric wind models tested.
Storm surges induced by hurricanes are also simulated using parametric wind models. The observations used as inputs for these models are taken from the International Best Track Archive for Climate Stewardship (IBTrACS) database (Knapp et al., 2010, 2018). The database provides at least 6 h information on the cyclone position and intensity from 1851 to the present, as well as additional variables such as the radius of maximum wind, environmental pressure, and various wind radii in recent decades. This study evaluates four recognized parametric wind models: the dynamic Holland model (DHM), the parameterization proposed by Willoughby et al. (2006), the physics-based model proposed by Chavas et al. (2015), and the generalized asymmetrical Holland model (GAHM). The DHM is an extension of the commonly used Holland model (Holland, 1980), with modifications applied by Fleming et al. (2012) to better capture dynamic processes within and around tropical cyclones. The Willoughby et al. (2006) model, also derived from the Holland model, is based on a piecewise continuous wind profile. This model is composed of analytical segments based on a power law inside the eye and two exponential decay functions outside. These segments are patched smoothly together across the radius of maximum wind using a radially varying polynomial ramp function. The required model parameters (i.e. R1, R2, X1, X2, n, and A) are statistically estimated by these authors based on aircraft observations for nearly 500 tropical cyclones. Done et al. (2020) provide examples of successful applications of the model to be used as the forcing of marine dynamics. The Chavas et al. (2015) model is a physics-based model that mathematically merges the Emanuel (2004) and Emanuel and Rotunno (2011) solutions to integrate the outer- and inner-core wind structures of tropical cyclones, respectively. In the Chavas et al. (2015) model, several parameters need to be prescribed: the drag coefficient in the outer region (set to 0.0015), the radiative-subsidence rate (set to 2 mm s−1), and the ratio of surface exchange coefficients for enthalpy and momentum (set to 1). No eye adjustment was applied to reduce the wind speed within the inner core. Wang et al. (2022) demonstrated the successful application of this model in simulating extreme sea levels. These three models assume a perfectly azimuthal symmetric structure of the wind fields (Fig. 1d, e, and f), which may lead to errors in storm surge forecasting (Xie et al., 2011). The GAHM is a more recent model that also derives from the commonly used Holland model (Holland, 1980) but incorporates asymmetries in the wind field (Fig. 1c) by considering information from all available isotachs (lines of constant wind speed) in the quadrants (Gao et al., 2018; Dietrich et al., 2018; Bilskie et al., 2022). All the models provide wind velocities averaged over 1 min at the top of the boundary layer. These velocities are first reduced by a factor of 0.9 and then adjusted by multiplication by 0.8928 to convert from 1 to 10 min averages to obtain surface wind speeds. No adjustment for wind speed reduction over land has been applied. The surface pressure field is estimated based on the rectangular hyperbola approximation proposed by Schloemer (1954), including the original/generalized Holland scaling parameter b as an exponent (Holland, 1980; Gao et al., 2018). The pressure drop is calculated by assuming a background pressure of 1013 mbar.
Storm surges induced by four hurricanes are simulated in the northwestern Atlantic region using two different models (ADCIRC and NEMO) with similar configurations (Sect. 3.1). Sensitivity experiments are then conducted to assess the impacts of atmospheric and oceanic forcings on storm surge modelling (Sect. 3.2). The simulated extreme storm surge events are evaluated in terms of the maximum amplitude, duration, and correlation against tide gauge records (Sect. 3.3).
3.1 Numerical models and regional configurations
The Advanced Circulation (ADCIRC) model, which is used here with version 53, is a numerical model for simulating coastal hydrodynamics (Luettich et al., 1992; Westerink et al., 1994). It solves a formulation based on the Navier–Stokes equations for shallow-water conditions, called the shallow-water equations. Spatial derivatives are discretized using a finite-element method, allowing unstructured meshes. This approach enables high-resolution modelling in specific areas, such as coastal regions or inland zones, without the computational cost of increasing the resolution across the entire domain. The model relies on the input of meteorological data, such as wind and pressure fields, which can be sourced in different formats, including parametric wind models or gridded reanalysis and climate model outputs. Tidal levels or mean sea level forcings can be added as optional inputs through boundaries. Typically used in a 2D barotropic mode for resolving storm surges and tides, ADCIRC can also operate in a 3D mode, which requires additional inputs such as temperature and salinity. Several advanced options can also be included: the modelling of the wetting and drying of inundated areas (Dietrich et al., 2004), the inclusion of river flows, the representation of obstructions to flow (Luettich and Westerink, 1999), and the integration of the wave setup by coupling with a wave model (Dietrich et al., 2012). ADCIRC is widely used in research for modelling storm surge induced by tropical cyclones at various scales – global (Pringle et al., 2021), regional (Marsooli and Lin, 2018; Camelo et al., 2020; Gori et al., 2023), and more local (Yin et al., 2016; Dietrich et al., 2018). It is also employed in operational forecasting systems, such as the NOAA operational model (Riverside Technology Inc. and AECOM, 2015), and is the standard coastal storm surge model used by the US Army Corps of Engineers (USACE) and the US Federal Emergency Management Agency (FEMA).
The Nucleus for European Modelling of the Ocean (NEMO) model (Madec et al., 2023) is a 3D baroclinic ocean general circulation model developed by a European consortium (https://www.nemo-ocean.eu/, last access: 18 November 2024). It solves primitive equations, i.e. the Navier–Stokes equations and a nonlinear equation of state that couples the temperature and salinity to the fluid velocity, with assumptions based on scale considerations. The equations are solved using a finite-difference method. The ocean is discretized horizontally using a curvilinear ORCA grid and vertically using a chosen coordinate system, resulting in a high computational cost. The model relies on the input of atmospheric fields (air temperature, specific humidity, winds, atmospheric pressure, short- and longwave radiation, precipitation, and snow cover) and tidal potential at the surface. It also requires oceanic fields (3D ocean temperature, salinity, and currents and 2D sea level) at lateral boundaries for regional configurations, as well as river runoff fluxes. In addition to storm surges and tides, NEMO can also resolve mean sea level changes related to ocean general circulation, i.e. due to baroclinic processes and the addition of mass to the ocean. In this study, we used the ocean circulation module of NEMO version 4.0.4 (Madec et al., 2019), but additional components, such as sea ice models and biogeochemical processes, can be included. NEMO has recently been applied in sea level research at global (Royston et al., 2022) and regional scales (Adloff et al., 2018; Chaigneau et al., 2022). It is also utilized in the framework of the Copernicus Marine Environment Monitoring Service (CMEMS), providing free-of-charge ocean data and information derived from real-time systems and reanalyses at global and regional scales. For example, it is used to forecast extreme coastal water levels and support coastal flood awareness applications across Europe (Irazoqui Apecechea et al., 2023).
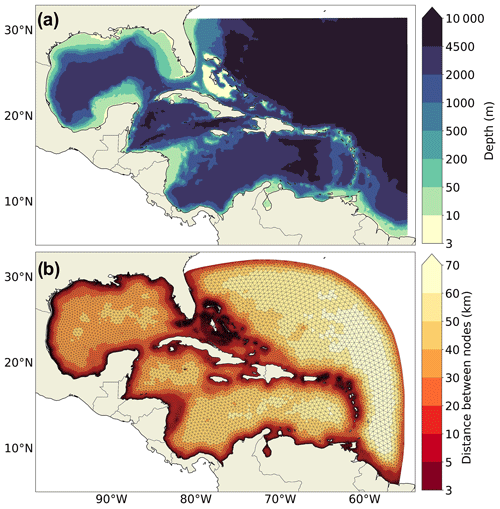
Figure 2(a) Bathymetry and NEMO domain. (b) ADCIRC domain and grid spacing with the ADCIRC unstructured mesh.
ADCIRC and NEMO are compared for storm surge modelling in the northwestern Atlantic region, covering a domain from 6 to 31.5° N and from 98 to 55° W (Fig. 2). The region includes the entire Caribbean Sea, the whole Gulf of Mexico, and part of the northwestern Atlantic Ocean. This region is particularly prone to tropical cyclone development because of its warm water temperatures, high moisture levels, and specific wind patterns. The region encompasses a variety of oceanographic processes that are crucial for accurate storm surge modelling. It has significant bathymetric variations, including a broad continental shelf in the Gulf of Mexico and around The Bahamas, as well as a narrow continental shelf near the Caribbean islands. In terms of ocean circulation, the dominant feature is the Gulf Stream, which originates in the Gulf of Mexico and flows through the Straits of Florida (USA) and up the eastern coastline of the USA. The region is microtidal, with the largest tidal amplitudes reaching approximately 2 m in northern Surinam and Guyana, as well as in northeastern Florida (USA).
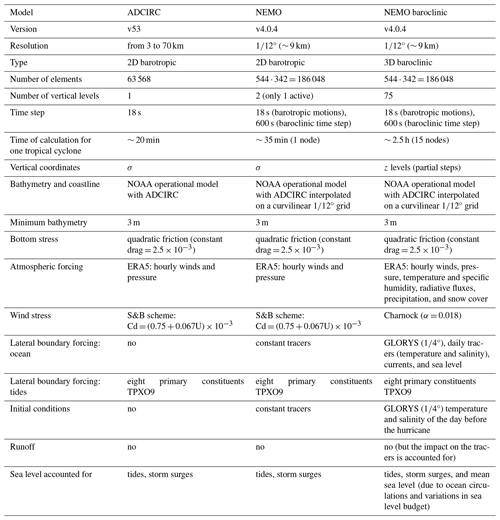
Two similar configurations operating in a 2D barotropic mode have been developed to ensure a fair comparison between the two models. As NEMO is mainly used in a 3D baroclinic mode, the code has been modified to enable running the model in a 2D barotropic mode based on the Met Office configuration for the UK (O'Neill et al., 2016). The model operates using two vertical sigma levels with only one active layer and with typical baroclinic processes disabled. Tracers (temperature and salinity) are kept constant in space and time, and vertical physics, such as vertical mixing, internal waves, and convection, are entirely deactivated. Atmospheric inputs are limited to winds (wind stress) and pressure (barotropic effects due to pressure forcing), with the total turbulent heat flux set to zero. The resolution of both configurations is limited by the computational cost of the NEMO model, which has a quasi-regular resolution of 9 km in the region. ADCIRC is configured to have a similar resolution, ranging from 3 km near the coast or in shallow-water areas to 70 km in the deeper open ocean (Fig. 2b), resulting in 3 times fewer elements than for NEMO (Table A1). The bathymetry and coastline data are derived from the NOAA operational model with ADCIRC (Riverside Technology, 2015) and are interpolated on the ADCIRC and NEMO grids (Fig. 2a). In this NEMO configuration, dry areas are not allowed; thus, a minimum bathymetry value of 3 m is set to allow lower sea levels, such as during low tides. This value is also applied to the ADCIRC configuration, despite dry areas being allowed. Both models are driven by hourly wind and pressure data from the ERA5 atmospheric reanalysis (Sect. 2.2) using the S&B scheme (Smith and Banke, 1975) for wind stress (Eq. 1). Additionally, they are forced by eight tidal constituents (M2, K2, S2, N2, Q1, O1, P1, and K1) derived from TPXO9 (Egbert and Erofeeva, 2002) at the open boundaries. For each simulated hurricane, the models are also run with only astronomical tidal forcing, excluding meteorological forcing. This approach enables the isolation of the storm surge component, making it comparable to the nontidal residuals from tide gauges (Sect. 2.1). Detailed settings and forcings for the ADCIRC and NEMO configurations are provided in Appendix A (Table A1).
3.2 Sensitivity experiments
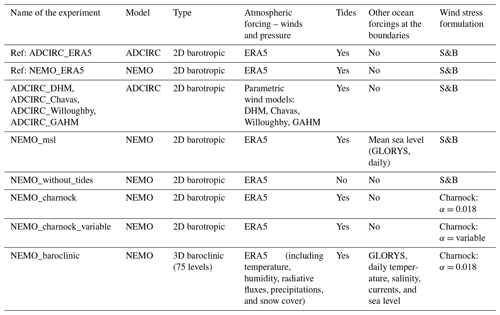
Sensitivity experiments are conducted based on the developed configurations described in Sect. 3.1. The aim is to assess the effects of atmospheric and oceanic forcings, physical parameterizations for wind stress, and baroclinic/barotropic modes on the performance of the models. All simulated experiments are listed in Table 3. The sensitivity of storm surge modelling to atmospheric forcing is evaluated by comparing the ERA5 atmospheric reanalysis and parametric wind models typically used for simulating tropical cyclones (Sect. 2.2). This experiment is conducted with the ADCIRC model, which is extensively used and developed for this application, particularly for operational systems (Fleming et al., 2012; Riverside Technology, 2015).
The sensitivity of storm surge modelling to ocean forcing is assessed in terms of nonlinear interactions of surges with astronomical tides and variations in the mean sea level. These experiments are performed using the barotropic NEMO configuration, either by excluding tidal forcing at the boundaries or by including the daily mean sea level forcing from the GLORYS ocean reanalysis at the boundaries (Garric and Parent, 2017). Similar tests were conducted using the ADCIRC model; however, only the NEMO experiments are presented, as the results were consistent between both models.
The barotropic configuration of NEMO is also used to investigate the impact of wind stress parameterization on storm surges, taking advantage of the flexibility of NEMO in modifying the code. This study compares the S&B (Smith and Banke, 1975) scheme (Eq. 1) with the Charnock formulation (Charnock, 1955) (Eq. 2). In the S&B scheme, the wind stress τ is calculated using a simple formulation for the drag coefficient CD, which represents the drag force exerted by the wind on the water surface, as follows:
where ρa is the air density, and U is the 10 m wind speed.
The Charnock relationship is a semiempirical formula that involves a more complex calculation, accounting for changes in surface roughness with wind speed as follows:
where z0 is the roughness length, α is the dimensionless Charnock parameter, u∗ is the friction velocity, and g is gravity. The Charnock parameter α is generally assumed to be constant in the formulation of sea surface roughness (Eq. 2). For example, in the standard NEMO code, it is kept constant in space and time, equal to 0.018. In reality, this parameter varies with sea surface roughness and is influenced by various wave parameters, such as wave age, wave steepness, and the presence of sea foam, especially under high wind conditions, as suggested by numerous studies published in recent decades (Janssen, 1989; Moon et al., 2004; Pineau-Guillou et al., 2020; Wu et al., 2024). An additional simulation has therefore been performed using a variable Charnock parameter derived from ERA5 reanalysis outputs, which depend on wave conditions (Riverside Technology, 2015).
Finally, a sensitivity experiment is conducted to evaluate the importance of baroclinic motions on modelled storm surges, which require a distinct configuration. This experiment is performed with NEMO in a standard baroclinic mode (Sect. 3.1). For this purpose, a baroclinic configuration with 75 vertical z levels was set up based on Wilson et al. (2019). This configuration is driven by the GLORYS ocean reanalysis (Garric and Parent, 2017) at the lateral oceanic boundaries and for the initial state and by the ERA5 atmospheric reanalysis (Sect. 2.2) at the air–sea interface (see the variables in Table 3). This configuration allows for the resolution of changes in pressure gradients due to variations in temperature and salinity, which generate ocean circulations and transport, as well as vertical physics. The short duration of the simulations (Table 1) does not allow for the modelling of deep ocean circulation, but surface circulation, which occurs more rapidly, can be simulated. The differences between the barotropic and baroclinic NEMO configurations are summarized in Appendix A (Table A1).
3.3 Statistical evaluation of extreme events
The hourly outputs from all the simulations (Table 3) are statistically compared with tide gauge records (Sect. 2.1) during the four hurricane events. We evaluate not only the maximum storm surge but also its temporal behaviour with an automated method we developed to identify the time window for each extreme event. This method is based on the analysis of wind time series, as we have found them to be good indicators of storm conditions. For each hurricane simulated and data available from each tide gauge station (Table 2), the following steps are applied to extract the time window of the extreme event:
-
The ERA5 wind time series closest to the tide gauge location is extracted for the hurricane dates (Table 1).
-
The maximum and local maxima of the wind time series are identified, as are the inflection points on either side of the maximum wind speed.
-
The time window to identify the extreme event is defined by the two inflection points that include the maximum wind speed and all local maxima exceeding the 95th percentile threshold, as illustrated in Fig. 3.
-
Storm surges from the various simulations are extracted at the closest point to each tide gauge station, and the same time window is applied to each station to identify the extreme events.
Once the time window is defined, various statistical metrics are computed to validate the modelled storm surge against tide gauge data as follows:
Evaluation of the maximum surge values. The maximum values reached within the specified time window are compared between the simulations and tide gauge data using the bias (Fig. 3). The mean absolute error (MAE) is also used to derive a general skill value for all the selected tide gauges.
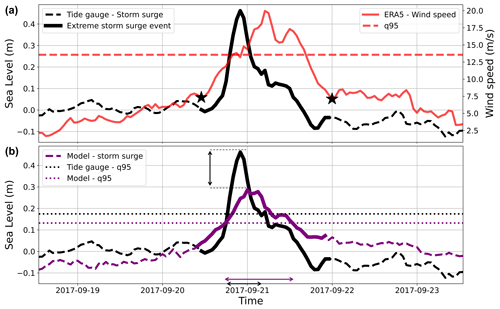
Figure 3Graphs of the selection of storm surge extreme events for tide gauge records (a) and comparison with simulations (b). The storm surge data extracted from the tide gauge dataset at one station are presented in black. The wind speed extracted from ERA5 is shown in red, with the dashed line denoting the 95th percentile threshold. The simulated storm surge data are presented in purple. The two stars and wider black and purple lines indicate the beginning and the end of the time window defining the storm surge extreme event. The vertical black arrow denotes the bias between the observed and modelled maximum storm surges reached within the time window. The horizontal black and purple arrows denote the durations above the 90th percentile for both the observed and the modelled data.
Evaluation of the surge time series. The Pearson correlation coefficient is computed over the time window to evaluate the correlation between the modelled and observed storm surge time series. Additionally, the difference in duration (in hours) exceeding the 90th percentile of the storm surge time series between the simulations and tide gauges is calculated over the time window (Fig. 3). These metrics, which depend on the temporal behaviour of the surge, are important for impact assessments (e.g. accelerated coastal erosion and increased likelihood of coastal flooding).
4.1 Intermodel comparison
The ADCIRC and NEMO simulations are compared for storm surge modelling using the two similar configurations described in Sect. 3.1, both of which are forced by the same drivers from ERA5. First, a comparison between the maximum storm surges generated by ADCIRC and the tide gauge data is presented for the four hurricanes simulated (Fig. 4). The validation is restricted to a few points (Table 2) because of the scarcity of tide gauge data along the coasts of Cuba, Haiti, and northern Mexico – regions significantly impacted by three of the four hurricanes (Table 1). The overall spatial pattern of the modelled storm surges is consistent with that of the hurricane tracks. Both the observed and the modelled highest storm surges exceed 1 m for each hurricane. However, ADCIRC simulations tend to underestimate maximum storm surges compared with tide gauge data, particularly along the eastern coast of Florida (USA) and in the Caribbean islands, resulting in a mean underestimation of at least 20 % (Fig. 4).
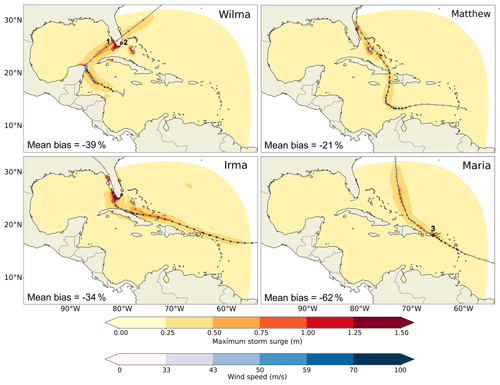
Figure 4Modelled (ADCIRC with ERA5 forcing, map) and observed (tide gauges, circles) maximum storm surges for the four simulated hurricanes. The tracks of the hurricanes and the wind speed are shown in blue. The blue colour bar represents the different hurricane categories, from category 1 between 33 and 43 m s−1 to category 5 for winds higher than 70 m s−1. The locations used to analyse the time series are marked with numbers 1 (Naples_FL), 2 (Virginia_Key_FL), and 3 (San_Juan_PR). The mean bias between the simulated and observed maximum storm surges is shown in the bottom-left corner of each panel.
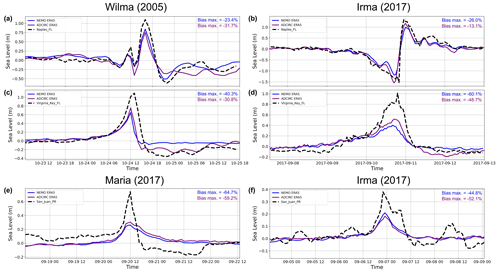
Figure 5Modelled (blue line for NEMO, purple line for ADCIRC) and observed (dashed black line) storm surge time series at three tide gauge locations in the Florida region (a–d) and in the Caribbean region (e, f). The locations are marked in Fig. 4. The results are shown for hurricanes Wilma, Irma, and Maria (Table 1). The bias between the simulated and observed maximum storm surges is shown in the top-right corner of each panel, with the colour indicating the model.
The time series of different target locations are shown in Fig. 5 to analyse the responses of both the ADCIRC and the NEMO models. The models exhibit very similar behaviours, with occasional instances where one model outperforms the other. For example, NEMO displays a slightly better correlation for Wilma at the Naples station during the post-peak period, whereas ADCIRC performs better in capturing the surge amplitude for Irma at the Virginia Key station. Overall, the correlation between the models and observed data is well reproduced. Along the western coast of Florida (Naples), both models also satisfactorily simulate the surge amplitude, including the double-peak behaviour during Hurricane Wilma. However, for all the simulated hurricanes, the storm surge is notably underestimated by both NEMO and ADCIRC along the eastern coast of Florida (Virginia Key) and in the Caribbean islands (San Juan) (Fig. 5), as also illustrated in Fig. 4.
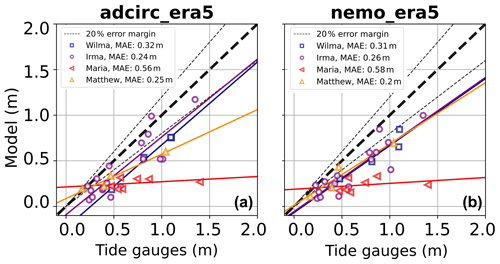
Figure 6Scatter plot of the modelled vs. observed maximum storm surges for the four hurricanes for the ADCIRC (a) and NEMO (b) simulations. The MAE value represents the mean absolute error of the surge maximum.
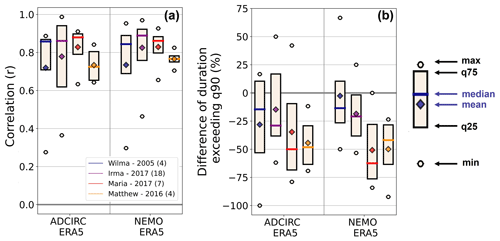
Figure 7Boxplot of the correlation (a) and difference in the storm surge duration above the 90th percentile (b) for the ADCIRC and NEMO simulations. The number of tide gauges considered for each box is listed in brackets after the four hurricane names.
The similarity of the results between ADCIRC and NEMO is noticeable when considering all tide gauges available as well (Fig. 6), revealing a general underestimation, with NEMO showing slight improvements for Hurricane Matthew. Compared with other studies at this scale and resolution, both models demonstrate satisfactory performance for three of the four hurricanes, with a mean absolute error of less than 0.3 m (Muis et al., 2019, 2020; Dullaart et al., 2020; Wood et al., 2023). However, both ADCIRC and NEMO notably underestimate storm surges associated with Hurricane Maria, located north of the Caribbean Sea (Fig. 6). The time series in the Caribbean (San Juan) consistently show significant underestimations for hurricanes Irma and Maria (Fig. 5), suggesting a region-dependent underestimation rather than one dependent on the hurricane characteristics. For Hurricane Irma, unlike Hurricane Maria, other tide gauges are utilized for the statistical analysis, particularly along the western coast of Florida, where the models perform well (Fig. 5), resulting in overall good performance (Fig. 6).
The general correlation between ADCIRC and NEMO is also consistent, with a satisfactory mean value of over 0.8 for both models (Fig. 7), which aligns with recent literature (Muis et al., 2019, 2020; Dullaart et al., 2020). The extreme event duration above a high percentile is also presented, combining biases in surge amplitude and correlation. Compared with tide gauge data, the duration of extreme events is slightly underestimated by both models by approximately 25 % for hurricanes Wilma and Irma (Fig. 7). This underestimation doubles to 50 % for hurricanes Maria and Matthew. For Hurricane Maria, although the correlation is high, the surge levels are significantly underestimated. An analysis of ERA5 meteorological inputs (not shown) indicates an accurate hurricane track representation but notable biases in meteorological conditions, particularly around the Caribbean islands. In particular, we observed weaker extreme winds and higher atmospheric pressure in the eye of the hurricane. These biases might be attributed to factors such as reduced data assimilation in this region or the impact of the resolution of the reanalysis (i.e. differences in the land mask of ERA5 over the Caribbean islands, with a spatial resolution of approximately 31 km). For Hurricane Matthew, the underestimation of the event duration is due to a lack of correlation with observations, which is attributed to its hurricane track being farther from the coast and tide gauges than that of other hurricanes.
4.2 Analysis of the sensitivity experiments for storm surge modelling
Given the similar performance of the ADCIRC and NEMO models, we employ the strengths of each model to conduct sensitivity experiments (Table 3). These experiments aim to assess the effects of atmospheric and oceanic forcings, physical parameterizations for wind stress, and baroclinic/barotropic modes on the performance of numerical models in simulating storm surges.
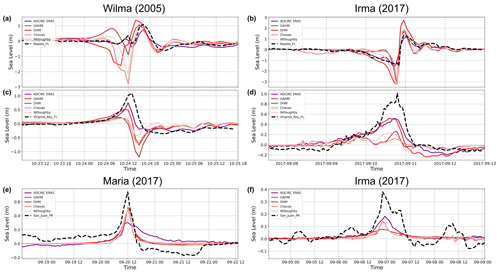
Figure 8Modelled (coloured lines) and observed (dashed black line) storm surge time series at three tide gauge locations in the Florida region (a–d) and in the Caribbean region (e, f). Each colour represents an ADCIRC simulation with a different atmospheric forcing (ERA5 or a parametric wind model). The locations are marked in Fig. 4. The results are shown for hurricanes Wilma, Irma, and Maria (Table 1).
First, we assess the impact of the atmospheric forcing by comparing storm surges simulated with four parametric wind models (Sect. 2.2) against those simulated using ERA5 (Table 3). The comparisons, shown in Fig. 8, are performed at the same three tide gauge locations as those in Fig. 5. The results from the parametric wind models are highly variable, displaying a range of performance between good and significant under- or overestimates, depending on the location relative to the cyclone track. In general, the maximum surge values obtained from the parametric wind models are less satisfactory than those derived from the ERA5 wind fields. The parametric wind models capture the surge peaks at the Naples station relatively well because of the close proximity of hurricanes Wilma and Irma to the tide gauge (within 25 km). However, these peaks show a time lag compared with those of ERA5 and the tide gauges during Hurricane Wilma, which is attributed to discrepancies between the hurricane tracks in the best track data and those in ERA5. According to the best track data, Wilma passed slightly earlier and closer to the Naples station (not shown). The behaviour of axisymmetric wind models also depends on the relative distance to the track. During Hurricane Wilma, a significant drop in the storm surge is detected at the Virginia Key station because the wind direction pushes water away from the shore. Conversely, during Hurricane Irma, the peak surge is notably underestimated at the same station because the hurricane centre is more than 100 km away. Compared with the other models, the GAHM model shows substantial differences, sometimes improving the maximum surge (e.g. at Virginia Key) and sometimes worsening it (e.g. at Naples), likely due to the inclusion of asymmetries (Fig. 1c). Nevertheless, a notable improvement in the performance of the parametric wind models is observed for Hurricane Maria (Figs. 8 and 9a), where the maximum surge is highly underestimated with the ERA5 forcing. This result highlights the relevance of using parametric winds in such cases.
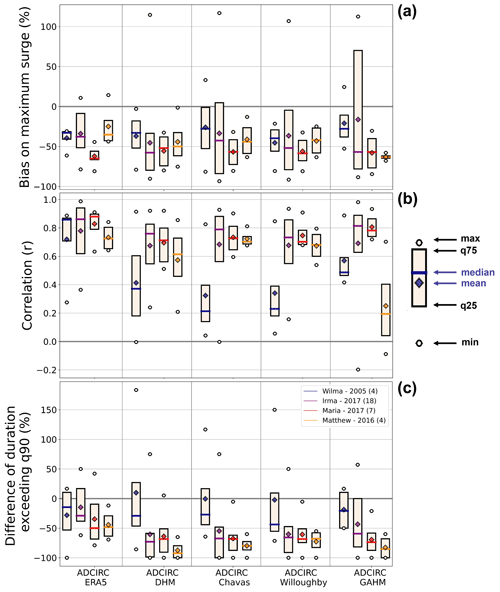
Figure 9Boxplot of the maximum surge bias (a), correlation (b), and difference in the duration of the surge above the 90th percentile (c) for the simulations using different atmospheric forcings with ADCIRC. The number of tide gauges considered for each box is in brackets after the four hurricane names and dates. A difference of 100 % corresponds to a missed extreme event.
The correlation between the parametric models and observations averages less than 0.6 and varies significantly among hurricanes (Fig. 9). For example, the DHM, Willoughby, and Chavas models perform rather poorly for Hurricane Wilma, whereas the GAHM model underperforms for Hurricane Matthew. These differences in the correlation compared with ERA5 atmospheric forcing are likely due to the simplifications in atmospheric surface conditions used by the parametric models (Fig. 1), in contrast to the complete spatial wind fields provided by ERA5. Additionally, variations in the location of the hurricane track in the parametric models and its relative distance from the tide gauges contribute to these discrepancies. A specific selection of the parameters used in the wind models for each hurricane could also increase the accuracy of storm surge simulations (Chavas et al., 2015). Across all the simulated hurricanes, the duration of extreme events is consistently underestimated by all the simulations (Fig. 9). While ERA5 systematically underestimates less than 50 % of the time, parametric wind models tend to exhibit more substantial underestimations and occasionally miss some extreme events. This result is particularly clear when the distance between the hurricane and the tide gauge is greater than 50 km because far-afield winds are not captured in the parametric models (not shown).
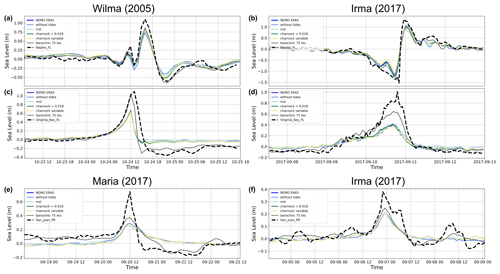
Figure 10Modelled (coloured lines) and observed (dashed black line) storm surge time series at three tide gauge locations in the Florida region (a–d) and in the Caribbean region (e, f). Each colour represents a different NEMO experiment (accounting for different sea level processes or wind stress implementations). The locations are marked in Fig. 4. The results are shown for hurricanes Wilma, Irma, and Maria (Table 1).
Next, we assess the effects on storm surge due to nonlinear interactions with astronomical tides and variations in the mean sea level, as well as the sensitivity to different wind stress schemes. We also investigate the baroclinic contribution to storm surges using a 3D configuration with 75 vertical levels (Sect. 3.2). Figure 10 compares the storm surges simulated by NEMO for these various experiments (Table 3) with tide gauge data obtained at the same three locations. The results show that with our model, nonlinear interactions between storm surges and tides or the mean sea level have minimal contributions to extreme sea levels, as do the different wind stress formulations. However, incorporating the baroclinic response significantly improves the maximum storm surge estimates by up to 40 cm at the Virginia Key station in the southeastern Florida peninsula and slightly in the Caribbean islands.
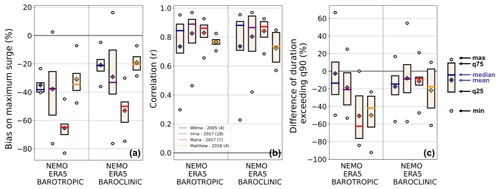
Figure 11Boxplots of the maximum surge bias (a), correlation (b), and difference in the duration of the surge above the 90th percentile (c) for the NEMO barotropic and baroclinic simulations. The number of tide gauges considered for each box is in brackets after the four hurricane names and dates.
In general, for all the simulated hurricanes, the inclusion of baroclinicity significantly influences the maximum surge amplitudes, reducing the bias by approximately 10 % to 20 % on average, depending on the hurricane (Fig. 11). Nevertheless, the average correlation of the surge peak events remains virtually unaffected by the baroclinic experiment. This outcome is due to compensation between minor improvements, such as those during the poststorm periods for hurricanes Wilma and Maria at the Naples and San Juan stations, and degradations observed at the Virginia Key during the decreasing surge for Hurricane Wilma. The statistics for the other experiments are not presented, as their impacts on storm surges are minimal with our model setup. The baroclinic impact on the event duration is also substantial, with a less than 20 % underestimation for all the simulated hurricanes.
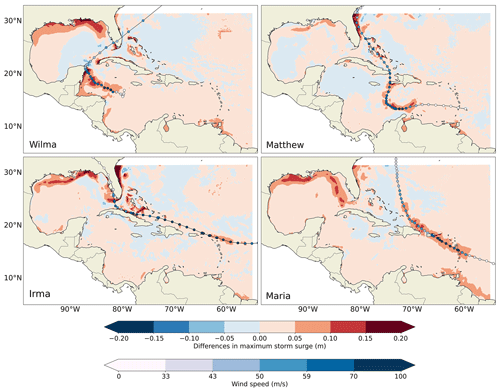
Figure 12Differences in the maximum storm surge between the NEMO baroclinic and barotropic simulations. The results are shown for the four simulated hurricanes: Wilma, Matthew, Irma, and Maria (Table 1). The tracks of the hurricanes and the wind speed are shown in blue. The blue colour bar indicates the different hurricane categories, from category 1 between 33 and 43 m s−1 to category 5 for winds higher than 70 m s−1.
A comparison of the maximum storm surges in the baroclinic and barotropic simulations provides insights into the regional significance and locations of the baroclinic impact (Fig. 12). Substantial differences of more than 20 cm are identified along the eastern coast of Florida when the hurricane approaches from the east, as also indicated by the various tide gauges used in that region (Figs. 4 and 10). In other areas, such as the Caribbean for Hurricane Maria and the Yucatan Peninsula (Mexico) for Hurricane Wilma, differences of more than 10 cm are observed along the hurricane track in coastal areas.
The passage of a hurricane affects the general surface circulation, for example, through winds inducing mixing in the water column, leading to a decrease in sea surface temperature. Additionally, the baroclinic simulation considers other atmospheric variables associated with hurricanes, such as precipitation. These variables not only impact the local sea level budget but also modify circulation due to the effect on salinity, which interacts with the existing circulation. Consequently, each cyclone generates a distinct baroclinic response, influenced by its specific characteristics and interactions with local oceanographic features. Other studies have investigated the impact of baroclinic motions on storm surges. For example, Ye et al. (2020) implemented a regional 3D baroclinic model and compared it to a 2D barotropic model in simulating storm surges induced by hurricanes along the US east coast. The results revealed a non-negligible influence of baroclinicity during the poststorm period, with differences of up to 14 % in sea level amplitude. However, this study focused on a single hurricane, and comparisons with observational data were conducted in an estuarine area outside our domain. Pringle et al. (2019) investigated the baroclinic contribution to storm surges using a 2D depth-integrated (2DDI) configuration that incorporated baroclinic effects on the free surface and depth-integrated currents without simulating them directly. They reported that for Puerto Rico (San Juan station) during hurricanes Maria and Irma, the predicted maximum surge increased by approximately 20 cm because of baroclinic effects, which is greater than the increase observed in our study. Another study by Ezer (2018) examined interactions between Hurricane Matthew, the Gulf Stream, and coastal water levels using a simpler model. The study highlights an increase in storm surge along the eastern coast of Florida that is similar in magnitude to our findings. This increase is attributed to the passage of the hurricane reducing the sea surface height slope between the coast and the other side of the Gulf Stream, consequently reducing the geostrophic Gulf Stream flux and increasing the sea level along the coast.
The results obtained from the intermodel comparison between ADCIRC and NEMO and from the different sensitivity experiments are summarized and discussed in this section. Two synthesis figures are provided: one illustrating the variance decomposition of the different sources of uncertainty (Fig. 13) and the other showing the mean absolute error (MAE) of the maximum storm surge (Fig. 14). Variance decomposition uses an n-factor ANOVA-based variance partitioning method to decompose the total ensemble uncertainty into different sources and their interactions (Storch and Zwiers, 1999). The sources of uncertainty analysed include the choice of simulated hurricanes, numerical models, atmospheric forcings, ocean forcings, physical parameterizations for wind stress, and barotropic/baroclinic modes.
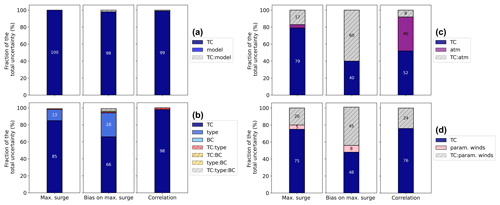
Figure 13Relative contributions (between 0 % and 100 %) of different sources of uncertainty in the ability to model storm surge (maximum surge, bias in the maximum surge, and correlation) based on two- (a, c, d) and three-factor (b) ANOVA decompositions. The four tide gauge locations where the highest surges occur are selected for each hurricane to ensure a consistent number of values between the different sources of uncertainty. Shown are the fraction of variance due to the four tropical cyclones (TC, dark blue) and (a) the two models, ADCIRC and NEMO (model, blue), for a total of n = 16 values; (b) the model type, i.e. baroclinic or barotropic (type, blue), and the boundary conditions, i.e. with or without tides (BC, light blue), for a total of n = 64 values; (c) the atmosphere, i.e. ERA5 or the dynamic Holland model (atm, purple), for a total of n = 16 values; and (d) the parametric wind models, i.e. the dynamic Holland model (GAHM), Willoughby, and Chavas (param. winds, pink), for a total of n = 64 values. Interactions between the different sources of uncertainties are noted with dashed lines. Experiments (c) and (d) are performed with ADCIRC, and experiment (b) is performed with NEMO. The ANOVA decomposition is performed using the statsmodels Python package.

Figure 14Mean absolute errors of the maximum surge values for all the different experiments performed (Table 3). The dots represent the errors of each experiment when they are grouped in a bar for the parametric wind models (DHM, Chavas, Willoughby, and GAHM) and for the wind stress (constant and variable Charnock parameters).
When similar configurations (domain, resolution, bathymetry, barotropic) are used, ADCIRC and NEMO simulate storm surges due to tropical cyclones in a similar manner to tide gauges, regardless of the simulated cyclone. This positive outcome highlights the potential of NEMO, which is currently rather poorly employed for this application. This result is illustrated by the variance decomposition (ANOVA) depicted in Fig. 13a, where the variability of the three different metrics (maximum value, bias in maximum value, and correlation) is dependent only on the simulated hurricanes and not on the chosen numerical model. After testing both models, we found that NEMO and ADCIRC have comparable computation times (Table A1) when using similar numerical domains and resolutions. However, ADCIRC demonstrates better computational performance than NEMO because of its use of an unstructured mesh, as indicated in Table A1.
The performances of these models are significantly influenced by those of the atmospheric reanalysis forcings, which vary across regions. Both models generally underestimate storm surge amplitudes, a common issue in large-scale modelling studies (Kirezci et al., 2020; Irazoqui Apecechea et al., 2023), often because of inadequate meteorological forcing, such as underestimating extreme winds and biases in tropical cyclone tracks (Dullaart et al., 2020; Hodges et al., 2017; Gori et al., 2023). In our case, the use of the global ERA5 atmospheric reanalysis with a 31 km resolution may inadequately capture atmospheric processes, particularly complex land features, such as for Hurricane Maria in the Caribbean islands. Additionally, the performance of the models is influenced by the amount of assimilated data in the atmospheric reanalysis, which varies depending on the location (Hersbach et al., 2020). ERA5 generally provides better storm surge estimates than parametric wind models in our tropical Atlantic region, although exceptions such as Hurricane Maria are noted, as depicted by the mean absolute error of the maximum surge in Fig. 14c. The ANOVA results in Fig. 13b show that the variance in the maximum surge is influenced more by the specific hurricane (i.e. location) than by the atmospheric forcing. This result suggests that in areas with less accurate reanalysis data, parametric wind models might be a viable alternative. For example, Wood et al. (2023) reported that the dynamic Holland model outperformed ERA5 in the South China Sea, where ERA5 struggled to capture typhoon dynamics accurately, likely because of limited data assimilation. Nevertheless, ERA5 clearly performs better in terms of the correlation and duration of extreme events, as illustrated by the significant variance attributed to atmospheric forcing in Fig. 13c. When comparing parametric wind models, none appear superior since their performance highly depends on the hurricane being simulated, and only four are simulated. This result is highlighted by the large interactions between tropical cyclones and parametric winds in the variance analysis in Fig. 13d. An alternative approach could involve a combination of reanalysis and parametric models based on the specific region or the prevalence of tropical cyclones to consider the strength of each approach (Dullaart et al., 2021). Potential strategies to mitigate biases associated with meteorological forcing could involve bias correction techniques (Li et al., 2019; Lemos et al., 2020) or the use of statistical or dynamical downscaling at higher resolutions to capture processes that are not resolved in global or regional reanalyses (Dullaart et al., 2024). In recent developments, data-driven techniques, such as those employed by Tadesse et al. (2020) and Qin et al. (2023), have utilized satellite products to quantify the relationships between storm surges and key atmospheric variables such as wind speed and mean sea level pressure. These diverse methodologies offer a range of options for improving storm surge modelling accuracy and addressing region-specific challenges.
Nonlinear interactions of tides and the mean sea level with storm surges, as well as wind stress formulations, have shown minimal impacts on storm surge estimates during hurricane events (Figs. 13b and 14). This limited simulated tide–surge interaction could be attributed to the small tidal range within the domain, which rarely exceeds 2 m. The impact of interactions with tides is likely greater in other regions dominated by tides, such as in the English Channel with extratropical cyclones (Fernández-Montblanc et al., 2019; Arns et al., 2020) or in Asia with typhoons (Hsiao et al., 2019; Idier et al., 2019). Although the effect of mean sea level forcing appears small, its significance may become more pronounced in the long-term context, particularly when accounting for the mean sea level rise (Fox-Kemper et al., 2021). The inclusion of wetting and drying in NEMO, which was not employed in this study, could also contribute to better resolving ocean dynamics in shallow-water areas, where storm surges are the greatest (O'Dea et al., 2020). In general, improving storm surge estimates by resolving more relevant components and their interactions may require the incorporation of additional processes and the use of a higher resolution in coastal regions (Hsiao et al., 2019), together with a refined coastline and bathymetry. For example, improving storm surge modelling could involve coupling with a wave model to simulate wave setup and associated interactions, as is done for ADCIRC with the SWAN wave model (Dietrich et al., 2018; Marsooli and Lin, 2018; Hsu et al., 2023) or for NEMO with the WAM (Staneva et al., 2021) or WW3 wave model (Couvelard et al., 2020). Additionally, including river inflows to account for significant precipitation during hurricanes may also be important. Employing a fully coupled ocean–atmosphere–wave model or a simplified atmospheric boundary layer model could further enable the simulation of the interactions and feedback mechanisms between the ocean and atmosphere (Lemarié et al., 2021). When coupled with increased resolution, adjustments based on land cover data, including the use of the Manning coefficient, canopy coefficient to mitigate wind stress from vegetation, and directional effective roughness length, could also be applied to refine surge amplitudes near the coast and inland (Dietrich et al., 2018).
The inclusion of the baroclinic response significantly impacts storm surge amplitudes for all hurricanes (Fig. 13b), with notable reductions in model underestimates and smaller MAEs depicted in Fig. 14. For example, maximum surge underestimations are reduced by up to 40 cm at a station in the southeastern Florida peninsula (USA). However, the correlation with tide gauge data remains unchanged, as shown by the negligible variance contribution of the baroclinic simulation for this metric in Fig. 13b. These improvements are attributed to large changes in general ocean circulation caused by hurricane passage. However, these simulations are computationally very expensive – approximately 70 times longer and requiring 15 times more computational resources – posing challenges not only for large-scale studies, long-term hindcasts, and long-term projections but also for operational applications requiring efficient results. Alternative approaches to incorporating these baroclinic processes without simulating the entire 3D column include using models in a 2D baroclinic mode (Westerink and Pringle, 2018) or adding baroclinic contributions as a postprocessing step (Zhai et al., 2019; Pringle et al., 2019).
This study aimed to examine various factors affecting the performance of numerical models in simulating extreme sea levels dominated by storm surges induced by hurricanes. The factors explored encompassed the choice of numerical models (ADCIRC and NEMO), oceanic and atmospheric forcings, physical parameterizations for wind stress, and baroclinic/barotropic modes. The study simulated four historical hurricanes in the tropical Atlantic region – Wilma (2005), Matthew (2016), Irma (2017), and Maria (2017) – covering the Caribbean Sea and Gulf of Mexico and evaluated the modelled storm surge maxima and hourly time series against tide gauge data.
The analysis of the numerical experiments revealed some interesting insights. Compared with tide gauges, both the ADCIRC and the NEMO models can simulate storm surges due to tropical cyclones in a similar manner. The accuracy of these models is highly dependent on atmospheric forcing, leading to regional variations. In the tropical Atlantic region studied here, the ERA5 atmospheric reanalysis generally outperforms parametric wind models in terms of the maximum surge values, correlations, and durations of extreme events. The inclusion of the baroclinic response significantly improves storm surge amplitudes, i.e. significantly reduces underestimates, in regions such as along the southeastern Florida peninsula (USA). Conversely, nonlinear interactions of tides and the mean sea level with storm surges, as well as different wind stress implementations, have minimal impacts on storm surges induced by hurricanes. These methodological insights will guide future research, especially in refining regional hindcasts and projections for the tropical Atlantic. By integrating these results and addressing uncertainties in the model and the configuration development, we aim to enhance the accuracy and reliability of storm surge estimates. Furthermore, these findings may also be used in coastal impact assessments to better understand and predict hurricane-induced coastal flooding and erosion. ADCIRC provides a wetting/drying option, which is crucial for coastal impact studies, such as floodplain inundation. NEMO also has this capability (O'Dea et al., 2020), and incorporating it for future coastal studies using NEMO would be highly beneficial.
These results rely primarily on the available tide gauge data, which are scarce and occasionally out of service during hurricane events. Currently, alternative observational products for accurately measuring storm surges are lacking, and satellite data are insufficient for capturing local surge details near the coast (Lobeto and Menendez, 2024).
NEMO version 4.0 was developed by the NEMO consortium (https://doi.org/10.5281/zenodo.3878122, Madec et al., 2019). All specificities included in the NEMO code are freely available (NEMO, 2024, https://www.nemo-ocean.eu/). The ADCIRC code is available from the project website (ADCIRC, 2024, http://adcirc.org/) under the terms stipulated there and is free for research or educational purposes.
The tide gauge data used for validation are available on the GESLA website (http://www.gesla.org, Haigh et al., 2023). ERA5 atmospheric forcings are available at the Climate Data Store (Copernicus Climate Change Service, Climate Data Store, 2023, https://doi.org/10.24381/cds.adbb2d47) in the context of the Copernicus Climate Change Service (C3S). The tidal forcing is available on the OSU TPXO Tide Models website (Egbert and Erofeeva, 2002, https://www.tpxo.net/home). The GLORYS ocean reanalysis product was obtained from the Copernicus Marine Service (Copernicus, 2024, https://doi.org/10.48670/moi-00021).
MM and AAC designed the study. AAC prepared the regional ocean configurations and performed the simulations. MRP prepared the parametric wind model forcings and helped to set up the ADCIRC ocean configuration. AT and AAC designed the variance decomposition analysis. AAC did the analyses of the simulations. MM and AT supervised the project. ACC wrote the first draft of the manuscript, and MRP wrote the parametric wind model sections. All authors contributed to paper revisions and read and approved the submitted version.
The contact author has declared that none of the authors has any competing interests.
Publisher's note: Copernicus Publications remains neutral with regard to jurisdictional claims made in the text, published maps, institutional affiliations, or any other geographical representation in this paper. While Copernicus Publications makes every effort to include appropriate place names, the final responsibility lies with the authors.
The authors are grateful to Clare O'Neill and Jeff Polton for sharing the NEMO barotropic code and to Chris Wilson for sharing the NEMO baroclinic Caribbean configuration. The tide gauge data used for validation are available on the GESLA website (http://www.gesla.org). Analyses were carried out with Python (utide and statsmodels packages). The unstructured mesh has been designed with SMS software.
Alisée A. Chaigneau and Alexandra Toimil have been supported by the government of Cantabria through the Fenix Project GFLOOD. Melisa Menéndez and Marta Ramírez-Pérez have been supported by the ThinkInAzul programme, with funding from 761 European Union NextGenerationEU/PRTR-C17.I1 and the Comunidad de Cantabria. Alexandra Toimil has been supported by the Ministerio de Ciencia e Innovación (MCIN/AEI and NextGenerationEU/PRTR) through the Ramón y Cajal programme (grant no. RYC2021-030873-I).
This paper was edited by Rachid Omira and reviewed by two anonymous referees.
ADCIRC: https://adcirc.org/, last access: 18 November 2024.
Adloff, F., Jordà, G., Somot, S., Sevault, F., Arsouze, T., Meyssignac, B., Li, L., and Planton, S.: Improving sea level simulation in Mediterranean regional climate models, Clim. Dynam., 51, 1167–1178, https://doi.org/10.1007/s00382-017-3842-3, 2018.
Arns, A., Wahl, T., Wolff, C., Vafeidis, A. T., Haigh, I. D., Woodworth, P., Niehüser, S., and Jensen, J.: Non-linear interaction modulates global extreme sea levels, coastal flood exposure, and impacts, Nat. Commun., 11, 1918, https://doi.org/10.1038/s41467-020-15752-5, 2020.
Bilskie, M. V., Angel, D. D., Yoskowitz, D., and Hagen, S. C.: Future Flood Risk Exacerbated by the Dynamic Impacts of Sea Level Rise Along the Northern Gulf of Mexico, Earths Future, 10, e2021EF002414, https://doi.org/10.1029/2021EF002414, 2022.
Bloemendaal, N., de Moel, H., Martinez, A. B., Muis, S., Haigh, I. D., van der Wiel, K., Haarsma, R. J., Ward, P. J., Roberts, M. J., Dullaart, J. C. M., and Aerts, J. C. J. H.: A globally consistent local-scale assessment of future tropical cyclone risk, Sci. Adv., 8, eabm8438, https://doi.org/10.1126/sciadv.abm8438, 2022.
Camelo, J., Mayo, T. L., and Gutmann, E. D.: Projected Climate Change Impacts on Hurricane Storm Surge Inundation in the Coastal United States, Front. Built Environ., 6, 588049, https://doi.org/10.3389/fbuil.2020.588049, 2020.
Cangialosi, J. P., Latto, A. S., and Berg, R.: Tropical Cyclone Report, Hurricane Irma, National Hurricane Center, https://www.nhc.noaa.gov/data/tcr/AL112017_Irma.pdf (last access: 18 November 2024), 2021.
Castellanos, E., Lemos, M. F., Astigarraga, L., Chaco, N., Cuvi, N., Huggel, C., Miranda, L., Moncassim Vale, M., Ometto, J. P., Peri, P. L., Postigo, J. C., Ramajo, L., Roco, L., and Rusticucci, M.: Central and South America, in: Climate Change 2022: Impacts, Adaptation and Vulnerability. Contribution of Working Group II to the Sixth Assessment Report of the Intergovernmental Panel on Climate Change, edited by: Pörtner, H.-O., Roberts, D. C., Tignor, M., Poloczanska, E. S., Mintenbeck, K., Alegri, A., Craig, M., Langsdorf, S., Löschke, S., Möller, V., Okem, A., Rama , B., Cambridge University Press, Cambridge, UK and New York, NY, USA, 1689–1816, https://doi.org/10.1017/9781009325844.014, 2022.
Cattiaux, J., Chauvin, F., Bousquet, O., Malardel, S., and Tsai, C.-L.: Projected Changes in the Southern Indian Ocean Cyclone Activity Assessed from High-Resolution Experiments and CMIP5 Models, J. Climate, 33, 4975–4991, https://doi.org/10.1175/JCLI-D-19-0591.1, 2020.
Chaigneau, A. A., Reffray, G., Voldoire, A., and Melet, A.: IBI-CCS: a regional high-resolution model to simulate sea level in western Europe, Geosci. Model Dev., 15, 2035–2062, https://doi.org/10.5194/gmd-15-2035-2022, 2022.
Charnock, H.: Wind stress on a water surface, Q. J. Roy. Meteor. Soc., 81, 639–640, https://doi.org/10.1002/qj.49708135027, 1955.
Chavas, D. R., Lin, N., and Emanuel, K.: A Model for the Complete Radial Structure of the Tropical Cyclone Wind Field. Part I: Comparison with Observed Structure, J. Atmos. Sci., 72, 3647–3662, https://doi.org/10.1175/JAS-D-15-0014.1, 2015.
Codiga, D. L.: Unified Tidal Analysis and Prediction Using the UTide Matlab Functions, Technical Report 2011-01, Graduate School of Oceanography, University of Rhode Island, Narragansett, RI, 59 pp., https://www.po.gso.uri.edu/codiga/utide/2011Codiga-UTide-Report.pdf (last access: 18 November 2024), 2011.
Copernicus: Reanalysis data, Marine Data Store [data set], https://doi.org/10.48670/moi-00021, 2024.
Copernicus Climate Change Service, Climate Data Store: ERA5 hourly data on single levels from 1940 to present. Copernicus Climate Change Service (C3S) Climate Data Store (CDS) [data set], https://doi.org/10.24381/cds.adbb2d47, 2023.
Couvelard, X., Lemarié, F., Samson, G., Redelsperger, J.-L., Ardhuin, F., Benshila, R., and Madec, G.: Development of a two-way-coupled ocean–wave model: assessment on a global NEMO(v3.6)–WW3(v6.02) coupled configuration, Geosci. Model Dev., 13, 3067–3090, https://doi.org/10.5194/gmd-13-3067-2020, 2020.
Deppermann, C. E., S. J.: Notes on the Origin and Structure of Philippine Typhoons, B. Am. Meteorol. Soc., 28, 399–404, https://doi.org/10.1175/1520-0477-28.9.399, 1947.
Dietrich, J. C., Kolar, R. L., and Luettich, R. A.: Assessment of ADCIRC's wetting and drying algorithm, in: Developments in Water Science, vol. 55, edited by: Miller, C. T. and Pinder, G. F., Elsevier, https://doi.org/10.1016/S0167-5648(04)80183-7, 1767–1778, 2004.
Dietrich, J. C., Tanaka, S., Westerink, J. J., Dawson, C. N., Luettich, R. A., Zijlema, M., Holthuijsen, L. H., Smith, J. M., Westerink, L. G., and Westerink, H. J.: Performance of the Unstructured-Mesh, SWAN+ADCIRC Model in Computing Hurricane Waves and Surge, J. Sci. Comput., 52, 468–497, https://doi.org/10.1007/s10915-011-9555-6, 2012.
Dietrich, J. C., Muhammad, A., Curcic, M., Fathi, A., Dawson, C. N., Chen, S. S., and Luettich, R. A.: Sensitivity of Storm Surge Predictions to Atmospheric Forcing during Hurricane Isaac, J. Waterw. Port Coast., 144, 04017035, https://doi.org/10.1061/(ASCE)WW.1943-5460.0000419, 2018.
Done, J. M., Ge, M., Holland, G. J., Dima-West, I., Phibbs, S., Saville, G. R., and Wang, Y.: Modelling global tropical cyclone wind footprints, Nat. Hazards Earth Syst. Sci., 20, 567–580, https://doi.org/10.5194/nhess-20-567-2020, 2020.
Dullaart, J. C. M., Muis, S., Bloemendaal, N., and Aerts, J. C. J. H.: Advancing global storm surge modelling using the new ERA5 climate reanalysis, Clim. Dynam., 54, 1007–1021, https://doi.org/10.1007/s00382-019-05044-0, 2020.
Dullaart, J. C. M., Muis, S., Bloemendaal, N., Chertova, M. V., Couasnon, A., and Aerts, J. C. J. H.: Accounting for tropical cyclones more than doubles the global population exposed to low-probability coastal flooding, Commun. Earth Environ., 2, 135, https://doi.org/10.1038/s43247-021-00204-9, 2021.
Dullaart, J. C. M., de Vries, H., Bloemendaal, N., Aerts, J. C. J. H., and Muis, S.: Improving our understanding of future tropical cyclone intensities in the Caribbean using a high-resolution regional climate model, Sci. Rep., 14, 6108, https://doi.org/10.1038/s41598-023-49685-y, 2024.
Egbert, G. D. and Erofeeva, S. Y.: Efficient Inverse Modeling of Barotropic Ocean Tides, J. Atmos. Ocean. Tech., 19, 183–204, https://doi.org/10.1175/1520-0426(2002)019<0183:EIMOBO>2.0.CO;2, 2002 (data available at: https://www.tpxo.net/home, last access: 18 November 2024).
Emanuel, K.: Tropical cyclone energetics and structure, in: Atmospheric Turbulence and Mesoscale Meteorology, edited by: Fedorovich, E., Rotunno, R., and Stevens, B., Cambridge University Press, https://doi.org/10.1017/CBO9780511735035.010, 165–192, 2004.
Emanuel, K. and Rotunno, R.: Self-Stratification of Tropical Cyclone Outflow. Part I: Implications for Storm Structure, J. Atmos. Sci., 68, 2236–2249, https://doi.org/10.1175/JAS-D-10-05024.1, 2011.
Ezer, T.: On the interaction between a hurricane, the Gulf Stream and coastal sea level, Ocean Dynam., 68, 1259–1272, https://doi.org/10.1007/s10236-018-1193-1, 2018.
Fernández-Montblanc, T., Vousdoukas, M. I., Ciavola, P., Voukouvalas, E., Mentaschi, L., Breyiannis, G., Feyen, L., and Salamon, P.: Towards robust pan-European storm surge forecasting, Ocean Model., 133, 129–144, https://doi.org/10.1016/j.ocemod.2018.12.001, 2019.
Fleming, J. G., Fulcher, C. W., Luettich, R. A., Estrade, B. D., Allen, G. D., and Winer, H. S.: A Real Time Storm Surge Forecasting System Using ADCIRC, in: Estuarine and Coastal Modeling (2007), 893–912, https://doi.org/10.1061/40990(324)48, 2012.
Fox-Kemper, B., Hewitt, H. T., Xiao, C., Aðalgeirsdóttir, G., Drijfhout, S. S., Edwards, T. L., Golledge, N. R., Hemer, M., Kopp, R. E., Krinner, G., Mix, A., Notz, D., Nowicki, S., Nurhati, I. S., Ruiz, L., Sallée, J.-B., Slangen, A. B. A., and Yu, Y.: Ocean, Cryosphere and Sea Level Change, in: Climate Change 2021: The Physical Science Basis. Contribution of Working Group I to the Sixth Assessment Report of the Intergovernmental Panel on Climate Change, edited by: Masson-Delmotte, V., Zhai, P., Pirani, A., Connors, S. L., Péan, C., Berger, S., Caud, N., Chen, Y., Goldfarb, L., Gomis, M. I., Huang, M., Leitzell, K., Lonnoy, E., Matthews, J. B. R., Maycock, T. K., Waterfield, T., Yelekçi, O., Yu, R., and Zhou, B., Cambridge University Press, Cambridge, United Kingdom and New York, NY, USA, 1211–1362, https://doi.org/10.1017/9781009157896.011, 2021.
Gao, J., Luettich, R., Rosman, J., Dietrich, C., Blanton, B., and Bane, J.: ON THE SURFACE WIND STRESS FOR STORM SURGE MODELING, Dissertation, Carolina Digital Repository, https://doi.org/10.17615/zpeb-7k73, 2018.
Garric G. and Parent L.: Quality Information Document (CMEMS-GLO-QUID-001-025-011-017), https://catalogue.marine.copernicus.eu/documents/QUID/CMEMS-GLO-QUID-001-025-011-017.pdf (last access: 7 March 2022), 2017.
Gori, A., Lin, N., Schenkel, B., and Chavas, D.: North Atlantic Tropical Cyclone Size and Storm Surge Reconstructions From 1950–Present, J. Geophys. Res.-Atmos., 128, e2022JD037312, https://doi.org/10.1029/2022JD037312, 2023.
Haigh, I. D., MacPherson, L. R., Mason, M. S., Wijeratne, E. M. S., Pattiaratchi, C. B., Crompton, R. P., and George, S.: Estimating present day extreme water level exceedance probabilities around the coastline of Australia: tropical cyclone-induced storm surges, Clim. Dynam., 42, 139–157, https://doi.org/10.1007/s00382-012-1653-0, 2014.
Haigh, I. D., Marcos, M., Talke, S. A., Woodworth, P. L., Hunter, J. R., Hague, B. S., Arns, A., Bradshaw, E., and Thompson, P.: GESLA Version 3: A major update to the global higher-frequency sea-level dataset, Geosci. Data J., 10, 293–314, https://doi.org/10.1002/gdj3.174, 2023 (data available at: http://www.gesla.org, last access: 18 November 2024).
Hersbach, H., Bell, B., Berrisford, P., Hirahara, S., Horányi, A., Muñoz-Sabater, J., Nicolas, J., Peubey, C., Radu, R., Schepers, D., Simmons, A., Soci, C., Abdalla, S., Abellan, X., Balsamo, G., Bechtold, P., Biavati, G., Bidlot, J., Bonavita, M., De Chiara, G., Dahlgren, P., Dee, D., Diamantakis, M., Dragani, R., Flemming, J., Forbes, R., Fuentes, M., Geer, A., Haimberger, L., Healy, S., Hogan, R. J., Hólm, E., Janisková, M., Keeley, S., Laloyaux, P., Lopez, P., Lupu, C., Radnoti, G., de Rosnay, P., Rozum, I., Vamborg, F., Villaume, S., and Thépaut, J.-N.: The ERA5 global reanalysis, Q. J. Roy. Meteor. Soc., 146, 1999–2049, https://doi.org/10.1002/qj.3803, 2020.
Hicke, J. A., Lucatello, S., Mortsch, L. D., Dawson, J., Domiguez Aguilar, M., Enquist, C. A. F., Gilmore, E. A., Gutzler, D. S., Harper, S., Holsman, K., Jewett, E. B., Kohler, T. A., and Miller, K. A.: North America, in: Climate Change 2022: Impacts, Adaptation and Vulnerability. Contribution of Working Group II to the Sixth Assessment Report of the Intergovernmental Panel on Climate Change, edited by: Pörtner, H.-O., Roberts, D. C., Tignor, M., Poloczanska, E. S., Mintenbeck, K., Alegri, A., Craig, M., Langsdorf, S., Löschke, S., Möller, V., Okem, A., and Rama , B., Cambridge University Press, Cambridge, UK and New York, NY, USA, https://doi.org/10.1017/9781009325844.016, 1929–2042, 2022.
Hodges, K., Cobb, A., and Vidale, P. L.: How Well Are Tropical Cyclones Represented in Reanalysis Datasets?, J. Climate, 30, 5243–5264, https://doi.org/10.1175/JCLI-D-16-0557.1, 2017.
Holland, G. J.: An Analytic Model of the Wind and Pressure Profiles in Hurricanes, Mon. Weather Rev., 108, 1212–1218, https://doi.org/10.1175/1520-0493(1980)108<1212:AAMOTW>2.0.CO;2, 1980.
Hsiao, S.-C., Chen, H., Chen, W.-B., Chang, C.-H., and Lin, L.-Y.: Quantifying the contribution of nonlinear interactions to storm tide simulations during a super typhoon event, Ocean Eng., 194, 106661, https://doi.org/10.1016/j.oceaneng.2019.106661, 2019.
Hsu, C.-E., Serafin, K. A., Yu, X., Hegermiller, C. A., Warner, J. C., and Olabarrieta, M.: Total water levels along the South Atlantic Bight during three along-shelf propagating tropical cyclones: relative contributions of storm surge and wave runup, Nat. Hazards Earth Syst. Sci., 23, 3895–3912, https://doi.org/10.5194/nhess-23-3895-2023, 2023.
Idier, D., Bertin, X., Thompson, P., and Pickering, M. D.: Interactions Between Mean Sea Level, Tide, Surge, Waves and Flooding: Mechanisms and Contributions to Sea Level Variations at the Coast, Surv. Geophys., 40, 1603–1630, https://doi.org/10.1007/s10712-019-09549-5, 2019.
Irazoqui Apecechea, M., Melet, A., and Armaroli, C.: Towards a pan-European coastal flood awareness system: Skill of extreme sea-level forecasts from the Copernicus Marine Service, Front. Mar. Sci., 9, 1091844, https://doi.org/10.3389/fmars.2022.1091844, 2023.
Jamous, M., Marsooli, R., and Miller, J. K.: Physics-based modeling of climate change impact on hurricane-induced coastal erosion hazards, npj Clim. Atmos. Sci., 6, 1–10, https://doi.org/10.1038/s41612-023-00416-0, 2023.
Janssen, P. A. E. M.: Wave-Induced Stress and the Drag of Air Flow over Sea Waves, J. Phys. Oceanogr., 19, 745–754 https://doi.org/10.1175/1520-0485(1989)019<0745:WISATD>2.0.CO;2, 1989.
Kirezci, E., Young, I. R., Ranasinghe, R., Muis, S., Nicholls, R. J., Lincke, D., and Hinkel, J.: Projections of global-scale extreme sea levels and resulting episodic coastal flooding over the 21st Century, Sci. Rep., 10, 11629, https://doi.org/10.1038/s41598-020-67736-6, 2020.
Knapp, K. R., Kruk, M. C., Levinson, D. H., Diamond, H. J., and Neumann, C. J.: The International Best Track Archive for Climate Stewardship (IBTrACS): Unifying Tropical Cyclone Data, B. Am. Meteorol. Soc., 91, 363–376, https://doi.org/10.1175/2009BAMS2755.1, 2010.
Knapp, K. R., Diamond, H. J., Kossin, J. P., Kruk, M. C., Schreck, C. J.: International Best Track Archive for Climate Stewardship (IBTrACS) Project, Version 4, NOAA National Centers for Environmental Information, 2018.
Knutson, T., Camargo, S. J., Chan, J. C. L., Emanuel, K., Ho, C.-H., Kossin, J., Mohapatra, M., Satoh, M., Sugi, M., Walsh, K., and Wu, L.: Tropical Cyclones and Climate Change Assessment: Part II: Projected Response to Anthropogenic Warming, B. Am. Meteorol. Soc., 101, E303–E322, https://doi.org/10.1175/BAMS-D-18-0194.1, 2020.
Kodaira, T., Thompson, K. R., and Bernier, N. B.: The effect of density stratification on the prediction of global storm surges, Ocean Dynam., 66, 1733–1743, https://doi.org/10.1007/s10236-016-1003-6, 2016.
Lemarié, F., Samson, G., Redelsperger, J.-L., Giordani, H., Brivoal, T., and Madec, G.: A simplified atmospheric boundary layer model for an improved representation of air–sea interactions in eddying oceanic models: implementation and first evaluation in NEMO (4.0), Geosci. Model Dev., 14, 543–572, https://doi.org/10.5194/gmd-14-543-2021, 2021.
Lemos, G., Semedo, A., Dobrynin, M., Menendez, M., and Miranda, P. M. A.: Bias-Corrected CMIP5-Derived Single-Forcing Future Wind-Wave Climate Projections toward the End of the Twenty-First Century, J. Appl. Meteorol. Clim., 59, 1393–1414, https://doi.org/10.1175/JAMC-D-19-0297.1, 2020.
Li, D., Feng, J., Xu, Z., Yin, B., Shi, H., and Qi, J.: Statistical Bias Correction for Simulated Wind Speeds Over CORDEX-East Asia, Earth Space Sci., 6, 200–211, https://doi.org/10.1029/2018EA000493, 2019.
Lobeto, H. and Menendez, M.: Variability Assessment of Global Extreme Coastal Sea Levels Using Altimetry Data, Remote Sens.-Basel, 16, 1355, https://doi.org/10.3390/rs16081355, 2024.
Luettich Jr., R. A. and Westerink, J. J.: Implementation of Bridge Pilings in the ADCIRC Hydrodynamic Model: Upgrade and Documentation for ADCIRC Version 34.19, https://adcirc.org/wp-content/uploads/sites/2255/2018/11/1999_Luettich03.pdf (last access: 18 November 2024), 1999.
Luettich, R. A., Westerink, J. J., and Scheffner, N. W.: ADCIRC: an advanced three-dimensional circulation model for shelves, coasts, and estuaries. Report 1, Theory and methodology of ADCIRC-2DD1 and ADCIRC-3DL, This Digital Resource was created from scans of the Print Resource, Coastal Engineering Research Center (U.S.), https://apps.dtic.mil/sti/tr/pdf/ADA276150.pdf (last access: 18 November 2024), 1992.
Madec, G., Bourdallé-Badie, J., Clementi, E., Coward, A., Ethé, C., Iovino, D., Lea, D., Lévy, C., Lovato, T., Martin, N., Masson, S., Mocavero, S., Rousset, C., Storkey, D., Vancoppenolle, M., Müeller, S., Nurser, G., Bell, M., and Samson, G.: NEMO ocean engine, Zenodo [code], https://doi.org/10.5281/zenodo.3878122, 2019.
Madec, G., Bell, M., Blaker, A., Bricaud, C., Bruciaferri, D., Castrillo, M., Calvert, D., Jérômeme Chanut, Clementi, E., Coward, A., Epicoco, I., Éthé, C., Ganderton, J., Harle, J., Hutchinson, K., Iovino, D., Lea, D., Lovato, T., Martin, M., Martin, N., Mele, F., Martins, D., Masson, S., Mathiot, P., Mele, F., Mocavero, S., Müller, S., Nurser, A. J. G., Paronuzzi, S., Peltier, M., Person, R., Rousset, C., Rynders, S., Samson, G., Téchené, S., Vancoppenolle, M., and Wilson, C.: NEMO Ocean Engine Reference Manual, Zenodo [code], https://doi.org/10.5281/ZENODO.1464816, 2023.
Makris, C. V., Tolika, K., Baltikas, V. N., Velikou, K., and Krestenitis, Y. N.: The impact of climate change on the storm surges of the Mediterranean Sea: Coastal sea level responses to deep depression atmospheric systems, Ocean Model., 181, 102149, https://doi.org/10.1016/j.ocemod.2022.102149, 2023.
Marsooli, R. and Lin, N.: Numerical Modeling of Historical Storm Tides and Waves and Their Interactions Along the U. S. East and Gulf Coasts, J. Geophys. Res.-Oceans, 123, 3844–3874, https://doi.org/10.1029/2017JC013434, 2018.
Martín, A., Amores, A., Orfila, A., Toomey, T., and Marcos, M.: Coastal extreme sea levels in the Caribbean Sea induced by tropical cyclones, Nat. Hazards Earth Syst. Sci., 23, 587–600, https://doi.org/10.5194/nhess-23-587-2023, 2023.
McMichael, C., Dasgupta, S., Ayeb-Karlsson, S., and Kelman, I.: A review of estimating population exposure to sea-level rise and the relevance for migration, Environ. Res. Lett., 15, 123005, https://doi.org/10.1088/1748-9326/abb398, 2020.
Moon, I.-J., Ginis, I., and Hara, T.: Effect of surface waves on Charnock coefficient under tropical cyclones, Geophys. Res. Lett., 31, L20302, https://doi.org/10.1029/2004GL020988, 2004.
Muis, S., Verlaan, M., Winsemius, H. C., Aerts, J. C. J. H., and Ward, P. J.: A global reanalysis of storm surges and extreme sea levels, Nat. Commun., 7, 11969, https://doi.org/10.1038/ncomms11969, 2016.
Muis, S., Lin, N., Verlaan, M., Winsemius, H. C., Ward, P. J., and Aerts, J. C. J. H.: Spatiotemporal patterns of extreme sea levels along the western North-Atlantic coasts, Sci. Rep., 9, 3391, https://doi.org/10.1038/s41598-019-40157-w, 2019.
Muis, S., Apecechea, M. I., Dullaart, J., de Lima Rego, J., Madsen, K. S., Su, J., Yan, K., and Verlaan, M.: A High-Resolution Global Dataset of Extreme Sea Levels, Tides, and Storm Surges, Including Future Projections, Front. Mar. Sci., 7, 263, https://doi.org/10.3389/fmars.2020.00263, 2020.
Muis, S., Aerts, J. C. J. H., Á. Antolínez, J. A., Dullaart, J. C., Duong, T. M., Erikson, L., Haarsma, R. J., Apecechea, M. I., Mengel, M., Le Bars, D., O'Neill, A., Ranasinghe, R., Roberts, M. J., Verlaan, M., Ward, P. J., and Yan, K.: Global Projections of Storm Surges Using High-Resolution CMIP6 Climate Models, Earths Future, 11, e2023EF003479, https://doi.org/10.1029/2023EF003479, 2023.
Neumann, B., Vafeidis, A. T., Zimmermann, J., and Nicholls, R. J.: Future Coastal Population Growth and Exposure to Sea-Level Rise and Coastal Flooding - A Global Assessment, PLOS ONE, 10, e0118571, https://doi.org/10.1371/journal.pone.0118571, 2015.
NEMO: https://www.nemo-ocean.eu/, last access: 18 November 2024.
O'Dea, E., Bell, M. J., Coward, A., and Holt, J.: Implementation and assessment of a flux limiter based wetting and drying scheme in NEMO, Ocean Model., 155, 101708, https://doi.org/10.1016/j.ocemod.2020.101708, 2020.
O'Neill, C., Saulter, A., Williams, J., and Horsburgh, K.: Storm surge forecasting and other Met Office ocean modelling, https://digital.nmla.metoffice.gov.uk/IO_53fa4f69-432c-40bb-9481-8c7dfbd6492d/ (last access: 18 November 2014), 2016.
Parker, K., Erikson, L., Thomas, J., Nederhoff, K., Barnard, P., and Muis, S.: Relative contributions of water-level components to extreme water levels along the US Southeast Atlantic Coast from a regional-scale water-level hindcast, Nat. Hazards, 117, 2219–2248, https://doi.org/10.1007/s11069-023-05939-6, 2023.
Pasch, R. J., Blake, E. S., Cobb III, H. D., and Roberts, D. P.: Tropical Cyclone Report, Hurricane Wilma, National Hurricane Center, https://www.nhc.noaa.gov/data/tcr/AL252005_Wilma.pdf (last access: 18 November 2024), 2006.
Pasch, R. J., Penny, A. B., and Berg, R.: Tropical Cyclone Report, Hurricane Maria, National Hurricane Center, https://www.nhc.noaa.gov/data/tcr/AL152017_Maria.pdf (last access: 18 November 2024), 2023.
Pineau-Guillou, L., Bouin, M.-N., Ardhuin, F., Lyard, F., Bidlot, J.-R., and Chapron, B.: Impact of wave-dependent stress on storm surge simulations in the North Sea: Ocean model evaluation against in situ and satellite observations, Ocean Model., 154, 101694, https://doi.org/10.1016/j.ocemod.2020.101694, 2020.
Powell, M. D., Houston, S. H., Amat, L. R., and Morisseau-Leroy, N.: The HRD real-time hurricane wind analysis system, J. Wind Eng. Ind. Aerod., 77–78, 53–64, https://doi.org/10.1016/S0167-6105(98)00131-7, 1998.
Pringle, W. J., Gonzalez-Lopez, J., Joyce, B. R., Westerink, J. J., and van der Westhuysen, A. J.: Baroclinic Coupling Improves Depth-Integrated Modeling of Coastal Sea Level Variations Around Puerto Rico and the U. S. Virgin Islands, J. Geophys. Res.-Oceans, 124, 2196–2217, https://doi.org/10.1029/2018JC014682, 2019.
Pringle, W. J., Wirasaet, D., Roberts, K. J., and Westerink, J. J.: Global storm tide modeling with ADCIRC v55: unstructured mesh design and performance, Geosci. Model Dev., 14, 1125–1145, https://doi.org/10.5194/gmd-14-1125-2021, 2021.
Qin, Y., Su, C., Chu, D., Zhang, J., and Song, J.: A Review of Application of Machine Learning in Storm Surge Problems, J. Mar. Sci. Eng., 11, 1729, https://doi.org/10.3390/jmse11091729, 2023.
Rankine, W. J. M.: A Manual of Applied Physics, 10th edn., Charles Griffin and Co., London, 663 pp., https://archive.org/details/manualappmecha00rankrich (last access: 18 November 2024), 1882.
Riverside Technology Inc. and AECOM: Mesh Development, Tidal Validation, and Hindcast Skill Assessment of an ADCIRC Model for the Hurricane Storm Surge Operational Forecast System on the US Gulf-Atlantic Coast, technical report, https://doi.org/10.17615/4z19-y130, 2015.
Roberts, M. J., Camp, J., Seddon, J., Vidale, P. L., Hodges, K., Vannière, B., Mecking, J., Haarsma, R., Bellucci, A., Scoccimarro, E., Caron, L.-P., Chauvin, F., Terray, L., Valcke, S., Moine, M.-P., Putrasahan, D., Roberts, C. D., Senan, R., Zarzycki, C., Ullrich, P., Yamada, Y., Mizuta, R., Kodama, C., Fu, D., Zhang, Q., Danabasoglu, G., Rosenbloom, N., Wang, H., and Wu, L.: Projected Future Changes in Tropical Cyclones Using the CMIP6 HighResMIP Multimodel Ensemble, Geophys. Res. Lett., 47, e2020GL088662, https://doi.org/10.1029/2020GL088662, 2020.
Royston, S., Bingham, R. J., and Bamber, J. L.: Attributing decadal climate variability in coastal sea-level trends, Ocean Sci., 18, 1093–1107, https://doi.org/10.5194/os-18-1093-2022, 2022.
Schloemer, R. W.: Analysis and Synthesis of Hurricane Wind Patterns over Lake Okeechobee, Florida (No. 31), US Department of Commerce, Weather Bureau, https://scholar.google.com/scholar_lookup?title=Analysis and Synthesis of Hurricane Wind Patterns over Lake Okeechobee (last access: 18 November 2024), 1954.
Smith, S. D. and Banke, E. G.: Variation of the sea surface drag coefficient with wind speed, Q. J. Roy. Meteor. Soc., 101, 665–673, https://doi.org/10.1002/qj.49710142920, 1975.
Staneva, J., Ricker, M., Carrasco Alvarez, R., Breivik, Ø., and Schrum, C.: Effects of Wave-Induced Processes in a Coupled Wave–Ocean Model on Particle Transport Simulations, Water, 13, 415, https://doi.org/10.3390/w13040415, 2021.
Stewart, S. R.: Tropical Cyclone Report, Hurricane Matthew, National Hurricane Center, https://www.nhc.noaa.gov/data/tcr/AL142016_Matthew.pdf (last access: 18 November 2024), 2017.
Storch, H. von and Zwiers, F. W.: Statistical Analysis in Climate Research, Cambridge University Press, Cambridge, https://doi.org/10.1017/CBO9780511612336, 1999.
Tadesse, M., Wahl, T., and Cid, A.: Data-Driven Modeling of Global Storm Surges, Front. Mar. Sci., 7, 260, https://doi.org/10.3389/fmars.2020.00260, 2020.
Toomey, T., Amores, A., Marcos, M., Orfila, A., and Romero, R.: Coastal Hazards of Tropical-Like Cyclones Over the Mediterranean Sea, J. Geophys. Res.-Oceans, 127, e2021JC017964, https://doi.org/10.1029/2021JC017964, 2022.
van Westen, R. M., Dijkstra, H. A., and Bloemendaal, N.: Mechanisms of tropical cyclone response under climate change in the community earth system model, Clim. Dynam., 61, 2269–2284, https://doi.org/10.1007/s00382-023-06680-3, 2023.
Vousdoukas, M. I., Mentaschi, L., Voukouvalas, E., Verlaan, M., Jevrejeva, S., Jackson, L. P., and Feyen, L.: Global probabilistic projections of extreme sea levels show intensification of coastal flood hazard, Nat. Commun., 9, 2360, https://doi.org/10.1038/s41467-018-04692-w, 2018.
Wang, S., Lin, N., and Gori, A.: Investigation of Tropical Cyclone Wind Models With Application to Storm Tide Simulations, J. Geophys. Res.-Atmos., 127, e2021JD036359, https://doi.org/10.1029/2021JD036359, 2022.
Westerink, J. and Pringle, W.: Exploring Baroclinic Mode 2D ADCIRC to Capture Inter/Intra-annual Sea Surface Variations, technical report, https://doi.org/10.17615/e5y0-kp16, 2018.
Westerink, J., Luettich, J., Richard, Blain, C., and Scheffner, N.: ADCIRC: An Advanced Three-Dimensional Circulation Model for Shelves, Coasts, and Estuaries, Report 2, User's Manual for ADCIRC-2DDI, 168, https://apps.dtic.mil/sti/tr/pdf/ADA276150.pdf (last access: 18 November 2024), 1994.
Willoughby, H. E., Darling, R. W. R., and Rahn, M. E.: Parametric Representation of the Primary Hurricane Vortex. Part II: A New Family of Sectionally Continuous Profiles, Mon. Weather Rev., 134, 1102–1120, https://doi.org/10.1175/MWR3106.1, 2006.
Wilson, C., Harle, J., and Wakelin, S.: NEMO regional configuration of the Caribbean, Zenodo [code], https://doi.org/10.5281/ZENODO.3228088, 2019.
Wood, M., Haigh, I. D., Le, Q. Q., Nguyen, H. N., Tran, H. B., Darby, S. E., Marsh, R., Skliris, N., Hirschi, J. J.-M., Nicholls, R. J., and Bloemendaal, N.: Climate-induced storminess forces major increases in future storm surge hazard in the South China Sea region, Nat. Hazards Earth Syst. Sci., 23, 2475–2504, https://doi.org/10.5194/nhess-23-2475-2023, 2023.
Woodworth, P. L., Melet, A., Marcos, M., Ray, R. D., Wöppelmann, G., Sasaki, Y. N., Cirano, M., Hibbert, A., Huthnance, J. M., Monserrat, S., and Merrifield, M. A.: Forcing Factors Affecting Sea Level Changes at the Coast, Surv. Geophys., 40, 1351–1397, https://doi.org/10.1007/s10712-019-09531-1, 2019.
Wu, L., Sahlée, E., Nilsson, E., and Rutgersson, A.: A review of surface swell waves and their role in air–sea interactions, Ocean Model., 190, 102397, https://doi.org/10.1016/j.ocemod.2024.102397, 2024.
Xie, L., Liu, H., Liu, B., and Bao, S.: A numerical study of the effect of hurricane wind asymmetry on storm surge and inundation, Ocean Model., 36, 71–79, https://doi.org/10.1016/j.ocemod.2010.10.001, 2011.
Ye, F., Zhang, Y. J., Yu, H., Sun, W., Moghimi, S., Myers, E., Nunez, K., Zhang, R., Wang, H. V., Roland, A., Martins, K., Bertin, X., Du, J., and Liu, Z.: Simulating storm surge and compound flooding events with a creek-to-ocean model: Importance of baroclinic effects, Ocean Model., 145, 101526, https://doi.org/10.1016/j.ocemod.2019.101526, 2020.
Yin, J., Lin, N., and Yu, D.: Coupled modeling of storm surge and coastal inundation: A case study in New York City during Hurricane Sandy, Water Resour. Res., 52, 8685–8699, https://doi.org/10.1002/2016WR019102, 2016.
Zhai, L., Greenan, B., Thomson, R., and Tinis, S.: Use of Oceanic Reanalysis to Improve Estimates of Extreme Storm Surge, J. Atmos. Ocean. Tech., 36, 2205–2219, https://doi.org/10.1175/JTECH-D-19-0015.1, 2019.


