the Creative Commons Attribution 4.0 License.
the Creative Commons Attribution 4.0 License.
The World Wide Lightning Location Network (WWLLN) over Spain
Jorge A. Portí
Alfonso Salinas
Sergio Toledo-Redondo
Jaume Segura-García
Aida Castilla
Víctor Montagud-Camps
Inmaculada Albert
The World Wide Lightning Location Network (WWLLN) operates a distributed network of stations which detect lightning signals at a planetary scale. Very high currents from lightning strokes radiate strong very low frequency signals in the 6–22 kHz band, which are detected up to 10 000 km away by the WWLLN stations and which are used to determine the time and position of the lightning stroke detected by triangulation, similarly to global positioning systems. Studies of the performance of the WWLLN in different areas around the world have already been reported in the literature, but similar studies for west European regions are still unavailable. This work presents a study to determine the detection efficiency and location accuracy of the WWLLN over Spain by comparing its data with those of the Spanish State Meteorological Agency, AEMET, during 2012 taken as the ground truth. The study provides a detection efficiency for the WWLLN of around 29 % and a location accuracy of between 2 and 3 km. The efficiency for high-energy strokes is considerably higher. A study of four subregions with different geographical features is also considered. The peak current distribution of lightning events in these regions is obtained, and a possible link to the WWLLN performance is discussed. Finally, an application of the WWLLN data for three major storms in 2020, 2021, and 2022 in the Mediterranean area of Spain demonstrates that the WWLLN is well suited for tracking the time evolution of adverse meteorological phenomena.
- Article
(12319 KB) - Full-text XML
- BibTeX
- EndNote
An important objective of regional and national lightning location networks is the detection and tracking of cloud-to-ground (CG) lightning strokes. The CG lightning strokes coexist with cloud-to-cloud (CC) and intra-cloud (IC) discharges. While the study of IC events is of great interest because they are considered a more important natural source of high-frequency and very high frequency radiation (Thomas et al., 2001) and are of direct interest to air traffic controllers, for instance, the social interest in monitoring and detecting CG activity relies on the fact that CG discharges are the main discharge type that pose a danger to people and cause death and other economic damage, such as forest fire or other disasters. Lightning activity is also important in areas such as energy and telecommunication network management. In the year 2023, the risk of forest fire was extremely high due to the long period of drought affecting the Iberian Peninsula; therefore, lightning activity information may be of great social interest in preventing fire (Benito-Verdugo et al., 2023; Pérez-Invernón et al., 2023; Rodrigues et al., 2023). Additionally, lightning discharges are closely related to storm dynamics and provide much relevant meteorological information, relevance which is currently growing because it seems that global warming is accelerating (Ciracì et al., 2023).
Global networks, such as the Earth Networks Total Lightning Network (ENTLN), https://www.earthnetworks.com/ (last access: 6 March 2024); the Global Lightning Detection Network GLD360 of Vaisala, https://www.vaisala.com/en/products/systems/lightning/gld360 (last access: 6 March 2024); or the World Wide Lightning Location Network (WWLLN), https://wwlln.net/ (last access: 6 March 2024), provide global Earth information for the purpose of monitoring these atmospheric phenomena and enabling users faster access to locations and warnings of storms and other forms of severe weather hazards, such as tornadoes, downbursts, and hail. Knowing the accuracy of the data provided by these networks is very important for potential customers who might use or analyze those data.
Different works clearly show the interest in the use of the WWLLN as a fundamental tool to study different geophysical aspects concerning global lightning activity across the Earth. A comparison of the lightning activity in two areas of the Congo Basin during the years 2012 and 2013, based on data from the WWLLN, can be found in Kigotsi et al. (2018). The network's capacity for analysis at a global scale is used in Ccopa et al. (2021) to compare the lightning activity during the years 2012 and 2013 with the universal Carnegie curve. The relation between storms and gravity waves and their effect on the ionosphere are addressed in Chowdhury et al. (2023) using data from the WWLLN and satellite observations from the Global Navigation Satellite System – Total Electron Content (GNSS-TEC) database. A local use of the WWLLN is presented in Chowdhury et al. (2023), in which a study of the energetic electron precipitation in the Van Allen belts induced by lightning activity is carried out. New and unexpected studies naturally emerge from the existence of these global networks. For example, Jacobson et al. (2021) address the problem of identifying which part of the attenuation produced in the extremely low frequency band, from 5 to 20 Hz, originates from reflections in the D layer of the ionosphere. It is precisely the information provided by globally distributed stations such as those of the WWLLN that helps in designing a model to study wave propagation in the natural electromagnetic cavity defined by the Earth's surface and the lower ionosphere.
Currently, the performance of the WWLLN is well established for different areas of the Earth, including Brazil (Lay et al., 2004), Australia (Rodger et al., 2004, 2005), Aotearoa / New Zealand (Rodger et al., 2006), the United States (Abarca et al., 2010), China (Fan et al., 2018), and part of the Western Hemisphere (Rudlosky and Shea, 2013; Thompson et al., 2014). However, analysis of the WWLLN's technical performance in other regions is still missing. The main goal of this work is to determine the performance of the WWLLN in Spain in terms of providing accurate data for the study of lightning or related events in this zone and surrounding areas. To this aim, an initial comparative study is carried out to determine the detection efficiency (DE) and location accuracy (LA) of the WWLLN over Spain in continental and insular regions together with surrounding seas. The WWLLN data are compared with independent data taken from the Spanish State Meteorological Agency, AEMET, which are considered the ground truth. These reference data from AEMET were openly accessible and cover the period from 1 January 2012 to 30 April 2012; soon after, a new WWLLN station, the 69th one, was installed by the University of Valencia, and it has been continuously operating since June 2011. Our work will show that the WWLLN provides values for the DE and LA in the area of Spain which are higher than those that have been reported up to the present, with remarkable results for high-peak-current lightning strokes. A subsequent second study concerning four Spanish subregions with different geographical characteristics is detailed to detect possible variations in the WWLLN performance and their link to differences in the energy distribution of lightning strokes in these areas. It must be noted that the study presented here provides the performance of the WWLLN during 2012 and that subsequent technical developments of the WWLLN mean that these values must be understood to be of direct interest only for studies focused on lightning activity evolution or as lower bounds for the current WWLLN performance in Spain and surrounding areas. Once the technical capabilities of the WWLLN in Spain are established in this work, its use in monitoring three events of strong lightning and hail activity which more recently affected the area of Valencia, in the east of Spain, in 2020, 2021, and 2022, respectively, will be analyzed.
The paper is organized as follows. Section 2 describes the main characteristics of the WWLLN. Section 3 includes some details on the AEMET network used as reference. Section 4 presents and discusses the main results concerning the initial study of the WWLLN performance in Spain, giving its DE and LA parameters in five cases. First, the whole Spanish region is considered; this is followed by a study of four geographically different subregions and the possible link between the variations in the energy distribution of the storms in these areas and the WWLLN performance. A final and more qualitative example is presented in Sect. 4.3, which shows the capabilities of the WWLLN to successfully monitor the evolution of three severe storms which affected Valencia between 2020 and 2022. The main conclusions of the work are finally summarized in Sect. 5.
The WWLLN under study in this work operates a ground-based globally distributed network of stations with very low frequency (VLF) antennas that detect lightning electromagnetic signals around the Earth. Very high currents from lightning radiate strong VLF signals in the 6–22 kHz band, which are detected at distances of up to 10 000 km. The WWLLN was deployed by the University of Washington (USA) and the University of Otago (Aotearoa / New Zealand), with the cooperation of and maintenance carried out by a large number of universities and research institutions around the world. The distribution of associated active stations across the whole Earth, at slightly more than 60 active stations since 2014 (Holzworth et al., 2021), makes it possible for the WWLLN to obtain the global locations of lightning strokes at a planetary scale with continually improved accuracy (Dowden et al., 2002; Lay et al., 2004; Jacobson et al., 2006; Rodger et al., 2005, 2006, 2009; Shevtsov et al., 2016).
From an electromagnetic point of view, the Earth's atmosphere can be considered an almost lossless volume located between the ground plane and the ionosphere. The system acts as a parallel-plate waveguide with small losses and is known as the Earth–ionosphere waveguide (EIWG). Lightning activity generates extremely high currents which excite electromagnetic propagating modes in the EIWG. Those modes resonating along the radial direction, i.e., between the ground and the ionosphere, have resonance frequencies controlled by the ionosphere altitude, h ∼ 90 km, and are known as sferic modes or, simply, sferics. For the fundamental mode, h is half the wavelength, which gives a resonance frequency of around 1.67 kHz. This fundamental mode together with the first higher-order modes is located in the VLF range and may propagate over long distances without significant attenuation. For this reason, the WWLLN stations are designed to detect propagating electromagnetic fields in the kilohertz range, a band where lightning strokes excite a large amount of power and losses are low, enabling their detection at distances of around 10 000 km. This explains the successful operation of the WWLLN even when the distances between its stations were around 5000–15 000 km before 2012. Finally, the detecting hardware of stations can take advantage of audio frequency systems (below 20 kHz), such as sound cards, which are cheap and easy to obtain.
When a lightning stroke happens, a sferic mode is excited and the antennas and hardware of some of the WWLLN stations around the Earth detect a time-limited electromagnetic signal in the VLF band with a duration of milliseconds. The time of arrival of the signal from the source to the antenna of each detecting station is measured using the timing signal of a satellite global positioning system. This time of arrival is used to calculate the distance from the station to the signal source, and, finally, the location of the source is obtained by triangulation, using the distance to several stations, similarly to the Global Positioning System (GPS). The detection of the sferic arrival at each station is a difficult task because of the background noise. Therefore, improved trigger techniques have been developed and combined with minimization methods in order to provide the correct timing of the arrival. The time-of-group-arrival method and some improvements can be found in Dowden et al. (2002) and in Rodger et al. (2009). The lightning is processed and registered by the WWLLN system and is recorded as a correct detection if and only if the signal is simultaneously detected by a minimum of five stations. It is worth noting that care must be taken when interpreting data of lightning locations below a given length scale. This is because the distance determined by the WWLLN corresponds to an equivalent VLF antenna transmitting from an effective point, but the actual lightning stroke path is not usually a vertical one; thus, the distance detected will not exactly coincide with the stroke contact point on the ground. This distance is even more approximate because of our comparison with independent AEMET results, which are obtained with low-frequency (LF) technology where characteristic distances differ from those of the WWLLN.
The WWLLN had 40 receiving sensors in 2010, providing a DE of around 11 % for peak currents greater than 20 kA (Abreu et al., 2010) and an LA of around 5 km. A recent comparison over time of the WWLLN detection efficiency for different peak currents can be found in Holzworth et al. (2019) for the Aotearoa / New Zealand area. The number of active stations, an important number, has increased to an almost stable number of around 60 active stations since 2014. In particular, the WWLLN station at Valencia (Spain) was set in operation by the team at the University of Valencia in June 2011; this team has been responsible for the maintenance of this station since then. This fact partially justifies our interest in assessing the still-unknown performance of the WWLLN in the Spanish area, but it is not our only reason. Effectively, despite the global nature of the network suggesting that the WWLLN behavior in Spain would be similar to that known for other areas of the world, the characteristics of Spain, with important geographical differences over relatively short distances (coasts, islands, mountain ranges, an inland plateau region surrounded by mountain regions, etc.), may greatly affect storm characteristics and, therefore, WWLLN performance over relatively short distances.
The WWLLN receiving sensors use a single 1.5 m whip antenna to measure the vertical polarization of the electric field associated with the sferic signal. The sensing procedure does not differentiate between CG and CC/IC discharges, since the whip antenna is sensitive to the vertical electric field and the two types of discharges show a similar behavior as regards this component of the electric field. The EIWG modes associated with the sferic signals are mainly excited by CG vertical strokes, although they may also be excited by strong IC and CC strokes. Therefore, differences between IC/CC and CG strokes are difficult to infer from the sferic signal, and both IC/CC and CG strokes are included in the signals measured by the WWLLN (Hutchins et al., 2012a).
The WWLLN data are provided to customers and members of the WWLLN in different formats. The APP files used in this paper provide the following information for each lightning stroke detected:
-
the date and time in UTC, with the time resolution in microseconds;
-
the latitude and longitude in degrees with four decimals;
-
the residual fit time error in microseconds (< 30 µs);
-
the number of stations which detect the signal (a minimum of five stations);
-
the root mean square (rms) power estimation in kilowatts (kW) from 7 to 17 kHz in a 1.3 ms sample time;
-
the power uncertainty (kW) in the power calculation;
-
the number of stations which detect the stroke used for the power estimation, with a subset of stations within a range of less than 10 000 km distant from the stroke used for the power estimation.
The whip antenna, the preamplifier, and the global positioning system are located outside the building on which the station is mounted. The preamplifier is wired to a sound card. The sound card is a typical commercial one that is inserted into the board of a desktop computer that has broadband connection inside the building. This computer processes the sferic time-domain signal combined with the global positioning system timing signal and transmits the data to the processing stations. The antenna is anchored to the steel structure of the building to have a good ground plane and thus to provide a good signal-to-noise ratio in the sferic bandwidth (Dowden et al., 2002). The WWLLN receivers are designed to be sensitive to the vertical electric field from lightning strokes, minimizing the influence of magnetic induction; therefore, the sensors show the important property of being strongly immune to artificial VLF magnetic fields (Lay et al., 2004), signals which are difficult to isolate from industrial machines, household appliances, and other electronic systems. Minimization methods are used to obtain the time of group arrival and lightning locations. The quality of these data is given by the residual fit time error, which is lower than 30 µs (Dowden et al., 2002; Rodger et al., 2005, 2009).
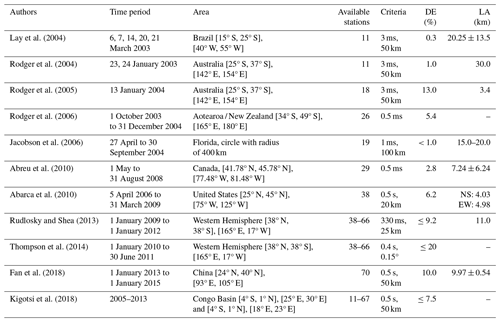
Prior to addressing in this work the task of determining the features of the WWLLN in Spain, let us consider the present knowledge of this network and its performance in different areas around the world. As mentioned before, there is a reduced set of bibliographic works in which the WWLLN DE and LA are analyzed. The more relevant ones among these studies are summarized in Table 1, which includes details on the time period of the study, the area of assessment, the number of stations available in the WWLLN at that moment, and the time-difference and spatial-distance criteria for considering the detected stroke to be coincident with a lightning stroke of the reference network. The network features in each specific area are summarized in this table by means of two parameters: the DE and the LA. It is worth noting that these two quantities must be considered total detection values; i.e., they correspond to all the detected lightning strokes, independently of their current peak amplitude. More detailed information on the DE values for specific current peak amplitudes can be found in the works referenced in Table 1. In these works, the WWLLN results are mainly compared with data from other terrestrial networks and, to a lesser extent, with satellite detection systems. These reference terrestrial networks operate continuously at a national or regional scale, while the information from satellites is not global and is only available for limited periods of time, since these systems orbit over a certain area of the Earth at specific times. In addition, they mostly detect IC and CC flashes by means of photodiode detectors embedded in the satellite (Suszcynsky et al., 2000; Rudlosky and Shea, 2013; Thompson et al., 2014).
From a general point of view, the details reported in the studies in Table 1 show interesting results which must be taken into account when using data from the WWLLN. As regards the influence of the distance at which the lightning stroke happens, the work by Rodger et al. (2006), the founders of the WWLLN, reveals a decreasing DE in the daytime for stations at a distance beyond 8000 km and a DE that is negligible for stations at a distance beyond 14 000 km. However, the DE was accurate between 10 000 and 12 000 km during the nighttime, which is valuable information to use in determining the geographical distribution of stations. As regards the effect of the lightning stroke energy, low-energy strokes may be dismissed mainly due to the attenuation when distances are large. Therefore, an improvement in the DE and LA for high-energy strokes is expected, with values well above the low values included in Table 1, which, as previously mentioned, correspond to all the lightning strokes detected independently of their peak amplitude.
Focusing on the results shown in Table 1 and the references therein, an initial very low DE for the early WWLLN measurements in 2003 was found, which was on the order of 1 % of the total lightning strokes detected by the reference networks and reached values of around 10 % for the year 2012, i.e., the year of this study. This is a shortcoming of the WWLLN compared to national or regional networks, but the global-scale nature of the network compared with the local or regional scale of the reference agencies must be taken into account. Moreover, the DE has large variations depending on the area of the Earth. Large differences are found in the DE and LA estimations shown in Table 1. The DE was assessed to be 0.3 % in March 2003 in Brazil (Lay et al., 2004), while the value reported in Florida between April and September 2004 was about 4 % for currents larger than 50 kA in absolute values (Jacobson et al., 2006). The best data recorded by the WWLLN so far comprise a DE of 31 % obtained in the Pacific Ocean in January 2010 for a subarea of the whole Western Hemisphere region considered in Rudlosky and Shea (2013) and shown in Table 1. The discrepancies in the results may be due to changes in the number and geographical distribution of active WWLLN stations because the network has increased its number of active sensors over the years. There were 11 stations in the first evaluation in 2003, a number which was augmented to 20 stations in 2004, and there have been around 60 active stations since 2012 (Holzworth et al., 2021). Differences seem to also be related to increasingly sophisticated processing techniques (Rodger et al., 2004, 2005, 2009). Moreover, the WWLLN has changed the distribution of active receiving sensors in different areas of the Earth. Other explanations for the discrepancies may be due to the assumed “ground truth” of the different networks used for comparison with the WWLLN (Abarca et al., 2010), some of them reporting an LA with errors assumed to be between 80 %–90 % (Lay et al., 2004; Brundell et al., 2002; Rodger et al., 2006). Technology deployment is focused on the detection of CG strokes, with the exception of the Los Alamos Sferic Array (Jacobson et al., 2006), whose DE is similar for both CG and CC/IC strokes. As regards the national and regional networks used as reference, these are devoted to the detection of both CG strokes and CC/IC strokes. In Rodger et al. (2004, 2005) and at a regional scale, there were an estimated 3.5 times more CC/IC strokes than CG ones (Mackerras et al., 1998; Soriano and de Pablo, 2007), and the WWLLN ratio of the detected CG events to CC/IC events was estimated to be roughly 2:1 (Hutchins et al., 2012b).
As regards the effect of the lightning stroke energy, the DE of the WWLLN rises with increasing stroke peak current for both positive and negative CG lightning strokes, as it is first discussed in Rodger et al. (2006) and later in Fan et al. (2018). In fact, results shown in Table 1 report low values of the DE, ranging from values of around 1 % to 20 %, as mentioned above, partially due to the fact that this figure is a total value for all peak amplitudes. In addition to the summary data presented in Table 1, details in the studies referenced therein show that the WWLLN DE is above 50 % for CG strokes with currents greater than 40 kA, with a large variability depending on the region, providing a spatial accuracy of around 15 km. Another interesting fact also mentioned in these works is that the DE is always higher over the oceans, although some variability is observed with the seasons (Rudlosky and Shea, 2013). The same is observed in Thompson et al. (2014), where higher values were obtained for the Pacific and Atlantic oceans. This DE for high peak currents is good enough to resolve convective-storm cells within a larger storm complex, i.e., a large, circular, long-lived cluster of showers and thunderstorms that can cover a large region and lasts more than 12 h. A storm complex often emerges during the late-night and early-morning hours; is identified by satellites; and is characterized by heavy rainfall, wind, hail, lightning, and possibly tornadoes (Jacobson et al., 2006).
The choice of the time- and spatial-coincidence criteria is crucial and affects the results of the DE and LA, as can be seen in Fig. 1 of Thomson et al. (2014). The choice strongly depends on the characteristics of the available reference data. In this context, Fan et al. (2018) presents a comparison of WWLLN data with two reference measurement sets: data from national terrestrial sensors and data from satellite observations. In making the comparison with the terrestrial network, the coincidence between lightning strokes is constrained to events happening within a time difference of 0.5 s and a distance of 50 km; however, the comparison with satellite data is not filtered for a distance of 50 km and provides better accuracy in determining the distance of the lightning stroke. As mentioned above, the WWLLN stations are expected to detect VLF signals generated at distances of around 10 000 km. However, their effectivity worsens for low-amplitude strokes; therefore, the geographical distribution of the stations may affect the network features. This is a simplistic explanation because there are also influences of the propagating conditions, the land or water presence, and the noise environment in the station. However, a trend is observed in the DE in Kigotsi et al. (2018), who use lightning imaging sensor technology, whereby the DE increases from around 2 % to 6 % between 2005 (23 WWLLN sensors) and 2013 (67 WWLLN sensors) in the continental areas of the Congo Basin.
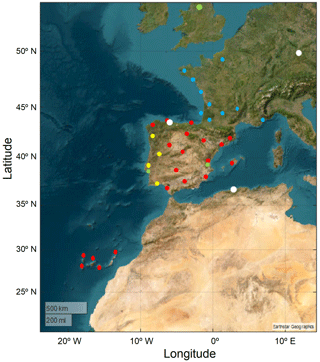
Figure 1The WWLLN and national lightning detection networks in Spain and surrounding areas. The green circles correspond to the WWLLN sensors in 2012, and white circles represent the new WWLLN sensors deployed between 2020 and 2022 relative to 2012. Red circles show the positions of the AEMET sensors in 2012: 14 sensors in continental Spain, 5 in the Canary Islands, and 1 in Mallorca. Four sensors of IPMA in Portugal are shown in yellow, while blue shows the 10 sensors of Météo-France.
Concerning the study presented in this work, 69 WWLLN stations were operative around the world in the time period considered, the year 2012, of which around 60 were active. As regards the area under study, Spain, the six most relevant WWLLN stations are shown in Fig. 1. Three stations, represented by green dots, were already operative in 2012 and are located in Valencia (Spain), Lisbon (Portugal), and Sheffield (England). Three new stations were deployed later, between the years 2020 and 2022, and are shown with white dots in the figure. These new stations were deployed at Gijón (Spain), Tihany (Hungary), and Algiers (Algeria). Other stations from Spanish, Portuguese, and French national agencies, which will be used as reference, are also shown with red, yellow, and blue dots, respectively. It is worth noting that this distribution of WWLLN stations is denser than that of other areas, where stations are deployed at distances of around 10 000 km.
The WWLLN performance in Spain will be determined by comparing its data with those measured by AEMET, so let us briefly describe the main features of this meteorological national agency. AEMET's sensors are spaced at distances of less than 400 km, distances well suited for the dimensions of the whole area of Spain, both the continental and the insular regions. These sensors detect the LF emissions of lightning, where LF is the International Telecommunication Union (ITU) designation of the radio frequency (RF) band with a range between 30 and 300 kHz. The LF signals from lightning strokes are intense and propagate with little attenuation as surface waves over the Earth's crust. Localization of lightning strokes is carried out by AEMET stations using IMPACT LF sensors, IMPACT ES/IMPACT ESP and LS7000/LS7001, produced by the Vaisala company: https://www.vaisala.com/en/products/systems/lightning/single-point-sensors (last access: 6 March 2024). This equipment is employed in around 45 national networks worldwide. The procedure starts by determining the direction from which the electromagnetic signal arrives using a magnetic direction finder (MDF) (Orville and Huffines, 1999; Cummins et al., 1998; Pérez-Puebla and Zanacajo-Rodríguez, 2010, 2012; López-Díaz et al., 2012; Cummins and Murphy, 2009). Using the information received by at least two sensors, the intersection of the lines establishes the location of the lightning. In addition, the propagation time of the signal to the sensor is determined, which depends on the distance of the sensor to the surface impact point of the discharge. Using the information from two sensors, the time of arrival delay between them determines a hyperbola with the possible locations of the discharge, and the intersection of the different hyperbolas will define the possible discharge location. At least four sensors are needed for the location to not be too ambiguous. Finally, to optimize the location, the intersection of circles is used instead of hyperbolas. Both techniques, MDF and time of arrival, are combined to obtain better accuracy of the stroke location.
AEMET's lightning detection network is made up of 20 electric discharge detectors distributed throughout the peninsular territory (14) and the Balearic (1) and Canary archipelagos (5) (Orville and Huffines, 1999; Cummins et al., 1998; Pérez-Puebla and Zanacajo-Rodríguez, 2010; López-Díaz et al., 2012). These detectors capture, analyze, and discriminate the electromagnetic radiation generated in atmospheric electrical discharges occurring within their range, between 50 and 1000 km. Through collaboration agreements, information is also received from four sensors belonging to the network of the Portuguese meteorological service (IPMA) and from sensors of METEORAGE, who provides data to the French meteorological service (Météo-France) (Rodrigues et al., 2010; Santos et al., 2013). These sensors are shown on the map in Fig. 1, together with the position of WWLLN sensors installed in 2012 and 2024. The data from these sensors are integrated into the system and allow optimal coverage of the entire Iberian Peninsula and the surrounding seas.
The CG lightning detection probability of this type of network ranges between 85 % and 95 %, while its localization accuracy ranges from 100–200 m to 1 km. The median of the peak intensity (maximum value of recorded electrical intensity) has an accuracy error of about 15 %–20 %, and the accuracy in determining the polarity (sign of the electrical discharge) is 100 %. As regards high-intensity lightning strokes, with intensity greater than 5 kA, a detection efficiency of more than 90 % is achieved with an LA value much lower than 0.5 km (Rodrigues et al., 2010; Santos et al., 2013).
The networks detect and keep track of lightning events, providing their times and geo-locations, together with information on the originating current. The raw data files in ASCII format containing this information for each lightning stroke were available on the website of AEMET until the end of the year 2012 (https://www.aemet.es, last access: 6 March 2024). Currently, access to data from this and other national agencies for the research community is usually very difficult or expensive, which increases interest in having more easily available data from other networks, such as the WWLLN studied here. The data used in this work as ground truth for comparison with our WWLLN data were obtained from the AEMET website in 2012 for the area of Spain. These open data provided the time of the lightning events with a 1 s time resolution, together with information about the current for the first lightning stroke.
The interest of national and regional agencies used as reference is directed towards the detection of CG lightning, disregarding the detection of IC/CC strokes. IC/CC lightning strokes were initially registered by the stations; however, most of these strokes were discarded in post-processing by taking into account their calculated current. Some IC/CC lightning strokes could not be filtered out because of their strong current, as happens in the US National Lightning Detection Network (NLDN) and the Canadian Lightning Detection Network (CLDN) (Abarca et al., 2010; Fleenor et al., 2009). Thus, an unknown reduced percentage of IC/CC strokes is included in the files. There is not a clear current threshold to differentiate CG strokes from IC/CC strokes, which explains the small percentage of IC strokes in the data. Some proposals have been made to distinguish between IC/CC strokes and CG strokes by analyzing the rate of change in the electromagnetic field, which can be obtained from the time-domain measurement of the signal (Rakov and Uman, 2003). The misclassification IC/CC–CG was first addressed in 1994–1995 by the USA NLDN (Cummins et al., 1998; Wacker and Orville, 1999; Jerauld et al., 2005; Orville et al., 2002; Cummins et al., 2006; Biagi et al., 2007). Typically, low-current IC/CC events are erroneously classified as CG events, and some proposals have been made to discard positive CG strokes with peak currents of less than 10 kA or to reclassify them as IC events (Grant et al., 2012).
A study concerning the features of the WWLLN in different areas of Spain is presented and discussed in this section, followed by an example of the application of the WWLLN stations. First, Sect. 4.1 shows the network performance for the whole Spanish area during 2012, soon after the Valencia station was deployed by two authors of this work. Storms are strongly affected by geographical features; thus, it seems reasonable to think that the WWLLN performance may also be affected by these geographical differences. In this sense, Sect. 4.2 presents a second similar study concerning four qualitatively different Spanish subregions to find possible inhomogeneities in DE values in the Spanish area. The four regions comprise an inland region and three different regions including mostly sea areas or land–sea transitions. Once the quantitative studies to determine the WWLLN DE for the whole area of Spain and these four subregions have been presented, a final qualitative application of the WWLLN to monitor three severe storms in Valencia, on the east coast of Spain, in 2020, 2021, and 2022, is presented in Sect. 4.3.
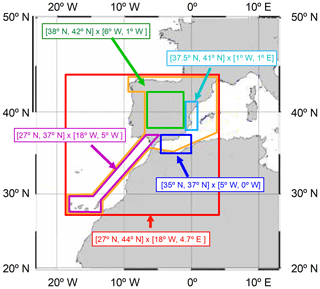
Figure 2 describes the different areas of these studies. Red and orange for the first study presented in Sect. 4.1. The green, cyan, dark blue, and magenta regions correspond to the areas considered in Sect. 4.2 which will be described in more detail there. The cyan region also approximately corresponds to the final monitoring application presented in Sect. 4.3.
4.1 Detection efficiency and location accuracy of the WWLLN in Spain
The WWLLN performance in the area of Spain is first analyzed using data from the WWLLN (http://www.wwlln.com, last access: 6 March 2024) during the period from 1 January 2012 to 30 April 2012. The data were generated using the most recent technique described in the work of Rodger et al. (2009). Two aspects support the choice of this time span. First, data from AEMET were openly available to the authors for this period, and second, this period was close in time to the moment at which the station in Valencia (Spain) was deployed by the team behind this work in the year 2011. It must be noted that the objective of this paper is not to compare AEMET and the WWLLN in order to determine which is the best network, since they have different local and global objectives, respectively. The main goal is to determine the DE of the WWLLN in the whole region of Spain, which includes continental and insular regions, using the AEMET data as true data (Abarca et al., 2010). This study is the first one analyzing WWLLN performance in western Europe, specifically in Spain, where large geographical differences occur over relatively short distances. The use of data from 2012 does not invalidate the conclusions of the first study, although, bearing in mind the technical improvements of both the WWLLN and AEMET since 2012, the results presented here must be considered a lower bound for the current network performance, which, most likely, will have been improved since.
The time span of the lightning data chosen is usually a period with low seasonal activity in the Iberian Peninsula. The main storm activity in Iberia prior to 2012 was typically distributed in the period of May–September, in which around 84 % of the storm phenomena with lightning events were detected (Soriano et al., 2005). Although the period under study had low activity in terms of lightning strokes, the AEMET data still contain a significant number of lightning strokes in the whole Spanish region: 20 651. The 2012 AEMET data file has 20 651 lines, and each line has nine columns with the following data: month, day, hour, minute, second, discharges, peak current, latitude, and longitude.
To analyze the WWLLN detection efficiency relative to the AEMET network and to identify the stroke events shared by both networks, we look for time and location coincidences within a given deviation. Several criteria have been used by different authors to define shared lightning strokes and, thus, to establish a coincidence. The particular criterion chosen greatly depends on the characteristics of the available data of the independent networks. These reference networks are assumed to provide true data, since the data's certainty is reported to be above 90 %. Obviously, the coincidences in time and location are used with a given tolerance or deviation from the ground truth. Lay et al. (2004) and Rodger et al. (2005) used both a time deviation of 3 ms and a space deviation of 50 km to establish coincidences. Jacobson et al. (2006) used a time gap within 1 ms and a maximum distance of 100 km. When the data available have a high temporal resolution, the time criterion alone seems good enough to establish shared events; i.e., there is no need to use a combined spatial coincidence. This explains why the works by Rodger et al. (2006) for Aotearoa / New Zealand and by Abreu et al. (2010) for the area of Toronto only impose a time difference of 0.5 ms to determine coincident events.
As regards the study in the area of Spain presented in this work, the lightning activity data available from AEMET have a time resolution of 1 s. This coarse time resolution forces the use of both temporal- and spatial-coincidence criteria to ensure confidence in this analysis. As the AEMET data were given with a resolution of 1 s, we establish a maximum time difference of 0.5 s between AEMET and WWLLN strokes to define the temporal coincidence. This large time tolerance is far from the range 0.5–3 ms used by other researchers (Rodger et al., 2005, 2006; Jacobson et al., 2006); however it is the same as in Abreu et al. (2010), Abarca et al. (2010), and the more recent work by Fan et al. (2018). This time coincidence is combined with a spatial coincidence of 20 km. Therefore, a WWLLN lightning stroke is shared by the AEMET reference if both events happen with a difference in time lower than 0.5 s and if the distance between them is below 20 km.
In this first assessment study, the region of the world under consideration is the whole area of Spain and small nearby areas of the Atlantic Ocean and the Mediterranean Sea, inside the area defined by the latitude interval [27.39° N, 43.83° N] and the longitude interval [18.01° W, 4.66° E] (red rectangle in Fig. 2). The limits of this rectangular area are defined by the maximum and minimum latitudes and longitudes of the available AEMET data, which are spatially filtered to reduce them to those from the non-rectangular orange region in Fig. 2, exclusively pertaining to the Spanish area. As regards the WWLLN, it collects global Earth data; therefore, the very large files contain all the registered events, and these data must be geographically filtered to obtain data for the reduced area.
Figure 3a depicts the lightning strokes detected by AEMET in the orange Spanish region of Fig. 2 during the period of 1 January 2012 to 30 April 2012, represented as green dots on the map. The green dots in Fig. 3a comprise a total of 20 651 lightning strokes detected by AEMET, which serve as reference for the WWLLN data during the abovementioned time period. We look for the AEMET lightning strokes that are coincident with WWLLN data following the abovementioned criteria of time and spatial coincidence. In the WWLLN, lightning stroke data across the whole Earth are stored in files on a day-to-day basis. Each file corresponds to a single day and has a size of about 30 Mb. Therefore, we first obtain the WWLLN files for the period 1 January 2012 to 30 April 2012, which occupy a total of 3.96 Gb. Later on, we filter the data of these files to extract the data inside the area defined by [27.39° N, 43.83° N] × [18.01° W, 4.66° E] (red area in Fig. 2). This data file is a smaller one, with a size of 2.7 Mb, and includes 54 079 lightning strokes. This last file was used for further processing in order to compare it with the AEMET data. Although it does not correspond to the same geographical area, it has a manageable size. Finally, this file was spatially filtered with the AEMET spatial filter (orange region of Fig. 2), providing a small file with the WWLLN data reduced to the Spanish region and containing a total of 12 855 lightning strokes.
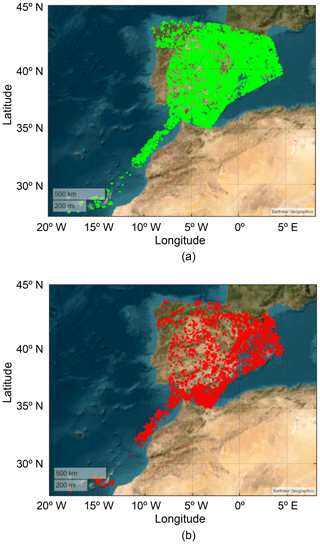
Figure 3(a) Lightning strokes detected by the AEMET network during the period 1 January 2012–30 April 2012. (b) Strokes detected simultaneously by the WWLLN and the AEMET network during the period of 1 January 2012–30 April 2012.
To identify the number of lightning strokes detected by AEMET which were also detected by the WWLLN and thus determine the DE of the global network, a correspondence is searched for in the file of the WWLLN data for each lightning stroke in the file of AEMET data. In the first stage, we look for temporal coincidence of each AEMET stroke with WWLLN strokes using a maximum time deviation of 0.5 s. In the second step, a maximum distance of 20 km between the AEMET and WWLLN strokes is checked. In doing so, we found that 5904 out of 20 651 AEMET lightning strokes matched with one of the 12 855 lightning strokes detected by the WWLLN. These coincidences are plotted in Fig. 3b and are used for further analysis and to determine the DE and the LA. These coincidences yield a WWLLN DE of 29 % relative to the AEMET network. The rest of the lightning detections of the WWLLN can be considered true detections without any comparison frame, most likely because they are CC/IC lightning strokes, which can be detected by the WWLLN but not by AEMET. This DE of 29 % for the WWLLN in the whole region of Spain is a good result when compared with the DEs included in Table 1. Although, in principle, it may seem that the high density of stations in Spain may cause this relatively high DE value, this is probably not the case since close lightning strokes usually saturate the nearest receivers. The explanation is probably linked more to the higher DE values usually obtained in sea areas, a finding which has already been reported in the literature (Rudlosky and Shea, 2013; Thomson et al., 2014). The geographical peninsular characteristics of Spain, with an important part surrounded by the Mediterranean Sea and the Atlantic Ocean, seem to indicate that the effect of the large coastal regions prevails over the effect of smaller inland regions and may explain this relatively good DE value. This aspect will be tested in Sect. 4.2 by considering geographically different subregions and the energy distribution of lightning strokes.
The distribution of the location error for the detected lightning strokes, according to the above criteria, is presented in Fig. 4. The location error has a maximum probability at 3.5 km for the interval of 0–20 km. The distribution of location errors in terms of longitude (Δx) and latitude (Δy) is shown in Fig. 5 and as a scatterplot in Fig. 6, in which a slightly systematic error in the location is observed in northward and westward directions. The standard error is larger in the west–east direction, since the Gaussian distribution broadens in this direction.
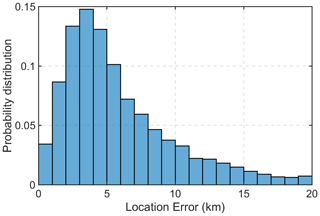
Figure 4Location error for the lightning strokes and probability distribution for the WWLLN correctly detected strokes according to the 0.5 s and 20 km criteria.
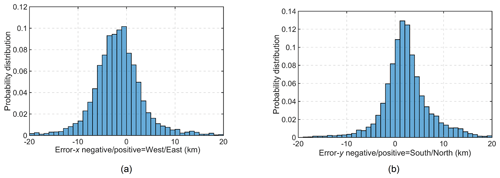
Figure 5Location error along longitude and latitude: (a) error in kilometers along the longitude and (b) error in kilometers along the latitude.
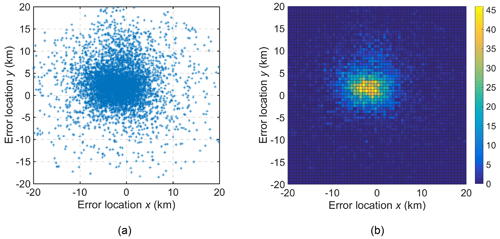
Figure 6Location error for the lightning strokes along x – longitude – and y – latitude – in the region [27° N, 44° N] × [18° W, 4.7° E]. (a) Error in kilometers. (b) Color code showing the number of lightning strokes at each x–y error.
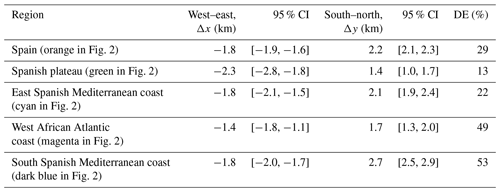
Quantitative data concerning the LA for the WWLLN at Spain can be inferred from the Gaussian shaped probability distributions depicted in Fig. 6. More specifically, the average error along the west–east direction is Δx= −1.8 km (minus indicates a deviation towards the west), with a 95 % confidence interval of [−1.9, −1.6] km, while the average error along the south–north direction is Δy= 2.2 km, with a 95 % confidence interval of [2.1, 2.3] km. The deviation is larger along the west–east (σx= 5.3 km) than along the south–north direction (σy= 4.8 km).
The distribution of AEMET strokes in bins of 10 kA, together with the distribution of strokes also detected by the WWLLN, is shown in Fig. 7. The distribution of peak currents is shifted towards negative strokes, which is in good agreement with the references of Table 1. There are 3471 positive CG lightning strokes (positive peak current) versus 17 180 negative lightning strokes in the AEMET data, i.e., 16.8 % of the detected CG strokes. As regards the WWLLN, the peak current is assigned as the one corresponding to the matched AEMET stroke. The same ratio between positive and negative lightning strokes is preserved for the subset of 5904 AEMET strokes also detected by the WWLLN. The figure shows the usual distribution of negative and positive CG strokes: nearly 90 % of the global lightning activity corresponds to negative peak currents. The average peak current in negative CG strokes is −25.40 kA and in positive CG strokes is 8.59 kA for the AEMET data. As regards the lightning strokes also detected by the WWLLN, the average results are −37.9 kA for negative CG strokes and 14.0 kA for positive ones. These results show a clear shift of the WWLLN operation towards the detection of high-energy lightning strokes.
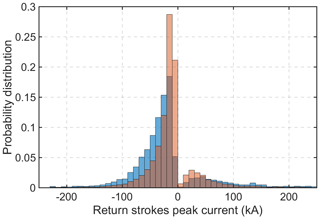
Figure 7Distribution of AEMET return strokes detected by the WWLLN, in blue, and total AEMET return strokes, in orange.
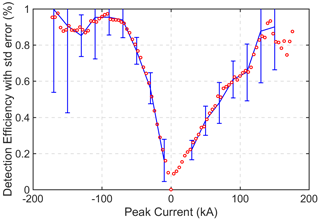
To establish the dependence of the network features on the energy of the lightning strokes, the distribution of the DE is calculated in bins of 2 kA. The result is mapped in Fig. 8, where each point (red circles) represents the DE for an interval of 2 kA. These discrete results are smoothed with a five-point mobile average (line in blue color), and standard error bars are also included. The information provided by both data types in Fig. 8 shows that the DE increases with the peak current; however, the DE looks slightly noisy for both positive and negative high energies above 100 kA, which is likely due to the small number of available data (see Fig. 7 for peak currents greater than 100 kA in absolute values). Despite these slight fluctuations observed for high-energy strokes, Fig. 8 shows that the DE of the WWLLN is remarkably good for lightning strokes with high peak currents, which are the more dangerous ones. Results of Fig. 8 are very similar to those of previous works referred to in Table 1 (Abarca et al., 2010; Rodger et al., 2006; Fan et al., 2018).
4.2 Detection efficiency and location accuracy in four subareas of Spain
In order to address the possible effects of geographical features on the DE and the LA, we now restrict the analysis to four particular regions with different geographical characteristics. Firstly, the WWLLN performance is studied for a reduced inland and geographically uniform region, the Spanish plateau region. Three sea and land–sea regions are considered next: the east Spanish Mediterranean coast, the south Spanish Mediterranean coast, and the west African Atlantic coast. The first sea region includes a transition between a coastal and a maritime area near Valencia in which severe storms usually happen at the beginning of autumn. The second includes the Alboran Sea, which is directly affected by strong marine currents that originate at the Strait of Gibraltar. Finally, the west African Atlantic coast is mostly a maritime region affected by ocean currents. The differences in the geographical characteristics in these regions produce important differences for the climate in these areas. The aim of this subsection is to determine whether these differences are reflected in the DE and the LA of the WWLLN.
The first region considered is defined by latitude [38° N, 42° N] × longitude [6° W, 1° W], which is inside the plateau area of the Iberian Peninsula (green rectangle in Fig. 2). Geographically, it is a homogenous region which avoids the main mountainous regions which surround it. In this case, the AEMET file contains 3389 lightning strokes, while the WWLLN file has 1229 strokes. A total of 435 of the lightning strokes detected by AEMET are also detected by the WWLLN, which means that the DE for the Spanish plateau is 13 %.
Figure 9 shows the errors along latitude and longitude for this reduced area. The results in this figure yield an average location error along the west–east direction of Δx= −2.4 km, with a 95 % confidence interval of [−2.9, −1.9] km and standard deviation of σx= 5.3 km. The average location error along the south–north direction is Δy= 1.3 km, with a 95 % confidence interval of [1.0, 1.7] km and standard deviation of σy= 3.9 km. These results for Δx and Δy are not significantly different from the results obtained using the larger area of Sect. 4.1. However, the results for the scatterplot of Δx–Δy seem better than previous ones, with lower standard deviation for the south–north direction, as can be seen by the differences between Figs. 6 and 9. Effectively, Fig. 9 shows data that are more horizontally concentrated around their mean value than those represented in Fig. 6, which corresponds to lower standard deviations and, therefore, better location error. For this area and the AEMET data, the average negative peak current is −17.92 in negative CG strokes and 10.26 kA in positive CG ones. As regards the strokes matched by the WWLLN, the corresponding average results are −26.4 kA for negative CG strokes and 29.4 kA for positive CG strokes. In this area, the differences in absolute value between positive and negative CG lightning strokes are lower than in the former larger area. This is probably related to the different characteristics of the storms and is more likely due to the influence of geographical features than to the characteristics of the sensors.
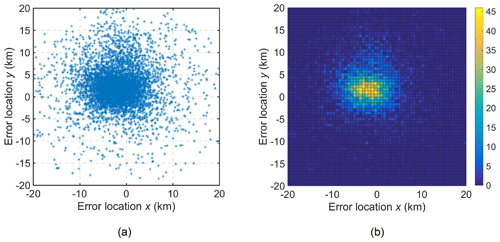
Figure 9Location error for the lightning strokes along x – longitude – and y – latitude – for the plateau region, [27° N, 44° N] × [18° W, 4.7° E]. (a) Error in kilometers; (b) Color code showing the number of lightning strokes at each x–y error.
The second subregion considered here includes coastal and maritime parts. The region under study corresponds to a small area of the west Spanish Mediterranean coast, with longitude and latitude limits given by [37.5° N, 41° N] × [1° W, 1° E] and which is demarcated by cyan in Fig. 2. The comparative study of the lightning activity detected by the WWLLN with the AEMET data provides results similar to those shown in Fig. 9 (not represented). A total of 2495 lightning strokes were detected by AEMET for this area, of which 558 were also detected by the WWLLN, giving a DE of 22 %. As regards the location error, the results yield an average location error along the west–east direction of Δx= −1.8 km, with a 95 % confidence interval of [−2.1, −1.5] km and a standard deviation of σx= 5.3 km. The average location error along the south–north direction is Δy= 2.1 km, with a 95 % confidence interval of [1.9, 2.4] km and standard deviation of σy= 4.4 km.
The third subregion, the south Spanish Mediterranean coast, is determined by longitude and latitude limits of [35° N, 37° N] × [5° W, 0° W]. This region is marked in dark blue in Fig. 2. This area also includes a transition between land zones and the Mediterranean coast but, unlike the area previously considered, is close to Strait of Gibraltar, with strong marine currents not present in the previous region. A total of 4104 lightning strokes were detected by AEMET for this area, of which 2179 were also detected by the WWLLN, which yields a DE of approximately 53 % for this area. The location error along the west–east direction is Δx= −1.8 km, with a 95 % confidence interval of [−2.0, −1.7] km and standard deviation of σx= 5.3 km. Similarly, the average location error along the south–north direction is Δy= 2.1 km, with a 95 % confidence interval of [1.9, 2.4] km and standard deviation of σy= 5.7 km.
Finally, the fourth subregion considered, the west African Atlantic coast, is delimited by longitude and latitude of [27° N, 37° N] × [18° W, 5° W]. It is mostly a maritime area which includes the Canary Islands and the Atlantic Ocean zone at the west African coast. This region is depicted in magenta in Fig. 2. A total of 1247 lightning strokes were detected by AEMET for this area, of which 613 were also detected by the WWLLN, which yields a DE value of around 49 %. The location error for this area along the west–east direction is Δx= −1.4 km, with a 95 % confidence interval of [−1.8, −1.1] km and standard deviation of σx= 5.8 km. Along the south–north direction, the location error is Δy= 1.7 km, with a 95 % confidence interval of [1.3, 2.0] km and standard deviation of σy= 5.3 km.
Table 2 summarizes the efficiency and location error for Spain and the four subregions studied in Sect. 4.1 and 4.2 according to AEMET reference data from 2012. Consistent Δx and Δy values are observed for the location accuracy. As regards the DE, the comparison of the reduced areas points to a higher DE value for areas containing sea zones, especially in those sea areas where strong maritime currents are more relevant.
Table 2Location accuracy for the west–east and south–north directions and detection efficiency for the WWLLN in the case studies of Sect. 4.1 and 4.2. Comparison is made with AEMET reference data from 2012.
As previously mentioned, the high DE value in sea regions has already been reported in the literature (Rudlosky and Shea, 2013; Thomson et al., 2014), and it could be related to a difference in the energy distribution of lightning strokes in sea areas. To support this statement, the peak current distribution of the lightning strokes detected for each subregion has been calculated. The results are shown in Fig. 10. Effectively, it can be appreciated from this figure that the continental area at the Spanish plateau presents an important distribution of lightning strokes at low energies. On the contrary, the presence of high-energy strokes increases in the other three areas containing land–sea transitions in the following order: east Spanish Mediterranean coast, west African Atlantic coast, and south Spanish Mediterranean coast. This, combined with the results shown in Fig. 8 depicting the increase in DE with current peak, seems to explain the differences in the DE obtained for the different subregions considered and draws attention to the variability in this efficiency if important geographical differences are present. In this sense and as regards the high value for the DE obtained for the WWLLN in the whole region of Spain compared to that in other regions included in Table 1, it seems that Spain's peninsular geographical characteristics, with a large contribution from its coasts compared to that of the inland Spanish areas, may explain this relatively high DE value of 29 %.
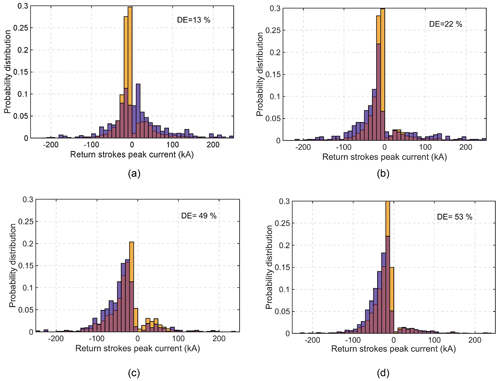
Figure 10Distribution of AEMET return strokes also detected by the WWLLN, in blue, and total AEMET return strokes, in orange, for different subregions: (a) the Spanish plateau, (b) the east Spanish Mediterranean coast, (c) the west African Atlantic coast, and (d) the south Spanish Mediterranean coast.
4.3 Three severe meteorological events at the Spanish Mediterranean coast
Once the technical features of the WWLLN have been determined, the network data can be useful in different applications. The following example demonstrates the use of the WWLLN in monitoring the evolution of three major lightning and hail storms that affected the Valencia region on the following days: 18 April 2020, 30 August 2021, and 17 August 2022. The region under study is the small area of the Spanish Mediterranean coast considered in the last case study of the previous subsection, approximately corresponding to the area plotted with cyan in Fig. 2.
Figures 11 to 13 show the results for the three storm events. Figures 11a, 12a, and 13a are screenshots taken directly from the AEMET website, https://www.aemet.es/ (last access: 6 March 2024), while Figs. 11b, 12b, and 13b have been generated with WWLLN data. In these figures, the locations of the lightning discharges are indicated with dots. A color code is used to temporally locate the lightning discharges in 1 h bands. For each day and for each 1 h interval starting from 00:00 and going to 23:00 GMT+1, the lightning location is plotted with a different color, which allows the visualization of the evolution of each storm time.
The storm of 18 April 2020 is shown in Fig. 11. The lightning strokes detected by AEMET are shown in Fig. 11a, while Fig. 11b shows the strokes detected by the WWLLN. According to the AEMET data, there were more than 11 000 lightning strokes in Spain, over land and sea, and 510 CG lightning strokes in the Valencia area. The storm of 30 August 2021 is shown in Fig. 12. Fig. 12a shows the lightning strokes detected by AEMET, while Fig. 12b shows the events detected by the WWLLN. Finally, similar plots for the storm of 17 August 2022 are shown in Fig. 13a for AEMET and Fig. 13b for the WWLLN data. There were 28 666 lightning strokes in Spain during that storm; in the Valencia region, there were 810 CG events.
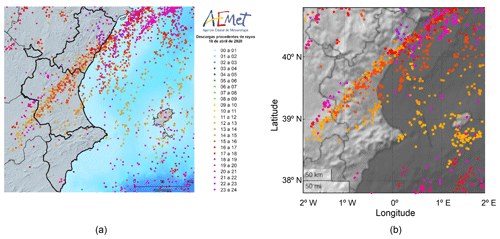
Figure 11The lightning storm of 18 April 2020 on the Spanish Mediterranean coast. The locations of the lightning strokes are given with circular dots, and different colors indicate different time periods: (a) AEMET (image source: AEMET_C.Valenciana@AEMET_CValencia, 2020, accessed via https://twitter.com/AEMET_CValencia/status/1251787766284857344/photo/2, last access: 6 March 2024) and (b) the WWLLN.
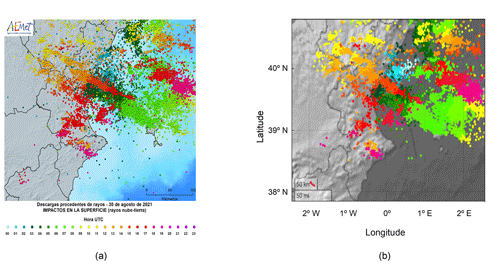
Figure 12The lightning storm of 30 August 2021 on the Spanish Mediterranean coast. The locations of the lightning strokes are given with circular dots, and different colors indicate different time periods: (a) AEMET (image source: AEMET_C. Valenciana@AEMET_CValencia, 2020, accessed via https://x.com/AEMET_CValencia/status/1432603501511782400?t=NPYXhi-gM4oTHwsPCROhPQ&s=08, last access: 6 March 2024) and (b) the WWLLN.
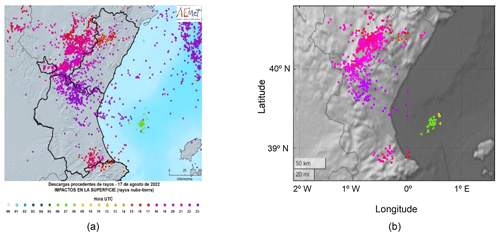
Figure 13The lightning storm of 17 August 2022 on the Spanish Mediterranean coast. The locations of the lightning strokes are given with circular dots, and different colors indicate different time periods: (a) AEMET (image source: AEMET_C. Valenciana@AEMET_CValencia, 2022, accessed via https://x.com/AEMET_CValencia/status/1560254824968785920, last access: 6 March 2024) and (b) the WWLLN.
In our opinion, an acceptable qualitative match is observed, although it must be noted that a rigorous statement on the quality of the results would require a quantitative comparison beyond mere image comparisons such as those shown in Figs. 11 to 13. Bearing this subjective and approximate sense in mind, reasonably good concordance can be appreciated for the point distribution giving the location and the color for the corresponding time. The WWLLN detects fewer lightning strokes than AEMET because it does not detect low-power discharges, showing an important DE decrease below 50 kA, as depicted in Fig. 8. This is especially noticeable in the northwest and northeast areas in Fig. 13, where lightning strokes detected by AEMET are not observed in the WWLLN results. On the other hand, the WWLLN detects IC lightning that AEMET has discarded, which explains why discharges detected by the WWLLN do not appear on the AEMET map. The qualitative concordance shown in this study indicates that the WWLLN data are a useful tool for thunderstorm tracking which can be used in combination with other techniques (Du et al., 2022). More specifically, Figs. 11 to 13 show the capability of the WWLLN to provide good agreement with LF data from AEMET to resolve convective-storm cells within a larger storm complex generated in a cutoff low-pressure system fed with the humidity of the Mediterranean Sea, which is typically a more frequent phenomenon in the western Mediterranean Basin than in inner continental areas, such as in the Spanish plateau previously considered in this work.
The work presented here contributes to the set of existing studies that analyze the operation of the WWLLN around the world, a set which had not previously included characteristics of this network in European countries. The performance of the WWLLN is evaluated in the area of Spain by comparison with data from the Spanish AEMET network as ground truth during the time period from 1 January 2012 to 30 April 2012, soon after the deployment of a new WWLLN station in Spain. At that moment, sensors in the Spanish area were very close in terms of VLF receivers, at a short distance of around 800 km, while typical receivers were between 5000 and 15 000 km apart in other regions. The current number and distribution of the WWLLN stations, around 70 stations with around 60 active ones, are similar to those considered in the study with data from 2012; therefore, results presented here are currently valid although, based on WWLLN growth, it is reasonable to assume that the 2012 DE is a lower bound of the present DE in Spain. Moreover, if the evolution of the AEMET network has surpassed the evolution of the WWLLN, the DE relative to AEMET might even be lower now than in 2012.
For the time interval considered, a global study for the whole region of Spain was firstly presented. A total of 20 651 lightning strokes were detected by AEMET in this case. As regards the coincident detections by the WWLLN, 5904 out of the 20 651 lightning strokes detected by AEMET were also detected by the WWLLN in the same area. This yields a theoretical CG detection of 29 % of the lightning strokes detected by AEMET. The rest of the lightning strokes detected by the WWLLN seem to mainly correspond to CC and IC strokes, which are not considered by AEMET. This DE value of 29 % is a significantly good result for the WWLLN as compared to its behavior for other areas, summarized in Table 1. Our study of the influence of the lightning peak current on the efficiency and location errors shows results consistent with previous reported works. It is worth noting that the DE considerably improves with high-energy strokes, the more relevant kind for monitoring, with DE values above approximately 50 % when peak currents are higher than 50 kA.
Our study for the whole area of Spain was followed by a subsequent one concerning four reduced regions with different geographical characteristics: a continental homogenous area – the Spanish plateau – and three regions including sea and sea–land transitions – the east and south Spanish Mediterranean coasts and the west African Atlantic coast. This second part of our work shows that the qualitative differences in the storms occurring in these different areas can be translated into objective quantitative differences regarding the energy distribution of the lightning strokes, which may explain the differences in the WWLLN performance. Similar results have been obtained for the accuracy of the four subregions. As regards the efficiency, higher values have been obtained for the results in the coastal regions, especially in those with higher maritime currents. The distribution of the peak current of the lightning strokes in these areas shows that the regions with higher DE values present an energy distribution with more content in the high-energy zone. Since, as shown in Fig. 8, the DE increases with higher-energy strokes, it seems reasonable to think that the difference in energy distribution explains the higher values obtained for the west African Atlantic coast and the south Mediterranean Spanish coast. As regards the relatively high DE value of 29 % for the whole area of Spain when compared to other more homogenous regions in Table 1, it seems that the peninsular geographical characteristics of Spain, with the important presence of coastal regions compared to inland regions, may be the reason for such high DE values. Concerning the high variability in the DE for the different studied subregions of Spain, it seems that the rapidly changing geographical characteristics of Spain produced by its peninsular shape form the basis of this variability, which draws attention to the differences in the expected DE values if important geographical changes are present in other areas.
A final application of the WWLLN shows the global network's capabilities to monitor the time evolution of climatic events. The study of three severe storms which affected the Mediterranean Spanish coast at Valencia during the years 2020, 2021, and 2022 seems to show qualitatively good agreement with screenshot results available from the AEMET national agency used as reference in this work.
The code is available on request to the authors.
The data used belong to WWLLN and are available on request to WWLLN. Contact Robert Holzworth, University of Washington (https://wwlln.net/, last access: 6 March 2024).
EAN and JSG installed the VLF station and are responsible for its maintenance. They also developed the MATLAB codes used for massive data processing.
EAN, JAP, and AS conceived the analysis, coordinated the work, revised the data and results, and wrote the manuscript.
STR participated in analysis, essential manuscript reviews, and editing and also provided project resources.
IA, AC, and VMC were responsible for collecting data and applying the MATLAB codes to obtain the presented results. They also participated in essential manuscript reviews.
The contact author has declared that none of the authors has any competing interests.
Publisher’s note: Copernicus Publications remains neutral with regard to jurisdictional claims made in the text, published maps, institutional affiliations, or any other geographical representation in this paper. While Copernicus Publications makes every effort to include appropriate place names, the final responsibility lies with the authors.
The authors wish to thank the World Wide Lightning Location Network (http://wwlln.net, last access: 6 March 2024), a collaboration of over 70 universities and institutions, for providing the lightning location data used in this paper.
This research has been supported by the Ministerio de Ciencia, Innovación y Universidades (grant no. PID2020-112805GA-I00).
This paper was edited by Ricardo Trigo and reviewed by three anonymous referees.
Abarca, S. F., Corbosiero, K. L., Galarneau Jr., T. J.: An evaluation of the worldwide lightning location network (WWLLN) using the National Lightning Detection Network (NLDN) as ground truth, J. Geophys. Res.-Atmos., 115, D18206, https://doi.org/10.1029/2009JD013411, 2010.
Abreu, D., Chandan, D., Holzworth, R. H., and Strong, K.: A performance assessment of the World Wide Lightning Location Network (WWLLN) via comparison with the Canadian Lightning Detection Network (CLDN), Atmos. Meas. Tech., 3, 1143–1153, https://https://doi.org/10.5194/amt-3-1143-2010, 2010.
Benito-Verdugo, P., Martínez-Fernández, J., González-Zamora, Á., Almendra-Martín, L., Gaona, J., and Herrero-Jiménez, C. M.: Impact of Agricultural Drought on Barley and Wheat Yield: A Comparative Case Study of Spain and Germany, Agriculture, 13, 2111, https://doi.org/10.3390/agriculture13112111, 2023.
Biagi, C. J., Cummins, K. L., Kehoe, K. E., and Krider, E. P.: National Lightning Detection Network (NLDN) performance in southern Arizona, Texas, and Oklahoma in 2003–2004, J. Geophys. Res.-Atmos., 112, D05208, https://doi.org/10.1029/2006JD007341, 2007.
Brundell, J. B., Rodger, C. J., and Dowden, R. L.: Validation of single-station lightning location technique, Radio Sci., 37, https://doi.org/10.1029/2001RS002477, 2002.
Ccopa, J. G. A., Tacza, J., Raulin, J. P., and Morales, C. A.: Estimation of thunderstorms occurrence from lightning cluster recorded by WWLLN and its comparison with the “universal” Carnegie curve, J. Atmos. Sol.-Terr. Phy., 221, 105682, https://doi.org/10.1016/j.jastp.2021.105682, 2021.
Chowdhury, S., Kundu, S., Ghosh, S., Sasmal, S., Brundell, J., and Chakrabarti, S. K.: Statistical study of global lightning activity and thunderstorm-induced gravity waves in the Ionosphere using WWLLN and GNSS-TEC, J. Geophys. Res.-Space, 128, e2022JA030516, https://doi.org/10.1029/2022JA030516, 2023.
Ciracì, E., Rignot, E., Scheuchl, B., Tolpekin, V., Wollersheim, M., An, L., Milillo, P., Bueso-Bello, J. Rizzoli, P., and Dini, L.: Melt rates in the kilometer-size grounding zone of Petermann Glacier, Greenland, before and during a retreat, P. Natl. Acad, Sci. USA, 120, e2220924120, https://doi.org/10.1073/pnas.2220924120, 2023.
Cummins, K. L., Murphy, M. J., Bardo, E. A., Hiscox, W. L., Pyle, R. B., and Pifer, A. E.: A combined TOA/MDF technology upgrade of the US National Lightning Detection Network, J. Geophys. Res., 103, 9035–9044, https://doi.org/10.1029/98JD00153, 1998.
Cummins, K. L., Cramer, J. A., Biagi, C. J., Krider, E. P., Jerauld, J., Uman M. A., and Rakov, V. A.: The U.S. National Lightning Data Network: Post-upgrade status, Second Conf. on Meteorological Applications of Lightning Data, Atlanta, GA, Amer. Meteor. Soc., http://www.atmo.arizona.edu/students/courselinks/spring08/atmo336s1/courses/spring15/atmo589/ATMO489_online/105142.pdf (last access: 8 November 2024), 2006.
Cummins, K. L. and Murphy, M. J.: An overview of lightning locating systems: History, techniques, and data uses, with an in-depth look at the US NLDN, IEEE T. Electromagn. C., 51, 499–518, https://doi.org/10.1109/TEMC.2009.2023450, 2009.
Dowden, R. L., Brundell, J. B., and Rodger, C. J.: VLF lightning location by Time Of Group Arrival (TOGA) at multiple sites, J. Atmos. Sol.-Terr. Phy, 64, 817–830, https://doi.org/10.1016/S1364-6826(02)00085-8, 2002.
Du, Y., Zheng, D., Ma, R., Zhang, Y., Lyu, W., Yao, W., Zhang, W, Ciren, L., and Cuomu, D.: Thunderstorm Activity over the Qinghai–Tibet Plateau Indicated by the Combined Data of the FY-2E Geostationary Satellite and WWLLN, Remote Sens., 14, 2855, https://doi.org/10.3390/rs14122855, 2022.
Fan, P., Zheng, D., Zhang, Y., Gu, S., Zhang, W., Yao, W., Yan, B., and Xu, Y.: A performance evaluation of the World Wide Lightning Location Network (WWLLN) over the Tibetan Plateau, J. Atmos. Ocean. Tech., 35, 927–939, https://doi.org/10.1175/jtech-d-17-0144.1, 2018.
Fleenor, S. A., Biagi, C. J., Cummins, K. L., Krider, E. P., and Shao, X. M.: Characteristics of cloud-to-ground lightning in warm-season thunderstorms in the Central Great Plains, Atmos. Res., 91, 333–352, https://doi.org/10.1016/j.atmosres.2008.08.011, 2009.
Grant, M. D., Nixon, K. J., and Jandrell, I. R.: Positive polarity: Misclassification between intracloud and cloud-to-ground discharges in the Southern African Ligthning Detection Network, 22nd International Lightning Detection Conference, 4th International Lightning Meteorology Conference, Broomfield, Colorado, USA, 2–3 April 2021, https://www.vaisala.com/sites/default/files/documents/Positive%20Polarity.pdf (last access: 8 November 2024), 2012.
Holzworth, R. H., McCarthy, M. P., Brundell, J. B., Jacobson, A. R., and Rodger, C. J.: Global distribution of superbolts, J. Geophys. Res.-Atmos., 124, 9996–10 005, https://doi.org/10.1029/2019JD030975, 2019.
Holzworth, R. H., Brundell, J. B., McCarthy, M. P., Jacobson, A. R., Rodger, C. J., and Anderson, T. S.: Lightning in the Arctic, Geophys. Res. Lett., 48, e2020GL091366, https://doi.org/10.1029/2020GL091366, 2021.
Hutchins, M. L., Holzworth, R. H., Rodger, C. J., and Brundell, J. B.: Far-field power of lightning strokes as measured by the World Wide Lightning Location Network, J. Atmos. Ocean. Tech., 29, 1102–1110, https://doi.org/10.1175/JTECH-D-11-00174.1, 2012a.
Hutchins, M. L., Holzworth, R. H., Rodger, C. J., Heckman, S., and Brundell, J. B.: WWLLN absolute detection efficiencies and the global lightning source function, EGU General Assembly, https://www2.jpgu.org/meeting/2012/session/PDF/P-EM12/PEM12-09_e.pdf (last access: 8 November 2024), 2012b.
Jacobson, A. R., Holzworth, R., Harlin, J., Dowden, R., and Lay, E.: Performance assessment of the world wide lightning location network (WWLLN), using the Los Alamos Sferic Array (LASA) as ground truth, J. Atmos. Ocean. Tech., 23, 1082–1092, https://doi.org/10.1175/JTECH1902.1, 2006.
Jacobson, A. R., Holzworth, R. H., and Brundell, J. B.: Using the World Wide Lightning Location Network (WWLLN) to Study Very Low Frequency Transmission in the Earth-Ionosphere Waveguide: 1. Comparison with a Full-Wave Model, Radio Sci., 56, e2021RS007293, https://doi.org/10.1029/2021RS007293, 2021.
Jerauld, J., Rakov, V. A., Uman, M. A., Rambo, K. J., Jordan, D. M., Cummins, K. L., and Cramer, J. A.: An evaluation of the performance characteristics of the US National Lightning Detection Network in Florida using rocket-triggered lightning, J. Geophys. Res. Atmos., 110, D19106, https://doi.org/10.1029/2005JD005924, 2005.
Kigotsi, J. K., Soula, S., and Georgis, J.-F.: Comparison of lightning activity in the two most active areas of the Congo Basin, Nat. Hazards Earth Syst. Sci., 18, 479–489, https://doi.org/10.5194/nhess-18-479-2018, 2018.
Lay, E. H., Holzworth, R. H., Rodger, C. J., Thomas, J. N., Pinto Jr., O., and Dowden, R. L.: WWLL global lightning detection system: Regional validation study in Brazil, Geophys. Res. Lett., 31, L03102, https://doi.org/10.1029/2003GL018882, 2004.
López-D.íiaz, J. A., Pérez-Puebla, F., and Zancajo-Rodríguez, C.: Tendencias y Homogeneidad en las series de descargas eléctricas del periodo 2000–2011, Boletín AME, 38, 34–38, 2012.
Mackerras, D., Darveniza, M., Orville, R. E., Williams, E. R., and Goodman, S. J.: Global lightning: Total, cloud and ground flash estimates, J. Geophys. Res. Atmos., 103, 19791–19809, https://doi.org/10.1029/98JD01461, 1998.
Orville, R. E. and Huffines, G. R.: Lightning ground flash measurements over the contiguous United States: 1995–97, Mon. Weather Rev., 127, 2693–2703, https://doi.org/10.1175/1520-0493(1999)127<2693:LGFMOT>2.0.CO;2, 1999.
Orville, R. E., Huffines, G. R., Burrows, W. R., Holle, R. L., and Cummins, K. L.: The North American lightning detection network (NALDN) – First results: 1998–2000, Mon. Weather Rev., 130, 2098–2109, 2002.
Pérez-Invernón, F. J., Gordillo-Vázquez, F. J., Huntrieser, H., and Jöckel, P.: Variation of lightning-ignited wildfire patterns under climate change, Nat. Commun., 14, 739, https://doi.org/10.1038/s41467-023-36500-5, 2023.
Pérez-Puebla, F. P. and Zanacajo-Rodríguez, C.: Regímenes tormentosos en la Península Ibérica durante la década 2000–2009, Revista Tiempo y Clima, 5, Boletín AME, April 2010, Vol. 5, 28–35, https://repositorio.aemet.es/bitstream/20.500.11765/2827/1/TyC_2010_28_02.pdf (last access: 8 November 2024), 2010.
Pérez-Puebla, F. and Zanacajo-Rodríguez, C.: La caracterización tormentosa, Acta de las Jornadas Científicas de la Asociación Meteorológica Española, https://pub.ame-web.org/index.php/JRD/article/view/1556 (last access: 8 November 2024), 2012.
Rakov, V. and Uman, M.: Lightning Physics and Effects, 1st edn., Cambridge University Press, Cambridge, UK, ISBN 9781107340886, https://doi.org/10.1017/CBO9781107340886, 2003.
Rodger, C. J., Brundell, J. B., Dowden, R. L., and Thomson, N. R.: Location accuracy of long distance VLF lightning locationnetwork, Ann. Geophys., 22, 747–758, https://doi.org/10.5194/angeo-22-747-2004, 2004.
Rodger, C. J., Brundell, J. B., and Dowden, R. L.: Location accuracy of VLF World-Wide Lightning Location (WWLL) network: Post-algorithm upgrade, Ann. Geophys., 23, 277–290, https://doi.org/10.5194/angeo-23-277-2005, 2005.
Rodger, C. J., Werner, S., Brundell, J. B., Lay, E. H., Thomson, N. R., Holzworth, R. H., and Dowden, R. L.: Detection efficiency of the VLF World-Wide Lightning Location Network (WWLLN): initial case study, Ann. Geophys., 24, 3197–3214, https://doi.org/10.5194/angeo-24-3197-2006, 2006.
Rodger, C. J., Brundell, J. B., Holzworth, R. H., and Lay, E. H.: Growing detection efficiency of the world wide lightning location network, in: AIP Conference Proceedings, 1118, 15–20, https://doi.org/10.1063/1.3137706, 2009.
Rodrigues, R. B., Mendes, V. M. F., and Catalão, J. P. D. S.: Lightning data observed with lightning location system in Portugal, IEEE T. Power Deliver., 25, 870–875, https://doi.org/10.1109/TPWRD.2009.2037325, 2010.
Rodrigues, M., Jiménez-Ruano, A., Gelabert, P. J., de Dios, V. R., Torres, L., Ribalaygua, J., and Vega-García, C.: Modelling the daily probability of lightning-caused ignition in the Iberian Peninsula, Int. J. Wildland Fire, 32, 351–362, https://doi.org/10.1071/WF22123, 2023.
Rudlosky, S. D. and Shea, D. T.: Evaluating WWLLN Performance Relative to TRMM/LIS, Geophys. Res. Lett., 40, 2344–2348, https://doi.org/10.1002/grl.50428, 2013.
Santos, J. A., Reis, M. A., De Pablo, F., Rivas-Soriano, L., and Leite, S. M.: Forcing factors of cloud-to-ground lightning over Iberia: regional-scale assessments, Nat. Hazards Earth Syst. Sci., 13, 1745–1758, https://doi.org/10.5194/nhess-13-1745-2013, 2013.
Shevtsov, B. M., Firstov, P. P., Cherneva, N. V., Holzworth, R. H., and Akbashev, R. R.: Lightning and electrical activity during the Shiveluch volcano eruption on 16 November 2014, Nat. Hazards Earth Syst. Sci., 16, 871–874, https://doi.org/10.5194/nhess-16-871-2016, 2016.
Soriano, L. R., de Pablo, F., and Tomas, C.: Ten-year study of cloud-to-ground lightning activity in the Iberian Peninsula, J. Atmos. Sol.-Terr. Phy., 67, 1632–1639, https://doi.org/10.1016/j.jastp.2005.08.019, 2005.
Soriano, L. R. and de Pablo, F.: Total flash density and the intracloud/cloud-to-ground lightning ratio over the Iberian Peninsula, J. Geophys. Res., 112, D13114, https://doi.org/10.1029/2006JD007624, 2007.
Suszcynsky, D. M., Kirkland, M. W., Jacobson, A. R., Franz, R. C., Knox, S. O., Guillen, J. L. L., and Green, J. L.: FORTE observations of simultaneous VHF and optical emissions from lightning: Basic phenomenology, J. Geophys. Res.-Atmos., 105, 2191–2201, https://doi.org/10.1029/1999JD900993, 2000.
Thomas, R., J. Krehbiel, P. R., Rison, W., Hamlin, T., Harlin, J., and Shown, D.: Observations of VHF source powers radiated by lightning, Geophys. Res. Lett., 28, 143–146, https://doi.org/10.1029/2000GL011464, 2001.
Thompson, K. B., Bateman, M. G., and Carey, L. D.: A comparison of two ground-based lightning detection networks against the satellite-based Lightning Imaging Sensor (LIS), J. Atmos. Ocean. Tech., 31, 2191–2205, https://doi.org/10.1175/JTECH-D-13-00186.1, 2014.
Wacker, R. S. and Orville, R. E.: Changes in measured lightning flash count and return stroke peak current after the 1994 US National Lightning Detection Network upgrade: 1. Observations, J. Geophys. Res.-Atmos., 104, 2151–2157, https://doi.org/10.1029/1998JD200060, 1999.
- Abstract
- Introduction
- The WWLLN: main characteristics and present knowledge
- The reference regional lightning detection system of the Spanish State Meteorological Agency, AEMET
- WWLLN performance in the area of Spain
- Conclusions
- Code availability
- Data availability
- Author contributions
- Competing interests
- Disclaimer
- Acknowledgements
- Financial support
- Review statement
- References


