the Creative Commons Attribution 4.0 License.
the Creative Commons Attribution 4.0 License.
Development of a regionally consistent and fully probabilistic earthquake risk model for Central Asia
Mario A. Salgado-Gálvez
Mario Ordaz
Benjamín Huerta
Osvaldo Garay
Carlos Avelar
Ettore Fagà
Mohsen Kohrangi
Paola Ceresa
Georgios Triantafyllou
Ulugbek T. Begaliev
A fully probabilistic earthquake risk model was developed for five countries in Central Asia, providing updated earthquake loss estimates with a higher level of detail on all components with respect to previous studies in the region. Additionally, a regionally consistent approach that, on the one hand, allows for direct comparisons at different disaggregation levels (e.g., country and oblast) was used. On the other hand, this updated earthquake risk assessment aims to facilitate initiating a policy dialogue regarding national and regional disaster risk financing and insurance applications. This earthquake risk model made use of a regional probabilistic seismic hazard analysis and a comprehensive exposure database on which different types of assets and sectors were included and for which two scenarios (the years 2020 and 2080) were modeled. For each type of asset, a unique vulnerability function was derived and later used for convolution with the hazard data, which allowed for the estimation of the loss exceedance curve, at different disaggregation levels, from where other risk metrics such as the average annual loss (AAL) and specific return period losses were obtained. The regional earthquake AAL for the five countries and for the 2020 exposure scenario has been estimated to be around USD 2 billion, with the Kyrgyz Republic and Tajikistan being the countries with the highest earthquake risk levels in the region. Besides the probabilistic earthquake risk results, as-if scenarios were modeled using a pseudo-deterministic approach to assess the human and economic losses for realistic and representative earthquakes for the main cities within earthquake-prone regions in the five countries of the study area.
- Article
(5434 KB) - Full-text XML
- BibTeX
- EndNote
A regionally consistent and fully probabilistic earthquake risk model was developed for Central Asia, under the sponsorship of the World Bank, in the framework of the Strengthening Financial Resilience and Accelerating Risk Reduction in Central Asia (SFRARR) project. Central Asia is an area characterized by a complex and active tectonic deformation, on which earthquakes, besides having the possibility to inflict damages and losses because of the ground motion, can trigger secondary hazards such as landslides and naturally dammed lake outbursts. The model described in this paper provides updated earthquake loss results for Kazakhstan, Tajikistan, Turkmenistan, Uzbekistan, and the Kyrgyz Republic. To achieve this, the development of a probabilistic seismic hazard analysis (PSHA), an exposure database for buildings and infrastructure (representative of the years 2020 and 2080), and a set of earthquake vulnerability functions for all representative building classes and infrastructure assets was needed.
Within this same project, a probabilistic flood risk assessment was carried out for the same exposed assets, for which details can be found in Coccia et al. (2023). The project required a multi-hazard risk approach; hence a peril-agnostic risk assessment methodology was chosen, which is based on the proposal by Ordaz (2000), and implemented in the R-CAPRA software (ERN, 2022), a tool that has been used for probabilistic risk assessments for different hazards and at different resolution levels (see for instance Salgado-Gálvez et al., 2014; Jaimes et al., 2016; Ordaz et al., 2019). Earthquake and flood hazards are represented through synthetic catalogs of 10 000 years, whereas the relationship between the hazard intensity measures (i.e., ground motion for earthquakes and water depth for floods) and the expected losses (both human and economic) is represented through vulnerability functions.
Previous regional and national earthquake risk assessments have been done in Central Asia, such as the one developed in 2009 by the Central Asia and Caucasus Disaster Risk Management Initiative (CAC-DRMI, 2009), which generated earthquake risk profiles at national, regional, and sub-regional levels based on historical data covering the 1988–2007 period. In the framework of the global risk model by the United Nations Office for Disaster Risk Reduction (UNDRR), a global and probabilistic earthquake risk assessment was carried out for 216 countries, which included the five nations that are part of this study, obtaining reference values in terms of average annual losses (AALs) and loss exceedance curves (LECs) for earthquakes and floods (Ordaz et al., 2014; Cardona et al., 2014; UNISDR, 2015). In 2016, the Global Facility for Disaster Reduction and Recovery (GFDRR) produced earthquake risk profiles for Central Asia at provincial and national levels, presenting results in terms of affected people and economic losses for multiple return periods, with the latter normalized by the country's gross domestic product (GDP) (GFDRR, 2016). More recently, in 2017, an earthquake risk assessment was carried out for the Kyrgyz Republic (World Bank, 2017), which estimated economic losses for different sectors (e.g., residential buildings, schools, fire stations, roads, bridges, and hospitals), although loss metrics such as the AALs are not available for all of them; using a deterministic methodology, the same study provided human and economic losses for 12 scenarios. Some studies were conducted for the region to also quantify earthquake risk at an urban scale, such as the one carried out by the government of Japan, which analyzed three major historical earthquakes that caused significant losses and disruptions in Almaty, with the aim of providing the bases for the formulation of the earthquake disaster risk management plan for the city of Almaty (JICA, 2009).
The earthquake model described in this paper was developed with the objective of facilitating strategic discussions with relevant stakeholders, allowing for coherent and consistent strategic financial solutions across the geographical study area and the key economic sectors of the five countries, and informing the World Bank's engagement in supporting regional and national disaster risk financing and insurance applications, such as for instance traditional and parametric solutions for the structuring of a regional program. However, results are only intended to inform and enable the World Bank to initiate a policy dialogue and do not yet have sufficient detail to recommend or support the design of specific disaster risk management initiatives. The results of the earthquake risk assessment include LECs and year loss tables (YLTs), which can be further disaggregated at two administrative levels (country – ADM0 and oblast – ADM1). In addition, the model allows for the obtainment of return period loss estimates and AALs for these two aggregation levels and for each sector included in the exposure model.
Four different exposure models were developed in this project, for which full details can be found in the accompanying paper of this Special Issue in Scaini et al. (2024a, b). The first exposure model provides a reliable and detailed representation of the conditions for the year 2020 for multiple sectors, whereas the other three exposure models depict a projection to the year 2080, for the residential sector only, considering three different shared socioeconomic pathways (SSPs), namely SSP1, SSP4, and SSP5. Since earthquake hazard can be assumed to be stationary, the occurrence characteristics of the PSHA developed for today's conditions can be considered to be the same for the next 60 years, which is the reason why no variations in the hazard model for the year 2080 earthquake risk estimates were introduced.
In addition to the probabilistic risk results, a pseudo-deterministic method was used to estimate human and economic losses for five credible and feasible earthquakes, one for each capital city (except for Kazakhstan where the scenario analysis was carried out for the city of Almaty). These earthquakes were selected from the YLT after having disaggregated the losses for a 100-year return period. Finally, the modeled losses have been used to derive a relationship between them and the total emergency costs, for which details can be found in Berny et al. (2024), to complement the relevant information required for the design and implementation of a comprehensive disaster risk management plan.
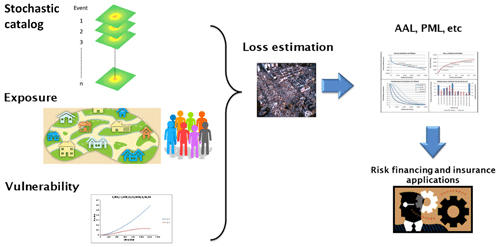
This section describes the fully probabilistic risk assessment methodology that was used to estimate the potential earthquake losses in the five countries in Central Asia. As previously mentioned, the methodology is peril agnostic and is the same as that used for estimating flood losses in the same study area, for which details and results can be found in Coccia et al. (2023). The main objective of any probabilistic risk assessment, regardless of the hazard, is to provide a long-term relationship between the losses (e.g., fatalities and/or economic losses) and their occurrence frequencies. Figure 1 shows the general framework of the risk assessment methodology used in this study, noting that it is at the loss module where the combination of the different outputs of the hazard, exposure, and vulnerability modules is made, yielding in this case the estimates of human and economic losses induced by earthquakes.
The probabilistic risk assessment methodology employed in this study required the following analytical steps:
-
A probabilistic seismic hazard analysis (PSHA) was conducted, for which the output consists of a synthetic earthquake catalog with a duration of 10 000 years, a time frame that was deemed long enough to provide an acceptable balance between risk result stability (for long return periods) and computational effort. This synthetic earthquake catalog contains thousands of earthquake events, for which in each case the characteristics of the location, depth, magnitude, and geometry of the rupture (e.g., strike, dip, shape, aspect ratio) are included so that an estimation of the probability distribution of the ground motion intensities (i.e., peak ground acceleration, PGA) produced by the event in the surrounding region can be made. To generate the synthetic earthquake catalog, a PSHA was developed for the area under study, for which details are fully described in two accompanying papers of this Special Issue by Poggi et al. (2023, 2024). The outputs of the PSHA were converted into the format required by R-CRISIS (Ordaz et al., 2021, 2023) so that it could be used in R-CAPRA, the chosen risk assessment tool for this study.
-
The inventory of the exposed assets was defined. For the five countries in the study area of this project, different exposure models (one for the year 2020 and three for the year 2080) were developed, including information about the location of the assets, their replacement cost, and structural characteristics (e.g., construction material, height, structural system, among others). The exposure model for the year 2020 accounts for the following types of assets:
-
population
-
building stock
- a.
residential buildings
- b.
non-residential buildings (schools, healthcare facilities, and industrial and commercial buildings)
- a.
-
infrastructure
- a.
transportation system (roads, railways, and bridges)
- b.
airports and airstrips
- c.
supply infrastructure.
- a.
Each of the other three exposure models that provide a projection of the exposure for the year 2080 considered a different shared socioeconomic pathway (SSP), SSP1, SSP4, and SSP5, and only the residential buildings were included.
-
-
The relationship between the hazard intensity measure and the expected human and physical losses was represented through vulnerability functions, which provide a continuous, quantitative, and probabilistic relationship between the hazard intensity measure (PGA in this case), the expected loss, and a dispersion measure. A unique vulnerability function was derived for each class of asset included in the exposure datasets (buildings and different types of infrastructure).
-
Hazard, exposure, and vulnerability data were combined in the loss module, where for each synthetic earthquake, the possible economic and human losses were estimated for the five countries. In a nutshell, the human and economic losses for each exposed asset were computed after convolving the ground acceleration distribution at the site of interest with the corresponding vulnerability function. This procedure provides a distribution of the mean loss ratio (i.e., the repair cost normalized by the asset replacement cost), which is later multiplied by the total value of the asset to obtain the distribution of losses for the asset caused by a given earthquake. The total loss for each synthetic earthquake is obtained after summing up the losses for all exposed assets. Because every synthetic earthquake has an annual occurrence probability, the losses for all events in the catalog are combined using the methodology proposed by Ordaz (2000), which is explained in detail next.
The probability density function of the loss for the ith synthetic earthquake (hereinafter denoted as event) is computed after aggregating the losses of the individual assets in the exposure database. The expected value of the loss, denoted as E(l|Eventi), and its variance, σ2(l|Eventi), are calculated for each event in the synthetic catalog with the following expressions:
where NE represents the total number of exposed assets within the ground motion footprint, E(lj) represents the expected value of the loss of the jth exposed asset given the occurrence of the ith event, σ2(lj) corresponds to the variance of the loss at the jth exposed asset given the occurrence of the ith event, and cov(lk,lj) represents the covariance of the loss of two different exposed assets. This covariance is estimated by using a correlation coefficient, denoted as ρk,j, besides considering the standard deviations of the losses for different exposed assets. It is worth noting that the selection of a correlation model is likely to have effects on the spatially aggregated losses. Equation (2) can therefore be rewritten as
The key outcome of this fully probabilistic risk assessment methodology corresponds to the LEC, which provides a relationship between different loss values and their annual exceedance frequencies. This model has calculated the LEC using the following expression, which corresponds to one of the possible forms that the total probability theorem can take:
where ν(l) represents the exceedance rate of the loss l, Pr(L>l|Eventi) is the probability that the loss is larger than l given the occurrence of the ith event, and FA(Eventi) is the annual occurrence frequency of the ith event. The sum of the equation is carried out for all the events included in the synthetic catalog. Finally, the return period of any loss value of interest, Tr(l), can be calculated as the inverse value of its loss exceedance rate.
Since the loss computed in a group of exposed assets for each synthetic earthquake is an uncertain quantity, it must be treated as a random variable. We have considered the uncertainty in the occurrence of future earthquakes, the uncertainty related to the estimation of the hazard intensities caused by an event (i.e., through the σ value of the ground motion models, GMMs), and the uncertainty in the vulnerability functions (i.e., the dispersion measure for the expected loss).
The loss probability distribution for each synthetic earthquake is calculated by first determining the distribution of the hazard intensity value at the location of each exposed asset and then evaluating the probability distribution of the loss given that hazard intensity value. This is a standard approach that simplifies the problem of assessing the loss distribution by dividing it into two steps. The probability of exceeding a loss with a given value l, conditioned to the occurrence of an earthquake, is thus expressed as
In Eq. (6), Pr(L>l|I) corresponds to the probability that the loss will exceed the value l given that the local ground motion intensity was I. This term represents the vulnerability model and the uncertainty associated with the expected loss given a certain value of ground motion. f(I|Eventi) represents the probability density function of the hazard intensity, conditional to the occurrence of the event. In this case, it represents the evaluation of the ground motion, which is uncertain, given the occurrence of an earthquake by means of the GMMs. The probability distribution of the ground motion intensity includes the aleatory uncertainty associated with the estimate of the ground motion caused by the event as computed by a GMM and the epistemic uncertainty due to the use of more than one GMM to assess the ground motion intensity (i.e., logic trees).
3.1 Development of a set of regional earthquake vulnerability functions
For each type of asset included in the exposure database, a unique earthquake vulnerability function was derived to estimate the human and economic losses using PGA as the hazard intensity measure. Vulnerability functions can be derived using different approaches, namely analytical, empirical, and expert opinion based, although usually a combination of all three is used. In this project, the empirical approach (i.e., the one that uses post-earthquake damage and loss observed data for different types of assets) was discarded because of the lack of sufficient data on ground motion and building damages and losses from past earthquakes that occurred in the study area. The methodology adopted for this study involved collecting and reviewing multiple sets of existing fragility and vulnerability functions from various references relevant for the region, including local studies, international literature, and previously developed projects by the World Bank in the region. Such an analysis allowed for the creation of a large database of vulnerability functions that were classified in accordance with the taxonomy used in our exposure model. These functions were further harmonized and processed, and a single class-specific function was extracted to capture the mean loss and its variation in the database compiled.
Because of the objective of the project and the lack of local data, in particular for some countries in the region, the earthquake vulnerability functions were derived at a regional level considering the similarities in construction practices in the whole area. Hence no differences between the countries could be captured, although they may exist, for which further studies are needed. As explained in detail by Scaini et al. (2024a, b), 6 building types and 15 building subtypes were included in the taxonomy for the residential buildings in Central Asia. For the non-residential building category, 8 building types were identified, whereas for the infrastructure assets (e.g., roads, railways, and bridges), 10 classes were included.
The starting point for the development of the regional vulnerability model was to compile a set of fragility curves (Kircher and McCann, 1983), which define the probability of exceeding a damage state (DS) given the ground motion intensity, properly classified in accordance with the exposure taxonomy. These are later combined with consequence functions that define the expected loss ratio (i.e., the fraction of earthquake losses with respect to the total replacement cost of an asset) for a given DS. To define these parameters, different studies that have previously been developed for the region were reviewed, such as the works by Kostov et al. (2004), Ahmad et al. (2011), Karantoni et al. (2011), and Lagomarsino and Cattari (2014), as well as the existing national earthquake-resistant building codes and the seismic risk assessment in the Kyrgyz Republic by the World Bank (2017). Moreover, for specific buildings such as schools, global libraries of vulnerability functions, such as the one by the Global Library of School Infrastructure (GLOSI), were considered. The functions from the different references were harmonized to the same intensity measure (e.g., PGA), and when fragility curves were reported, the functions were combined with an appropriate consequence function, compatible with the DS assumed in the original reference. The harmonization allowed us to make a direct comparison of the information provided in the different references considered. The harmonization procedure resulted in a unique function for each building class, accounting for the uncertainty implied by the combination of functions derived with different approaches and methodologies. This allowed, for the first time in the Central Asian context, the derivation of a new model applicable to the entire region, leveraging the most recent international research outcomes, as well as local observations and expertise. Moreover, the approach adopted allowed us to consider the uncertainty associated with the evaluation of the damage due to the different approaches that could be adopted to define the vulnerability (i.e., the variability among the studies analyzed). It should be noted that the choice of an efficient and sufficient intensity measure is crucial in an earthquake risk assessment (Luco and Cornell, 2007; Kohrangi et al., 2016). It is widely recognized that PGA may not be an optimal predictor for damage and, eventually, losses, especially for some building typologies. The reasons behind such a choice herein, especially in a context like the one in Central Asia, are due to the limited information on existing fragility and vulnerability curves in the region and the fact that the limited information is mainly available as a function of PGA.
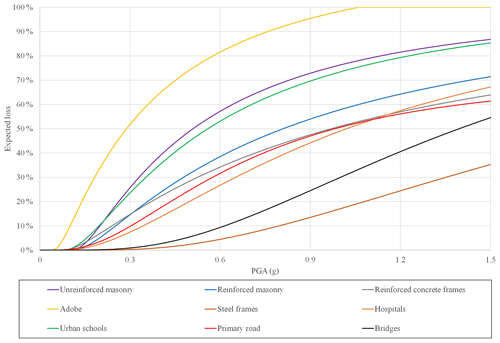
Figure 2 shows some examples of the earthquake vulnerability functions used in this study to estimate earthquake losses on different types of buildings and infrastructure components. The full details of the vulnerability models can be found in the technical report of the project (RED, 2023).
3.2 Loss model calibration and validation
Using the vulnerability functions derived with the procedure explained in Sect. 3.1, a comparison between the total direct losses obtained from the model and the reported losses from the data of seven historical earthquakes in the region was carried out. With the initial vulnerability functions, in most cases the losses computed with the model were higher compared to the reported ones. The difference in the losses can be partially explained by the changes in the exposed assets at the time of the event compared to the current exposure assets (on which losses were estimated in this study). However, part of the difference in the losses can be the result of the conservatively high loss ratios in the original vulnerability curves, mainly the loss ratios in the initial (left) side of the vulnerability curves, where the intensity measure (e.g., PGA) tends to be very low. Therefore, a calibration procedure of the original vulnerability functions was carried out through an iterative process on the original set of functions, which was done by comparing the results of the model on an event-by-event basis, in terms of economic losses and fatalities, with those included in publicly available reports. Reported losses were obtained from different sources, and it must be highlighted that these values are affected by large uncertainties, and the following limitations exist:
-
The accuracy of the reported losses is variable since different methodologies were used in each case at different times in each of the five countries. Because of the use of different methodologies, the same event could have different values of reported human and economic losses.
-
The reported losses were trended using the methodology by Pielke et al. (2003) to account for the effect of the national population, inflation, local currency deflator, and gross domestic product growth, among others, to make them comparable with the modeled values. This process is another source of uncertainty because many factors that occurred after the event are unknown. In general, the older the event, the most uncertain its reported losses.
-
Reported losses usually account for the sum of direct and indirect (and in some cases content) losses, and this detail is often unspecified, or the losses are not disaggregated by type. The earthquake losses computed in this study are representative of only the direct losses of buildings and infrastructure.
-
For earthquakes such as the 2003 Kazakhstan event, the available economic losses were reported in the local currency (tenge). Since the comparisons were carried out in terms of US dollars, additional variability was included in the procedure by adopting an average exchange rate for the time of occurrence.
With the support of the local specialists involved in the development of this project, data from the seven historical earthquakes listed in Table 1 were compiled and used for validation purposes.
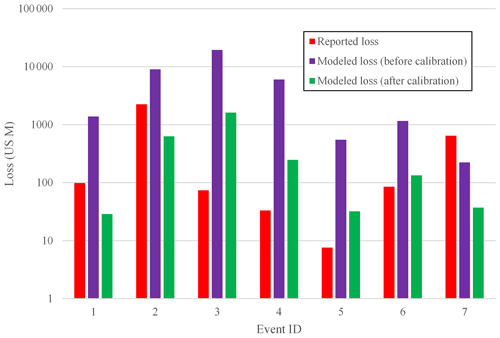
Figure 3Comparison of monetary losses between the observed (reported) values and the modeled losses before and after the calibration.
Table 1Location, magnitude, and depth parameters for the historical earthquakes used in the loss validation process.
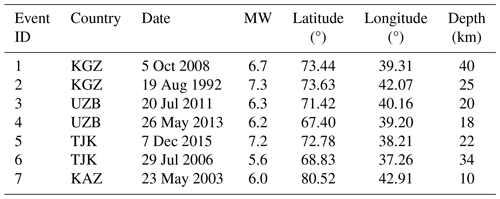
With the data shown in Table 1 and considering the GMM and rupture's characteristics that were used in the PSHA for this project, the PGA footprints were generated to estimate the losses for the different types of assets. The methodology employed for calculating the losses of these historical earthquakes is the same as for the fully probabilistic risk assessment. For most of the historical earthquakes, two possible fault planes have been reported from the moment tensor solution, and, following this, based on the tectonic environment while maintaining coherence with the PSHA assumptions, the most appropriate fault plane was chosen to define the geometric and orientation characteristics of each rupture. Note that the adopted vulnerability functions have been calibrated based on the outcomes of the estimated losses for the historical events. This was informed by finding an intermediate solution based on the historical reported losses in the region and by comparing the outcomes of the normalized losses (i.e., the ratio of the total estimated losses to the total replacement value) for the historical events of the region with other regions of the world with similar seismicity and exposure. Figure 3 shows the comparison between the reported and modeled losses (before and after the calibration). A similar methodology was followed for the calibration of the vulnerability functions to estimate human losses, for which a comparison between the modeled and reported fatalities was made, allowing for the improvement of the fit between the two values.
Figure 4 shows the shake maps, based on the selected ground motion models used for the PSHA carried out in this study, for peak ground acceleration (PGA) for the Kyrgyz Republic earthquakes listed in Table 1. Figure 5 shows the comparison between the modeled and reported economic losses and fatalities for the two events. The average value is indicated in green and is limited by the black squares that depict the upper and lower limits of the reported values, as per the different data sources.
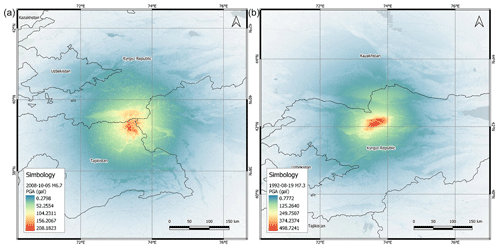
Figure 4Shake maps (PGA) for the 5 October 2008 (a) and the 19 August 1992 (b) Kyrgyz Republic earthquakes.
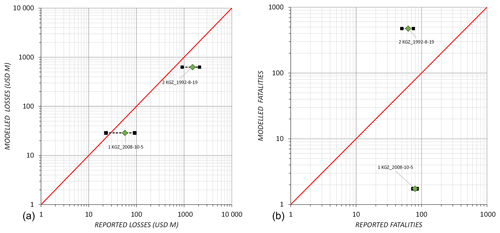
Figure 5Comparison of the modeled economic losses (a) and fatalities (b) for the historical earthquakes in the Kyrgyz Republic.
The reported economic losses for the two historical earthquakes used in the validation procedure in the Kyrgyz Republic are higher than the modeled losses by a factor of almost 3. However, it should be stressed again that the reported losses have large uncertainties associated with them, such as what they include (e.g., only residential buildings or emergency costs). For the modeled fatalities of the 2008 event, the obtained results are lower than the reported ones, whereas the opposite occurs for the 1992 event. As mentioned before, the use of a regional vulnerability model may overlook different considerations that are specific to each country, which therefore explains these differences.
The differences between the modeled and reported losses for the seven historical events, despite being non-negligible, can be explained by different reasons. First, during the development of the earthquake vulnerability functions for this project, there were not enough specific data on the vulnerability characteristics and the reported losses to be able to distinguish and calibrate the models at a country level. Therefore, a regional approach was adopted for the development of the vulnerability functions. As shown in Fig. 3, there are some overestimations (e.g., Uzbekistan 2011 earthquake) and underestimations (e.g., Kyrgyz Republic 1992 earthquake) against the reported losses that are normal in this type of modeling, even if these are systematic for a given country. Even if part of the differences can be related to the characteristics of the exposed assets at the time of the event compared to the current ones, another possible explanation could be the choice of conservative (i.e., high) loss ratios, particularly for low PGA levels, which can affect the aggregated losses. This occurs because the number of exposed assets in areas far from the epicenter (and thus affected by low ground motion intensities) is usually much larger than that close to it for these seven events, and even very small loss ratios in the low PGA range, when summed for all those far exposed assets, might unrealistically increase the total aggregated losses. Note that the reported losses after earthquakes commonly consider the losses induced by the mainshock event and all other aftershocks (i.e., the entire sequence). Herein, however, the loss estimates reflect the results of the loss calculations related only to the mainshock (or the largest event in the sequence), which may explain the underestimation of the losses in some of the cases. The other components of the risk assessment (i.e., earthquake hazard and exposure) were subject to separate validation processes, and details can be found in the accompanying papers in this Special Issue by Poggi et al. (2023, 2024) and Scaini et al. (2024a, b).
4.1 Aggregated earthquake loss estimates
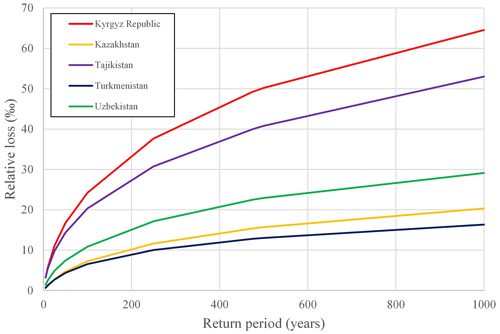
Earthquake risk results have been calculated at different aggregation levels, with the oblast one being the most refined, followed by the national and regional cases. In the latter, aggregated results for the five countries in the study area were obtained. For each case, an LEC was estimated, as shown in Fig. 6, providing a relationship between different loss levels and their annual occurrence frequencies. As it is well-known, the inverse value of the annual occurrence frequency represents the return period (in years).
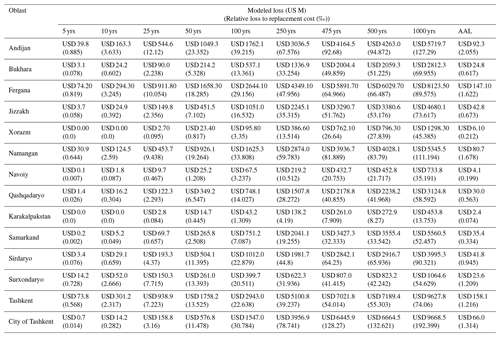
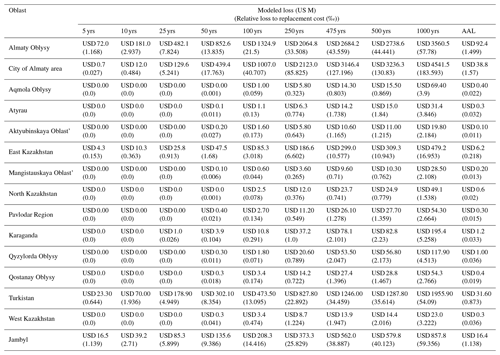
Tables 2–5 show the tabulated results for the earthquake losses (in absolute values and normalized by their exposed value) in terms of the AAL and return period losses between 5 and 1000 years at country and regional levels for the 2020 exposure and the three SSPs for the year 2080. Appendix A includes the earthquake risk results at an oblast level for the residential sector and the year 2020 exposure for the five countries in the study area.
Table 2Tabulated earthquake losses at regional and country levels for the 2020 exposure (all sectors).

Table 3Tabulated earthquake losses at regional and country levels for the 2080 exposure (residential sector only), SSP1.

Table 4Tabulated earthquake losses at regional and country levels for the 2080 exposure (residential sector only), SSP4.

Table 5Tabulated earthquake losses at regional and country levels for the 2080 exposure (residential sector only), SSP5.

The tables show the absolute and relative earthquake losses at a country level and at a regional level for the current exposure scenario (the year 2020). The regional level refers to the aggregated results for the five Central Asian countries. Although the largest absolute losses are found for Uzbekistan, these values do not indicate that the largest earthquake risk in the region is in that country. In relative terms (per mil – ‰), it can be seen from the same tables (Tables 2–5) that the Kyrgyz Republic and Tajikistan have larger losses due to a combination of the higher earthquake levels at locations with exposure concentrations and earthquake vulnerability. From Tables 2–5, it can also be seen that this metric is additive, meaning that the regional AAL is the sum of the individual AALs calculated for each of the five countries. However, the same additive property does not hold true for specific return period losses, meaning that the regional loss for a given return period is different from (or lower than) the sum of the individual losses for that same return period calculated for each country (see Ordaz, 2000, for more details).
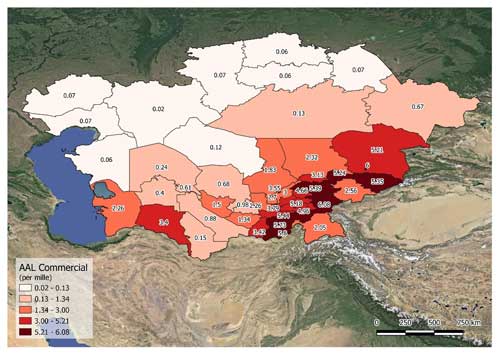
When interpreting the absolute losses of the exposure representative of the year 2080, it must be noted that it was developed only for the residential sector. Therefore, since the total exposed value is lower in the region for the 2080 case, the absolute losses are lower too. It must be noted that this does not mean that risk will decrease in the future under the assumptions adopted in this study. Besides the losses shown in the tables, earthquake losses can be further disaggregated by sector (into as many as included in the exposure databases). For instance, Fig. 7 shows the normalized AAL at an oblast level in the study area for the commercial buildings only.
4.2 Scenario earthquake loss estimates
Some disaster risk management applications, such as the development of emergency response plans, require – in addition to the probabilistic risk results – additional information such as scenario (or pseudo-deterministic) risk assessments, which include only one event in the risk equation. We denote this risk assessment approach as pseudo-deterministic since it is only deterministic from an occurrence perspective (i.e., FA takes a value equal to 1.0 in Eq. 4), given that the loss assessment is still probabilistic, and the uncertainties associated with the hazard and vulnerability components are identified, quantified, and propagated throughout the process. This approach yields results in terms of the expected economic and human losses and allows for the obtainment of the probability density function (PDF) of the loss. In this project, five scenario analyses using the previously described approach were carried out for selected cities. The cities correspond to the capitals of each country, except for Kazakhstan, where the scenario analysis was carried out for Almaty because of the relatively low seismic hazard in Astana.
The criterion followed for choosing the critical scenarios was based on the disaggregation of the loss at an arbitrarily chosen return period, in this case set equal to 100 years. For this, the following steps were followed:
-
The LECs for the oblasts where the cities of interest are located were used, and the loss with a 100-year return period is read as a reference. However, if a different return period is needed, all the required information is at the LECs.
-
Knowing the 100-year return period loss, from the year loss tables (YLTs) different events that cause similar loss amounts are identified. Depending on the seismotectonic and vulnerability characteristics, these events can have either similar locations and magnitudes (e.g., all moderate magnitudes and in close proximity to the city) or different locations and magnitudes (e.g., some with moderate magnitudes in close proximity to the city and some with larger magnitudes but farther from the city).
-
From each of these events, the key parameters are identified, such as their magnitude, location, depth, and rupture characteristics (e.g., strike and dip). For each city, between four and five synthetic events causing similar losses to the event with the 100-year return period were identified.
-
After this short-listing, which includes only different earthquakes with different magnitudes and locations that caused similar losses to the event of the 100-year return period, a single event was chosen, and the pseudo-deterministic risk assessment was carried out.
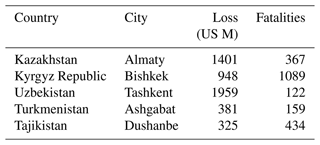
Table 6 shows the characteristics of the chosen earthquakes for the five analyzed cities. In general, all magnitudes are moderate except for the event in Turkmenistan, where, based on the 100-year loss disaggregation results, an event with Mw>7.0 was selected. Figure 8 shows the modeled PGA for the Ashgabat event as an example.
Table 6Characteristics of the selected earthquake scenarios for the pseudo-deterministic earthquake risk assessment.
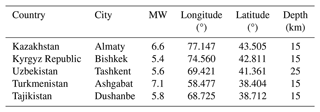
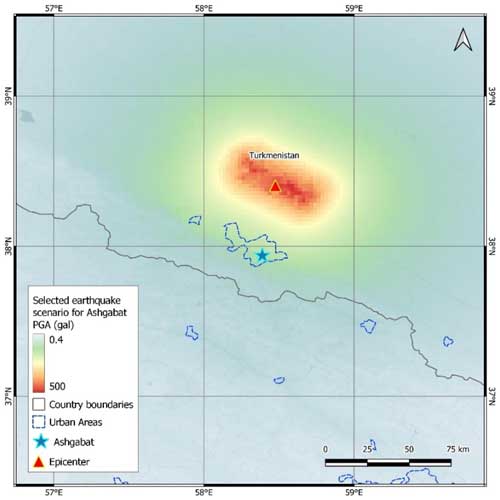
Figure 8Shake map (PGA) for the deterministic event of Mw=7.1 at a distance of 50 km from Ashgabat, Turkmenistan.
Table 7 shows the expected values for the economic and human losses after performing the risk assessment for these five events. These results include the economic losses modeled for all the sectors considered in the exposure database and are in all cases very close to those of the 100-year return period of each oblast.
This paper presented a methodological framework for the development of a regionally consistent and fully probabilistic earthquake risk assessment for Central Asia, which yielded results in terms of loss exceedance curves (LECs), average annual losses (AALs), and specific return period losses, namely the commonly used risk metrics within any comprehensive disaster risk management strategy. Earthquake risk has been estimated considering four different exposure models, one representative of today's conditions and the other three representative of the year 2080 but accounting for different shared socioeconomic pathways (SSPs). The level of detail for all the components of this earthquake risk model is higher compared to previous studies in the region, and all components of this study were subject to comprehensive validations and calibrations, using the best available public data. This refinement has also been complemented with the inclusion of additional sectors in the exposure databases that enabled the derivation of a more comprehensive overview of the earthquake risk level in the study area.
The earthquake losses calculated in this study provided an order of magnitude for feasible losses up to the subnational level, which was made possible because of the good-enough resolution level used for the representation of both hazard and exposure. Moreover, by using a regionally consistent approach, the results are directly comparable across the modeling approaches, which, in addition to the use of consistent assumptions, modeling approaches, and treatment of uncertainties, is crucial, especially considering the final objective of the study (i.e., the regional calculation of earthquake losses).
In addition to earthquake risk, flood risk was also of interest within this study, and therefore a peril-agnostic and fully probabilistic risk assessment methodology was used. This was achieved by using the same representation of all the key risk components (i.e., hazard, exposure, and vulnerability), and a key benefit is having obtained the results in terms of the same risk metrics. At the same time, the exposure model disaggregated the assets into different sectors, therefore allowing for the estimation of earthquake results for each of them and providing valuable information for policy- and decision-makers involved in different activities both at subnational and national levels.
It must be noted too that the results of this earthquake risk assessment are intended to inform the World Bank's engagement in the support of regional and national disaster risk financing and insurance applications, which can include, for instance, traditional and parametric solutions for the structuring of a regional program. However, the level of detail in this study may not be sufficient to on its own support the planning and design of specific risk management infrastructure, although it can clearly be used to enable the World Bank to initiate a policy dialogue.
Central Asia lacks detailed analysis of historical emergency costs. Because of this, a methodology was proposed in the framework of the study (see Berny et al., 2024) considering all the relevant aspects identified after a literature review and taking as a reference the modeled earthquake losses.
A major limitation found during the development of this earthquake risk model was the lack of data to carry out a comprehensive validation and calibration process. A regional approach was used to build the earthquake vulnerability model for the five countries, and peculiarities of each country have not been taken into account due to the lack of detailed data; however, no significant differences within the region are expected, and a calibration process was performed to match the reported economic and human losses available for historical events. Finally, regarding the exposure projections to the year 2080 for the residential buildings, it must be highlighted that catastrophe risk models always have associated levels of uncertainty when based on current hazard and exposure characteristics, which in this case tend to increase due to the uncertainties in this future scenario. For this reason, although these results have been made available, they must be taken as indicative and should only be used for comparison purposes.
Table A1Earthquake losses for different return periods and AALs for the residential sector in the Kyrgyz Republic. The first line shows the absolute loss (in US M) and the second line the normalized loss (‰).
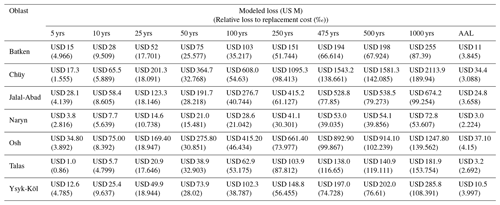
Table A2Earthquake losses for different return periods and AALs for the residential sector in Tajikistan. The first line shows the absolute loss (in US M) and the second line the normalized loss (‰).

Table A3Earthquake losses for different return periods and AALs for the residential sector in Turkmenistan. The first line shows the absolute loss (in US M) and the second line the normalized loss (‰).
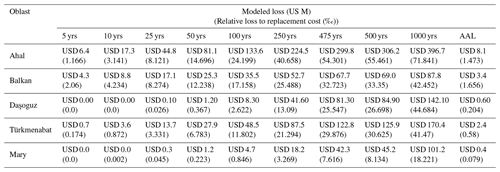
Table A4Earthquake losses for different return periods and AALs for the residential sector in Kazakhstan. The first line shows the absolute loss (in US M) and the second line the normalized loss (‰).
The data and results of this study are available at https://datacatalog.worldbank.org/search?q=sfrarr central&start=0&sort= (World Bank Group, 2024).
MASG: conceptualization, validation, formal analysis, writing (editing). MOS: conceptualization, risk assessment methodology, software, validation, formal analysis, writing (review and editing). BH, OG, and CA: conceptualization, software, formal analysis, and validation. EF, MK, PC, and ZF: conceptualization, vulnerability model development, vulnerability methodology, formal analysis, validation, and calibration.
The contact author has declared that none of the authors has any competing interests.
Publisher's note: Copernicus Publications remains neutral with regard to jurisdictional claims made in the text, published maps, institutional affiliations, or any other geographical representation in this paper. While Copernicus Publications makes every effort to include appropriate place names, the final responsibility lies with the authors.
This article is part of the special issue “Regionally consistent risk assessment for earthquakes and floods and selective landslide scenario analysis in Central Asia”. It is not associated with a conference.
The authors thank the World Bank specialists, in particular Chyi-Yun and Stuart Fraser, for their contributions and constructive criticism during the development of the earthquake risk model. The authors also thank Sergey Tyagunov for assistance and support in the finding and validation of local data.
The Strengthening Financial Resilience and Accelerating Risk Reduction in Central Asia (SFRARR) project was funded by the European Union and implemented by the World Bank.
This paper was edited by Valerio Poggi and reviewed by three anonymous referees.
Ahmad, N., Crowley, H., and Pinho, R.: Analytical fragility functions for reinforced concrete and masonry buildings and buildings aggregates of Euro-Mediterranean Regions – UPAV methodology, Internal Report, Syner-G Project, 2011.
Berny, E., Avelar, C., Salgado-Gálvez, M. A., and Ordaz, M.: Estimating emergency costs for earthquakes and floods in Central Asia based on modelled losses, Nat. Hazards Earth Syst. Sci., 24, 53–62, https://doi.org/10.5194/nhess-24-53-2024, 2024.
CAC-DRMI: Risk assessment for Central Asia and Caucasus: desk study review, https://www.unisdr.org/files/11641_CentralAsiaCaucasusDRManagementInit.pdf (last access: 11 November 2023), 2009.
Cardona, O. D., Ordaz, M., Mora, M., Salgado-Gálvez, M. A., Bernal, G. A., Zuloaga, D., Marulanda, M. C., Yamín, L. E., and González, D.: Global risk assessment: a fully probabilistic seismic and tropical cyclone wind risk assessment, Int. J. Disast. Risk Reduct., 10, 461–476, 2014.
Coccia, G., Ceresa, P., Bussi, G., Denaro, S., Bazzurro, P., Martina, M., Fagà, E., Avelar, C., Ordaz, M., Huerta, B., Garay, O., Raimbekova, Z., Abdrakhmatov, K., Mirzokhonova, S., Ismailov, V., and Belikov, V.: Large-scale flood risk assessment in data scarce areas: an application to Central Asia, Nat. Hazards Earth Syst. Sci. Discuss. [preprint], https://doi.org/10.5194/nhess-2023-157, in review, 2023.
ERN – Evaluación de Riesgos Naturales: R-CAPRA, Program for probabilistic and multi-hazard risk assessment, Evaluación de Riesgos Naturales, Mexico City, Mexico, 2022.
GFDRR: Europe and Central Asia Country Risk Profiles for Floods and Earthquakes, https://documents1.worldbank.org/curated/en/958801481798204368/pdf/111015-REVISED-WP-ECA-Country-risk-profiles-PUBLIC.pdf (last access: 11 November 2023), 2016.
Jaimes, M. A., Reinoso, E., Ordaz, M., Huerta, B., Silva, R., Mendoza, E., and Rodríguez, J.C.: A new approach to probabilistic earthquake-induced tsunami risk assessment, Ocean Coast Manage., 119, 68–75, 2016.
JICA: The Study on Earthquake Disaster Risk Management for Almaty City in the Republic of Kazakhstan, https://openjicareport.jica.go.jp/pdf/11961752.pdf (last access: 15 August 2023), 2009.
Karantoni, T., Lyrantzaki, F., Tsionis, G., and Fardi, M. N.: Analytical fragility functions for masonry buildings and building aggregates, UPAT Methodology, Syner-G Project 2009/2012, 2011.
Kircher, C. A. and McCann, M. W.: Appendix A: development of seismic fragility curves for sixteen types of structures common to cities of the Mississippi Valley Region. Jack Benjamin and Associates Inc., Mountain View, California, USA, 1983.
Kohrangi, M., Vamvatsikos, D., and Bazzurro, P.: Implications of Intensity Measure Selection for Seismic Loss Assessment of 3-D Buildings, Earthq. Spectra, 32, 2167–2189, 2016.
Kostov, M., Vaseva, E., Kaneva, A., Koleva, N., Verbanov, G., Stefanov, D., Darvarova, E., Salakov, D., Simeonova, S., and Cristoskov, L: Application to Sofia, Report RISK-UE WP13, RISK-UE Project, 2004.
Lagomarsino, S. and Cattari, S.: Fragility Functions of Masonry Buildings, in: SYNER-G: Typology Definition and Fragility Functions for Physical Elements at Seismic Risk, Vol. 27, edited by: Pitilakis, K., Crowley, H., and Kaynia, A., GGEE – Geotechnical, Geological and Earthquake Engineering, 2014.
Luco, N. and Cornell, C. A.: Structure-Specific Scalar Intensity Measures for Near-Surface and Ordinary Earthquake Ground Motions, Earthq. Spectra, 23, 357–392, 2007.
Ordaz, M. Metodología para la evaluación del riesgo sísmico enfocada a la gerencia de seguros por terremoto, technical report, Universidad Nacional Autónoma de México, Mexico City, Mexico, 2000.
Ordaz, M., Cardona, O. D., Salgado-Gálvez, M. A., Bernal, G. A., Singh, S. K. and Zuloaga, D.: Probabilistic seismic hazard assessment at global level, Int. J. Disast. Risk Reuct., 10, 419–427, 2014.
Ordaz, M., Salgado-Gálvez, M. A., Huerta, B., Rodríguez, J. C., and Avelar, C.: Considering the impacts of simultaneous perils, Disast. Prevent. Manage., 28, 823–837, 2019.
Ordaz, M., Salgado-Gálvez, M. A., and Giraldo, S.: R-CRISIS: 35 years of continuous developments and improvements for Probabilistic Seismic Hazard Analysis, Bull. Earthq. Eng., 19, 2797–2816, 2021.
Ordaz, M., Martinelli, F., Aguilar, A., Arboleda, J., Meletti, C. and D'Amico, V.: R-CRISIS, Program for computing seismic hazard, Instituto de Ingeniería, Universidad Nacional Autónoma de México, Mexico City, Mexico, http://www.r-crisis.com/ (last access: 18 July 2023), 2023.
Pielke, R. A., Rubiera, J., Landsea, C., Fernández, M. L., and Klein, R.: Hurricane Vulnerability in Latin America and The Caribbean: Normalized Damage and Loss Potentials, Nat. Hazards Rev., 4, 101, https://doi.org/10.1061/(ASCE)1527-6988(2003)4:3(101), 2003.
Poggi, V., Parolai, S., Silacheva, N., Ischuk, A., Abdrakhmatov, K., Kobuliev, Z., Ismailov, V., Ibragimov, R., Karayev, J., Ceresa, P., Santulin, M., and Bazzurro, P.: Development of a regional probabilistic seismic hazard model for Central Asia, Nat. Hazards Earth Syst. Sci. Discuss. [preprint], https://doi.org/10.5194/nhess-2023-132, in review, 2023.
Poggi, V., Parolai, S., Silacheva, N., Ischuk, A., Abdrakhmatov, K., Kobuliev, Z., Ismailov, V., Ibragimov, R., Karaev, J., Ceresa, P., and Bazzurro, P.: Harmonizing seismicity information in Central Asian countries: earthquake catalogue and active faults, Nat. Hazards Earth Syst. Sci., 24, 2597–2613, https://doi.org/10.5194/nhess-24-2597-2024, 2024.
RED – Risk Engineering Development: Earthquake vulnerability for the regional consistent risk assessment for earthquakes and floods and selective landslide scenario analysis for strengthening financial resilience and accelerating risk reduction Central Asia, Technical Report Task 5a, 2023.
Salgado-Gálvez, M. A., Zuloaga, D., Bernal, G. A., Mora, M. G., and Cardona, O. D.: Fully probabilistic seismic risk assessment considering local site effects for the portfolio of buildings in Medellín, Colombia, Bull. Earthq. Eng., 12, 671–695, 2014.
Scaini, C., Tamaro, A., Adilkhan, B., Sarzhanov, S., Ismailov, V., Umaraliev, R., Safarov, M., Belikov, V., Karayev, J., and Faga, E.: A new regionally consistent exposure database for Central Asia: population and residential buildings, Nat. Hazards Earth Syst. Sci., 24, 929–945, https://doi.org/10.5194/nhess-24-929-2024, 2024a.
Scaini, C., Tamaro, A., Adilkhan, B., Sarzhanov, S., Ergashev, Z., Umaraliev, R., Safarov, M., Belikov, V., Karayev, J., and Fagà, E.: A regional-scale approach to assessing non-residential building, transportation and cropland exposure in Central Asia, Nat. Hazards Earth Syst. Sci., 24, 355–373, https://doi.org/10.5194/nhess-24-355-2024, 2024b.
UNISDR: Global Assessment Report on Disaster Risk Reduction 2015, UNISDR, Geneva, Switzerland, https://doi.org/10.18356/919076d9-en, 2015.
World Bank: Measuring Seismic Risk in Kyrgyz Republic. Seismic Risk Reduction Strategy, Scientific Technical Report 240323-00, https://documents1.worldbank.org/curated/fr/689251517034023 (last access: 15 August 2023), 2017.
World Bank Group: SFRARR Central Asia, https://datacatalog.worldbank.org/search?q=sfrarr central&start=0&sort= (last access: 7 November 2024), 2024.
- Abstract
- Introduction and previous studies
- Risk assessment methodology
- Earthquake vulnerability functions and loss validation and calibration
- Results
- Discussion and conclusions
- Appendix A: Earthquake risk results at an oblast level for the five countries in Central Asia
- Data availability
- Author contributions
- Competing interests
- Disclaimer
- Special issue statement
- Acknowledgements
- Financial support
- Review statement
- References


