the Creative Commons Attribution 4.0 License.
the Creative Commons Attribution 4.0 License.
Brief communication: Monitoring impending slope failure with very high-resolution spaceborne synthetic aperture radar
Yves Bühler
Andreas Stoffel
Johan Gaume
Qiaoping Zhang
Valentyn Tolpekin
We demonstrate how high spatial and temporal resolution spaceborne synthetic aperture radar (SAR) imagery can improve slope deformation monitoring. We process ICEYE data over the Brienz/Brinzauls slope instability in the Swiss Alps, where a catastrophic failure occurred on 15 June 2023. Image correlation applied to retrieve surface velocities shows results comparable to in situ measurements. Pre- and post-failure acquisitions used to map areas invaded by debris and to compute associated volumetric changes are in good agreement with photogrammetric data. This study sets the baseline for new-generation satellite SAR data aimed at providing timely information in landslide early warning scenarios.
- Article
(5759 KB) - Full-text XML
- BibTeX
- EndNote
The availability of spaceborne synthetic aperture radar (SAR) sensors has considerably increased in recent years due to launch of numerous missions, and this is a trend that is expected to continue. This scenario offers new options for the systematic use of SAR datasets in numerous applications related to natural hazards. Thanks to the ESA Copernicus Sentinel-1 mission, slope stability analysis applications have progressively migrated from classic surveys, in the form of local- and/or regional-scale processing efforts for inventorying purposes and/or for back analyses of case studies, to systematic and operational monitoring solutions (Bianchini et al., 2021). Several limitations remain, however, especially when the surface displacements sharply accelerate and the probability of slope failure increases (Manconi, 2021). New-generation SAR missions promise to be a game changer due to the massive technological improvement introduced, reducing the cost of production and the size of satellites and sensors, thus allowing for the space missions to provide more frequent revisits (Sigmundsson et al., 2024).
In this work, we show the results of a pilot study performed during the crisis associated with the acceleration of instability of the Brienz/Brinzauls slope (hereinafter referred to as Brienz), located in the Swiss Alps, culminating in a failure on 15 June 2023, which accumulated ∼ 1.2 Mm3 of debris material very close to the village. In this case, surface velocities have increased consistently since 2013, and an early warning system based on an extensive geodetic monitoring (a combination of GNSS, robotic total station, and a permanent ground-based SAR) has been progressively developed to protect people and infrastructure. The emergency scenario in 2023 gained resonance in the media due to the successful evacuation of the population (ca. 100 people) on 13 May, i.e. ca. 1 month before the failure event. The main goal of this work is to investigate the reliability of the information provided by high spatial and temporal resolution satellite SAR, as well as their potential use in operational near-real-time monitoring and early warning contexts.
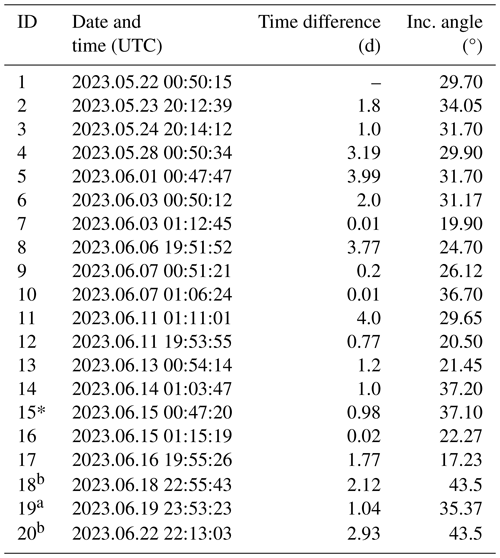
We benefit from the high-resolution SAR imagery acquired from the ICEYE constellation and the exceptional availability of independent measurements and ground observations, allowing for a thoughtful validation. ICEYE is a commercial operator offering spaceborne SAR imagery (X-Band, 9.65 GHz, wavelength 3.1 cm) acquired with different modalities (details can be found at ICEYE, 2024a). The current configuration allows for covering the Earth's surface ca. every 6 h, although imaging modes and/or the geometrical characteristics may strongly differ. For our application in Brienz, we considered the imagery acquired in spot imaging mode, vertical transmit–vertical receive polarization (VV), covering an area of 5×5 km. Among the four different views available, the ascending orbit, left-looking sensor (ASC_L), provides optimal coverage over the area of interest and minimal zones of layover and shadow (dark/black areas in Fig. 1b), as well as a total of 16 images acquired in the period before the failure event (see Table A1 and Fig. 1c, red filled triangles, average revisit time 1.6 d, minimum ca. 25 min, maximum 4 d). Incidence angles vary from ca. 17 to ca. 37° (see also Appendix Table A1). We used the GAMMA software to initially process the Single Look Complex (SLC) images, applying a multilooking of two samples in azimuth and one in range, resulting in a ground sampling distance (GSD) of ca. 0.42 m × 0.33 m in range and azimuth direction, respectively. SAR images were then aligned (co-registered) considering as a reference the acquisition on 22 May 2023 (ID1 in Table A1) and the radiometric terrain-corrected (RTC, Small et al., 2022) data that benefit from a high-resolution digital topographic surface model openly provided by Swisstopo over the entirety of Switzerland (GSD 0.50 m). The RTC removes the influence of topography on SAR backscatter and ensures an appropriate evaluation of the values and their variations over space and time.
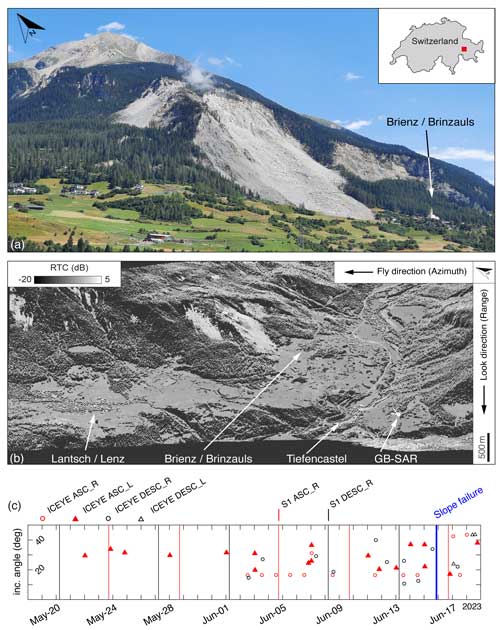
Figure 1(a) Picture of the Brienz slope acquired from the GB-SAR station (location is labelled in b) after the failure occurred on 15 June 2023. (b) Reference SAR (22 May 2023) backscattering image (in dB) after radiometric terrain correction. Some points of interest are indicated for spatial orientation. (c) Sentinel-1 and ICEYE imagery acquired over Brienz with an indication of orbit direction (ascending or descending) and sensor look direction (left or right).
Pixel offset (hereafter referred to as PO) is a well-established method to measure displacements in digital imagery. For what concerns SAR imagery, PO is an efficient alternative to radar interferometry to measure displacements when large spatial gradients occur due to landslide processes. We adapted the PO method presented in Bickel et al. (2018) by first converting the SAR backscatter in an orientation image (Dematteis and Giordan, 2021). We used a template window of 128×128 pixels, an overlap of 75 %, and an oversampling factor of 4. We computed PO in SAR coordinates (range and azimuth directions) for all possible pairs with images acquired between 22 May and 15 June 2023. Following this, we converted the results to metres, calculated the magnitude of the 2D surface displacement vectors, and finally generated velocity maps (in m d−1).
The velocity results for selected snapshots are shown in Fig. 2. The acceleration of the portion that failed on 15 June, called the Island, is clearly visible compared with the rest of slope. There, velocities increased from about 0.25 m d−1 reported on 28 May to a maximum of 0.5 m d−1 on 3 June 2023 (Fig. 2a). Thereafter, the values reached ca. 1 m d−1 on 11 June and then ramped up to maximum values of 4 m d−1 on 15 June, i.e. the day of the failure.
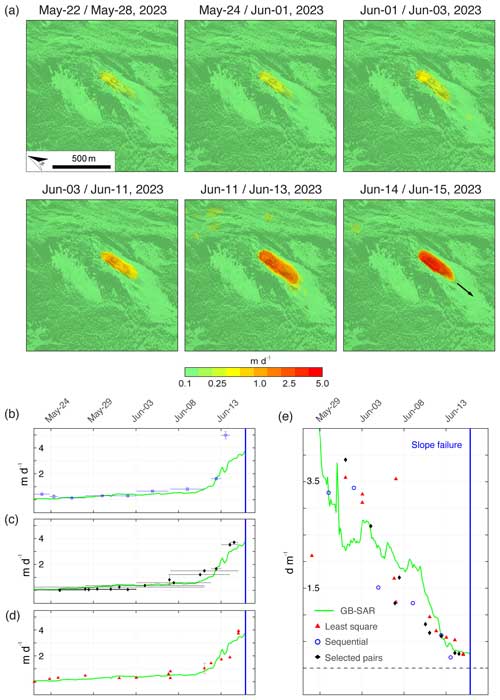
Figure 2(a) Selected results showing the 2D surface velocities over Brienz measured with pixel offset (PO) applied to the ICEYE data. Note that the colour scale is logarithmic to show the extreme differences in velocities that occurred within a few days that were a factor of 6 larger compared to the ones shown in (a). (b–d) Time series of maximum surface velocities measured with PO versus velocities recorded with GB-SAR. Horizontal bars in (b) and (c) show the time span of the images paired. Error bars, in most cases smaller than the symbol size, are related to the median PO measured in an area that is considered stable. (e) Inverse velocity plot to show the failure forecasting potential of ICEYE PO results versus GB-SAR.
We extracted the maximum PO velocities for all pairs and generated velocity time series to compare with the measurements obtained from a ground-based (GB) SAR installed in Brienz for early warning purposes and measuring every 4 min. Figure 2b shows the comparison between three different approaches to generate the time series from the PO results and the GB-SAR measurements. For all three time series approaches, we considered the statistical distribution of PO velocities obtained in a stable area of 1000×1000 pixels (i.e. 420 m × 330 m) to estimate the inaccuracies, which are in most cases below 0.1 m d−1 (see error bars in Fig. 2b). For the first time series approach, we computed PO versus the first available subsequent image (i.e. sequential) without any constraints on the view angles but considering at least 1 d of temporal baseline. The results agree with the GB-SAR time series with a RMSE of 0.06 m (see Table A2) when the last pair close to the failure time is not considered. Such deviation is caused by the large differences in incidence angle between the images (almost 15° between image ID13 and ID14, Table A1). For this reason, in the second time series approach we used all possible PO pairs with at least a 24 h temporal baseline but also constrained incidence angle differences to a maximum of 1.5°. This value was fixed after several trials and allowed for preserving enough pairs and a high signal-to-noise ratio in the PO results. The results show a very good match with the GB-SAR over the entire time series (RMSE 0.08 m), showing the high potential of ICEYE in monitoring applications in cases where acquisition parameters are nearly constant over the area of interest. Finally, as third approach we used the least-squares optimization to compute the displacement time series (Casu et al., 2011), which in this case also considered acquisitions with incidence angle differences lower than 1.5°. The results also compare well with the GB-SAR velocities (RMSE 0.01 m), with the advantage that the velocities are estimated at the dates of acquisition and not representative of an average value between the pairs, as is the case for the other two methods.
Figure 1c shows the conversion of the velocity time series into their inverse. When velocity increases exponentially, its inverse approaches progressively lower values, and the linear projection of the time series to zero is expected to provide an indication of the ultimate stages towards an impending slope failure (Fukuzono, 1985). Despite different versions and ad hoc adaptations developed over the years, the inverse velocity approach is widely used in operational scenarios to infer the time of slope failure and to manage early warning scenarios (Sharifi et al., 2024). Our results show that the inverse velocity values retrieved from PO applied to the ICEYE images and the GB-SAR time series converge comparably towards the failure occurred on 15 June 2015. This suggests that the increase in spatial and temporal resolution of spaceborne SAR datasets can provide new solutions for continuous monitoring when in situ datasets are not available and can potentially be used in operational early warning scenarios to forecast time of failure.
Optical and radar images are often used in an event's aftermath to document and characterize the slope failure in terms of area and assets affected by the failed materials and to study the runout dynamics (Guzzetti et al., 2012).
In Fig. 3a and b, we show pre- and post-event ICEYE Spot images for backscattering, which already allow us to visually identify areas affected by changes (erosion and deposition) and assets invaded by the debris materials (i.e. the cantonal road connecting Brienz to the village of Lantsch/Lenz; see Fig. 1).
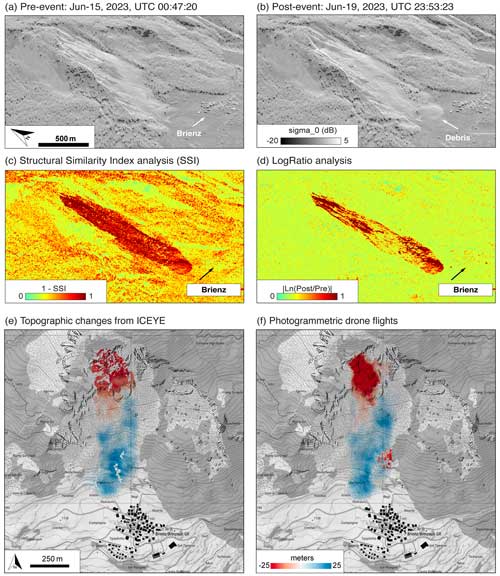
Figure 3Comparison between (a) pre- and (b) post-event ICEYE images acquired over Brienz. Panels (c) and (d) show the results of analytical change detection attempts with SSI and log-ratio methods, respectively. Comparison between (e) ICEYE interferometry and (f) a digital surface model of difference (DoD) generated from photogrammetric drone flights. Note that the negative height difference in (f) in the lower part above the village indicates where trees were cut down by the landslides. The base maps in (e) and (f) are from © swisstopo.
Change detection computation, such as the structural similarity index (SSI; Wang et al., 2004) or the log ratio (Mondini, 2017) applied to the backscattering (shown Fig. 3c and d, respectively) can be used efficiently to map landslide boundaries and highlight important features associated with the failure dynamic by benefitting from the high spatial resolution. However, change detection provides only a two-dimensional view of the event characteristics. To estimate the volume of the failed material, photogrammetric approaches based on spaceborne or airborne optical imagery, as well as terrestrial and airborne lidar, are generally used due to their flexibility and high-resolution results for the reconstruction of surface topography. Spaceborne SAR can be also used for identification of topographic changes, provided that SAR scenes are acquired with the same orbit and view angles and that perpendicular baselines (i.e. orbit separation) between images acquired before and after the event remain within critical values for the determination of heights with interferometry (Bürgmann et al., 2000). Among the datasets we considered, two ICEYE images acquired after the 15 June event in Brienz (i.e. on 18 and 22 June 2023, ascending orbit, right-looking sensor) have the same view angle and a spatial baseline of 931 m, resulting in a height of ambiguity of 7.6 m. The differences between the topography before the failure event and the digital surface models obtained with radar interferometry (InSAR) are shown in Fig. 4a. For validation, we compare the InSAR results with a digital model of difference (DoD) obtained after photogrammetric drone flights before (8 June 2023) and right after (16 June 2023) the event (Fig. 4b). The georeferencing accuracy achieved with post-processing kinematic (PPK) methods is in the range of 0.1 m. The spatial distribution of the negative (erosion) and positive changes (deposition) due to the slope failure are comparable. The 95th percentile of the height differences between InSAR and photogrammetric measurements is on the order of 16 m, with local peaks up to 50 m. This leads to the estimated negative volumes from InSAR being −0.79 Mm3 versus −1.24 Mm3 from photogrammetry, i.e. a difference of about 40 %. Deviations in the source area are most likely due to phase unwrapping errors (a procedure used to convert the phase differences retrieved with InSAR into a metric scale) associated with the presence of steep slopes and decorrelation due to large phase gradients. Other sources of inaccuracy are atmospheric disturbances and surface changes (minor slope failures) that occurred in the upper ranges of the slope after the main event. On the other end, deposited volumes from InSAR are +1.18 Mm3, very similar to the +1.28 Mm3 estimated from photogrammetry, with only a 10 % difference.
Reliable warning systems with high temporal and spatial resolution are the key to prevent life and asset loss caused by slope failure. In Brienz, an exceptional in situ network allowed for the recognition in due time of the evolution towards a potential catastrophic failure, supporting the decision of local authorities to evacuate the population and restricting access to areas and infrastructures at risk. However, such an extensive monitoring system is not replicable in all mountain areas where it would be needed, mainly due to logistical/access reasoning and/or financial matters. Satellite data, available in all weather conditions with sub-metric spatial resolutions and sub-daily revisit, can be a viable alternative to manage slope instability operational scenarios. As demonstrated in this work, the results obtained from high-resolution SAR images are comparable with the ground-based monitoring data and could also be used for near-real-time forecasting of time of failure with similar outcomes. In addition, the increase in spatial and temporal resolution allows for prompt and accurate post-event mapping of the slope failure and could support the determination of event magnitudes (volumes) via InSAR. Intrinsic limitations due to the combination of satellite viewing geometries and slope orientation might still hinder the use of such an approach at high elevations. Moreover, in some cases the unavailability of recent, high-resolution topographic models might affect the accuracy of geocoding and decrease the quality of the results. Despite these concerns, we have shown that the very high spatial resolution also allows for working efficiently using SAR coordinates, as the targets of interest and changes can be clearly identified. Our results provide a step towards the use of satellite SAR imagery for operational scenarios, bringing new insights into the use of satellite SARs to monitor and potentially forecast imminent slope failure in operational early warning scenarios. Accurate information that is provided in timely fashion by SAR satellites during the day and night and in all weather conditions can be used in data-driven forecast methods via the inverse velocity approach shown here, for the calibration of more sophisticated numerical models aimed at the evaluation of slope stability, and/or to simulate runout scenarios (Bartelt et al., 2018; Gaume et al., 2024).
Table A1List of ICEYE imagery (mode SPOT, ascending orbit, left-looking sensor, VV polarization), date and time of acquisition (format: yyyy.mm.dd hh:mm:ss), relative temporal baselines (in d), and incidence angles. a Images used for detecting change between pre- and post- slope failure, selected due to the similarity of the incidence angle (see Fig. 3). b Images used for the estimation of topographic changes with radar interferometry (see Fig. 4).
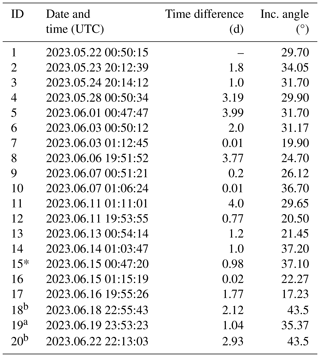
Table A2Summary table of the differences between the surface velocity time series measured before Brienz failure with GB-SAR and the PO time series obtained from ICEYE. Residuals are computed by resampling the GB-SAR time series on the time vector of the specific PO time series. A negative sign in the residual means that PO overestimates GB-SAR velocities. “Sequential*” represents the results without considering the last sample, which is a clear outlier caused by major difference in incidence angles in the last pair.
The raw ICEYE Spot images used in this study can be downloaded from the ICEYE archive (https://www.iceye.com/lp/iceye-18000-public-archive, ICEYE, 2024b). The GAMMA software used for the processing of the SAR images is available at https://www.gamma-rs.ch/software (Gamma Remote Sensing, 2024). The PO algorithm applied in this work is presented in Bickel et al. (2018). The digital height models for pre-failure were retrieved from https://www.swisstopo.admin.ch/en/height-model-swisssurface3d (Federal Office of Topography swisstopo, 2024).
AM conceived the study, processed the ICEYE imagery to generate the PO time series and the change detection analyses, produced the graphics, and wrote the manuscript. YB and AS acquired and processed the photogrammetric drone imagery to compute the volumetric changes shown in Fig. 3, and revised the manuscript. JG provided funding resources for the acquisition of the ICEYE images and revised the manuscript. VT and QZ supported the acquisition of the ICEYE images, derived the InSAR results, and revised the manuscript.
At least one of the (co-)authors is a member of the editorial board of Natural Hazards and Earth System Sciences. The peer-review process was guided by an independent editor, and the authors also have no other competing interests to declare.
Publisher’s note: Copernicus Publications remains neutral with regard to jurisdictional claims made in the text, published maps, institutional affiliations, or any other geographical representation in this paper. While Copernicus Publications makes every effort to include appropriate place names, the final responsibility lies with the authors.
We thank Melanie Rankl and Michael Wollersheim from ICEYE Oy for supporting the data acquisition and for fruitful discussions about the results. Two anonymous reviewers provided insightful comments that helped in improving the manuscript.
This paper was edited by Daniele Giordan and reviewed by two anonymous referees.
Bartelt, P., Christen, M., Bühler, Y., and Buser, O.: Thermomechanical modelling of rock avalanches with debris, ice and snow entrainment, in: Numerical Methods in Geotechnical Engineering IX, Volume 2, CRC Press, ISBN 9781138332034, 2018.
Bianchini, S., Solari, L., Bertolo, D., Thuegaz, P., and Catani, F.: Integration of Satellite Interferometric Data in Civil Protection Strategies for Landslide Studies at a Regional Scale, Remote Sensing, 13, 1881, https://doi.org/10.3390/rs13101881, 2021.
Bickel, V. T., Manconi, A., and Amann, F.: Quantitative Assessment of Digital Image Correlation Methods to Detect and Monitor Surface Displacements of Large Slope Instabilities, Remote Sensing, 10, 865, https://doi.org/10.3390/rs10060865, 2018.
Bürgmann, R., Rosen, P. A., and Fielding, E. J.: Synthetic aperture radar interferometry to measure Earth's surface topography and its deformation, Annual Rev. Earth Pl. Sc., 28, 169–209, 2000.
Casu, F., Manconi, A., Pepe, A., and Lanari, R.: Deformation Time-Series Generation in Areas Characterized by Large Displacement Dynamics: The SAR Amplitude Pixel-Offset SBAS Technique, IEEE T. Geosci. Remote, 49, 2752–2763, https://doi.org/10.1109/TGRS.2010.2104325, 2011.
Dematteis, N. and Giordan, D.: Comparison of Digital Image Correlation Methods and the Impact of Noise in Geoscience Applications, Remote Sensing, 13, 327, https://doi.org/10.3390/rs13020327, 2021.
Fukuzono, T.: A new method for predicting the failure time of a slope, in: Proceedings of 4th international conference and field workshop on landslides, Tokyo, 145–150, 1985.
Gamma Remote Sensing: The GAMMA Software, https://www.gamma-rs.ch/software, last access: 30 October 2024.
Gaume, J., Kenner, R., Bühler, Y., Stoffel, A., Vicari, H., Kyburz, M., Cicoira, A., and Blatny, L.: Blind prediction of the Brienz rock avalanche runout using a 3D Material Point Method, in Proceedings of Intrapraevent, Vienna, 2024, https://www.interpraevent.at/en/proceeding/proceedings-ip-2024 (last access: 30 October 2024), 2024.
Guzzetti, F., Mondini, A. C., Cardinali, M., Fiorucci, F., Santangelo, M., and Chang, K.-T.: Landslide inventory maps: New tools for an old problem, Earth-Sci. Rev., 112, 42–66, https://doi.org/10.1016/j.earscirev.2012.02.001, 2012.
ICEYE: Imaging modes | SAR data | ICEYE, https://www.iceye.com/sar-data/imaging-modes, last access: 3 April 2024a.
ICEYE: ICEYE data catalogue, https://www.iceye.com/lp/iceye-18000-public-archive, last access: 30 October 2024b.
Manconi, A.: How phase aliasing limits systematic space-borne DInSAR monitoring and failure forecast of alpine landslides, Eng. Geol., 287, 106094, https://doi.org/10.1016/j.enggeo.2021.106094, 2021.
Mondini, A. C.: Measures of Spatial Autocorrelation Changes in Multitemporal SAR Images for Event Landslides Detection, Remote Sensing, 9, 554, https://doi.org/10.3390/rs9060554, 2017.
Sharifi, S., Macciotta, R., and Hendry, M. T.: Critical assessment of landslide failure forecasting methods with case histories: a comparative study of INV, MINV, SLO, and VOA, Landslides, 21, 1629–1643, https://doi.org/10.1007/s10346-024-02237-5, 2024.
Sigmundsson, F., Parks, M., Geirsson, H., Hooper, A., Drouin, V., Vogfjörd, K. S., Ófeigsson, B. G., Greiner, S. H. M., Yang, Y., Lanzi, C., De Pascale, G. P., Jónsdóttir, K., Hreinsdóttir, S., Tolpekin, V., Friðriksdóttir, H. M., Einarsson, P., and Barsotti, S.: Fracturing and tectonic stress drive ultrarapid magma flow into dikes, Science, 383, 1228–1235, https://doi.org/10.1126/science.adn2838, 2024.
Small, D., Rohner, C., Miranda, N., Rüetschi, M., and Schaepman, M. E.: Wide-Area Analysis-Ready Radar Backscatter Composites, IEEE Transactions on Geoscience and Remote Sensing, 60, 1–14, https://doi.org/10.1109/TGRS.2021.3055562, 2022.
Federal Office of Topography swisstopo: swissSURFACE3D, https://www.swisstopo.admin.ch/en/height-model-swisssurface3d, last access: 3 April 2024.
Wang, Z., Bovik, A. C., Sheikh, H. R., and Simoncelli, E. P.: Image quality assessment: from error visibility to structural similarity, IEEE T. Image Process., 13, 600–612, https://doi.org/10.1109/TIP.2003.819861, 2004.
- Abstract
- Introduction
- Dataset
- Pre-event: measuring accelerated slope deformation
- Post-event: slope failure documentation and volume estimation
- Conclusions and outlook
- Appendix A
- Code and data availability
- Author contributions
- Competing interests
- Disclaimer
- Acknowledgements
- Review statement
- References


