the Creative Commons Attribution 4.0 License.
the Creative Commons Attribution 4.0 License.
Inundation and evacuation of shoreline populations during landslide-triggered tsunamis: an integrated numerical and statistical hazard assessment
Emmie Malika Bonilauri
Catherine Aaron
Matteo Cerminara
Raphaël Paris
Tomaso Esposti Ongaro
Benedetta Calusi
Domenico Mangione
Andrew John Lang Harris
The volcanic island of Stromboli (southern Tyrrhenian Sea, Italy) is renowned for its persistent, periodic, low-intensity explosive activity, whose spectacular manifestations attract tens of thousands of tourists every year. However, sporadic more intense major explosive and effusive eruptions and paroxysms pose serious threats to the island. In addition to direct hazards, granular slides of volcanic debris and pyroclastic avalanches, which can rapidly reach the sea and potentially generate tsunamis, are often associated with such unpredictable eruptive activity. Due to the very fast propagation of the tsunami around the island and the consequent short tsunami warning time (ranging from less than a minute to only a few minutes), mitigation efforts and evacuation from the Strombolian coast must be carefully planned. In this paper, we describe a new GIS-assisted procedure that allows us to combine the outputs of an ensemble of 156 pre-computed landslide-generated tsunami hazard scenarios (with variable landslide volume, position, and density), statistical exposure data (i.e. the number of inhabitants and tourists), and digital geographic information to obtain a quantitative (scenario-based) risk analysis. By means of the analysis of the road network and coastal morphology, we develop a model with routes and times to reach a safe area from every pixel in the inundated area and an appraisal of the time needed to escape versus the wave arrival time. This allows us to evaluate and quantify the effectiveness of potential risk mitigation by means of evacuation. The creation of an impact score linking the predicted inundation extent and the tsunami warning signals is intended, in the long term, to be used to predict the intensity of future tsunamis and to adapt evacuation plans accordingly. The model, here applied to Stromboli, is general and can be applied to other volcanic islands. Evacuating an island hosting several thousand tourists every summer with very little warning time underlines the absolute necessity for such mitigation efforts, aimed at informing hazard planners and managers and all other stakeholders.
- Article
(16569 KB) - Full-text XML
- BibTeX
- EndNote
NOAA's NCEI (National Centers for Environmental Information) estimates that about 81 % of recorded tsunamis originate from earthquakes, with 7 % originating from landslides and 5% from volcanoes, the remaining 5 % being from unknown sources (NCEI, 2023; Harbitz et al., 2014). Landslide-generated tsunamis vary greatly in their size and origin, with volcano flank collapse being a frequent source. The range of volumes and the position of the collapse on the volcano flank produce great variation in terms of coastal impact (Grezio et al., 2017). Large-volume collapse of the flank of a volcano island can, for example, generate local tsunamis with waves tens of metres high in proximal fields (Paris et al., 2018). However, tsunamis caused by volcanic landslides are characterised by shorter wavelengths compared to earthquake-induced tsunamis (Grezio et al., 2017), and consequently their far-field effect is often considerably reduced compared to their proximal impact, as observed, for example, during the 2018 Anak Krakatau tsunami (Muhari et al., 2019). However, even a 1 m high tsunami inundating a beach can present a high risk to populated coastlines and tourist seaside resorts.
At Stromboli, an active volcano of the Aeolian Islands (southern Tyrrhenian Sea, Italy; Rosi et al., 2000, 2013), tsunamis can be potentially generated by instability and collapse of volcano flanks (in particular, the steep north-western slope of the Sciara del Fuoco) or by pyroclastic currents generated by paroxysmal eruptions (Pistolesi et al., 2020; Giordano and De Astis, 2020). One example of a tsunami generated by a landslide is that of Stromboli in December 2002. In that case, two landslides generated two tsunamis 7 min apart with maximum run-up of 10.9 m (Tinti et al., 2006a). The first tsunami was due to a nearshore submarine landslide, probably involving up to 20×106 m3 of material (Chiocci et al., 2003), and the second to a subaerial landslide of 4×10⁶–9×10⁶ m3 that broke off at about 500 m a.s.l. (Tinti et al., 2006b). The resulting tsunami caused significant damage along the island coast up to an elevation of about 10 m a.s.l. (Tinti et al., 2006a; Fornaciai et al., 2022), as well as at the island of Panarea 21 km distant (Maramai et al., 2005a).
The risk associated with tsunamis is particularly high on Stromboli due to the high density of population on the coasts, where travel time for the tsunami from the source is minutes (Bonilauri et al., 2021). This is enhanced at Stromboli, where, with the development of global tourism, vacation rentals, restaurants, shops, and hotels have been built close to the beaches. With the development of tourism and influx of seasonal workers, the collective memory linked to the tsunami risk also becomes reduced (Tulius, 2020; Riskianingrum and Yogaswara, 2022).
For these reasons, after the 2002 events, the scientific community and the Italian Civil Protection Department undertook a series of initiatives aimed at quantifying the hazards associated with landslide-generated tsunamis, providing an early-detection and alert system to mitigate the associated risks. In particular, the Laboratorio di Geofisica Sperimentale (LGS) of the University of Florence installed two tsunami detection beacons: the first in 2008 south-west of the foot of the Sciara del Fuoco and the second in 2017 in the north-east (Selva et al., 2021). To be able to generate an automatic alert and warn the relevant authorities and the population as quickly as possible, they have developed a tsunami detection algorithm by studying the STA LTA (short-time average over long-time average) ratio and the dispersion of surface waves (Lacanna and Ripepe, 2020; Selva et al., 2021). They were able to test the algorithm successfully during the two paroxysms in July and August 2019 (Lacanna and Ripepe, 2020; Selva et al., 2021) and during the avalanche caused by the partial collapse of the NE crater on 4 December 2022.
In parallel, a systematic study has been carried out to define tsunami hazard scenarios based on several complementary approaches. The first is the identification of past events in the sedimentological record (tsunami deposits) and historical archives in order to build a tsunami catalogue (Maramai et al., 2014; Pistolesi et al., 2020). The second is based on the interpretation of observations and instrumental data (Bonaccorso et al., 2003; Pino et al., 2004; Boldini et al., 2005; Calvari et al., 2005; Maramai et al., 2005a, b; Tinti et al., 2005, 2006a, b; Tommasi et al., 2005; Acocella et al., 2006; Chiocci et al., 2008a, b; Fornaciai et al., 2022). The third comprises model-based scenarios through data-driven simulations (Fornaciai et al., 2019; Bonilauri et al., 2021; Esposti Ongaro et al., 2021; Cerminara et al., 2024).
Finally, a series of initiatives have been carried out to enhance awareness of the tsunami risk and to enforce mitigation actions aimed at the timely evacuation of the risk zones in case of tsunami via the “Io non rischio” awareness campaign (https://www.iononrischio.gov.it/en/get-ready/volcanoes/stromboli/what-do/, last access: 8 January 2024) and via several work tasks as part of Task 4.3, which is an ongoing task of the Italian Civil Protection Department–Istituto Nazionale di Geofisica e Vulcanologia (DPC–INGV) 2022–2024 agreement for the implementation of the service activities: “Survey on risk perception of explosive paroxysms and tsunamis to better define a communication strategy and informative materials”.
In this paper, we describe a new procedure that allows us to combine the outputs of an ensemble of pre-computed tsunami hazard scenarios and exposure data and digital geographic information to obtain a quantitative (scenario-based) risk analysis and to quantify the effectiveness of potential risk mitigation by means of evacuation. In our procedure, the tsunami hazard is represented by a set of (static, georeferenced raster) maps of inundation (maximum wave height above ground) and wave arrival times, one for every individual scenario produced by numerical simulations. Every tsunami scenario is in turn defined, in a deterministic approach, by a corresponding landslide scenario, and it is associated with a trigger time (which approximately corresponds to the initial time at which an alert is issued). For every scenario, we are able to calculate an “impact score”, which classifies in a simple and intuitive way the scenarios in terms of their impact on the island shores. For exposure, we consider the population distribution on the island and the geometry of the road network, with which we can compute escape times from any pixel of the map towards a refuge area entry point (RAEP). By convolving hazard and exposure maps, we are then able to obtain maps expressing the level of risk of the different areas along the Stromboli shores in terms of the potential impact of a given scenario and potential mitigation in terms of evacuation capacity.
The procedure here applied to the island of Stromboli is a general one, and we discuss in the following sections its main components, assumptions, and criticalities.
2.1 Tsunami hazard scenarios
In this paper, we base our analysis on tsunami scenarios produced by numerical simulations with a coupled landslide–water multilayer, non-hydrostatic shallow-water model (Esposti Ongaro et al., 2021; Cerminara et al., 2024). The landslide is considered a granular fluid, having a given initial volume, position, and density, which is dynamically two-way-coupled with the water layers. The Multilayer Hyperbolic Systems and Efficient Algorithms (Multilayer-HySEA) numerical model (Fernández-Nieto et al., 2018; Macías et al., 2021a, b) adopted to generated the scenarios is particularly suited to the case of a volcanic island, since typical landslide-generated tsunamis have short wavelengths and develop over steep topo-bathymetry, making the usual hydrostatic approximation fail.
Simulations using Multilayer-HySEA were performed using 10 different initial landslide positions (positions 1 to 10, Fig. 1), five different volumes (5×10⁶, 8×10⁶, 14×106, 21×106, and 30×106 m3) and three different densities (2.5, 2.0, and 1.7 kg m−3 or water–landslide density contrasts of 0.4, 0.5, and 0.6, respectively), based on the ranges hypothesised for the 2002 tsunami event at Stromboli (Fornaciai et al., 2019; Esposti Ongaro et al., 2021; Cerminara et al., 2024). Additional simulations from a higher subaerial position (position 0, Fig. 1) were run with two different volumes for a total of 156 simulations analysed. For each simulation, we consider (1) the coastal inundation (i.e. the estimated inundation depth for each onshore pixel), (2) the tsunami arrival time for each pixel in the inundated area, and (3) the offshore water surface elevation.
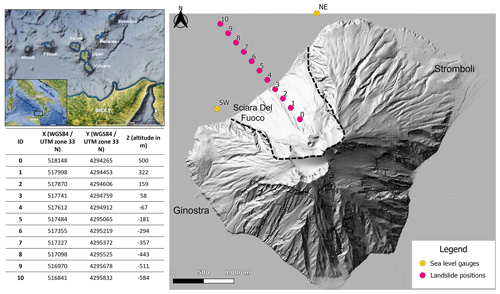
Figure 1Location of the island of Stromboli and landslide position numbers simulated by the INGV of Pisa with their respective coordinates and altitudes and position number 0 corresponding to December 2002 characteristics. The authors made maps using Quantum GIS version 3.16.7 software (2021). Image data © 2021 Google Earth: SIO, NOAA, US Navy, NGA, GEBCO.
For each simulation, we also define an onset time T0, when the landslide starts; a final time T600, when the simulation is stopped; and “trigger time” Tg, when the generated wave overcomes a given threshold at one of the two gauges offshore the Sciara del Fuoco. These are located on the position of the actual beacons, installed close to Punta Labronzo (north-east beacon, BNE) and Punta dei Corvi (south-west beacon, BSW). In this work, we decided to adopt a threshold of +0.3 or −0.3 m for the wave detection at the gauges, to analyse only “significant” scenarios in terms of impact. The choice of such a threshold was made on a subjective basis and might be the object of further analysis in the future.
The trigger time Tg should be approximatively equivalent to the time at which the alert is issued, following the procedure described by Selva et al. (2021) and Lacanna and Ripepe (2020). Finally, the wave arrival time at a given pixel is computed as the difference between the actual tsunami arrival time and the trigger time Tg.
All simulation and post-processed data were integrated in QGIS (Quantum GIS) 3.16.7 with GRASS (Geographic Resources Analysis Support System) version 7.8.5. Topography was represented by a digital elevation model (DEM) of 31 635 pixels (20 m by 20 m) from the lidar (light detection and ranging) campaign carried out in July 2010 by the INGV, and bathymetry was from the Marine Geohazards along the Italian Coasts (MaGIC) project (for more details, see Favalli et al., 2009; Chiocci and Ridente, 2011; and Fornaciai et al., 2019).
2.2 Inundation impact score and link with the proximal wave height
For each landslide and tsunami scenario, we define an impact score S, equal to the number of on-land pixels (in the digital model) that are inundated at a given time during the numerical simulation (we might also consider our impact score in terms of inundated area in m2). The impact score allows us to classify the landslide–tsunami scenarios based on their coastal hazard and to link such a hazard to the features of the tsunami at the proximal gauge. In particular, we have used several statistical methods to try to establish a robust link between the impact score and the maximum wave height at the proximal gauge, which is, in principle, a measurable quantity. The classic method for this type of problem (that is, to find an unknown value from several knowns) is linear regression. This approach, however, lacks robustness when the number of explanatory variables (here, 40) is too large compared with the number of individuals (here, the 156 simulations). LASSO linear regression is thus a modification of traditional linear regression that identifies a subset of explanatory variables (in this case, times of interest for measuring wave heights) of sufficiently small size for the results to be robust.
In a real case, the volume, density, or position of the landslide is not immediately known; thus we only have the signals of the two gauges. As a result, the aim of LASSO is to find out whether there is any chance of detecting the impact of tsunamis on coastlines both quickly and accurately (without counterproductive false alarms) before the tsunami arrives and without knowledge of the landslide characteristics. We thus determine how we can use simulated wave signals to correctly determine the impact score. To set the impact score, we used the signals from the two beacons, i.e. 40 variables (one wave height every 2 s between 0 and 40 s for two beacons). The statistical procedure is described in detail in Appendix A.
2.3 Pedestrian horizontal evacuation model
For every simulated scenario, we applied an evacuation model to each inundated pixel using the approach of Bonilauri et al. (2021). This is a macroscopic model, i.e. a model for global evacuation and not an agent-based approach, which determines the fastest pedestrian evacuation paths from a danger point to a safe point and compares the escape time with the wave arrival time.
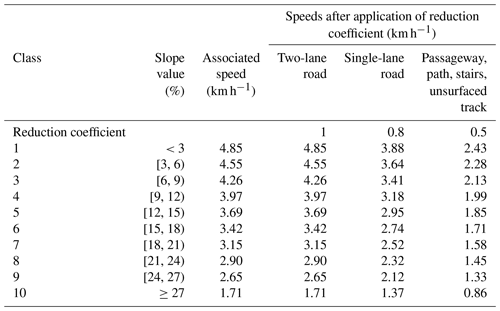
To apply the evacuation model, a grid with the same mesh size as the inundation model (20 m) was created for the village of Stromboli (Fig. 2), and a centroid, i.e. an evacuation starting point, was placed centrally in each pixel. A speed reduction coefficient was assigned to each road segment according to its width, slope, and surface type (Table 1). For each tsunami simulation, the quickest escape routes were projected from each inundated centroid, and times required to evacuate each inundated pixel were calculated, with evacuation time being the time needed to move from the inundated pixel to a “safe” zone defined by the limit of the area impacted by the tsunami.
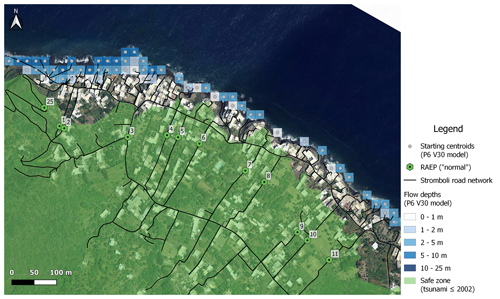
Figure 2Establishment of baseline data: starting centroids for the numerical simulation of a 30×106 m3 tsunamigenic landslide that detached from position number 6 (294 m b.s.l.) with a density of volcanic materials of 2.5 kg m−3 and the Stromboli road network and refuge area entry points used to run evacuation models. The map was produced by the authors using Quantum GIS version 3.16.7 software (2021). Image data © 2014 LGS.
Table 1Pedestrian evacuation speeds depending on land slope and road types (Péroche, 2016; Bonilauri et al., 2021).
To reach the safe zone, evacuees must pass through a refuge area entry point (RAEP). Two categories of RAEP were established:
-
A normal-event RAEP was assigned for tsunamis with run-ups less than or approximately equal to the run-up of the December 2002 event; i.e. the RAEP was placed at the intersection between the road network and 15 m contour line.
-
An extreme-event RAEP was set for tsunamis greater than the December 2002 run-up and placed at the intersection between the road network and 35–40 m contour line.
For each inundated pixel, the difference between the time needed for escape and the wave travel time to the pixel was calculated. In particular, we used two source-to-pixel travel times. Firstly, we used T0, i.e. the onset time of the landslide trigger, and then Tg, the time of the first detection of the generated tsunami at one of the two beacons. It is worth highlighting that the use of T0 gives a longer escape time, but using Tg is more realistic given the current beacon-based alert system.
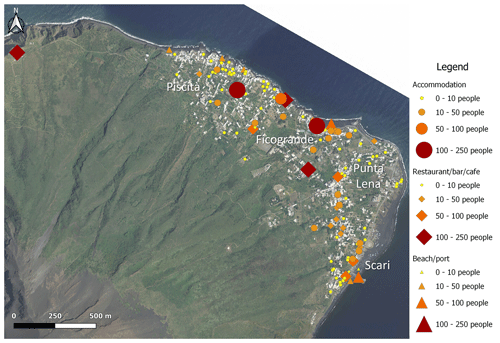
Figure 3Spatial distribution of population on the island of Stromboli based on Internet public data (accommodation, restaurant–bar–cafe, and beach–port). The authors produced maps using Quantum GIS version 3.16.7 software (2021). Image data © 2014 LGS.
Finally, a spatial-population-distribution layer (Fig. 3) was created using publicly available data, allowing the creation of three categories of population:
-
The first category is populations in accommodation, i.e. those people resident in holiday rentals, hotels, and bed and breakfast (B&B) locations. We generally used websites associated with any given establishment, and other websites such as Booking.com were used if no direct booking website was available. Capacities for all active establishments were thus taken from as individual rental/hotel/B&B websites and, if unavailable, from Booking.com, Airbnb, Tripadvisor, Vrbo, Abritel, https://www.gites.fr/ (last access: 12 October 2023), or https://www.cybevasion.fr/ (last access: 12 October 2023).
-
The second category is populations using restaurants, bars, and cafes, with capacities assessed from Tripadvisor and Google Images.
-
The third category is pedestrian traffic in and out of the port and visitors to beaches. This was assessed from our own pictures and head counts made during surveys in September 2022 and in June and September 2023.
For locations where information was not available, we averaged the available capacity of the holiday rentals found and used a density of one person per 12.3 m2. We then determined occupation scenarios by season and time of day. This distinguished between winter, when only the permanent population (≤150) is present, and the summer tourist season, when as many as 5000 visitors can be on the island. It also distinguished between morning, midday, afternoon, evening, and night, between which the distribution of workers and tourists across accommodation, restaurants–bars–cafes, and beaches–the port varies.
Combining the vulnerability determined from these surveys with the hazard output for each of the 156 tsunami simulations provided the number of pixels inundated and, for each inundated pixel,
-
wave arrival time (Tarrive), where Tarrive is the moment when the generated tsunami has reached a pixel and inundation begins to be detected (1 cm threshold). Tarrive being calculated from Tg;
-
inundation depth (i.e. water thickness above ground level);
-
evacuation time (Tevac), where Tevac is the moment when evacuees reach a refuge area entry points (RAEPs);
-
“evacuability” (Tarrive−Tevac);
-
the number of people in need of evacuation.
We statistically convolved these metrics to allow a full and robust scenario-based risk assessment, which includes generation of the probability of inundation and an impact score.
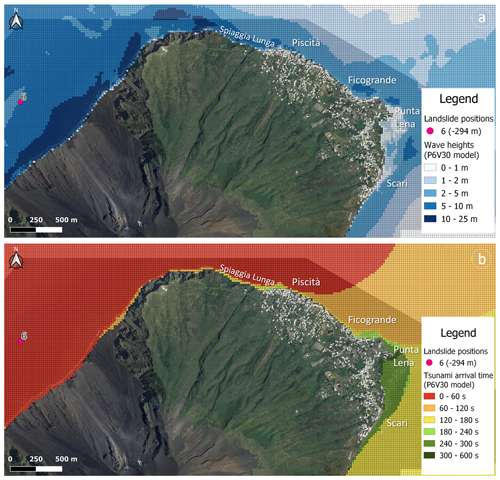
Figure 4Example of a numerical simulation for a 30×106 m3 tsunamigenic landslide that detached from position number 6 (294 m b.s.l.) with a density of volcanic materials of 2.5 kg m−3. (a) Sea level variation around the island of Stromboli due to the propagation of the tsunami wave. (b) Time of travel of the tsunami wave around Stromboli. The authors produced maps using Quantum GIS version 3.16.7 software (2021). Image data © 2014 LGS.
3.1 Analysis of individual scenarios: arrival time and coastal impact
The simulation outputs range from tsunamis of just 0.22 m in amplitude, with run-ups of 0.29 m and impacting only some parts of the beaches, to tsunamis with amplitudes of 48.1 m and run-ups of 24.2 m that inundate almost the entire village (Cerminara et al., 2024). For means of demonstration, we take a mid-range example that falls between these two extremes, this being scenario P6V30CD0.4. This scenario was selected as being slightly larger than the event of 2002 but within the same order of magnitude, as we have already conducted a detailed analysis of the 2002 events (Bonilauri et al., 2021). Scenario P6V30CD0.4 involves the simulation of a submarine landslide involving 30×106 m3 of volcanic material with a density of 2.5 kg m−3 from position number 6 (centred at 294 m b.s.l.). Fornaciai et al. (2019) compared the model output with the extent of inundation and run-up recorded following the 2002 tsunamis and showed that the model favours subaqueous landslide volumes of 15×106–20×106 m3 and/or a subaerial landslide of 4×10⁶–6×10⁶ m3 on the Sciara del Fuoco. The P6V30CD0.4 scenario used here as the example thus produces a slightly larger tsunami, with a 12.5 m maximum run-up at Spiaggia Lunga, whereas a 10.9 m run-up for the 2002 events was measured by Tinti et al. (2006a). Such a scenario is likely to occur and could be mitigated for, unlike doomsday end-member scenarios.
The generated tsunami inundates an area of 544 pixels, i.e. a surface of approximately 217 600 m2, with the wave trapped around the entire island (Fig. 4a). Refraction of the wave causes some variation in tsunami travel times over short distances, where arrival times (computed using the trigger time T0 as an initial time) vary from 48 s at Spiaggia Lunga (north of Piscità) to 154 s at Ficogrande and to 188 and 242 s at Punta Lena and the port at Scari, respectively (Fig. 4b). These four vulnerable sites are about 2.4, 3.5, 4.1, and 4.9 km distant, respectively, from the Sciara del Fuoco. The arrival times computed using the landslide onset time T0 as an initial time are 20 s longer.
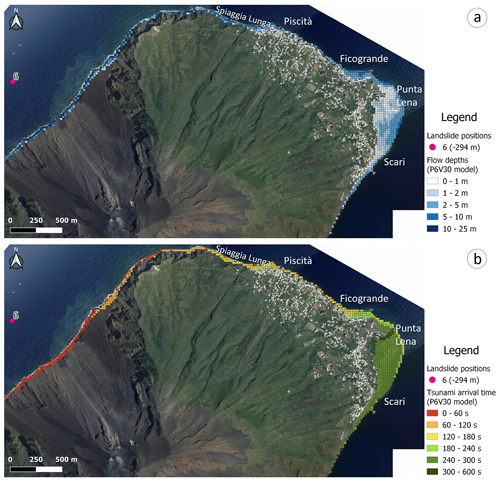
Figure 5Example of a numerical simulation for a 30×106 m3 tsunamigenic landslide that detached from position 6 (294 m b.s.l.) with a density of volcanic materials of 2.5 kg m−3. (a) Extent of inundation zone and flow depths. (b) Arrival time of the landslide-induced tsunami on Stromboli coasts. The authors produced the maps using Quantum GIS version 3.16.7 software (2021). Image data © 2014 LGS.
The coastal inundation simulation for scenario P6V30CD0.4, i.e. the maximum height above ground of water reached by the tsunami in each inundated pixel, is represented in Fig. 5a. Inundation depths are highly variable due to the topography of the village, which is underlain by around 11 lava flow fields that erupted from eccentric vents just above the village between 15 and 2 ka (Calvari et al., 2011; Speranza et al., 2008). To the north of the village, while the Spiaggia Lunga is well-exposed, the 20–30 m high sea cliffs behind it protect the road and buildings from inundation. The same is true for Piscità, the first district of Stromboli to be reached by the tsunami, which is protected due to its location on the San Bartolo lava flow field. The same presence of the lava flow field along a coastal length of 1 km means that 10 m high cliffs protect the population as far as Ficogrande. In contrast, Ficogrande is a bay located at the SE edge of the San Bartolo lava flow field, which focuses the tsunami wave and produces an increase in run-up behind the bay. To the SE of Ficogrande, another 0.2 km stretch of coast is protected by the 15 m high sea cliffs associated with the San Vincenzo lava flow field. However, beyond this in the southern part of Punta Lena and the northern part of Scari, the relatively flat coastal topography for an area extending up to 150–200 m inland results in an increase in the extent of inundation. Refraction of the tsunami wave around the island produces a decrease in the wave height to the south, causing low levels of inundation south of Scari.
The peculiar behaviour of wave propagation around the island impacts the arrival times of tsunamis too. This is particularly true on the low promontory of Punta Lena. Here we observe a narrow, in-land, extending band of pixels on the north side of the promontory with an arrival time of 300–600 s, while pixels immediately to the south have an arrival time of between 120 and 300 s (Fig. 5b).
3.2 Impact score
Figure 6 shows the impact score function of landslide position and volume. After no change in the score between positions 0 and 3, the impact score systematically decreases as a function of landslide position between locations 4 and 10 (Fig. 6a). The level of impact increases with volume but with each curve having a similar shape. Subaerial positions (i.e. position numbers 0–3, Fig. 1) have higher impact levels but with little dependence on altitude. In the case of submarine positions (i.e. position numbers 4–10, Fig. 1), the impact decreases with depth (below sea level) of the landslide source. For all positions there is a positive, and broadly linear, relation impact and volume (Fig. 6b). In the case of the subaerial positions, position 3, which is closest to sea level (Fig. 1), shows a slightly higher impact score than the higher-elevation subaerial positions 0, 1, and 2. This effect is related to the fact that the sliding volume of volcanic material has not had time to deform before reaching the sea surface, so its entry is more focused.
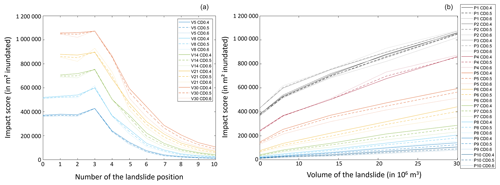
Figure 6Evolution of the impact score as a function of (a) the position for each volume of volcanic material landslide in the Sciara del Fuoco and (b) the volume for each landslide position (position 0 to position 3: subaerial landslide; position 4 to position 10: submarine landslide). The authors produced graphs using MATLAB version 2019b.
3.3 Analysis of the signals at virtual gauges and link with the impact score
The purpose of LASSO is to find the impact score based on the beacon data (without having to analyse the shape of the waves or the volume of the slip from the signal). Our LASSO method is robust in terms of its ability to adapt to landslides with volumes of between 5×10⁶ and 30×106 m3, densities of between 1.7 and 2.5 kg m−3, and landslide source positions of between 500 and −584 m. That is, it is robust within the limits of our simulations. For our simulated beacon signals, we work with landslide models whose smallest volume is 5×10⁶ m3. We are thus not considering the same volume scale as scales that are associated with tsunamis generated by pyroclastic density currents (PDCs) at Stromboli, whose volumes were an order of magnitude smaller than our smallest-volume simulation: the 2019 volumes were estimated by Ripepe and Lacanna (2024) as 2.08×10⁵ m3 (July) and 1.05×10⁵ m3 (August), and the May 2021 event volume was estimated at around 8.4×10⁵ m3 by Calvari et al. (2022). Even so, Ripepe and Lacanna (2024) showed that the shape of the waveform did not change with slip volume and that it was possible to determine the inundation extent/run-up from the waveform amplitude. Ripepe and Lacanna (2024) also showed that real waveforms matched model-derived (NHWAVE) waveforms, and NHWAVE has been shown through benchmarking to produce results comparable to the model used here (Esposti Ongaro et al., 2021). We thus have confidence that out synthetic waveforms are valid.
In Fig. 7, we link the impact score for each scenario to the absolute value of the wave height. It is worth noting that in the evacuation analysis we used an initial time defined by Tg, i.e. the moment when a signal with an amplitude higher than a threshold of 0.3 m is detected. Please note that in the cases in which the signal never reaches this threshold, we assume that the landslide will not generate a tsunami large enough to require an evacuation and will therefore not be considered. Figure 8 shows the wave heights registered at the NE gauge (Fig. 7a) and the SW gauge (Fig. 7b) in the first 40 s (starting from T0). The first peak is in most cases detected between 20 and 28 s at the NE beacon and between 8 and 16 s at the SW beacon. Not surprisingly, we observe that the highest impact scores are always associated with the highest wave heights.
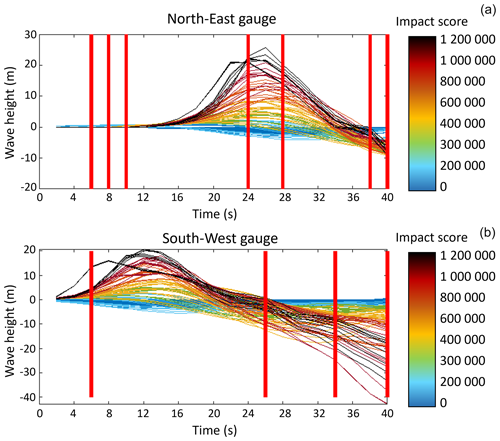
Figure 7Gauge signals with the (a) north-east gauge and (b) south-west gauge. The colour code corresponds to the impact score (in m2 inundated). The bold red lines correspond to the 11 explanatory variables retained by the LASSO linear regression model.
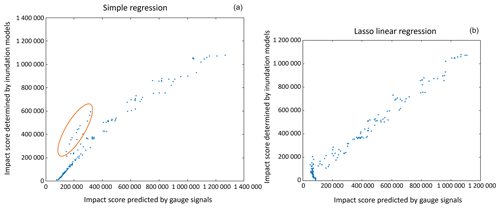
Figure 8Inundation expected in m2 by tsunami gauge signals according to (a) a simple regression approach and (b) a LASSO linear regression approach. Blues points represent each simulation of tsunamigenic landslide, and the orange ellipse represents tsunamis with a high impact score that are underestimated by the approach. The authors produced graphs using MATLAB version 2019b.
To refine this relationship between wave amplitude and impact score, two approaches were adopted (see Methods and Appendix A). The first “rough” approach is a simple linear regression; i.e. we take the maximum amplitude value and relate it to the impact score (Fig. 8a). With this approach, some tsunamis with high impact scores are underestimated because the score predicted by the gauge is lower than the score determined by the inundation models (see orange ellipse in Fig. 8a). In the second method, the LASSO penalised linear regression algorithm automatically chooses which gauge data values are most likely to explain the impact scores. The method finds 11 “explanatory variables” that best explain the relationship between gauge data and impact scores (Fig. 7). As detailed mathematically in Appendix A, these variables are the 11 most critical times at which a point on the waveform better reproduces the inundation area. The 11 explanatory variables selected were times of 6, 8, 12, 24, 28, 38, and 40 s for the NE beacon (Punta Labronzo) and 6, 26, 34, and 40 s for the SW beacon (Punta dei Corvi). This is then used to best define and distinguish the specific shape of each given waveform and links it to its inundation capacity. The LASSO regression shows a closer relationship between the gauge data and impact scores than the simple regression and does not underestimate any tsunami with a high impact score (Fig. 8b). The LASSO regression also results in small errors, defining a linear relation with a low degree of scatter.
3.4 Evacuation capacity
We here define “warning time needed” and “real warning time”. The former is the time needed to move from any given point to a safe point, thus corresponding to the exit from the inundation zone refuge area entry point (RAEP), while the real warning time is the time available for escape prior to wave arrival. We thus have two types of point, (1) those for which the RAEP can be reached inside the threshold time and (2) those that cannot be reached inside the threshold time (i.e. outside of the threshold time). The threshold time is, for any given scenario, the wave arrival time minus the time needed to reach the RAEP. If this is negative, the point is outside of the threshold time.
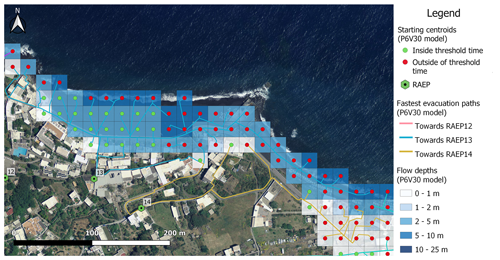
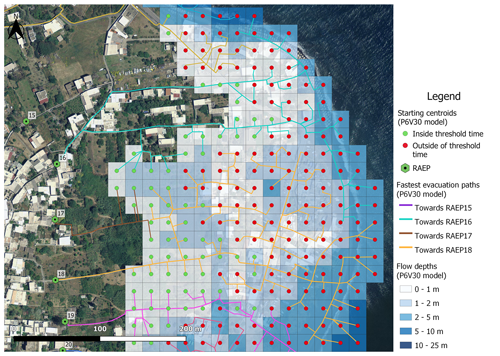
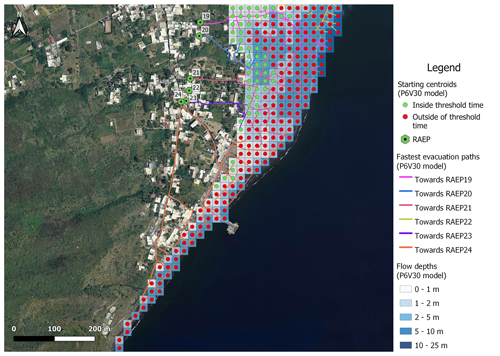
Evacuation modelling gives the fastest routes from each inundated pixel to an RAEP, i.e. an entry point into a safe zone. Results for Piscità, the most proximal community to the source, are given in Fig. 9 by way of example. Results for the Ficogrande, Punta Lena, and Scari are given in Appendix B, Figs. B1–B3. As evacuation speeds consider the slope and nature of the escape route (path width, surface type, presence of steps, etc.), some routes are not used because, although they appear short, they are slow. This explains why RAEP4 and RAEP9 in Piscità (Fig. 9), as well as RAEP12 in Ficogrande (Fig. B1), RAEP15 in Punta Lena (Fig. B2), and RAEP22 in Scari (Fig. B3), are not chosen as viable refuge area entry points.
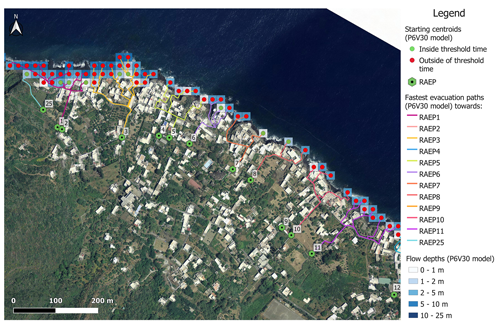
Figure 9Example of an evacuation model at Piscità created for a numerical simulation with a tsunamigenic landslide of 30×106 m3 having broken away from position 6 (294 m b.s.l.) with a density of volcanic materials of 2.5 kg m−3. A total of 64 pixels will be inundated (25 600 m2), and their associated flow depth and the fastest evacuation routes are shown. In green, points are inside the threshold time, and in red, points are outside of the threshold time. The authors produced maps using Quantum GIS version 3.16.7 software (2021). Image data © 2014 LGS.
For each pixel in the inundated zones, we used the time for the wave to arrive (Tarrive) minus the time needed to travel between the pixel centroid and the closest RAEP, in terms of time (evacuation time, Tevac), to set the threshold time A positive difference for Tarrive−Tevac thus means that the pixel can reach an RAEP inside the threshold time for the given scenario, these being the green centroids (shown as circles) in Fig. 9 and in Appendix B, Figs. B1–B3. In contrast, a negative Tarrive−Tevac value means that the pixel reaches an RAEP outside of the threshold time, these being the red centroids in Figs. 9 and B1–B3.
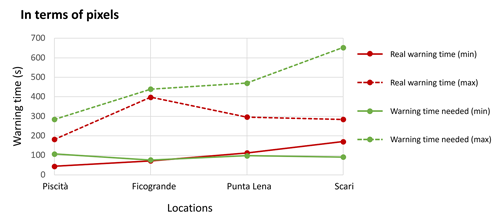
Figure 10Minimum and maximum real warning time given by the tsunami gauges and warning time needed for each district to evacuate from the coastal inundated area.
In our selected simulation example (scenario P6V30CD0.4), out of 544 inundated pixels (217 600 m2), only 132 (24 %) pixels (52 800 m2) are theoretically inside the threshold time (i.e. the RAEP can be reached before the tsunami arrives). To understand if these pixels can reach a safe RAEP point before the arrival of the tsunami, we compared the real warning times (minimum and maximum for any given zone) available from the tsunami detection gauges and the warning times needed (minimum and maximum) to evacuate the inundated area (Fig. 10). In terms of number of inundated pixels, we observe that for Piscità, Punta Lena, and Scari there is time to evacuate some pixels but not the whole area (warning time needed > real warning time). To evacuate the whole area, a maximum of 102, 174, and 368 s of extra warning time is needed for Piscità, Punta Lena, and Scari, respectively. For Ficogrande, the two curves “warning time needed” and “real warning time” are very close (Fig. 10), which means that most pixels can reach an RAEP inside the threshold time (i.e. before the wave arrives). At most an extra 41 s is needed to evacuate the whole area.
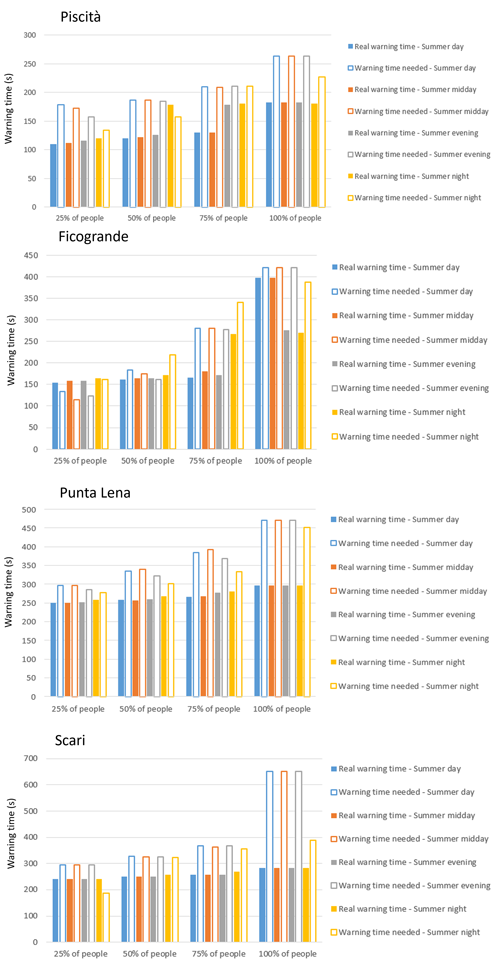
Figure 11Comparison between the real warning time given by the tsunami gauges and the warning time needed to evacuate 25 %, 50 %, 75 %, and 100 % of the Stromboli population from the four main inundated districts. The difference between the filled and empty bars is the number of cases for which we lack the time to carry out evacuation at a point for each evacuation scenario.
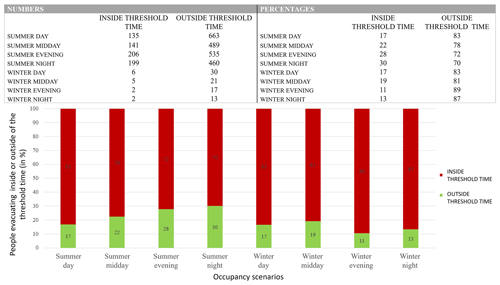
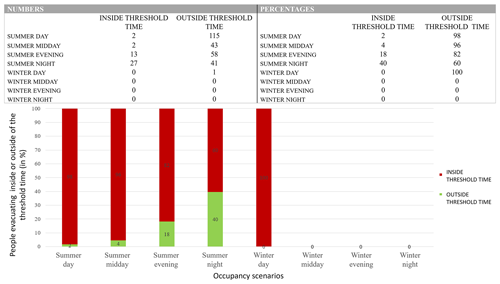
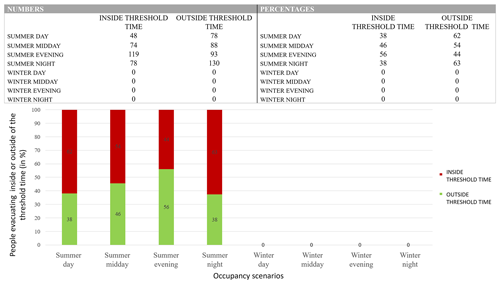
Figure 12Table and bar chart of the global number of people who can reach an RAEP inside or outside the threshold time (i.e. before the arrival of the tsunami) in the case of a 30×106 m3 tsunamigenic landslide at position 6 (294 m b.s.l.) with a density of volcanic materials of 2.5 kg m−3.
In Fig. 11 we assess the time needed to evacuate 25 %, 50 %, 75 %, and 100 % of the population from the inundated zone and thus the warning time needed to complete partial or full evacuation. In doing this, we need to distinguish between an evacuation in winter and one in summer. In summer when the coastline is highly populated, differences in the time needed to evacuate 25 %, 50 %, 75 %, and 100 % of the population can be observed depending on the time of day (Fig. 11).
We see in Fig. 11 that the time of day during which evacuation is most effective varies from district to district. For example, for Ficogrande the best time is daytime when tourists gather in locations with easy access to RAEP13. In contrast, for Scari and Punta Lena all times of day are equally bad due to the long distances to the RAEPs. For Piscità, the situation is slightly better during the night, when people leave the highly exposed beach and gather in the village closer to RAEPs. The situation is exacerbated in Piscità due to its proximal location and thus the very short wave arrival time.
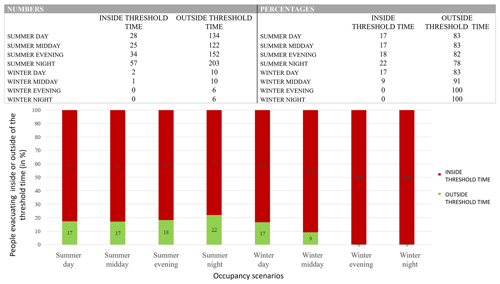
To summarise the evacuation capacity of the zone inundated by scenario P6V30CD0.4, we created bar charts giving the distribution between the number of agents that can reach an RAEP inside and outside of the threshold time depending on the season and time of day (Fig. 12). For this scenario, it is extremely difficult to reach a safe point on time. Out of 544 inundated pixels (217 600 m2), in the best case (a tsunami occurring during a summer night), only 30 % of the population can reach an RAEP inside the threshold time (Fig. 12). We also prepared individual bar charts for each of the four main neighbourhoods of the village of Stromboli (see Appendix C, Figs. C1–C4). Depending on the district, we can see that during certain periods of the year and certain times of the day, some areas are not occupied (i.e. their bar charts have empty columns). This is particularly the case during the winter period, when a “winter desert” can be found in the districts of Piscità and Ficogrande, which are the locations of summer rentals, B&Bs, and hotels. Unfortunately, permanent residents are concentrated in the districts of Punta Lena and Scari, with Punta Lena being a zone with mainly (red) points that reach an RAEP outside of the threshold time (Fig. B2). This explains why for a winter night tsunami, when the Punta Lena population are at home and close to the shore, the evacuation capacity is 0 % (Fig. C3).
4.1 Landslide source parameters
The choice of the source input parameters was driven by the need of the Italian Civil Protection Department to analyse tsunami impacts in the range of the 2002 event (Tinti et al., 2006b). Larger events are possible (with the upper bound of the 1.81 km3 mass movement for the 5 ka event that formed the Sciara del Fuoco; Kokelaar and Romagnoli, 1995), and they are documented in the geological history of the island (Rosi et al., 2019; Pistolesi et al., 2020).
For what concerns the landslide initial positions, the highest impact is always associated with landslides triggered at the lowest subaerial positions (position 3, which is just above sea level at 58 m a.s.l). This is due to the fact that granular flows starting at higher elevations deform and are diluted during the downward motion, reducing the front thickness at the impact with water and thus producing smaller waves. Finally, analysis of the whole database allows us to state that the bulk density of the landslide has a second-order effect on its tsunamigenic capability. Our analysis, carried out on simulation 6 with a density contrast of 0.4, is substantially unchanged for lower densities.
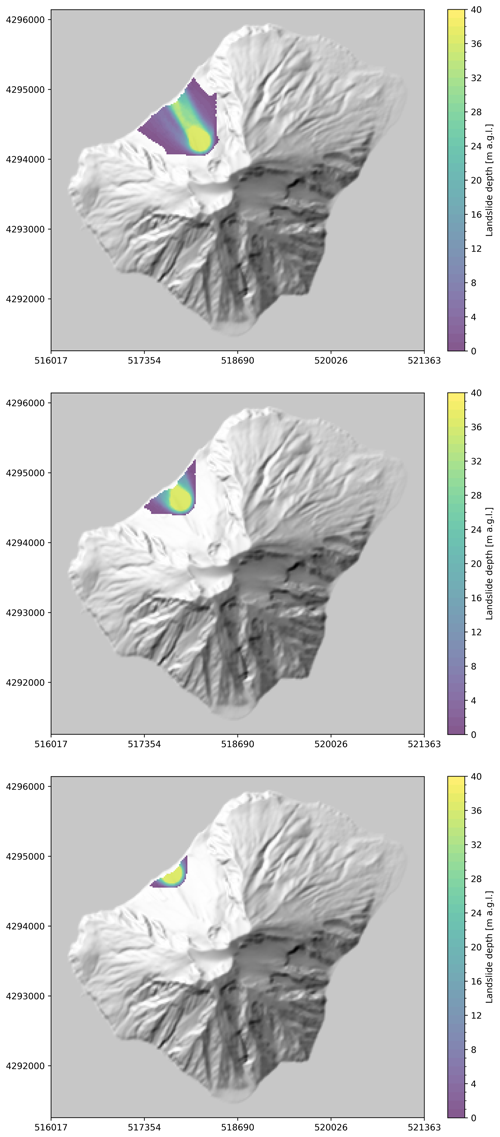
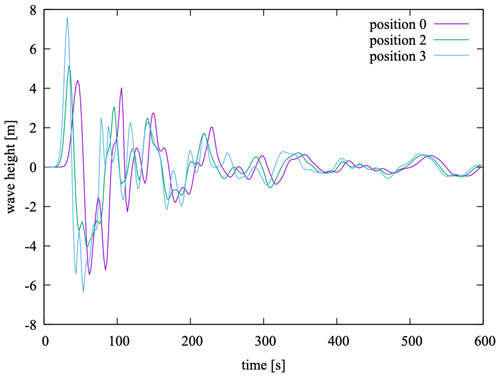
In Appendix D, Fig. D1, we show the maximum thickness of a 5×10⁶ m3 subaerial landslide (measured throughout the entire simulation) for three different initial positions along the Sciara del Fuoco (positions 0, 2, 3), thus demonstrating that the maximum landslide thickness at the impact with water is higher for the lowest-elevation landslide. Conversely, the highest initial position of landslide results in significant lateral spreading and a reduced thickness of the landslide.
We notice in our simulations that, even if the first peak is higher for low-elevation landslides at the proximal gauges, the later peaks are generally of lower amplitude (Fig. E1). This might support the idea that the tsunami energy is more focused on the first peak when the subaerial landslide is less dispersed in terms of lateral extent, but the total energy might still be correlated with the initial landslide potential energy. Verifying such a correlation for granular landslides is thus another of the objectives of our future studies.
In this study, landslide position and volume are considered the key parameters in determining the hazard score (Cerminara et al., 2024). The dependency on other parameters such as the landslide initial aspect ratio and horizontal position across the Sciara del Fuoco are of second order. Numerical simulations used in this work assume an initial position of the landslide along the central axis of the Sciara del Fuoco (consistently with the 2002 event). This assumption provides an average travel time for the tsunami to the village of Stromboli (Fig. 1). Off-axis landslides will give longer or shorter travel times (by ±30 s) for the direction of the village of Stromboli depending on whether the landslide is in the western (furthest from the village) or eastern (closest to the village) sector of the Sciara del Fuoco, thus affecting the results of the evacuation model. However, this measure can be very sensitive to the wave height, especially in areas characterised by small slopes or wall-bounded regions (e.g. topographic pools). Future numerical investigations will sample initial landslide positions considering potential off-axis sources. Finally, it is worth remarking that different assumptions about the granular flow rheology and water–landslide friction might significantly affect the results. Such effects will be analysed in a dedicated future work.
4.2 Human exposure
For the Aeolian Islands, demographic data are available from the official public censuses of 2021 (yearly survey by ISTAT, https://www.istat.it/, last access: 17 October 2023), Istat.it, 2023 and 2011 (https://www.citypopulation.de/, last access: 10 October 2023, Citypopulation.de, 2023). However, data are generally grouped by municipality for ISTAT and by island and sometimes by district for City Population. There are no data for the number of people living in each building or their demographics. Thus, we had to rely on publicly available data, such as hotel booking forms on the Internet, as well as a ground-based census completed by us for permanently occupied houses in January 2020 (Bonilauri et al., 2021). Some areas have therefore probably been overestimated in terms of population capacity, under the assumption of full capacity for all holiday facilities during the summer season. Ideally, precise population distribution and demographic data would allow us to adjust our evacuation model, but we consider the data used useful in providing a worst-case (full-capacity) scenario.
For our evacuation time calculations, we considered a “standard” person with an associated forced walking speed (see Table 1; Péroche, 2016; Bonilauri et al., 2021). These calculations were calibrated and checked as valid during escape simulations carried out by us in January 2020. Obtaining data on the age and physical abilities of the Stromboli inhabitants would allow construction of evacuation plans tailored to the individuals' capacities (see Bonilauri et al., 2021). Our escape times also involve no reaction time: the reaction is immediate, spontaneous, and correct, meaning that the agent escapes immediately using the fastest route.
Provitolo et al. (2015) presented two main kinds of behaviours in psychological reactions to imminent danger. The first was “instinctive” behaviours, where panic or disbelief prevail, and the second was “learned” behaviours, where reactions to danger are taken in a reflective manner, are adapted to the context, and are no longer instinctive. These learned behaviours can be found in preventive or spontaneous evacuations when the context is already known by the population, has been anticipated, and is likely the case for the resident populations (Bonilauri et al., 2021). However, visitors are likely to fall into the instinctive category. This poses a problem for risk management and mitigation. That is why risk awareness campaigns have been organised in volcanic contexts by the Italian Civil Protection Department for several years to reduce reaction times in the face of real danger among the visitor population.
Reaction time is hard to consider because it is specific to each person, depending, for example, on knowledge of, experience of, and familiarity with the hazard. Establishing the reaction time of both informed and uninformed agents present in vulnerable areas when the sirens sound is thus our next focus and will allow us to factor this uncertainty into our evacuation models. The same tests will allow us to assess, and refine, the escape times.
In winter, tourism on the island of Stromboli is greatly reduced, with visitors numbering below 5 per day and rising to 20 for two nights when a visiting football team was on the island (based on our January 2020 survey). Thus, generally, only permanent residents, who numbered 98 during our January 2020 count, are present in the winter months. Because most of the population live along the upper roads in the village, under winter conditions only around 20 residents are in vulnerable zones (mostly Punta Lena). However, these zones are at high risk, with only an 11 %–13 % escape percentage on a winter evening or night (Fig. 12), and thus require special attention in terms of evacuation needs.
The real warning time available to us (given by beacons) to evacuate as many people as possible before the tsunami reaches the coast is extremely short due to the short (<5 km) distance between the source and point of impact. This means that, even for the best-case scenario, only 30 % of the vulnerable population can reach a safe point inside the threshold time (Fig. 12). As the warning time cannot be reduced, only accelerating the evacuation can guarantee the safety of the people living on or visiting the island. Moreover, the greater the volume of the landslide is, the higher and faster the tsunami generated will be, reducing the warning time. Thus, this highlights the need to link tsunami waveforms to impact scores and tailor evacuation times accordingly.
To speed up horizontal evacuation, a number of RAEPs and ease of access to them are necessary, as are the distribution of evacuation plans and installation of signage. However, in cases where horizontal evacuation is clearly identified as impossible, vertical evacuation capable of taking the required capacity is the only solution (Bonilauri et al., 2021; Turchi et al., 2022). Since the response needs to be evacuation, either vertical or horizontal (Leone et al., 2013, 2018; Péroche, 2016; Solís and Gazmuri, 2017), the evacuation plans need to be developed well in advance. Our approach can be used to identify zones suitable for horizontal and vertical evacuation and be used to set capacity.
4.3 Anticipated inundation
The use of the LASSO penalised method (see Method, Fig. 8, Appendix A) to link a beacon signal to a predicted inundation extent is a major advance in our tsunami risk assessment and management. Testing this method on real tsunami detection beacon signals instead of simulated signals would make it possible to determine whether the method is valid and reliable in real conditions, and eventually integrating it directly into the beacon algorithms would make it possible to estimate the impact zone before the tsunami reaches the inhabited coast. Currently LASSO needs 40 s to recognise and classify the waveform. This time is the result of a payoff between precision in inundation area and the time needed to classify the waveform to an acceptable degree of accuracy. We could reduce this time, but that would make model output decreasingly accurate. This means that for proximal locations, maps will be delivered after the wave arrival, but the locations will have been alerted by the siren.
Having an estimation of how much coastline will be inundated and therefore needs to be evacuated could also aid in disaster planning and management, as well as guiding search-and-rescue follow-up. The refuge area entry points could be automatically adapted to each tsunami case by lowering them in elevation for small tsunamis and raising them in elevation for larger tsunamis. In our current study, we considered two types of RAEPs: 15 m a.s.l. for smaller tsunamis and 35–40 m a.s.l. for larger ones. This would modulate the population in need of evacuation and regulate the load placed on escape routes, which could be blocked for agents at risk lower in the zone by agents in the upper zone undergoing an unnecessary evacuation. Such an approach allows output of the hazard maps and risk assessments in real time, tailored to the case in hand. We are currently testing such problems using on-site escape tests with multiple agents faced with differing traffic flow scenarios, starting positions (beach, water, bed), and degrees of preparation (footwear, reaction time). This will enable us to better calibrate our escape times and to produce a distribution of potential times depending on traffic and route conditions.
At Stromboli, except the two tsunamis of December 2002, landslide-related tsunamis have few or no data available. In such cases, hazard scenarios must be supported by modelling that is validated by the well-constrained cases. The same can be argued for vulnerability and the modelling of mitigation efforts, such as evacuation, where gaps need to be identified and filled through extrapolation. Our integrated modelling approach, which involves a statistical combination of model-output hazard metrics (wave run-up, arrival time, and seafloor pressure sensor waveform) with seasonally and diurnally distributed populations as well as a model for evacuation times, allows risk mapping to assess whether or not horizontal evacuation is possible at a given point.
The simulated scenarios allow us to consider a wide range of source conditions, enabling a statistical approach to hazard assessment and providing scenario-tailored evacuation maps. Our approach involves 156 hazard (tsunami) scenarios and 5 diurnal (morning, midday, afternoon, evening, and night) population distributions divided by season (winter and summer). This results in combinations of risk assessment scenarios. Each risk assessment scenario can be linked to the tsunamic type through the waveform recorded by a seafloor pressure gauge and is automatically selected accordingly. Given a warning time of less than 3–6 min on a small volcanic island where the tsunami source is just a few kilometres from the vulnerable shoreline population, such a pre-prepared and automatic event outcome procedure is indispensable.
This method is tested and applied here to Stromboli, but it can serve as a blueprint for any other volcanic islands where volcanic activity and landslides cause local tsunamis with little warning time. Key elements in this regard are to collect the two most important source terms for hazard modelling (landslide location and volume) as well as spatial and temporal assessments of population distributions. Given uncertainty in the source terms and population distributions our scenario-based approach considers all simulations to have the same probability of future occurrence, as well as a worst-case scenario for population distribution. This approach is thus consistent with the precautionary principle of disaster management while being open to refinement subject to further data collection from, for example, geological studies, expert elicitation, escape tests, and/or population surveys, which will be our next step.
Here we present our statistical analysis of tsunamigenic landslides and penalised linear regression LASSO.
Our aim is to define a tsunami impact score based on the coastal inundation and to understand the link between this score, the associated landslide characteristics, and the gauge signals.
For each tsunamigenic landslide i (i.e. individual i) we have the following information:
-
the landslide characteristics given by (Vi, Pi, Di), where Vi is the volume of volcanic material, Pi is the onset position of the landslide along the Sciara del Fuoco, and Di is the density of the landslide material;
-
the area of coastal inundation described by a vector , …, x(i,j), …, x(i,31 635)) of 31 635 values (i.e. the number of pixels of the DEM) of 0 or 1, where if the jth pixel is inundated by the tsunami generated by the landslide i;
-
the associated gauge signals BNEi and BSWi, which are two vectors describing the wave heights recorded every 2 s since the beginning of the landslide.
For each scenario, the inundation is given by a map of high-dimensional data (the dimension corresponds to 31 635 values). To reduce the data dimension, we tested three classical statistical methods (PCA, multidimensional scaling, and isomap), and we found that the inundation data are very close to a one-dimensional space characterised by the total number of inundated pixels.
Since we have data for 156 simulations, we used a regression model to reduce the number of scenarios by searching for a relationship between the explanatory variables and the variables to be explained from Y=f(X1, …, Xk)+ε; we usually look for the “best” function f within a family of function parameters (e.g. for polynomials of degree less than d, and then d is the parameter). Due to the high dimensionality (relative to the number of experiments), we have evaluated two approaches: (1) a rough approach, i.e. retaining only the maximum amplitude of the first major wave detected by each gauge, and (2) a more classical approach, which consists in applying a LASSO penalised linear regression to select a smaller number of explanatory variables (Giraud, 2021).
The purpose of a multiple regression is to explain a variable y belonging to R using p explanatory variables x1, …, xp also in R. In our case, y is the hazard score and x1, …, xp denotes the signals emitted by the two tsunami detection beacons.
-
Linear regression. It is assumed that y can be determined as a function of x1, …, xp in a linear way, i.e. that there is an affine function f such as
Here, a1, …, ap and b are the unknown coefficients that we will try to estimate from measurements made on individuals. In our case, an individual is a tsunamigenic landslide scenario. The random part ε synthesises the measurement noise and the experimental uncertainties.
For each individual i we measure Yi; the value of the variable y; and X1,i, …, Xp,i, indicating the values of the variables x1 to xp.
To carry out a linear regression, we look for coefficients , …, and which best allow us to estimate , …, and from the results of our N individuals.
For this purpose, we define the following for each individual i:
If α1=a1, αp=ap, β=b, and ε=0, then (α1, …, αp, β) and .
We can show that there is equivalence between “the αi values are all close to ai and β is close to b” and “all values are close to Yi”.
This is why the coefficients , …, and calculated in a linear regression are those that make the error criterion, , minimal.
Linear regression does not fit the following two situations:
-
when N (total number of experiments done) ≤ p (total number of explanatory variables), i.e. when there are fewer experiments than the number of explanatory variables;
-
when explanatory variables are too correlated.
Our problem lies in both cases, so we cannot use classical linear regression.
-
-
LASSO penalised linear regression. There are ways to get around the limitations of linear regression. One of them is the LASSO penalty. LASSO is described and studied in the book Introduction to High-Dimensional Statistics by Giraud (2021), in which it has been proven that this penalty works and is adequate to solve problems similar to ours.
The LASSO penalty consists in adding to the error criterion of the linear regression, a penalty proportional to the sum of the absolute values of the coefficients. This has the effect of cancelling out many coefficients (which means working on fewer variables and therefore limits the negative effects of the above-mentioned situations).
The criterion to be minimised becomes
For each λ value we have an associated LASSO regression. To choose a λ value, one can use classical “model choice” methods. For our part, we used the “leave-one-out” method thanks to the parameter selection program present in the MATLAB software.
The leave-one-out method applied to our case involves, for a λ value and each subscript i (one of our tsunamigenic landslide scenarios), the following steps:
-
Virtually remove individual i values from our experiments (we pretend we have no information for individual i values).
-
Apply the LASSO method to calculate the coefficients (, …, and ) for all other individuals.
-
Calculate , the estimated value of Yi from the previously estimated coefficients, and then .
The error associated with lambda is defined by .
Then we start again with several values of λ and choose the λ that makes E(λ) minimal.
-
Here we present examples of the evacuation model at Ficogrande (Fig. B1), Punta Lena (Fig. B2), and Scari (Fig. B3) created for a numerical simulation with a tsunamigenic landslide of 30×106 m3 released from position 6 (294 m b.s.l.) with a density of volcanic materials of 2.5 kg m−3. Here we show the pixels that will be inundated and their associated flow depth, as well as the fastest evacuation routes. In green (circles) are points from which an RAEP safe point can be reached inside the threshold time (i.e. before the tsunami arrives), and in red are points from which the RAEP is reached outside of the threshold time. The authors produced maps using Quantum GIS version 3.16.7 software (2021) (image data © 2014 LGS).
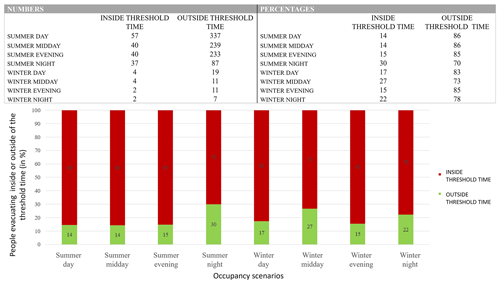
Tables and bar charts showing the number of people who can reach an RAEP point inside or outside of the threshold time (before the arrival of the tsunami) in the case of a 30×106 m3 tsunamigenic landslide (initiated from position 6 at 294 m b.s.l. and with a density of 2.5 kg m−3) for four different locations (Piscità – Fig. C1; Ficogrande – Fig. C2; Punta Lena – Fig. C3; Scari – Fig. C4).
All maps produced as part of the work of Emmie M. Bonilauri are available on request, but the GIS is the property of DPC and is thus only available for situations involving officially sanctioned access and collaboration.
EMB was responsible for all data processing and analysis through the setting up of the GIS and its data layers. MC, BC, and TEO completed all tsunami modelling and provided the hazard data layers. CA guided the development and application of the statistical methodologies. RP and AJLH conceptualised, designed, and guided the work. DM ensured the results were applicable to the field needs of the Italian Civil Protection Department. EMB led the manuscript, figure, and table preparation with input from all co-authors.
The contact author has declared that none of the authors has any competing interests.
Publisher's note: Copernicus Publications remains neutral with regard to jurisdictional claims made in the text, published maps, institutional affiliations, or any other geographical representation in this paper. While Copernicus Publications makes every effort to include appropriate place names, the final responsibility lies with the authors.
Emmie Malika Bonilauri acknowledges the support of the French government IDEX–ISITE initiative 16-IDEX-0001 (CAP 20–25), and the whole group acknowledge the support from the Italian Civil Protection Department through the 2022–2025 agreement between Istituto Nazionale di Geofisica e Vulcanologia (INGV) and the Italian Presidenza del Consiglio dei Ministri, Dipartimento della Protezione Civile (DPC), Convenzione attuativa per lo sviluppo delle attività di servizio (2022–2024), and the 2023–2024 agreement between Laboratoire Magmas et Volcans (France) and Istituto Nazionale di Geofisica e Vulcanologia (Italy).
This work was completed as part of Emmie Malika Bonilauri's PhD funded by the French government IDEX–ISITE initiative 16-IDEX-0001 (CAP 20–25) and under the 2023–2024 agreement between Laboratoire Magmas et Volcans (France) and Istituto Nazionale di Geofisica e Vulcanologia (Italy).
This work was supported under the 2012–2021 agreement between Istituto Nazionale di Geofisica e Vulcanologia (INGV) and the Italian Presidenza del Consiglio dei Ministri, Dipartimento della Protezione Civile (DPC), Convenzione B2, WP2 Task 12 (2019–2021), and under the 2022–2025 agreement between Istituto Nazionale di Geofisica e Vulcanologia (INGV) and the Italian Presidenza del Consiglio dei Ministri, Dipartimento della Protezione Civile (DPC), Convenzione attuativa per lo sviluppo delle attività di servizio (2022–2024). This is contribution no. 655 of the ClerVolc programme of the International Research Center of Disaster Sciences and Sustainable Development of the University of Clermont Auvergne.
This paper was edited by Maria Ana Baptista and reviewed by two anonymous referees.
Acocella, V., Neri, M., and Scarlato, P.: Understanding shallow magma emplacement at volcanoes: Orthogonal feeder dikes during the 2002–2003 Stromboli (Italy) eruption, Geophys. Res. Lett., 33, L17310, https://doi.org/10.1029/2006GL026862, 2006.
Boldini, D., Wang, F., Sassa, K., and Tommasi, P.: Mechanism of Landslide Causing the December 2002 Tsunami at Stromboli Volcano (Italy), in: Landslides: Risk Analysis and Sustainable Disaster Management, edited by: Sassa, K., Fukuoka, H., Wang, F., and Wang, G., Springer, Berlin, Heidelberg, 173–180, https://doi.org/10.1007/3-540-28680-2_21, 2005.
Bonaccorso, A., Calvari, S., Garfì, G., Lodato, L., and Patanè, D.: Dynamics of the December 2002 flank failure and tsunami at Stromboli volcano inferred by volcanological and geophysical observations, Geophys. Res. Lett., 30, 1941, https://doi.org/10.1029/2003GL017702, 2003.
Bonilauri, E. M., Harris, A. J. L., Morin, J., Ripepe, M., Mangione, D., Lacanna, G., Ciolli, S., Cusolito, M., and Deguy, P.: Tsunami evacuation times and routes to safe zones: a GIS-based approach to tsunami evacuation planning on the island of Stromboli, Italy, J. Appl. Volcanol., 10, 4, https://doi.org/10.1186/s13617-021-00104-9, 2021.
Calvari, S., Spampinato, L., Lodato, L., Harris, A. J. L., Patrick, M. R., Dehn, J., Burton, M. R., and Andronico, D.: Chronology and complex volcanic processes during the 2002–2003 flank eruption at Stromboli volcano (Italy) reconstructed from direct observations and surveys with a handheld thermal camera, J. Geophys. Res.-Solid, 110, B02201, https://doi.org/10.1029/2004JB003129, 2005.
Calvari, S., Branca, S., Corsaro, R. A., De Beni, E., Miraglia, L., Norini, G., Wijbrans, J., and Boschi, E.: Reconstruction of the eruptive activity on the NE sector of Stromboli volcano: timing of flank eruptions since 15 ka, Bull. Volcanol., 73, 101–112, https://doi.org/10.1007/s00445-010-0412-5, 2011.
Cerminara, M., Esposti Ongaro, T., De' Michieli Vitturi, M., Tadini, A., Trolese, M., Fornaciai, A., Nannipieri, L., and Rodriguez Galvez, J. F.: Simulated scenarios of volcanic mass movements and associated tsunamis at Stromboli (Aeolian archipelago, Tyrrhenian sea, Italy), version 1 [Data set], INGV – Istituto Nazionale di Geofisica e Vulcanologia [data set], https://doi.org/10.13127/stromboli/sciara_del_fuoco_tsunami, 2024.
Chiocci, F. L. and Ridente, D.: Regional-scale seafloor mapping and geohazard assessment. The experience from the Italian project MaGIC (Marine Geohazards along the Italian Coasts), Mar. Geophys. Res., 32, 13–23, https://doi.org/10.1007/s11001-011-9120-6, 2011.
Chiocci, F. L., Bosman, A., Romagnoli, C., Tommasi, P., and de Alteris, G.: The December 2002 Sciara del Fuoco (Stromboli Island) submarine landslide: a first characterization, EGS – AGU – EUG Joint Assembly, abstract id 12069, http://adsabs.harvard.edu/abs/2003EAEJA....12069C (last access: 18 December 2020), 2003.
Chiocci, F. L., Romagnoli, C., and Bosman, A.: Morphologic resilience and depositional processes due to the rapid evolution of the submerged Sciara del Fuoco (Stromboli Island) after the December 2002 submarine slide and tsunami, Geomorphology, 100, 356–365, https://doi.org/10.1016/j.geomorph.2008.01.008, 2008a.
Chiocci, F., Romagnoli, C., and Tommasi, P.: The Stromboli 2002 tsunamigenic submarine slide: Characteristics and possible failure mechanisms, J. Geophys. Res., 113, B10102, https://doi.org/10.1029/2007JB005172, 2008b.
Citypopulation.de: Stromboli (Messina, Sicily, Italy) – Population Statistics, Charts, Map, Location, Weather and Web Information, https://www.citypopulation.de/en/italy/localities/sicilia/messina/08304110011__stromboli/ (last access: 10 October 2023), 2023.
Esposti Ongaro, T., de' Michieli Vitturi, M., Cerminara, M., Fornaciai, A., Nannipieri, L., Favalli, M., Calusi, B., Macías, J., Castro, M. J., Ortega, S., González-Vida, J. M., and Escalante, C.: Modeling Tsunamis Generated by Submarine Landslides at Stromboli Volcano (Aeolian Islands, Italy): A Numerical Benchmark Study, Front. Earth Sci., 9, 274, https://doi.org/10.3389/feart.2021.628652, 2021.
Favalli, M., Fornaciai, A., and Pareschi, M. T.: LIDAR strip adjustment: Application to volcanic areas, Geomorphology, 111, 123–135, https://doi.org/10.1016/j.geomorph.2009.04.010, 2009.
Fernández-Nieto, E., Parisot, M., Penel, Y., and Sainte-Marie, J.: A hierarchy of dispersive layer-averaged approximations of Euler equations for free surface flows, Commun. Math. Sci., 16, 1169–1202, https://doi.org/10.4310/CMS.2018.v16.n5.a1, 2018.
Fornaciai, A., Favalli, M., and Nannipieri, L.: Numerical simulation of the tsunamis generated by the Sciara del Fuoco landslides (Stromboli Island, Italy), Sci. Rep., 9, 18542, https://doi.org/10.1038/s41598-019-54949-7, 2019.
Fornaciai, A., Favalli, M., and Nannipieri, L.: Reconstruction of the 2002 tsunami at Stromboli using the non-hydrostatic WAVE model (NHWAVE), Geol. Soc. Lond. Spec. Publ., 519, SP519-2020-162, https://doi.org/10.1144/SP519-2020-162, 2022.
Giordano, G. and De Astis, G.: The summer 2019 basaltic Vulcanian eruptions (paroxysms) of Stromboli, Bull. Volcanol., 83, 27, https://doi.org/10.1007/s00445-020-01423-2, 2020.
Giraud, C.: Introduction to high-dimensional statistics and probability, J. Roy. Stat. Soc. A, 185, 364, https://doi.org/10.1111/rssa.12861, 2021.
Grezio, A., Babeyko, A., Baptista, M. A., Behrens, J., Costa, A., Davies, G. R., Geist, E. L., Glimsdal, S., González, F. I., Griffin, J., Harbitz, C. B., Leveque, R. J., Lorito, S., Løvholt, F., Omira, R., Mueller, C., Paris, R., Parsons, T., Polet, J., Power, W., Selva, J., Sørensen, M. B., and Thio, H. K.: Probabilistic Tsunami Hazard Analysis: Multiple Sources and Global Applications, Rev. Geophys., 55, 1158–1198, https://doi.org/10.1002/2017RG000579, 2017.
Harbitz, C., Løvholt, F., and Bungum, H.: Submarine landslide tsunamis: how extreme and how likely?, Nat. Hazards, 72, 1341–1374, https://doi.org/10.1007/s11069-013-0681-3, 2014.
Istat.it: Dashboard Permanent census of population and housing, https://esploradati.censimentopopolazione.istat.it/databrowser/#/en/censtest/dashboards (last access: 17 October 2023), 2023.
Kokelaar, P. and Romagnoli, C.: Sector collapse, sedimentation and clast population evolution at an active island-arc volcano: Stromboli, Italy, Bull. Volcanol., 57, 240–262, https://doi.org/10.1007/BF00265424, 1995.
Lacanna G. and Ripepe M.: Genesis of tsunami waves generated by Pyroclastic flows and the Early-Warning system, in: The Rittmann Conference, 14 February 2020, Catania, Italy, https://www.conferenzarittmann.it/images/2020/Miscellanea_52.pdf (last access: 1 December 2023), 2020.
Leone, F., Péroche, M., Lagahé, E., Gherardi, M., Sahal, A., Vinet, F., Hachim, S., and Lavigne, F.: Modélisation de l'accessibilité territoriale pour l'aide à la gestion de crise tsunami (Mayotte, France), Annales de géographie, 693, 502–524, https://doi.org/10.3917/ag.693.0502, 2013.
Leone, F., Péroche, M., Robustelli, M., Cargnelutti, L., Perdrieau, J.-C., Coupin, T., and Gherardi, M.: Planifier les évacuations en cas de tsunami: la méthode EXPLOIT, Guide méthodologique, Service des publications de Montpellier 3, 2018.
Macías, J., Escalante, C., and Castro, M. J.: Multilayer-HySEA model validation for landslide-generated tsunamis – Part 1: Rigid slides, Nat. Hazards Earth Syst. Sci., 21, 775–789, https://doi.org/10.5194/nhess-21-775-2021, 2021a.
Macías, J., Escalante, C., and Castro, M. J.: Multilayer-HySEA model validation for landslide-generated tsunamis – Part 2: Granular slides, Nat. Hazards Earth Syst. Sci., 21, 791–805, https://doi.org/10.5194/nhess-21-791-2021, 2021b.
Maramai, A., Graziani, L., Alessio, G., Burrato, P., Colini, L., Cucci, L., Nappi, R., Nardi, A., and Vilardo, G.: Near- and far-field survey report of the 30 December 2002 Stromboli (Southern Italy) tsunami, Mar. Geol., 215, 93–106, https://doi.org/10.1016/j.margeo.2004.11.009, 2005a.
Maramai, A., Graziani, L., and Tinti, S.: Tsunamis in the Aeolian Islands (southern Italy): a review, Mar. Geol., 215, 11–21, https://doi.org/10.1016/j.margeo.2004.03.018, 2005b.
Maramai, A., Graziani, L., and Brizuela, B.: Euro-Mediterranean Tsunami Catalogue (EMTC), version 1.0 (1.0), INGV, https://doi.org/10.13127/TSUNAMI/EMTC.1.0, 2014.
Muhari, A., Heidarzadeh, M., Susmoro, H., Nugroho, H. D., Kriswati, E., Supartoyo, Wijanarto, A. B., Imamura, F., and Arikawa, T.: The December 2018 Anak Krakatau Volcano Tsunami as Inferred from Post-Tsunami Field Surveys and Spectral Analysis, Pure Appl. Geophys., 176, 5219–5233, https://doi.org/10.1007/s00024-019-02358-2, 2019.
NCEI: Center NGD Tsunami Data and Information, https://www.ngdc.noaa.gov/hazard/tsu.shtml (last access: 9 January 2023), 2023.
Paris, R., Ramalho, R. S., Madeira, J., Avila, S. L., May, S. M., Rixhon, G., Engel, M., Brückner, H., Herzog, M., Schukraft, G., Perez-Torrado, F. J., Rodriguez-Gonzalez, A., Carracedo, J. C., and Giachetti, T.: Mega-tsunami conglomerates and flank collapses of ocean island volcanoes, Mar. Geol., 395, 168–187, https://doi.org/10.1016/j.margeo.2017.10.004, 2018.
Péroche, M.: La gestion de crise tsunami dans la Caraïbe: contribution géographique aux dispositifs d'alerte et d'évacuation des populations, phdthesis, Univeristé Paul Valery, Montpellier 3, https://hal.science/tel-03129123v1 (last access: 10 January 2023), 2016.
Pino, N. A., Ripepe, M., and Cimini, G. B.: The Stromboli Volcano landslides of December 2002: A seismological description, Geophys. Res. Lett., 31, L02605, https://doi.org/10.1029/2003GL018385, 2004.
Pistolesi, M., Bertagnini, A., Di Roberto, A., Ripepe, M., and Rosi, M.: Tsunami and tephra deposits record interactions between past eruptive activity and landslides at Stromboli volcano, Italy, Geology, 48, 436–440, https://doi.org/10.1130/G47331.1, 2020.
Provitolo, D., Dubos-Paillard, E., Verdière, N., Lanza, V., Charrier, R., Bertelle, C., and Aziz-Alaoui, M. A.: Les comportements humains en situation de catastrophe: de l'observation à la modélisation conceptuelle et mathématique, Cybergeo: European Journal of Geography, Systèmes, Modélisation, Géostatistiques, document 735, https://doi.org/10.4000/cybergeo.27150, 2015.
Ripepe, M. and Lacanna, G.: Volcano generated tsunami recorded in the near source, Nat. Commun., 15, 1802, https://doi.org/10.1038/s41467-024-45937-1, 2024.
Riskianingrum, D. and Yogaswara, H.: The fading of disaster memory in Pulau Sebesi: A historical construction, E3S Web Conf., 340, 05008, https://doi.org/10.1051/e3sconf/202234005008, 2022.
Rosi, M., Bertagnini, A., and Landi, P.: Onset of the persistent activity at Stromboli Volcano (Italy), Bull. Volcanol., 62, 294–300, https://doi.org/10.1007/s004450000098, 2000.
Rosi, M., Pistolesi, M., Bertagnini, A., Landi, P., Pompilio, M., and Di Roberto, A.: Stromboli volcano, Aeolian Islands (Italy): present eruptive activity and hazards, in: The Aeolian Islands Volcanoes, vol. 37, edited by: Lucchi, F., Peccerillo, A., Keller, J., Tranne, C. A., and Rossi, P. L., Geological Society of London, https://doi.org/10.1144/M37.14, 2013.
Selva, J., Amato, A., Armigliato, A., Basili, R., Bernardi, F., Brizuela, B., Cerminara, M., de' Micheli Vitturi, M., Di Bucci, D., Di Manna, P., Esposti Ongaro, T., Lacanna, G., Lorito, S., Løvholt, F., Mangione, D., Panunzi, E., Piatanesi, A., Ricciardi, A., Ripepe, M., Romano, F., Santini, M., Scalzo, A., Tonini, R., Volpe, M., and Zaniboni, F.: Tsunami risk management for crustal earthquakes and non-seismic sources in Italy, Riv. Nuovo Cim., 44, 69–144, https://doi.org/10.1007/s40766-021-00016-9, 2021.
Solís, I. and Gazmuri, P.: Evaluation of the risk and the evacuation policy in the case of a tsunami in the city of Iquique, Chile, Nat. Hazards, 88, 503–532, https://doi.org/10.1007/s11069-017-2876-5, 2017.
Speranza, F., Pompilio, M., D'Ajello Caracciolo, F., and Sagnotti, L.: Holocene eruptive history of the Stromboli volcano: Constraints from paleomagnetic dating, J. Geophys. Res., 113, B09101, https://doi.org/10.1029/2007JB005139, 2008.
Tinti, S., Manucci, A., Pagnoni, G., Armigliato, A., and Zaniboni, F.: The 30 December 2002 landslide-induced tsunamis in Stromboli: sequence of the events reconstructed from the eyewitness accounts, Nat. Hazards Earth Syst. Sci., 5, 763–775, https://doi.org/10.5194/nhess-5-763-2005, 2005.
Tinti, S., Maramai, A., Armigliato, A., Graziani, L., Manucci, A., Pagnoni, G., and Zaniboni, F.: Observations of physical effects from tsunamis of December 30, 2002 at Stromboli volcano, southern Italy, Bull. Volcanol., 68, 450–461, https://doi.org/10.1007/s00445-005-0021-x, 2006a.
Tinti, S., Pagnoni, G., and Zaniboni, F.: The landslides and tsunamis of the 30th of December 2002 in Stromboli analysed through numerical simulations, Bull. Volcanol., 68, 462–479, https://doi.org/10.1007/s00445-005-0022-9, 2006b.
Tommasi, P., Baldi, P., Chiocci, F. L., Coltelli, M., Marsella, M., Pompilio, M., and Romagnoli, C.: The Landslide Sequence Induced by the 2002 Eruption at Stromboli Volcano, in: Landslides: Risk Analysis and Sustainable Disaster Management, edited by: Sassa, K., Fukuoka, H., Wang, F., and Wang, G., Springer, Berlin, Heidelberg, 251–258, https://doi.org/10.1007/3-540-28680-2_32, 2005.
Tulius, J.: Lesson from the Past, Knowledge for the Future: Roles of Human Memories in Earthquake and Tsunami Narratives in Mentawai, Indonesia, Paradigma, 10, 147–168, https://doi.org/10.17510/paradigma.v10i2.396, 2020.
Turchi, A., Di Traglia, F., Gentile, R., Fornaciai, A., Zetti, I., and Fanti, R.: Relative seismic and tsunami risk assessment for Stromboli Island (Italy), Int. J. Disast. Risk Reduct., 76, 103002, https://doi.org/10.1016/j.ijdrr.2022.103002, 2022.


