the Creative Commons Attribution 4.0 License.
the Creative Commons Attribution 4.0 License.
 | 24 Oct 2024
Risk of compound flooding substantially increases in the future Mekong River delta
Melissa Wood
Ivan D. Haigh
Quan Quan Le
Hung Nghia Nguyen
Hoang Ba Tran
Stephen E. Darby
Robert Marsh
Nikolaos Skliris
Joël J.-M. Hirschi
Floods are consistently identified as the most serious global natural hazard, causing devastating loss of life and economic damage that runs into multiple billions of US dollars each year. At the coastline, many flood disasters are in fact compound flood events, with two or more flood drivers occurring concurrently or in quick succession. In coastal regions the combined effect of fluvial (river) and coastal (storm tides – storm surges and high astronomical tides) floods has a greater impact than if each occurred separately. Deltas in south-east Asia are particularly exposed to coastal compound floods as they are low-lying, densely populated regions subject to the intense rainfall storm surges frequently associated with tropical cyclone (TC) activity. For our study we used a sophisticated 1D river model, combined with 2D storm tide levels, to analyse past–present and future compound flood hazard and exposure for the Mekong River delta, one of the most flood-vulnerable deltas in the world. We found that with compound flooding, a greater area of the delta will be inundated, and some parts will flood to greater flood depth. Central areas around An Giang and the Dong Thap provinces are particularly impacted in our plausible scenario, where a TC makes landfall near the mouth of one Mekong River distributary. In the future delta, the impact of compound flooding is potentially more significant, as the same compound flood scenario inundates a greater area relative to the present case and to greater depth in many locations, and floods last longer. Compound flooding therefore has clear implications for flood managers of the future delta, who will need to ensure that existing and future flood defences are to the right standard and in the right locations to offer effective protection against this future risk.
- Article
(7299 KB) - Full-text XML
- BibTeX
- EndNote


The United Nations Office for Disaster Risk Reduction estimates that, between 2010 and 2019, a total of 1.65 billion people were affected by flood events worldwide, with 104 614 deaths (UNDRR, 2020). A relatively large proportion of these deaths and losses occurred in low-lying coastal regions, particularly in deltas. Water-related disasters are a major issue in deltas because, located at the nexus of the marine environment and major rivers, the land is exposed to flooding from both. Globally around 339 million people live on deltas – that is approximately 4.5 % of the population living on just 0.57 % of the Earth's land surface area (Edmonds et al., 2020). Some global deltas are “drowning” due to combinations of land subsidence (from groundwater extraction or the decline in fluvial sediment loads), sea-level rise, and changes in storminess associated with climate change (Brown and Nicholls, 2015; Le et al., 2007; Brown et al., 2013; Kirezci et al., 2020; Nicholls and Cazenave, 2010). This exacerbates flood risk, and it tends to be poorer delta inhabitants who are most vulnerable to its consequences. Their livelihoods are more likely to depend directly on the delta, their homes and assets are less protected, they are less financially resilient, and they are more prone to flood-related health impacts (Bangalore et al., 2016; McGranahan et al., 2007).
Flooding in deltas can be greatly exacerbated when two or more flood sources occur concurrently or in close succession, resulting in disproportionately extreme events referred to as “compound flooding” (Kew et al., 2013; Wahl et al., 2015; Ward et al., 2018; Couasnon et al., 2020; Camus et al., 2021). The Intergovernmental Panel on Climate Change (IPCC) defines compound events as (1) two or more extreme events occurring simultaneously or successively, (2) combinations of extreme events with underlying conditions that amplify the impact of the events, or (3) combinations of events that are not themselves extreme but lead to an extreme event when combined (Seneviratne et al., 2012). Zscheischler et al. (2018) describe compound flooding as “the combination of multiple drivers and/or hazards that contributes to societal or environmental risk”.
Tropical and sub-tropical cyclones and storms deliver prime conditions for compound flooding – depositing large volumes of rainfall and driving storm surges at the coast because of strong winds and lowered air pressure. A number of destructive historic floods around deltas are now considered to have been compound events. When Super Typhoon Hato made landfall around Macao SAR and Hong Kong SAR on 23 August 2017, the intense rainfall, winds, astronomical tides, and storm surges all combined to flood urban coastlines of the Pearl River Delta estuary, China, by up to 1.29 m. This affected 2.46 million people, with 32 people declared dead or missing (Wang et al., 2019). Just 2 d later, Hurricane Harvey landed in Houston, Texas, USA. Intense rainfall over 4 d led to record rain depths over a wide area, with the hurricane forcing a storm tide of between 2.40 and 3.05 m (8–10 ft) above the mean higher high water level at the coast (Chambers et al., 2020; Blake and Zelinsky, 2018). A total of 70 people died in this complex flood that defied the standard classification – half the fatalities occurred beyond the 1-in-500-year flood zone extents designated by the Federal Emergency Management Agency (FEMA; Sebastian et al., 2021; Jonkman et al., 2018; Wahl et al., 2018; Valle-Levinson et al., 2020).
Despite the growing evidence, until relatively recently, few studies had focused on compound flood hazard in large river deltas (Collins et al., 2019; Green et al., 2024). In delta environments, flood studies tended to assume a single flood driver such as a constant mean sea level boundary, leading to an underestimation of flood depths. However, Eilander et al. (2020) created a global river model bounded by dynamic sea level conditions with storm surges and found that compound effects influenced flood levels at the majority of coastal locations for high-probability events. Eilander et al. (2023) subsequently coupled a high-resolution 2D hydrodynamic model, Super-Fast INundation of CoastS (SFINCS), with CaMa-Flood (Yamazaki et al., 2011, 2013) and the Global Tide and Surge Model (GTSM) (Muis et al., 2020) to examine compound effects from pluvial, fluvial, and tropical-cyclone-induced storm surge drivers at Mozambique's coastline, again confirming that interactions between flood drivers will amplify total water levels. Around the same time, Bates et al. (2021) modelled the interactions between fluvial, pluvial, and coastal flood hazards for the coastline of the conterminous USA, finding that there would be some significant local changes from the expected flood envelope because of compound flooding interactions.
Statistical-dependence analysis has also been used in a range of global- and regional-scale studies to assess the likelihood of different extreme drivers occurring at similar times (e.g. Zheng et al., 2014; Wahl et al., 2015; Bevacqua et al., 2019). Prior studies have shown that statistical dependence between flood drivers means extreme combinations are more likely. Ignoring such dependency can lead to underestimation of return periods at the river mouth (Ward et al., 2018; Couasnon et al., 2020; Camus et al., 2021). The research warns that future coastal flooding due to mean sea-level rise can be aggravated by compound interactions. They found that dependence can variably influence the joint probability of river discharge and storm surge extremes, having important implications for our understanding of flood statistics and probability along impacted coastlines.
Current research points to populations living along Asian and African deltas and coastlines being most exposed to future coastal flooding, due to atmospheric climate changes driving tropical and sub-tropical storm surge events in these regions (Seto, 2011; Neumann et al., 2015). Consequently, the aim of this paper is to characterise the past–present and future compound flood risk from tropical-cyclone-induced extreme river discharges and storm tides to one of the most flood-vulnerable and populated deltas in south-east Asia: the Mekong River delta in Vietnam. The Mekong River delta is located in a region of intense tropical cyclone (TC) activity: the western North Pacific. Storm tides driven by TC events are a tangible hazard on top of relative sea-level rise for many low-lying coastal communities in this region (Vousdoukas et al., 2016; Calafat et al., 2022; Wood et al., 2023; Toan, 2014; Takagi et al., 2014). Mean sea levels (MSLs) in the South China Sea surrounding the delta rose by 3.5 mm yr−1 at Vung Tau, Vietnam, between 1985–2010 (Hak et al., 2016). While TCs currently impact the Red River delta in northern Vietnam more frequently, TCs do strike southern Vietnam and the Mekong River delta too. In 1997, Tropical Storm Linda killed 3111 people across the Mekong River delta, destroyed 300 000 homes, and flooded 4500 km2 of rice paddy crops (Dun, 2011; Anh et al., 2017). In December 2017, 650 000 people were evacuated from vulnerable areas of southern Vietnam, including the Mekong River delta, because of Typhoon Tembin. Climate change is likely to increase the flood risk to Vietnam in the coming decades. In 2019 the IPCC identified the future Mekong River delta as being at risk not only from sea-level rise and soil erosion, but also from high tides and cyclones (Oppenheimer et al., 2019; Nguyen et al., 2019). The region is projected to experience increased storminess, which would lead to more intense rainfall events as well as extreme sea levels from TC-induced storm surges (Dasgupta et al., 2009; Seneviratne et al., 2012; Hirabayashi et al., 2013; Tessler et al., 2015; Lin and Emanuel, 2021; IPCC, 2021; Skliris et al., 2022; Wood et al., 2023: Emanuel, 2021).
Despite the area being an economic powerhouse for the region and despite its strategic value to regional food security, no research has been carried out specifically to look at TC-linked compound flood risk within the Mekong River delta. The recent work of Rodrigues do Amaral et al. (2023) explored the compound flood hazards imposed on the adjacent Ho Chi Minh City by Typhoon Usagi (2018) and found that river flooding and rainfall runoff caused flooding of up to 0.8 m because of the co-occurrence of high sea levels which prevented normal drainage. However, Ho Chi Minh City is not within the large Mekong River delta catchment area. Triet et al. (2020) assessed the combined impacts of climate change – increased river discharges and rising sea levels (including tides) – on the future (2036–2065) Mekong River delta assuming Representative Concentration Pathway 4.5 (RCP4.5). This was within the context of continued hydropower development within the catchment. They found that floodwaters would submerge some new areas and prolong the flood in some parts of the delta by an additional 1–2 months. However, neither of these studies examined multi-driver or compound flood risk from TC activity in the delta, specifically the combination of river flooding combined with TC-linked storm surges at the coastline. The research question for this study is, therefore, “how is the Mekong River delta impacted by compound flooding linked to TC activity in the region (river flooding and storm surges), and to what extent will these impacts change due to climate change by the year 2050?”
To answer this question, this paper has three objectives: (1) to examine how compound flood hazard differs across the delta compared to flood hazard driven by river-only or storm-tide-only events, under past and present-day conditions; (2) to explore how this compound flooding will change over time due to projected climate change; and (3) to assess which regions of the delta are river, coastal, or compound flood dominated and how this might change over time with climate change. We achieve these objectives using an existing model, the DHI MIKE 11 hydrodynamic model of this area, and apply new river discharge and storm-tide boundary conditions. We simulate a range of combined flooding scenarios, with differing return periods of river discharge at the upstream boundary and storm-tide return periods at the downstream boundary, and compare those flood extents and durations against single-flood-driver outcomes. We contrast river discharges and storm tides that reflect a past–present climate and a future climate. We then use a compound ratio approach applied to the model outputs to quantify which regions of the delta are river, coastal, or compound flood dominated.
The structure of the paper is therefore as follows. The Mekong River delta study region is described in Sect. 2. The model set-up is discussed in Sect. 3, with model scenarios and simulations described in Sect. 4. Results are presented in Sect. 5, with key findings and discussion in Sect. 6. Conclusions are given in Sect. 7.
The Mekong River delta (Fig. 1) is home to ∼ 20 % of Vietnam's ∼ 98.5 million population (as of 2021), with around a quarter of this population living within 2 m of the current MSL (Edmonds, 2020; Nguyen, 2021; GSO, 2024). The delta's importance for jobs and food security cannot be understated. It produces up to 50 % of the nation's rice, 65 % of its aquaculture, and 70 % of its fruit (Dun, 2011; Van et al., 2012; Triet et al., 2020).
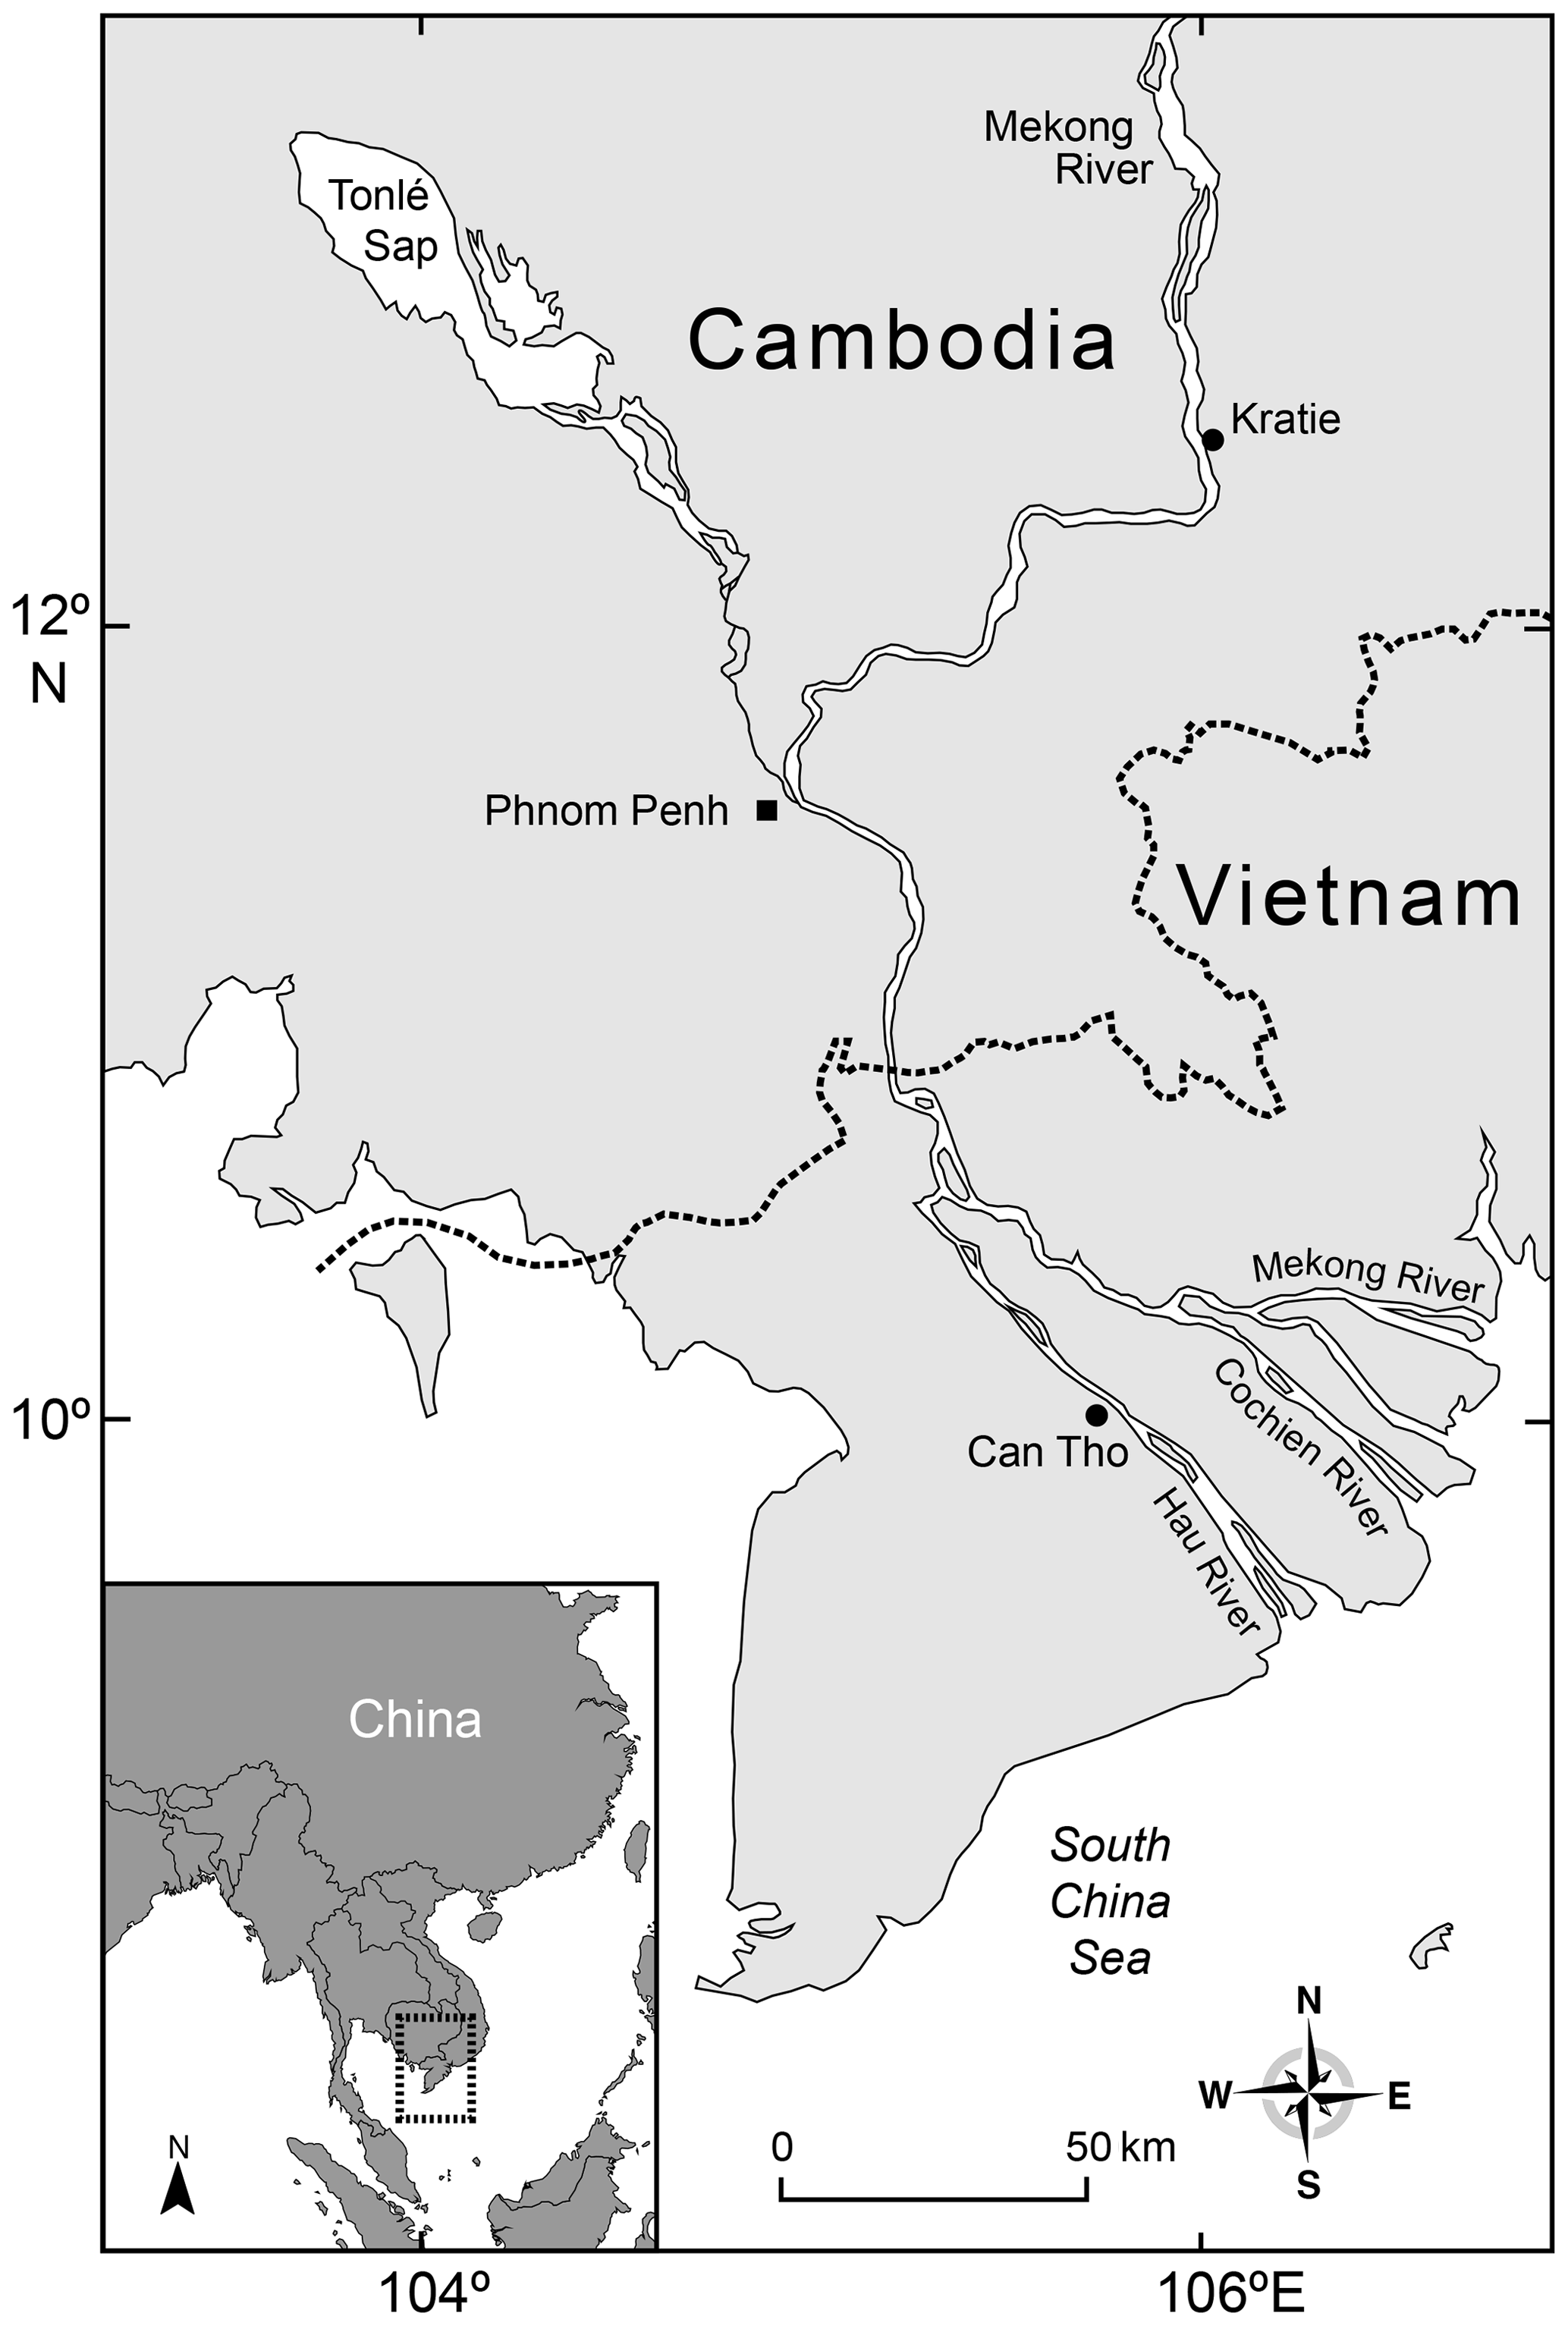
Figure 1Location of the Mekong River.
The region owes its fertile land to regular flooding following seasonal rainfall. The local climate supports two monsoon systems, which together generate around 85 % of annual river flows in the Mekong River over the wet season (May to November) (Nguyen, 2021). Wet-season floods can have two flood peaks. A principal “good” flood always arrives between July and early September as a response to monsoonal rainfall (Dung et al., 2011; Nguyen, 2021). A second peak can sometimes be observed between September and October and is linked to rain from tropical depressions, storms, and cyclones from the South China Sea making landfall over the ∼ 795 000 km2 Mekong River watershed (Hung et al., 2012). These can be so damaging that they have been coined “bad” floods because they arrive unexpectedly and can have higher peaks or sustain flooding for longer at higher water levels, overwhelming local flood defences (Nguyen, 2021).
Farmers and local government started to intensively manage floodwater levels in the late 1990s by heavily engineering the delta via miles of protective canals, pumps, gates, dykes, and seawalls (Hung et al., 2012; Welch et al., 2017; Nguyen, 2021). Low dykes with crest levels at around 2.5 m (1.5 to 4.0 m) a.m.s.l. are used to manage the annual flood peak and thereby extend the rice paddy season. These are also known as “August dykes” to match the seasonal high water level (Wesselink et al., 2015; Thanh et al., 2020; Triet et al., 2020; Nguyen, 2021). High dykes, with crest levels of approximately 4.0–6.0 m a.m.s.l., were introduced more recently in response to a series of extreme (bad) river floods (Thanh et al., 2020; Nguyen, 2021). These function to cut off the floodplain from the natural flood inundation regime of the river, facilitating a third rice crop in select areas (Triet et al., 2020). Unfortunately, the engineered systems restrict natural deposition around the delta mouth, reducing delta stability and disrupting processes that protect the delta coastline from sea surges and high tides, compromising the long-term climate resilience of the delta (Käkönen, 2008; Welch et al., 2017; Day et al., 2016; Tessler et al., 2015).
We used a DHI MIKE 11 hydrodynamic model of the lower Mekong River and its delta. The model set-up and domain are described in Sect. 3.1, a summary of the model channels, structures, boundary conditions and run parameters is given in Sect. 3.2 and the model calibration and validation is discussed in Sect. 3.3.
3.1 MIKE 11 model and domain
In this study we use the MIKE 11 hydrodynamic model of the Mekong River delta first developed in 2007 by the Vietnamese Southern Institute of Water Resources Research (SIWRR; Dung et al., 2007, 2011; Hung et al., 2012; Manh et al., 2014). The MIKE 11 model generates discharges within its network using an implicit, finite-difference solution of the one-dimensional shallow-water (Saint-Venant) equations. A fully 1D approach is recommended for the lower Mekong River delta due to its size; its dense and heavily engineered network of rivers, canals, and pipes; and unique hydraulic processes occurring because of the river's connection with Tonle Sap, a lake in Cambodia (Dung et al., 2011).
The model domain, channel network, cross sections, and boundary locations are illustrated in Fig. 2a. The associated Mekong River delta digital elevation model in Fig. 2b highlights the low-lying nature of the lower delta, with median elevations of around 0.5 m a.m.s.l. It spans an area of ∼ 55 000 km2, ranging between 8 and 14° N latitude and 102 and 107° E longitude and encompasses two distinctly different hydraulic regimes: the northern Cambodian floodplain (CFP) and the southern Vietnamese Mekong Delta (VMD). The upstream extents of the model are between Kratie and Tonle Sap in Cambodia, and the downstream extents coincide with the coastal boundaries of the South China Sea and Gulf of Thailand in the VMD (Fig. 2a). The model was created in the WGS 84 UTM zone 48N coordinate system and has a local “Hon Dau” vertical datum equivalent to local MSL (Hoa et al., 2017; Minderhoud et al., 2019). Elevations in the MIKE 11 model faithfully reproduce levels from ∼ 25 m a.m.s.l. around Kratie and ∼ 12 m a.m.s.l. around Tonle Sap down to 0.3–0.7 m a.m.s.l. at the Vietnam coastline (Tri, 2012).

Figure 2(a) The 1D MIKE 11 model network (black) with cross sections (blue) and coastal boundary locations (red). The nine downstream boundaries are (1) Vung Tau, (2) Vam Kenh, (3) Binh Dai, (4) An Thuan, (5) Ben Trai, (6) Tran De, (7) Ganh Hao, (8) Song Dec, and (9) Rach Gia/Xeo Ro. (b) A digital elevation model (DEM) illustrates the flat landscape of the Mekong River delta (GLO-30: https://doi.org/10.5270/ESA-c5d3d65; ESA, 2020; FABDEM).
While 1D models can be appropriate for representing the conveyance of water volumes in a well-defined channel, they do not always adequately represent more complex inundation in the floodplain, such as wetting and drying processes or backflow (Bates et al., 2005; Ikeuchi et al., 2015, 2017). To address this, the MIKE 11 model incorporates long and closely packed cross sections (i.e. two-dimensional profiles created from ground survey data) in the wide natural floodplains of the Mekong River in the upper delta within Cambodia and around Tonle Sap (Fig. 2a). Contrast this with the short cross sections (with attached storage cells) in the lower delta to represent the canalised channels fenced by dykes and adjoined by traditional terraced paddies within Vietnam.
Importantly, SIWRR recently updated the MIKE 11 model in three ways to improve performance. First, model dyke elevation data throughout the delta were updated from surveys undertaken between 2015 and 2018. Second, many of the model's channel bathymetry data were updated, from survey work undertaken by SIWRR and the University of Hull (described in Vasilopoulos et al., 2021). In that work, the most recent river discharge and stage data, measured at five internal gauge stations, were used to update channel roughness parameters throughout the model (Vasilopoulos et al., 2021; Le et al., 2022). Third, data from floodplain elevation surveys around Dong Thap Province, carried out by SIWRR in 2019, were incorporated.
3.2 Model hydrology, structures, and parameters
The model is forced at the upstream boundary by a single river discharge time series at Kratie, Cambodia (Fig. 2a). There are three main routes of floodwater entry into the Vietnamese Mekong Delta: (i) the two main river channels the Mekong and Bassac in Cambodia (locally named the Tien and Hau rivers, respectively, within Vietnam), (ii) transboundary overland discharge via the Plain of Reeds located east of the Mekong River, and (iii) overland discharge to the west of the Bassac River (Fig. 1; Nguyen, 2021). The flows at Kratie feed all three of these routes of floodwater entry into the delta. Further details of the Kratie discharge time series, forcing the model, are given within Sect. 4.1. Minor inflows at the border plains and the eastern boundary vary between 0.8 m3 s−1 (fixed) and 953 m3 s−1 (varying with a peak in September) but have a negligible impact on model results; hence we kept them constant for this study.
At the downstream limits of the model, there are 58 coastal boundaries at points located around the Vietnam coastline (Fig. 2a). These are driven by storm-tide (e.g. astronomical tide and storm surge) time series in our model. These storm-tide boundary condition time series are described in more detail in Sect. 4.2.
An important hydraulic feature in the model is Tonle Sap (Great Lake), which acts as a reservoir storage area at the top of the model (Fig. 2a). As Mekong River discharges gradually rise during the monsoonal wet season, Tonle Sap and the Cambodian floodplains provide vital floodwater storage and attenuation of the good annual flood peak for the lower delta. Tonle Sap receives rainfall (i.e. surface) runoff inputs at a number of locations around its perimeter in the model but has a single major inflow from the Mekong River near Phnom Penh to the south which only begins to spill over into the lake when river levels exceed ∼ 17 m a.m.s.l. (equivalent to ∼ 2.3 m water depth; Hoi, 2005; Le et al., 2022) at the start of the wet season. There is no evaporation from the lake in the model. At the end of the flood season, spillover from the Mekong River ceases and Tonle Sap starts to draw down again, releasing floodwaters back into the Mekong River delta system (Nguyen, 2021).
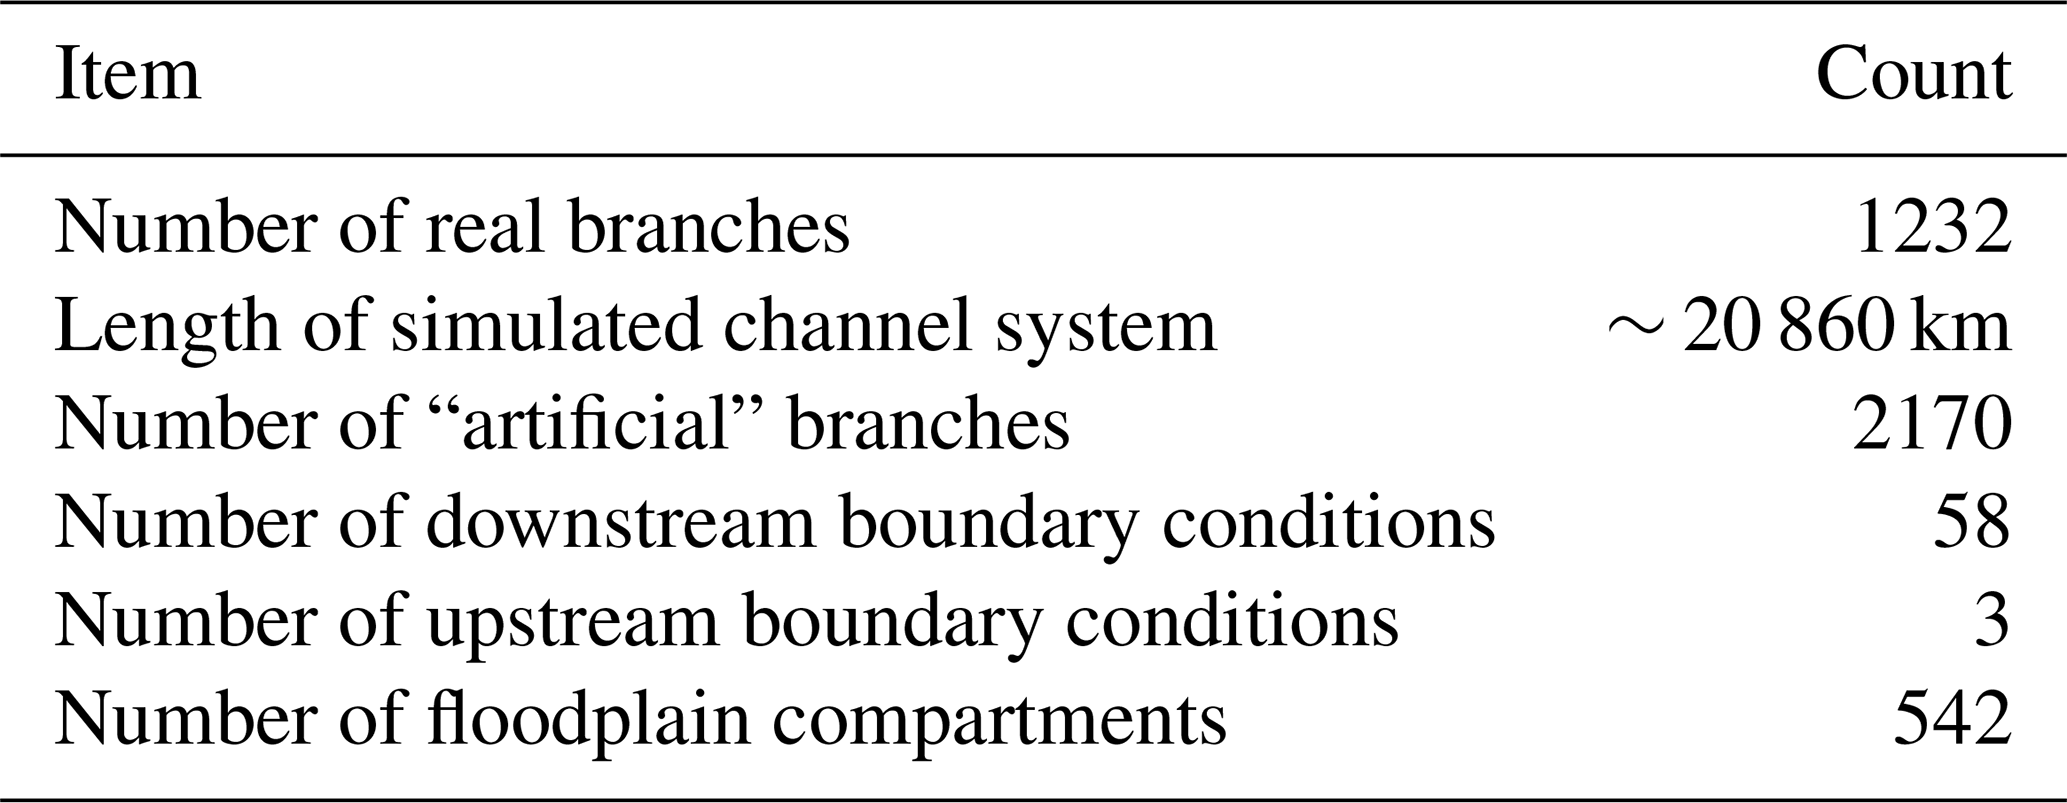
A key advantage of 1D models is that discharge over hydraulic structures and supercritical/subcritical discharges are stably represented (DHI, 2017), which is particularly important considering there are a large number of such structures within the Mekong River delta. The SIWRR MIKE 11 model that we used here includes measurements from a total of 542 flood-cell compartments enclosed by dykes and control structures (Table 1). In the model, dyke heights range between the 0.8 and 6.5 m a.m.s.l. datum. There are also a total of 23 weirs and 2260 sluice and gate structures for irrigation and flood level management. Sluice gates within the Vietnamese Mekong River delta are used to manage saline intrusion and flood levels within the protected areas, diverting flows to neighbouring and downstream compartments (Triet et al., 2020).
Table 1Overview of the Mekong River delta hydrodynamic model, modified from Dung et al. (2011).
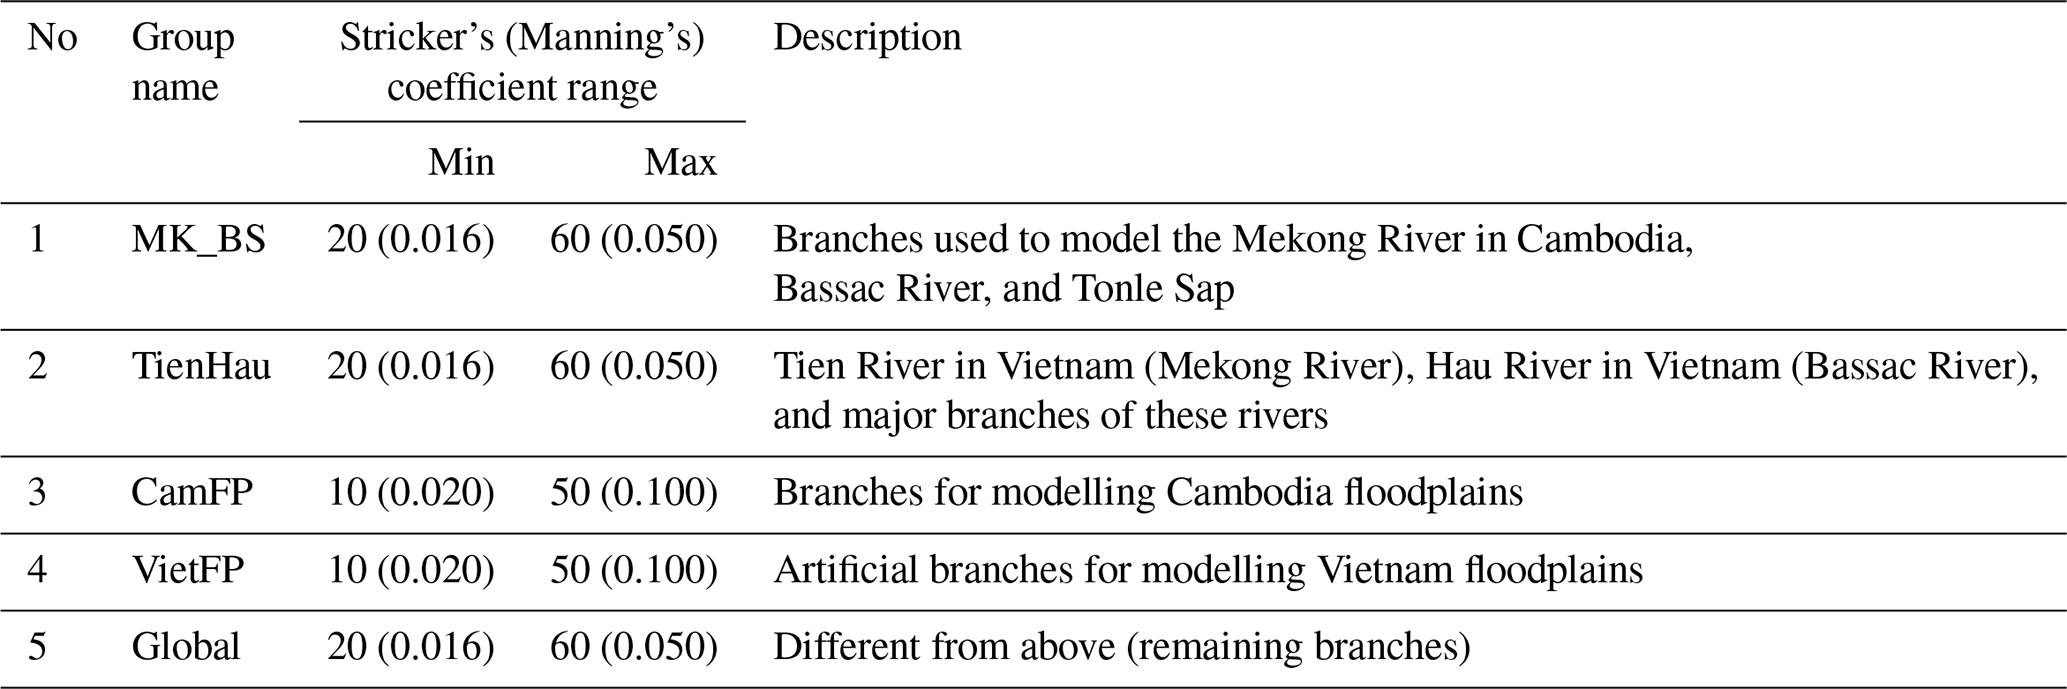
The model categorises rivers, channels, and floodplains into five separate classes according to their size and function. Channel roughness (resistance) defaults are defined according to these classes as detailed within Dung et al. (2011), using Manning's coefficient value, and they are summarised in Table 2. However, these default roughness values have also recently been fine-tuned (as described above; Vasilopoulos et al., 2021). Floodplain roughness is given a global Manning's value of 0.1.
Table 2Assignment of roughness values to five classes of channels and floodplains (adapted from Dung et al., 2011).
3.3 Model calibration and validation
For highly distributed numerical models to accurately replicate observed flood extents and levels, the model needs to be calibrated and validated against a wide range of discharge conditions, which can be a challenge if measured data are of poor quality or insufficiently spatially dispersed around the domain (Horritt and Bates, 2002). Fortunately, there are abundant data on the Mekong River delta that can be used. Dung et al. (2011) and Manh et al. (2014) used a mixture of time series of Envisat Earth observation satellite data products and hydrometric data from a network of gauge stations to auto-calibrate and validate the model for high-discharge events encompassing the floods of 2008, 2009, and 2011. These calibration exercises confirmed that the model is optimised for higher discharges and the annual flood – but it would be further improved if dyke heights in the model could be better represented. Consequently, surveys of dykes, channel dimensions, and floodplains were undertaken between 2015 and 2019, and these data were incorporated in the model (Sect. 3.1).
In 2019, SIWRR carried out a further validation exercise to test the MIKE 11 model's suitability for characterising flood conditions in the Mekong River delta. SIWRR compared the river discharge and water level data at five (main) and eight (medium) channel gauge stations internal to the model domain and independent of boundary data. The main river gauge stations were located at Can Tho, Chau Doc, My Thuan (now renamed Tran De), Vam Nao, and Tan Chau (as described in Vasilopoulos et al., 2021, and Le et al., 2022). Nash–Sutcliffe efficiency coefficients were calculated by finding the error between modelled and measured data at these locations for the year 2018. This gave a mean overall rating of 0.89 for river discharge (0.87 in the dry-season months January to May and 0.91 in the flood-season months June to December), and a mean rating of 0.94 for river water levels (0.95 in dry-season months, and 0.95 in flood-season months). Any value above 0.8 is considered to show good model accuracy, so results again clearly demonstrated that the model can effectively simulate the higher discharges and water levels (e.g. Ritter and Muñoz-Carpena, 2013; Moriasi et al., 2007). Because of SIWRR's thorough and consistent work to calibrate and validate this MIKE 11 model for high flows, we did not implement any additional model validation.
In this paper we assess the potential compound flood hazard from extreme river discharges and TC-induced storm tides across the Mekong River delta, using a number of representative scenarios. For both rivers and storm tides, we create seven scenarios: a baseline flood event, a 10 % (1-in-10-year), a 2 % (1-in-50-year), a 1 % (1-in-100-year), a 0.4 % (1-in-250-year), a 0.2 % (1-in-500-year), and a 0.1 % (1-in-1000-year) annual exceedance probability (AEP; defined in Sect. 4.1) flood event. We do not assess the precise likelihood of these events, as measured datasets are currently too short to derive accurate dependence statistics between drivers. All possible combinations of coastal and river compound flooding are then simulated. We run simulations for a wet season in the past–present (year 2020 – representative of the period 1980–2017) and a wet season in the future (year 2050 – representative of the period 2015–2050) including climate change.
We begin with a description of the creation of upstream river conditions in Sect. 4.1 and of downstream coastal boundary conditions in Sect. 4.2. The different compound flood combinations and the scenarios contrasting past–present and future compound floods are described in Sect. 4.3. Finally, in Sect. 4.4 we describe how the model simulation results were post-processed for analysis.
4.1 River boundary condition
We used a four-step process to create design return period scenario discharges for Kratie, Cambodia, as the upstream boundary condition in the MIKE 11 model. Step one, we create a baseflow hydrograph for Kratie flows, encompassing the full wet season with a peak in late August/early September, with 10 min time steps. This was achieved by taking the median of all (January 1924 to December 2013) daily flow data at Kratie, obtained from the Mekong River Commission (MRC; https://www.mrcmekong.org, last access: 4 May 2021). A long time series baseflow hydrograph is important to model accuracy, as antecedent conditions in the wider delta strongly influence how extreme floodwaters are distributed and what flood storage is physically available. This baseflow is illustrated in Fig. 3a as a greyed-out area and represents our “baseline” condition scenario.
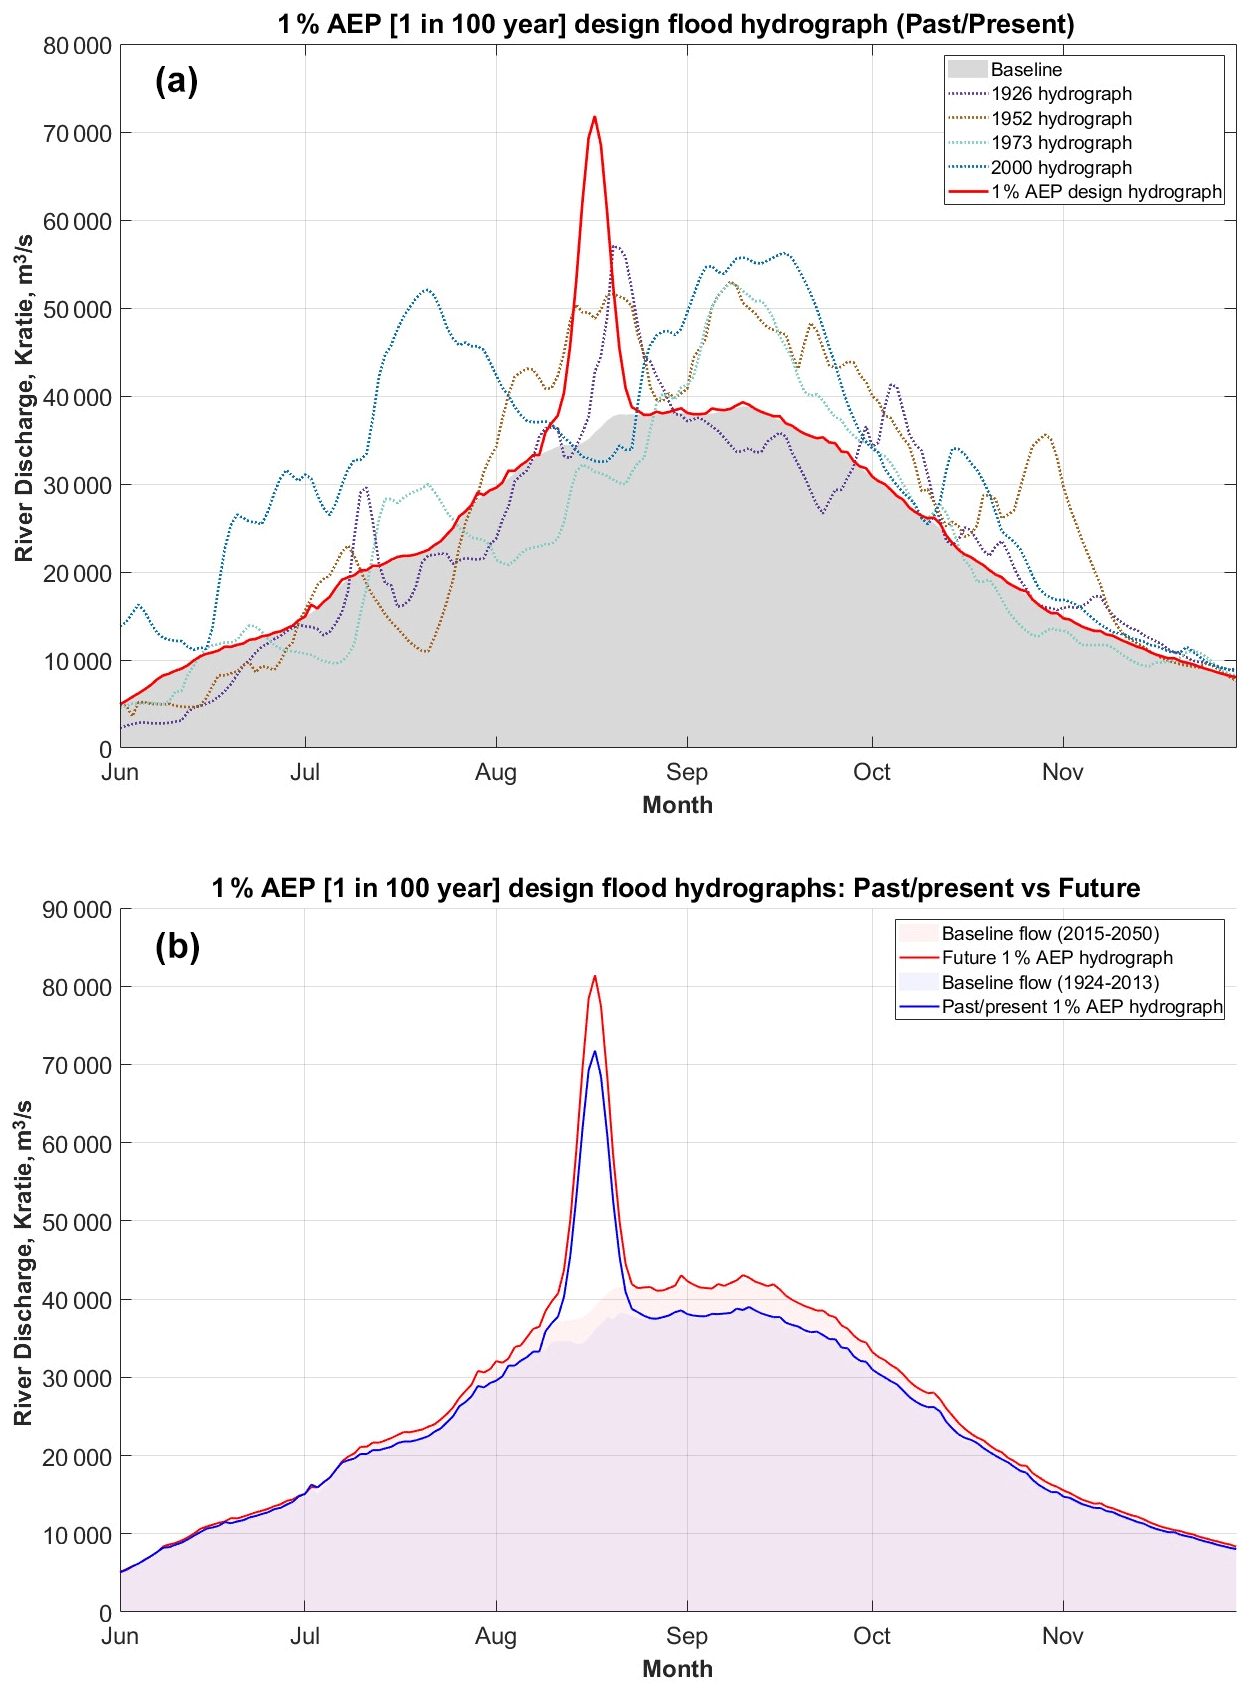
Figure 3(a) A past–present 1 % AEP return period design flood hydrograph (red line) used as an upstream boundary condition in the model. This combines a baseflow hydrograph (greyed-out area) with a single extreme flood event on the required date. Annual hydrographs for the years 1926, 1952, 1973, and 2000 are also shown for comparison (dotted coloured lines). (b) The 1 % AEP flood hydrograph at Kratie for the year 2020 (blue) vs. a 2050 future (red).
In step two, we estimate design return period flood discharges at Kratie, for TC-rainfall-forced flood events. We did this using annual (block) maxima from the 1924–2013 daily flow record, and assigning a rank (m) to the maxima from each year, from largest to smallest. Since extreme discharges at Kratie all occur under the same wet-season climate conditions and since annual-maximum peaks are hydrologically independent of each other, statistical conditions are met to apply the Gringorten formula and estimate the river discharge probability of exceedance and return period values. The Gringorten formula was chosen due to its suitability for estimating extreme values and its demonstrable record for unbiased return period estimation (Guo, 1990). The probability of exceedance (P) using this formula is
where a is a scale parameter equal to 0.44 and n is the number of annual-maximum observations. The discharge return period at Kratie is given as . Our desired return period values are then interpolated based on these data. The AEP is the percentage chance that a given discharge will be equalled or exceeded in any given year, based on these years of data. We therefore estimated “design” return period discharge values for the 0.1 %, 0.2 %, 0.4 %, 1 %, 2 %, and 10 % AEP levels.
In step three, we create a flood event pulse shape using an approach described in Yue et al. (2002). This method identifies typical flood event variables – event mean and event variance – from river gauge measurements and creates a two-parameter beta probability density function (PDF) to produce a synthetic flood pulse shape of appropriate height (peak discharge) and width (duration). We isolated extreme flood event mean and variance values in the 1924–2013 Kratie discharge record to thus create a synthetic flood pulse shape characteristic of historic flood pulses at Kratie. We scaled the height to represent the appropriate discharge rate required for each of our design return period flood event scenarios (step two, Table 3). Lastly, we compared the flood duration and total flood volume contained in this synthetic flood pulse with historic events to confirm that it also carries a credible volume of floodwater into the past–present delta.
Table 3Peak discharge (m3 s−1) for the 10 % (1-in-10-year), 2 % (1-in-50-year), 1 % (1-in-100-year), 0.4 % (1-in-250-year), 0.2 % (1-in-500-year), and 0.1 % (1-in-1000-year) AEP floods at Kratie, Cambodia, for present (by 2020) and future (by 2050) climates.

Finally, in step four, we attempt to align the time to peak between the river and storm surge flood surges so that they coincide and compound within the model. Through an iterative process of model simulations, we determined that the optimal time to have the peak occur upstream at Kratie was 3.3 d before any storm tide strikes at our chosen section of Vietnam coastline. This would generate a river discharge flood peak which combines with the storm tide around the centre of the delta, near to Can Tho on the Hau (Bassac) River and to Vinh Long on the Tien (Mekong) River.
We created a future total flood hydrograph at Kratie by following the same steps as for the past–present delta above. Future river discharges in the Mekong by 2050 are expected to be greater than today's flows due to increased storminess and TC activity in the region from projected climate change. To represent these changes, we utilised results from the HYPE (Hydrological Predictions for the Environment) model created for the past–present and future climate for the Mekong region (Du et al., 2020, 2022). The future (up to the year 2050) HYPE model used HadGEM3-GC3.1 climate model input data with local CMIP RCP8.5 rainfall projections (Skliris et al., 2022). The HYPE future model predicts more intense rain days and a larger number of dry days for the future Mekong region. However, due to the coarse resolution of the climate input data, discharge values at Kratie appear to be underestimated in both past–present and future HYPE model outputs, contrary to other projections for southern Vietnam, which predicts at least a 5 % increase in river flows there (Västilä et al., 2010; Skliris et al., 2022; Try et al., 2022). HYPE future has mean discharge output at Kratie that is actually 3 % less than past–present-day gauged values. Du et al. (2022) confirm that some river discharges linked to uncertain precipitation can be underestimated in the HYPE model. Since the future HYPE model does regionally follow projected trends overall, we have assumed that the results for Kratie represent a local discrepancy in the data.
Consequently, to create future discharges for our MIKE 11 model, we chose to disregard the specific Kratie model outputs and instead incorporated the overall trend for the region using the differences between the past–present HYPE model outputs and the future HYPE model outputs. The procedure we used is as follows. Firstly, we ordered the time series of HYPE model output discharges, at Kratie, and calculated percentiles for these flows, for both the past–present and the future results. We then calculated the percentage difference (δ), at every percentile, between the past–present and future HYPE river discharges. Plotting this out we observed that δ was largest for extreme high and low discharges and smallest around the mean. Secondly, we increased the δ 50th percentile so that it was equal to the +5 % expected within the wider literature for future river flows in this area and applied the same adjustment to all other δ values, creating δ+. Thirdly, we similarly ordered our Kratie gauged record (1924–2013), created a ranking of observed river discharges by percentile, and then applied δ+ to estimate future river discharges. This method therefore combines both the general trend information by percentile from HYPE and expected increases in mean flows around Kratie from the wider literature and applies it to the past–present discharge record at Kratie. Using this approach, future river discharges have mean flows that have been increased by 5 % during the wet season. Wet-season high (95th-percentile) river flows have been increased by ∼ 11 % and the low (5th-percentile) flow extremes have been decreased by ∼ 1 %. This is entirely consistent with a future Mekong climate which is projected to have more intense rain days and a larger number of dry days (Västilä et al., 2010; Try et al., 2022; Skliris et al., 2022).
The subsequent steps to create future design flood hydrographs for the MIKE 11 model are then identical to the past–present-day method described above. The 1 % AEP hydrographs for the year 2020 vs. the year 2050 are compared in Fig. 3b. The estimated peak discharges for the past–present and future periods, under our return period scenarios, are listed in Table 3.
4.2 Coastal boundary conditions
The MIKE 11 river model has 58 coastal boundary points, shown in Fig. 2. However, only 9 points have a significant influence on water levels in the delta; the other 49 points represent channels with negligible impact on the delta. We create a suite of design return period storm tides (i.e. astronomical tides and storm surges) at each of the nine principal coastal boundary points, representing a storm tide associated with a TC crossing the Mekong River delta, using outputs from a prior study by Wood et al. (2023) for the same past–present and future years.
We chose to model the storm surge striking one of the largest distributaries of the Mekong Delta coastline at the Co Chien River mouth, near Thanh Phong, Thanh Phu District, Ben Tre, Vietnam (Point 4 in Fig. 2a). Wood et al. (2023) derived storm surge probabilities around the whole coastline of Vietnam by driving a MIKE 21 (DHI) coastal ocean model with 10 000 years of synthetic TC activity from Bloemendaal et al. (2020, 2022), representative of a past–present (1980–2017) and high-emission-scenario future (2015–2050) period. We obtained storm surge information for the 10 largest past–present storms, at each of the nine coastal boundary points and then calculated the average percentage scale factor as the storm surge reduces in size moving north or south of Point 4. We found that, on average, points 1, 2, 3, and 5 experience a surge that is 61 %, 96 %, 100 %, and 23 % of the peak storm surge at Point 4. Point 6 experiences a surge that is −45 % of the peak surge at Point 4; this is because, south of the eye in the Northern Hemisphere, cyclonic winds flow in the offshore direction away from the track of the cyclone, generating a negative surge. At points 7, 8, and 9, the storm surge is negligible on average, and so we set this as 0 % of the storm-tide height at Point 4. The resulting storm-tide boundary conditions are shown in Fig. 4.
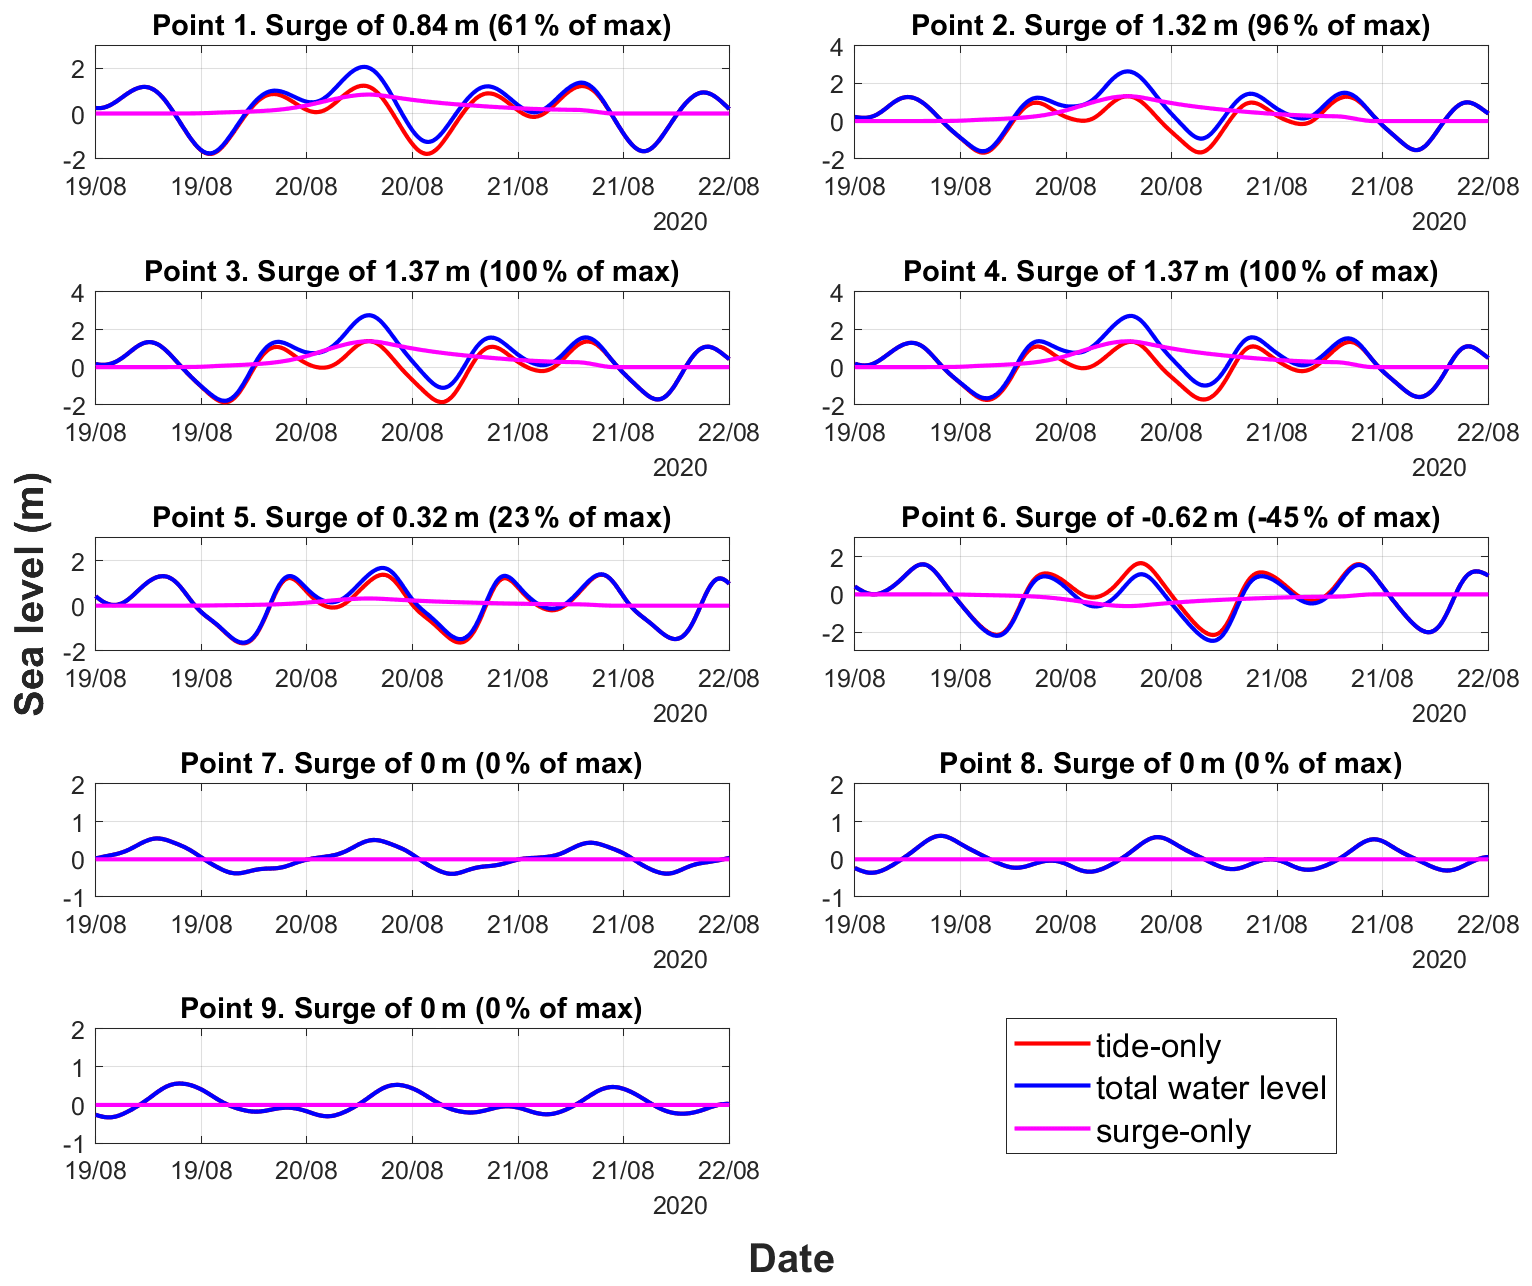
Figure 4The 1 % AEP storm tide for each coastal boundary condition in the past–present climate, shown in blue. Red indicates the astronomical tide, and magenta shows the storm surge.
We follow four steps to calculate storm-tide levels for the coastal boundaries of the model. First, we predict the astronomical tide for the duration of the model simulation using the T Tide software package (Pawlowicz et al., 2002) in MATLAB for June to November at each of our nine points (Fig. 2a). These are shown by the red line in Fig. 4, for each point. Second, we derive a design storm surge profile shape which has a length of ∼ 2 d (±1 d around the peak) from the time series of synthetic storm surges generated from the 10 largest events at Point 4, from Wood et al. (2023). We set the time and date of the storm surge peak to 07:30 LT (local time) on 20 August to coincide with the high water of a spring tide and around the time of maximum river discharge (Sect. 4.1). The storm surge is shown by the magenta line in Fig. 4. Third, we scale the storm surge profile so that when combined with the astronomical tide, the peak storm tide corresponds with either the 0.1 %, 0.2 %, 0.4 %, 1 %, 2 %, or 10 % design AEP level at this location. At the neighbouring eight locations, we scale the storm surge profile by the percentage factor described above to represent the decrease in strength of the storm surge further away from Point 4. Finally we combine design storm surge and astronomical tides. The blue line in Fig. 4 shows the combined storm tide corresponding to the 1 % AEP. Note that for the remainder of the simulation period (not shown in Fig. 4), the storm surge is set to zero. In this way, we create coastal boundary data files containing the full time series for all nine coastal point locations for each of the six AEPs and for the past–present and future periods. These coastal boundary sea level files have a time step of 10 min.
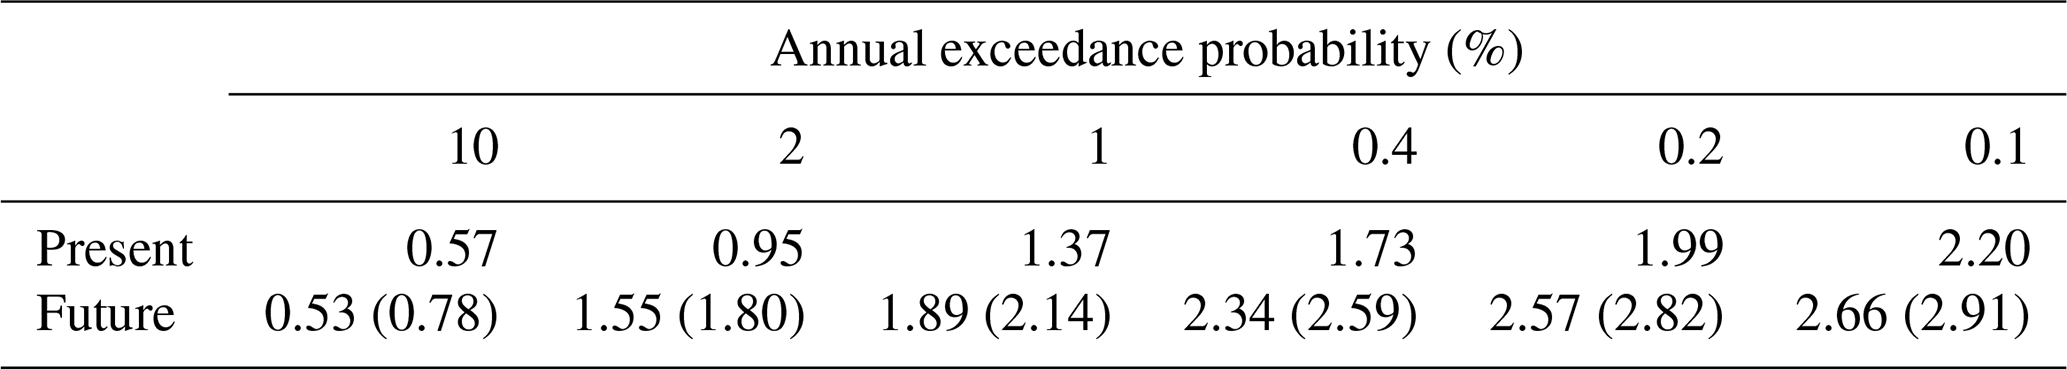
For the future period, we followed the same procedure but scaled the storm tide to match the future AEP probabilities, also derived in Wood et al. (2023). The past–present and future storm-tide AEPs are listed in Table 4 for Point 4. The IPCC's Sixth Assessment Report projects a relative MSL mean rise at the grid point adjacent to the Mekong River delta of 0.25 m by the year 2050, under the SSP5-8.5 reference scenario, relative to a 1995–2014 baseline (Fox-Kemper et al., 2021; NASA sea-level tool: https://sealevel.nasa.gov/ipcc-ar6-sea-level-projection-tool, last access: 10 March 2022). The projected future storm tide heights that we use in the model therefore have an additional 0.25 m added to capture this, as shown in brackets in Table 4.
Table 4Past–present (by 2020) and future (by 2050) storm tide heights (m) for the 10 % (1-in-10-year), 2 % (1-in-50-year), 1 % (1-in-100-year), 0.4 % (1-in-250-year), 0.2 % (1-in-500-year), and 0.1 % (1-in-1000-year) AEP for Point 4. Values in brackets are storm tide and a projected future sea-level rise of 0.25 m.
4.3 Model scenarios
We run 98 simulations of the model: 49 representing a past–present period and 49 representing a future period. The past–present period is representative of TC activity derived from observations for the years 1980–2017 (Bloemendaal et al., 2021, 2022). The future period is representative of TC activity for the years 2015–2050 derived from high-resolution climate models driven with a high-emission (SSP5-8.5) climate change scenario (Bloemendaal et al., 2022) and with a sea-level rise increase up to 2050 under the same SSP5-8.5 scenario from the IPCC Sixth Assessment Report (Fox-Kemper et al., 2021).
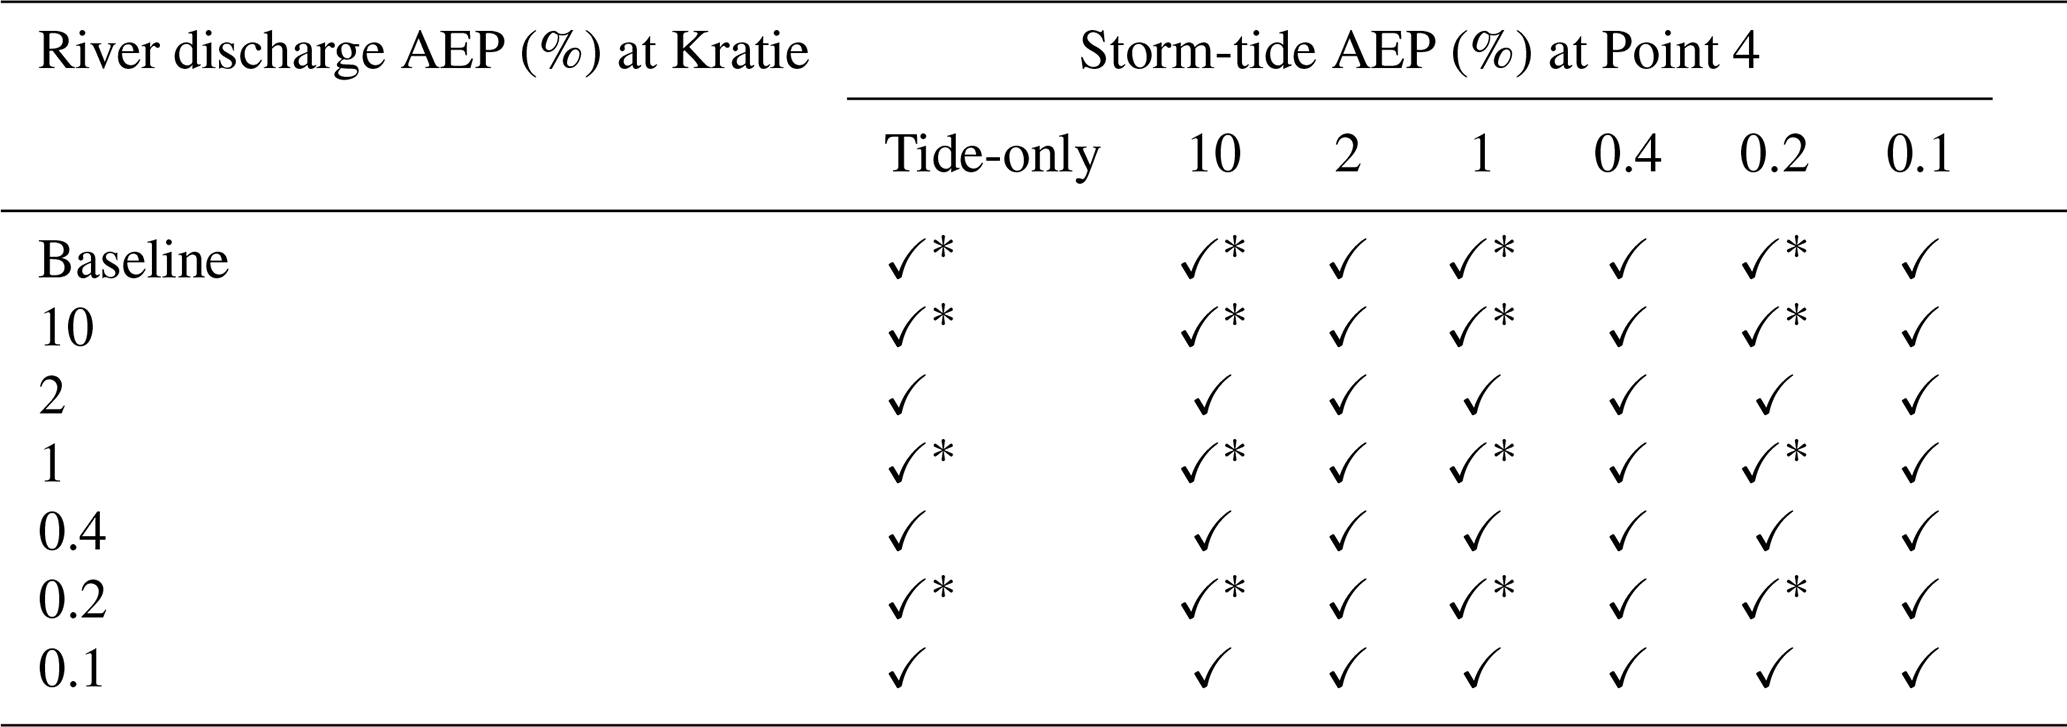
We aim to determine the extent, influence, and duration of the full range of possible compound flood event combinations. Table 5 conveys the 49 combinations of river and coastal boundary conditions modelled in each time period. The river discharge baseline conditions, at Kratie, are median daily flows. At the nine coastal boundary points, the coastal baseline conditions correspond to just astronomical tides (no storm surge). We timed our model boundary conditions to produce a state where Mekong River discharge and storm tides combine to flood the central delta, coinciding around Can Tho on the Hau (Bassac) River and Vinh Long on the Tien (Mekong) River soon after the TC makes landfall.
Table 5Model combinations to synthesise a compound flood with river discharge flooding and storm tide flooding at the same time. The asterisks indicate results we reproduce as maps in this paper.
Each of the 98 simulations in the MIKE 11 model was run from 1 June to 28 November. We used an adaptive time step (minimum 1 min, maximum 30 min) and selected the unsteady state option for river discharges as downstream sea levels, and upstream river discharges, volumes, and velocities all vary over time. We set an “initial water level” value of between 0.5 and 7.65 m in the major channels (1.5 m globally otherwise) at time step zero. In addition, a condition of no groundwater infiltration and no evaporation was set within the model, and a flood-calibrated default Courant number was used (see Sect. 3.3). We set the simulation outputs to be a 3-hourly record of water level and discharge at all river channel output locations.
4.4 Presentation of model results
We present model results in four ways, showing variation relative to a flood baseline, with (1) spatial flood difference maps; (2) profile plots along the Tien River–Co Chien River length, between Kratie and the Co Chien river mouth; (3) flood depth hazard maps showing days of flooding at dangerous depths; and (4) spatial maps showing relative dominance of flood drivers.
Spatial maps of flood extent for all scenarios in Table 5 were created.
- i.
Environmental Systems Research Institute (Esri) ArcMap software was used to interpolate model maximum water elevations at each river channel outwardly using an inverse-distance-weighted tool. The interpolation and extension were confined to appropriate sub-basin limits (outlines obtained at https://data.opendevelopmentmekong.net, last access: 4 February 2021).
- ii.
This flood layer was then applied to a high-resolution digital elevation model (DEM) of the Mekong Delta. We used FABDEM, based on the European Space Agency's Copernicus GLO-30 dataset (https://doi.org/10.5270/ESA-c5d3d65; Hawker et al., 2022). The FABDEM vertical datum was reprojected to match the model's local Hon Dau model datum (Minderhoud et al., 2019: Hoa, 2017).
- iii.
Any flooding found below ground level was consequently removed, as were floods over river channels and permanent bodies of water (e.g. Tonle Sap, areas of aquaculture).
- iv.
Any islands of floodwater not hydrologically connected to the coastline or the river and canal network were also removed using GIS tools. We repeated this process for every design flood scenario (Table 5) for both past–present and future scenarios. Hence, this process created a series of spatially interpolated flood maps of the 1D model maximum water elevations for the Mekong River delta.
- v.
The final step was to calculate flood difference maps by subtracting the past–present baseline flood map from the compound flood maps. Difference maps not only are created to highlight differences from the period baseline, but also are an attempt to remove systematic errors in the process of creating these flood maps.
Second, we examined the differences in flooding relative to a past–present baseline (i.e. median river discharges at Kratie combined with only the astronomical tide at all coastal boundaries) in profile view for all scenarios. We achieved this by extracting maximum flood elevations from the MIKE 11 river model at points along the Mekong–Tien–Co Chien channel and plotted the additional depth of flooding relative to our past–present baseline.
Third, we explored if there was a change in the duration of dangerous flood levels in compound scenarios over time (objective 2). We defined a dangerous flood depth as a flood that was 0.5 m higher than our past–present baseline. This depth was selected because standing flood depths between ∼ 0.5 and ∼ 1 m have been established to be unsafe for children, the elderly, and vehicles travelling through flooding (Smith, 2015). We did this by mapping the duration (number of days) and locations where flood depths exceeded 0.5 m above our past–present baseline, creating “flood depth hazard maps”.
Fourth, we present results showing which regions of the delta are river, coastal, or compound flood dominated (objective 3) in Sect. 5.3. Our approach was to apply the “compound ratio” method of Huang et al. (2021). For a given grid cell in our flood maps, the compound ratio (Cr) is the ratio between the maximum water level disturbance (D) away from the baseline and the sum of the two combined maximum disturbances (Dj) as follows:
Disturbance (D) is the height of the maximum water level above the baseline state, as captured by our flood difference maps; j represents the number of different flood drivers at this location. Cr values close to 0 indicate substantial non-linear compound effects, while Cr values closer to 1 indicate negligible compound effects. The Cr maps in our Results section were created in a two-step process. First, we took the flood difference map of a river-flooding-only scenario (e.g. 1 % AEP with no storm tide component) for the numerator in Eq. (2). The denominator is a difference map from a compound flood scenario with the same magnitude river flood (e.g. 1 % AEP river flood with a 10 % storm-tide flood). Every cell in the flood map will thus have a Cr value between 0 and 1, with values closer to 1 indicating river flooding dominance and values closer to 0 indicating compound effects. This produces the river portion of the Cr map. The process is then repeated for the storm tide parts of the Cr map: a storm-tide-only difference map is used in the numerator to characterise storm-tide-dominant flood areas in the domain. The denominator is a difference map from a compound flood scenario with the same magnitude storm-tide flood. After this, the second step is to combine these two Cr maps, with the compound zones overlapping.
The following sub-sections present our results as they relate to each of the three objectives outlined in Sect. 1.
5.1 Differences between compound flood hazard and single-source flooding
We present areas of excess flood inundation for select past–present AEP scenarios (10 %, 1 %, and 0.2 %), relative to the past–present baseline, in Fig. 5a. In this matrix of figures, the y axis shows river flood magnitude scenarios and the x axis shows storm-tide magnitude scenarios. To make allowance for margins of error, we present only flood differences greater than 0.1 m. Figure 5a, Pa–Pd, illustrates the increased area of coastal flooding around Point 4, linked to an increasing magnitude of storm tides. The excess flood depths range between ∼ 0.25 m (10 % AEP) and 3.0 m (0.2 % AEP). The length of coastline impacted is around 100 km. Inland this reaches approximately 160 km up the Mekong–Tien–Co Chien channel, up to around Cao Lanh in the 10 % AEP storm-tide-only flood (Fig. 5a, Pb) and up to Tan Chau at the Cambodia–Vietnam border in the 0.2 % AEP flood (Fig. 5a, Pd), whereas, for river-only flood scenarios (Fig. 5a, Pa, Pe, Pi, and Pm), it is flood depths, rather than the flood inundation area, that change with increasing flood magnitude. Floodwaters are largely confined to Cambodian and Tonle Sap areas and northern parts of the Vietnam delta near the border. Between Great Lake and the country border, north of Chau Doc in Vietnam, the extra depth of flooding due to compound effects ranges between 0.3 m (10 % AEP river flood) and 1 m (0.2 % AEP river flood).
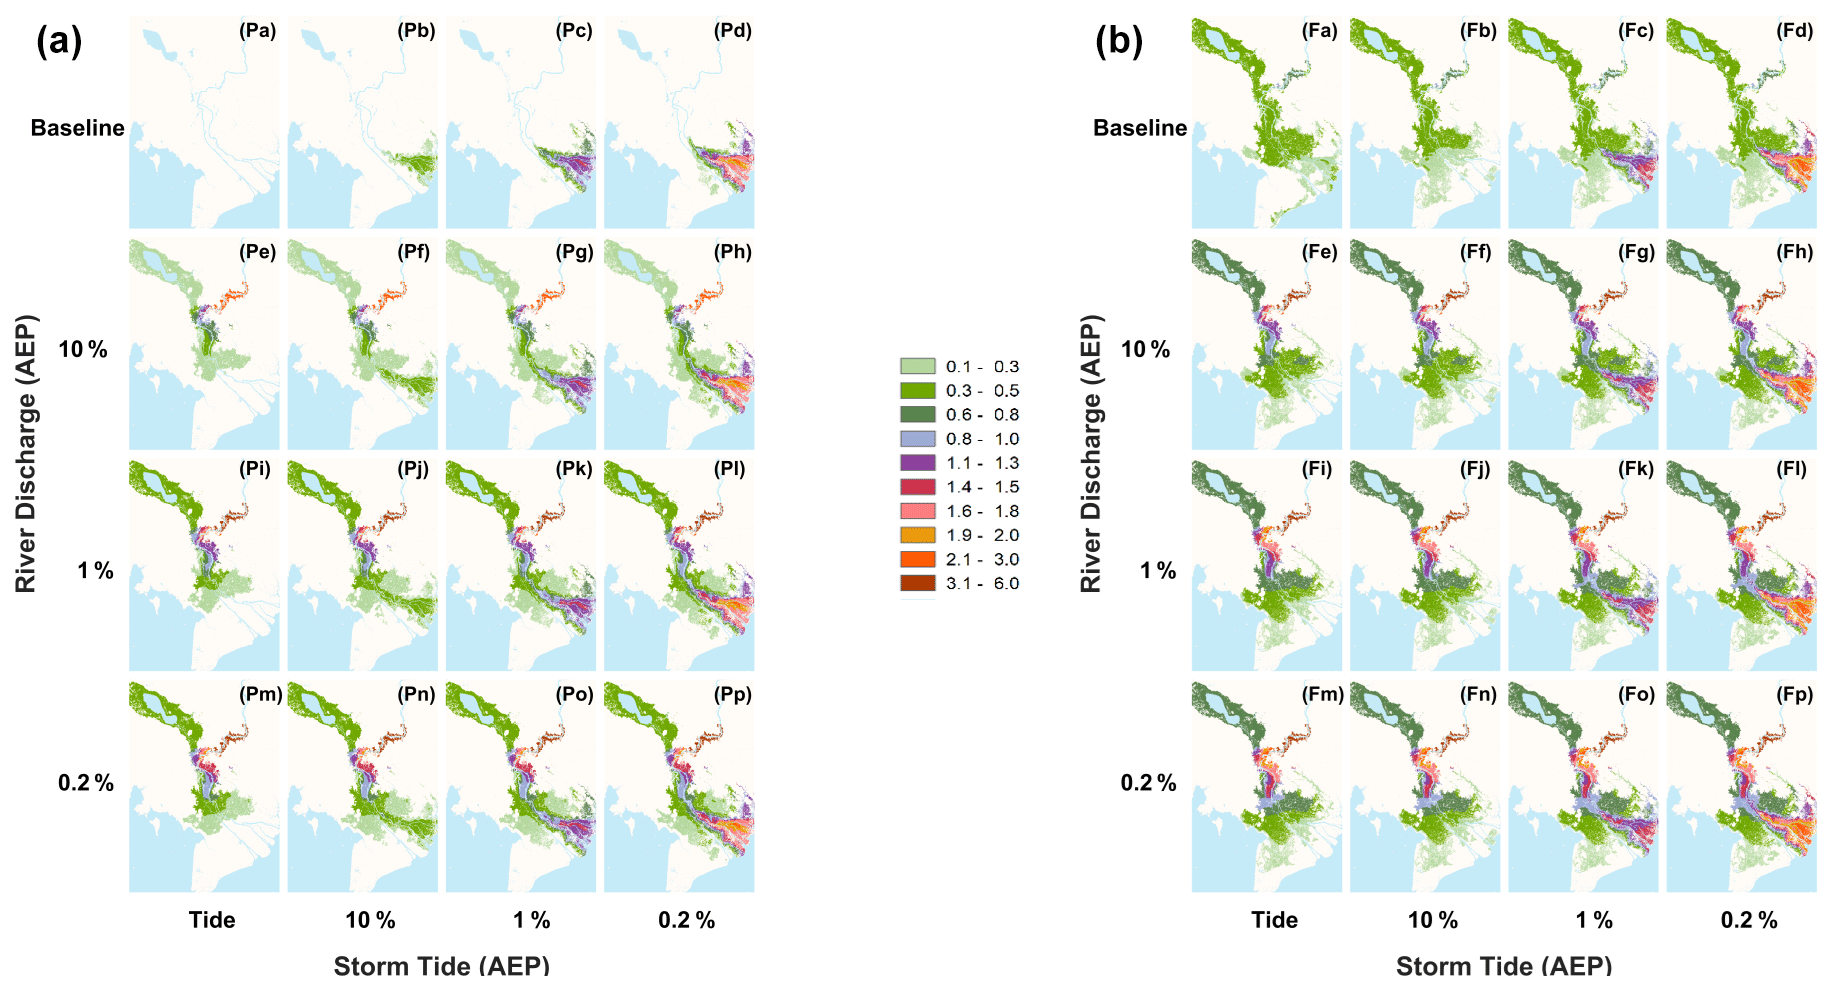
Figure 5Areas of excess flood inundation greater than 0.1 m height for various return period combinations. The depth difference ranges between 0.1 m and 6.0 m, as shown in the legend (centre). Panel (a) (Pa–Pp) shows excess flooding in a past–present climate (up to the year 2020), relative to the past–present baseline. Panel (b) (Fa–Fp) shows excess flooding in a future climate (up to the year 2050), relative to the past–present baseline.
Compound river and storm-tide flooding appears to restrict how river discharges exit the network, resulting in an up to 0.5 m additional depth of floodwater in the central compound zone, between the Bassac/Hau River near to Can Tho (An Giang Province) and the Plain of Reeds around Dong Thap Province. This may be due to the delta structures and canal network being optimally designed to divert excess river flows to these neighbouring locations, but it is worth noting that these areas do not normally experience spillover in single-driver flood scenarios (Fig. 5a – Pe, Pi, Pm and Pb, Pc), unless the storm tide is very large (Fig. 5a, Pd). Further, the extent of storm tide progress inland varies when there is also a river flood. This is explored more in the long-section (profile view) plot results described below. There is a ∼ 70 km long stretch of river, between around Cao Lanh and Tan Chau, where compound flood hazard appears to present a particular danger, generating an up to ∼ 1.5 m additional depth of floodwater at its most extreme (≤ 1 % AEP), in areas adjacent to the river (Fig. 5a, Ph, Pl, and Pp). However, in general, the past–present flood difference maps appear to show that river and storm tide floods are largely distinct and separate within the delta, presumably a distinction that is modulated by the delta's engineered landscape. Where mixing does occur, excess flood depths increase and spillover affects neighbouring areas.
Excess flood depths for the Mekong–Tien–Co Chien rivers, relative to the past–present baseline, are shown in profile in Fig. 6a to d. In this profile plot, the upstream extent is at Kratie (left) and downstream is the open sea (right). The top two panels show fixed coastal boundary conditions (a: no storm surge; b: 0.2 % AEP storm tide). The bottom two panels show fixed river flood conditions at Kratie (c: baseline river; d: 0.2 % AEP river flood). Solid coloured lines indicate the past–present results. At the coastline, excess past–present flood depths reach ∼ 0.25 to ∼ 1.8 m (10 % to 0.2 % AEP scenarios, respectively), and this excess is maintained ∼ 80 km inland along this stretch of river before it starts to decline. The past–present storm tide dissipates around 130 km (10 % AEP) and 175 km (0.2 % AEP) inland. At the upstream end of this Mekong reach, excess river flooding appears extensive both in height (where the Mekong River channel narrows in Cambodia) and in extent (as it is diverted into Tonle Sap and descends into the delta, as seen in Fig. 5a, Pm). We see in Fig. 6a and d that large flood discharges can increase the normal annual river water level as far down the channel as 130 km from the coast. Consequently, there is a zone in the middle where river flooding and storm tides both influence flood levels, between ∼ 130 to ∼ 180 km inland (between Sa Dec and Thanh Binh). When both river and storm tide occur together, we see that the maximum heights of the storm tides are somewhat pushed downstream towards the coastline. However, Fig. 6a and d together show that behind this, river flooding elevates flood levels in this same mixing region by ∼ 0.2 m.
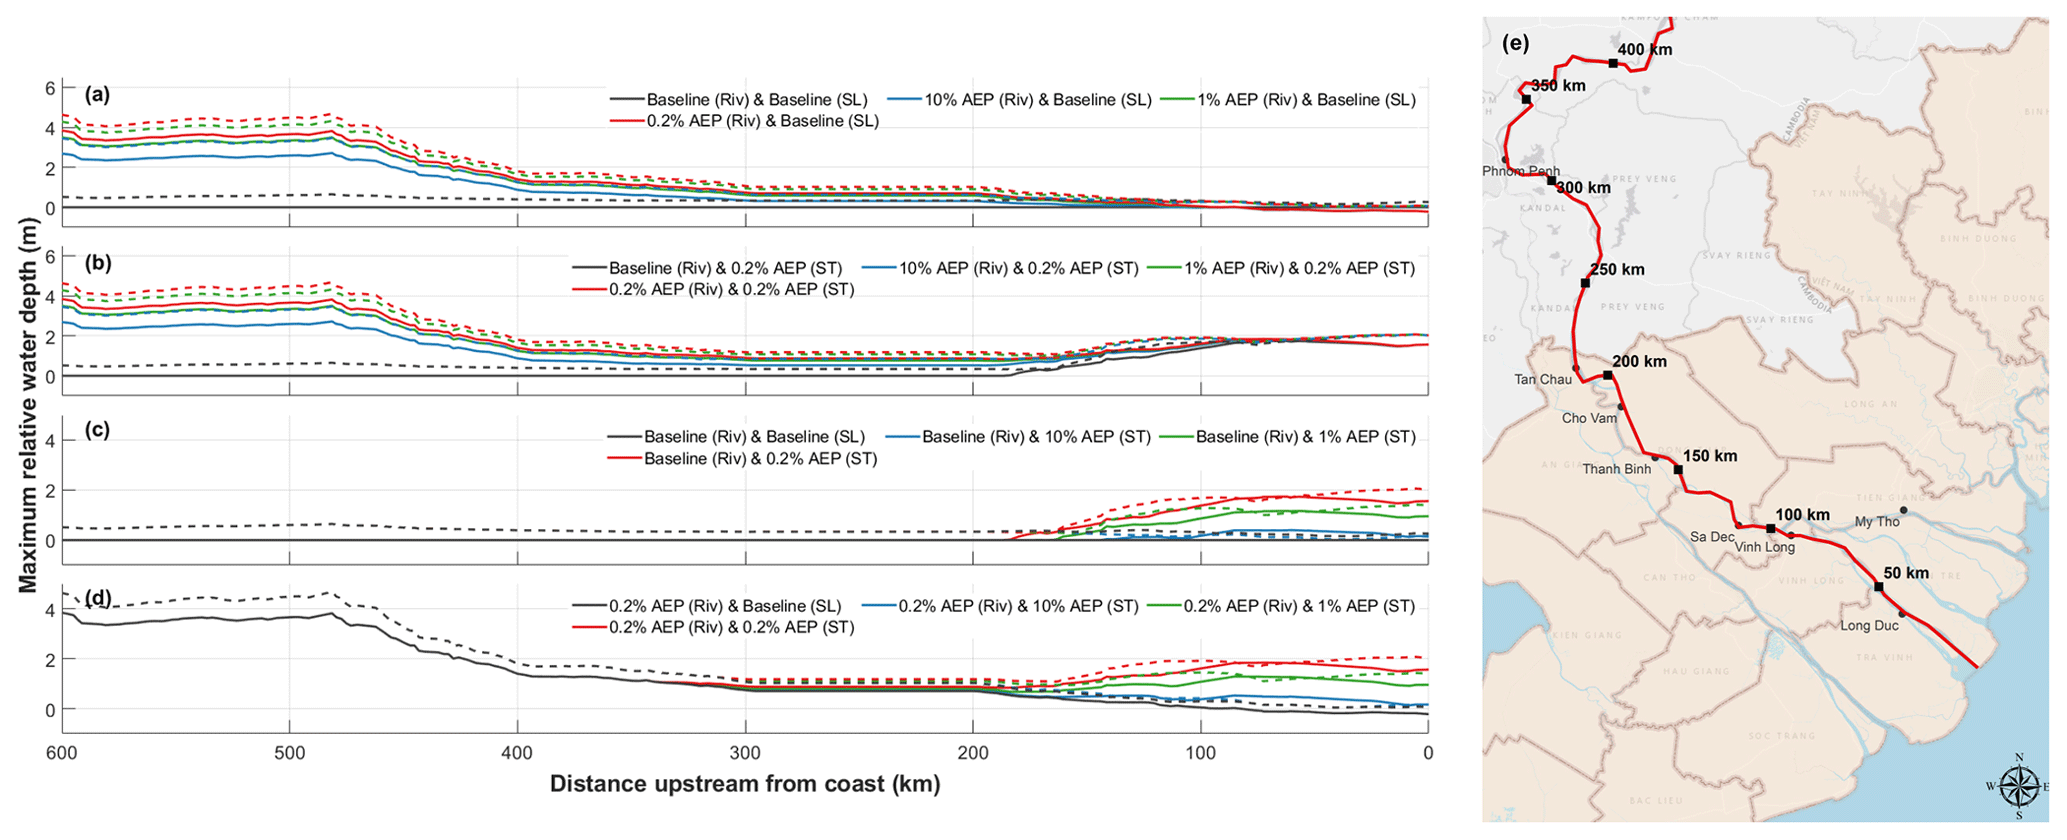
Figure 6(a–d) Profile view of the relative flood depth within the Mekong–Tien–Co Chien rivers for past–present (solid line) and future (dashed line) climates. The coastline is on the right side (0 km from the coast) and Kratie is on the left (∼ 600 km inland along this river line). Abbreviations: Riv, river; ST, storm tide; Baseline (SL), tide-only simulations. The future results include 0.25 m additional sea-level rise (SLR) at the coastline. Flood depths are relative to the past–present median river and tide-only simulation. The panels show (a) median, 10 %, 1 %, and 0.2 % AEP return period river discharges vs. tide-only simulation (no surge); (b) median, 10 %, 1 %, and 0.2 % AEP return period river discharges vs. 0.2 % AEP storm tides; (c) fixed median discharges in the river vs. median, 10 %, 1 %, and 0.2 % AEP return period storm tides; (d) fixed 0.2 % AEP return period river discharges vs. median, 10 %, 1 %, and 0.2 % AEP return period storm tides; and (e) the Mekong–Tien–Co Chien river line (in red), from 0 km at the coastline to 400 km inland.
The area of excess flooding (in km2) above baseline conditions is listed in Table 6 for each of the 49 past–present scenarios. A colour scale indicates the scenarios with the greatest difference in area away from the past–present baseline: green indicates a small change and red indicates a greater change in area. As expected, the areas of flood excess area increase with increasing flood magnitudes. The greatest flood area gains occur when the comparatively dry delta begins to fill with diverted river discharges. The system is of course designed to disperse these river flows efficiently, but gains in extent are added irregularly, which is symptomatic of a managed system. Sluice gates and weirs are designed to divert flows once a water level is reached. Zones flood as the storage becomes available, depending on topography.
Table 6The area in square kilometres of excess flooding above the past–present baseline – for (left) past–present scenarios up to the year 2020 and (right) future scenarios up to the year 2050. Cells are coloured by percentage full, relative to maximum flood extent, with green indicating the least flood area occupied and dark red indicating maximum (100 %) flooded area in our set-up.
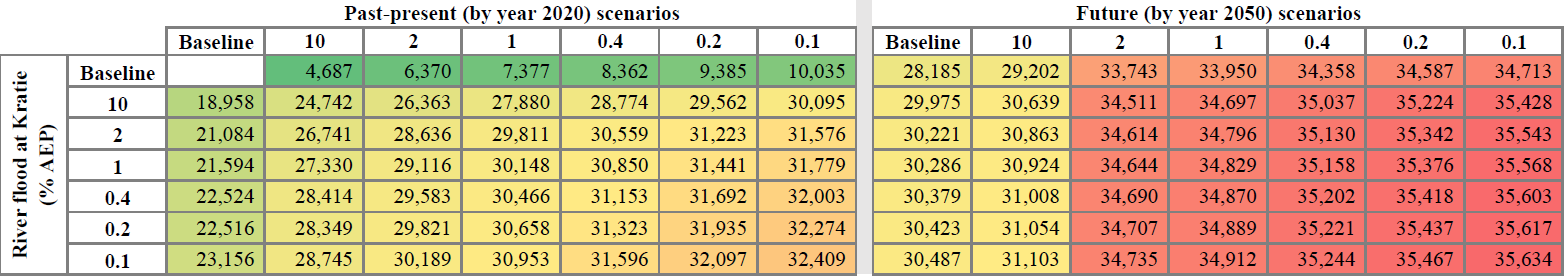
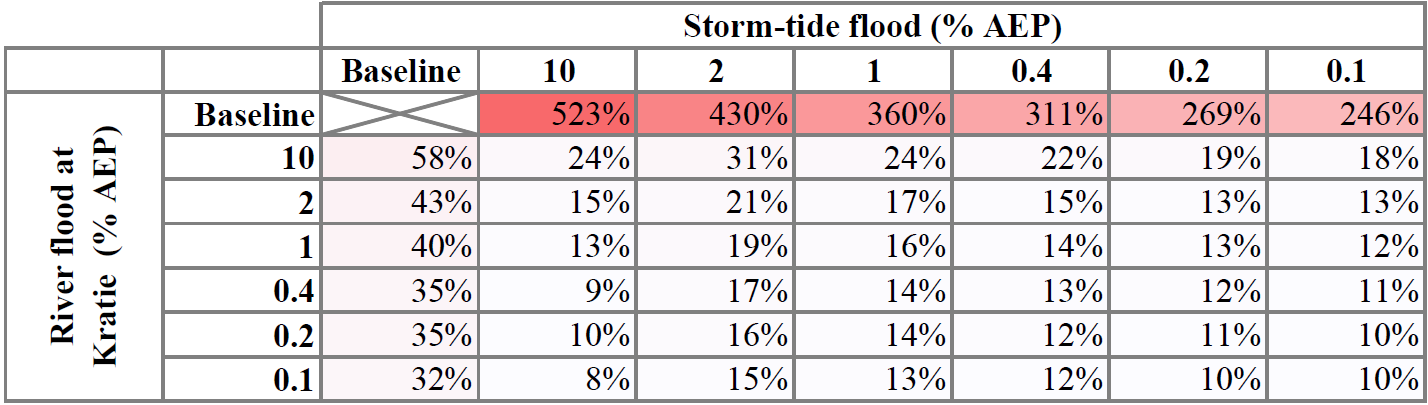
Table 7The percentage increase in the excess flood area (km2) between 2020 and 2050. Cells are coloured as a percentage of maximum excess flood area. The darker the red, the greater the excess flood area.
The duration of flood inundation in the delta, beyond a past–present baseline, is shown in Fig. 7a for select AEP scenarios (10 %, 1 %, and 0.2 %). Again, the y axis shows river flood magnitude scenarios and the x axis shows storm-tide magnitude scenarios. Blue and pink colours indicate extra days, totalling up to 3 weeks. At the other extreme, flood durations of up to 2 months are given by brown and yellow colours. The past–present results show that river flooding in the Cambodian (upper) Mekong River delta tends to flood for longer as the magnitude of river flooding increases. The river flood hydrograph had a duration of approximately 2 weeks (Fig. 3) in our simulation. In the canalised Vietnamese (lower) delta, flooding is distributed. Any direct or indirect (compound) flood impacts inland are contained to the channel or diverted, within short time periods (1–5 d). Flooding related to storm-tide events at the coast only lasts ∼ 2 d, as expected given the coastal boundary conditions (see Fig. 4).
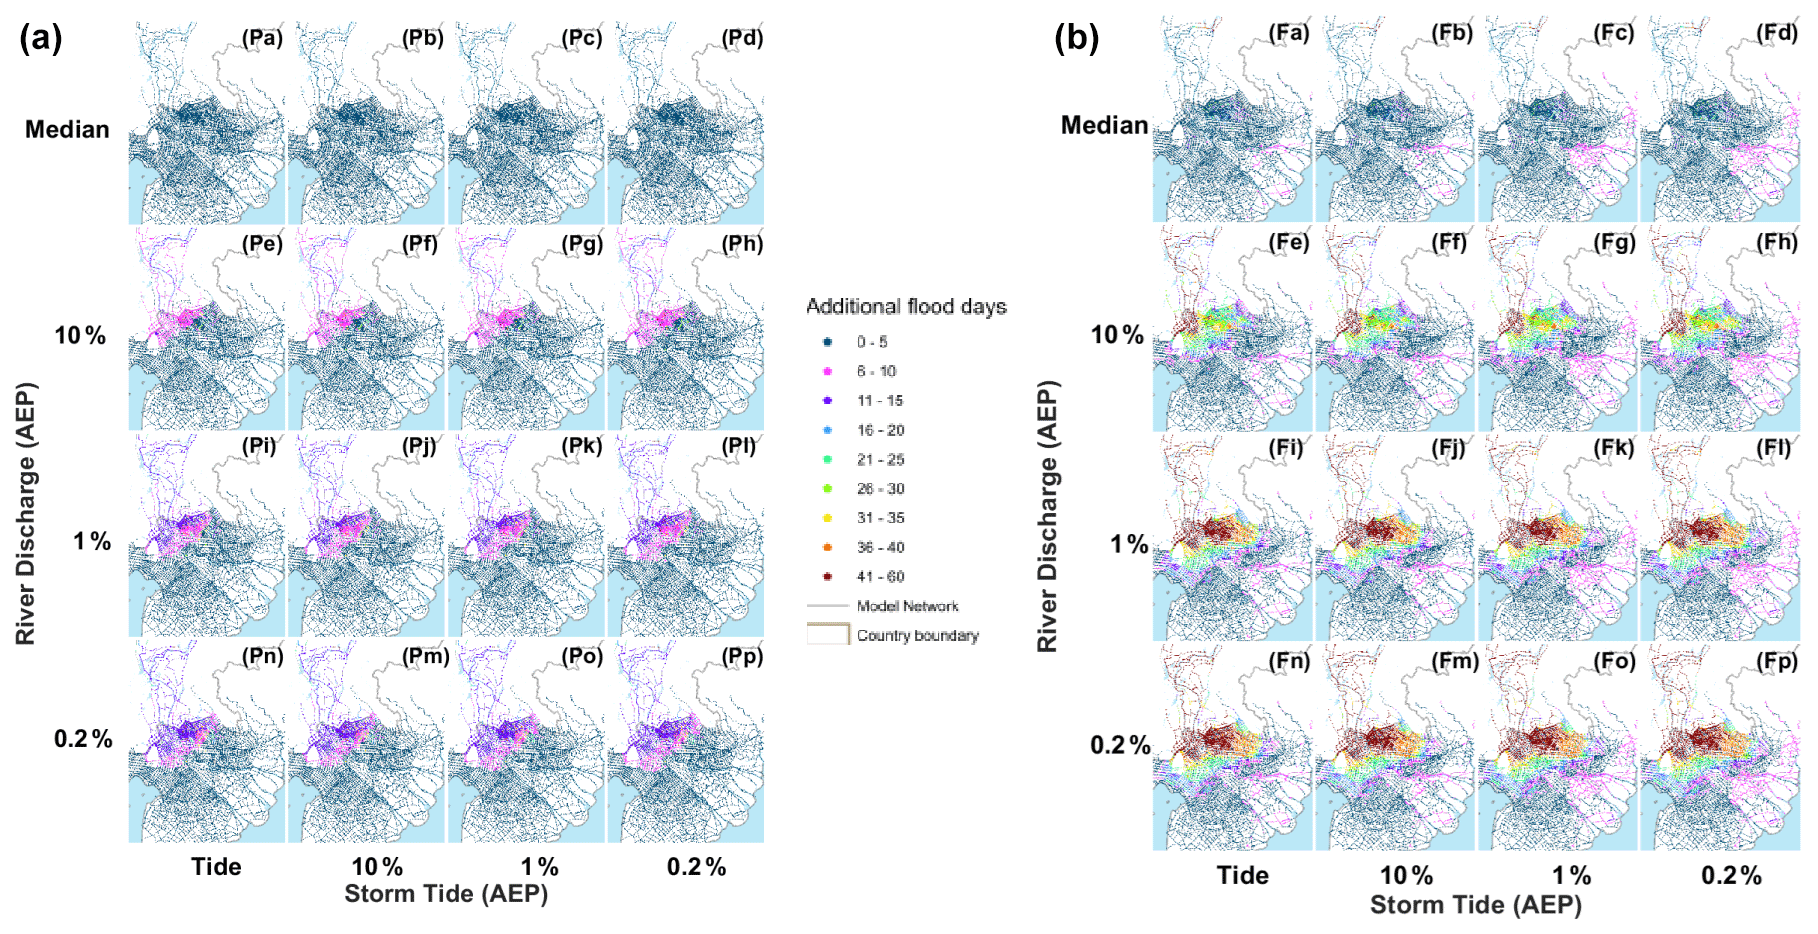
Figure 7Number of days that flood depths are over 0.5 m higher than the past–present baseline (Pa), measured between 10 August and 29 September, for the years 2020 (a, Pa–Pp) and 2050 (b, Fa–Fp).
5.2 Contrasting past–present and future compound flood risk
Building on our assessment of past–present compound flood characteristics in the delta, our second objective is to explore how compound flooding will change over time (up to 2050) due to a projected high-emission (SSP5-8.5) climate change scenario. Areas of excess flood inundation, relative to the past–present baseline, are shown in Fig. 5b, again for select AEP scenarios (10 %, 1 %, and 0.2 %). By 2050 we see a similar pattern to the past–present state in that river and storm-tide flooding are mostly separate processes within the delta. However, sea-level rise (0.25 m in this scenario) clearly impacts the subsequent excess depth of floodwaters during the storm-tide event. More of the lower delta (centred on Point 4) now has a substantial depth of extra floodwater (1.5–2.0 m). The area covered by a 1 % AEP storm-tide flood (matched with a baseline river flood) in the past–present simulation is 7377 km2, and in the future simulation it is ∼ 33 950 km2 (a 4.6-fold bigger area). Where, in the past–present, excess flood depths of ∼ 1.5 m in the middle delta would only be projected during the most extreme 0.2 % AEP storm surge (Fig. 5a, Pd, Ph, Pl, and Pp), by 2050 this extra depth of flooding can be seen even during 1 % AEP scenarios and especially where river flooding occurs at the same time (Fig. 5b, Fg, Fk, and Fo).
Similarly, future increased river discharges still flood the wider floodplains around Tonle Sap and upper delta regions around the Cambodia–Vietnam border. In these wide and shallow floodplain areas, in all scenarios, the flood depth difference increases by ∼ 0.25 m in the future (from around 0.1–0.5 to around 0.3–0.8 m). In some locations, future excess flood depths may reach 0.6–1.0 m for the first time, and such depths may occur more often, as they are to be found in the more likely river flood event scenarios (the 10 % AEP flood; Fig. 5b, Fe, Ff, Fg, and Fh). Surprisingly, future storm tides of 10 % AEP (Fig. 5b, Fb, Ff, Fj, and Fn) with sea-level rise (SLR) are not seen to flood the coastline to any substantial additional depth relative to the past–present baseline. This may be a response of the (present-state) model to permanently higher future mean sea levels, triggering flood defence/redistribution action, but further investigation is warranted.
The profile of excess future flooding, relative to the past–present baseline, is shown in Fig. 6 (dashed lines). At the coastline we see a sustained higher storm-tide excess flood height in larger-magnitude storm tides that persists for ∼ 40 km further inland than we see today (Fig. 6d, e). At the upstream river boundary, increases in future flows elevate flood levels by ∼ 0.8 m between the Kratie station and the Cambodia–Vietnam border at ∼450 km inland. When there is compound flooding (Fig. 6b, d), there is a ∼ 70 km long stretch of river, between around Sa Dec and Tan Chau, where compound flood hazard appears to present a particular danger, in the most extreme case generating an up to ∼ 1.5 m additional depth of floodwater in areas close to the Mekong–Tien–Co Chien channel (Fig. 5a, Ph, Pl, and Pp).
The areas of excess flooding (in km2), for each of the proposed 49 future scenarios relative to the past–present baseline, are listed in Table 6. Table 7 shows the percentage increase in flood areas between the past–present and future scenarios. There is a marked increase in the excess flood area extent between the past–present and future scenarios. For example, around the year 2050 the flood extent linked to a 10 % AEP river flood combined with a 1 % AEP storm tide is around 24 % bigger than the same event today. In these future scenarios, excess floodwater is diverted towards parts of the lower delta that had been previously unflooded. The south-west of the delta, around Hau Giang, Kien Giang, and Bac Lieu provinces, experiences up to an extra 0.5 m depth of flooding in the future scenarios. The area calculations in Table 6 show that annual flood probabilities are also likely to occur with more frequency. For example, the additional flood area resulting from a combined low-probability 0.4 % AEP (1-in-250-year) storm tide with a 1 % AEP (1-in-100-year) river flood in a past–present climate is projected to result from something like a 10 % AEP (1-in-10-year) more likely river flood with a 2 % AEP (1-in-50-year) storm tide in the future.
Additional days of flood inundation in the future, relative to the past–present baseline, are shown in Fig. 7b. Results show that the major waterways of the lower delta around the coastline could, in the future, have up to 10 extra days of inundation due to the combination of SLR and storm tides, but increasing storm-tide magnitude does not widen the coastal region affected. Floodwaters are largely contained to the area east of the Bassac/Hau River, but there are a greater number of reaches which would transition from 0–5 to 6–10 d as a result of such flooding (compare Fig. 7a, Po, with Fig. 7b, Fo, for example). By contrast, the future Mekong Delta is greatly affected by the increased river discharges in the upper delta zone around the Cambodia–Vietnam border. This area would have 0–15 d of additional flooding in only the median river flood scenario (Fig. 7b, Fa) due to increases in river flow as a result of climate change. This area today is the zone most likely to retain current floodwaters during a major flood in the Mekong Delta. In the future 10 % AEP scenario (all storm tides), the duration of flooding increases to 6 d to months more, depending on the proximity to the main channel. Under the more extreme 0.2 % AEP river flood, a large proportion of this area would be flooded for months longer than it is today.
5.3 Compound flood areas
Our third and final objective is to assess which regions of the delta are river, coastal, or compound flood dominated and how this might change in the future with climate change. Maps of the compound ratio (Cr) are shown in Fig. 8a (past–present) and Fig. 8b (future) for select (10 %, 1 %, and 0.2 % AEP combinations) return period scenarios. The red zones are river-dominant (i.e. they have a Cr value of 0.8–1.0 when compared to a river-only flood scenario), blue zones are storm-tide-dominant (i.e. a Cr value of 0.8–1.0 when compared to a surge-tide-only flood scenario), and yellow areas indicate compound flooding regions (Cr value of 0–0.8).
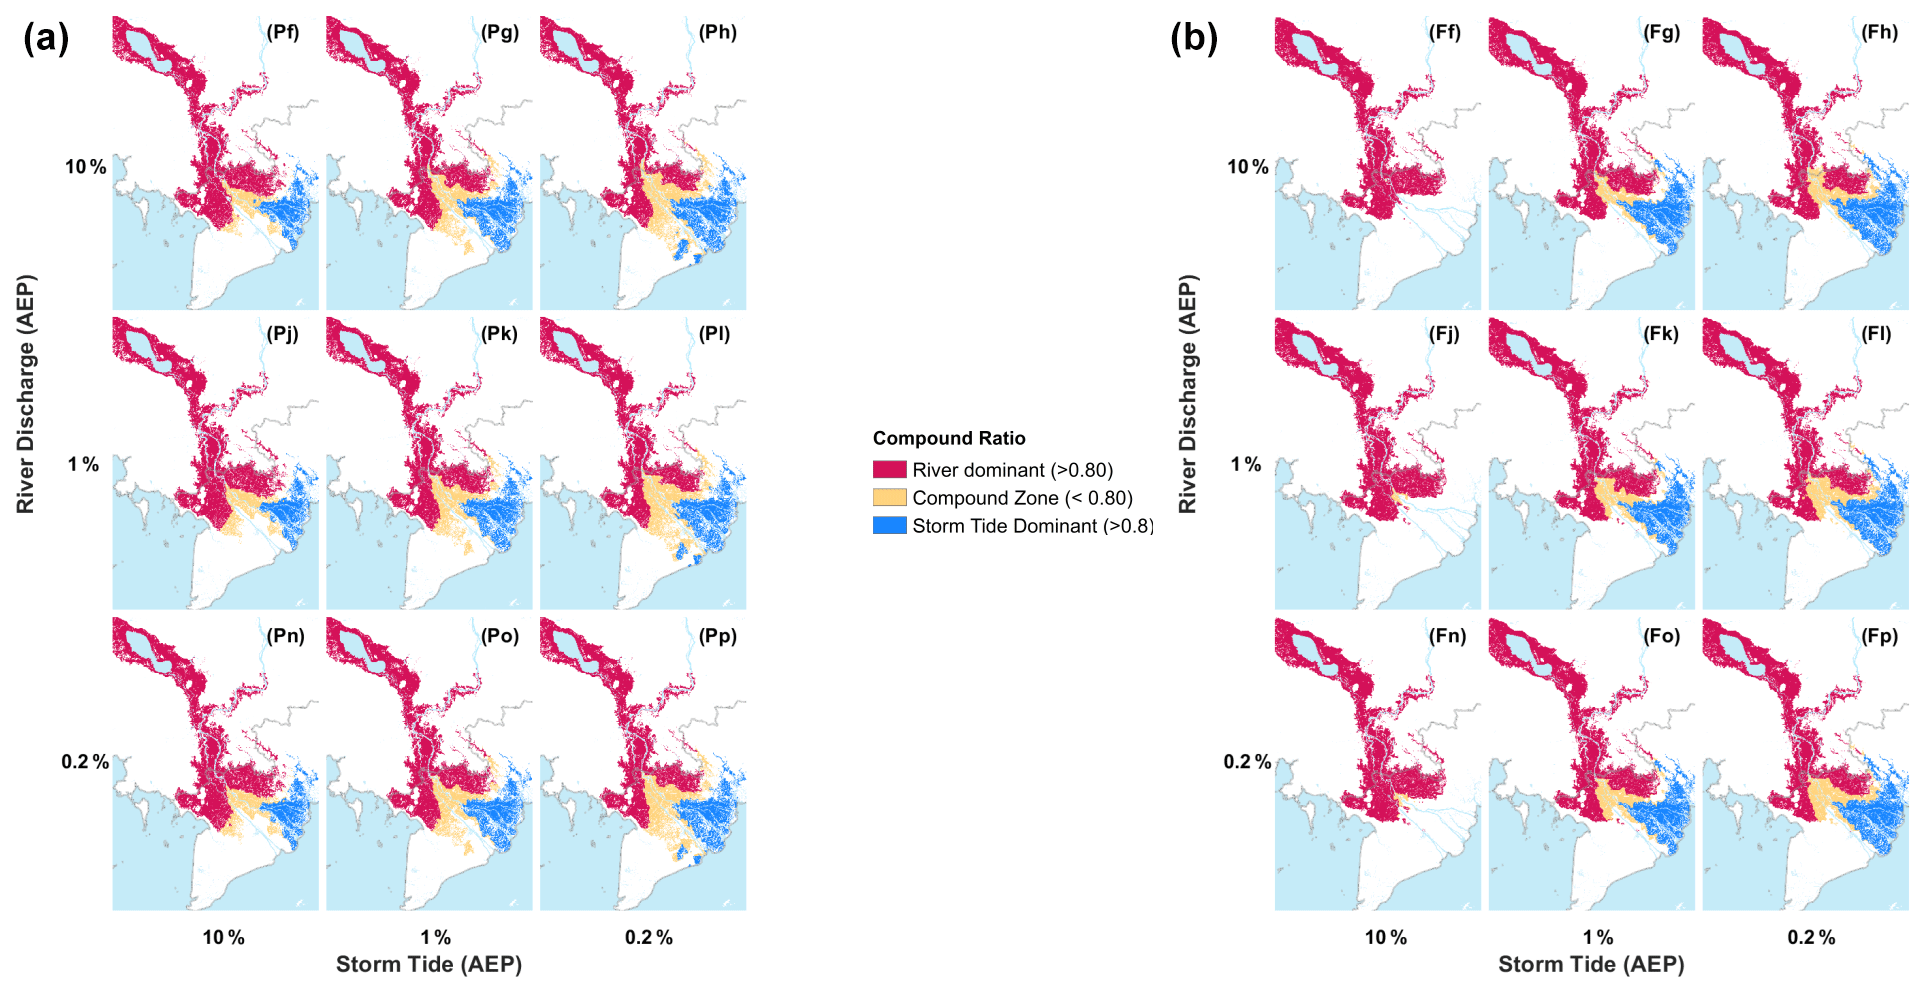
Figure 8Compound ratio for the 10 %, 1 %, and 0.2 % combination of events, illustrating the relative dominance of river vs. storm tide flood processes within the domain for past–present (a, Pf–Pp) and future (b, Ff–Fp) scenarios.
Figure 8 highlights the tension between the two flood drivers during a compound flood event. Clearly, river flooding is a major driver within the delta. The river-dominant red zone is large in all scenarios, illustrating not only river dominance but also areas of natural flood storage and retention. As the magnitude of river flooding increases in the past–present delta (e.g. opposing a comparatively small-magnitude 10 % AEP storm tide; Fig. 8a, Pf, Pj, and Pn), flood extents barely grow due to the highly engineered system for capture and redistribution. However if normal discharge routes into the sea become temporarily inaccessible due to a larger storm tide (Fig. 8a, Ph, Pl, and Pp), this discharge turns inward, spreading out into the lower delta and towards the Bassac River. This new flood extent is largely composed of compound floodwaters. The push and pull between the two flood drivers can also be seen with the movement of the compound zone: seawards as river-dominant waters increase in magnitude (contrast Fig. 8a, Ph, with Fig. 8a, Pn) and inland/upstream as storm tides become the dominant process (contrast Fig. 8a, Pf, with Fig. 8a, Pp).
The same effects can be observed in the future results (Fig. 8b). However with greater flood volumes in the future and projected higher storm tides at the coast by the year 2050, the compound zone is smaller, being squeezed with less apparent mixing. The areas of river or storm-tide dominance appear greater in the future too (e.g. contrast the red 1 % AEP river floods and blue 1 % AEP storm-tide floods of Fig. 8a, Pk, with Fig. 8b, Fk). However there is also less apparent spillover into the central/Bassac River regions when a storm-tide blocks egress of river floodwaters in the future. Of additional note is the model response to the future 10 % AEP storm tide (Fig. 8b, Ff, Fj, and Fn), where no blue-zone storm-tide-dominant waters are seen. Figure 5a (Pb; past–present) and b (Fb; future), together with the profile plots of Fig. 6c and d, tell us that the 10 % AEP storm tide is very close to baseline levels, particularly at the coastline. Accordingly, the reason why this occurs could be that the settings of the past–present flood defences in the model effectively mitigate the 10 % AEP flood in the future delta (i.e. flood gates are triggered early because climate change adds an additional 0.25 m to sea levels through the entire simulation) and/or the subtleties of the 10 % AEP storm tide are missed in our approach to mapping flood extents. More detailed modelling may be useful for clarification.
Results show that fluvial flooding in the Mekong River delta, coinciding with a storm tide at the coast, brings the effects of compound flooding to central regions of the Vietnamese lower delta, where the highly engineered network of dykes, flood gates, and weirs can efficiently divert floodwaters above the 0.5 m (summer dykes) to ∼ 4 m (winter dykes) thresholds, into compartments of rice paddies and fisheries, and redistribute the unwanted volumes into the sea. However, in our test, we found that storm tides act to oppose normal egress of high Mekong River flows around the struck coastline; thus compound flooding disrupts normal flood rerouting processes within some parts of the delta. Due to this temporary (< 2 d) block, greater depth of flooding is observed upstream (1–6 m extra depth of flooding in the narrow channels between Kratie and Phnom Penh) in river-dominant zones, and as much as an extra 3 m depth of flooding can occur in storm-tide-dominant zones at the coastline (∼ 100 km wide and, under 0.2 % AEP flood conditions, up to ∼ 160 km inland). The travel speed of TCs making landfall is also of significance in this context because slower-moving TCs will increase the risk of compound flooding. The transport speed of the TC making landfall in our model was an average from the 10 events at Point 4 (Sect. 4.2). However for slower-than-average TCs, associated storm surges would last for longer, as would the period of intense TC-linked rainfall.
The combination of TC-linked precipitation regionally with storm tides on Vietnam's eastern coastline creates compound flooding in the main Mekong–Tien–Co Chien channel that spills into adjacent land: south-westwards around the Bassac/Hau River near to Can Tho (An Giang Province), and north-eastwards towards the Plain of Reeds (Dong Thap Province). This compound zone extends along a ∼ 50 to ∼ 80 km section of the upper and middle delta, up to the Cambodia–Vietnam border, although the area covered varies with flood driver magnitude (e.g. a 10 % AEP river flood combined with a 2 % AEP storm surge would flood an extra ∼ 26 300 km2 of land above 0.1 m). Clearly, many Vietnam wards and communes in the central region are vulnerable to experiencing new, or greater, depths of flooding relative to the good flood welcomed by farmers annually because of compound flooding linked to TC activity. Compound flood risk, particularly that associated with TC activity, is not something customarily included within regional and local emergency and flood management plans for this area, despite the projected consequences for inhabitants of these central areas and for national food supply and security. However, strengthening resilience against climate risks, such as extreme flooding, is a regional priority for those managing the wider basin (Basin Development Strategy and MRC Strategic Plan; Mekong River Commission, 2021). The current plans largely benefit urban centres and high-value agricultural land in the mid-delta, such as around Can Tho, through flood defence upgrades (levees, tidal barriers, engineered systems).
Our results tells us that compound flooding in the future Mekong River delta will produce floods of greater magnitude that last longer and thus produce greater flood depths with more frequency than today. A greater area of the lower delta will be flooded overall, even for smaller-magnitude compound events (a 1 % AEP storm tide with a 1 % AEP river flood scenario today is equivalent to a baseline flood by year 2050). In our model set-up, south-western parts of the delta, around Hau Giang, Kien Giang, and Bac Lieu provinces, are projected to flood in the future delta. Assuming that the population of Vietnam continues to grow, by the year 2050 more people will be impacted by compound flooding more often. If more land area becomes inundated (even for low-category storms), then unless the flood risk can be effectively and fully mitigated, flood managers in the Mekong River delta may have to consider flood resilience as standard for homes, infrastructure, and future agriculture in plans beyond 2030. If compound flooding is not unequivocally included within future strategic plans for the Mekong River delta beyond 2030, a rethink may be required. That rethink could focus on particular risks from compound flooding such as (i) overtopping of existing flood defences (river and sea dykes) and flood storage availability; (ii) the likelihood of compound flood inundation to new areas of the delta that are potentially not as fully protected as other flood-prone regions and implications for their inhabitants; (iii) protecting high-value land and implications of future flooding for future land use needs; (iv) in a sinking delta, what options are available to remove or relocate excess floodwaters; (v) consideration of compound flood duration and the implications of this directly for local health (e.g. sanitation, drinking water), social welfare, livelihoods, transport infrastructure, and industrial systems; (vi) the likely future demographics and the implications of these by age and distribution; and finally (vii) how compound flooding may alter current and future flood evacuation plans.
The overall aim of this paper was to better understand the issue of compound river and storm-tide flooding in the Mekong River delta as a result of plausible TC activity and how it changes over time, through the use of a detailed 1D MIKE 11 river model updated with recent survey data. We simulated one specific scenario of a TC striking close to the Co Chien River distributary of the Mekong River. Our results show that compound flooding is markedly different from single-driver flooding in the delta. In the present climate, compound floods produce greater depth of flooding, and floods travel into new areas of the delta if unmanaged (e.g. a modest 10 % AEP river flood combined with a 2 % AEP storm surge at the Mekong River mouth would flood an extra ∼ 26 300 km2 of land above 0.1 m). We identified an active compound zone within the central area of the Mekong River delta that is a mixture of storm-tide flooding and river flooding, and it changes shape and shifts depending on the magnitude of our two flood drivers.
By 2050 (SSP5-8.5 projections), sea-level rise will further exacerbate the compound hazard because a greater volume of water entering the delta will more quickly fill available flood storage areas, and storm tides will begin at greater height. Our results suggest that, compared to today, future compound flooding will increase in magnitude, duration, and frequency in the Mekong River delta. A future delta with compound flooding that lasts longer in parts and is likely to flood at higher levels more often has important implications for how the future delta is managed and for the status of flood defences, standards, and storage today. The complexity of compound flooding is an important consideration for deltas beyond the Mekong River delta, specifically those in Asian and African regions subject to a changing atmospheric climate over the coming decades. Any flood managers responsible for deltas in tropical and sub-tropical zones need to be aware of the extra hazards associated with TC-linked flooding today and how this will change in the coming decades (Haque et al., 2022; Smajgl et al., 2015). Compound flooding not only will create a need for extra considerations regarding flood defences, thresholds, and flood detention/storage options, but also has implications for plans and policies relating to future land use, economic investment, population health, and access. Adaptation to this hazard is critical for the future delta. Compound flooding may be best managed with layered defences over a wider area for optimum flexibility, with an eye to both future depth of flooding and future flood durations.
There are inherent uncertainties built into our modelled results due to the series of assumptions made in the construction of future river discharges and due to future extreme sea levels based on projections for our changing climate. Future studies could explore the bounds of these uncertainties with more data or with new techniques. Additionally, there are clear socio-economic impacts from compound flooding, and future studies could explore these more widely. In our analysis, we employed a scenario assuming a worst-case scenario of a TC strike and river flood peak occurring almost concurrently on a date in the middle of the wet season. Variations in this set-up will alter model outcomes and be interesting to explore. In particular, neither the compound hazard where TCs make landfall at different locations/orientations nor the impact of compound flooding in a delta with changing morphologies due to sand mining, coastal development, or land subsidence has been explored here. These topics could also be interesting and rewarding areas of future research.
The only code we used was T_TIDE. This MATLAB code is provided by Pawlowicz et al. (2002) as referenced.
European Space Agency Copernicus GLO-30 data used to represent the Mekong Delta topography are available via the ESA Panda tool in https://panda.copernicus.eu/ (ESA, 2024).
We also used Mekong Delta FABDEM data (https://data.bris.ac.uk/data/dataset/s5hqmjcdj8yo2ibzi9b4ew3sn, University of Bristol, 2024). For more information on this dataset, see Hawker et al. (2022).
IDH conceptualised this work, designed the methodology, supervised the model design, and provided supervision in the UK. IDH was also in charge of the Comp-Flood project administration. The supervision, methodology development, and resources in Vietnam were provided by HBT and HNN, with formal data analysis carried out by QQL. MW carried out the hydrodynamic modelling simulations, conducted the formal analysis, and prepared the first draft of the manuscript. SED, NB, RM, and JJMH provided key resources for this study. All authors commented on and edited the paper prior to submission.
The contact author has declared that none of the authors has any competing interests.
Publisher's note: Copernicus Publications remains neutral with regard to jurisdictional claims made in the text, published maps, institutional affiliations, or any other geographical representation in this paper. While Copernicus Publications makes every effort to include appropriate place names, the final responsibility lies with the authors.
This work was supported by the UK Natural Environment Research Council (grant no. NE/S003150/1) and the Ministry of Science and Technology of Vietnam and National Foundation of Science and Technology Development (NAFOSTED–RCUK fund). In personal communications, Philip Minderhoud (Wageningen University) provided expert advice on the vertical datum adjustments required when working with local measurements in the Mekong River delta, and Hal Voepel (University of Southampton) and Christopher Hackney (Newcastle University) kindly shared processed river discharge data. The authors wish to acknowledge the use of the Iridis high-performance computing facility and associated support services at the University of Southampton in the completion of this work. We thank our illustration technician Kate Davis (University of Southampton) for creating key figures in this paper. At the University of Bristol, we would like to thank Laurence Hawker and Jeff Neal for sharing FABDEM data of the Mekong River delta (https://doi.org/10.1088/1748-9326/ac4d4f) (Hawker et al., 2022). FABDEM is derived from the European Space Agency's Copernicus GLO-30 DEM data (https://copernicus-dem-30m.s3.amazonaws.com/readme.html, last access: 17 October 2024). Lastly, we thank the German Aerospace Center, DLR, for sharing TanDEM-X data of the Mekong Delta, which were extremely useful in our analysis (https://tandemx-science.dlr.de/, last access: 3 April 2020, © DLR 2020).
This research has been supported by UK Research and Innovation (grant no. NE/S003150/1) and the Ministry of Science and Technology of Vietnam (NAFOSTED–RCUK).
This paper was edited by Olga Petrucci and reviewed by two anonymous referees.
Anh, L. T., Takagi, H., Thao, N. D., and Esteban, M.: Investigation of awareness of typhoon and storm surge in the Mekong Delta–Recollection of 1997 Typhoon Linda, J. Jpn. Soc. Civ. Eng. Ser. B3, 73, 168–173, 2017.
Bangalore, M., Hallegatte, S., Bonzanigo, L., Kane, T., Fay, M., Narloch, U., Treguer, D., Rozenberg, J., and Vogt-Schilb, A.: Shock Waves: Managing the Impacts of Climate Change on Poverty, Climate Change and Development, World Bank, Washington, D.C., http://hdl.handle.net/10986/22787 (last access: 18 October 2024), 2016.
Bates, P. D., Lane, S. N., and Ferguson R. I.: ations in Environmental Hydraulics, John Wiley & Sons, Ltd., ISBN 0-470-84359-4, 2005.
Bates, P. D., Quinn, N., Sampson, C., Smith, A., Wing, O., Sosa, J., Savage, J., Olcese, G., Neal, J., Schumann, G. and Giustarini, L.. Combined modeling of US fluvial, pluvial, and coastal flood hazard under current and future climates. Water Resour. Res., 57, e2020WR028673, https://doi.org/10.1029/2020WR028673, 2021.
Bevacqua, E., Maraun, D., Vousdoukas, M.I., Voukouvalas, E., Vrac, M., Mentaschi, L. and Widmann, M., Higher probability of compound flooding from precipitation and storm surge in Europe under anthropogenic climate change, Science Advances, 5, eaaw5531, https://doi.org/10.1126/sciadv.aaw5531, 2019.
Blake, E. S. and Zelinsky, D. A.: National hurricane center tropical cyclone report: Hurricane Harvey (AL092017), National Hurricane Center: Silver Spring, MD, USA, https://www.nhc.noaa.gov/data/tcr/AL092017_Harvey.pdf (last access: 16 October 2024), 2018.
Bloemendaal, N., Haigh, I. D., de Moel, H., Muis, S., Haarsma, R. J., and Aerts, J. C.: Generation of a global synthetic tropical cyclone hazard dataset using STORM, Scientific Data, 7, 40, https://doi.org/10.1038/s41597-020-0381-2, 2020.
Bloemendaal, N., de Moel, H., Martinez, A. B., Muis, S., Haigh, I. D., van der Wiel, K., Haarsma, R. J., Ward, P. J., Roberts, M. J., Dullaart, J. C., and Aerts, J. C.: A globally consistent local-scale assessment of future tropical cyclone risk, Science Advances, 8, eabm8438, https://doi.org/10.1126/sciadv.abm8438, 2022.
Brown, S. and Nicholls, R. J.: Subsidence and human influences in mega deltas: the case of the Ganges–Brahmaputra–Meghna, Sci. Total Environ., 527, 362–374, 2015.
Brown, S., Nicholls, R. J., Woodroffe, C. D., Hanson, S., Hinkel, J., Kebede, A. S., Neumann, B., and Vafeidis, A. T.: Sea-Level Rise Impacts and Responses: A Global Perspective, in: Coastal Hazards. Coastal Research Library, vol. 1000, edtied by: Finkl, C., Springer, Dordrecht, https://doi.org/10.1007/978-94-007-5234-4_5, 2013.
Camus, P., Haigh, I. D., Nasr, A. A., Wahl, T., Darby, S. E., and Nicholls, R. J.: Regional analysis of multivariate compound coastal flooding potential around Europe and environs: sensitivity analysis and spatial patterns, Nat. Hazards Earth Syst. Sci., 21, 2021–2040, https://doi.org/10.5194/nhess-21-2021-2021, 2021.
Calafat, F. M., Wahl, T., Tadesse, M. G., and Sparrow, S. N.: Trends in Europe storm surge extremes match the rate of sea-level rise, Nature, 603, 841–845, 2022.
Chambers, K. A., Husain, I., Chathampally, Y., Vierling, A., Cardenas-Turanzas, M., Cardenas, F., Sharma, K., Prater, S., and Rogg, J.: Impact of Hurricane Harvey on healthcare utilization and emergency department operations, Western Journal of Emergency Medicine, 21, 586, https://doi.org/10.5811/westjem.2020.1.41055, 2020.
Collins, M., Sutherland, M., Bouwer, L., Cheong, S.-M., Frölicher, T., Jacot Des Combes, H., Koll Roxy, M., Losada, I., McInnes, K., Ratter, B., Rivera-Arriaga, E., Susanto, R. D., Swingedouw, D., and Tibig, L.: Extremes, Abrupt Changes and Managing Risk, in: IPCC Special Report on the Ocean and Cryosphere in a Changing Climate, edited by: Pörtner, H.-O., Roberts, D. C., Masson-Delmotte, V., Zhai, P., Tignor, M., Poloczanska, E., Mintenbeck, K., Alegría, A., Nicolai, M., Okem, A., Petzold, J., Rama, B., and Weyer, N. M., Cambridge University Press, 589–655, ISBN 9781009157964, https://doi.org/10.1017/9781009157964.008, 2019.
Couasnon, A., Eilander, D., Muis, S., Veldkamp, T. I. E., Haigh, I. D., Wahl, T., Winsemius, H. C., and Ward, P. J.: Measuring compound flood potential from river discharge and storm surge extremes at the global scale, Nat. Hazards Earth Syst. Sci., 20, 489–504, https://doi.org/10.5194/nhess-20-489-2020, 2020.
Dasgupta, S., Laplante, B., Meisner, C., Wheeler, D., and Yan, J.: The impact of sea level rise on developing countries: a comparative analysis, Climatic Change, 93, 379–388, https://doi.org/10.1007/s10584-008-9499-5, 2009.
Day, J. W., Agboola, J., Chen, Z., D'Elia, C., Forbes, D. L., Giosan, L., Kemp, P., Kuenzer, C., Lane, R. R., Ramachandran, R., and Syvitski, J.: Approaches to defining deltaic sustainability in the 21st century. Estuar. Coast. Shelf S., 183, 275–291, 2016.
DHI: 1D-DHI Simulation Engine for 1D River and Urban Modelling-Reference Manual, https://manuals.mikepoweredbydhi.help/latest/Water_Resources/MIKE_1D_reference.pdf (last access: 17 October 2024), 2017.
Du, T. L., Lee, H., Bui, D. D., Arheimer, B., Li, H. Y., Olsson, J., Darby, S. E., Sheffield, J., Kim, D., and Hwang, E.: Streamflow prediction in “geopolitically ungauged” basins using satellite observations and regionalization at subcontinental scale, J. Hydrol., 588, 125016, https://doi.org/10.1016/j.jhydrol.2020.125016, 2020.
Du, T. L., Lee, H., Bui, D. D., Graham, L. P., Darby, S. D., Pechlivanidis, I. G., Leyland, J., Biswas, N. K., Choi, G., Batelaan, O., and Bui, T. T.: Streamflow Prediction in Highly Regulated, Transboundary Watersheds Using Multi-Basin Modeling and Remote Sensing Imagery, Water Resour. Res., 58, e2021WR031191, https://doi.org/10.1029/2021WR031191, 2022.
Dun, O.: Migration and displacement triggered by floods in the Mekong Delta, Int. Migr., 49, e200–e223, 2011.
Dung, N. V. and Thang, T. D.: Establishment of a large scale hydrodynamic model for modelling floods in the Mekong Delta using MIKE 11, SIWRR–Southern Institute of Water Resour. Res. Ho Chi Minh City, 2007.
Dung, N. V., Merz, B., Bárdossy, A., Thang, T. D., and Apel, H.: Multi-objective automatic calibration of hydrodynamic models utilizing inundation maps and gauge data, Hydrol. Earth Syst. Sci., 15, 1339–1354, https://doi.org/10.5194/hess-15-1339-2011, 2011.
Edmonds, D. A., Caldwell, R. L., Brondizio, E. S., and Siani, S. M.: Coastal flooding will disproportionately impact people on river deltas, Nat. Commun., 11, 4741, https://doi.org/10.1038/s41467-020-18531-4, 2020.
Eilander, D., Couasnon, A., Ikeuchi, H., Muis, S., Yamazaki, D., Winsemius, H. C., and Ward, P. J.: The effect of surge on riverine flood hazard and impact in deltas globally, Environ. Res. Lett., 15, 104007, https://doi.org/10.1088/1748-9326/ab8ca6, 2020.
Eilander, D., Couasnon, A., Leijnse, T., Ikeuchi, H., Yamazaki, D., Muis, S., Dullaart, J., Haag, A., Winsemius, H. C., and Ward, P. J.: A globally applicable framework for compound flood hazard modeling, Nat. Hazards Earth Syst. Sci., 23, 823–846, https://doi.org/10.5194/nhess-23-823-2023, 2023.
Emanuel, K.: Response of global tropical cyclone activity to increasing CO2: Results from downscaling CMIP6 models, J. Climate, 34, 57–70, 2021.
ESA: Copernicus GLO-30 DEM dataset, https://panda.copernicus.eu/ (last access: 21 October 2024), 2024.
Fox-Kemper, B., Hewitt, H. T., Xiao, C., Aðalgeirsdóttir, G., Drijfhout, S. S., Edwards, T. L., Golledge, N. R., Hemer, M., Kopp, R. E., Krinner, G., Mix, A., Notz, D., Nowicki, S., Nurhati, I. S., Ruiz, L., Sallée, J.-B., Slangen, A. B. A., and Yu, Y.: Ocean, Cryosphere and Sea Level Change, in: Climate Change 2021: The Physical Science Basis, Contribution of Working Group I to the Sixth Assessment Report of the Intergovernmental Panel on Climate Change, edited by: Masson-Delmotte, V., Zhai, P., Pirani, A., Connors, S. L., Péan, C., Berger, S., Caud, N., Chen, Y., Goldfarb, L., Gomis, M. I., Huang, M., Leitzell, K., Lonnoy, E., Matthews, J. B. R., Maycock, T. K., Waterfield, T., Yelekçi, O., Yu, R., and Zhou, B.:,Cambridge University Press,Cambridge, UK and New York, NY, USA, 1211–1362, https://doi.org/10.1017/9781009157896.011, 2021.
Green, J., Haigh, I., Quinn, N., Neal, J., Wahl, T., Wood, M., Eilander, D., de Ruiter, M., Ward, P., and Camus, P.: Review Article: A Comprehensive Review of Compound Flooding Literature with a Focus on Coastal and Estuarine Regions, EGUsphere [preprint], https://doi.org/10.5194/egusphere-2024-2247, 2024.
GSO (General Statistics Office of Vietnam): https://www.gso.gov.vn/en/population, last access: 24 March 2024.
Guo, S. L.: A discussion on unbiased plotting positions for the general extreme value distribution, J. Hydrol., 121, 33–44, https://doi.org/10.1016/0022-1694(90)90224-L, 1990.
Hak, D., Nadaoka, K., Bernado, L. P., Le Phu, V., Quan, N. H., Toan, T. Q., Trung, N. H., Van Ni, D., and Van, P. D. T.: Spatio-temporal variations of sea level around the Mekong Delta: their causes and consequences on the coastal environment, Hydrological Research Letters, 10, 60–66, 2016.
Haque, A., Haider, D., Rahman, M. S., Kabir, L., and Lejano, R. P.: Building Resilience from the Grassroots: The Cyclone Preparedness Programme at 50, Int. J. Env. Res. Pub. He., 19, 14503, https://doi.org/10.3390/ijerph192114503, 2022.
Hawker, L., Uhe, P., Paulo, L., Sosa, J., Savage, J., Sampson, C., and Neal, J.: A 30 m global map of elevation with forests and buildings removed, Environ. Res. Lett., 17, 024016, https://doi.org/10.1088/1748-9326/ac4d4f, 2022.
Hirabayashi, Y., Mahendran, R., Koirala, S., Konoshima, L., Yamazaki, D., Watanabe, S., Kim, H., and Kanae, S.: Global flood risk under climate change, Nat. Clim. Change, 3, 816–821, 2013.
Hoa, H. M.: Construction of initial national quasi-geoid model VIGAC2017, first step to national spatial reference system in Vietnam, Vietnam Journal of Earth Sciences, 39, 155–166, 2017.
Hoi, T. N.: Research on scientific and technological solutions on building dike system for sustainable development in the Mekong Delta, Southern Institute of Water Resour. Res., Ho Chi Minh City, 2005.
Horritt, M. S. and Bates, P. D.: Evaluation of 1D and 2D numerical models for predicting river flood inundation, J. Hydrol., 268, 87–99, 2002.
Huang, W., Ye, F., Zhang, Y. J., Park, K., Du, J., Moghimi, S., Myers, E., Pe'eri, S., Calzada, J. R., Yu, H. C., and Nunez, K.: Compounding factors for extreme flooding around Galveston Bay during Hurricane Harvey, Ocean Model., 158, 101735, https://doi.org/10.1016/j.ocemod.2020.101735, 2021.
Hung, N. N., Delgado, J. M., Tri, V. K., Hung, L. M., Merz, B., Bárdossy, A., and Apel, H.: Floodplain hydrology of the Mekong delta, Vietnam, Hydrol. Process., 26, 674–686, 2012.
Ikeuchi, H., Hirabayashi, Y., Yamazaki, D., Kiguchi, M., Koirala, S., Nagano, T., Kotera, A., and Kanae, S.: Modeling complex flow dynamics of fluvial floods exacerbated by sea level rise in the Ganges–Brahmaputra–Meghna Delta, Environ. Res. Lett., 10, 124011, https://doi.org/10.1088/1748-9326/10/12/124011, 2015.
Ikeuchi, H., Hirabayashi, Y., Yamazaki, D., Muis, S., Ward, P. J., Winsemius, H. C., Verlaan, M., and Kanae, S.: Compound simulation of fluvial floods and storm surges in a global coupled river-coast flood model: Model development and its application to 2007 Cyclone Sidr in Bangladesh, J. Adv. Model. Earth Sy., 9, 1847–1862, 2017.
IPCC: Climate Change 2021: The Physical Science Basis. Contribution of Working Group I to the Sixth Assessment Report of the Intergovernmental Panel on Climate Change, edited by: Masson-Delmotte, V., Zhai, P., Pirani, A., Connors, S. L., Péan, C., Berger, S., Caud, N., Chen, Y., Goldfarb, L., Gomis, M. I., Huang, M., Leitzell, K., Lonnoy, E., Matthews, J. B. R., Maycock, T. K., Waterfield, T., Yelekçi, O., Yu, R., and Zhou, B., Cambridge University Press, Cambridge, UK and New York, NY, USA, https://doi.org/10.1017/9781009157896, 2021.
Jonkman, S. N., Godfroy, M., Sebastian, A., and Kolen, B.: Brief communication: Loss of life due to Hurricane Harvey, Nat. Hazards Earth Syst. Sci., 18, 1073–1078, https://doi.org/10.5194/nhess-18-1073-2018, 2018.
Le, T. V. H., Nguyen, H. N., Wolanski, E., Tran, T. C., and Haruyama, S.: The combined impact on the flooding in Vietnam's Mekong River delta of local man-made structures, sea level rise, and dams upstream in the river catchment, Estuar. Coast. Shelf S., 71, 110–116, 2007.
Le Quan, Q., Vasilopoulos, G., Hackney, C., Parsons, D., Nguyen Nghia, H., Darby, S., and Houseago, R.: Sediment routing though the apex of a mega-delta under future anthropogenic impacts and climate change, EGU General Assembly 2022, Vienna, Austria, 23–27 May 2022, EGU22-9871, https://doi.org/10.5194/egusphere-egu22-9871, 2022.
Lin, N. and Emanuel, K.: Grey swan tropical cyclones, Nat. Clim. Change, 6, 106–111, 2021.
Käkönen, M.: Mekong Delta at the Crossroads: More Control or Adaptation?, Ambio, 37, 205–12, 2008.
Kew, S. F., Selten, F. M., Lenderink, G., and Hazeleger, W.: The simultaneous occurrence of surge and discharge extremes for the Rhine delta, Nat. Hazards Earth Syst. Sci., 13, 2017–2029, https://doi.org/10.5194/nhess-13-2017-2013, 2013.
Kirezci, E., Young, I. R., Ranasinghe, R., Muis, S., Nicholls, R. J., Lincke, D., and Hinkel, J.: Projections of global-scale extreme sea levels and resulting episodic coastal flooding over the 21st Century, Sci. Rep., 10, 11629, https://doi.org/10.1038/s41598-020-67736-6, 2020.
Manh, N. V., Dung, N. V., Hung, N. N., Merz, B., and Apel, H.: Large-scale suspended sediment transport and sediment deposition in the Mekong Delta, Hydrol. Earth Syst. Sci., 18, 3033–3053, https://doi.org/10.5194/hess-18-3033-2014, 2014.
McGranahan, G., Balk, D., and Anderson, B.: The rising tide: assessing the risks of climate change and human settlements in low elevation coastal zones, Environ. Urban., 19, 17–37, 2007.
Mekong River Commission: The integrated water resources management–based Basin Development Strategy for the Lower Mekong Basin 2021–2030 and the MRC Strategic Plan 2021–2025, Vientiane: MRC Secretariat, https://www.mrcmekong.org/publications/basin-development-strategy-2021-2030-and-mrc-strategic-plan (last access: 17 October 2024), 2021.
Minderhoud, P. S. J., Erkens, G., Pham, V. H., Bui, V. T., Erban, L., Kooi, H., and Stouthamer, E.: Impacts of 25 years of groundwater extraction on subsidence in the Mekong delta, Vietnam, Environ. Res. Lett., 12, 064006, https://doi.org/ 10.1088/1748-9326/aa7146, 2017.
Minderhoud, P. S. J., Coumou, L., Erkens, G., Middelkoop, H., and Stouthamer, E.: Mekong delta much lower than previously assumed in sea-level rise impact assessments, Nat. Commun., 10, 3847, https://doi.org/10.1038/s41467-019-11602-1, 2019.
Moriasi, D. N., Arnold, J. G., Van Liew, M. W., Bingner, R. L., Harmel, R. D., and Veith, T. L.: Model evaluation guidelines for systematic quantification of accuracy in watershed simulations, T. ASABE, 50, 885–900, 2007.
Muis, S., Apecechea, M. I., Dullaart, J., de Lima Rego, J., Madsen, K. S., Su, J., Yan, K., and Verlaan, M.: A high-resolution global dataset of extreme sea levels, tides, and storm surges, including future projections, Frontiers in Marine Science, 7, 263, https://doi.org/10.3389/fmars.2020.00263, 2020.
Neumann, B., Vafeidis, A. T., Zimmermann, J., and Nicholls, R. J.: Future coastal population growth and exposure to sea-level rise and coastal flooding-a global assessment, PloS one, 10, e0118571, https://doi.org/10.1371/journal.pone.0118571, 2015.
Nicholls, R. J. and Cazenave, A.: Sea-level rise and its impact on coastal zones, Science, 328, 1517–1520, 2010.
Nicholls, R. J., Lincke, D., Hinkel, J., Brown, S., Vafeidis, A. T., Meyssignac, B., Hanson, S. E., Merkens, J. L., and Fang, J.: A global analysis of subsidence, relative sea-level change and coastal flood exposure, Nat. Clim. Change, 11, 338–342, 2021.
Nguyen, K. A., Liou, Y. A., and Terry, J. P.: Vulnerability of Vietnam to typhoons: A spatial assessment based on hazards, exposure and adaptive capacity, Sci. Total Environ., 682, 31–46, 2019.
Nguyen, V. K. T.: Flood dynamics in the Vietnamese Mekong Delta: Current state and future projections, Diss. Universität Potsdam Potsdam, https://publishup.uni-potsdam.de/opus4-ubp/frontdoor/deliver/index/docId/51283/file/nguyen_diss.pdf (last access date: 17 October 2024), 2021.
Oppenheimer, M., Glavovic, B. C., Hinkel, J., van de Wal, R., Magnan, A. K., Abd-Elgawad, A., Cai, R.,Cifuentes-Jara, M., DeConto, R. M., Ghosh, T., Hay, J., Isla, F., Marzeion, B., Meyssignac, B., and Sebesvari, Z.: Sea Level Rise and Implications for Low-Lying Islands, Coasts and Communities, in: IPCC Special Report on the Ocean and Cryosphere in a Changing Climate, edited by: Pörtner, H.-O., Roberts, D. C., Masson-Delmotte, V., Zhai, P., Tignor, M., Poloczanska, E., Mintenbeck, K., Alegriìa, A., Nicolai, M., Okem, A., Petzold, J., Rama, B., and Weyer, N. M., Cambridge University Press, Cambridge, UK and New York, NY, USA, 321–445, https://doi.org/10.1017/9781009157964.006, 2019.
Pawlowicz, R., Beardsley, B., and Lentz, S.: Classical tidal harmonic analysis including error estimates in MATLAB using T_TIDE, Computers and Geosciences, 28, 929–937, 2002.
Ritter, A. and Muñoz-Carpena, R.: Performance evaluation of hydrological models: Statistical significance for reducing subjectivity in goodness-of-fit assessments, J. Hydrol., 480, 33–45, 2013.
Rodrigues do Amaral, F., Gratiot, N., Pellarin, T., and Tu, T. A.: Assessing typhoon-induced compound flood drivers: a case study in Ho Chi Minh City, Vietnam, Nat. Hazards Earth Syst. Sci., 23, 3379–3405, https://doi.org/10.5194/nhess-23-3379-2023, 2023.
Sebastian, A., Bader, D. J., Nederhoff, C. M., Leijnse, T. W. B., Bricker, J. D., and Aarninkhof, S. G. J.: Hindcast of pluvial, fluvial, and coastal flood damage in Houston, Texas during Hurricane Harvey (2017) using SFINCS, Nat. Hazards, 109, 2343–2362, 2021.
Seneviratne, S. I., Nicholls, N., Easterling, D., Goodess, C. M., Kanae, S., Kossin, J., Luo, Y., Marengo, J., Mc Innes, K., Rahimi, M., Reichstein, M., Sorteberg, A., Vera, C., Zhang, X., Rusticucci, M., Semenov, V., Alexander, L. V., Allen, S., Benito, G., Cavazos, T., Clague, J., Conway, D., Della-Marta, P. M., Gerber, M., Gong, S., Goswami, B. N., Hemer, M., Huggel, C., Van den Hurk, B., Kharin, V. V., Kitoh, A., Klein Tank, A. M. G., Li, G., Mason, S., Mc Guire, W., Van Oldenborgh, G. J., Orlowsky, B., Smith, S., Thiaw, W., Velegrakis, A., Yiou, P., Zhang, T., Zhou, T., and Zwiers, F. W.: Changes in climate extremes and their impacts on the natural physical environment, in: Managing the Risks of Extreme Events and Disasters to Advance Climate Change Adaptation: Special Report of the Intergovernmental Panel on Climate Change, Cambridge University Press, 109–230, https://doi.org/10.1017/CBO9781139177245.006, 2016.
Seto, K. C.: Exploring the dynamics of migration to mega-delta cities in Asia and Africa: Contemporary drivers and future scenarios, Global Environ. Chang., 21, S94–S107, 2011.
Skliris, N., Marsh, R., Haigh, I., Wood, M., Hirschi, J. J., Darby, S., Quynh, N. P., and Hung, N. N.: Drivers of rainfall trends in and around Mainland Southeast Asia, Frontiers in Climate, 4, 926568, https://doi.org/10.3389/fclim.2022.926568, 2022.
Smajgl, A., Toan, T. Q., Nhan, D. K., Ward, J., Trung, N. H., Tri, L. Q., Tri, V. P. D., and Vu, P. T.: Responding to rising sea levels in the Mekong Delta, Nat. Clim. Change, 5, 167–174, 2015.
Smith, G. P.: Expert opinion: Stability of people, vehicles and buildings in flood water, Technical Report No. 2015/11, University of New South Wales, Water Research Laboratory, https://doi.org/10.4225/53/58e1dfd63f1f4, 2015.
Takagi, H., Esteban, M., and Tam, T. T.: Coastal vulnerabilities in a fast-growing Vietnamese City, in: Coastal disasters and climate change in Vietnam, Elsevier, 157–171, https://doi.org/10.1016/B978-0-12-800007-6.00007-1, 2014.
Tessler, Z. D., Vörösmarty, C. J., Grossberg, M., Gladkova, I., Aizenman, H., Syvitski, J. P., and Foufoula-Georgiou, E.: Profiling risk and sustainability in coastal deltas of the world. Science, 349, 638–643, 2015.
Thanh, V. Q., Roelvink, D., van der Wegen, M., Reyns, J., Kernkamp, H., Van Vinh, G., and Linh, V. T. P.: Flooding in the Mekong Delta: the impact of dyke systems on downstream hydrodynamics, Hydrol. Earth Syst. Sci., 24, 189–212, https://doi.org/10.5194/hess-24-189-2020, 2020.
Toan, T. Q.: Climate change and sea level rise in the Mekong Delta: flood, tidal inundation, salinity intrusion, and irrigation adaptation methods, in: Coastal disasters and climate change in Vietnam, Elsevier, 199–218, https://doi.org/10.1016/B978-0-12-800007-6.00009-5, 2014.
Tri, V. K.: Hydrology and hydraulic infrastructure systems in the Mekong Delta, Vietnam, in: The Mekong Delta System, edited by: Renaud, F. G. and Kuenzer, C., The Mekong Delta System: Interdisciplinary Analyses of a River Delta, Springer Environmental Science and Engineering, Springer, Dordrecht, 49–81, https://doi.org/10.1007/978-94-007-3962-8_3, 2012.
Triet, N. V. K., Dung, N. V., Hoang, L. P., Le Duy, N., Tran, D. D., Anh, T. T., Kummu, M., Merz, B., and Apel, H.: Future projections of flood dynamics in the Vietnamese Mekong Delta, Sci. Total Environ., 742, 140596, https://doi.org/10.1016/j.scitotenv.2020.140596, 2020.
Try, S., Tanaka, S., Tanaka, K., Sayama, T., Khujanazarov, T., and Oeurng, C.: Comparison of CMIP5 and CMIP6 GCM performance for flood projections in the Mekong River Basin, Journal of Hydrology: Regional Studies, 40, 101035, https://doi.org/10.1016/j.ejrh.2022.101035, 2022.
UNDRR: The human cost of disasters: An overview of the last 20 years (2000–2019), https://www.undrr.org/publication/human-cost-disasters-overview-last-20-years-2000-2019 (last access: 17 October 2024), 2020.
University of Bristol: FABDEM V1–2, University of Bristol [data set], https://data.bris.ac.uk/data/dataset/s5hqmjcdj8yo2ibzi9b4ew3sn (last access: 18 October 2024), 2024.
Valle-Levinson, A., Olabarrieta, M., and Heilman, L.: Compound flooding in Houston-Galveston Bay during Hurricane Harvey, Sci. Total Environ., 747, 141272, https://doi.org/10.1016/j.scitotenv.2020.141272, 2020.
Van, P. D. T., Popescu, I., van Griensven, A., Solomatine, D. P., Trung, N. H., and Green, A.: A study of the climate change impacts on fluvial flood propagation in the Vietnamese Mekong Delta, Hydrol. Earth Syst. Sci., 16, 4637–4649, https://doi.org/10.5194/hess-16-4637-2012, 2012.
Västilä, K., Kummu, M., Sangmanee, C., and Chinvanno, S.: Modelling climate change impacts on the flood pulse in the Lower Mekong floodplains, J. Water Clim. Change, 1, 67–86, 2010.
Vousdoukas, M. I., Voukouvalas, E., Annunziato, A., Giardino, A., and Feyen, L.: Projections of extreme storm surge levels along Europe, Clim. Dynam., 47, 3171–3190, 2016.
Vasilopoulos, G., Quan, Q. L., Parsons, D. R., Darby, S. E., Tri, V. P. D., Hung, N. N., Haigh, I. D., Voepel, H. E., Nicholas, A. P., and Aalto, R.: Establishing sustainable sediment budgets is critical for climate-resilient mega-deltas, Environ. Res. Lett., 16, 064089, https://doi.org/10.1088/1748-9326/ac06fc, 2021.
Wahl, T., Jain, S., Bender, J., Meyers, S. D., and Luther, M. E.: Increasing risk of compound flooding from storm surge and rainfall for major US cities, Nat. Clim. Change, 5, 1093–1097, 2015.
Wahl, T., Ward, P. J., Winsemius, H. C., AghaKouchak, A., Bender, J., Haigh, I. D., Jain, S., Leonard, M., Veldkamp, T. I. E., and Westra, S.: When environmental forces collide, EOS, 99, https://doi.org/10.1029/2018EO099745, 2018.
Wang, Q., Xu, Y., Wei, N., Wang, S., and Hu, H.: Forecast and service performance on rapidly intensification process of Typhoons Rammasun (2014) and Hato (2017), Trop. Cyclone Res. Rev., 8, 18–26, https://doi.org/10.1016/j.tcrr.2019.07.002, 2019.
Ward, P. J., Couasnon, A., Eilander, D., Haigh, I. D., Hendry, A., Muis, S., Veldkamp, T. I., Winsemius, H. C., and Wahl, T.: Dependence between high sea-level and high river discharge increases flood hazard in global deltas and estuaries, Environ. Res. Lett., 13, 084012, https://doi.org/10.1088/1748-9326/aad400, 2018.
Welch, A. C., Nicholls, R. J., and Lázár, A. N.: Evolving deltas: Coevolution with engineered interventions, Elementa: Science of the Anthropocene, 5, 49, https://doi.org/10.1525/elementa.128, 2017.
Wesselink, A., Warner, J., Syed, M. A., Chan, F., Tran, D. D., Huq, H., Huthoff, F., Le Thuy, N., Pinter, N., Van Staveren, M., and Wester, P.: Trends in flood risk management in deltas around the world: Are we going `soft'?, International Journal of Water Governance, 3, 25–46, https://doi.org/10.7564/15-IJWG90, 2015.
Wood, M., Haigh, I. D., Le, Q. Q., Nguyen, H. N., Tran, H. B., Darby, S. E., Marsh, R., Skliris, N., Hirschi, J. J.-M., Nicholls, R. J., and Bloemendaal, N.: Climate-induced storminess forces major increases in future storm surge hazard in the South China Sea region, Nat. Hazards Earth Syst. Sci., 23, 2475–2504, https://doi.org/10.5194/nhess-23-2475-2023, 2023.
Yamazaki, D., Kanae, S., Kim, H., and Oki, T.: A physically based description of floodplain inundation dynamics in a global river routing model, Water Resour. Res., 47, W04501, https://doi.org/10.1029/2010WR009726, 2011.
Yamazaki, D., de Almeida, G. A., and Bates, P. D.: Improving computational efficiency in global river models by implementing the local inertial flow equation and a vector-based river network map, Water Resour. Res., 49, 7221–7235, 2013.
Yue, S., Ouarda, T. B., Bobée, B., Legendre, P., and Bruneau, P.: Approach for describing statistical properties of flood hydrograph, J. Hydrol. Eng., 7, 147–153, 2002.
Zheng, F., Westra, S., Leonard, M., and Sisson, S. A.: Modeling dependence between extreme rainfall and storm surge to estimate coastal flooding risk, Water Resour. Res., 50, 2050–2071, https://doi.org/10.1002/2013WR014616, 2014.
Zscheischler, J., Westra, S., Van Den Hurk, B. J. J. M., Seneviratne, S. I., Ward, P. J., Pitman, A., AghaKouchak, A., Bresch, D. N., Leonard, M., Wahl, T., and Zhang, X.: Future climate risk from compound events, Nat. Clim. Change, 8, 469–477, 2018.