the Creative Commons Attribution 4.0 License.
the Creative Commons Attribution 4.0 License.
 | 14 Oct 2024
Dynamic response of pile–slab retaining wall structure under rockfall impact
Peng Zou
Yuzhang Bi
Hanhua Xu
Pile–slab retaining walls, as innovative rockfall protection structures, have been extensively utilized in the western mountainous regions of China. With their characteristics of a small footprint, high interception height, and ease of construction, these structures demonstrate promising potential for application in mountainous regions worldwide, such as the Himalayas, Andes, and Alps. However, their dynamic response upon impact and impact resistance energy remain ambiguous due to the intricate composite nature of the structures. To elucidate this, an exhaustive dynamic analysis of a four-span pile–slab retaining wall with a cantilever section of 6 m under various impact scenarios was conducted utilizing the finite-element numerical simulation method. The rationality of the selected material constitutive models and the numerical algorithm was validated by reproducing two physical model tests. The simulation results reveal the following. (1) The lateral displacement of the pile at the ground surface and the concrete damage under the pile at the impact center are greater than those under the slab at the impact center, implying that the impact location has a significant influence on the stability of the structure. (2) There is a positive correlation between the response indexes (impact force, interaction force, lateral deformation of pile and slab, concrete damage) and the impact velocities. (3) The rockfall peak impact force, the ratio of the peak impact force to the peak interaction force, and lateral displacement of the pile at the ground surface had strong linear relationships with rockfall energy. (4) Relative to the bending moment, shear force, and damage degree, the lateral displacement of the pile at the ground surface is the first to reach its limit value. Taking the lateral displacement of the pile at the ground surface as the controlling factor, the estimated maximum impact energy that the pile–slab retaining wall can withstand is 905 kJ in this study when the structure top is taken as the impact point. In cases where the impact energy of falling rocks exceeds 905 kJ, it is recommended to optimize the mechanical properties of the cushion layer, improve the elastic modulus of concrete, increase the reinforcement ratio of longitudinal tension bars, enlarge the section size of piles at ground level, or add anchoring measures to enhance the bending resistance of the retaining structure.
- Article
(18859 KB) - Full-text XML
- BibTeX
- EndNote


Rockfall disasters pose a great threat to roads, railways, buildings, and inhabitants in mountainous terrain (Hungr et al., 2014; Crosta and Agliardi, 2004; Shen et al., 2019) and can be described as a process of rapid bouncing, rolling, and sliding movements of one or several boulders down a slope (Peila and Ronco, 2009). Muraishi et al. (2005) surveyed 607 rockfall events and found that about 68 % of rockfall events have an impact energy of less than 100 kJ, whereas 90 % have less than 1000 kJ. Chau et al. (2002) indicated that the rotational kinetic energy of rockfall only accounts for 10 % of the total kinetic energy. To mitigate such geological hazards, scholars and engineers have proposed different types of technical solutions. Two primary categories of defensive measures are commonly employed: active and passive. Active protection measures mainly include masonry protection, reinforcement protection (grouting, anchor rod, and anchor cable), and initiative protective nets (Yang et al., 2019). Passive protection measures include passive flexible protection (Yu et al., 2021), rockfall shed gallery (Zhao et al., 2018), and rockfall retaining wall. Considering many factors, such as technological feasibility and economic considerations, rockfall retaining wall is frequently employed in practical engineering (Volkwein et al., 2011).
Currently, various types of retaining walls are utilized in engineering projects aimed at intercepting falling boulders. These include masonry retaining walls, reinforced concrete (RC) retaining walls, reinforced soil retaining walls, and pile–slab retaining walls (PSRWs). Due to the inherent structural weakness of these walls, their ability to absorb the impact energy from rockfall is limited (Mavrouli et al., 2017). To enhance impact resistance, reinforced concrete retaining walls have been utilized (Yong et al., 2020). These structures can intercept rockfall impact energy ranging approximately from 120 to 500 kJ (Maegawa et al., 2011). To prevent concrete from being damaged by the direct impact of rockfall, a buffer layer is generally added in front of the structure for protection, such as reinforced soil and gabion cushion (Perera et al., 2021). Although the impact resistance of the structure has been improved, there is still a problem of limited interception height. When the required interception height is large, the foundation size has to be increased to prevent the structures from overturning. In order to mitigate against rockfall events involving higher energy levels, numerous researchers have proposed the implementation of reinforced soil retaining walls. Extensive studies have been conducted in this regard, demonstrating that the structures can effectively intercept rockfall impact energies exceeding 5000 kJ (Lambert et al., 2009). Moreover, geosynthetic-reinforced soil retaining walls have proven to be efficacious in reducing wall stresses (Lu et al., 2021). However, the structure requires a substantial spatial footprint and poses an overturning risk during construction in steep terrain (Peila et al., 2007). Additionally, when the topography at the wall site features steep slopes, the available space behind the wall for accommodating rockfalls becomes constrained.

Figure 1PSRWs in southwestern China in (a) Kongyu, (b) the Jiuzhaigou nature reserve, (c) the Zhenjiangguan tunnel exit on the Chengdu–Lanzhou railway, and (d) Zhangmu.
In response to the challenges posed by steep terrains, narrow site conditions, and suboptimal foundation conditions in mountainous terrain, Hu et al. (2019) introduced the PSRW structure. The structures are composed of a buffer layer and an anti-slide pile–slab structure, which has found widespread application in southwestern China (Fig. 1). Due to its implementation of pile foundations, this structure possesses characteristics such as a small footprint, high interception height, and ease of construction.
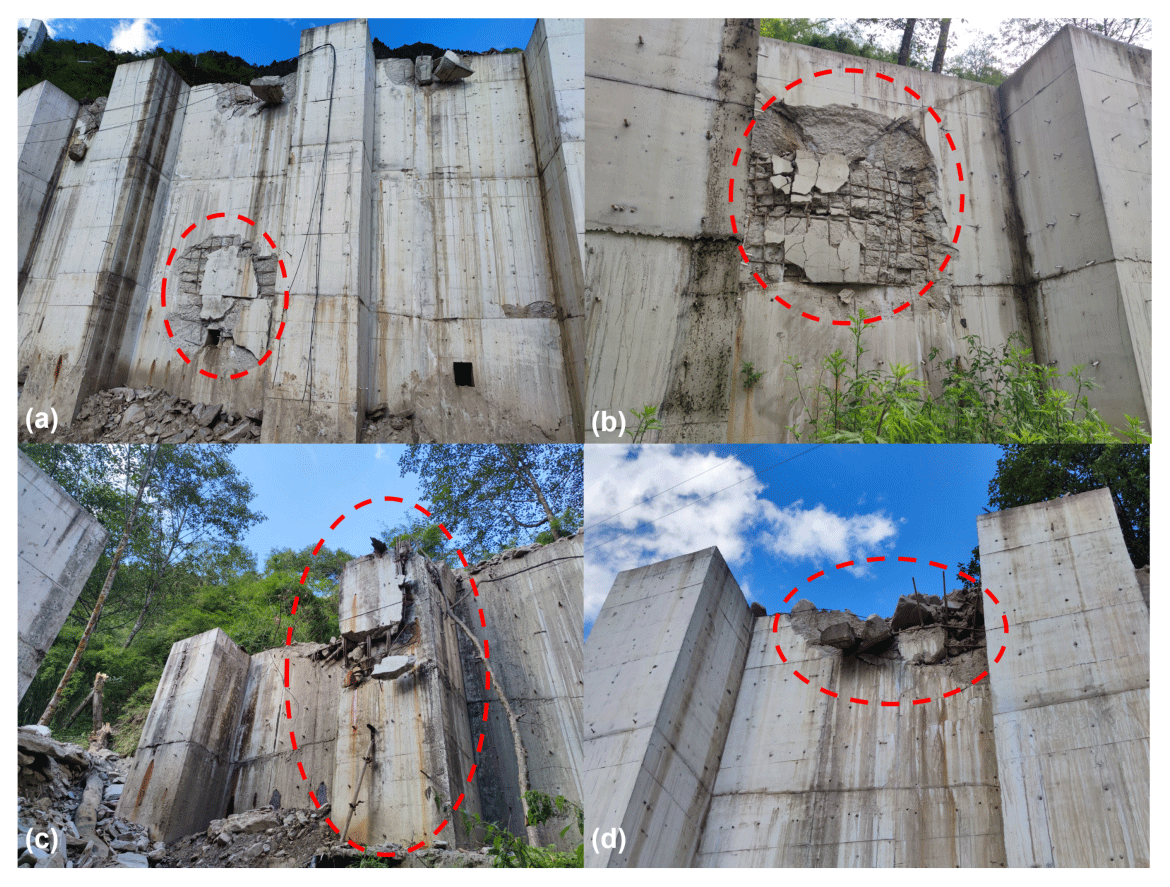
However, the current PSRW design verification approach treats the structure as either an underground continuous wall (CAGHP, 2019) or an elastic cantilever beam (Tian et al., 2024). The structural design primarily considers the impact force of falling rocks as the sole external influencing parameter, while the impact energy is seldom taken into account. Furthermore, existing research primarily focuses on single slabs and piles impacted by rockfall (Wu et al., 2021; Yong et al., 2021). Consequently, due to the scarcity of comprehensive reports on the ultimate load-bearing capacity of this structure, it is frequently overlooked during the initial selection of protective structures, and potential failure scenarios may be underestimated (Fig. 2). Additionally, because of the composite nature of this structure, the dynamical response at various impact points remains elusive.
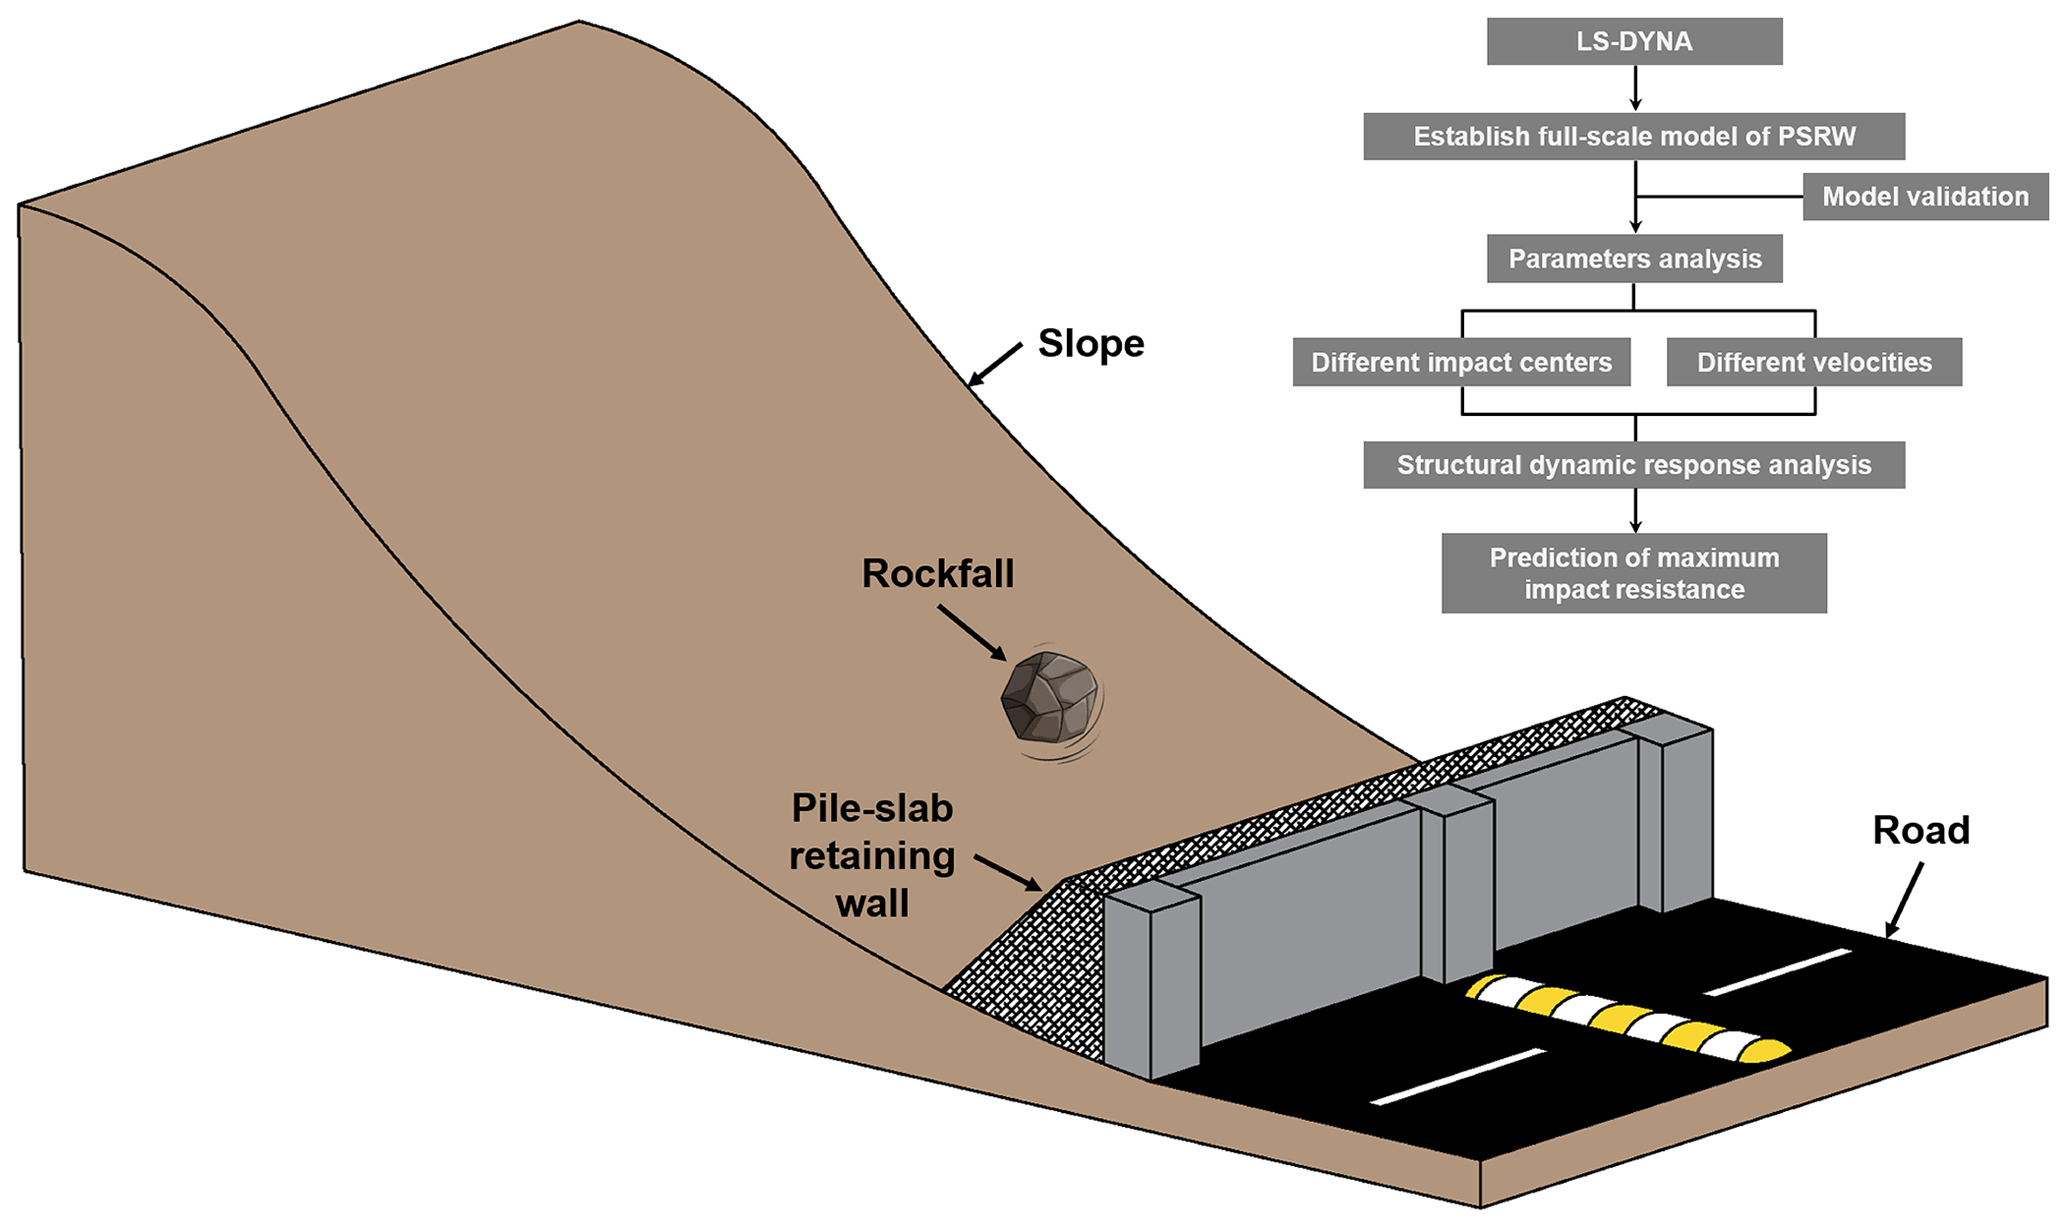
Figure 3Diagram of a PSRW and steps followed to predict the PSRW structure's maximum impact resistance.
Therefore, determining the maximum impact energy, analyzing the structural dynamic response, and assessing concrete damage are crucial factors in determining the effectiveness of the structure in mitigating rockfall hazards. Based on the unique advantages of the finite-element method, this study employs the LS-DYNA to simulate the complete process of rockfall impacting on PSRWs. This methodology has been widely adopted by numerous researchers and has been demonstrated to be suitable for simulating impact problems of reinforced concrete structures (Zhong et al., 2022; Fan et al., 2022; Bi et al., 2023). In conclusion, a full-scale numerical model of a four-span pile–slab retaining wall satisfying specification requirements is established. The rationality of the selected material constitutive models and a numerical algorithm was validated by reproducing two physical model tests. The structure's dynamic behavior under different impact velocities and impact centers is discussed (Fig. 3). The results provide insights into structure dynamic response analysis of the PSRW and serve as a benchmark for further research.
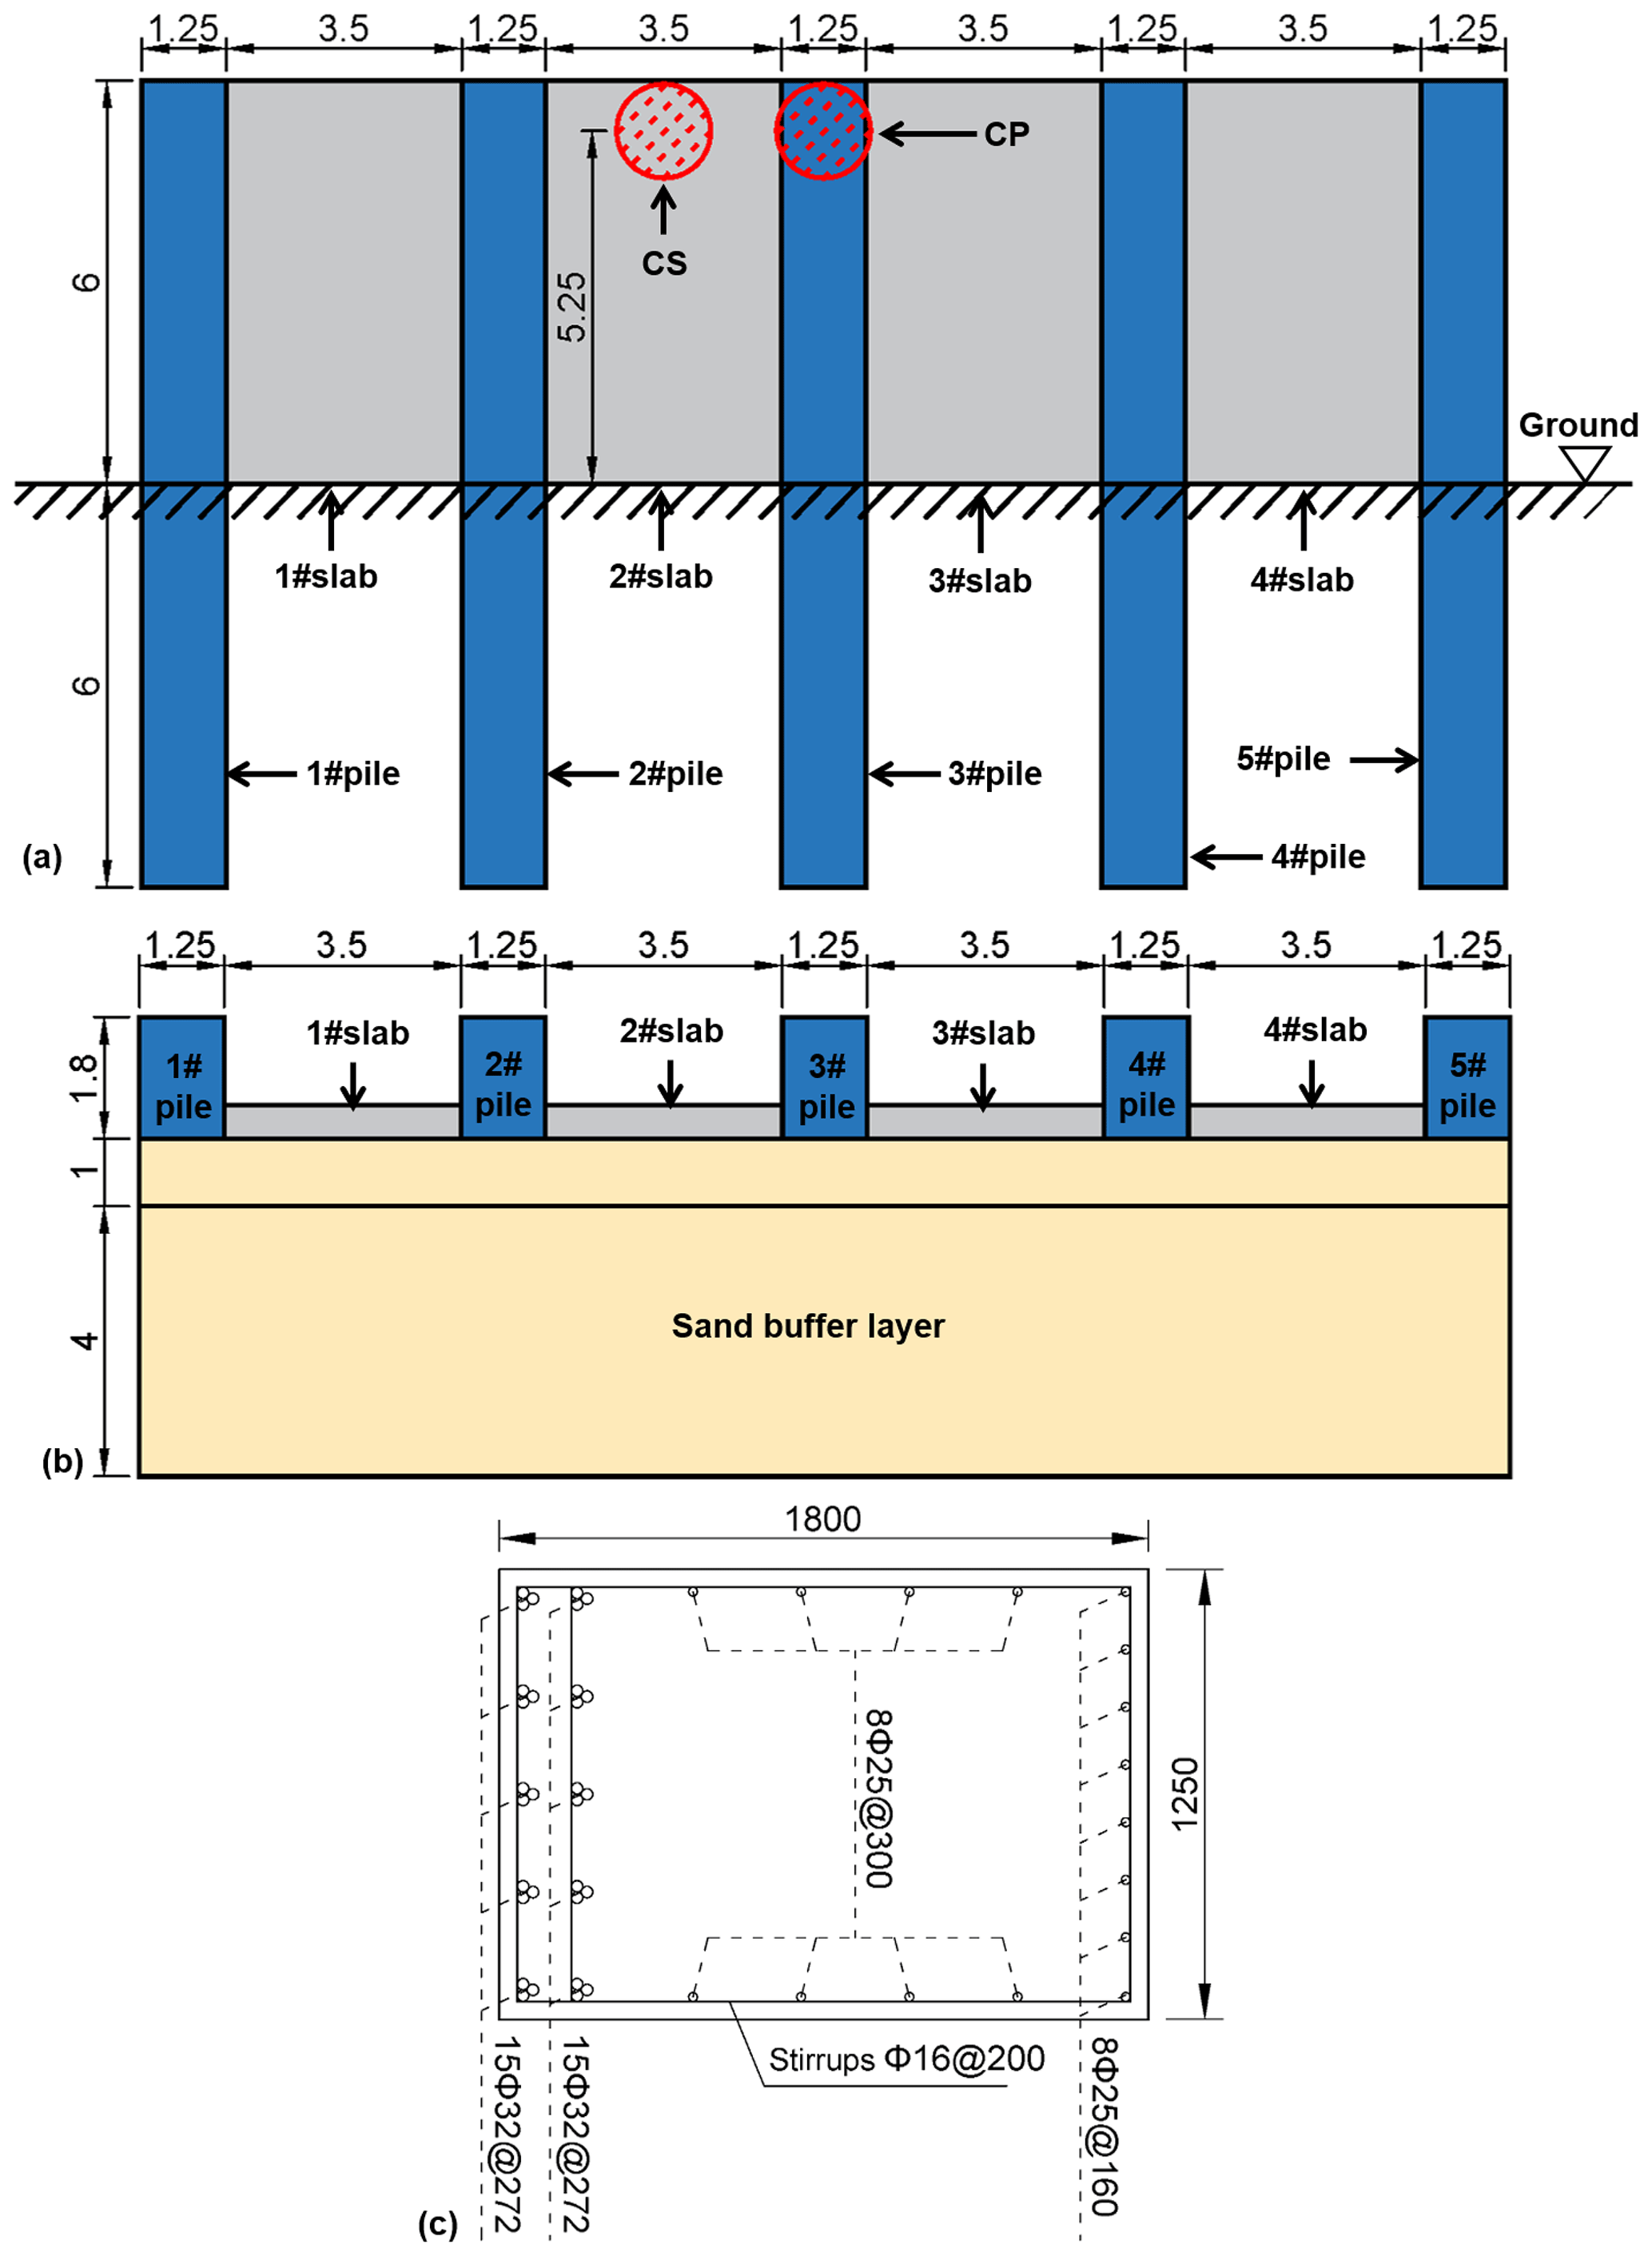
Figure 4The design diagram of the PSRW's (a) front view (unit: m), (b) top view (unit: m), and (c) cross-section profile of the pile (unit: mm).
2.1 Model configuration
2.1.1 Engineering background
The design drawing of the PSRW (Fig. 4) is consistent with the actual project located in the town of Zhangmu, China. Given the large scale of the actual engineering structure, numerical simulations have solely been focused on a representative four-span structure, incorporating appropriately simplified boundary conditions to facilitate the analysis. For a comprehensive understanding of the modeling specifics, refer to Sect. 2.1.3. The anti-slide piles with a concrete protective layer thickness of 0.04 m have a cross-section area of 1.8 m × 1.25 m. The total pile length is 12 m, and the embedded section is 6 m. The HRB400 longitudinal bars with diameters of 25 and 32 mm were arranged in the pile (Fig. 4c). The stirrups are HRB335 with a diameter of 16 mm and a spacing of 200 mm. The slabs between the piles are 6 m in length, 3.5 m in width, and 0.5 m in thickness. These slabs contain two layers of a 16 mm diameter reinforced bar. The sand buffer layers are 1 and 5 m on the top and bottom, respectively. A geogrid is horizontally placed in the buffer layer at 0.25 m intervals. Lastly, a 1 m3 sphere rock boulder with a diameter of 1.24 m was set as an impactor. The impact locations are the no. 2 slab center (CS) and no. 3 pile center (CP) at 5.25 m over the ground.
2.1.2 Soil–pile interaction
Under impact, the lateral deformations of the pile are greatly influenced by the plastic behavior of the soil, particularly the soil near the pile. Given their importance and complexity, it is not easy to thoroughly describe soil–pile interactions. This paper calculates the pile–soil interaction with the lateral resistance–deflection (p–y) curve method. As stated by Truong and Lehane (2018), the p–y curves for square cross-section piles are utilized as
where P is the actual lateral soil resistance, kPa; Pu is the ultimate lateral soil resistance, kPa; Su_cu is the consolidated isotropic undrained triaxial shear strength of soil, kPa m−1; y is the actual lateral soil deformation, m; B is the pile width, m; z is the depth below the soil surface, m; and Sp is a shape correction factor.

According to the reference and simulated model, Su_cu and Sp are adopted as 1.5 kPa m−1 and 1.25, respectively. Additionally, the soil is modeled by compressive inelastic springs, arranged every 0.25 m along the pile height and side (Fig. 5a).
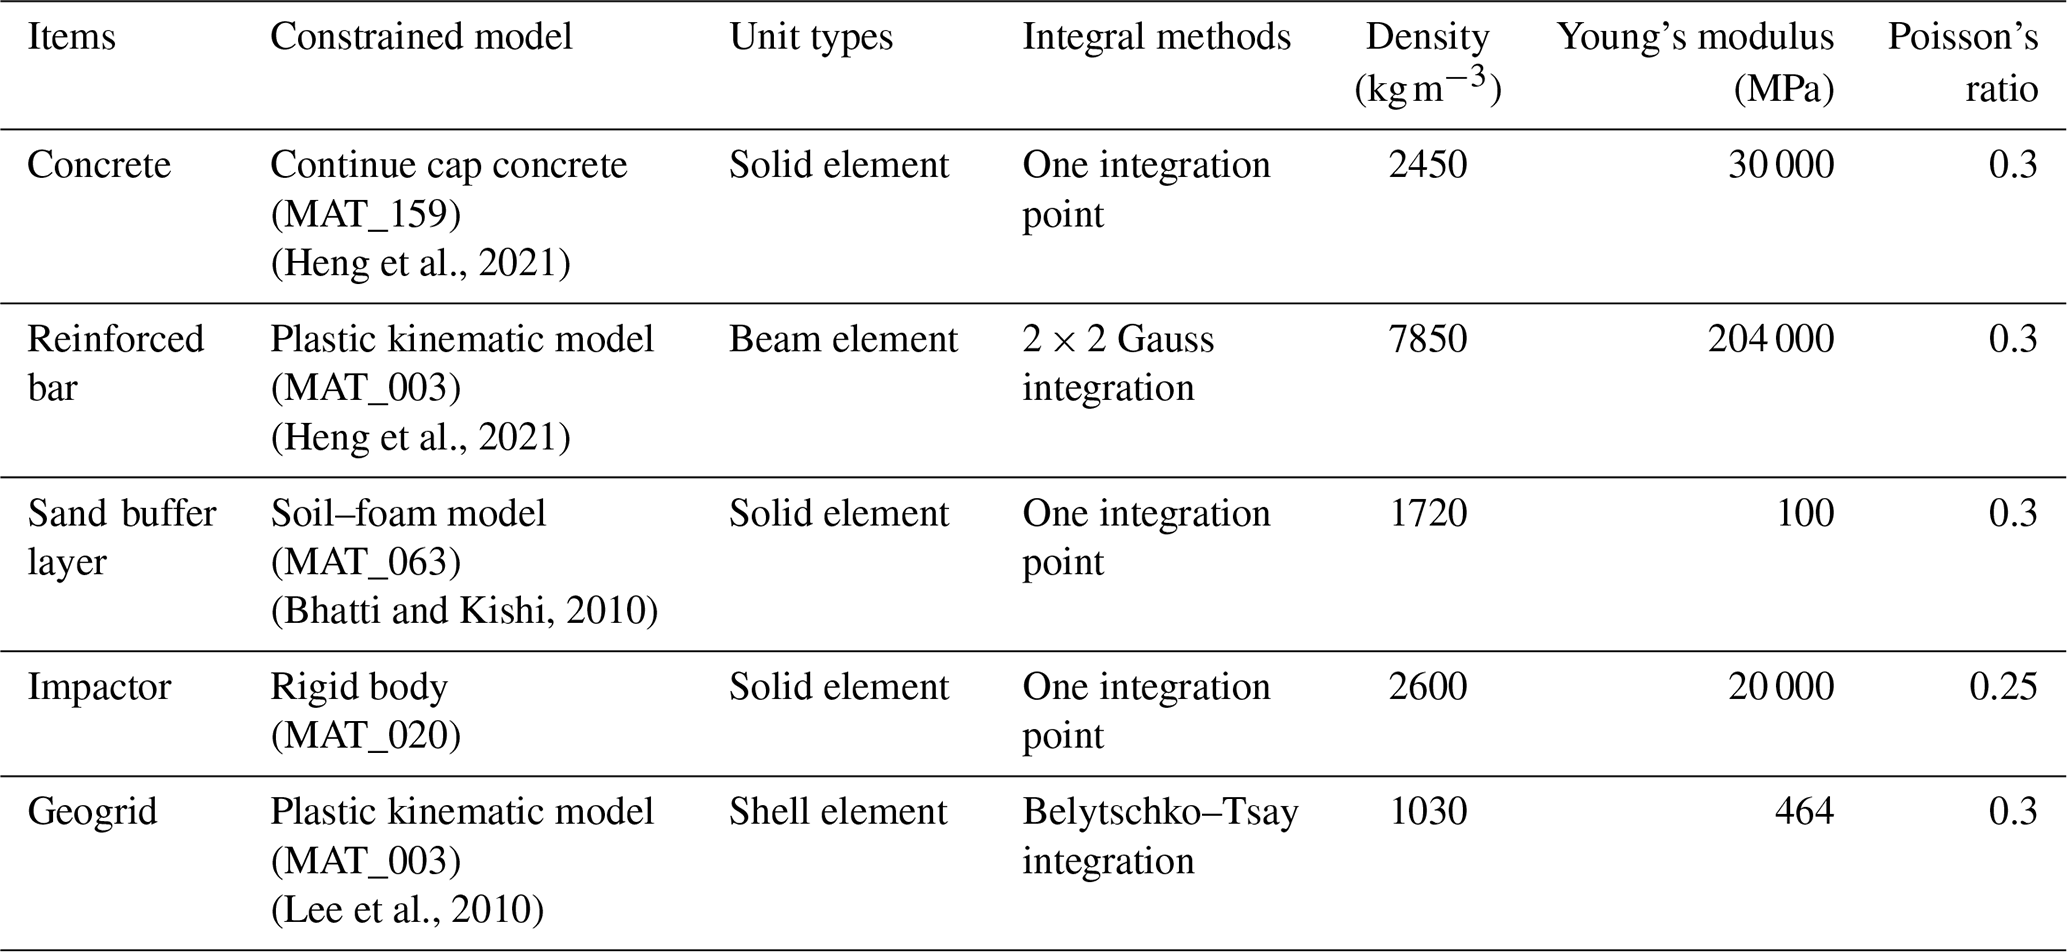
Table 1Material constitutive model and physical–mechanical parameters for various components of the PSRW.
2.1.3 Numerical model and numerical simulation scheme
(1) Numerical model
The numerical model of the PSRW is shown in Fig. 5. The material constitutive models, unit types, physical–mechanical parameters, and parametersource for all components are listed in Table 1. The rationality of all material constitutive models and physical–mechanical parameters is verified in Sect. 2.2. The bottoms of the piles and buffer layers are fixed for the boundary conditions. Additionally, both sides of the buffer layer are blocked by infinitely rigid walls. The contact type between the rockfall, sand buffer layer, and pile–slab structure was set to automaticsurface to surface.
Table 2Detailed numerical simulation scheme.
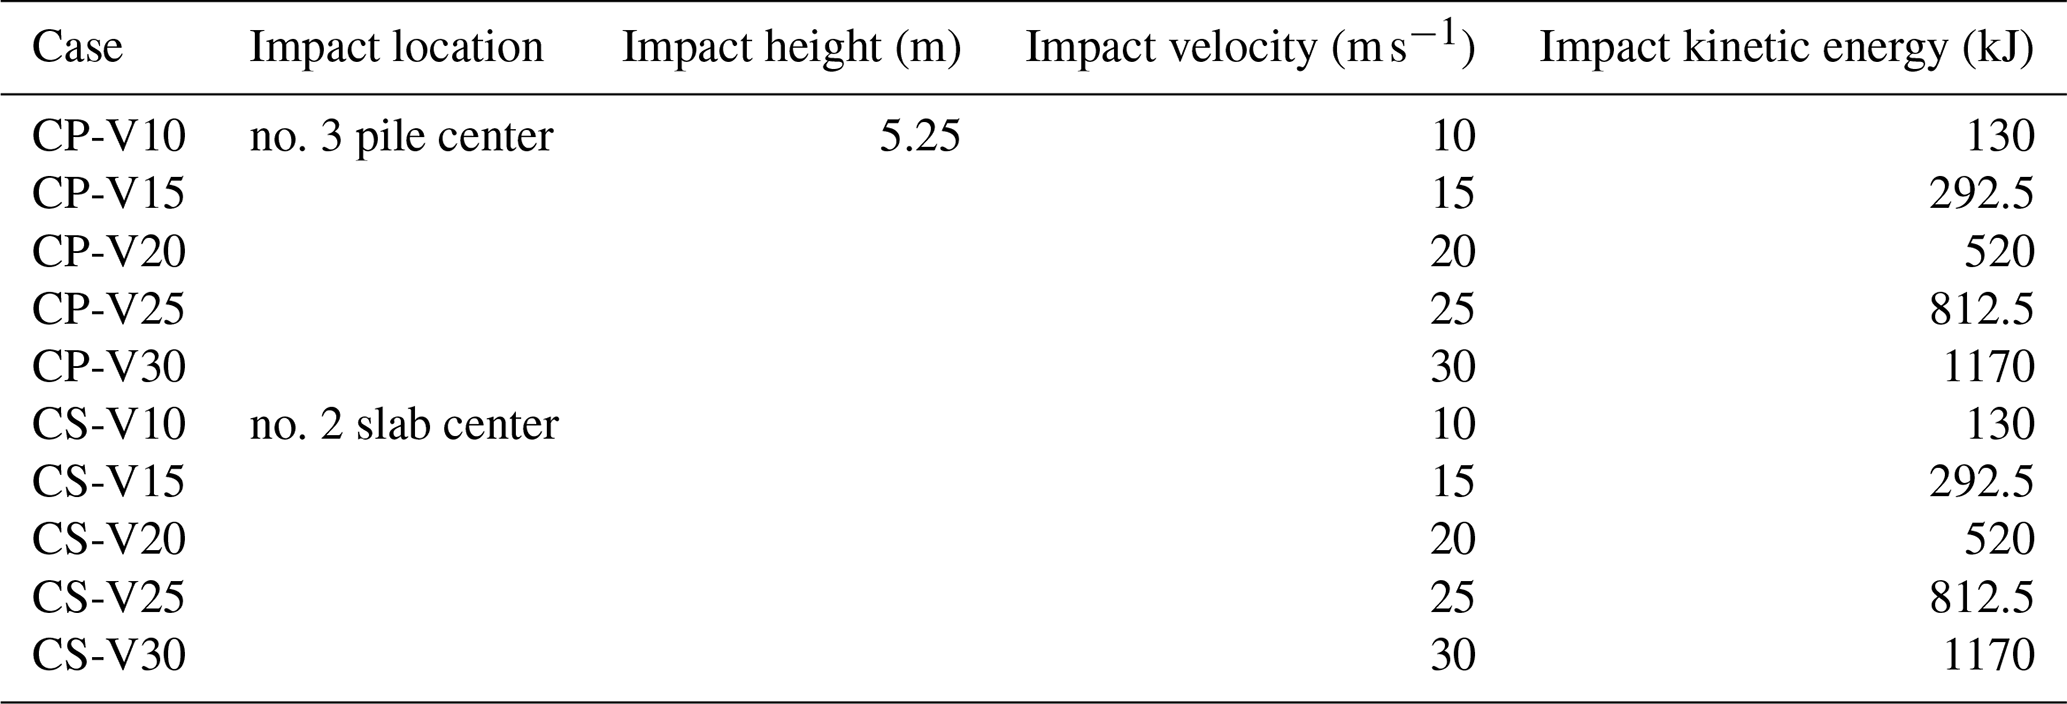
Note: CP denotes the no. 3 pile center as the impact location, CS denotes the no. 2 slab center as the impact location, and V denotes the velocities of rockfall.
(2) Numerical simulation scheme
In previous research (Muraishi et al., 2005; Chau et al., 2002), the angular velocity of the impactor was neglected in numerical simulations, and line velocities were set as 10, 15, 20, 25, and 30 m s−1, corresponding to impact energies of 130, 292.5, 520, 812.5, and 1170 kJ (Table 2). The linear velocity is perpendicular to the surface of the buffer layer.
2.2 Model validation
In order to verify the rationality of the selected material constitutive model and the established numerical model, two physical model tests from previously published papers (Heng et al., 2021; Demartino et al., 2017; Schellenberg, 2008) were selected to be reproduced.

Figure 6Models of the RC cantilever column failure test: (a) experimental model and (b) numerical model (unit: mm).
2.2.1 Failure test of RC cantilever column
The physical model test conducted by Demartino et al. (2017) was selected to verify the ability of the constitutive model to reflect the accumulative damage for RC structures under impact loads. The model is composed of a cylindrical column with a diameter of 0.3 m and a height of 1.7 m and a square-section concrete foundation with a length of 0.9 m and a height of 0.5 m. The column was reinforced with 16 longitudinal reinforced bars of 8 mm diameter and 6.5 mm diameter stirrups at 100 mm spacing. The foundation was firmly connected to the ground using four 50 mm diameter high-strength prestressed reinforced bars. The experiment involved a test truck made of Q235 steel (regarded as a rigid body) (Fig. 6a). The impactor was positioned 0.4 m above the bottom of the column and was released at a velocity of 3.02 m s−1 (impact energy of 7.21 kJ). Figure 6b shows the numerical model with hexahedral mesh. The material constitutive models for the components are shown in Table 1. For the boundary conditions, the model was fixed with four high-strength bolts.


Table 4Comparison of experimental and simulation results of concrete damage accumulation with time.

The trend and amplitude of the impact forces by numerical simulations closely matched the experimental results (Fig. 7). The deviations of peak impact forces between the numerical simulations and the experiments were below 10 % (Table 3). Similarly, Table 4 indicates a consistency between the extent of the experimental and numerical damage in concrete. These results suggest that the numerical model and its governing parameters can reliably simulate the accumulative damage in RC structures subjected to impact loads. Considering both accuracy and computational time, a mesh size of 50 mm was selected for the numerical simulations conducted in this study.

Figure 8Models of the RC slab failure test. (a) Experimental model and (b) numerical model (unit: mm).
2.2.2 Failure test of RC slab with a buffer layer
The physical model test conducted by Schellenberg (2008) was selected to validate the capability of the constitutive model to reflect the interaction between the boulder, sand buffer layer, and RC structure. The specimen comprises an RC slab measuring 1.5 m × 1.5 m × 0.23 m and a sand buffer layer with a radius of 0.5 m and a thickness of 0.45 m (Fig. 8). The slab is reinforced with one layer of reinforced bar with 12 mm diameter and a spacing of 95 mm for the lower layer. The diameter and density of the boulder are 0.8 m and 3110 kg m−3, respectively. The impact position is located at the center of the buffer layer, with an impact velocity of 5.5 m s−1 (impact energy of 14.4 kJ). The material constitutive models for concrete, the reinforced bar, and the sand buffer layer are shown in Table 1. For the boundary conditions, the bottom of the supports was fixed.
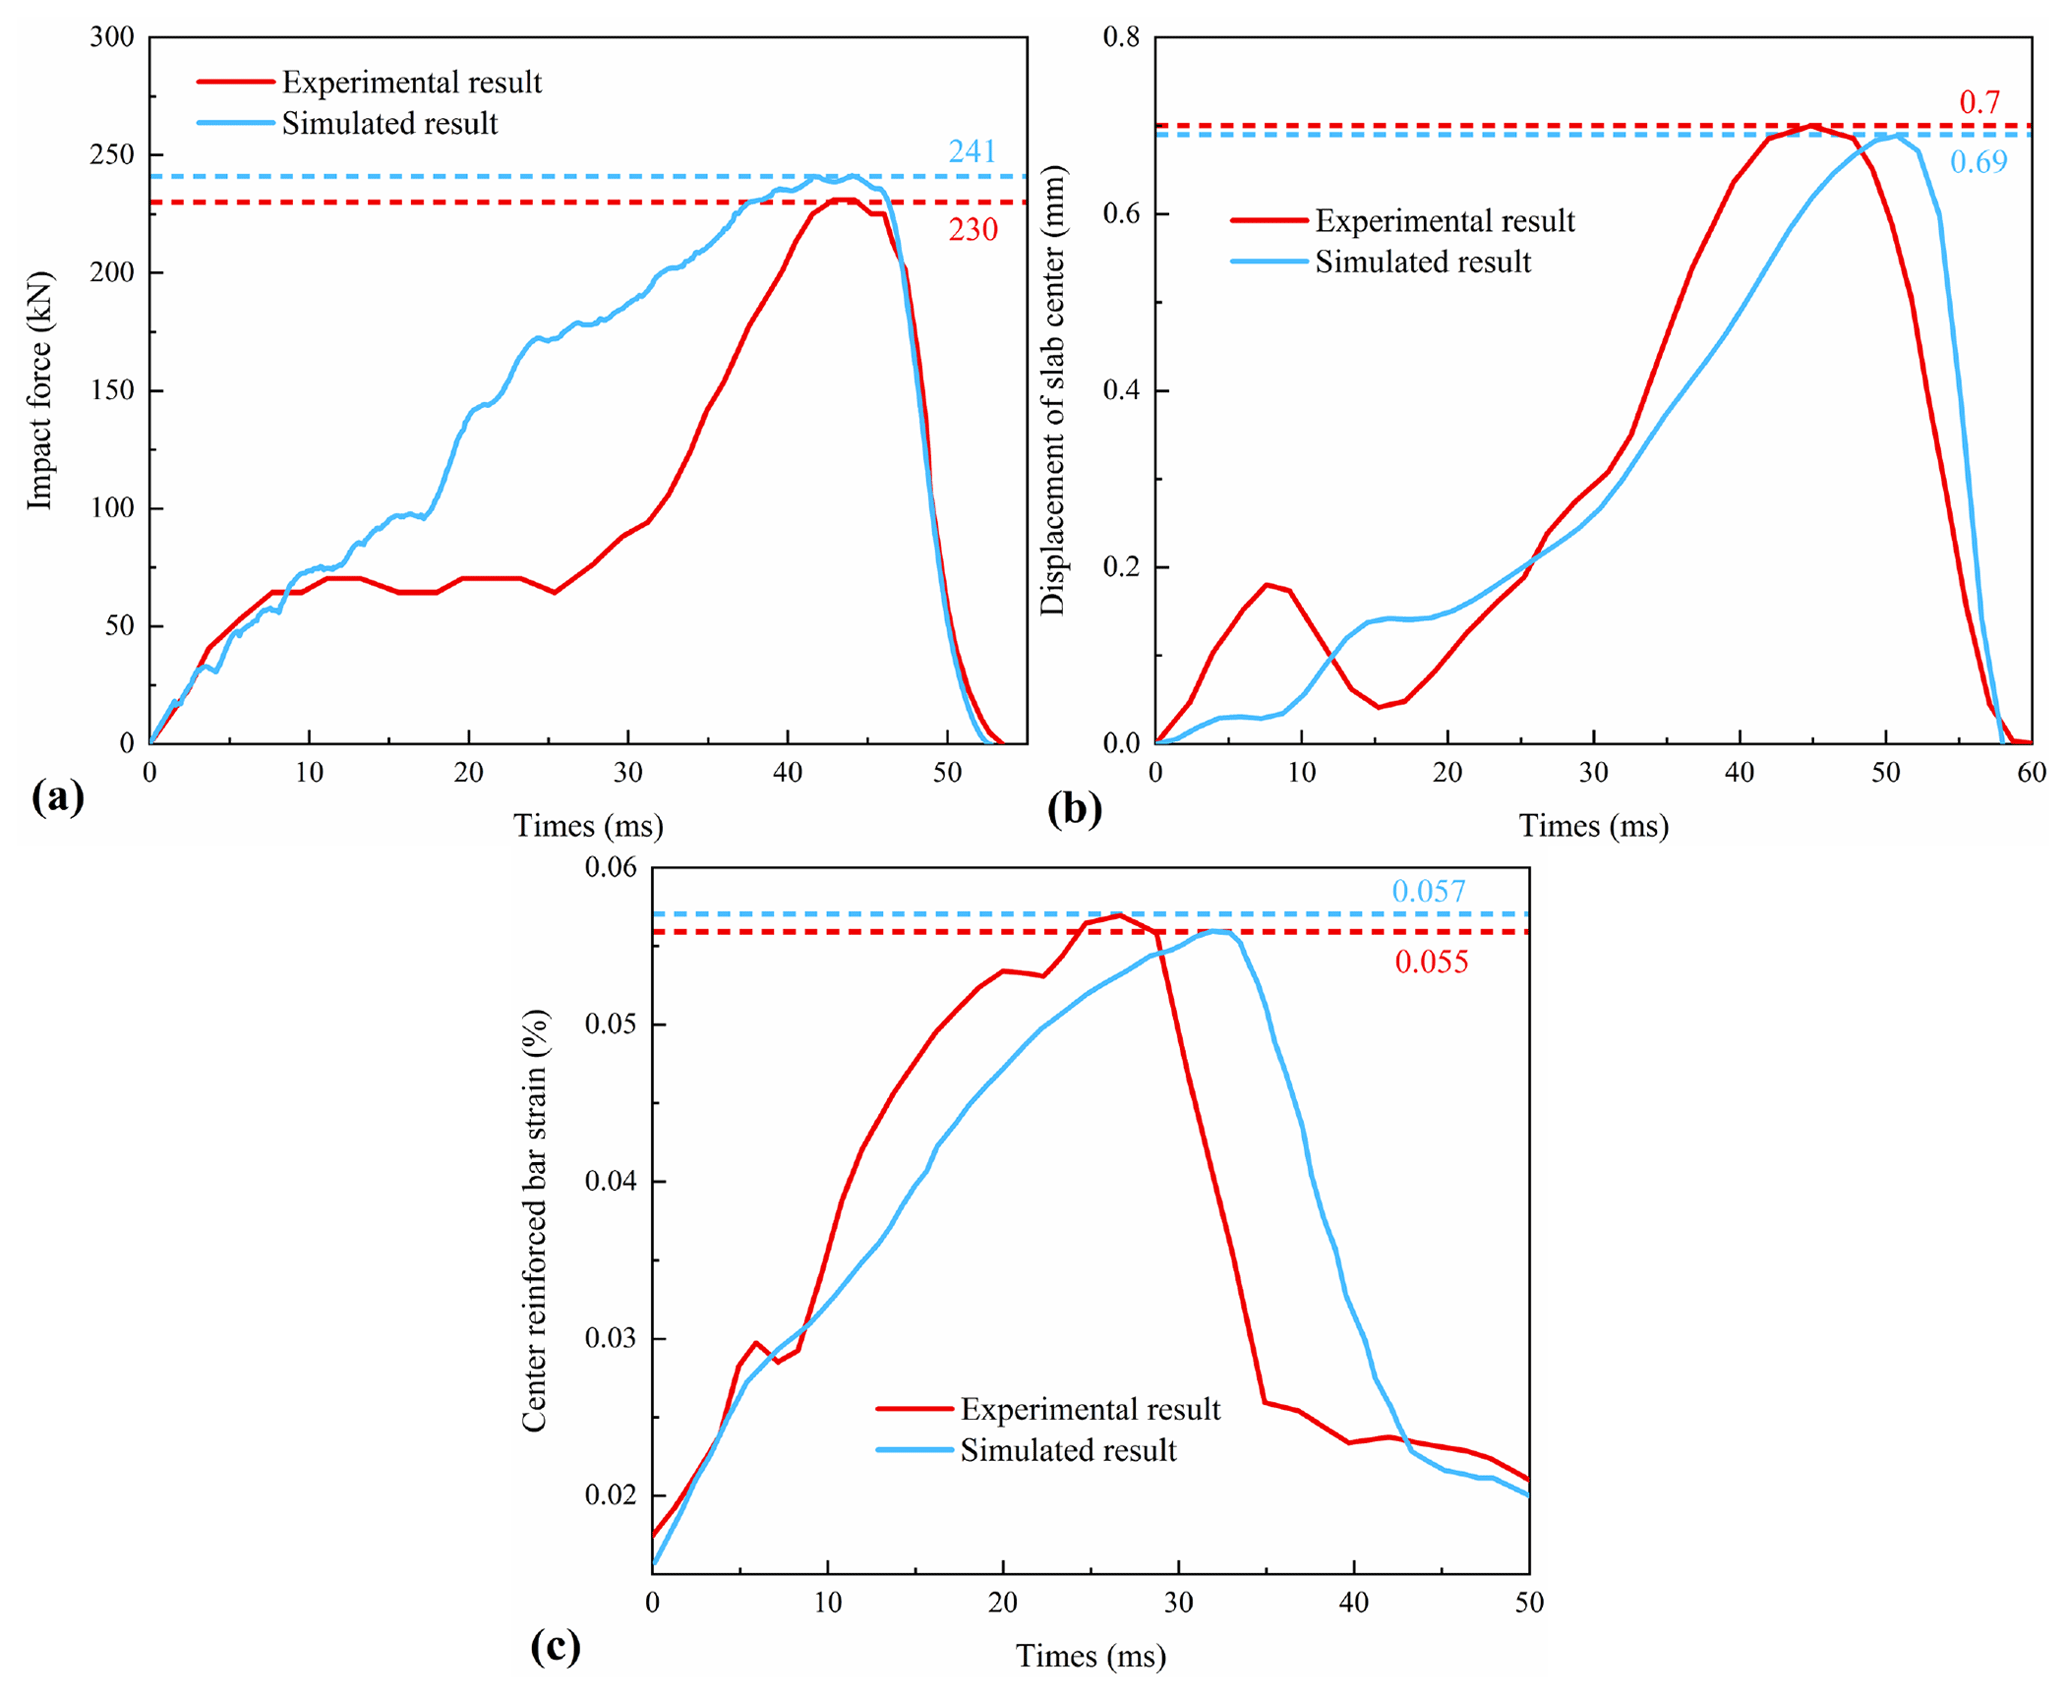
Figure 9Comparisons between experimental and simulation results. (a) Impact force, (b) displacement of slab center, and (c) axial strain of reinforced bar.
Figure 9 presents the dynamic curve of the impact force, the displacement of the slab center, and the axial strain of the reinforced bar's center. The results demonstrate that the deviations of the peak impact force, the maximum strain of the reinforced bar, and the slab center displacement are less than 10 %. Therefore, the numerical model and its governing parameters are deemed reliable for simulating the behavior of a sand cushion layer and an RC structure under impact loads.
In this section, the dynamic responses of the PSRW under different impact centers and different impact velocities are compared and analyzed. The main evaluation indexes are as follows: impact force (the contact force between the impactor and the buffer layer), interaction force (the contact force between the buffer layer and the RC structure), stress of concrete and reinforced bar, concrete damage, lateral displacement at the crown of different components (piles and slabs), and lateral displacement of all piles at the ground surface.
3.1 Influence of different impact centers
To analyze the influence of dynamic behaviors of the PSRW under different impact centers, two group simulations under maximum impact energy (CP-V30 and CS-V30) are selected for comparison.
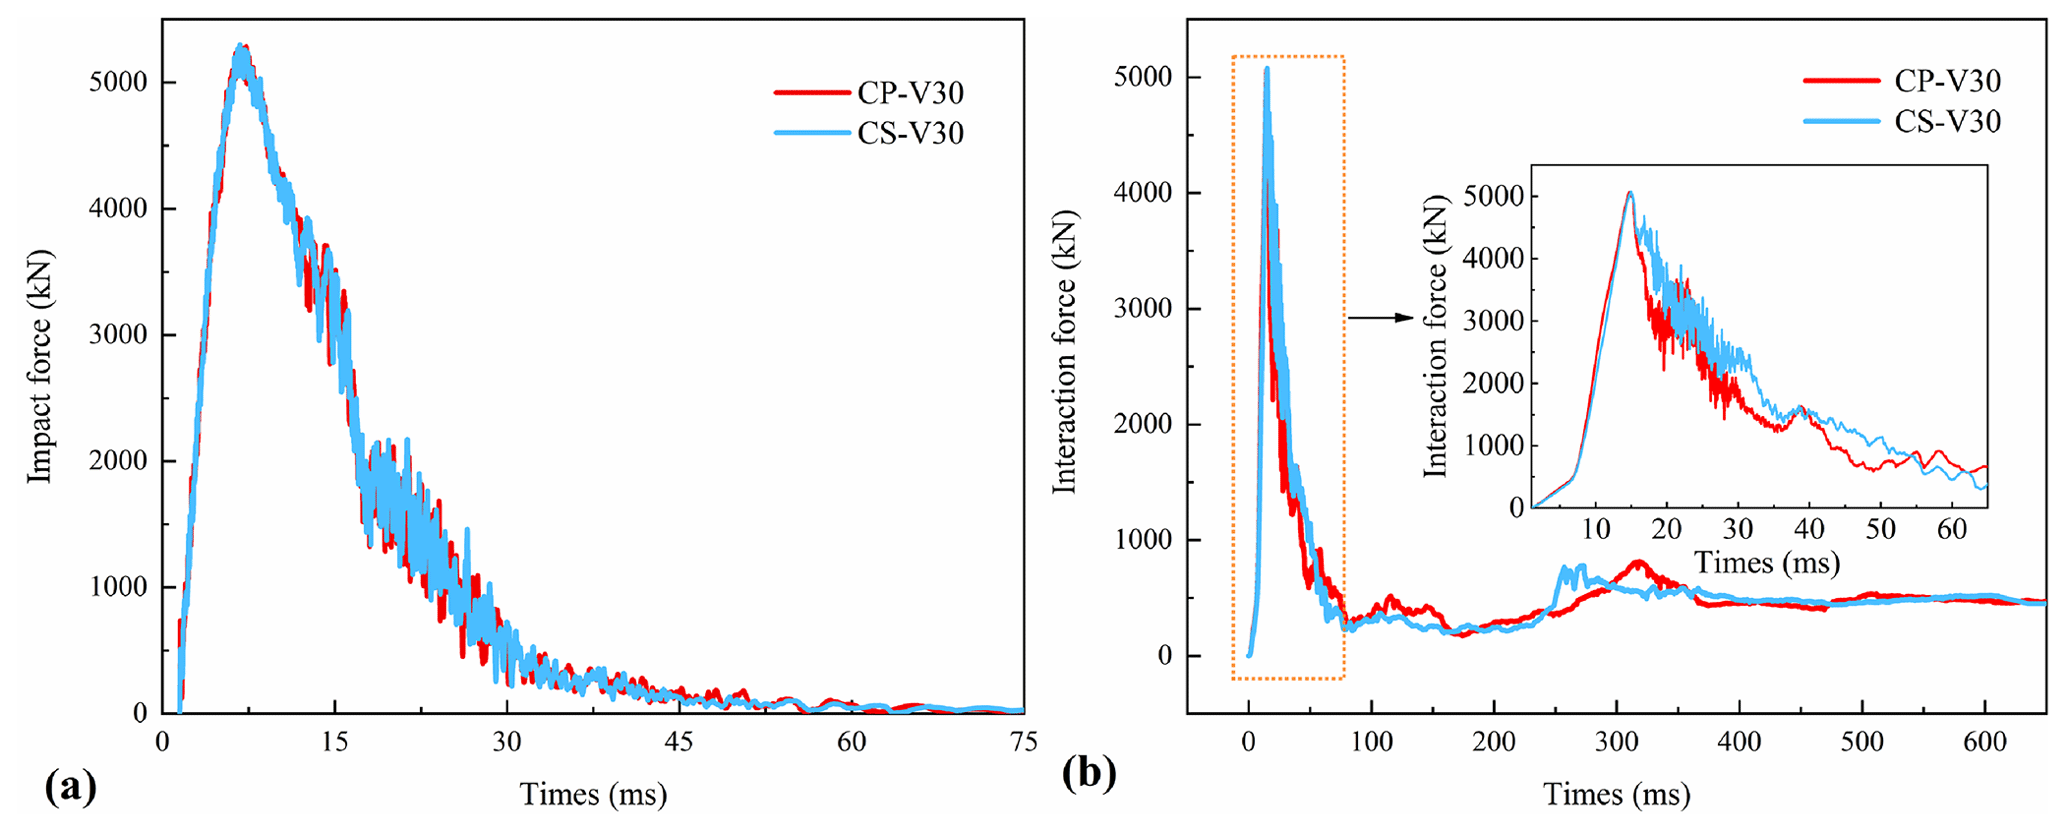
Figure 10Dynamic curves of impact force (a) and interaction force (b) under various impact centers.
3.1.1 Impact force and interaction force
Figures 10a and 9b show the dynamic curves of the impact force and interaction force, respectively. Both force curves exhibit a distinct single-peaked pattern. The impact force rapidly reduces to zero due to the energy-dissipating properties of the sand buffer layer (Fig. 10a). In contrast, the interaction force remains at a non-zero value (475 kN) (Fig. 10b). Owing to the permanent deformation sustained by the structure, the gravitational force exerted by the sand buffer acts on the surface of the structure. Furthermore, Fig. 10a illustrates the close overlap of the impact forces for various impact centers, depending on the buffer and impactor characteristics, and shows that they are minimally affected by the impact center. The slight differences observed in the dynamic curve of the interaction force under CP-V30 and CS-V30 may be attributed to the flexural stiffness of the slab and pile.
3.1.2 Stress of concrete
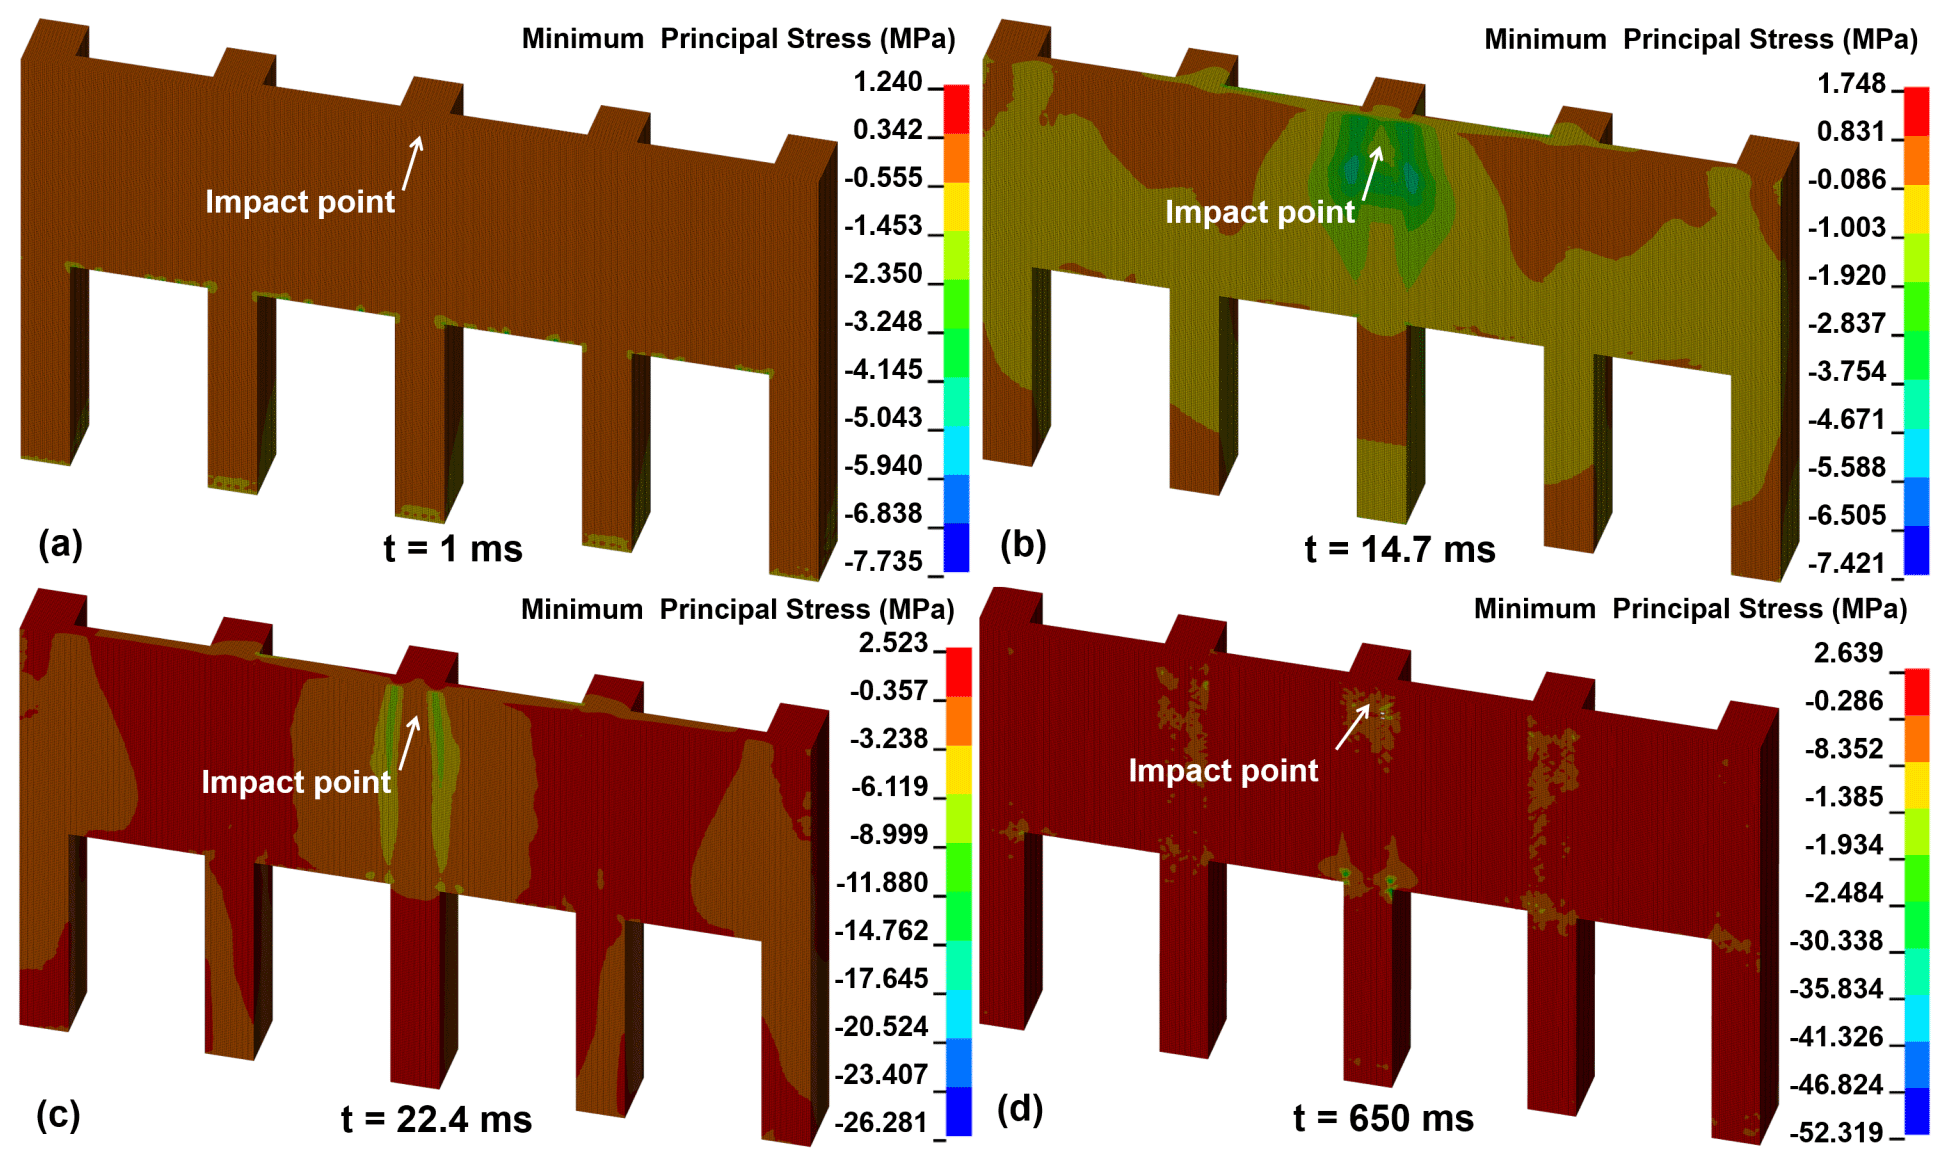
The minimum principal stress of concrete and the effective stress of reinforced bar are important indexes for evaluating the dynamic response of RC structures (Zhong et al., 2021; Zhong et al., 2022). Figure 11 shows the minimum principal stress nephogram of concrete under CP-V30 from 1 to 650 ms. When t = 1 ms (Fig. 11a), the minimum stress is focused on the bottom of the piles. When t = 14.7 ms (Fig. 11b), the minimum principal stress of concrete around the impact point increases rapidly to 7.421 MPa. When t = 22.8 ms (Fig. 11c), the concrete elements at the joints of the no. 3 pile and slabs achieve compressive strength, leading to concrete damage. When t = 650 ms (Fig. 11d), the total volume of damaged elements reaches 0.63 m3, which occupies a proportion of 0.35 %.
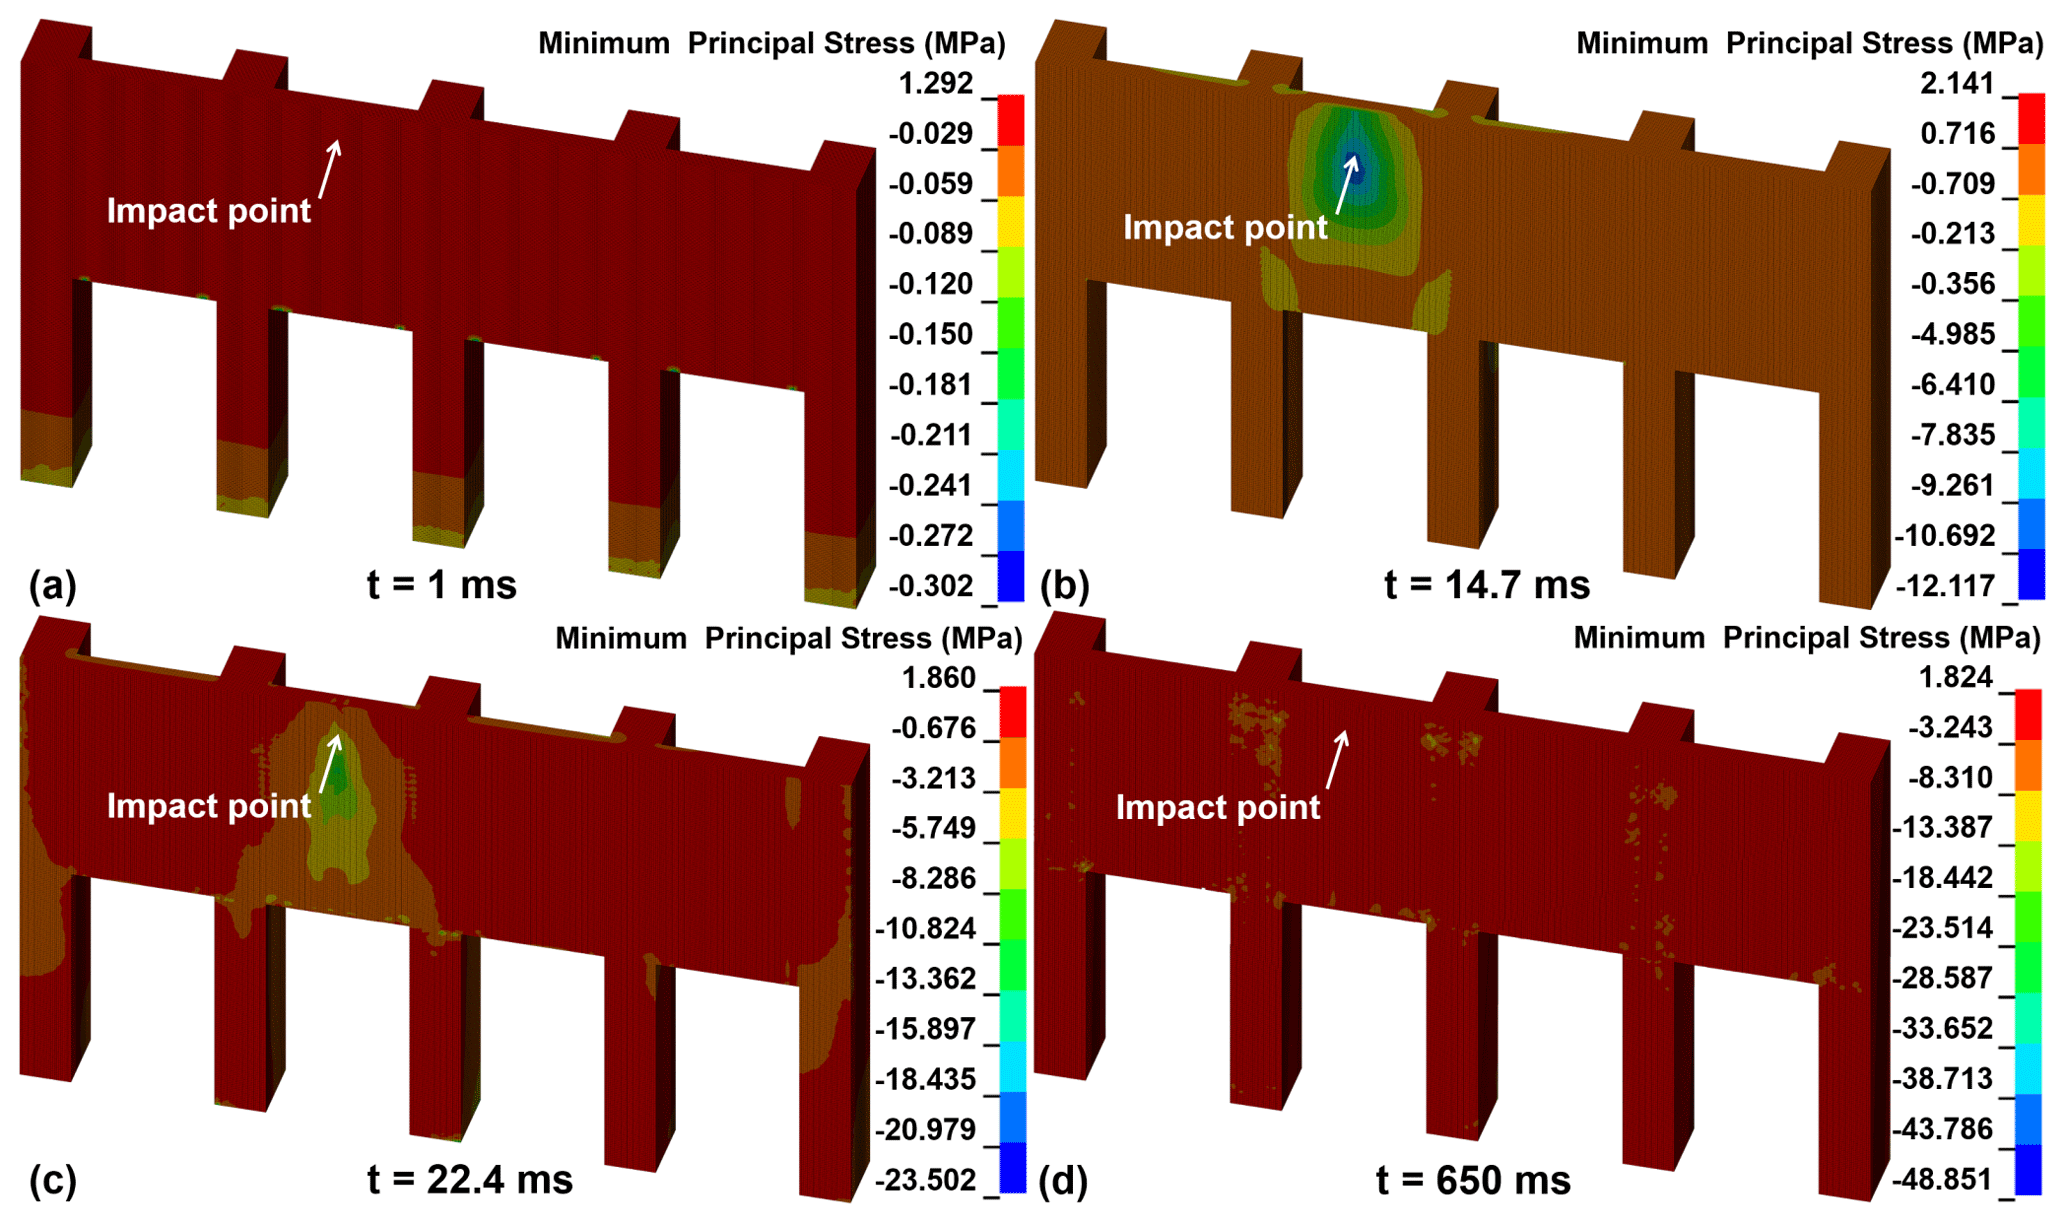
Figure 12 shows the minimum principal stress nephogram of concrete under CP-V30 from 1 to 650 ms. When t = 1 ms, the maximum stress is focused on the bottom of the piles (Fig. 12a). When t = 14.7 ms, the minimum principal stress around the impact point increases rapidly to 12.117 MPa (Fig. 12b). When t = 22.4 ms, the elements of the concrete at the impact point of the no. 2 slab achieve ultimate compressive strength, leading to the concrete damage (Fig. 12c). When t = 650 ms, the total volume of damage elements reaches 0.61 m3 (Fig. 12d), which occupies a proportion of 0.34 %.
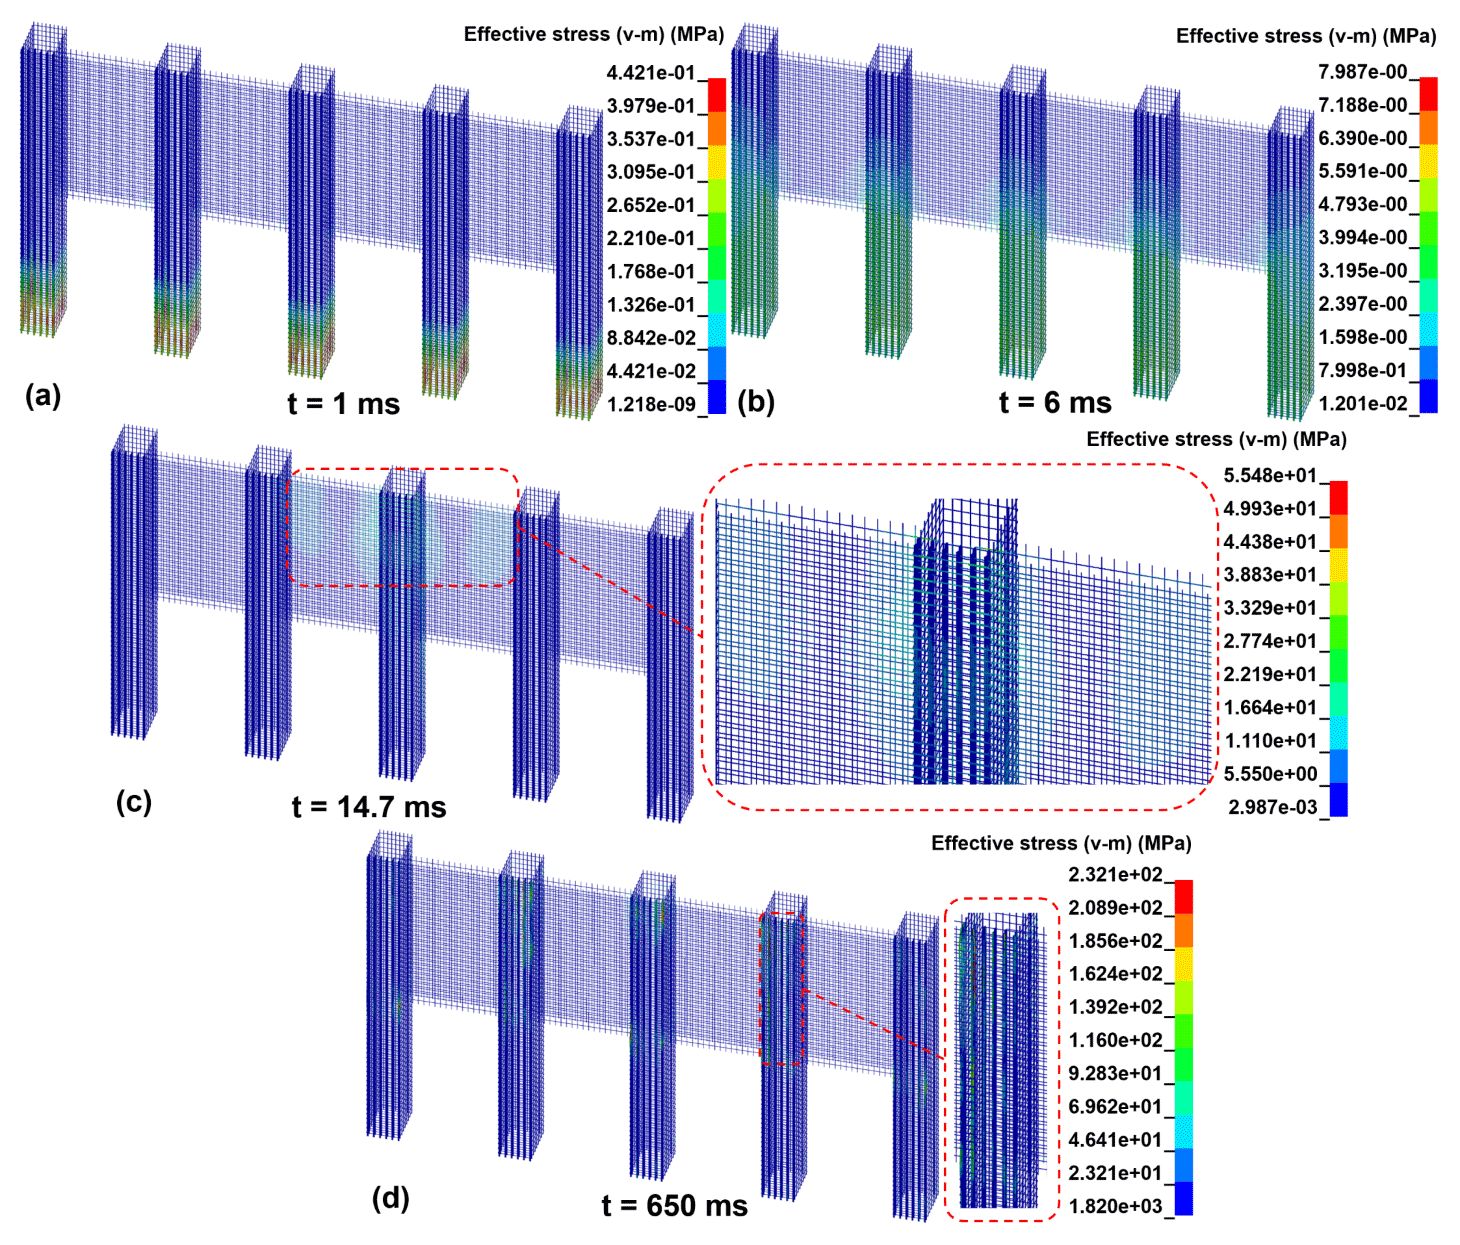
3.1.3 Stress of reinforced bar
Figure 13 shows the effective stress nephogram of the reinforced bar from 1 to 650 ms under the condition of CP-V30. It can be observed that (i) when t = 1 ms, the maximum stress concentrated at the bottom of the pile (Fig. 13a); (ii) when t = 14.7 ms (the moment of attaining the maximum interaction force), the maximum stress concentrated in the vicinity of the impact point and the joints of piles and slabs (Fig. 13c); and (iii) when t = 650 ms, the maximum stress concentrated at the longitudinal bar of the no. 2, 3, and 4 piles (Fig. 13d). Noteworthily, the effective stress of the reinforced bar did not exceed the ultimate yield stress.
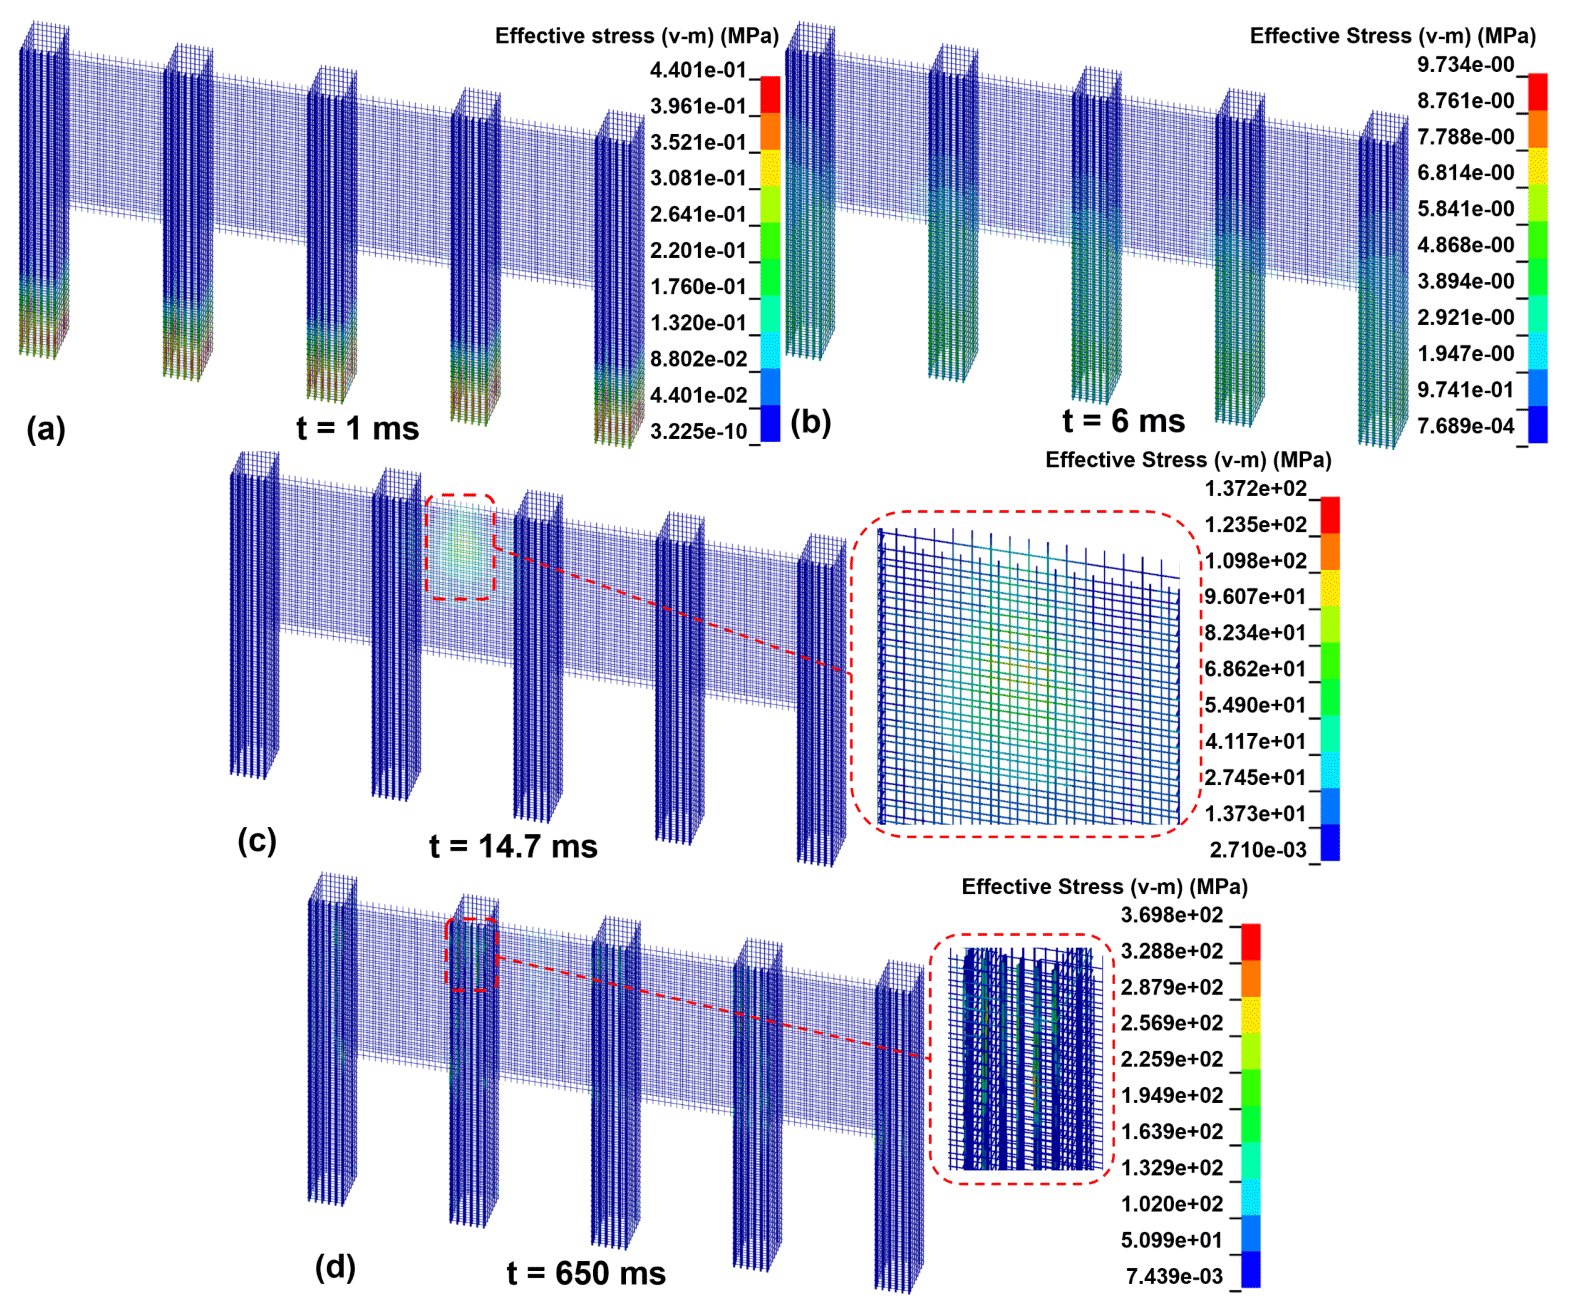
Figure 14 shows the effective stress nephogram of the reinforced bar from 1 to 650 ms under CS-V30. It can be observed that (i) when t = 1 ms, the maximum stress concentrated at the bottom of the pile (Fig. 14a); (ii) when t = 14.7 ms, the effective stress of the reinforced bar around the impact point increased rapidly to 137.2 MPa (Fig. 14c); and (iii) when t = 650 ms, the maximum stress concentrated at the longitudinal bar of the no. 2, 3, and 4 piles (Fig. 14d). Noteworthily, the effective stress of the reinforced bar did not exceed the ultimate yield stress.
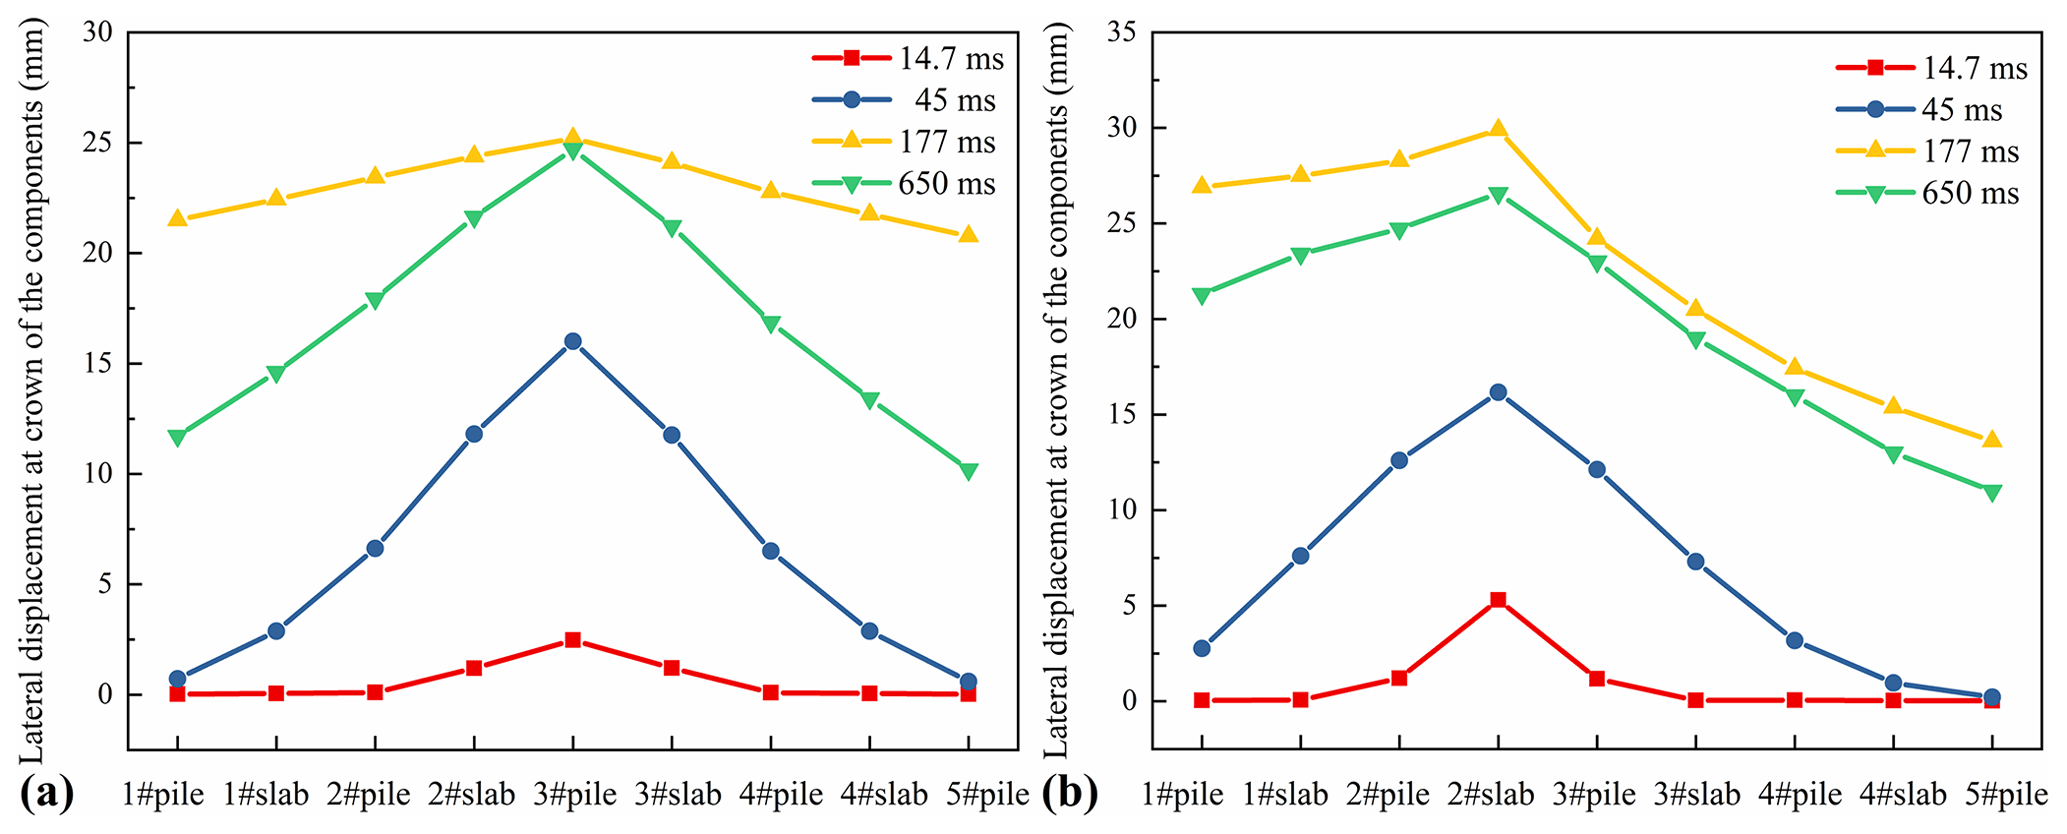
3.1.4 Lateral displacement at the crown of different components
Figure 15a presents lateral displacements at the crown of different components under CP-V30 and CS-V30 conditions. The lateral displacement rapidly increased until t = 177 ms and gradually decreased until t = 650 ms. The final displacement does not reach 0, indicating plastic deformation of both the pile and the slab. Comparing the lateral displacement under CS-V30 and CP-V30 (Fig. 15), the trends are consistent, but the magnitude differs. This discrepancy in magnitude can be attributed to the greater deformation capacity of slab compared to pile when subjected to the same impact energy.
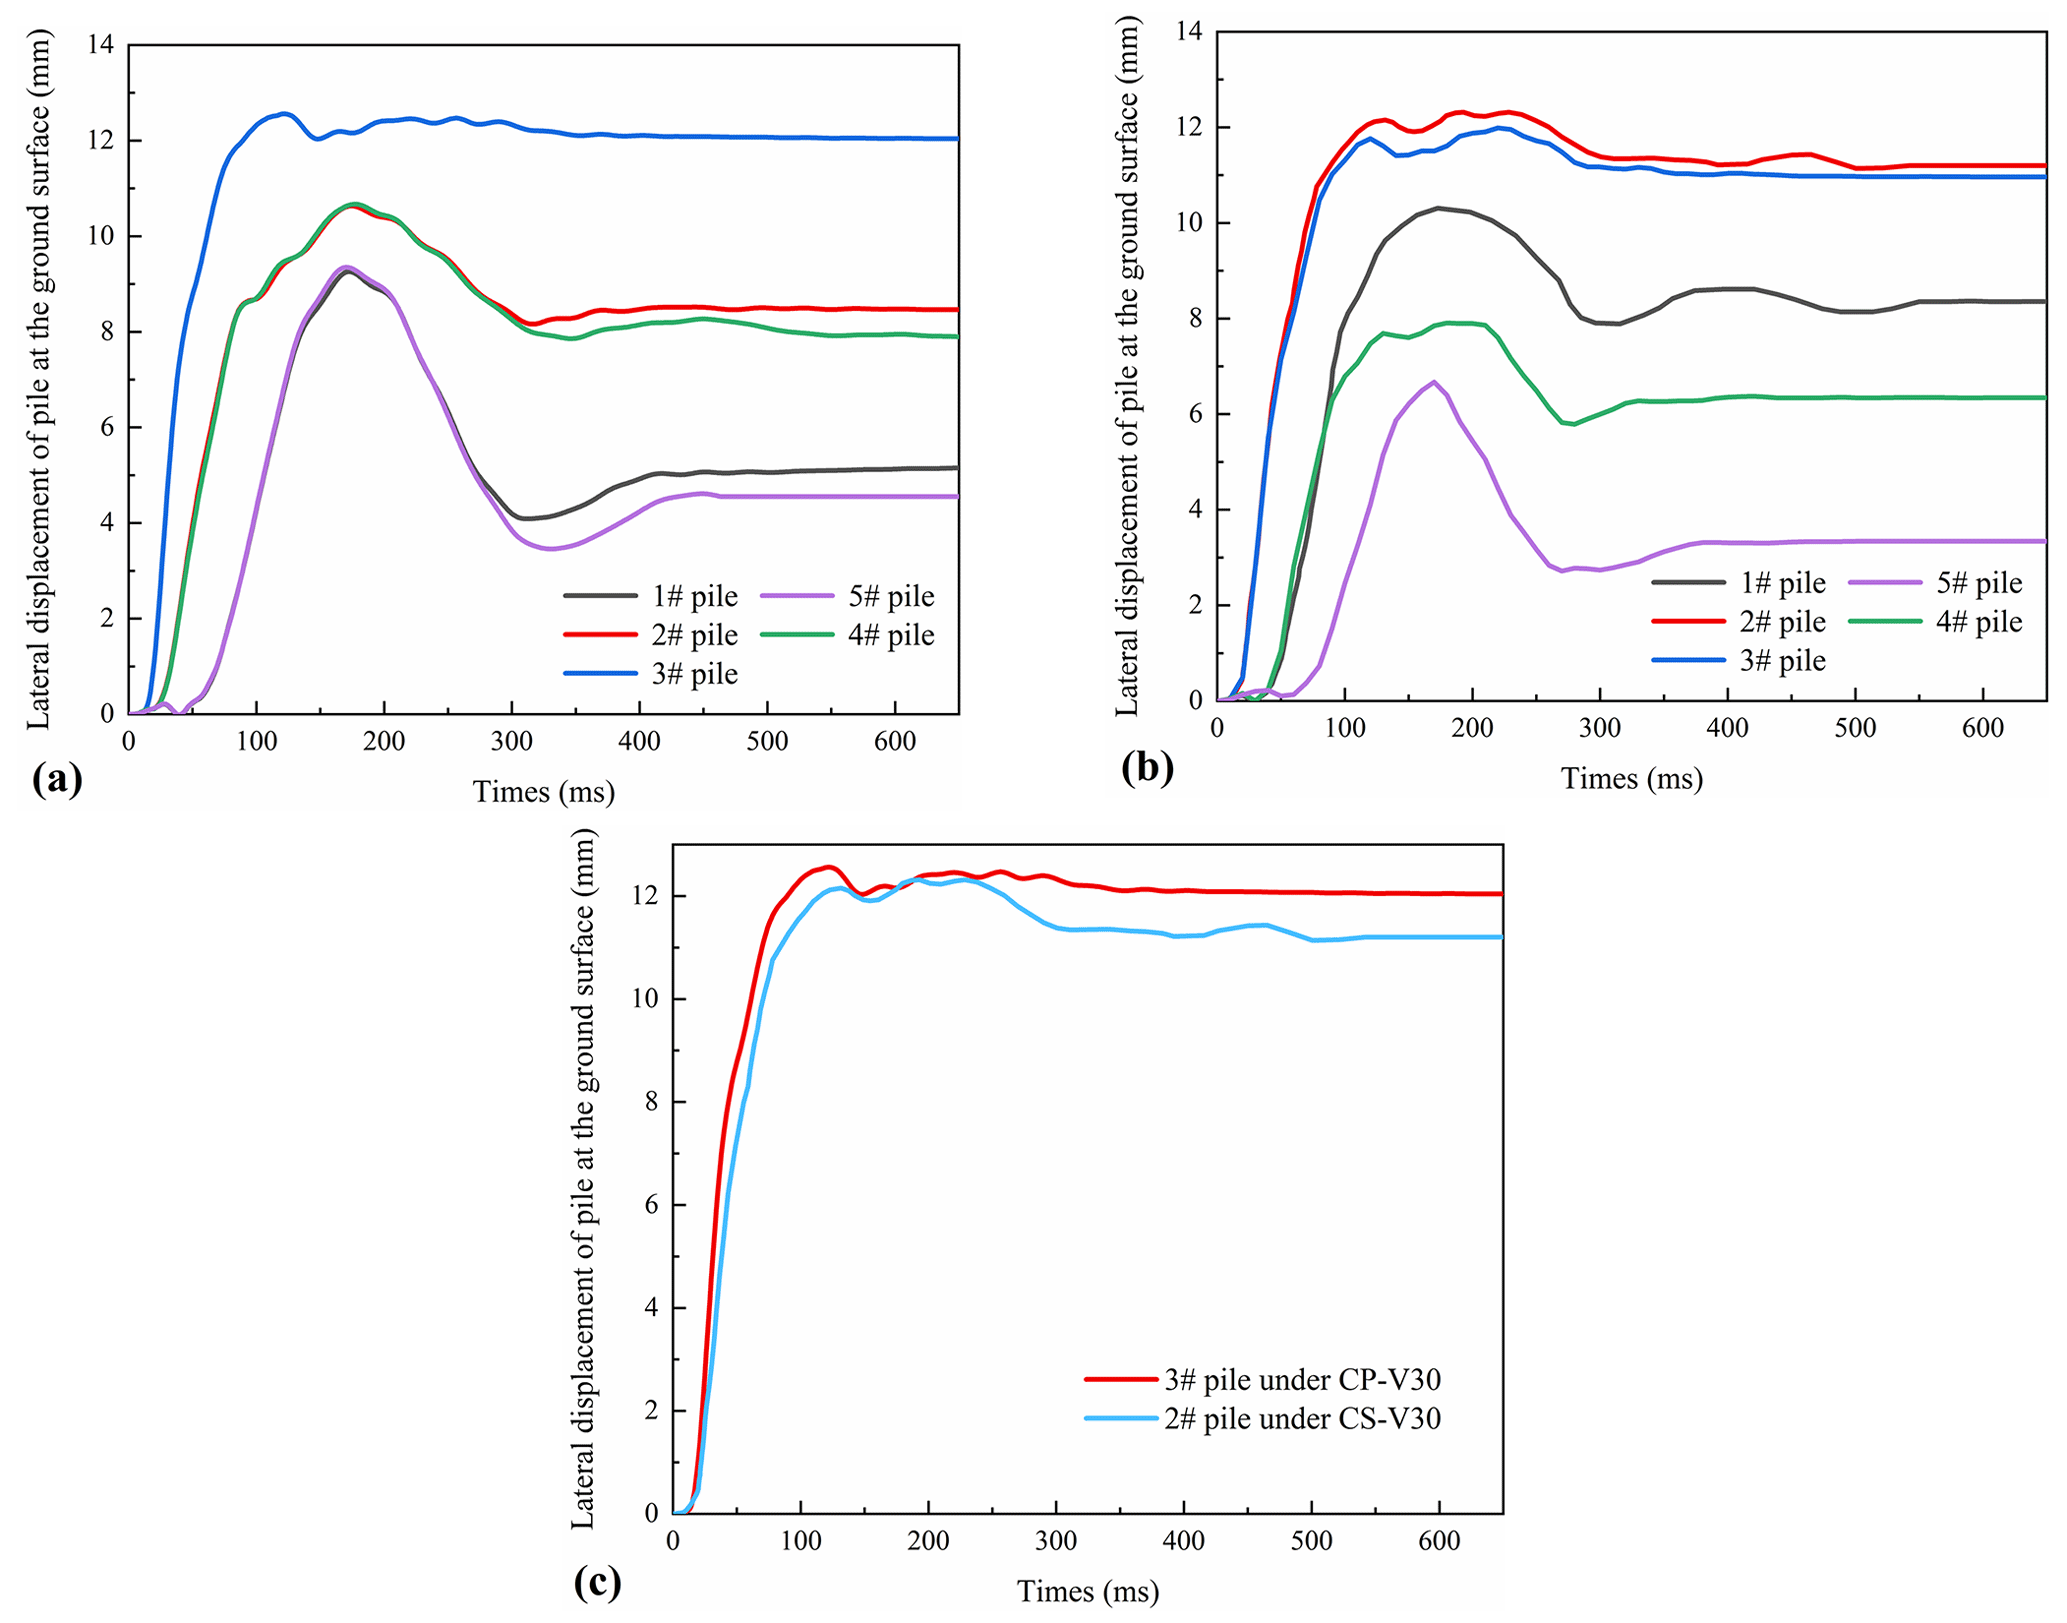
Figure 16Dynamic curves of the lateral displacement of the pile at the ground surface. (a) CP-V30, (b) CS-V30, and (c) comparison between CP-V30 and CS-V30.
3.1.5 Lateral displacement of piles at the ground surface
Figure 16a and b show the dynamic curve of the lateral displacement of all piles at the ground surface under CP-V30 and CS-V30, respectively. Under CP-V30, the no. 3 pile exhibited the maximum lateral displacement, whereas the no. 2 pile exhibited the maximum lateral displacement under CS-V30. This discrepancy is due to the structural asymmetry on either side of the impact center under CS-V30, which allows one side of pile no. 2 greater freedom, resulting in larger lateral displacement. When comparing the lateral displacement of the no. 2 pile under CS-V30 and the no. 3 pile under CP-V30 (Fig. 16c), it is apparent that the maximum lateral displacement of the pile at the ground surface is greater under CP conditions, despite the fact that it has the same impact velocity. The characteristics of the lateral displacements suggest that the concrete slab is capable of undergoing larger deformations and absorbing more energy.
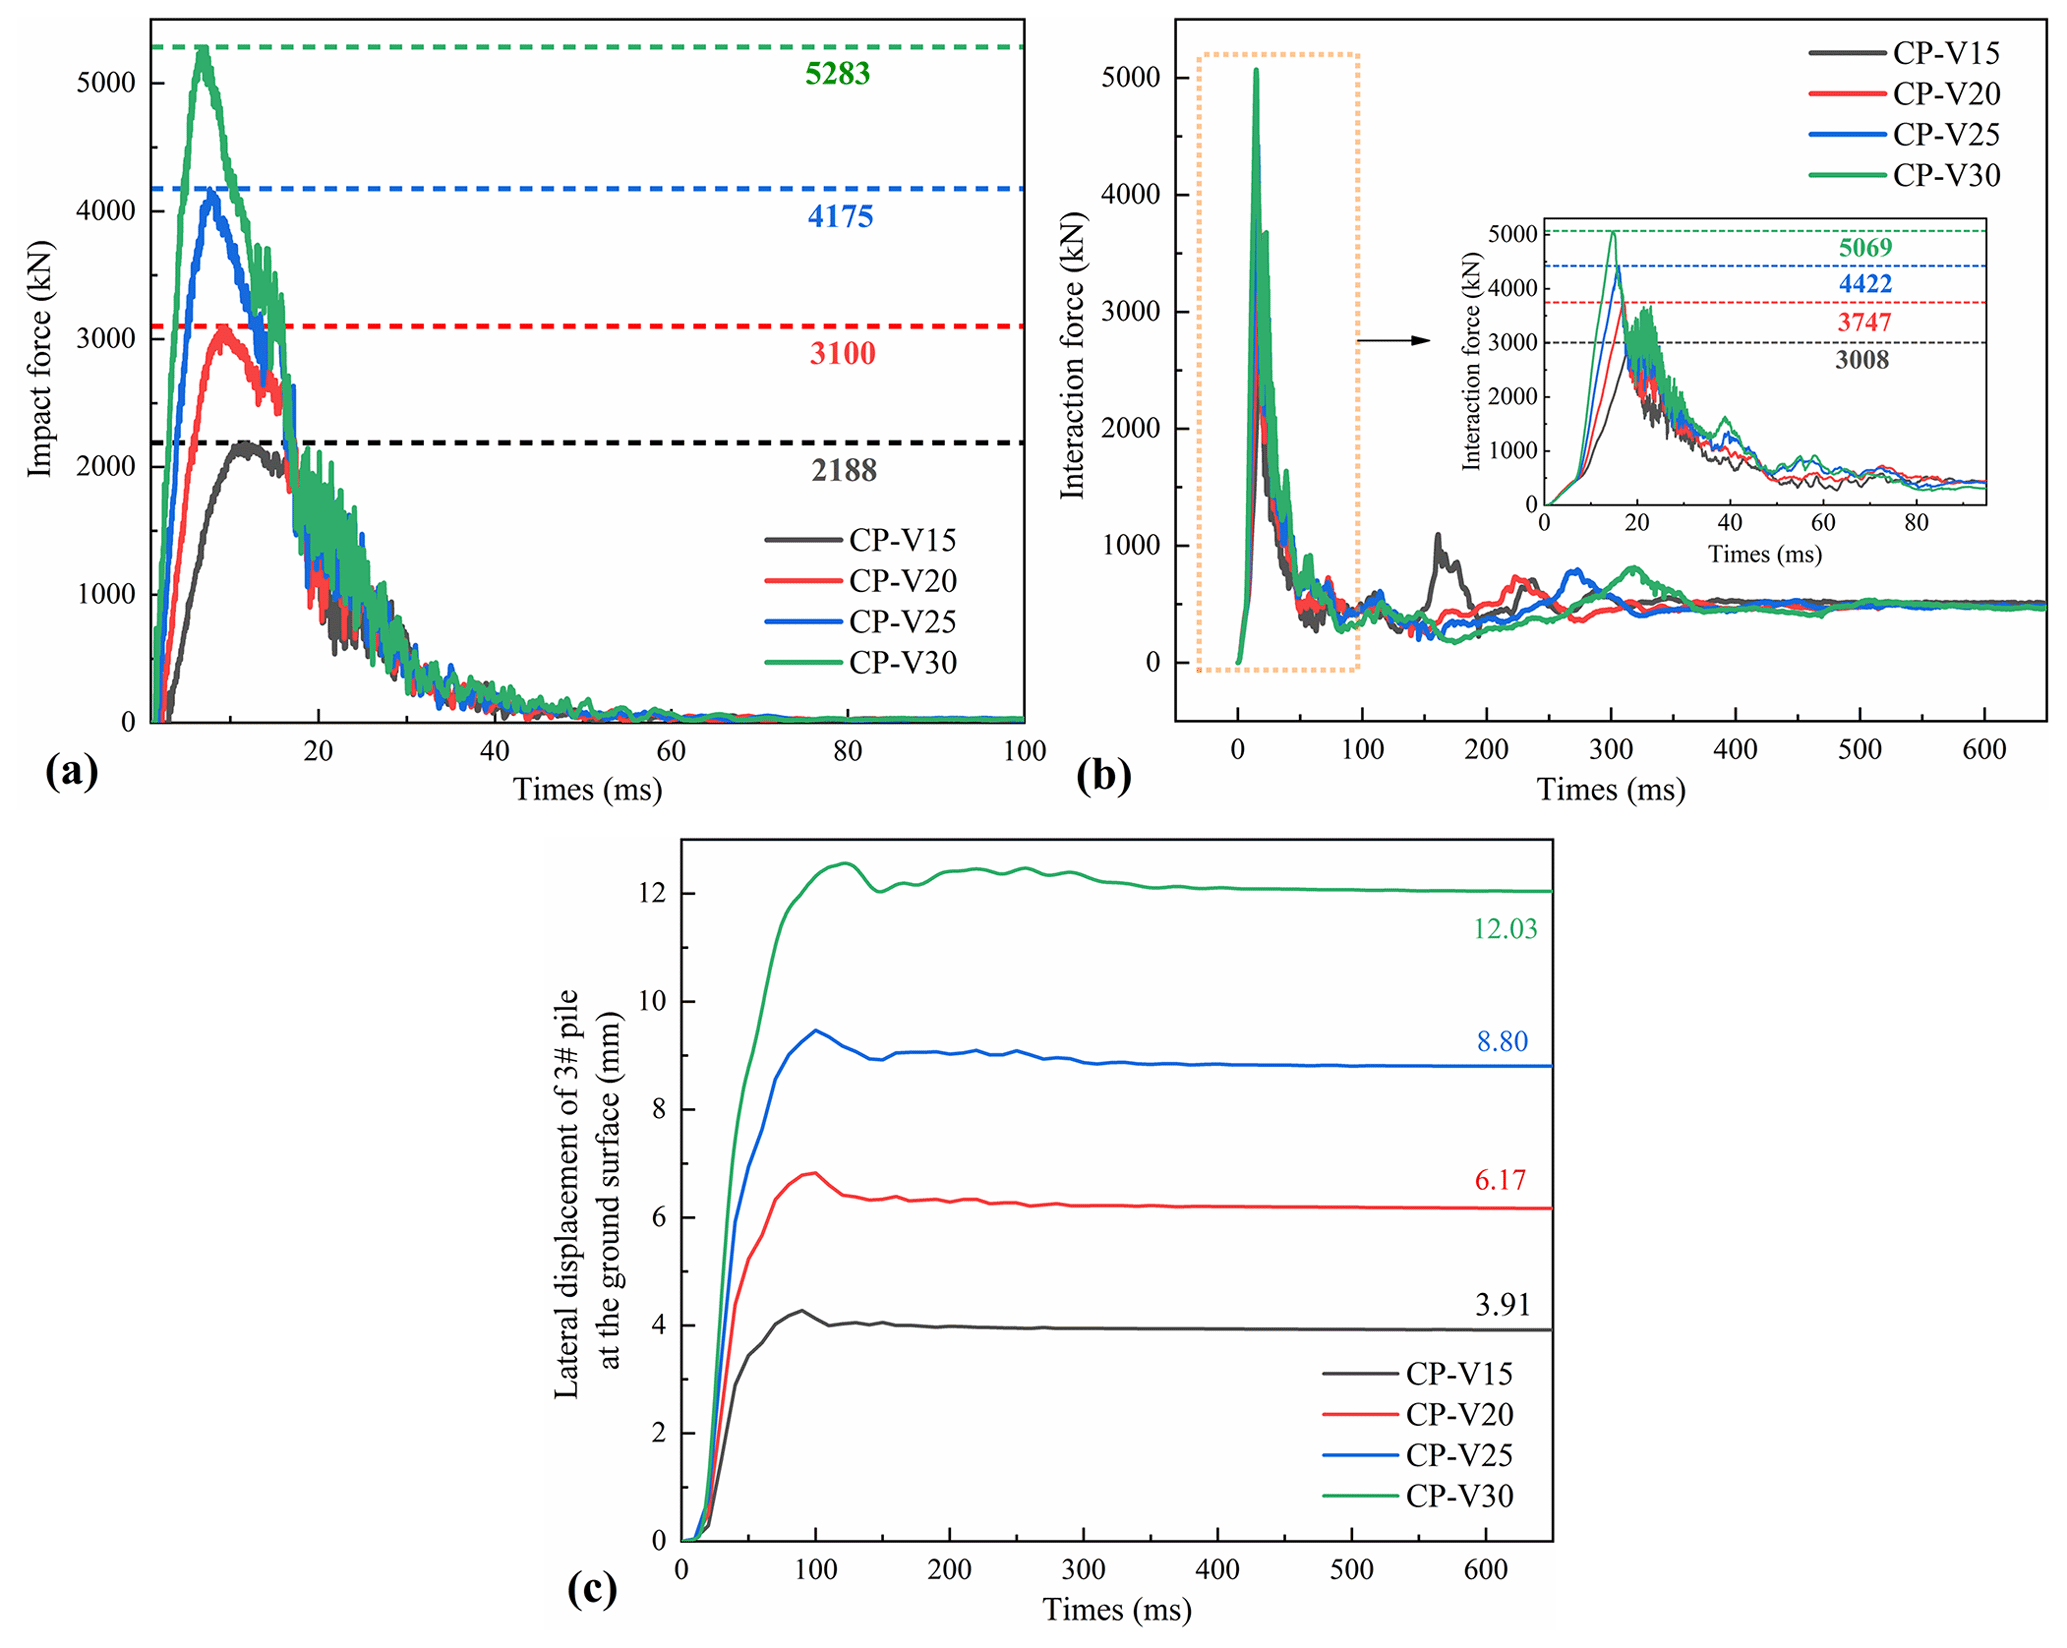
Figure 17Dynamic curves of evaluation indexes under various velocities. (a) Impact force, (b) interactional force, and (c) lateral displacement at the ground surface of the no. 3 pile.
3.2 Influence of different impact velocities
Figure 17 demonstrates that under CP conditions, the impact force, interaction force, and lateral displacement of the no. 3 pile at the ground surface increase as the impact velocity of rockfall rises. When the velocity increases from 15 to 30 m s−1, the impact force increases by 1.42, 1.91, and 2.41; the interaction force increases by 1.25, 1.47, and 1.68; and the lateral displacement of the no. 3 pile at the ground surface increases by 1.57, 2.24, and 3 at t = 650 ms. By comparing the magnitude of changes, the lateral displacement is more sensitive to velocity variations than impact force and structural interaction force.
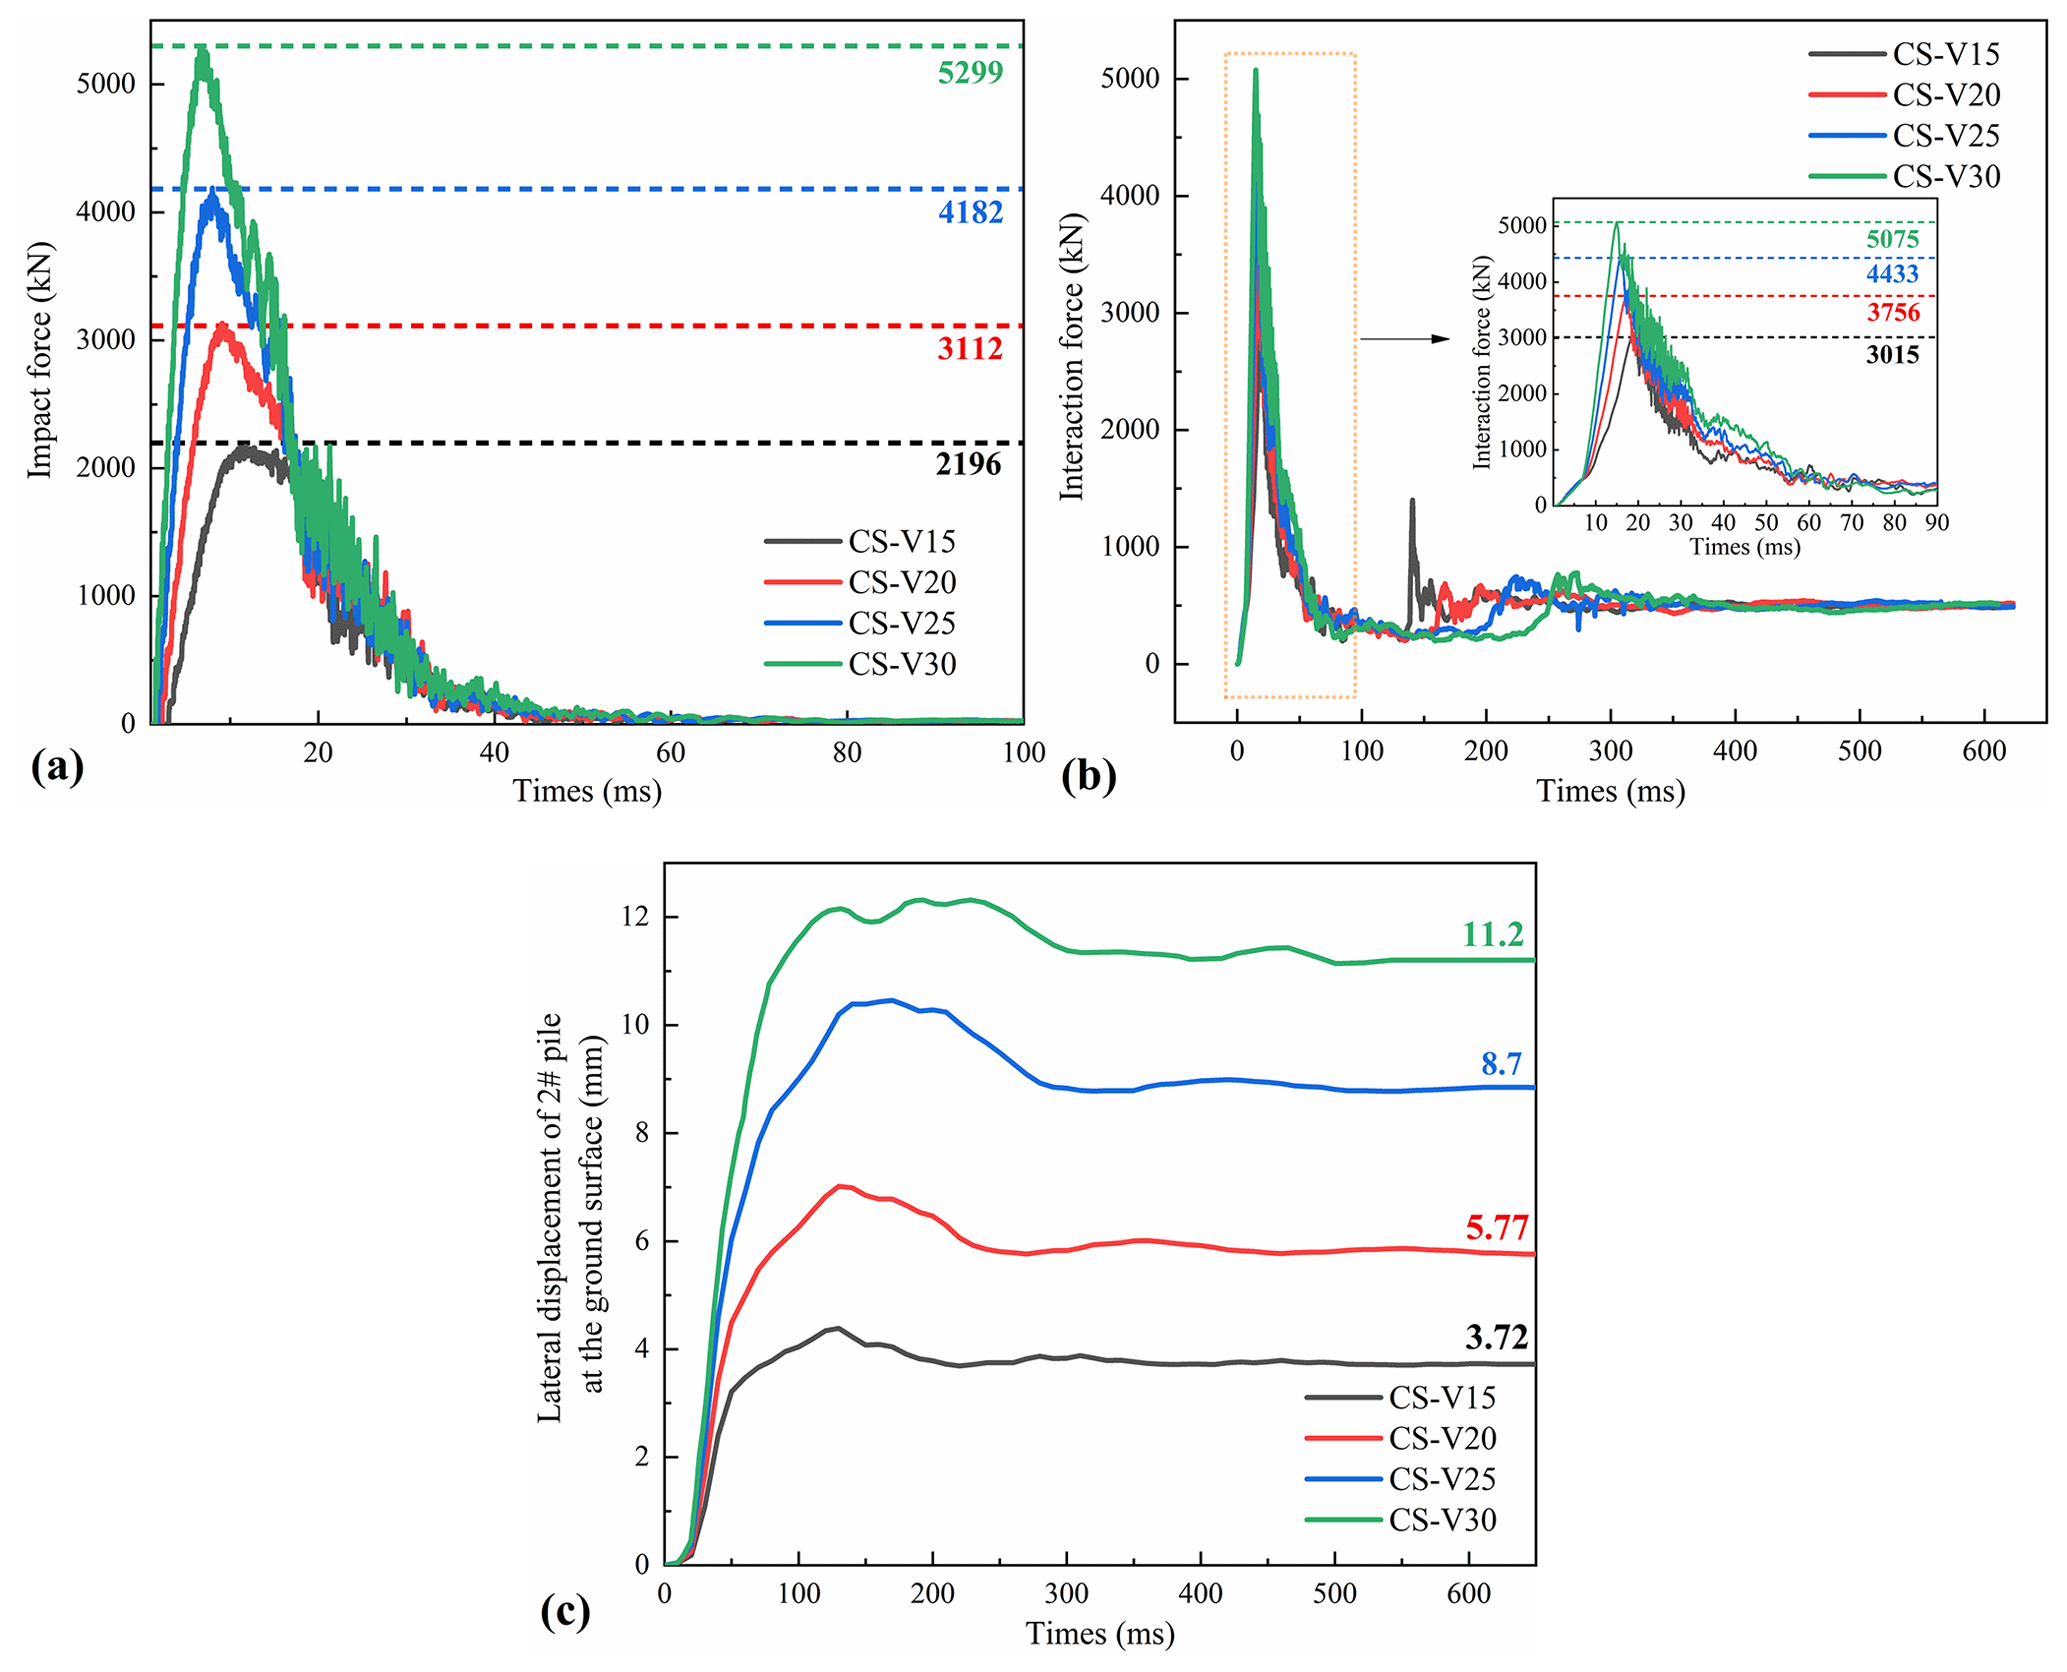
Figure 18Dynamic curves of evaluation indexes under various velocities. (a) Impact force, (b) interactional force, and (c) lateral displacement at the ground surface of the no. 2 pile.
Figure 18 shows an increase in the impact force, interaction force, and lateral displacement of the no. 2 pile at the ground surface as the impact velocity increases under CS conditions. When the velocity increases from 15 to 30 m s−1, the impact force increases by 1.41, 1.90, and 2.41; the interaction force increases by 1.24, 1.47, and 1.68; and the lateral displacement of the no. 3 pile at the ground surface increases by 1.55, 2.23, and 3 at t = 650 ms. Similar to the CP conditions, the lateral displacement is still the most sensitive to velocity variations.
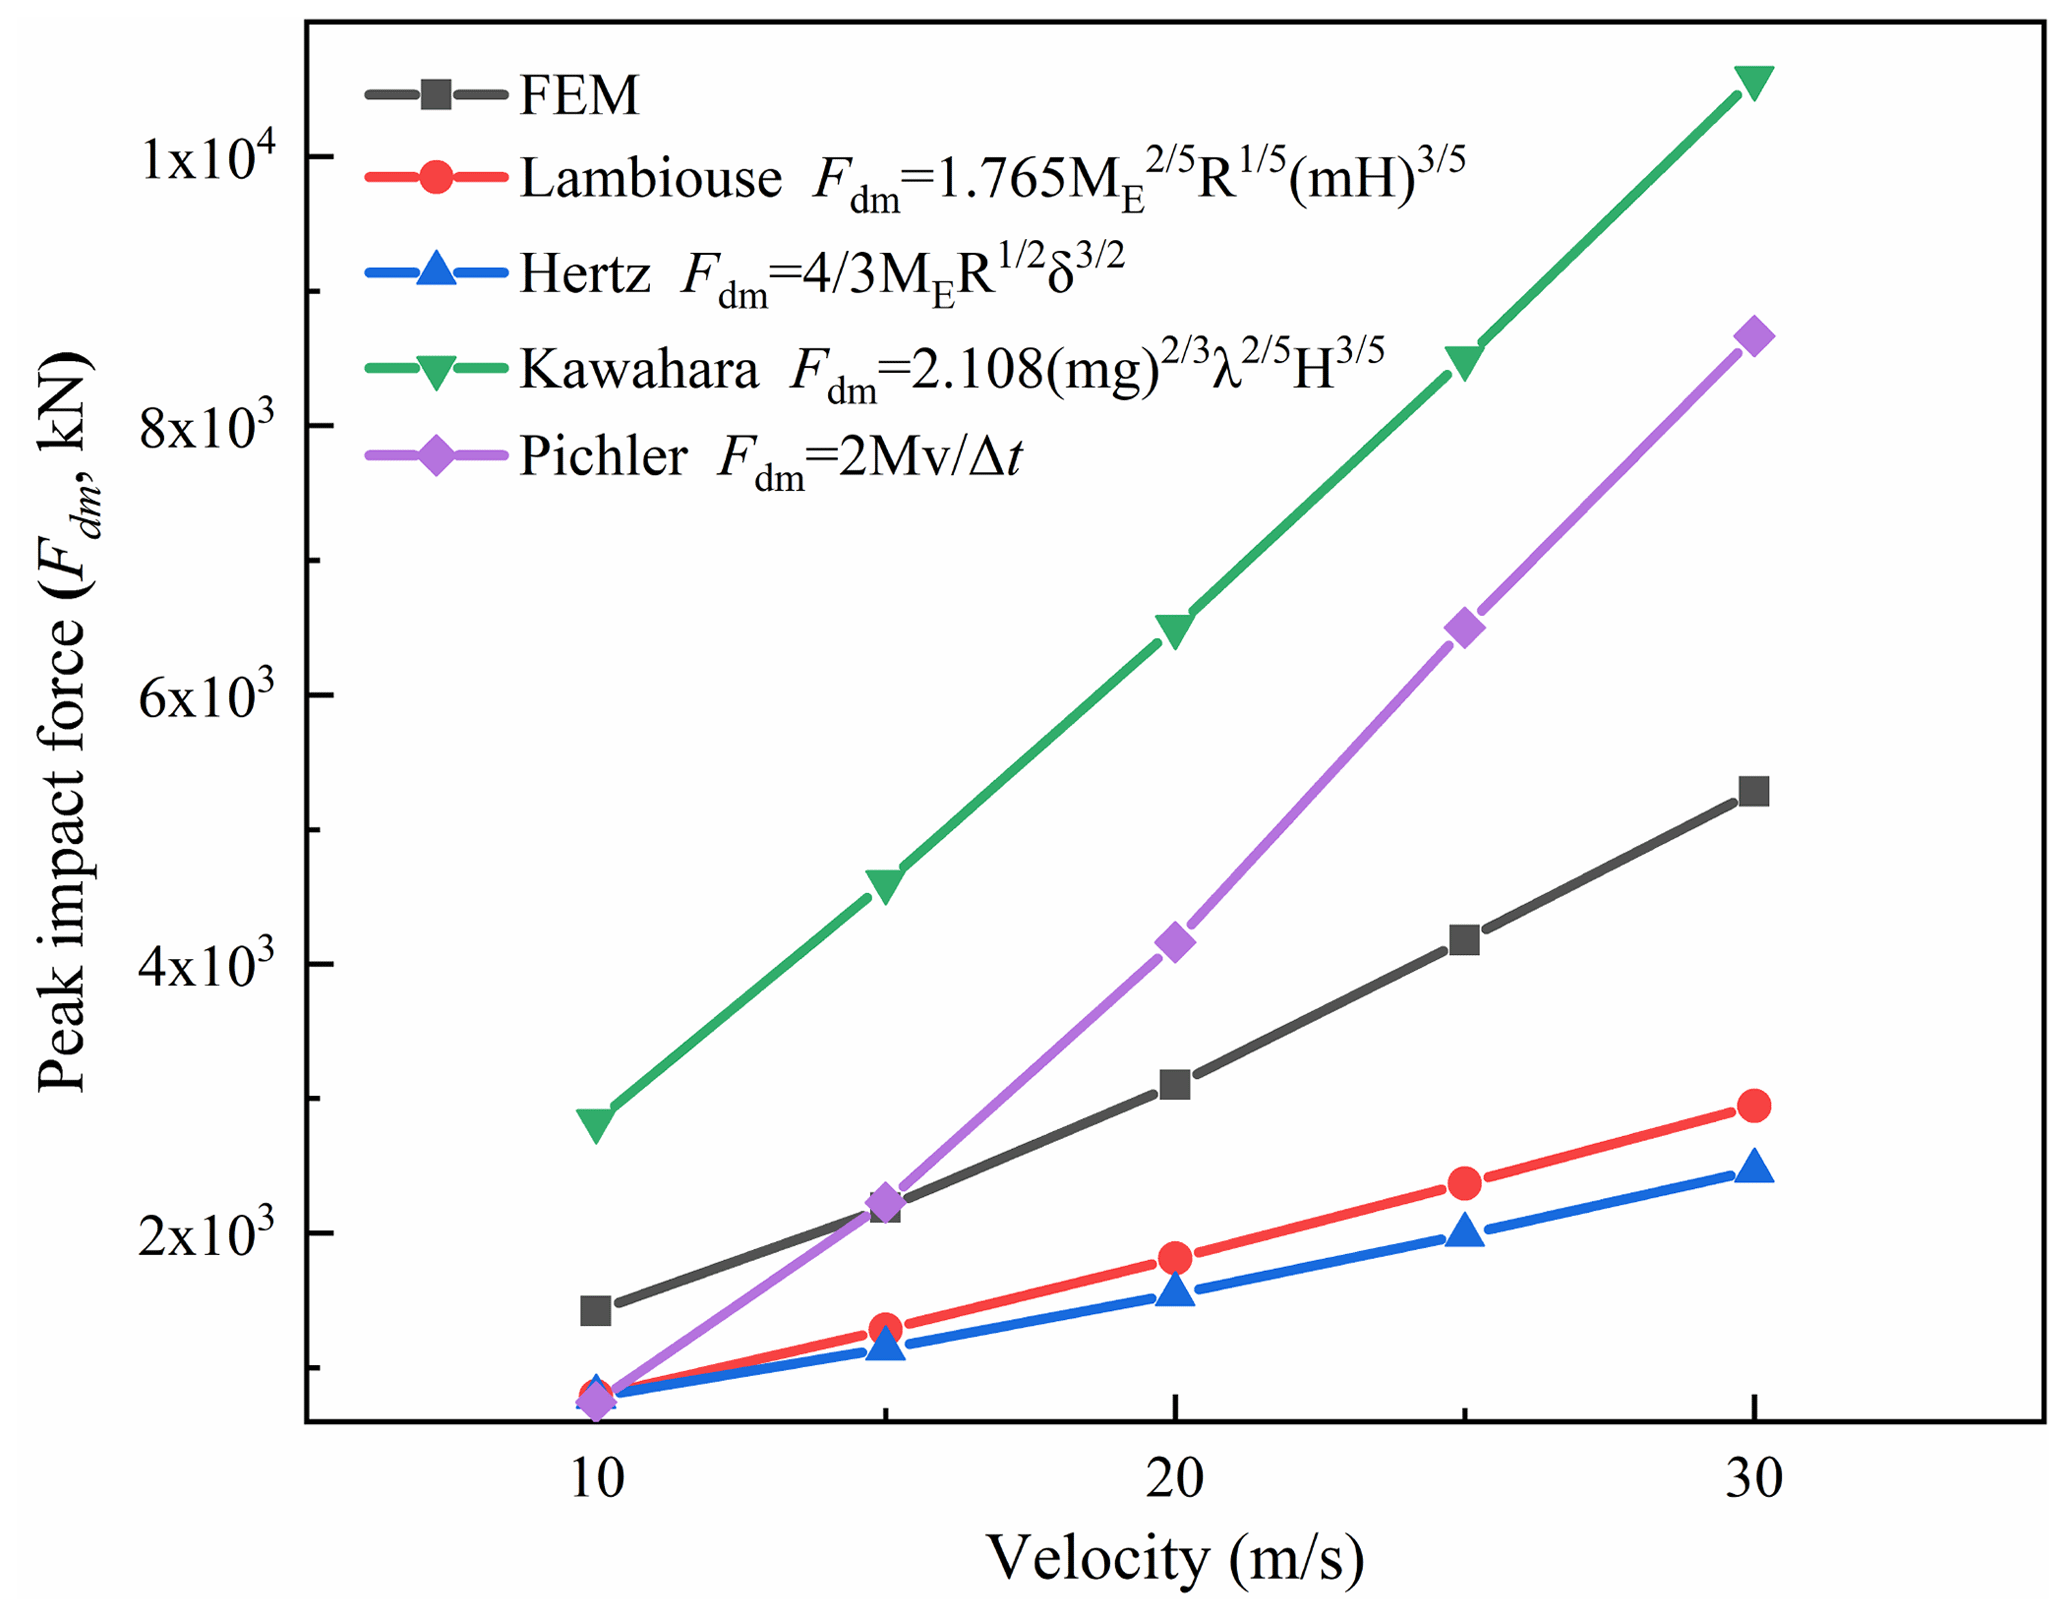
4.1 Comparison of impact force calculation models
A comparative analysis comparing the elastic theories proposed by Labiouse et al. (1996), Kawahara and Muro (2006), Pichler et al. (2006), and Hertz (1881) was conducted to assess the validity of the numerical simulation (Fig. 19). The results reveal a fundamental linear correlation between impact force and velocity. Overall, the computational results are consistent with those of other models in terms of magnitude, thus confirming the validity of the calculations reported here.

4.2 Relationship between structural evaluation indexes and impact energy
Table 5 lists the initial kinetic energy of the impactor (E), the peak impact force (Fdm), the peak interaction force (Fim), the ratio of the peak impact force to the peak interaction force (α), the maximum of the lateral displacement of the pile at the ground surface at t = 650 ms (Smpt), the number of damage failure units (Nd), and the ratio of the damage failure units to the overall RC structure units (β).

Figure 20Dependence of various indexes on impactor energy. (a) Peak impact force and (b) the ratio of the peak impact force to the peak interaction force.
Under the premise of known impact energy, estimating the impact force, interaction force, and displacement of the pile for the structural design is very important. As shown in Table 5, the variation in peak impact force (Fdm) with different impact centers is minimal. Consequently, CP simulation results were chosen for further analysis. The dependence of the peak impact force on the impact energy is shown in Fig. 20a, with a correlation coefficient R2 = 0.99; i.e.,
where m is the impactor mass (m = 2600 kg herein), and v is the initial impact velocity (10 m s−1 30 m s−1 herein).
The dependence of the ratio of the peak impact force to the peak interaction force on the impact energy is shown in Fig. 20b, with a correlation coefficient of 0.99; i.e.,

Figure 21Dependence of the lateral displacement of the no. 3 pile at the ground surface on impactor energy.
The lateral displacement of the pile at the ground surface is an important index to judge the failure of the pile foundation under lateral loads. As shown in Table 5, the maximum lateral displacement of the pile at the ground surface when the pile is the impact center is greater than when the slab is the impact center. Therefore, the situation where the pile is the center of impact is more dangerous. As shown in Fig. 21, with the increase in impact energy, the displacement value and number of damage failure units increase, which means the structure suffers more damage under CP. Furthermore, the maximum lateral displacement of the pile at the ground surface when t = 650 ms can be calculated by the following equation:
According to the Chinese Specification for the Design of Rock Retaining Wall Engineering in Geological Hazards (CAGHP, 2019), the lateral displacement of the resistant sliding pile at the ground surface must not exceed 10 mm. Substituting this value into Formula 3, the maximum impact energy that the PSRW can withstand in this study is 905 kJ.
Table 6Comparison of different concrete rockfall protection structures.

Note: the energy dissipation ratio denotes the ratio of dissipated energy to input energy.
4.3 Comparison with other concrete rockfall retaining walls
Table 6 presents crucial data on an improved cast-in-place rockfall concrete barrier developed by the US Department of Transportation (Patnaik et al., 2015). This barrier exhibits relatively low resistance to impact energy, which restricts its applicability to situations where high-impact-energy rockfalls are likely to occur. Integrating a specialized buffering layer on the concrete retaining wall, the barrier's impact resistance can be effectively enhanced (Kurihashi et al., 2020). According to Maegawa et al. (2011), concrete rockfall barriers with a buffering layer offer a maximum impact resistance ranging from approximately 120 to 490 kJ. Addressing the resistance limitations of traditional concrete rockfall barriers, Furet et al. (2022) proposed the articulated concrete block rockfall protection structures. These innovative structures allow concrete blocks to hingedly connect to one another, enabling greater impact energy absorption.
In terms of energy dissipation, structure damage and friction are responsible for 74 % of the impact energy dissipation, with the remaining 26 % attributed to other phenomena such as deformation of structural elements, elastic wave propagation, viscous damping, and fracturing. Compared to conventional concrete rockfall barriers, PSRWs exhibit significantly higher impact resistance (905 kJ) and interception height (6 m). Similarly, these structures absorb all the impact energy, preventing the impactor from rebounding.
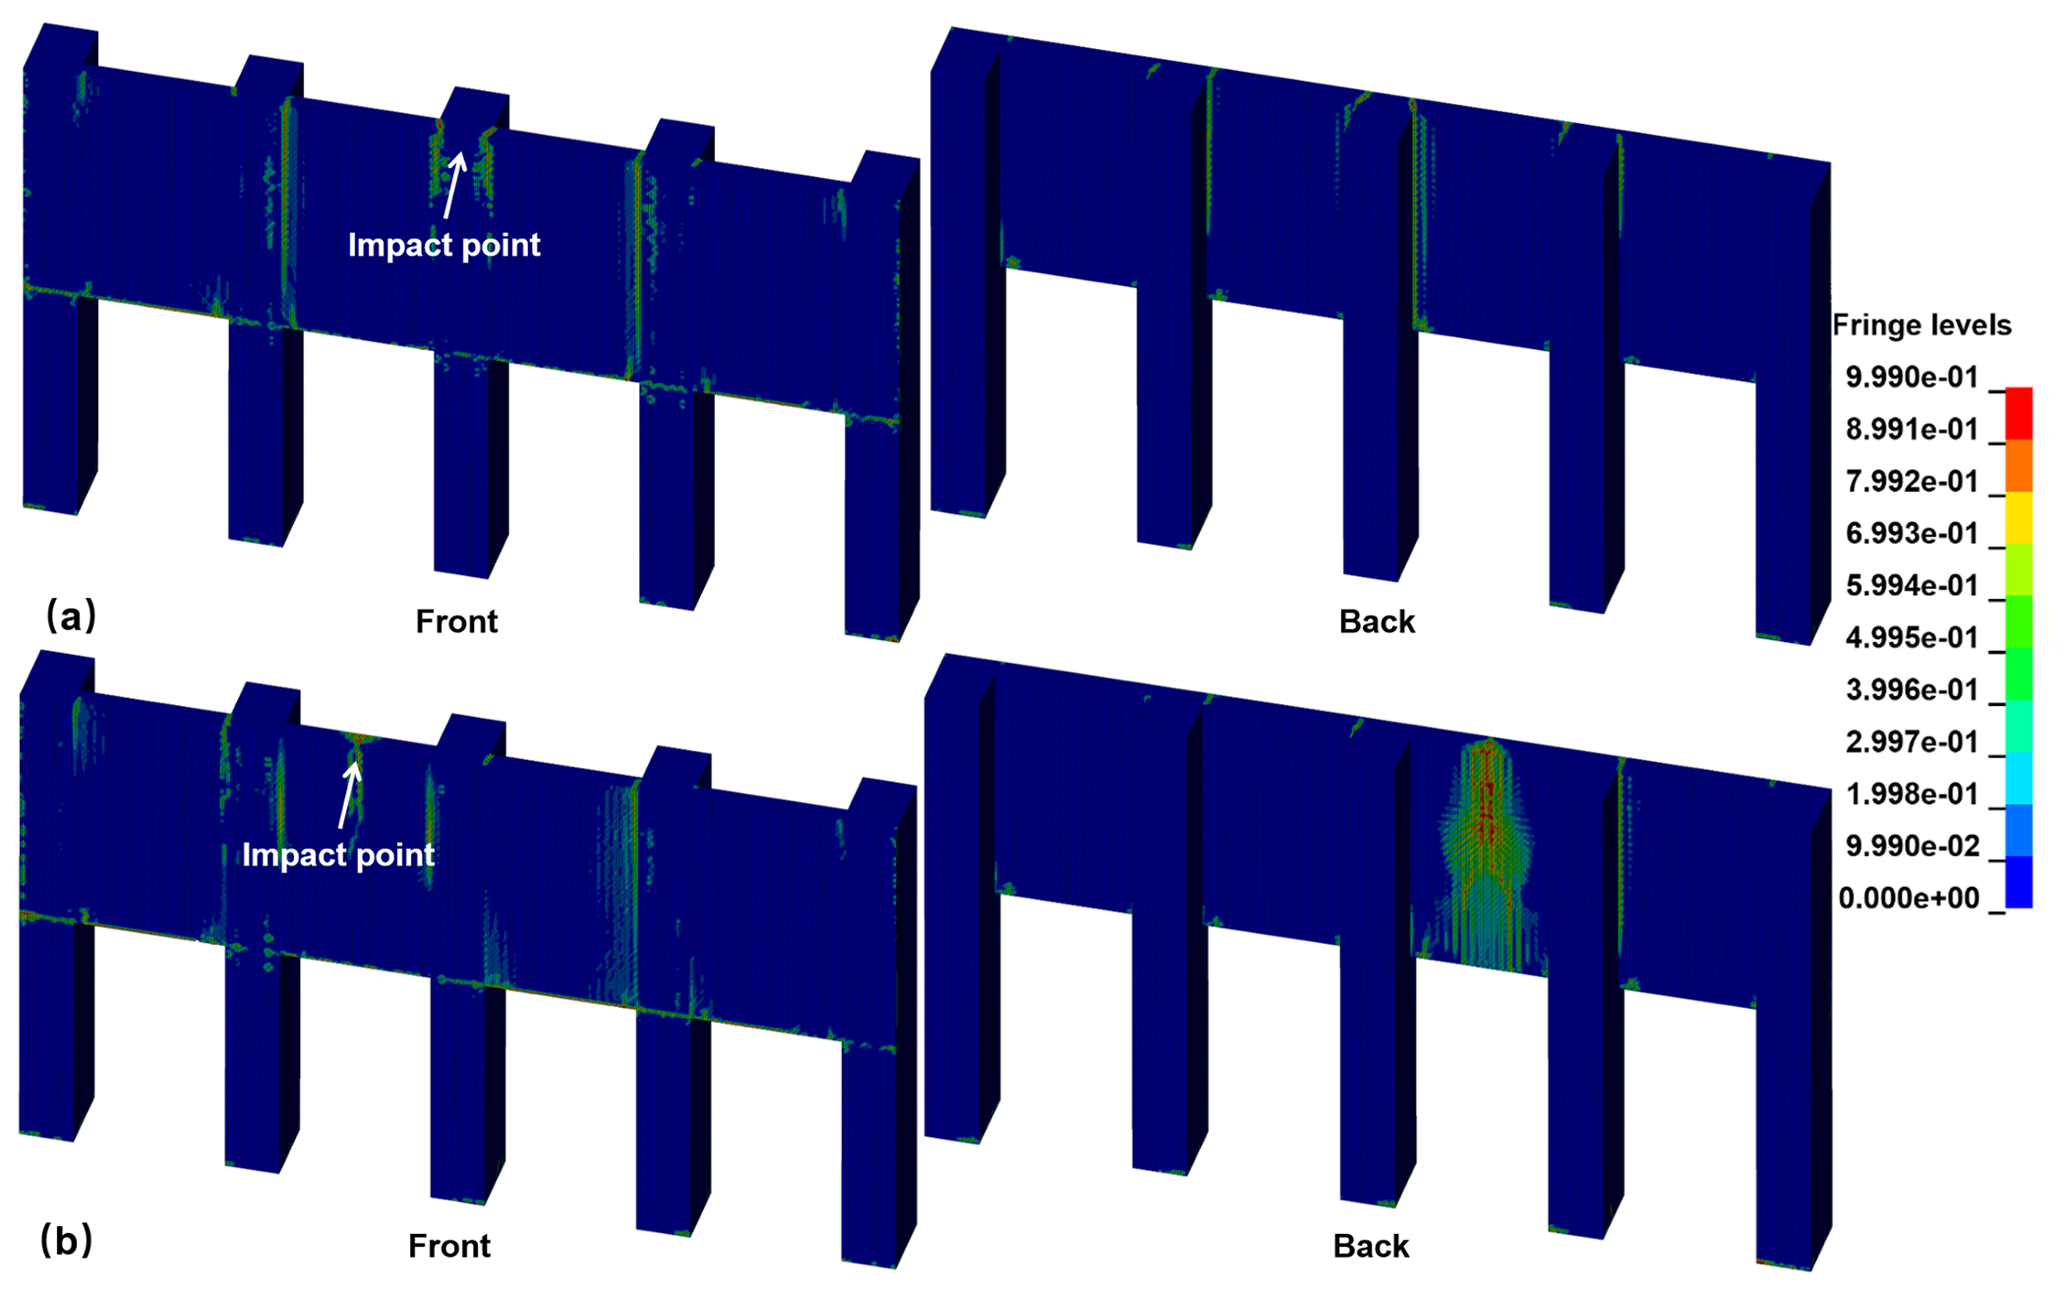
Figure 22Damage nephogram of concrete at t = 650 ms under (a) CP-V30 and (b) CS-V30 conditions.
For traditional RC retaining walls subjected to a 16 kJ impact energy, shear cracks develop diagonally from the impact point, with wider spreading observed on the rear face compared to the collision surface (Kurihashi et al., 2020). Figure 22 illustrates the concrete damage nephogram of the PSRW under the impact load of 1170 kN. It is evident that concrete damage primarily concentrated around the impact point and at the junction between the pile and slab. Importantly, there is no evidence of crack penetration into the structure itself, indicating that the PSRW maintains its structural integrity.
Although the lateral displacement of the pile exceeds the stipulated limit, reaching 12 mm as indicated in Table 5 and Fig. 21, it is essential to acknowledge that the specified ultimate lateral displacement is frequently a conservative estimation. Concurrently, the maximum lateral displacement at the crown of the cantilever section is 35 mm, which is substantially less than the lateral displacement threshold for the cantilever section of the anti-slide pile. This threshold is defined as 1 % of the cantilever section's length, according to CAGHP (2019). As a result, the impact load does not compromise the integrity of the structure.
In summary, the PSRW is an innovative rockfall protection structure, providing an enhanced level of impact resistance, increased interception height, and reduced concrete damage. Additionally, the minimal lateral displacement observed after impact further ensures structural integrity and safety in challenging terrain areas.

4.4 Discussion on engineering practicality
The data presented in Table 7 reveal the distribution of rockfall energy levels across four regions that experience frequent rockfalls. Notably, the Alps region experiences substantial rockfalls, with many of them exhibiting an impact energy below 1000 kJ. Schneider et al. (2023) utilized Doppler radar technology to monitor rockfall activity in Brienz/Brinzauls, Switzerland. Their findings indicated that although the volume of rockfalls ranged from 1 to 100 m3, smaller events (1 m3) were markedly more common. As previously mentioned, the PSRW can withstand rockfalls with an impact energy of about 1000 kJ, making it an ideal solution for a multitude of small alpine rockfall scenarios. Additionally, its compact size and robust structural stability further enhance its suitability for mountainous construction projects. In cases where the impact energy of falling rocks exceeds 1000 kJ, it is advisable to optimize the mechanical properties of the cushion layer, improve the elastic modulus of the concrete, increase the reinforcement ratio of the longitudinal tension bars, enlarge the section size of the pile at ground level, or add anchoring measures to enhance the bending resistance of the retaining structure.
Compared to existing rockfall protection structures, the PSRW offers enhanced stability and requires a smaller footprint, making it adept at addressing a broad spectrum of rockfall impact scenarios commonly encountered in alpine canyon regions. In this paper, the dynamic responses of the PSRW under different impact centers and velocities were compared and analyzed using the finite-element simulation method. Additionally, the influencing factors, such as the peak impact force, peak interaction force, ratio of the peak impact force to the peak interaction force, concrete stress, reinforcement stress, maximum lateral displacement of the pile at the ground surface, and ratio of damage failure units to overall structure units, were quantified. Notably, the formulas for calculating the peak impact force of the PSRW (Eq. 1), the ratio of the peak impact force to the peak interaction force (Eq. 2), and the maximum lateral displacement of the pile at the ground surface (Eq. 3) based on the impact energy of rockfalls were proposed. The key findings of this study are as follows:
-
The impact force, interaction force, and lateral displacement exhibit a linear correlation with the impact velocity. However, the lateral displacement is more sensitive to velocity variations than the impact force and interaction force.
-
Under different impact centers, the variations in impact force and interaction force are minimal. When the pile serves as the impact center, the lateral displacement of the pile at the ground surface and the extent of concrete damage are significantly greater than when the slab center is the impact center. This indicates that impacts centered on the pile pose a more hazardous impact scenario.
-
Concrete damage predominantly concentrates at the joints between piles and slabs, the impact center itself, and the section of piles at the ground surface. To minimize structural concrete damage, it is imperative to prioritize these critical sections in the structural design.
-
The impact force, the ratio of the peak impact force to the peak interaction force, and the maximum lateral displacement of the pile at the ground surface have a significant correlation with the impact energy. These relationships are crucial for evaluating impact force, interaction force, and the lateral displacement of piles at the ground surface during the design of PSRW structures. According to Chinese specifications for displacement requirements, the maximum lateral displacement of the pile at the ground surface should not exceed 10 mm. Consequently, the maximum impact energy that the PSRW can withstand is 905 kJ, when the crown is designated as the impact center.
| P | Actual lateral soil resistance (kPa) |
| Fdm | Peak impact force (kN) |
| Pu | Ultimate lateral soil resistance (kPa) |
| Fim | Peak interaction force (kN) |
| Su_cu | Consolidated isotropic undrained triaxial shear strength of soil (kPa m−1) |
| α | Ratio of the peak impact force to the peak interaction force (%) |
| y | Actual lateral soil deformation (m) |
| Smpt | Maximum lateral displacement of the pile at the ground surface (mm) |
| B | Pile width (m) |
| Nd | Number of damage failure units |
| z | Depth below the ground surface (m) |
| β | Ratio of damage failure units to overall structure units (%) |
| Sp | Shape correction factor of pile section |
| m | Impactor mass (kg) |
| E | Initial kinetic energy of impactor |
| v | Initial velocity of impactor (m s−1) |
The data that support the findings of this study are available from the corresponding author, Gang Luo, upon reasonable request.
PZ: methodology, simulation, visualization, writing (original draft). GL: test design, funding acquisition, writing (review). YB: visualization, writing (review). HX: writing (review).
The contact author has declared that none of the authors has any competing interests.
Publisher's note: Copernicus Publications remains neutral with regard to jurisdictional claims made in the text, published maps, institutional affiliations, or any other geographical representation in this paper. While Copernicus Publications makes every effort to include appropriate place names, the final responsibility lies with the authors.
This article is part of the special issue “Natural hazards' impact on natural and built heritage and infrastructure in urban and rural zones”. It is not associated with a conference.
The authors thank the editors and anonymous reviewers for their constructive comments that improved the paper.
This research has been supported by the National Natural Science Foundation of China (grant no. 42277143), the National Key Research and Development Program of China (grant no. 2022YFC3005704), the Sichuan Province Science and Technology Support Program (grant no. 2024NSFSC0100), and the research project of the Department of Natural Resources of Sichuan Province (grant nos. KJ-2023-004 and KJ-2023-029).
This paper was edited by Maria Bostenaru Dan and reviewed by Polina Lemenkova and two anonymous referees.
Bhatti, A. Q. and Kishi, N.: Impact response of RC rock-shed girder with sand cushion under falling load, Nucl. Eng. Des., 240, 2626–2632, https://doi.org/10.1016/j.nucengdes.2010.07.029, 2010.
Bi, Y., Li, M., Wang, D., Zheng, L., Yan, S., and He, S.: A numerical study of viscous granular flow in artificial step-pool systems: flow characteristics and structure optimization, Acta Geotech., 18, 6275–6295, https://doi.org/10.1007/s11440-023-01933-1, 2023.
CAGHP: Code for design of rock retaining wall engineering in geological hazards (T/CAGHP060-2019), China University of Geosciences Press, Wuhan, 2019 (in Chinese).
Chau, K. T., Wong, R., and Wu, J.: Coefficient of restitution and rotational motions of rockfall impacts, Int. J. Rock Mech. Min., 39, 69–77, https://doi.org/10.1016/S1365-1609(02)00016-3, 2002.
Crosta, G. B. and Agliardi, F.: Parametric evaluation of 3D dispersion of rockfall trajectories, Nat. Hazards Earth Syst. Sci., 4, 583–598, https://doi.org/10.5194/nhess-4-583-2004, 2004.
Demartino, C., Wu, J. G., and Xiao, Y.: Response of shear-deficient reinforced circular RC columns under lateral impact loading, Int. J. Impact Eng., 109, 196–213, https://doi.org/10.1016/j.ijimpeng.2017.06.011, 2017.
Dietze, M., Mohadjer, S., Turowski, J. M., Ehlers, T. A., and Hovius, N. J. E. S. D.: Seismic monitoring of small alpine rockfalls–validity, precision and limitations, Earth Surf. Dynam., 5, 653–668, https://doi.org/10.5194/esurf-5-653-2017, 2017.
Fan, W., Zhong, Z., Huang, X., Sun, W., and Mao, W.: Multi-platform simulation of reinforced concrete structures under impact loading, Eng. Struct., 266, 114523, https://doi.org/10.1016/j.engstruct.2022.114523, 2022.
Furet, A., Villard, P., Jarrin, J.-P., and Lambert, S.: Experimental and numerical impact responses of an innovative rockfall protection structure made of articulated concrete blocks, Rock Mech. Rock Eng., 55, 5983–6000, https://doi.org/10.1007/s00603-022-02957-x, 2022.
Heng, K., Li, R., Li, Z., and Wu, H.: Dynamic responses of highway bridge subjected to heavy truck impact, Eng. Struct., 232, 11828–11850, https://doi.org/10.1016/j.engstruct.2020.111828, 2021.
Hertz, H.: The contact of elastic solids, J. Reine Angew. Math., 92, 156–171, 1881.
Hu, X., Mei, X., Yang, Y., and Luo, G.: Dynamic Response of Pile-plate Rock Retaining Wall under Impact of Rockfall, Journal of Engineering Geology, 27, 123–133, 2019 (in Chinese).
Hungr, O., Leroueil, S., and Picarelli, L.: The Varnes classification of landslide types, an update, Landslides, 11, 167–194, https://doi.org/10.1007/s10346-013-0436-y, 2014.
Kawahara, S. and Muro, T.: Effects of dry density and thickness of sandy soil on impact response due to rockfall, J. Terramechanics, 43, 329–340, https://doi.org/10.1016/j.jterra.2005.05.009, 2006.
Kurihashi, Y., Oyama, R., Komuro, M., Murata, Y., and Watanabe, S.: Experimental study on buffering system for concrete retaining walls using geocell filled with single-grain crushed stone, Int. J. Civ. Eng., 18, 1097–1111, https://doi.org/10.1007/s40999-020-00520-9, 2020.
Labiouse, V., Descoeudres, F., and Montani, S.: Experimental study of rock sheds impacted by rock blocks, Struct. Eng. Int., 6, 171–176, https://doi.org/10.2749/101686696780495536, 1996.
Lambert, S., Gotteland, P., and Nicot, F.: Experimental study of the impact response of geocells as components of rockfall protection embankments, Nat. Hazards Earth Syst. Sci., 9, 459–467, https://doi.org/10.5194/nhess-9-459-2009, 2009.
Lee, K., Chang, N., and Ko, H.: Numerical simulation of geosynthetic-reinforced soil walls under seismic shaking, Geotext. Geomembranes, 28, 317–334, https://doi.org/10.1016/j.geotexmem.2009.09.008, 2010.
Le Roy, G., Helmstetter, A., Amitrano, D., Guyoton, F., and Le Roux-Mallouf, R.: Seismic analysis of the detachment and impact phases of a rockfall and application for estimating rockfall volume and free-fall height, J. Geophys. Res.-Earth, 124, 2602–2622, https://doi.org/10.1029/2019JF004999, 2019.
Lu, L., Lin, H., Wang, Z., Xiao, L., Ma, S., and Arai, K.: Experimental and numerical investigations of reinforced soil wall subjected to impact loading, Rock Mech. Rock Eng., 54, 5651–5666, https://doi.org/10.1007/s00603-021-02579-9, 2021.
Maegawa, K., Yokota, T., and Van, P. T.: Experiments on rockfall protection embankments with geogrids and cushions, GEOMATE Journal, 1, 19–24, 2011.
Mavrouli, O., Giannopoulos, P., Carbonell, J. M., and Syrmakezis, C.: Damage analysis of masonry structures subjected to rockfalls, Landslides, 14, 891–904, https://doi.org/10.1007/s10346-016-0765-8, 2017.
Muraishi, H., Samizo, M., and Sugiyama, T.: Development of a flexible low-energy rockfall protection fence, Quarterly Report of RTRI, 46, 161–166, https://doi.org/10.2219/rtriqr.46.161, 2005.
Patnaik, A., Musa, A., Marchetty, S., and Liang, R.: Full-scale testing and performance evaluation of rockfall concrete barriers, Transp. Res. Record, 2522, 27–36, https://doi.org/10.3141/2522-03, 2015.
Peila, D. and Ronco, C.: Technical Note: Design of rockfall net fences and the new ETAG 027 European guideline, Nat. Hazards Earth Syst. Sci., 9, 1291–1298, https://doi.org/10.5194/nhess-9-1291-2009, 2009.
Peila, D., Oggeri, C., and Castiglia, C.: Ground reinforced embankments for rockfall protection: design and evaluation of full scale tests, Landslides, 4, 255–265, https://doi.org/10.1007/s10346-007-0081-4, 2007.
Perera, J. S., Lam, N., Disfani, M. M., and Gad, E.: Experimental and analytical investigation of a RC wall with a gabion cushion subjected to boulder impact, Int. J. Impact Eng., 151, 103823–103839, https://doi.org/10.1016/j.ijimpeng.2021.103823, 2021.
Pichler, B., Hellmich, C., Mang, H. A., and Eberhardsteiner, J.: Loading of a gravel-buried steel pipe subjected to rockfall, J. Geotech. Geoenviron., 132, 1465–1473, https://doi.org/10.1061/(ASCE)1090-0241(2006)132:11(1465), 2006.
Schellenberg, K.: On the design of rockfall protection galleries, ETH Zurich, https://www.research-collection.ethz.ch/ (last access: 3 October 2024), 2008.
Schneider, M., Oestreicher, N., Ehrat, T., and Loew, S.: Rockfall monitoring with a Doppler radar on an active rockslide complex in Brienz/Brinzauls (Switzerland), Nat. Hazards Earth Syst. Sci., 23, 3337–3354, https://doi.org/10.5194/nhess-23-3337-2023, 2023.
Shen, W., Zhao, T., Dai, F., Jiang, M., and Zhou, G. G.: DEM analyses of rock block shape effect on the response of rockfall impact against a soil buffering layer, Eng. Geol., 249, 60–70, https://doi.org/10.1016/j.enggeo.2018.12.011, 2019.
Spadari, M., Kardani, M., De Carteret, R., Giacomini, A., Buzzi, O., Fityus, S., and Sloan, S.: Statistical evaluation of rockfall energy ranges for different geological settings of New South Wales, Australia, Eng. Geol., 158, 57–65, https://doi.org/10.1016/j.enggeo.2013.03.007, 2013.
Tian Y., Luo G., Zou P., Zhang L., Hou Y.: Study on design method of rockfall retaining pile under rockfall impact, Chinese J. Geol. Hazard Control, 35, 88–96, https://doi.org/10.16031/j.cnki.issn.1003-8035.202304026, 2024.
Truong, P. and Lehane, B.: Effects of pile shape and pile end condition on the lateral response of displacement piles in soft clay, Géotechnique, 68, 794–804, https://doi.org/10.1680/jgeot.16.P.291, 2018.
Volkwein, A., Schellenberg, K., Labiouse, V., Agliardi, F., Berger, F., Bourrier, F., Dorren, L. K. A., Gerber, W., and Jaboyedoff, M.: Rockfall characterisation and structural protection – a review, Nat. Hazards Earth Syst. Sci., 11, 2617–2651, https://doi.org/10.5194/nhess-11-2617-2011, 2011.
Wu, J., Ma, G., Zhou, Z., Mei, X., and Hu, X.: Experimental Investigation of Impact Response of RC Slabs with a Sandy Soil Cushion Layer, Advances in Civil Engineering, 1–18, https://doi.org/10.1155/2021/1562158, 2021.
Yang, J., Duan, S., Li, Q., and Liu, C.: A review of flexible protection in rockfall protection, Nat. Hazards, 99, 71–89, https://doi.org/10.1007/s11069-019-03709-x, 2019.
Yong, A. C., Lam, N. T., Menegon, S. J., and Gad, E. F.: Experimental and analytical assessment of flexural behavior of cantilevered RC walls subjected to impact actions, J. Struct. Eng., 146, 04020034, https://doi.org/10.1061/(ASCE)ST.1943-541X.0002578, 2020.
Yong, A. C., Lam, N. T., and Menegon, S. J.: Closed-form expressions for improved impact resistant design of reinforced concrete beams, Structures, 29, 1828–1836, https://doi.org/10.1016/j.istruc.2020.12.041, 2021.
Yu, Z., Luo, L., Liu, C., Guo, L., Qi, X., and Zhao, L.: Dynamic response of flexible rockfall barriers with different block shapes, Landslides, 18, 2621–2637, https://doi.org/10.1007/s10346-021-01658-w, 2021.
Zhao, P., Xie, L., Li, L., Liu, Q., and Yuan, S.: Large-scale rockfall impact experiments on a RC rock-shed with a newly proposed cushion layer composed of sand and EPE, Eng. Struct., 175, 386–398, https://doi.org/10.1016/j.engstruct.2018.08.046, 2018.
Zhong, H., Lyu, L., Yu, Z., and Liu, C.: Study on mechanical behavior of rockfall impacts on a shed slab based on experiment and SPH–FEM coupled method, Structures, 33, 1283–1298, https://doi.org/10.1016/j.istruc.2021.05.021, 2021.
Zhong, H., Yu, Z., Zhang, C., Lyu, L., and Zhao, L.: Dynamic mechanical responses of reinforced concrete pier to debris avalanche impact based on the DEM-FEM coupled method, Int. J. Impact Eng., 167, 104282–104301, https://doi.org/10.1016/j.ijimpeng.2022.104282, 2022.