the Creative Commons Attribution 4.0 License.
the Creative Commons Attribution 4.0 License.
 | 12 Sep 2024
On the potential of using smartphone sensors for wildfire hazard estimation through citizen science
Hofit Shachaf
Colin Price
Dorita Rostkier-Edelstein
Cliff Mass
Weather conditions that can enhance wildfire potential are a problem faced by many countries around the world. Wildfires can have major economic impacts as well as prolonged effects on populations and ecosystems. Distributing information on fire hazards to the public and first responders in real time is crucial for fire risk management and risk reduction. Although most fires today are caused by people, weather conditions determine if and how fast the fire spreads. In particular, research has shown that atmospheric vapor pressure deficit (VPD) is a key parameter predicting the dryness of vegetation and the available fuel for fires. VPD is determined from the environmental air temperature and relative humidity, both of which are readily obtained from smartphones carried by the public. In this study we use smartphone data from the company Opensignal, collected over almost 4 years and from more than 40 000 users per day, to estimate VPD values. We have found that smartphone data can provide useful information about fire risk and danger. Here we present two case studies from wildfires in Israel and Portugal in which VPD is calculated using calibrated temperature and relative humidity measurements from smartphones. Given the rapid growth in the number of smartphones around the globe, we propose applying smartphone data for meteorological research and fire weather applications. Possible users of these results could be wildfire researchers; public policy specialists in wildfire, climate, and disaster management; engineers working with big data; low-income countries; and citizen science advocates.
- Article
(6507 KB) - Full-text XML
- BibTeX
- EndNote


In the past years there has been a dramatic rise in wildfires around the globe. Between January 2017 and August 2017, there were around 40 000 wildfires in the United States that burned approximately 2.3×10⁶ ha. In California and Portugal, 2017 was the worst wildfire season on record, with major destruction of homes and natural vegetation. In November 2019, Australia restricted its outdoor water consumption to maintain a sufficient water supply to help firefighters, and in 2019 California wildfire damage was estimated at more than USD 80 billion. In 2023 there were record fires across Canada, with the resulting air pollution and smoke spreading across the northeastern United States. It is clear that improved monitoring and forecast models will foster better early wildfire warnings that will allow people, cities, and countries to be better prepared, with implications for reducing the loss of lives and damage to property and infrastructure.
Monitoring of such extreme weather hazards has typically used traditional weather stations and sensors for in situ measurements of the environment. In this study we propose that micro-sensors in smartphones carried by the public may provide additional and highly complementary data. The development of smartphones over the last 2 decades and the reduction in their cost has led to more than 6.4 billion smartphones in use worldwide today (out of almost 8 billion estimated people). Today, smartphones are often more accessible to the population in some countries than electricity or running water, and the global distribution of smartphones, together with improved internal sensors, is only expected to increase over the coming decades.
In recent years, several research groups have used smartphone data in scientific research. In the Netherlands, smartphones have been used to study air pollution (Snik et al., 2014), while in the United States smartphones have been used to study atmospheric pressure variability and the potential for improved numerical weather prediction (Mass and Madaus, 2014; McNicholas and Mass, 2021). Droste et al. (2017) and Hintz et al. (2019) showed that smartphone pressure sensors are a reliable source of atmospheric data, with biases of the order of 1 mbar. In the UK, a study demonstrated that smartphones can be used to map temperature changes and anomalies (Overeem et al., 2013), and in Israel (Price et al., 2018) smartphone data were used to study semi-diurnal tides in the atmosphere.
The conditions that can affect the ignition and propagation of wildfires have been studied for more than a century and can be influenced by large-scale climate phenomena such as the El Niño–Southern Oscillation (ENSO) and the Indian Ocean Dipole (Goldammer and Price, 1998; Bovalo et al., 2012). However, on a daily basis, fire weather models use surface weather conditions (temperature, humidity, wind speed, and precipitation) on hourly to daily scales to generate fire weather indices (Baumgartner et al., 1967; McArthur, 1967; Keetch and Byram, 1968; Kase, 1969; Fosberg, 1978; Anderson, 1982; Chandler et al., 1983; van Wagner, 1987; Sharples et al., 2009; Di Giuseppe et al., 2020). Some studies have combined large-scale climate indices and local meteorological parameters (Shen et al., 2019) to estimate fire risk and danger on longer timescales.
One main criterion for estimating fire danger and behavior is the moisture content of vegetation (Keetch and Byram, 1968; Schroeder and Buck, 1970; Anderson, 1982; Sharples et al., 2009; Shen et al., 2019). Indices like the Fire Potential Index (FPI), thousand-hour fuel (TH), dead fuel moisture (DFM), and others are used to predict fire risk (Hernandez-Leal et al., 2006; Escuin et al., 2008). Fire indices vary in their complexity; some are very simple, like the Ångström index (Chandler et al., 1983), which uses only temperature (T) and relative humidity (RH), while others are more complex, applying additional meteorological parameters along with soil properties and the biological life cycle of the plants, like M68 (Kase, 1969). However, the majority of indices are based on the two key parameters, temperature and relative humidity (Table 1). While daily and hourly meteorological data can be obtained using traditional measuring sensors, smartphones potentially offer an additional source of reliable data (Overeem et al., 2013; Mass and Madaus, 2014; Fujinami, 2016; Hintz et al., 2019). Furthermore, smartphones can theoretically provide high spatial resolution of the observed parameters. For example, Fig. 1 shows the spatial coverage of smartphone readings on 1 d (4 June 2014) in Israel compared to the official weather station distribution from the Israel Meteorological Service (IMS) stations.
Table 1Summary of input data used in the most common fire danger indices. The abbreviations for the meteorological parameters are the following: T, temperature; RH, relative humidity; P, precipitation; U, wind speed.
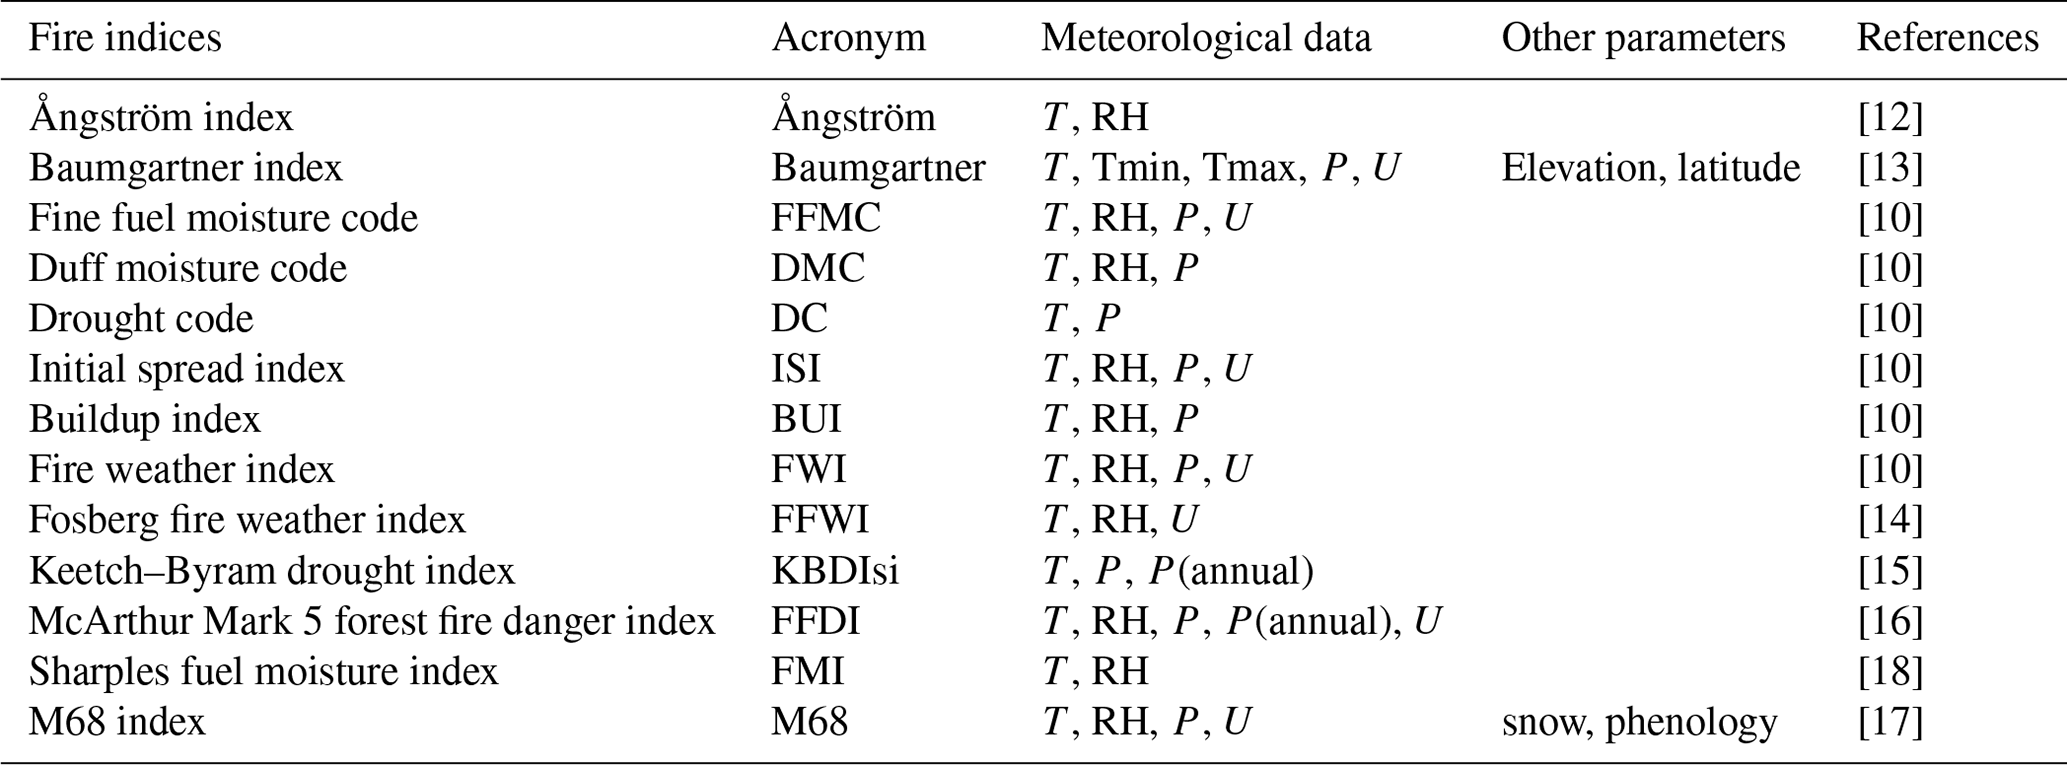
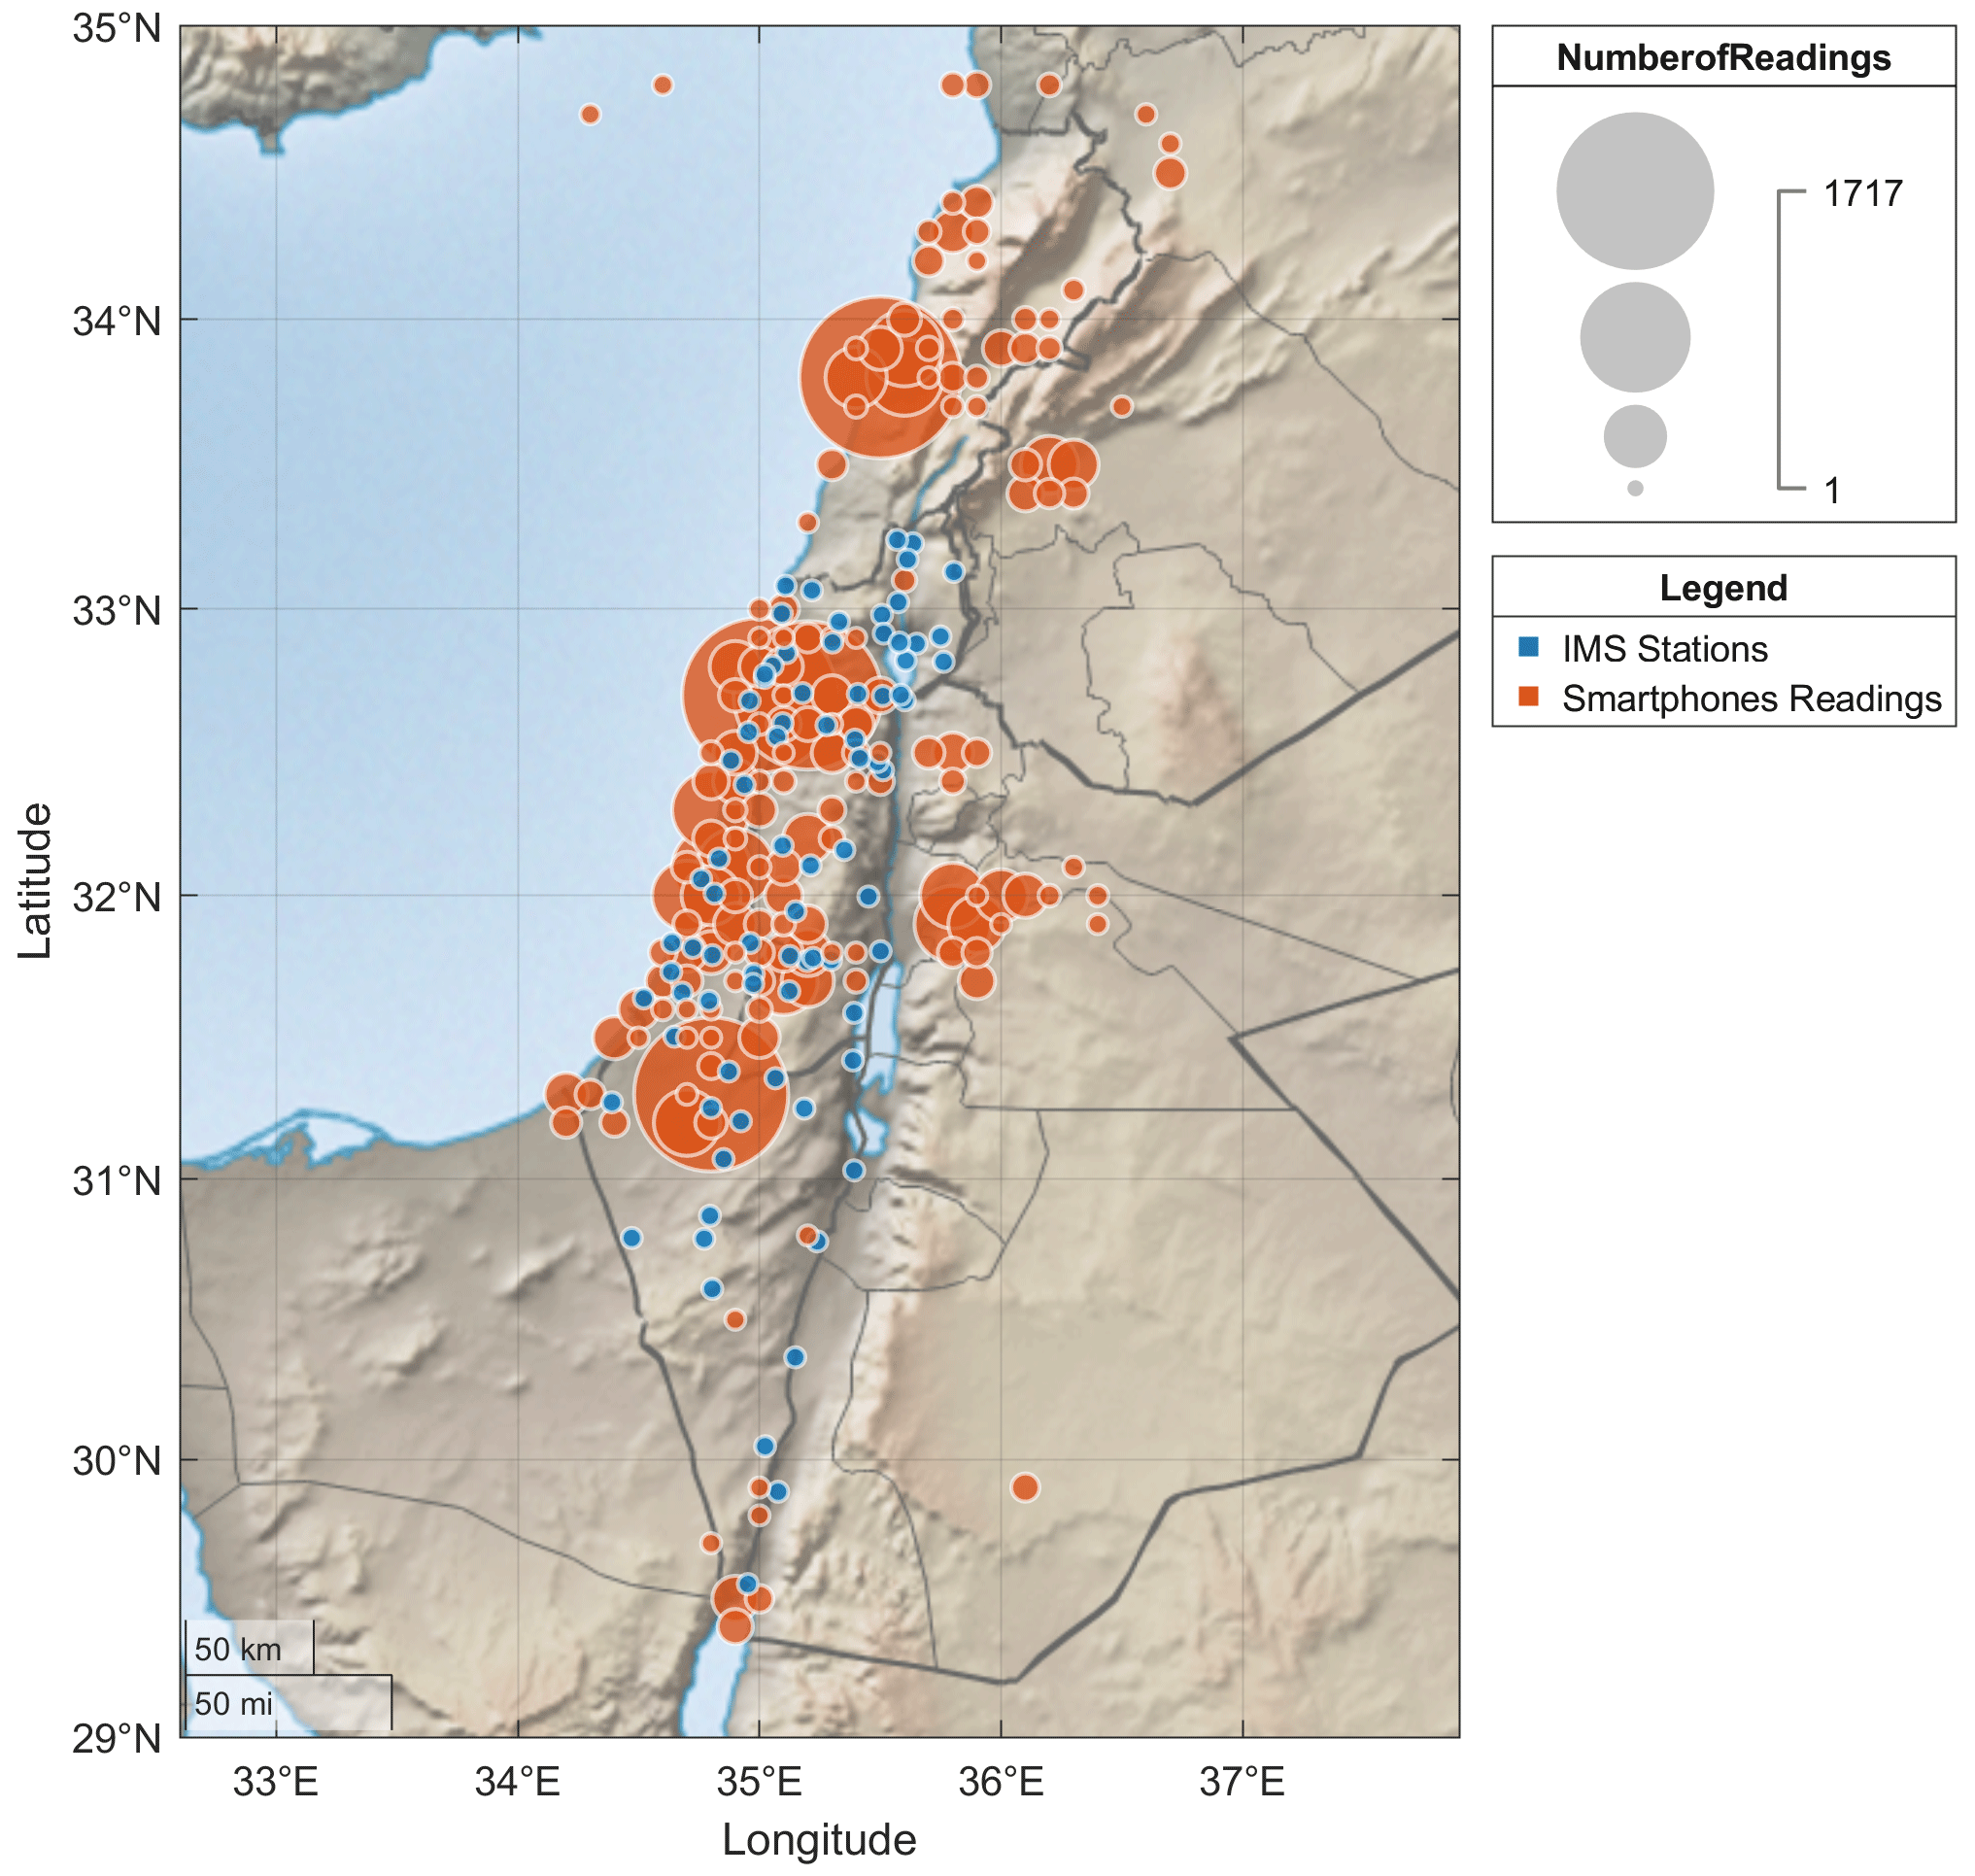
Figure 1Smartphone observations during 1 d (4 June 2014), with each circle representing the number of readings in a 0.1°×0.1° grid box. The IMS station coverage (official reference stations) is shown by uniform-size blue dots. The number of data samples from IMS is 86 400 on this day. The total number of data samples from smartphones is 15 770.
The vapor pressure deficit (VPD) can be calculated from temperature and relative humidity. Jain et al. (2022) used VPD to show that a decrease in RH and an increase in T were primarily responsible for increases in extreme fire weather conditions globally. Other fire-related VPD studies done in different parts of the world, like the study by Williams et al. (2014) in the southwestern United States (SWUS), found that in the spring and early summer (March–July) of 1961–2014 the average VPD was ∼15 hPa. When they compared it with the same months of 2011, which is considered to be a year of extreme drought with record-breaking wildfires, they found VPD anomalies of +3 hPa. Their finding showed that even though it was not exceptionally hot in the southwestern United States, it was exceptionally dry, showing that the annual burnt area is closely related to spring–summer potential evapotranspiration and VPD anomalies. Thus, monitoring T and RH, and hence VPD, from smartphone sensors has the potential for providing useful information about VPD at high spatial resolution and high temporal resolution even in remote areas with few official weather stations. Crowdsourcing of smartphone data may therefore provide a new tool for analyzing the risk of fires in real time.
2.1 Calibration methods
Most smartphones today have a set of sophisticated micro-sensors that measure several local environmental parameters. The most common sensors in smartphones measure atmospheric pressure, magnetic field, light, temperature, relative humidity, GPS location, sound, and even gravity and acceleration in three directions. This paper focuses on two parameters measured by smartphones: T and RH. RH sensors are usually capacitive sensors that measure RH by placing a thin strip of metal oxide between two electrodes. The metal oxide's electrical capacity changes with the atmosphere's RH (Yoo et al., 2010). The internal thermometers of smartphones do not directly measure ambient air temperature and are impacted by heat sources within the smartphone. Thus, a major challenge is to estimate environmental air temperatures from the smartphone temperatures measured inside the unit.
Figure 2 shows our control experiment done in Israel comparing a stationary smartphone (Samsung Galaxy S4) and an adjacent weather station (Davis Vantage Vue) for both T and RH. The smartphone was placed in a fixed location next to the Davis system (less than a meter distance) on a table in a shaded room with open windows. The temperature sensor used in the Samsung Galaxy S4 model is SHTC1 version 1 from Sensirion (https://www.sensirion.com/products/catalog/?category=Humidity, last access: 6 March 2017, Sensirion, 2015), with a resolution of 0.01 °C, an accuracy of 0.3 °C, and a range between −40 and 125 °C (Cabrera et al., 2021). The Davis temperature sensor has 0.1 °C resolution with a nominal accuracy of 0.5 °C and ranges between −40 and 65 °C. The same sensor (SHTCI1) is used in the Samsung Galaxy S4 for RH, with a resolution of 0.01 %, an accuracy between 3 % and 5 % that depends on both the temperature of the environment and the humidity, and a range between 0 % and 100 %. The Davis humidity sensor has a resolution of 1 %, an accuracy of 2 %, and a range between 0 % and 100 %.
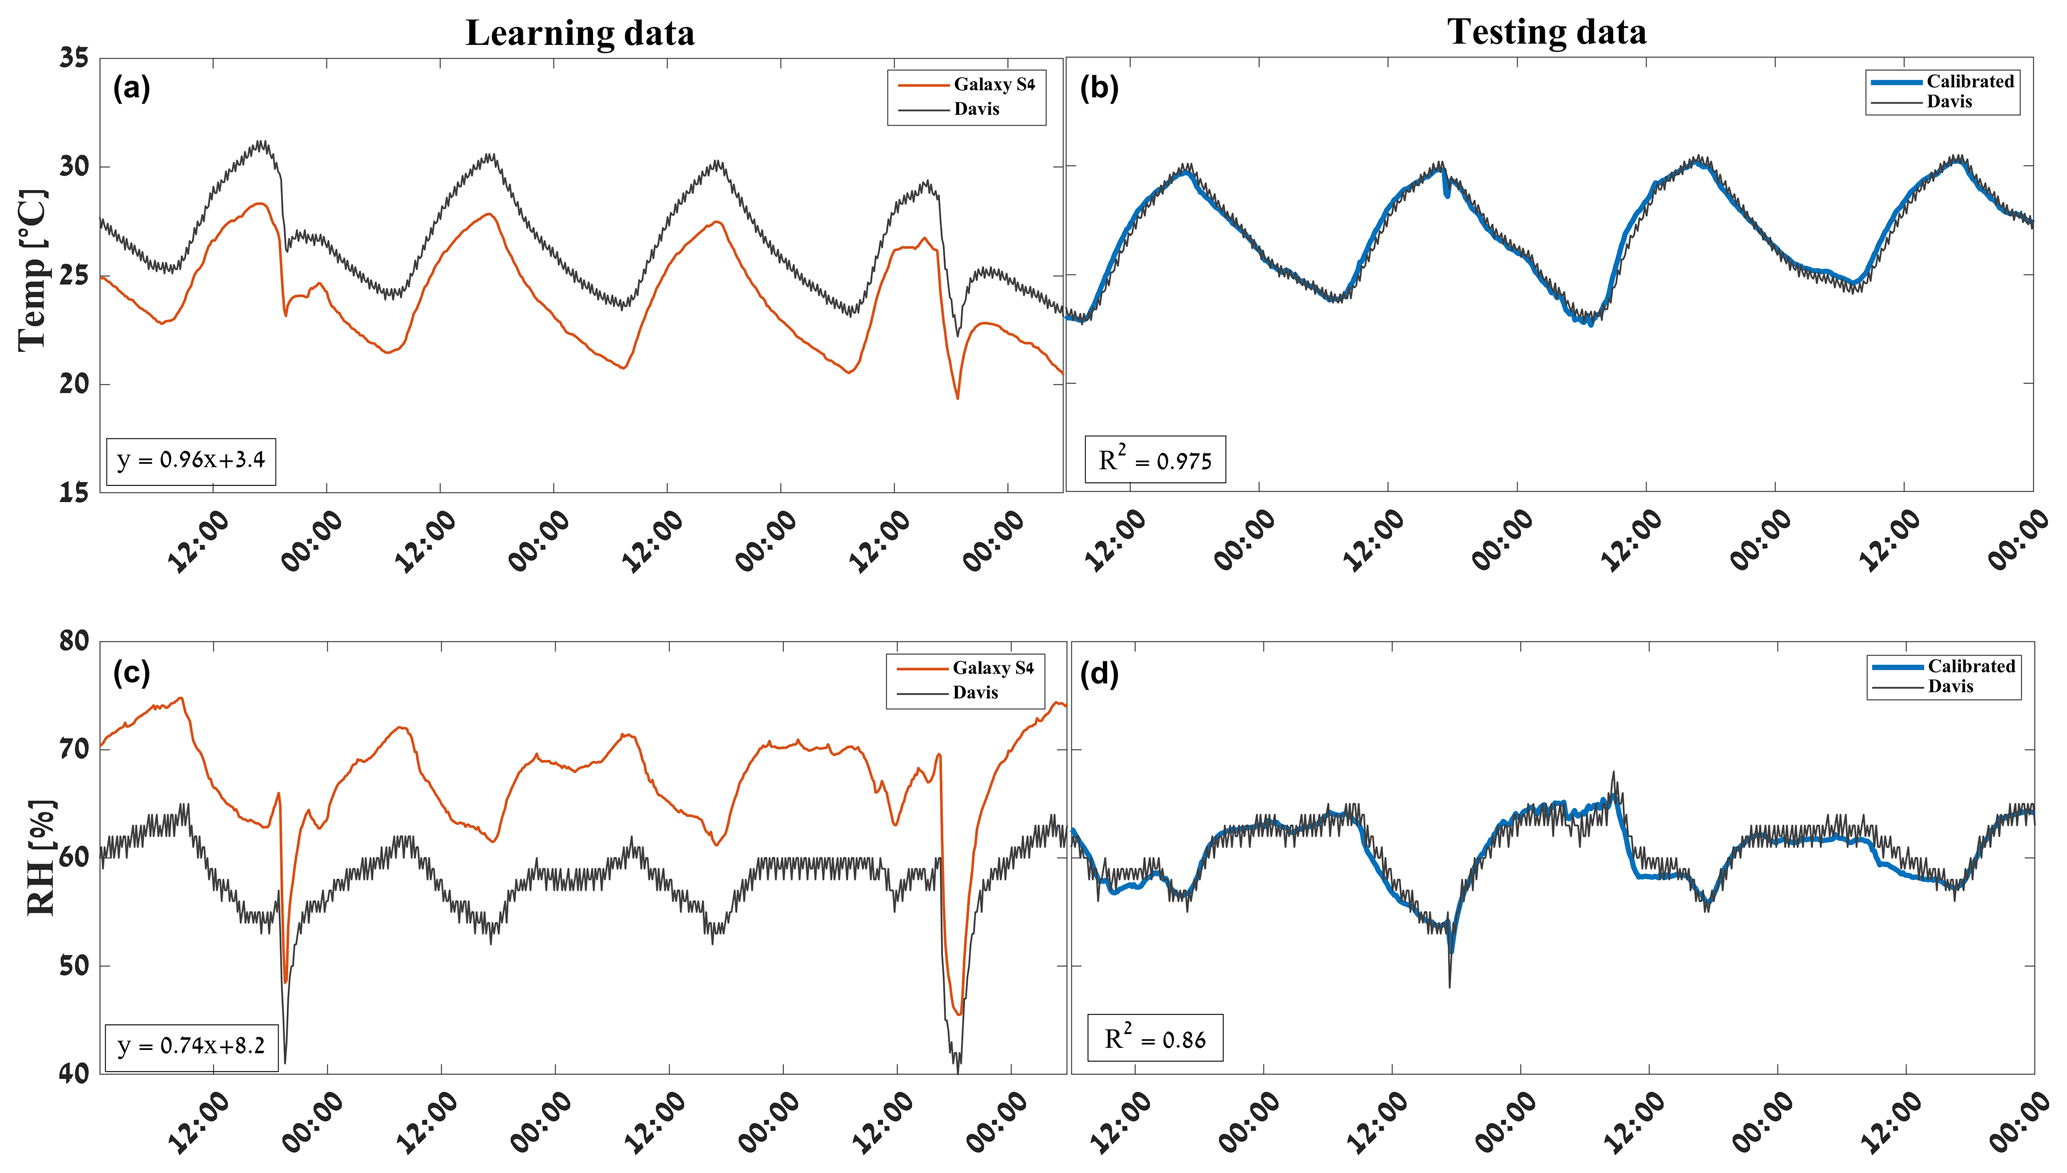
Figure 2Temperature and RH control experiment with a stationary smartphone (Samsung Galaxy S4) and an adjacent weather station (Davis Vantage Vue), conducted in Israel. (a, c) Raw smartphone (red) and weather station (black) T and RH values, respectively, during 4 d (2–6 October). (b, d) Smartphone calibrated data (blue) and weather station (black) T and RH values, respectively, for a different 4 d (7–10 October).
The data acquired from both sensors were split into training/learning data and testing data (Fig. 2). Using simple linear regression, we calibrated the smartphone data using the Davis T and RH as ground truth for two periods (2–6 October and 7–10 October). As can be seen in Fig. 2, after calibrating with a simple linear regression, the correlation between the calibrated T and RH data and the Davis data is very high for both parameters (R2 of 0.86 and 0.975). This experiment was repeated several times with several different devices (Galaxy S4) and locations, and all show the same results, consistent with Price et al. (2018).
Given this good estimation for the changes in T and RH using four different Samsung Galaxy S4 smartphone sensors, the next step was to determine how well crowdsourced smartphone data (which are non-stationary and are used in different and varied environments) agree with measurements from official meteorological stations. For the crowdsourced data from smartphones, we used data from the WeatherSignal app (operated by Opensignal https://www.opensignal.com/, last access: 6 March 2017). Opensignal provided almost 4 years of smartphone data (2013–2016) originating from their WeatherSignal app and collected from more than 40 000 smartphone daily users (58 000 in 2014 and 40 000 in 2015) around the globe. Raw smartphone data were supplied without any phone or user ID to protect user privacy. We note that the WeatherSignal app does not operate on iOS (iPhone) and is available only for Android smartphones.
Although this appears to be a relatively large number of global daily measurements, the measurements for specific local locations can be highly variable and limited, and in this study we were limited to the coverage of WeatherSignal users. Using smartphone data, we calculated VPD on a 1° by 1° grid using daily mean T and RH from smartphone data. Since Overeem et al. (2013) already investigated crowdsourced temperature data from the same WeatherSignal data, here we focus primarily on the quality of the RH data from WeatherSignal, although we also show our new analysis of temperature data from these same smartphones.
Due to the extreme fire season in the Iberian Peninsula in 2013, in Fig. 3 we present a comparison between the RH data from two official meteorological stations in the south of Spain in 2013 (European Climate Assessment & Dataset – ECAD, 2020) and the crowdsourced RH data from smartphones in the same region. The RH data from the two weather stations (Fig. 3a) in the south of Spain (latitude 36.75 N, longitude 6.0625 W and latitude 36.5 N, longitude 6.2625 W) were compared with all smartphone data collected in the same area (within latitudes 36–37 N and longitudes 7–6 W) (Fig. 3b). The daily RH in this region was determined using ∼230 smartphone data points per day. After a 3-month period of training and calibration between the official stations and the smartphone data, Fig. 3 shows the calibrated relative humidity data for June to December 2013. The blue curve indicates the RH daily mean from the two official weather stations, while the green curve indicates the RH daily mean from smartphones after calibration. The calibration was also done using a simple linear regression model. The correlation R2 between smartphone RH and official observations was greater than 0.7, implying that the smartphone data can explain more than 70 % of the daily variability in the RH measured by the two meteorological stations in southern Spain. The smartphone data averaged in space and time successfully duplicate the daily fluctuations in RH for this region.
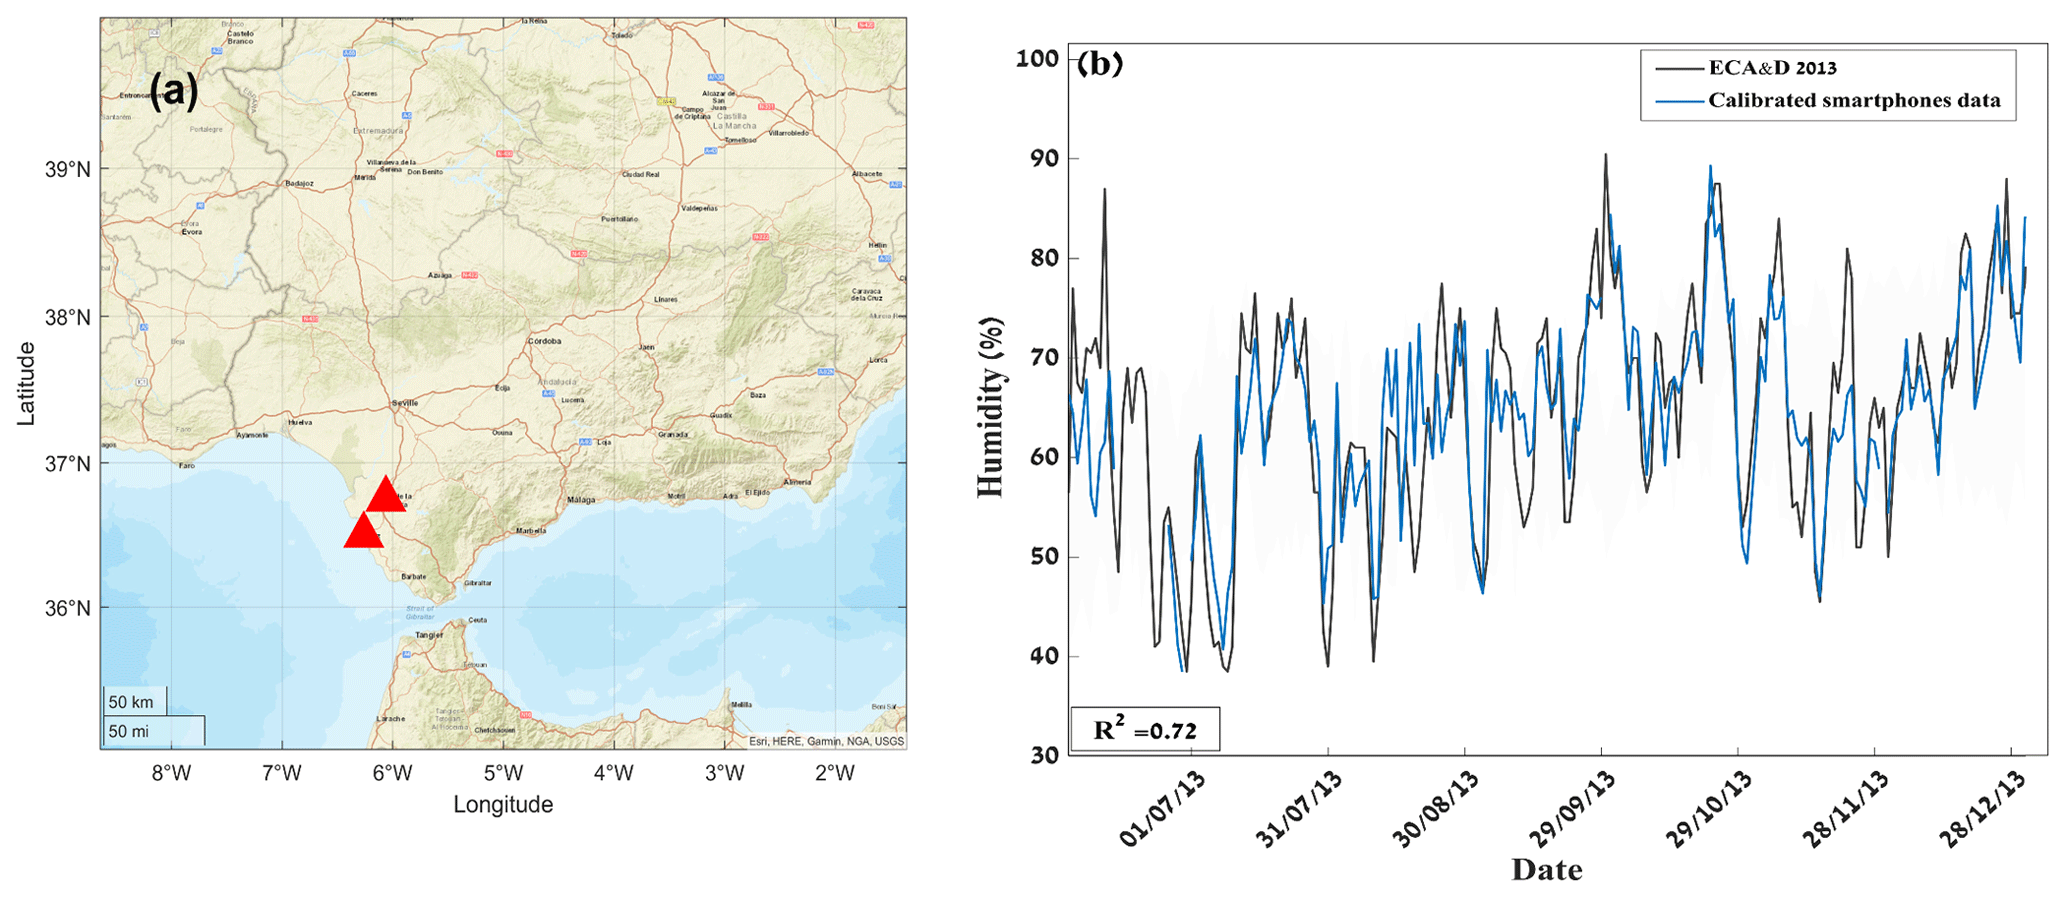
Figure 3RH data from two weather stations in Spain extracted from ECAD (2020) marked with red triangles (a), with the exact location at 36.75° N, 6.0625° W and 36.5° N, 6.2625° W. The RH data collected from smartphones were collected within latitudes 36–37° N and longitudes 7–6° W (over land). Smartphones were trained using data from 3 previous months in the data sets. (b) The calibrated smartphone (blue) and meteorological station (black) mean RH data are shown following the training period from June to December 2013 (R2=0.72).
A similar comparison for smartphone T and RH was performed using the European Centre for Medium-Range Weather Forecast (ECMWF) ERA5 reanalysis (Hersbach et al., 2020) and data from the Israel Meteorological Services (IMS) as ground truth in Israel. Figures 4 and 5 show training/learning data (left panels) and testing data (right panels) for T and RH in Israel. Part of the temperature data sets (learning data) were used to establish the linear relation between the ERA5 and the smartphone data sets (June 2013–December 2015) and then were applied to 2016 using the calibrated data (Fig. 4). The same calibration process was done for RH data from Israel. Figure 5 shows the training/learning RH data and calibration equation for July and August 2016, which was then applied to September to December 2016 (testing data). In general RH data are noisier data compared with temperature data, with less regular diurnal and seasonal trends. Hence, we generally used shorter training data sets (months instead of years) for calibrating the RH data. The calibrations using both data sets (ERA5 and IMS) result in strong correlations between the calibrated data and ground truths for T and RH (R2>0.83).
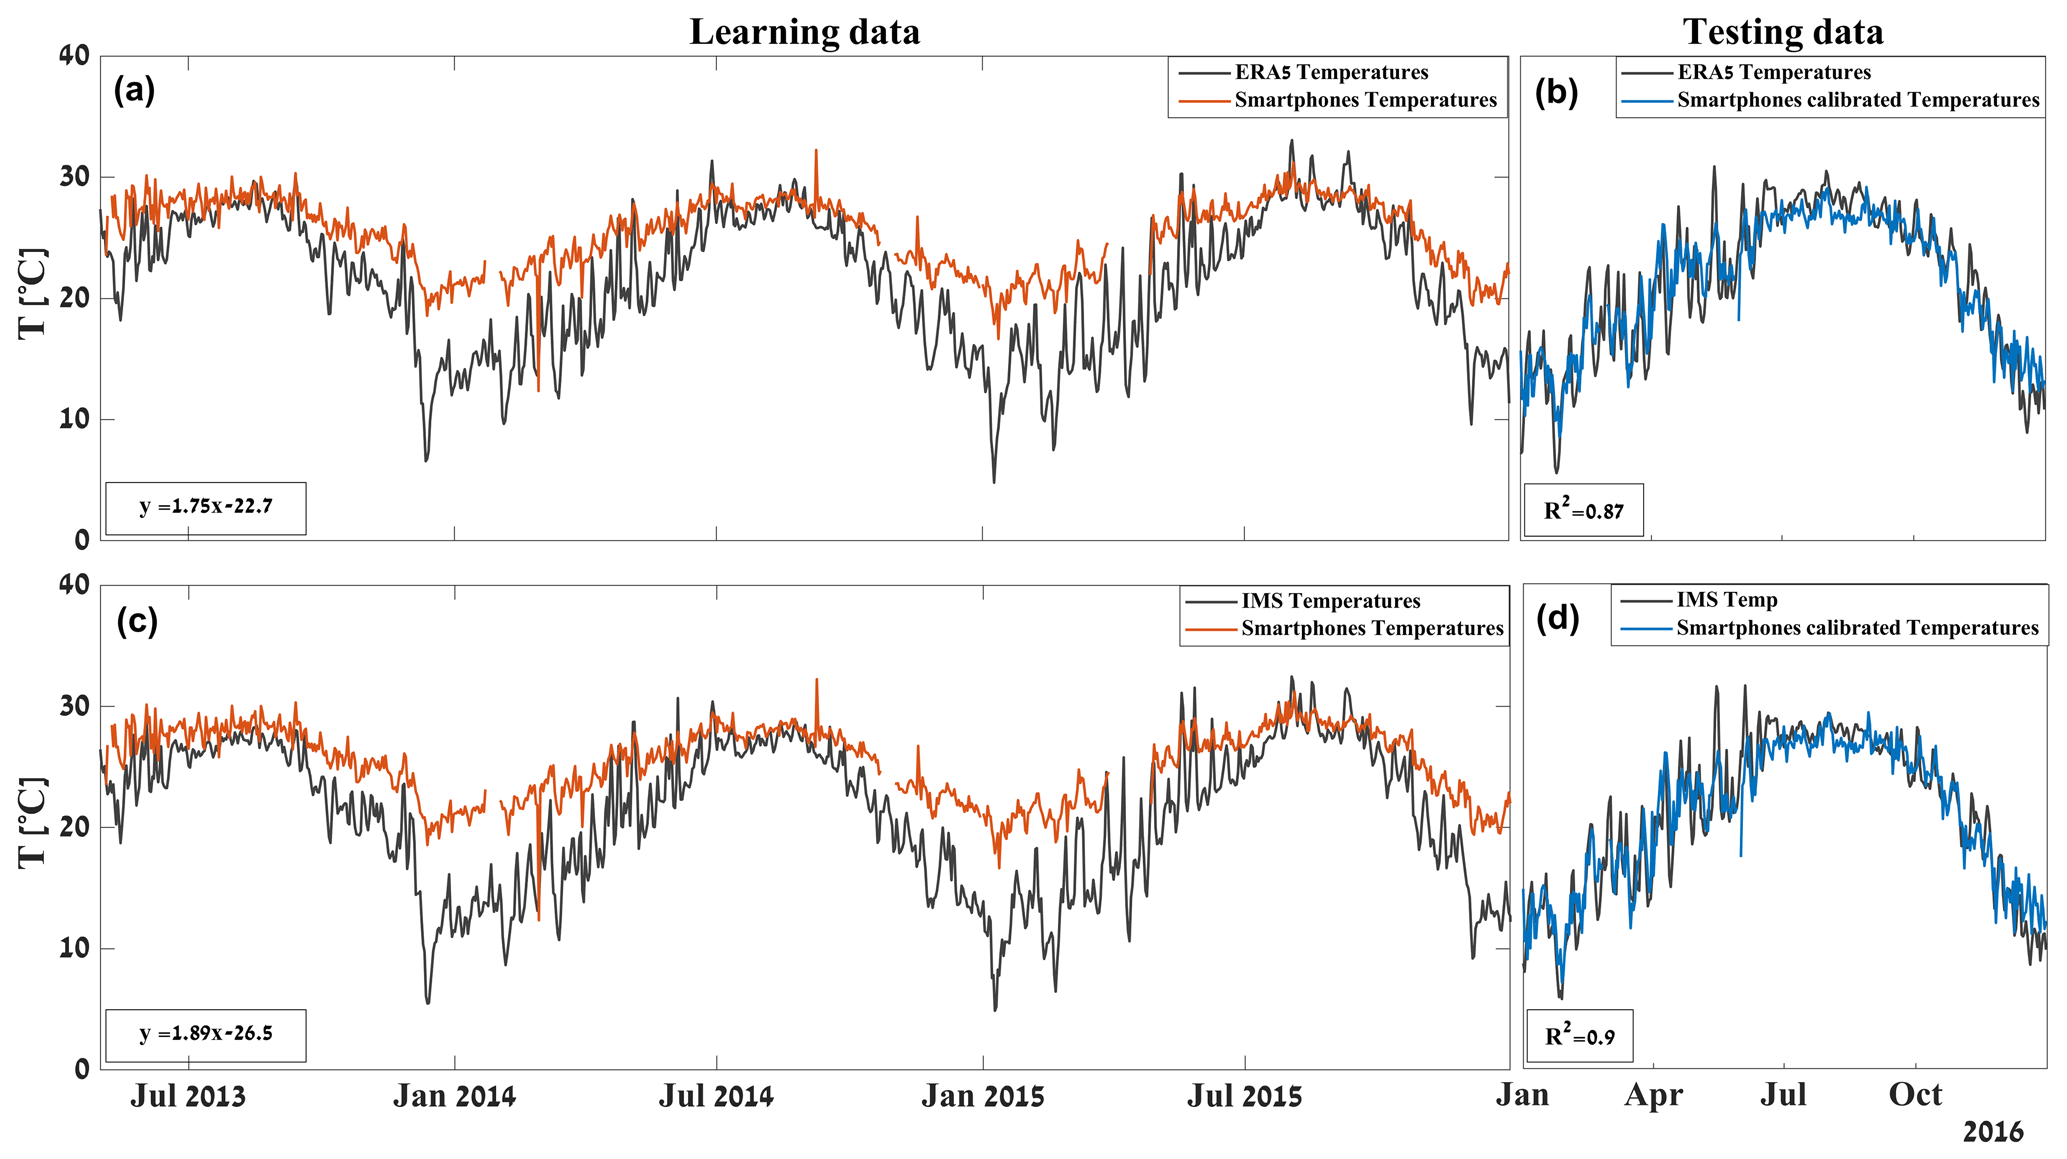
Figure 4Daily temperatures for Israel from ERA5, IMS, and smartphones. (a, c) Learning data: linear regression equations using the two data sets over 2.8 years (black, ERA/IMS; red, smartphones). (b, d) Calibrated smartphone data in blue and ERA5 and IMS data in black for the year of 2016 (R2=0.87–0.9). The regression curve uses temperature in units of degrees Celsius.
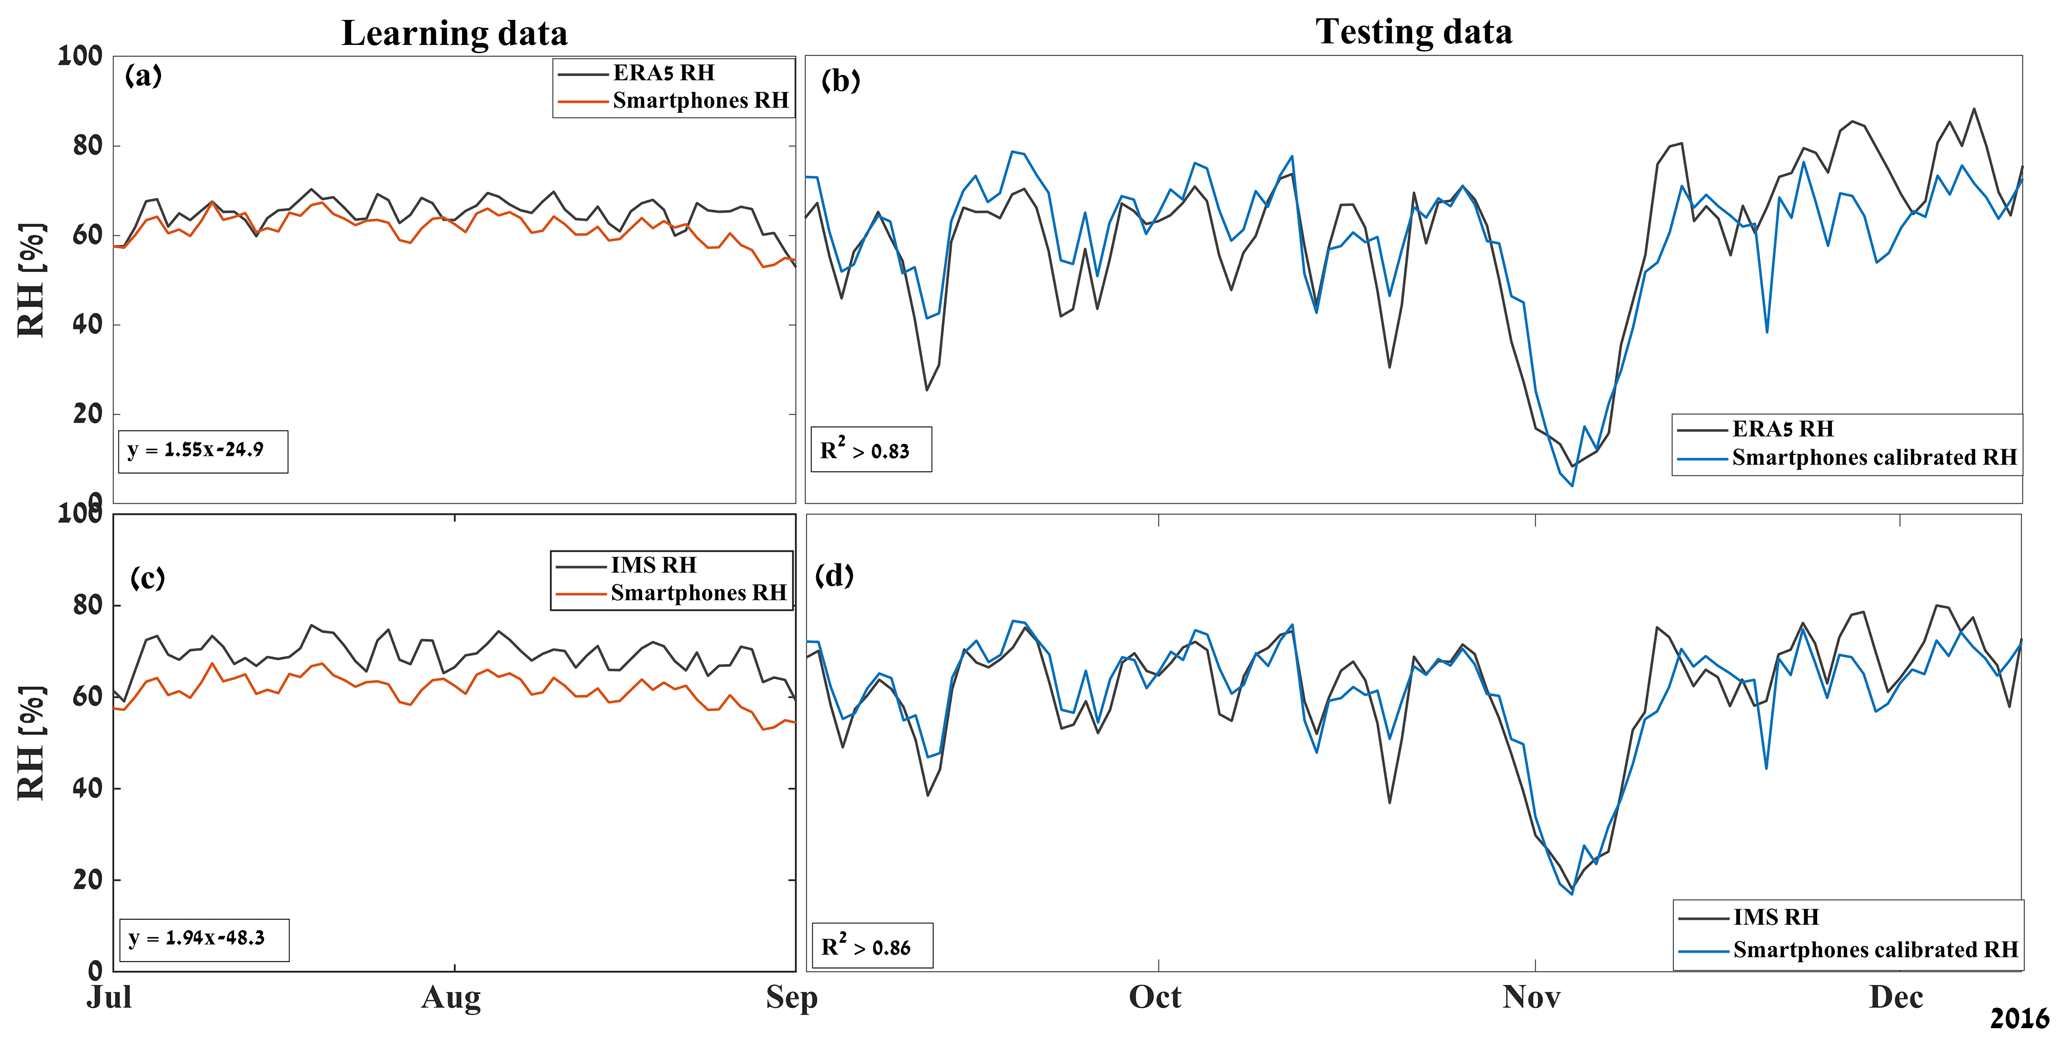
Figure 5Daily RH for Israel from ERA5, IMS, and smartphones. (a, c) Learning data: linear regression equations were found using these two data sets for 2 months (black, ERA/IMS; red, smartphones). (b, d) Calibrated smartphone data in blue and ERA5 and IMS data in black for September–December 2016 (R2=0.83–0.97).
A further comparison was done with T and RH data collected from ERA5 and smartphones in Portugal. The results are shown in Figs. 6 and 7. Figure 6 shows the temperature learning data in the left panel (June 2013–January 2015) and the testing data in the right panel, showing a high correlation coefficient (R2>0.8). Figure 7 shows the RH learning data in the left panel (June–December 2013) and the calibrated testing data in the right panel, showing a rather moderate correlation (R2=0.55). As mentioned above, we found that the calibrated T data are generally in better agreement with the ERA5 data than the calibrated RH data. This could be due to fewer smartphones having RH sensors than temperature sensors, and hence there is a larger sensitivity to RH outliers and/or the impacts of rapid changes in RH over relatively short distances between users (unlike temperature). In conclusion, we found that the RH crowdsourced data are less reliable than the T crowdsourced data, even though the temperature data are significantly impacted by the battery temperature in the phones.
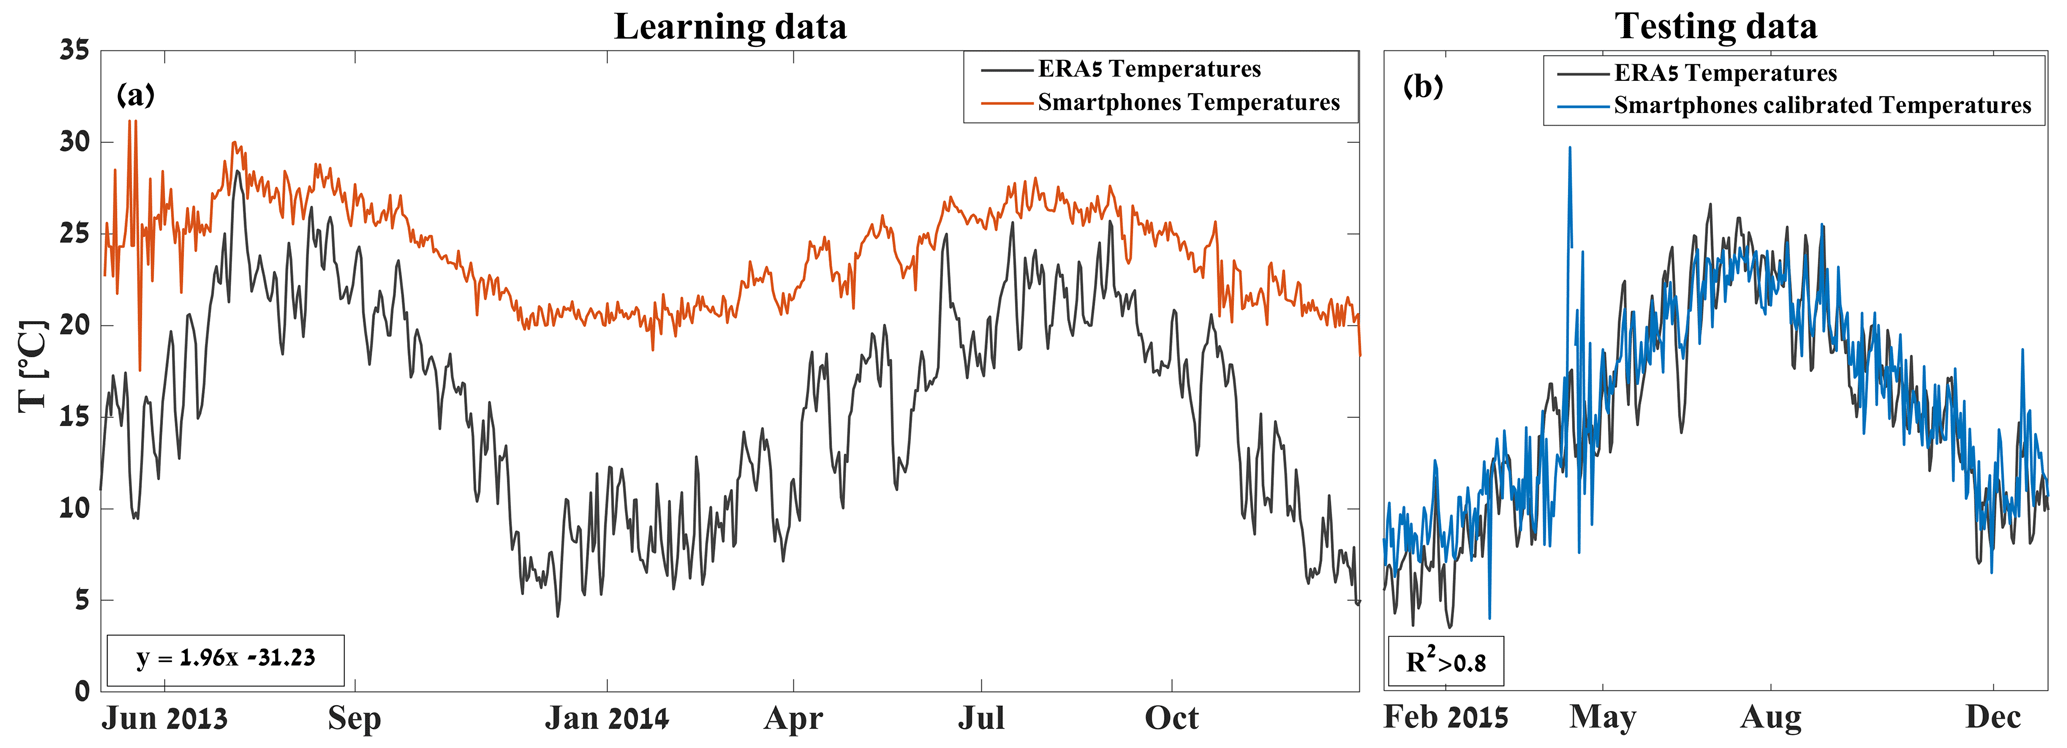
Figure 6Daily temperatures for Portugal from ERA5 and smartphones. (a) Learning data: linear regression equations were found using these two data sets over 1.6 years (black, ERA; red, smartphones). (b) Calibrated smartphone data in blue for the year of 2015 (R2>0.8). The peak temperatures were associated with the extreme heat in the Iberian Peninsula in April 2015, with temperatures reaching nearly 40 °C at some locations.
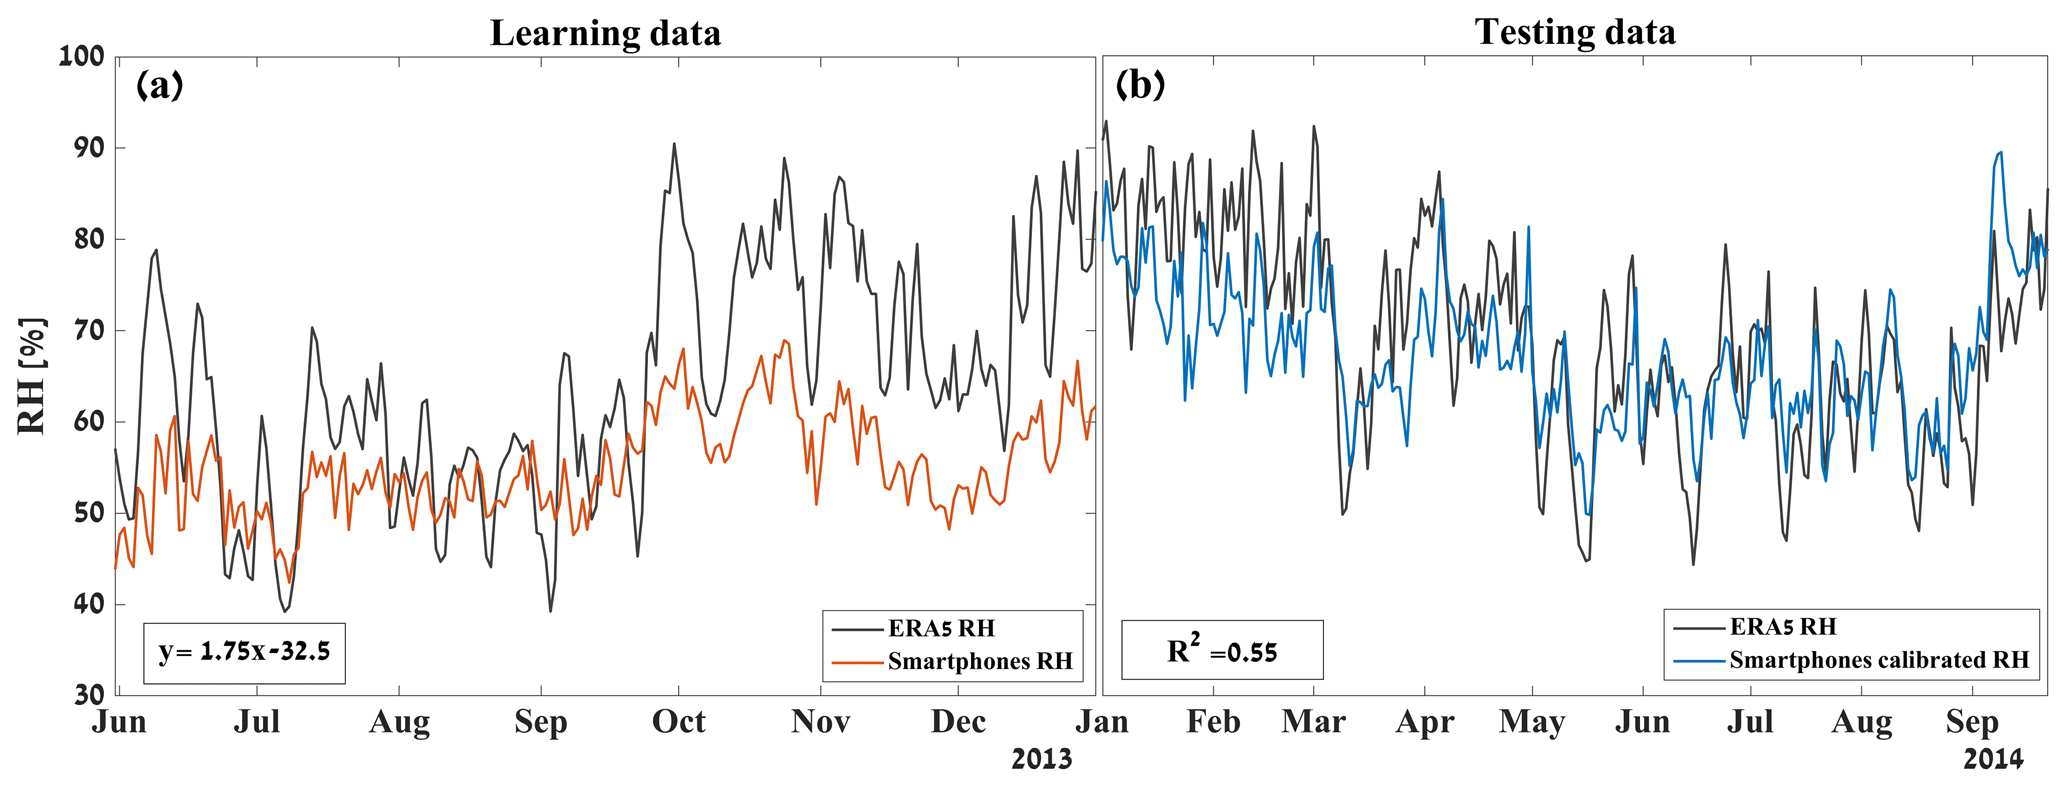
Figure 7Daily RH for Portugal from ERA5 and smartphones. (a) Learning data: linear regression equations were found using these two data sets over a 7-month period (black, ERA; red, smartphones). (b) Calibrated smartphone RH data in blue for the year of 2014 (R2=0.55).
From the temperature data (Figs. 4 and 6) the annual variations in smartphone T values are apparent (lower T in wintertime and higher T in summer), but compared with data from ECMWF and IMS data the winter temperatures are always too warm. This can be explained by smartphone T being affected by internal heat, and, moreover, most smartphone temperature measurements in winter are taken indoors, as opposed to the official weather stations. In addition, the ECMWF model has its own obvious biases in wintertime, often reporting warm biases too. So the ERA5 reanalysis cannot always be regarded as ground truth. Nevertheless, using the ECMWF and IMS data to calibrate T dramatically improves the accuracy of the smartphone data. All further analyses were done with daily calibrated smartphone data (T and RH).
2.2 Vapor pressure deficit (VPD)
Vapor pressure deficit (VPD) is the difference between the water vapor content of the air and its saturation value (Eq. 1a). Unlike T and RH each by itself, VPD can reflect more accurately the ability of the atmosphere to extract moisture from the land surface and fuels and estimate the potential of fuel for fires. While RH is defined as the ratio between the actual vapor pressure ea and the saturation vapor content of the air at a certain temperature, es (Ta), in percentage (Eq. 1b), it is not an absolute measure like VPD (hPa). In addition, VPD shows an almost linear relationship with the rate of evapotranspiration.
VPD can be calculated by using RH and es(Ta), as can be seen in Eq. (2):
The August–Roche–Magnus approximation (Eq. 3) presents an empirical relationship for es that implies VPD varies exponentially as a function of T and RH because es(Ta) depends on the Clausius–Clapeyron equation. In other words, the same water vapor pressure at different temperatures results in very different RH values. Despite its low popularity, VPD has been investigated in several papers and has shown a high correlation with burnt area for forest fires in the United States (Williams et al., 2014; Seager et al., 2015; Sedano and Randerson, 2014; Brown et al., 2023; Rao et al., 2023).
In our analysis we calculated VPD both temporally and spatially using the calibrated smartphone data (T and RH). Daily VPD values were calculated for the entire time period as well as during large fire events. The background climatology of VPD was calculated using ERA5 T and RH data from 2000 to 2010 (10 years). These years are independent of our data (2013–2016) and represent a climatological background for comparison with the smartphone data.
For the spatial analysis, a spatial anomaly index was created using a climatology of VPD in 3 non-fire years from the smartphone data and averaging the daily VPD at a spatial resolution of 1°×1°. When analyzing the wildfire case studies, we subtracted the daily mean VPD of a specific month from the 3-year non-fire monthly mean to calculate the ΔVPD (VPD anomaly). An index of zero means that the daily VPD is the same as the monthly climatology, and a negative or positive index indicates that VPD is lower or higher than usual for this day. An anomaly larger than 2 standard deviations from the climatological VPD represents a statistically significant anomaly at the 95 % level, while a 3-standard-deviation anomaly represents a statistical significance greater than 99.7 %. High positive values of VPD imply enhanced drying of vegetation and enhanced fire risk.
Below, we present the analysis of VPD during wildfire events in Israel and Portugal between 2013 and 2016 using smartphone data.
3.1 Israel
From 18 to 29 November 2016, Israel was influenced by two different pressure systems causing dry surface winds from the northeast. There were more than 1770 fires, 40 of which were considered mega-fires (burning more than 4000 ha); houses and properties were destroyed; and around 300 people were injured. The total damage was estimated at USD 150 million (KKL JNF, 2020). Data from the IMS show that the overall mean values of the relative humidity during that period (coming from 80 stations scattered around Israel) were below 20 %, and at the peak they were as low as 10 %.
Figure 8 shows the temporal and spatial analysis on regional maps showing the absolute VPD (Fig. 8 top panels) and the VPD anomaly (Fig. 8 bottom panels) calculated from smartphones for individual days in November 2016. The maps start on 16 November, with a 3 d interval between each map (a–e). From 22 to 27 November, widespread fires occurred, with the VPD evolving during these 2 weeks. As mentioned before, ΔVPD is calculated using the monthly mean of the calibrated VPD for a specific month (here November 2013, 2014, and 2015) and subtracting November 2016 daily means from the November 3-year monthly mean. Figure 8 shows extreme anomalies (>8 hPa) in VPD during the days of wildfire (22–27 November).
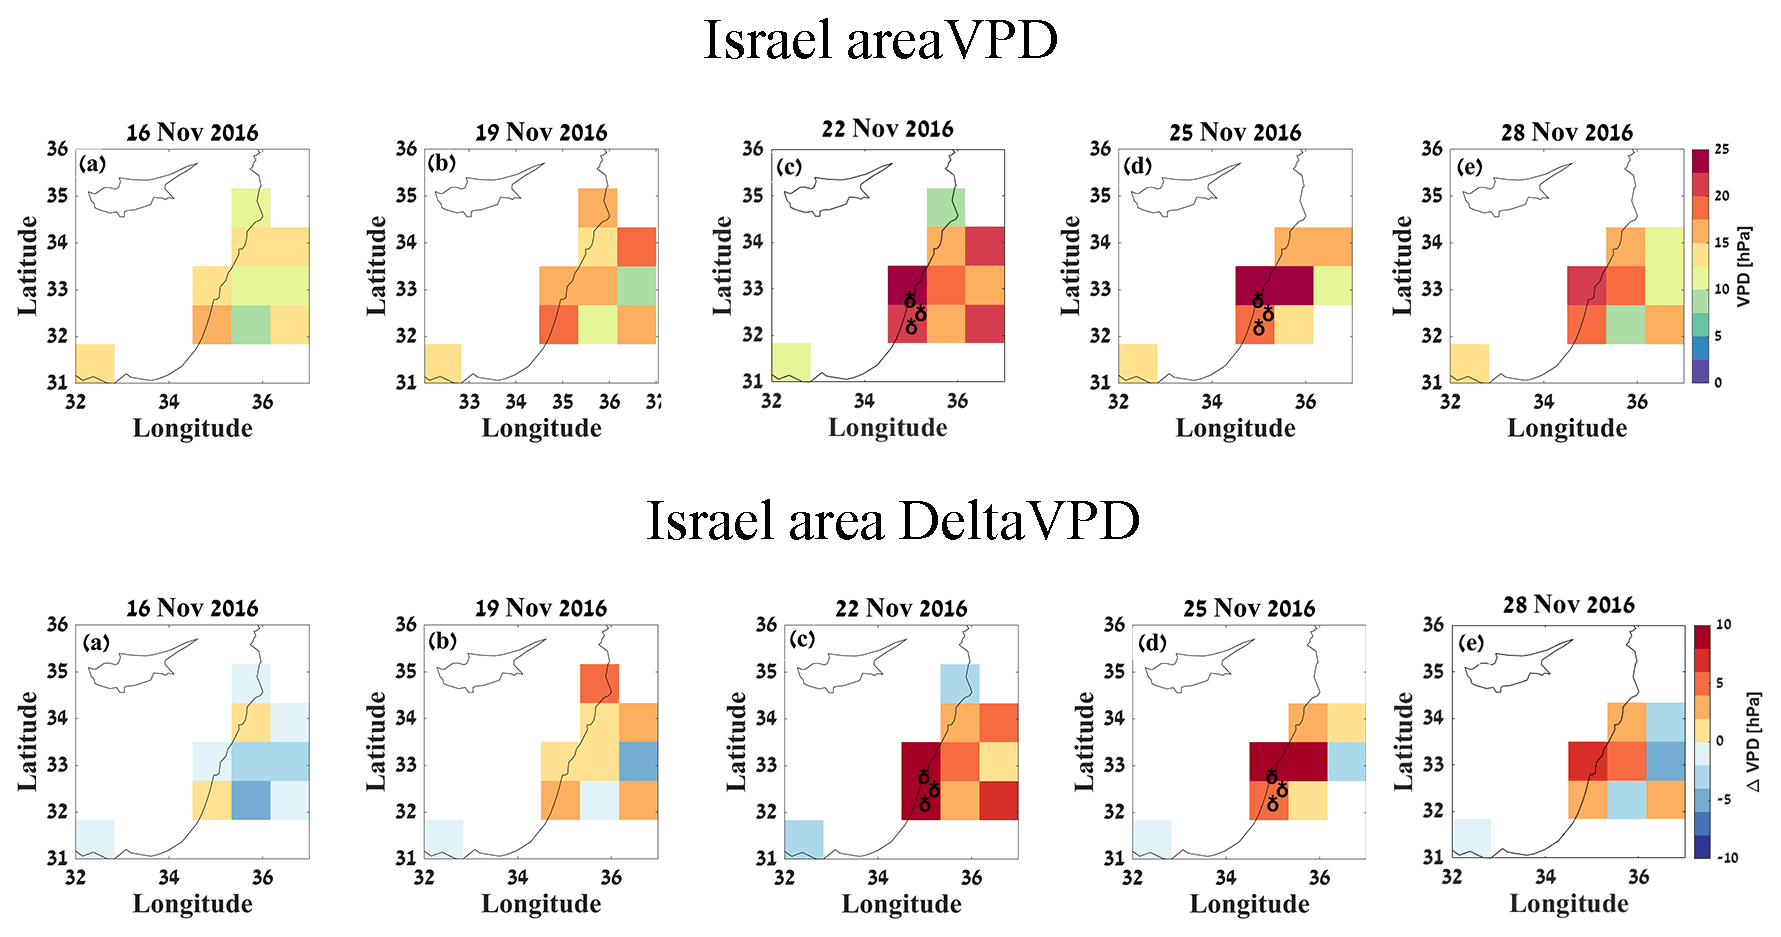
Figure 8(a–e, top) Absolute VPD calculated from smartphones for days in November 2016, starting with 16 November and with a 3 d interval between each map. Extreme wildfires occurred from 22 to 27 November (locations of fires are marked with black symbols). (a–e, bottom) ΔVPD calculated from smartphones for days in November 2016, starting with 16 November and with a 3 d interval between each map. Extreme wildfires occurred from 22 to 27 November (locations of fires are marked with black symbols).
Figure 9 shows July to December 2016 daily VPD calculated from smartphones (red line) across Israel, compared with the 2000–2010 climatology of daily mean VPD for the same area from ERA5 (dashed blue line), together with 1 standard deviation (light blue lines). A significant increase and anomaly in VPD are detected a day before the fires start (21 November 2016) and during the fires, with an increase that starts at 1σ going up to 8σ. Hence, this anomaly in VPD in November, detected by the smartphones, is statistically significant at the 99.9999 % level. There was also another large VPD positive anomaly at the end of August 2016, implying high wildfire danger. However, no significant fires occurred.
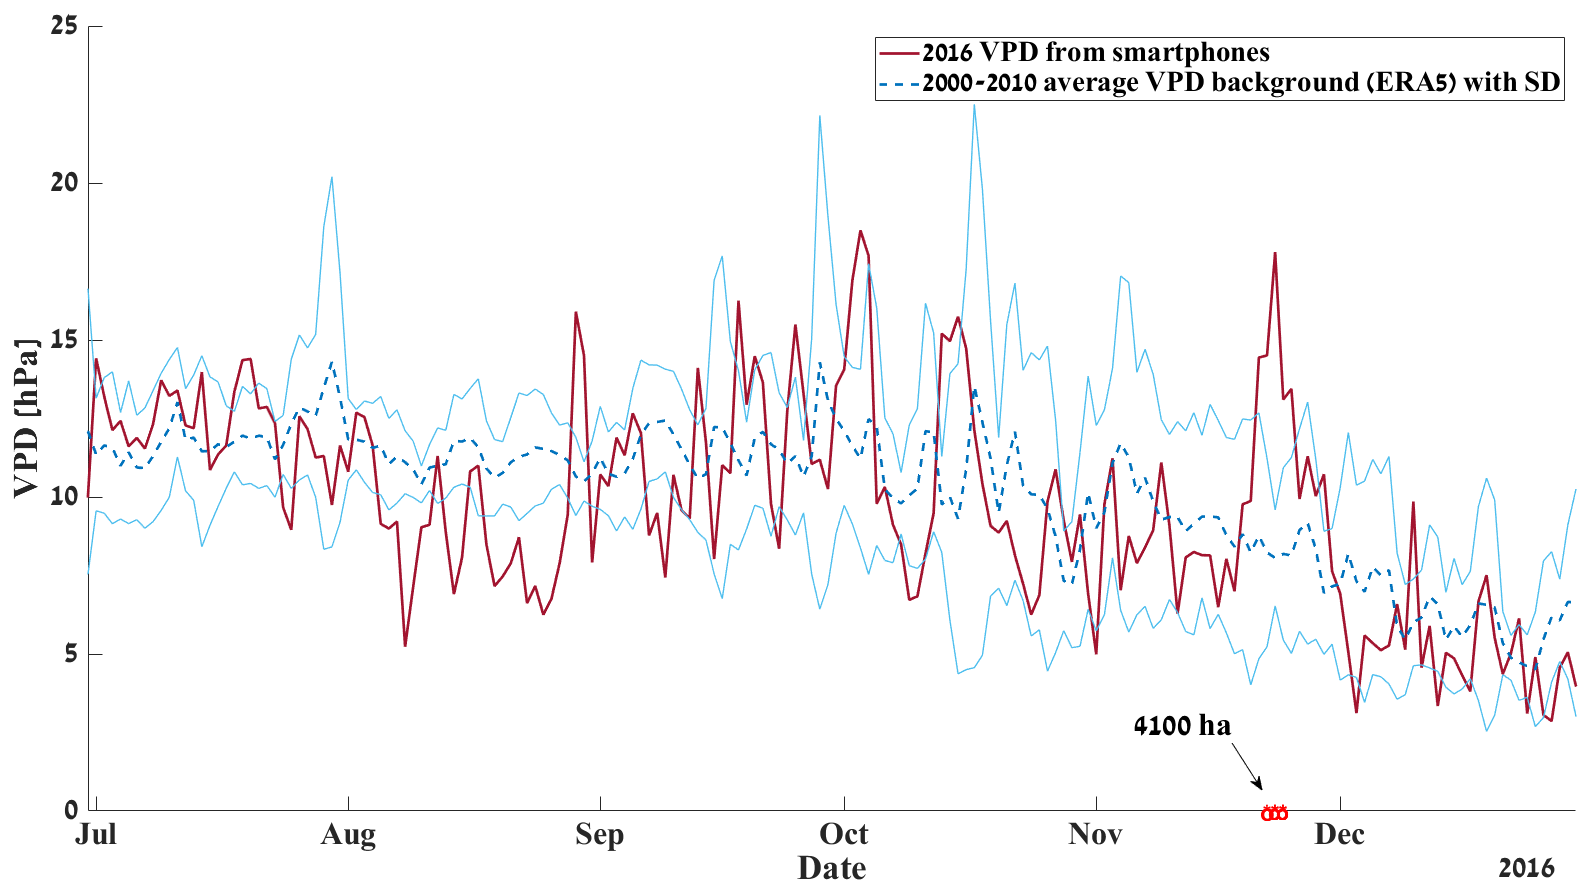
Figure 9Israel July–December 2016 daily mean calibrated smartphone VPD (red) vs. 10-year (2000–2010) daily mean VPD for the same area from ERA5, with 1 standard deviation (light blue envelope) used as the background reference climatology of VPD. Fires indicated with red marks had a total burnt area of 4100 ha.
3.2 Portugal
According to Forest Fires in Europe, Middle East and North Africa reports for 2013–2016 (Schmuck et al., 2014, 2015; San-Miguel-Ayanz et al., 2016, 2017), in 2013 Portugal was severely affected by fires. More than 350 fires bigger than 40 ha occurred in Portugal, while most of the damage occurred between July and September. The fire season in Portugal was more severe in 2013 due to the easterly flow over the Portuguese mainland providing hot continental air over the fire areas. The year 2016 is ranked second after 2013, with a similar burnt area but fewer fires in numbers (Table 2). The smartphone analysis for the Iberian Peninsula is shown in Figs. 10 and 11 and is evaluated for latitudes 37–43 N and longitudes 9–6 W. Fires in this region were examined using data from the European Forest Fire Information System (EFFIS, https://effis.jrc.ec.europa.eu, last access: 7 February 2019).
Table 2Number of fires and total burnt area (ha) in Portugal for years 2013–2016.
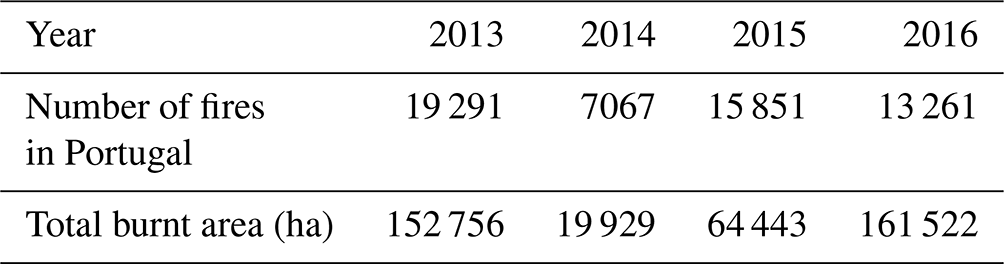
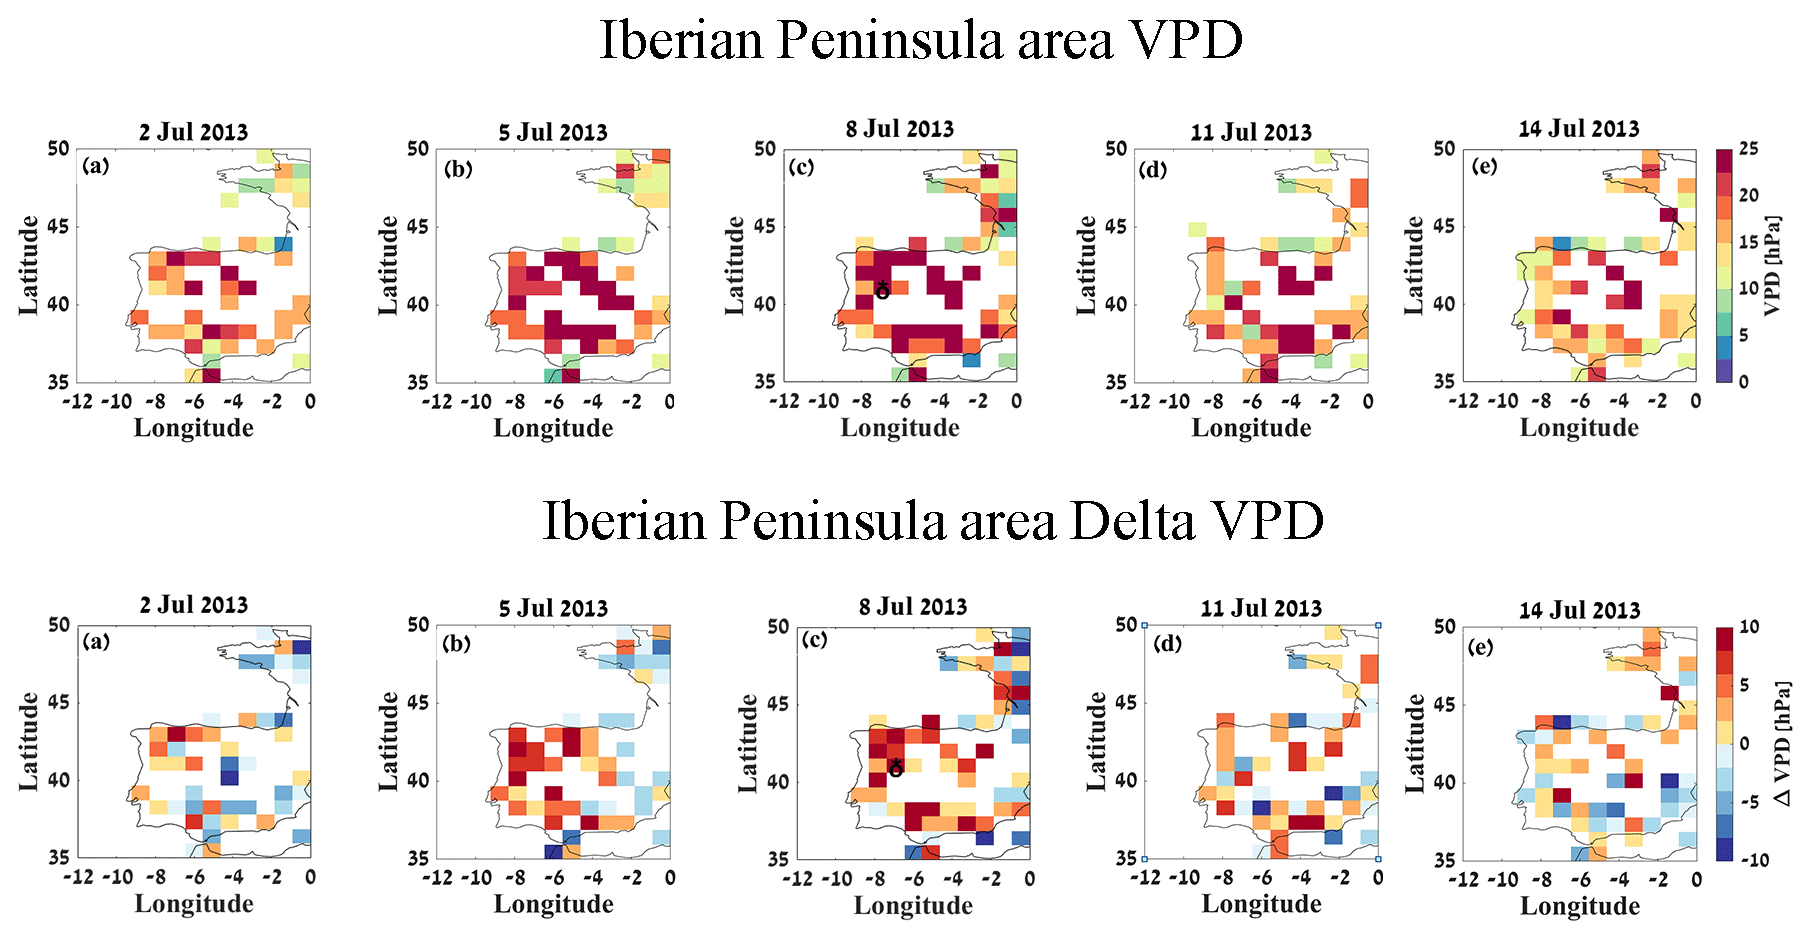
Figure 10(a–e, top) Absolute VPD calculated from smartphones for days starting with 2 July and with a 3 d interval between each map. The wildfires occurred on 8 July 2013 with total burnt area >15 000 ha (locations of fires are marked with black symbols). (a–e, bottom) VPD anomalies calculated from smartphones for days starting with 2 July and with a 3 d interval between each map. The fires occurred on 8 July 2013 with total burnt area >15 000 ha (locations of fires are marked with the black symbol).
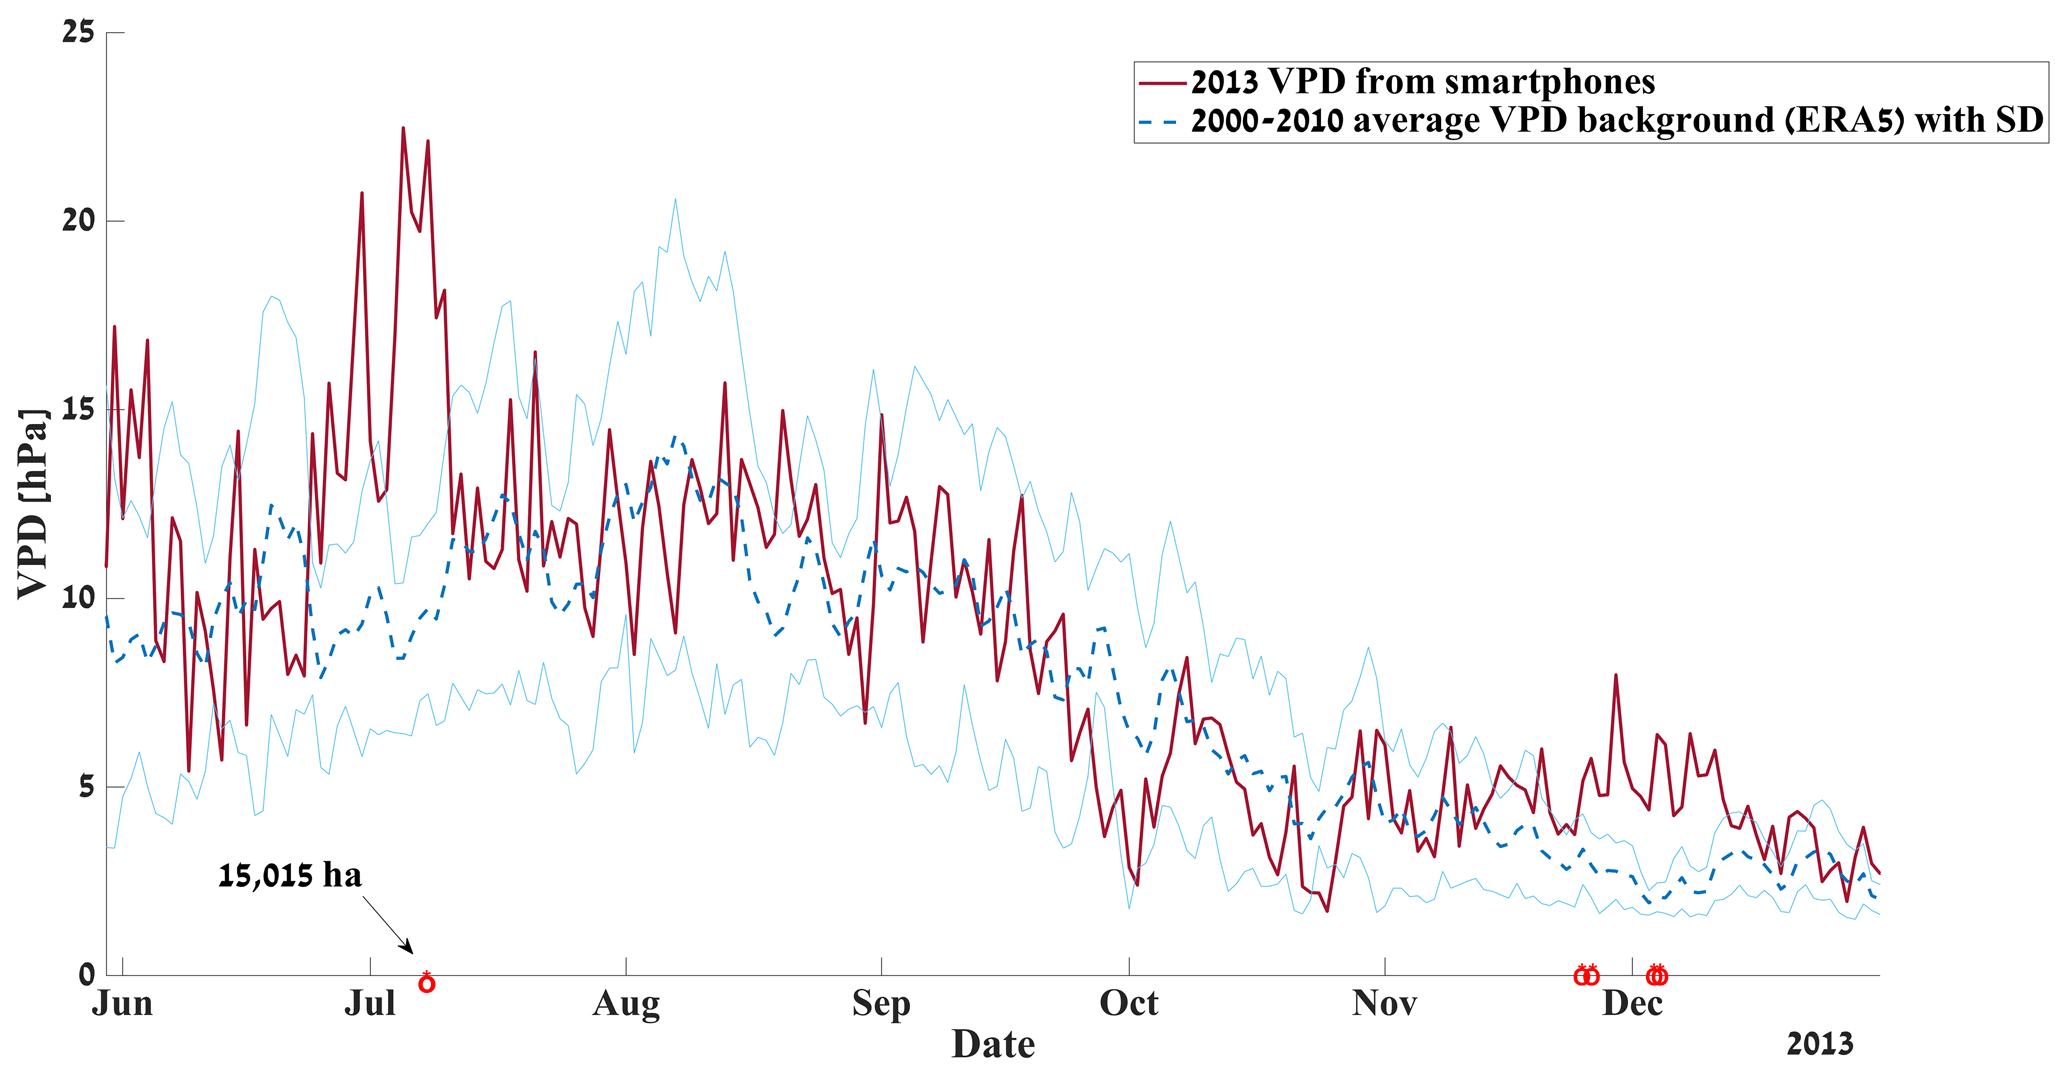
Figure 11Portugal June to December 2013 daily mean calibrated smartphone VPD (red) compared with 10-year (2000–2010) daily mean VPD for the same area from ERA5 with 1 standard deviation (light blue envelope) used as the background reference climatology of VPD. Large fires are indicated with red symbols. In July 2013, the total burnt area was >15 000 ha. In late November and early December 2013, the total burnt area was >1660 ha.
Figure 10 (top panels) shows the temporal and spatial analysis, where the maps show the absolute VPD values calculated from smartphones for days in July 2013, starting with 2 July and with a 3 d interval between each map, while on 8 July a large wildfire occurred (>15 000 ha). Figure 10 (bottom panels) shows the ΔVPD index, calculated using the monthly mean VPD of the discussed month (here July 2014, 2015, and 2016) and subtracting July 2013 daily means from the July 3-year monthly mean. Figure 10 shows large extreme anomalies in VPD (>8 hPa) in the day before and during the wildfire (8 July 2013). The regions in white did not have sufficient smartphone data for this analysis.
Figure 11 shows June to December 2013 daily VPD calculated from smartphones (red line) and the 2000–2010 daily mean VPD for the same area from ERA5 (dotted blue line), together with 1 standard deviation (blue lines). A significant increase in VPD is detected 2 weeks before the fire, when VPD remains high above the SD background envelope, and it reaches a maximum anomaly 3 d before the large fire (5 July 2013), with VPD values of more than 6σ and remaining around these values for 2 d after the fire started (10 July 2013). Such large anomalies are statistically significant above the 99.999 % level and suggest that dry and hot weather was surrounding the Portugal region, drying fuels and increasing the fire risk. Another interesting observation is the high VPD value around the end of November and the beginning of December 2013. December was surprisingly dry, with more than 510 fires reported and more than 1660 ha burnt around Portugal.
We have analyzed vapor pressure deficit (VPD) anomalies from crowdsourced smartphones to show the potential of smartphone data for detecting significant drying anomalies related to wildfire events in two different locations in the Mediterranean region. The November 2016 fires in Israel together with the 2013 fires in Portugal were caused by dry weather that caused rapid drying out of surface fuel and local vegetation. The smartphone-calculated VPD anomalies in these two locations closely match the periods of severe dry weather and severe wildfires.
Large anomalies in VPD, calculated with calibrated smartphone T and RH data, often occur days before the fires start while continuing to rise during the fire periods, reaching 6–8 standard deviations above the mean – a highly statistically significant anomaly (>99.9999 % significance). In our two case studies the VPD anomalies at their peaks were above +8 hPa. In this study we considered the daily mean VPD. This may introduce biases in the actual extreme VPD values, since some of the data may have been collected outdoors (daytime) and indoors (nighttime). In addition, there have been recent studies highlighting the importance of nighttime VPD for the effectiveness of fire suppression operations (Balch et al., 2022). During nighttime, fuels may recover part of their moisture content; when VPD remains high at night, this process is hindered and fuels' flammability remains high, thus supporting the rapid spread of fire.
Not every significant increase in VPD leads to a fire, since without an ignition source a fire will not occur. Furthermore, smartphones may give inaccurate readings since they are non-stationary, moving from desk to pocket, from indoor A/C to outdoors, and sometimes from countryside to urban heat islands. Of course, fire weather and warning depend on additional more complex parameters, such as solar radiation, types of fuel at the surface and subsurface, topography, cloud cover, and ignition sources. However, many of these parameters may be reflected in the local temperature and humidity fields.
Our vision is to one day use crowdsourced smartphone data to extract useful information that will help provide early warnings of fire hazards and risks. Such warnings could be supplied in real time to the public, and they could be supplied to firefighters and emergency management authorities at high spatial resolution and close to real time. In the future, such warnings could be supplied on a smartphone application made available to users that contribute their data to the crowdsourced early-warning algorithm. As with mapping applications for traffic and hiking, future applications can be developed to supply smartphone sensor data to a central processing unit and within a few seconds receive in return the fire hazard index on the user's phone.
We propose that crowdsourced smartphone data may eventually provide superior spatial resolution than regular meteorological networks as the density of smartphones over the world grows. Obviously, these data need to be obtained first in order to use them, but the coverage of these high-volume–high-density data is far greater than the coverage of stationary weather stations. This is especially true in developing countries where other sources of public early warnings are less available. In conclusion, we encourage the future use of smartphone data collected by the public to help monitor extreme fire hazard conditions at high temporal and spatial resolution. However, it should also be noted that this research was done using smartphones in the market between 2013 and 2017. This includes all smartphone models that downloaded the WeatherSignal app during that period. The more recent smartphones have fewer sensors, and the relative humidity sensor is less common in recent smartphones in order to fulfill customers' demands to make smartphones more robust against water. In addition, due to the number of data available to us from WeatherSignal, we averaged the data on 1°×1° grid boxes. While we have shown that when comparing with individual weather stations the agreement is significant (Figs. 2 and 3), we recommend future analysis with better data be performed at 0.1° spatial resolution and 1 h temporal resolution.
It is true that other observation networks can also supply the data supplied by smartphone users, often at better quality. However, the novelty of our methodology is using sensors that are commonly found in smartphones carried by the public without specifically purchasing these sensors from the users, and often the users do not even know they are collecting these data. The crowdsourcing method presented here is not intended to replace conventional methods of collecting meteorological data but as an additional tool to use, particularly since these sensors are non-stationary, have high density in populated areas, and are beneficial in developing countries where smartphones are quite well distributed compared to fixed meteorological sensors. Furthermore, the connectivity of smartphones via the cell phone networks is built in and transparent compared regular stationary observation networks.
Finally, to address privacy issues when using smartphone data, we suggest data collection apps to save and supply only area-averaged values (superobs) (McNicholas and Mass, 2021) to researchers and users. Supplying gridded data at 1 km spatial resolution and 1 h temporal resolution would eliminate any privacy and user identification issues.
The smartphone data can be obtained directly from Opensignal (https://www.opensignal.com/, last access: 6 March 2017, Opensignal, 2015) via their WeatherSignal app (https://weathersignal.en.uptodown.com/android, last access: 6 March 2017). The ERA5 data are available from the ECMWF (https://doi.org/10.24381/cds.adbb2d47, Hersbach et al., 2020).
HS and CP designed the experiments and HS carried them out. HS prepared the paper with contributions from all co-authors. DRE and CM helped with editing and funding of this research.
The contact author has declared that none of the authors has any competing interests.
Publisher's note: Copernicus Publications remains neutral with regard to jurisdictional claims made in the text, published maps, institutional affiliations, or any other geographical representation in this paper. While Copernicus Publications makes every effort to include appropriate place names, the final responsibility lies with the authors.
We would like to thank Opensignal for supplying the WeatherSignal data free of charge for this research.
This research has been supported by the United States–Israel Binational Science Foundation (grant no. 2018186).
This paper was edited by Oded Katz and reviewed by two anonymous referees.
Anderson, H. E.: Aids to determining fuel models for estimating fire behavior, USDA Forest Service General Technical Report INT-122, 2, 3820–3824, Ogden, Utah, 1982.
Balch, J. K., Abatzoglou, J. T., and Joseph, M. B.: Warming weakens the night-time barrier to global fire, Nature, 602, 442–448, https://doi.org/10.1038/s41586-021-04325-1, 2022.
Baumgartner, A., Klemmer, L., Raschke, E., and Waldmann, G.: Waldbrände in Bayern 1950 bis 1959, Mitteilungen aus der Staatsforstverwaltung Bayerns, 36, 57–79, 1967.
Bovalo, C., Barthe, C., and Bègue, N.: A lightning climatology of the South-West Indian Ocean, Nat. Hazards Earth Syst. Sci., 12, 2659–2670, https://doi.org/10.5194/nhess-12-2659-2012, 2012.
Brown, P. T., Hanley, H., Mahesh, A., Reed, C., Strenfel, S. J., Davis, S. J., Kochanski, A. K., and Clements, C. B.: Climate warming increases extreme daily wildfire growth risk in California, Nature, 621, 760–766, https://doi.org/10.1038/s41586-023-06444-3, 2023.
Cabrera, A. N., Droste, A., Heusinkveld, B. G., and Steeneveld, G. J.: The Potential of a Smartphone as an Urban Weather Station – An Exploratory Analysis, Front. Environ. Sci., 9, 1–16, 2021.
Chandler, C., Cheney, P., Thomas, P., Trabaud, L., and Williams, D.: Fire in Forestry, vol. 1, USDA Forest Service, ISBN 0-471-87447-7, 1983.
Di Giuseppe, F., Vitolo, C., Krzeminski, B., Barnard, C., Maciel, P., and San-Miguel, J.: Fire Weather Index: the skill provided by the European Centre for Medium-Range Weather Forecasts ensemble prediction system, Nat. Hazards Earth Syst. Sci., 20, 2365–2378, https://doi.org/10.5194/nhess-20-2365-2020, 2020.
Droste, A. M., Pape, J. J., Overeem, A., Leijnse, H., Steeneveld, G. J., Van Delden, A. J., and Uijlenhoet, R.: Crowdsourcing urban air temperatures through smartphone battery temperatures in São Paulo, Brazil, J. Atmos. Ocean. Tech., 34, 1853–1866, 2017.
ECAD: Daily data, https://www.ecad.eu/dailydata/index.php, last access: 28 June 2020.
Escuin, S., Navarro, R., and Fernández, P.: Fire severity assessment by using NBR (Normalized Burn Ratio) and NDVI (Normalized Difference Vegetation Index) derived from LANDSAT TM/ETM images, Int. J. Remote Sens., 29, 1053–1073, 2008.
Fosberg, M. A.: Weather in wildland fire management: the fire weather index, US Serv. Repr. Artic, American Meteorological Society, Boston, MA, 19800670973, 1978.
Fujinami, K.: Smartphone-based environmental sensing using device location as metadata, Int. J. Smart Sens. Intell. Syst., 9, 2257–2275, 2016.
Goldammer, J. G. and Price, C.: Potential impacts of climate change on fire regimes in the tropics based on MAGICC and a GISS GCM-derived lightning model, Climatic Change, 39, 273–296, 1998.
Hernandez-Leal, P. A., Arbelo, M., and Gonzalez-Calvo, A.: Fire risk assessment using satellite data, Adv. Space Res., 37, 741–746, 2006.
Hersbach, H., Bell, B., Berrisford, P., Biavati, G., Horányi, A., Muñoz Sabater, J., Nicolas, J., Peubey, C., Radu, R., Rozum, I., Schepers, D., Simmons, A., Soci, C., Dee, D., and Thépaut, J.-N.: The ERA5 global reanalysis, Q. J. Roy. Meteor. Soc., 146, 1999–2049, https://doi.org/10.1002/qj.3803, 2020 (data available at: https://doi.org/10.24381/cds.adbb2d47).
Hintz, K. S., Vedel, H., and Kaas, E.: Collecting and processing of barometric data from smartphones for potential use in numerical weather prediction data assimilation, Meteorol. Appl., 26, 1–14, https://doi.org/10.1002/met.1805, 2019.
Jain, P., Castellanos-Acuna, D., Coogan, S. C. P., Abatzoglou, J. T., and Flannigan, M. D.: Observed increases in extreme fire weather driven by atmospheric humidity and temperature, Nat. Clim. Change, 12, 63–70, 2022.
Käse, H.: Ein Vorschlag für eine Methode zur Bestimmung und Vorhersage der Waldbrandgefährdung mit Hilfe komplexer Kennziffern, Thesis dissertation, Akademie-Verlag, Berlin, 1969.
Keetch, J. J. and Byram, G. M.: A drought index for forest fire control, US Department of Agriculture, Forest Service, Southeastern Forest Experiment Station, Vol. 38, 1968.
KKL JNF: November 2016 Wildfires, Keren Kayemeth LeIsrael, Jewish National Fund, https://www.kkl-jnf.org/forestry-and-ecology/fire-prevention/fighting-wildfires-in-israel/november-2016/, last access: 30 June 2020.
Mass, C. F. and Madaus, L. E.: Surface pressure observations from smartphones: A potential revolution for high-resolution weather prediction?, B. Am. Meteorol. Soc., 95, 1343–1349, 2014.
McArthur, A. G.: Fire behaviour in eucalypt forests, Forestry and Timber Bureau, Canberra, 1967.
McNicholas, C. and Mass, C. F.: Bias Correction, Anonymization, and Analysis of Smartphone Pressure Observations Using Machine Learning and Multiresolution Kriging, Weather Forecast., 36, 1867–1889, 2021.
Opensignal: Android Fragmentation Visualized, https://cdn.opensignal.com/public/data/reports/global/data-2015-08/2015_08_fragmentation_report.pdf (last access: 6 March 2017), 2015.
Overeem, A., Robinson, J. C., Leijnse, H., Steeneveld, G. J., Horn, B. K., and Uijlenhoet, R.: Crowdsourcing urban air temperatures from smartphone battery temperatures, Geophys. Res. Lett. 40, 4081–4085, 2013.
Price, C., Maor, R., and Shachaf, H.: Using smartphones for monitoring atmospheric tides, J. Atmos. Sol.-Terr. Phy., 174, 1–4, https://doi.org/10.1016/j.jastp.2018.04.015, 2018.
Rao, K., Williams, A. P., Diffenbaugh, N. S., Yebra, M., Bryant, C., and Konings, A. G.: Dry Live Fuels Increase the Likelihood of Lightning-Caused Fires, Geophys. Res. Lett., 50, e2022GL100975, https://doi.org/10.1029/2022GL100975, 2023.
San-Miguel-Ayanz, J., Durrant, T., Boca, R., Libertà, G., Branco, A., De, R., Ferrari, D., Maianti, P., Artes, V. T., Pfeiffer, H., and Loffler, P.: Forest Fires in Europe, Middle East and North Africa 2015, Scientific and Technical Research Series, JRC Technical Reports, https://doi.org/10.2788/914, 2016.
San-Miguel-Ayanz, J., Durrant, T., Boca, R., Libertà, G., Branco, A., De, R., Ferrari, D., Maianti, P., Artes, V. T., Pfeiffer, H., and Loffler, P.: Forest Fires in Europe, Middle East and North Africa 2016, Scientific and Technical Research Series, JRC Technical Reports, https://doi.org/10.2760/17690, 2017.
Schmuck, G., San-Miguel-Ayanz, J., Camia, A., Durrant, T., Boca, R., Libertà, G., Petroliagkis, T., Di Leo, M., Rodrigues, D., and Boccacci, F.: Forest Fires in Europe, Middle East and North Africa 2013, Scientific and Technical Research Series, JRC Technical Reports, https://doi.org/10.2788/99870, 2014.
Schmuck, G., San-Miguel-Ayanz, J., Camia, A., Durrant, T., Boca, R., Libertà, G., Petroliagkis, T., Di Leo, M., Rodrigues, D., and Boccacci, F.: Forest fires in Europe, Middle East and North Africa 2014, Scientific and Technical Research Series, JRC Technical Reports. Scientific and Technical Research series, https://doi.org/10.2788/1082, 2015.
Schroeder, M. and Buck, C.: Fire weather: a guide for application of meteorological information to forest fire control operations, USDA For. Serv., Washington, DC, 360, 236, 1970.
Seager, R., Hooks, A., Williams, A. P., Cook, B., Nakamura, J., and Henderson, N.: Climatology, variability, and trends in the U. S. Vapor pressure deficit, an important fire-related meteorological quantity, J. Appl. Meteorol. Clim., 54, 1121–1141, 2015.
Sedano, F. and Randerson, J. T.: Multi-scale influence of vapor pressure deficit on fire ignition and spread in boreal forest ecosystems, Biogeosciences, 11, 3739–3755, https://doi.org/10.5194/bg-11-3739-2014, 2014.
Sensirion: SHTC1 (RH) Digital Humidity Sensor, https://sensirion.com/products/catalog?category=Humidity (last access: 6 March 2017), 2015.
Sharples, J. J., McRae, R. H. D., Weber, R. O., and Gill, A. M.: A simple index for assessing fire danger rating, Environ. Modell. Softw., 24, 764–774, 2009.
Shen, H., Tao, S., Chen, Y., Odman, M.T., Zou, Y., Huang, Y., Chen, H., Zhong, Q., Zhang, Y., Chen, Y., and Su, S.: Global Fire Forecasts Using Both Large-Scale Climate Indices and Local Meteorological Parameters, Global Biogeochem. Cy., 33, 1129–1145, 2019.
Snik, F., Rietjens, J. H., Apituley, A., Volten, H., Mijling, B., Di Noia, A., Heikamp, S., Heinsbroek, R .C., Hasekamp, O. P., Smit, J. M., and Vonk, J.: Mapping atmospheric aerosols with a citizen science network of smartphone spectropolarimeters, Geophys. Res. Lett., 41, 7351–7358, 2014.
van Wagner C. E.: Development and structure of the Canadian forest fire weather index system, Canadian Forest Service, Forestry Technical Report No. 35, 1987.
Williams, A. P., Seager, R., Berkelhammer, M., Macalady, A. K., Crimmins, M. A., Swetnam, T. W., Trugman, A. T., Buenning, N., Hryniw, N., McDowell, N. G., and Noone, D.: Causes and implications of extreme atmospheric moisture demand during the record-breaking 2011 wildfire season in the southwestern United States, J. Appl. Meteorol. Clim., 53, 2671–2684, 2014.
Yoo, K. P., Lim, L. T., Min, N. K., Lee, M. J., Lee, C. J., and Park, C. W.: Novel resistive-type humidity sensor based on multiwall carbon nanotube/polyimide composite films, Sensor. Actuat. B-Chem., 145, 120–125, 2010.