the Creative Commons Attribution 4.0 License.
the Creative Commons Attribution 4.0 License.
 | 04 Sep 2024
“More poison than words can describe”: what did people die of after the 1783 Laki eruption in Iceland?
Claudia Elisabeth Wieners
Guðmundur Hálfdanarson
The 1783 Laki eruption in Iceland was followed by an almost 20 % population loss, traditionally attributed to famine (caused by fluorine poisoning of livestock) and contagious diseases. From the 1970s on, hypotheses have been formed that fluorine poisoning might have contributed to human mortality in Iceland and air pollution might have caused excess deaths both in Iceland and Europe. Using historical documents including parish registries, we find that regional and temporal patterns in Icelandic excess mortality can be satisfactorily explained by hunger and disease when other factors such as the availability of secondary food sources (fishing or food aid) are taken into account. In contrast, the timing and estimated concentrations of air pollution do not match observed excess mortality, and observed symptoms and estimated human fluorine uptake do not suggest large-scale fluorosis in humans. We therefore conclude that the evidence for significant direct contributions from pollution to human mortality is weak.
- Article
(3059 KB) - Full-text XML
-
Supplement
(2022 KB) - BibTeX
- EndNote


The flood basalt eruption of the Lakagígar fissure in 1783, commonly referred to as the Laki eruption, was arguably the worst natural disaster in the history of Iceland. Although the eruption did not take human lives directly through lava, tephra fall, or similar phenomena, in the words of a local pastor, “more poison fell from the sky than words can describe” (Steingrímsson, 1788), and acid rain and fluorine-rich ash caused a massive loss of livestock (Pétursson et al., 1984; Rafnsson, 1984) leading to famine. The Icelandic population dropped from 49 609 at the beginning of 1783 to 40 381 at the beginning of 1786 (Jónsson and Magnússon, 1997) due to excess mortality and a reduction in childbirth. Until the 1980s, most historians attributed human excess mortality entirely to hunger and disease (Pétursson et al., 1984; Hálfdanarson, 1984).
In the 1990s, Grattan et al. analysed parish data in England and France and found significant excess mortality in the late summer of 1783 and in the following winter, which they attributed to air pollution blown over from Iceland (Grattan et al., 2003, 2005). Their studies sparked interest in the possible health impact of future Laki-type eruptions (Schmidt et al., 2011; Heaviside et al., 2021) and led to the suggestion that pollution also helped increase excess mortality in Iceland itself: “Icelandic records clearly suggest that air pollution contributed directly to increased mortality rates, with northern regions repeatedly exposed to a low-level sulfuric acid haze suffering much higher deathrates than other regions” (Schmidt et al., 2011). However, no attempt has been made to carefully test this hypothesis combining written sources, mortality statistics, and environmental (modelling) data.
Another suggested cause of human mortality in Iceland (but not beyond) is fluorine poisoning, which, as mentioned, was prevalent in livestock. Blong (1984) suggests that the symptoms in humans described by Stephensen (1785), who visited the region in 1784, might be “partly” attributed to fluorosis. Weinstein (2005), discussing the question of whether the saga figure Egill Skallagrímsson suffered from chronic fluorosis, refers to the careful observations of the local pastor Jón Steingrímsson (Steingrímsson, 1788) as potential evidence for human fluorine poisoning during the eruption. D'Alessandro (2006) cites the Laki eruption as the only known example of potential human fluorine poisoning due to an active volcanic eruption and, referring to Friðriksson (1983), writes that “Jón Steingrímsson ... tells us also that some of the people ... developed the same bone and teeth deformations like the animals.” However, few attempts have been made to conduct a systematic differential diagnosis from scurvy (vitamin-C deficiency) or estimate the probable level of human fluorine intake.
We suspect that the hypotheses of human mortality due to air pollution and fluorine poisoning caused by the Laki eruption have been insufficiently scrutinised and potentially over-emphasised, including in popular science literature (Witze, 2016). In this article, we conduct a critical review of written records, Icelandic mortality data, studies of contemporary pollution events, and modelling studies to investigate whether air pollution and fluorine poisoning made a direct, significant contribution to excess mortality in Iceland and beyond.
One aspect we do not study in depth is the eruption's climate impact. Stratospheric sulfate aerosol ejected by the volcano reflected incoming sunlight and led to Northern Hemisphere cooling (Stevenson et al., 2003; Highwood and Stevenson, 2003; Chenet et al., 2005; Oman et al., 2006b; Zambri et al., 2019a, b). It might have upset regional weather patterns and caused or exacerbated famine in the Nile region due to drought (Oman et al., 2006a). Note that regional climate anomalies can only be attributed in a probabilistic sense. Even if Laki-style eruptions increased the likelihood of certain weather events, it is impossible to prove that particular outcomes in 1783–1784 were indeed caused by the eruption. For example, the cold winter of 1783–1784 in central Europe may have been exacerbated by larger-scale cooling but may also have been (partly) related to El Niño (D'Arrigo et al., 2011), although El Niño itself may have been influenced by the eruption (Pausata et al., 2011). The hot summer in 1783 in central Europe likely occurred despite and not because of the eruption (Zambri et al., 2019b). If indeed caused by the eruption, some climate extremes would contribute significantly to the volcano's death toll. We will, however, focus on the direct effects of pollution.
Our study is structured as follows. After sketching the socioeconomic situation of Iceland and the environmental impacts of the eruption (Sect. 2), we describe the data and methods used (Sect. 3). In Sect. 4, we give an overview of Icelandic mortality data, including spatial and temporal patterns in the crucial period. In Sect. 5, we investigate whether famine and a famine-induced rise in endemic disease satisfactorily explains the available Icelandic data. After a brief review on mortality in Europe (Sect. 6), we investigate in Sect. 7 the possibility of human death by air pollution, using written records and modelling studies. Similarly, in Sect. 8, we use written sources and our own estimates of fluorine intake to assess the possibility of widespread lethal fluorosis in humans.
2.1 Socioeconomic background
At the time of the Laki eruption, Iceland had been a province of the Danish–Norwegian monarchy for over 400 years. Local Icelandic officials received instructions from Danish institutions in Copenhagen. In Iceland there were two interlocking administrative systems, one civil and the other religious. The basic units of the former were communes (hreppur), which were responsible for administering care for the poor, and counties (sýsla, pl. sýslur; Fig. 1). The latter system consisted of parishes (sókn, pl. sóknir) and deaneries (prófastsdæmi). Both systems were used to generate data for the royal authorities in Copenhagen. The boundaries of counties and deaneries were very similar but not identical, which has to be corrected for when comparing different types of statistics. In particular, the counties of Gullbringusýsla and Kjósarsýsla were one deanery and appear as one unit in demographic data, and Hnappadalssýsla was split between Snæfellsnes- and Mýrasýsla.
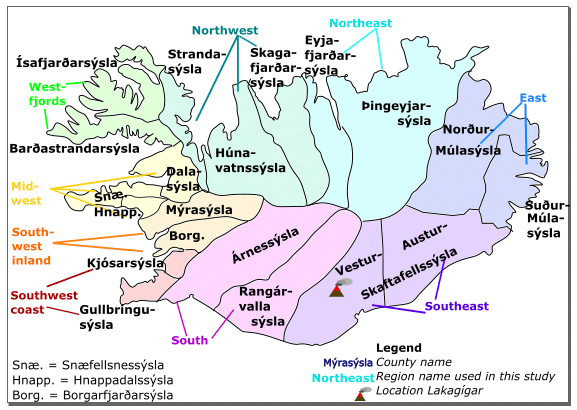
Figure 1Icelandic counties (sýslur, sing. sýsla) around 1783. Shading and coloured region names depict the groups of counties used for parish data analysis.
Economically, Iceland prior to 1783 was largely a subsistence-farming community with fishing as an important secondary activity (Gunnarsson, 1983). The population was around 50 000 people living along the coast, in valleys, and on low-lying plains (Fig. S1a in the Supplement). Animal husbandry (cows and sheep) was the dominant occupation and hay the main crop. Dairy products accounted for half of the Icelanders' calorie intake (Karlsson, 2000). Fishing was done in open rowing boats which could not venture out far to sea; hence, fishers could not follow the fish. The best fishing grounds, with fishing opportunities in late winter and spring, were in the west, particularly Gullbringu- and Snæfellsnessýsla (Fig. S1b). Farmers and farmhands from other regions often travelled to the fishing regions to participate in winter fishing or to barter dried fish for farming products. The number of cow equivalents (six ewes being traditionally valued the same as one cow) can serve as a rough index of farming-based food production. Not surprisingly, districts with good access to fishing – particularly on the western peninsulas – tended to have less livestock per person (Fig. S1b). The figure also suggests, however, that the eastern regions, especially the Múlasýslur, had fewer cow equivalents than regions with similar fishing access further west. This may be the expression of fluctuations, for example, due to relatively harsh weather in the preceding years (Guðjónsson, 2010).
Contact with the outside world was mostly limited to Danish merchants who served the roughly 20 trade posts (Fig. S1a). The main export goods were dried fish, mutton, and wool products; imports included grain but also wood, iron, and fishing lines. The trade posts were the only locations where Danish food aid could be delivered. Such aid did not arrive before July 1784 and even then in meagre quantities (Wieners, 2020).
2.2 Environmental impacts of eruption
The eruption lasted from 8 June 1783 to 7 February 1784, although volcanic activity was greatest in the first months (Thordarson and Self, 1993). Thanks to its location in the uninhabited inland of southern Iceland (Fig. 1), the eruption did not directly kill people, but when the lava flowed into inhabited areas, 42 farmsteads and cottages (≈0.8 % of all Icelandic farms) were given up because of lava flows, inundation by dammed-up rivers, tephra fall, and sand storms; another 19 were abandoned for other reasons including loss of livestock (Guðbergsson and Theodórsson, 1984). About 500 out of 1964 inhabitants fled Vestur-Skaftafellsýsla, most going to the west (Gunnlaugsson, 1984a).
As opposed to local lava flows, volcanic haze and ash fall affected most of Iceland (Thordarson, 1995). The Lakagígar magma was rich in SO2, which within a few days reacted in the atmosphere to form droplets of sulfuric acid (H2SO4; Stevenson et al., 2003), leading to the formation of a thick, “dry” acidic haze. Roughly 20 % of the ≈120 Mt (megatons) of SO2 slowly degassed from the lava flows and mostly affected southern Iceland, while 80 % was carried by eruption columns into the high troposphere and lower stratosphere (9–13 km in height; Thordarson and Self, 2003), was transported by high-level winds, and was partly re-introduced into the lower troposphere by downward air movement and gravitational setting, in both Iceland and mainland Europe (Thordarson, 1995). Low-altitude haze was observed, on and off, in all parts of Iceland during the summer and autumn of 1783 and in mainland Europe from the second half of June to September–December (depending on location; Thordarson, 1995; Grattan and Brashay, 1996; Thordarson and Self, 2003; Halldórsson, 2013). The haze caused massive damage to the vegetation in Iceland, including grass (Steingrímsson, 1788; Thordarson, 1995), which was all-important for animal husbandry, but secondary food sources like lyme grass, berries, and Icelandic moss were also strongly diminished due to the eruption (Steingrímsson, 1788; Pétursson et al., 1984). In Europe, some plant damage was observed but did not lead to harvest failure (Halldórsson, 2013).
Ash was produced by lava fragmentation during explosive episodes and spread over an area of 200 000 km2, including most of Iceland except for the extreme west and northwest (Thordarson and Self, 2003). The ash carried fluorine. It has been estimated that ≈8 Mt of fluorine was released from the vents (Thordarson and Self, 1996), of which 9×10⁷ kg was adsorbed by ash and deposited along with it (Thordarson and Self, 2003). Spread over an area of 200 000 km2, this yields a fluorine deposition of 450 mg m−2 on average1.
Symptoms associated with fluorine poisoning of livestock were reported from nearly all over Iceland, except in the northwest (Pétursson et al., 1984), consistent with the spread of fine ash. Animals, especially sheep, started to die within 2 weeks of the onset of the eruption in nearby parishes (Steingrímsson, 1788); elsewhere it took several months for livestock to die (Pétursson et al., 1984). Even before animals died, a drop in milk production to one-half or less was noticed immediately after the arrival of the haze in Vestur-Skaftafellssýsla (Steingrímsson, 1788) but also in the north. Lack of fodder exacerbated the loss of livestock (Wieners, 2020, SM). Wild animals such as fresh-water fish and birds were also reduced (Steingrímsson, 1788; Pétursson et al., 1984), while there is no indication that marine fish were affected.
Throughout the 18th century, the Danish administration showed growing interest in its distant Icelandic dependency, reflecting new centralising tendencies in the capital. This interest appeared in various efforts to collect information on Iceland's economy, demography, and natural conditions because if the state was to control and develop the periphery, the authorities had to understand it. For this reason, we have access to a wealth of information on various aspects of Iceland's demography and economy during the years of the Laki eruption, although there are, as in most historical statistics, gaps in the available data and uncertainties regarding its accuracy.
In addition to the demographic data explained below, we made use of letters by local officials (Gunnlaugsson and Rafnsson, 1984), which were summarised in English in the supplementary material of Wieners (2020, henceforth Wieners20SM). A few additional reports were used; these are listed in the reference list.
3.1 Icelandic demographic data
When it comes to mortality data from the late 18th century, we have primarily two sets of sources. First, there are general vital statistics from the period – that is, the raw numbers of deaths and births broken down by county level – both in print and in unpublished reports preserved in the National Archives of Iceland (NAI) in Reykjavík. For these data, we used a set of tables published in the 18th-century Icelandic journal, Rit þess íslenzka lærdómslistafélags (The Proceedings of the Icelandic Learned Society), as the basis of our analysis (RÞÍL, 1781–1797, VI, 249–263; VII, 251–269; VIII 271–274; and IX, 287–289). The data cover the period from around 1770 to the end of the 1780s and were compiled by two Icelandic officials, using reports composed by parish priests every year (Stephensen and Sigurðsson, 1854, II, 226–227). Obvious mistakes and gaps in the tables were corrected by comparing them to the existing original reports from the two Icelandic bishops, preserved in the National Archives of Iceland. Two remaining instances of incomplete data (Rangárvallasýsla 1776 and Dalasýsla 1774) were filled by assuming that birth- and deathrates developed in parallel with neighbouring counties,
where D is the number of deaths (or births), C and Y the county and year for which data are missing, and C ± 1 the neighbouring counties.
Second, every pastor in Iceland was required to keep a register of the tasks performed, including burials and baptisms in the parish (Prestsþjónustubækur, 1782–1787). The information provided varies, and it changes over time; invariably, the pastor registered the names of the deceased persons (indicating their gender) and the time of burial, but most of the registers also provide additional data including the actual dates and presumed causes of death, the ages of the deceased, where they lived, and their social status at death. We used all available parish registers from the period 1782, or right before the eruption, to 1787, when the crisis following the eruption was over. Using the registers, we were able to create a database of almost five thousand registered burials, providing a detailed and individualised picture of the demographic crisis in 1784–1786. Additional explanations are given in the Supplement (Sect. S1). Unfortunately, no registry data are available for Skaftafellssýsla, the county closest to the volcano. Also, information from some parishes is missing for 1782 and/or 1783. In the northern counties, recording causes of death only become mandatory starting in 1785, leading to a high number of “unspecified” causes of death.
Population counts were only performed sporadically. The closest complete census prior to the eruption took place in 1769; the data are available at the parish level (Jónsson and Magnússon, 1997). Minor mistakes were corrected using NAI (1769). To be able to compare census data with the mortality data, we grouped parishes according to the county boundaries used in the county-level data.
All three datasets are available online; please see the “Data availability” section for the link.
3.2 Demographic data: estimation methods and index definition
To analyse the demographic data, we used the following definitions.
Estimated population (county level). The last complete census prior to 1783 was performed in 1769. We multiplied the population in each county in that year by a factor 1.024 to match the national population given in Jónsson and Magnússon (1997). We then estimated the county-level population up to 1783 by adding births and subtracting deaths. Population is given at the beginning of each calendar year. The method ignores migration across county borders; therefore, it is unreliable after 1783. Migration out of Iceland as a whole was negligible.
Deathrates (county level). Deathrates for 1770–1783 were computed by dividing the number of deaths by the estimated population at the beginning of the year. For 1784–1785, the estimated population at the beginning of 1783 was used because migration prevents us from forming reliable population estimates.
Relative mortality (county level). Relative mortality is computed by dividing the number of deaths for a year of interest (1783, 1784, or 1785) by the average number of deaths in 1773–1782.
Normalising parish-level data. Parish-level data were aggregated on the county level. Since the coverage is incomplete, the number of deaths in any given category G (e.g. people who died of hunger or migrants) were extrapolated to the county level by assuming that the available parish data were representative of the whole county; i.e. if parish data were available for one-third of the deaths in a given county and year, then it was assumed that 3 times as many deaths occurred in category G as appear in the parish data. See Sect. S1.3 for details.
Migrants' county of origin. Pastors often noted the region of origin of the people they buried. Migrant data were aggregated at the county level for both the receiving county and the county of origin. See Sect. S1.2 for details on grouping migrants and Sect. S1.3 for treatment of unspecified cases. Unless otherwise specified, county-level data were used without correcting for migration.
“Smoothed” baseline for animal ownership. As livestock ownership in 1703 (Fig. S1b) may have been affected by prior weather events, we define a smoothed baseline for livestock ownership by assuming that people with no access to fisheries, summer-only access, and winter access owned 1.22, 0.85, and 0.46 cow equivalents per person, respectively (i.e. the national average over each fishing category). See Sect. S1.3 for details.
4.1 Mortality at the county level
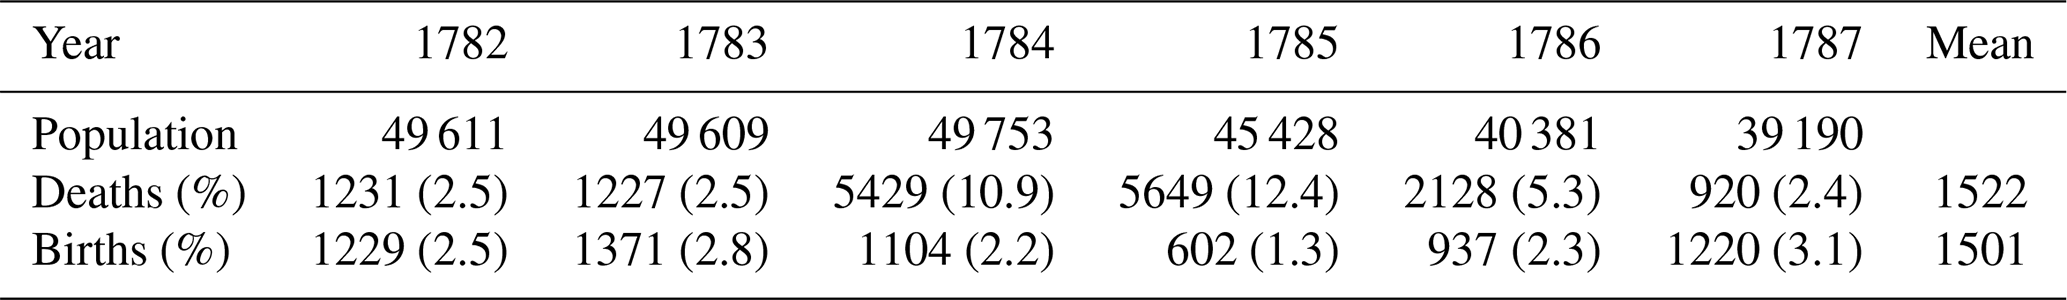
As can be seen in Table 1, the Laki eruption was followed by a large mortality peak in 1784 and 1785 as well as by a dip in births. However, no excess mortality can be discerned for the eruption year, 1783. In the 2 peak years, about 11 000 persons died in Iceland, amounting to an excess mortality of around 8000 persons, given that the average annual mortality in 18th-century Iceland was just over 1500 (Jónsson and Magnússon, 1997). The excess mortality during these 2 years was therefore one-sixth of the pre-crisis population. Mortality remained elevated in 1786, but this was mainly caused by a smallpox epidemic largely unrelated to the eruption (Sect. 5). Population decline was increased by a decrease in births, particularly in 1785 (Vasey, 1991), a common phenomenon during famines.
Table 1Population, deaths, and births in Iceland, 1782–1787. Population is given for the beginning of the corresponding year. The last two rows give the absolute number of deaths and births and the percentages (in parentheses) with respect to population size. The percentages of deaths are number of deaths in a given year divided by the population at the beginning of that year, the same for births. The mean values are for 1750–1800. Data from Jónsson and Magnússon (1997).
Mortality was unevenly distributed across the Icelandic counties. In Fig. 2a and b, two measures for the severity of the crisis are presented: relative mortality with regard to 1773–1782 and deathrates based on the 1783 population (Sect. 3.2). Both measures show that 1783 had below-average mortality in most of the country, except in the three easternmost deaneries, particularly in Þingeyjarsýsla, where it was about 50 % above average. In the northeastern part of Iceland and Ísafjarðarsýsla in the Westfjords, mortality was highest in 1784, while in the southwest it was highest in 1785. In the following, we focus on the years 1784–1785.
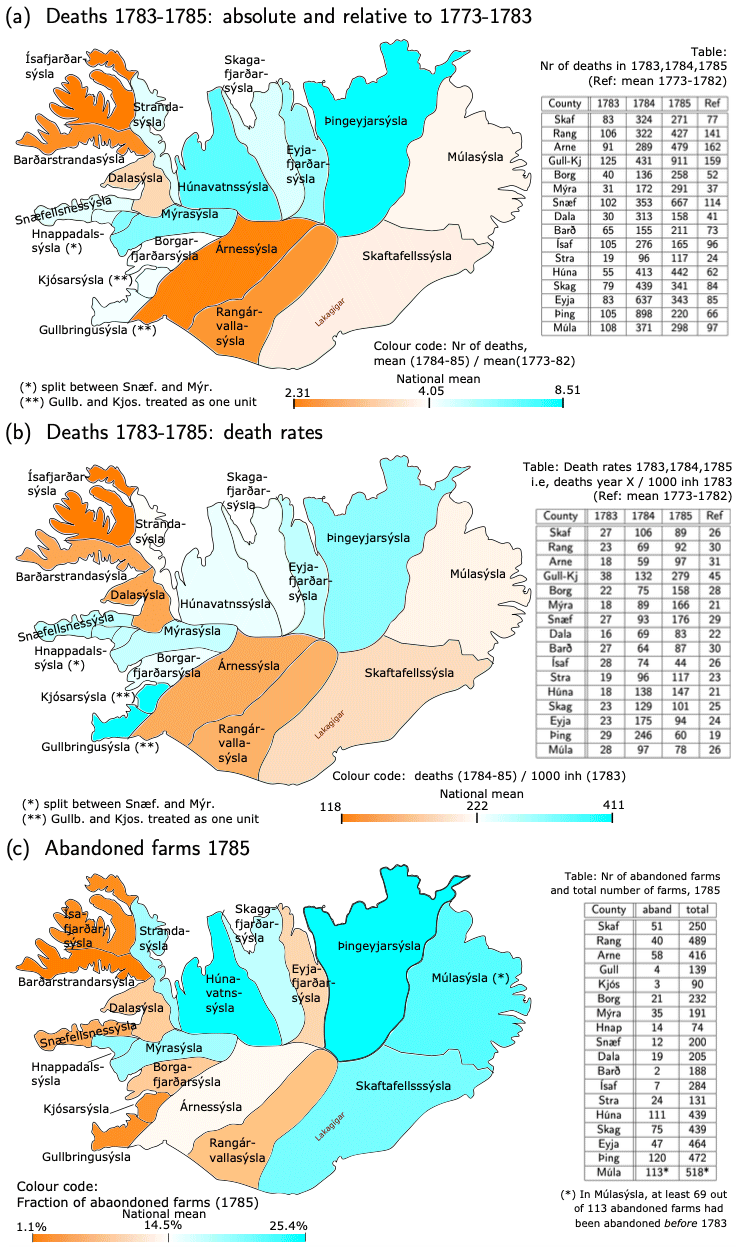
Figure 2Regional distribution of death and abandoned farms. (a) Colours depict relative mortality in 1784–1785, i.e. the mean over 1784–1785 divided by the mean over 1773–1782. Numbers in the table are deaths in 1783, 1784, and 1785 and for reference the mean in 1773–1782. (b) Colours depict the 2-year deathrates in 1784–1785, i.e. deaths in 1784–1785 divided by the estimated population at the beginning of 1783. Numbers in the table are the deathrates for 1783, 1784, and 1785 (all with respect to the population at the beginning of 1783) and, for reference, the mean death rate in 1773–1782 (mean over deaths in year Y divided by the population at the beginning of year Y). (c) Colours depict the fraction of abandoned farms in 1785, whereas the table shows the number of abandoned farms vs. the total number of farms. In all panels, the colour bar is tuned such that the darkest orange (blue) colour represents the least-(worst-)affected county and white the weighted national average. The data are also presented in table form in Sect. S2.
Both mortality measures show that the Westfjords (Ísafjarðar- and Barðarstrandarsýsla) and the south (Árnes- and Rangárvallasýsla) escaped comparatively lightly, although not unscathed (the 2 year mortality rate was about 2.5 times the normal value), whereas all the counties in northern Iceland (from Húnavatns- to Þingeyjarsýsla) had very high mortality in 1784–1785, Þingeyjarsýsla being worst hit, with 8.5 times as many deaths as in normal years. The southwest and west – from Gullbringu- and Kjósarsýsla to Snæfellsnessýsla – had relatively high excess mortality too, but here the two measures disagree considerably about the relative severity of the crisis. When using deathrates, Gullbringu- and Kjósarsýsla were the hardest hit of all the counties in Iceland, and Snæfellsnes- and Mýrasýsla were almost as badly affected as Þingeyjarsýsla. When using relative mortality, the worst-hit counties were Þingeyjar- and Húnavatnssýsla in the north followed by Mýrasýsla in the west, while relative mortality in Gullbringu- and Kjósarsýsla was close to the national average. In Skaftafellssýsla, the county where the Laki fissure is located, mortality was slightly below the national average according to both measures. However, in the parishes near the volcano, i.e. the western part of Skaftafellssýsla, population fell significantly through outmigration to the west (Gunnlaugsson, 1984a).
The discrepancies between the mortality measures obviously comes from the fact that the denominator (estimated 1783 population in deathrates vs. 1773–1782 deaths in relative mortality) was distributed differently among counties. This can be seen from the fact that the 1773–1782 average deathrates differed strongly across counties (Fig. 2b), with values ranging from 19 deaths per 1000 inhabitants per year (Þingeyjarsýsla) to 45 deaths per 1000 inhabitants per year (Gullbringu- and Kjósarsýsla). Snæfellsnessýsla also had rather high values, 32 deaths per 1000 inhabitants per year. Birthrates for 1773–1782 show roughly similar discrepancies (not shown).
Unless systematic reporting errors are to blame, one possible explanation for the discrepancy is that people did not always die in the county where they were registered as inhabitants. This affected, in particular, the fishing regions in the southwestern and western parts of the country (Gullbringu- and Snæfellsnessýsla and the coastal parishes in Árnessýsla), where seasonal fishers from the inland parishes gathered in the late winter. These regions may also have attracted people on the margins of society that were officially registered as inhabitants of their parish of origin in the 1769 census but would nonetheless contribute to the births and deaths of the parish where they actually lived, leading to higher apparent birth- and deathrates – especially the latter. Indeed, Gullbringu- and Kjósarsýsla was the only region with higher deathrates than birthrates in 1773–1782. Given these discrepancies, relative mortality might be a more reliable measure of the (relative) severity of the crisis because probably at least some of the systematic inconsistencies between population and death records affect counts for 1773–1782 and 1783–1785 in a similar manner.
Farm abandonment (Fig. 2c) can provide an additional rough indicator of depopulation. The data (Rafnsson, 1984) come with caveats. First, larger farms often contained two or more separate households, and the data do not indicate cases where only part of the farm was given up. Second, it appears that in most districts both the main farms (lögbýli) and crofts (hjáleigur) were counted, while in the primary fishing districts (Gullbringu-, Kjósar-, and Snæfellsnessýsla), only the main farms were counted. Third, not all farms counted as abandoned were necessarily given up due to the eruption and its aftermath. In particular, in Suður-Múlasýsla (the southern part of Múlasýsla), the county commissioner (sýslumaður) wrote in 1786 that of the 98 abandoned farms there, 29 had been given up in 1781–1786, while the others had been abandoned during the famine of 1754–1760 or much earlier. In contrast, the number of deserted farms in Skaftafellssýsla (51) hardly exceeds the 42 farms given up after being physically damaged by the eruption (Sect. 2.2).
Figure 2c suggests, once more, that the Westfjords escaped comparatively lightly and that most of the northern districts were hit hard. Skaftafellssýsla lost a substantial number of farms to the eruption. In the west, Mýra- and Hnappadalssýsla, both regions with less access to fishing, had the most deserted farms, while Snæfellsnes-, Gullbringu-, and Kjósarsýsla only had a few. However, counting only main farms may have led to lower estimates in farm abandonment because farmers on the main farms were typically wealthier and less likely to give up their farms. But it may also be that even the number of deserted crofts was low in these regions due to immigration. Data from around 1795 and 1802–1806 suggest a lasting shift from (hard-hit) farming regions to fishing regions (Rafnsson, 1984).
Using parish registers, one can roughly correct death counts for migration (Fig. 3) as the pastors often mentioned if a person came from outside of the parish. In regions where pastors only gave sketchy information, especially in the north, immigrants may have been undercounted. No usable registers from Skaftafellssýsla exist for this period; hence, immigrants are not counted there at all. However, the north and Skaftafellssýsla were mostly emigration regions, as can be seen in frequent references from the registers of the fishing districts to refugees and vagabonds from these regions. Snæfellsnessýsla received a large number of refugees from the north and Gullbringusýsla from the southeast, especially Vestur-Skaftafellssýsla, plus a smaller number from the north. Migration over shorter distances, including within counties, also occurred and was often directed coastward. Figure 3 suggests that the north and in particular Skaftafellssýsla experienced higher mortality than raw data suggest, while the midwest (Dala- and Snæfellsnessýsla) and southwest coasts (Gullbringu- and Kjósarsýsla) had exaggerated death counts. The corrections in the cumulative death rate remain within 20 %, although underreporting cannot be excluded.
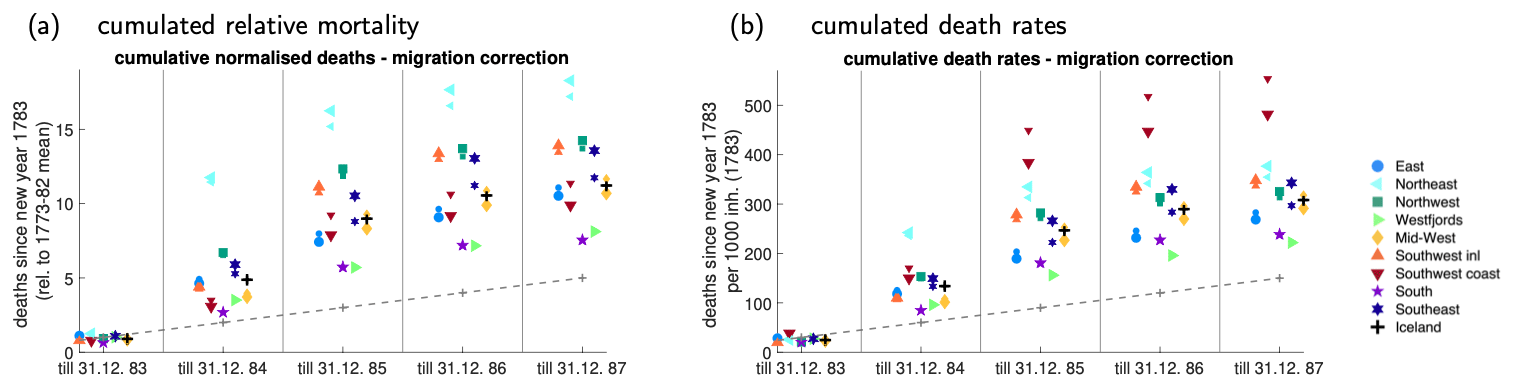
Figure 3Migration and mortality. (a) Cumulated number of deaths, divided by the normal (1773–1782 mean) value for each region. For example, a value of 9 in 1785 means that from 1 January 1783 until 31 December 1785, 9 times as many people died as would normally have died in 1 year. Regions are defined in Fig. 1a. (b) As (a) but for deathrates rather than relative deaths. For example, a value of 200 in 1785 means that 200 out of 1000 persons alive on 1 January 1783 died by 31 December 1785. The straight dashed line depicts the normal (1773–1782 whole-country) deathrates. In both panels, small (big) symbols denote values without (with) correction for migration.
To conclude, the Laki eruption was followed by a massive mortality crisis in Iceland, which manifested itself not in the year of the eruption (1783) but in the 2 following years. No district escaped unscathed, but the relative severity and the timing of the mortality peak differed between regions, with proximity to the volcano offering only a limited explanation for these differences. Other, more complex processes must have been at play, including migration.
4.2 Mortality in parish registries
The presumed causes of death in the parish registries were grouped into nine categories (see Table 2 and, for detailed explanations, Sect. S1.1). Landfarsótt (literally “land-travelling disease”, epidemic) and to a lesser extent tak (literally “bouts of pain”) were diseases that occurred in epidemic proportions, but it is unclear what they were and whether they were distinct diseases (some victims were diagnosed with landfarsótt and tak). In cases where two causes of death were given, the more proximal, lethal, or specific cause was used (e.g. “leprosy and hunger” was counted as hunger, “toothache and scurvy” as scurvy, and “pain and landfarsótt” as landfarsótt); otherwise, the first expression was used (e.g. as in “landfarsótt and hunger” or “hunger and landfarsótt”).
Table 2Categories for causes of death in the parish registries as used in Fig. 4. For further explanation, see Sect. S1.1.
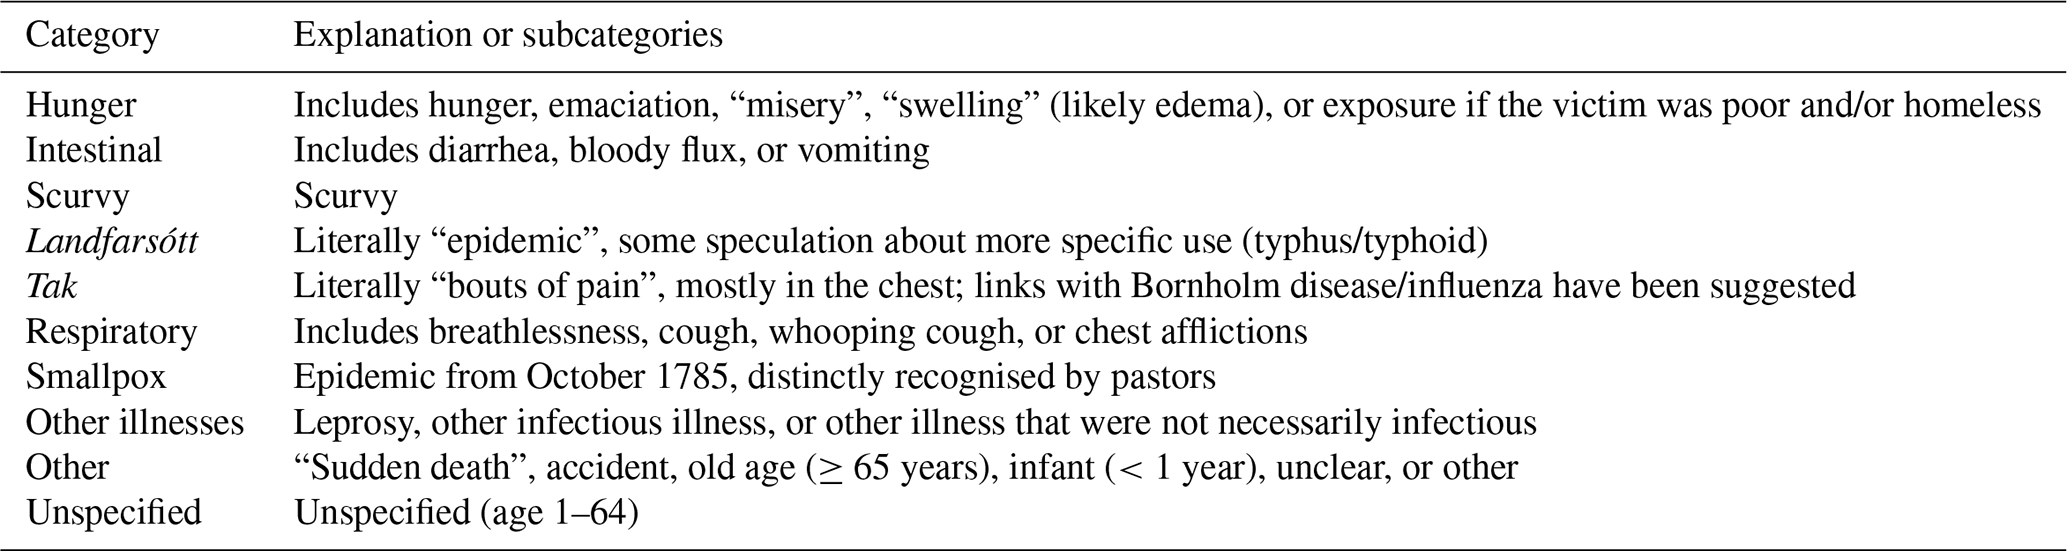
The presumed causes of death in parish data come with some caveats. First, reporting rules changed during the period of interest. In the north, listing causes of death only became mandatory in 1785, leading to a high number of unspecified (and hence, old age and infant) cases there. Second, pastors generally had no medical training but went by symptoms, possibly based on reports by family members. Illnesses with generic symptoms such as pain and fever may have been confused, whereas smallpox was widely recognised as such. Third, different pastors may have used different expressions for the same phenomenon; for example, the expression innanpína (inner pain) only appears in the data from Útskálar parish in Gullbringusýsla. Finally, people might have suffered from more than one condition (e.g. a starving person with fever). Obvious instances of missing data (60 deaths in three parishes) were corrected as described in Sect. S1.3.
Monthly mortality data for the whole of Iceland (Fig. 4a) do not show a marked increase in mortality in summer–autumn 1783. Neither is there a significant increase in lethal respiratory disease – the fraction of deaths (Fig. 4j) due to respiratory illness was 3.2 % of all recorded deaths in the second half of 1783 compared to 3.0 % in the second half of 1782. That is not to say that the eruption did not induce respiratory complaints – indeed, such complaints were widely mentioned (Wieners20SM). However, the respiratory symptoms were not (perceived to be) lethal.
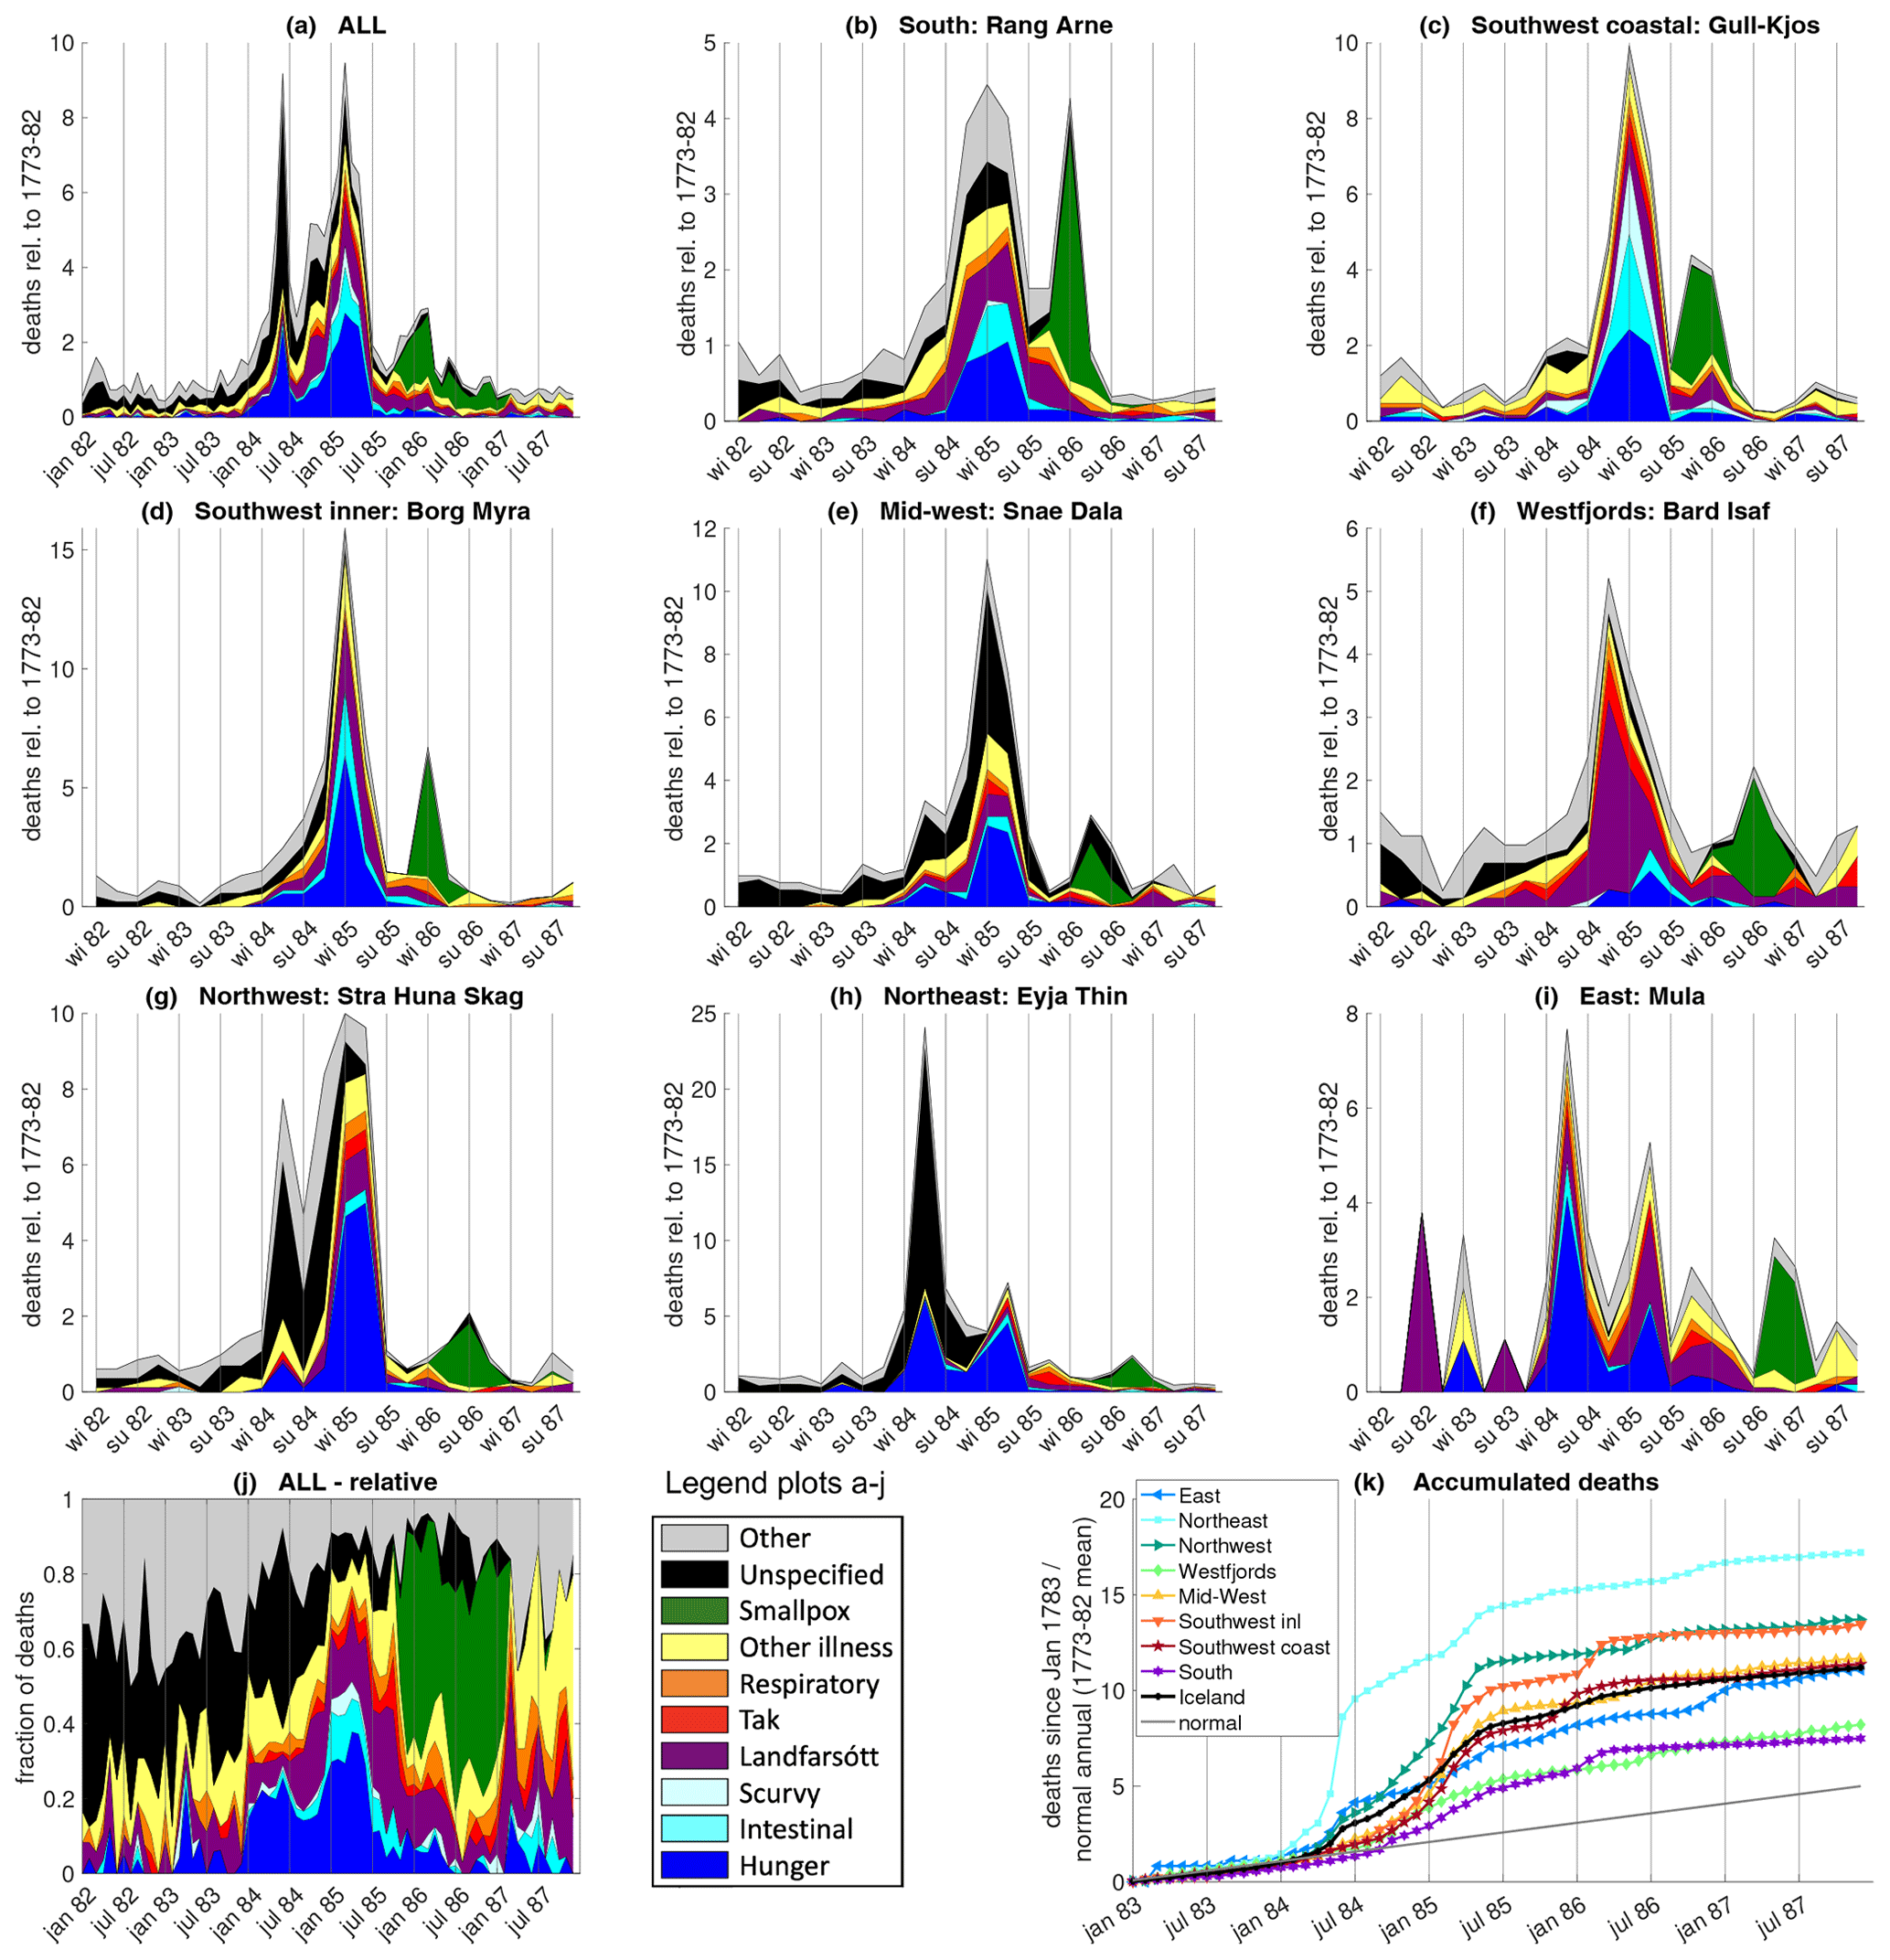
Figure 4Causes of death in Iceland based on parish data. Top three rows (a–i): relative mortality in the whole of Iceland and in eight regions (defined in Fig. 1), broken down by cause. For the whole of Iceland, data are plotted at a monthly resolution; for the regions, they are plotted at a 3-monthly resolution. For example, a value of 5 in “winter 85” means that in the winter (January–March) of 1785, 5 times as many people died as normally (1773–1782) would have died in 3 months (disregarding the seasonal cycle). Note the different y axis scales. Panel (j) shows the fraction of death from each cause at a monthly resolution. Panel (k) shows the cumulative relative mortality starting in the new year of 1783; for example, a value of 7 in July 1785 means that 7 times as many people died in January 1783–July 1785 as would normally (1773–1782) have died in 1 single year. The plain grey line denotes normal mortality (ignoring seasonality). No monthly data exist for the southeast (Skaftafellssýslur).
Mortality in the whole of Iceland shows two distinct peaks, a sharp, shorter one around June 1784 and one of longer duration with a maximum in March 1785. Both peaks coincide with peaks in hunger deaths. Hunger was a seasonal phenomenon in Iceland: food production was highest in summer and autumn, especially in farming regions, and stores were lowest in spring.
The 1784 peak is almost entirely caused by excess mortality in the north and east; in the northeast, mortality in spring (April–June) 1784 was 24 times as high as in an average 3-month period. The high proportion of unspecified causes of death in the north can be explained by the fact that giving causes was not mandatory there until 1785. Unless underreporting is to blame, disease played a relatively minor role during the first peak. However, in September 1784, the deputy governor wrote that mortality was still elevated in the north but was now mostly due to disease. He also mentioned bloody diarrhoea that had infected and killed many people during spring and summer but that he considered to be caused by hunger (Wieners20SM). While no parish data survive from Skaftafellssýsla, the county containing the Laki craters, descriptive records from the parishes closest to the volcano likewise describe very high mortality in the first half of 1784 (Steingrímsson, 1788).
After a sharp drop in the summer months, overall mortality gradually increased again in the autumn. At first, this increase was largely caused by an increase in disease. Landfarsótt, tak, and other diseases continued to contribute significantly to the second mortality peak, while hunger and (probably hunger-related) intestinal complaints started to increase again in the autumn–winter of 1784, especially in the south and southwest. Scurvy (vitamin-C deficiency) was recorded almost exclusively in the southwestern fishing regions.
In most regions, the highest mortality occurred in the winter (January–March) of 1785. In the northeast and east, the peak in spring 1784 was stronger; in the Westfjords, mortality peaked in autumn 1784 and started to decline in winter. In October 1785, the aforementioned smallpox epidemic started in the coastal southwest and spread through the country in the following year.
Any hypothesis explaining the excess mortality in 1784–1785 must answer the question of how an eruption lasting until February 1784 caused one mortality peak in spring 1784 centred in the northeast and a second one in spring 1785 centred in the west. We will show that hunger and disease can provide a plausible explanation but pollution cannot.
Several factors influenced the local severity of the famine: the loss of livestock, the availability of alternative food sources, the timing of the livestock loss, migration, and disease.
Livestock loss. The loss of farming animals can be roughly estimated by comparing reports on the number of farming animals in Iceland taken in conjunction with the general censuses of 1703 and 1785 (Fig. 5a). It should be kept in mind that the 1703 reference data (Fig. S1b) were obtained 80 years before the event and were only a snapshot taken after a series of bad years. Nonetheless, the loss of animals seems roughly consistent with reports of pollution. The Skaftafellssýslur, being closest to the volcano, were badly affected. From there, much of the ash and gas seems to have been blown towards the northwest, over the uninhabited parts of Rangárvallasýsla into Árnes-, Borgarfjarðar-, Mýra-, and Hnappadalssýsla (Pétursson et al., 1984), which also suffered severe losses. In those counties, the upland farms typically were hit worse than the coastal regions, probably due to the direction of wind dispersal. Kjósar- and Gullbringusýsla further south escaped rather lightly, as did the Westfjords (Barðarstrandar- and Ísafjarðarsýsla) further north – the only region where no ash layer was reported. Coastal regions also profited from access to seaweed as additional fodder (Wieners20SM). The losses in the north were around average. The Múlasýslur seem to have escaped lightly, but the losses there may have been underestimated due to the low 1703 reference value.
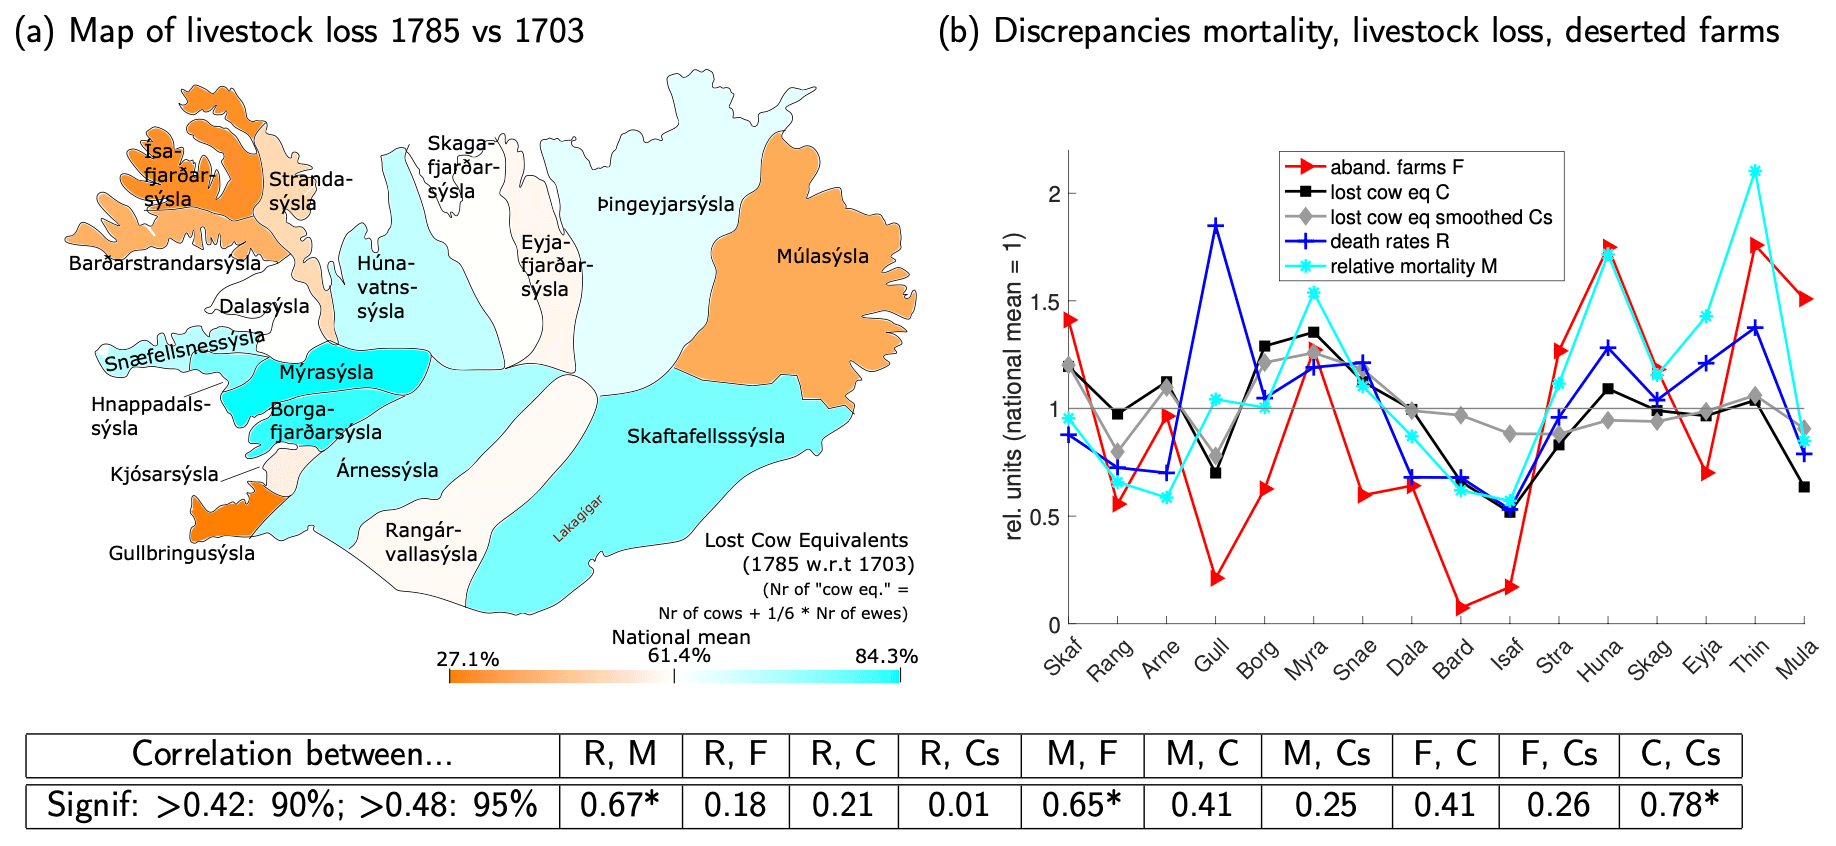
Figure 5(a) Animal loss in 1785 compared to 1703. The colour code depicts the (unsmoothed) fraction of cow equivalents (E) lost, i.e. . Six ewes count as the equivalent of one cow. The colour code is tuned such that the darkest orange (blue) corresponds to the least (worst) hit area and white to the weighted mean for the whole of Iceland. The raw data are presented in table form in Sect. S2. (b) Relative mortality M, deathrates R, animal loss in cow equivalents (raw C and smoothed Cs; see Sect. 3.2), and abandoned farms per region F, normalised by the weighted mean for the whole of Iceland. The correlations between the quantities in this panel are given in the table at the bottom of the figure. Correlations are significant at 90 (95) % confidence if the absolute value exceeds 0.42 (0.48); hence, correlations marked by a (*) are significant at 95 % confidence and others not even at 90 %. In this figure, Kjósarsýsla is combined with Gullbringusýsla, and Hnappadalssýsla is split between Mýra- and Snæfellsnessýsla.
Figure 5b shows that human mortality and loss of animals were only weakly correlated across counties (a correlation of 0.41 when using relative mortality and 0.21 using deathrates). Using the smoothed baseline for 1703 animal ownership (defined in Sect. 3.2) instead of the original 1703 values does not lead to a stronger correlation. The Westfjords escaped lightly both in terms of human mortality and animal loss. In the north and in Gullbringusýsla, human mortality was much higher than livestock loss would suggest, and the opposite holds for Árnes- to Skaftafellssýsla, although in Skaftafellssýsla outmigration helped to keep human death counts low.
Alternative food sources. Of the non-livestock sources of food, fish was the most important (Fig. 1b). In the summer of 1783, attempts to fish largely failed due to hazy weather. During the winter and spring of 1783–1784, results were mixed in the southwestern and western fishing regions but on the whole were not abnormally bad (Wieners20SM); the Danish merchants were able to buy the usual amount of dried fish. In the north, fishing in spring was hampered by sea ice, and the worst-hit region, the northern part of Þingeyjarsýsla, had no catches even in summer 1784 (Wieners20SM). Many farmers from the north also could not make the habitual journey to the west to catch or buy fish, as they lacked produce, horses, and healthy men for the journey.
An additional source of foodstuff was aid from Danish trade posts. In general, the density of trade posts was highest in the fishing districts, while the southern coast was a harbourless stretch of about 400 km. The aid obtainable at trade posts depended on the willingness of the merchant, the strong-mindedness of the district commissioners in coaxing the merchants to help, and the availability of foodstuff in the store houses (Wieners, 2020). These factors varied considerably. For example, Hálfdanarson (1984) suggested that the death toll in Húnavatnssýsla in 1785 may have been exacerbated by the fact that no trade made it to the local trade posts that summer due to sea ice. Conversely, merchants in Eyrarbakki and Vestmannaeyjar in the south provided aid to the refugees from Vestur-Skaftafellssýsla (Steingrímsson, 1788). Overall, famine relief provided through the Danish government via the trade company was meagre, amounting to about 2 weeks of additional provisions for the whole of Iceland in 1784 (Wieners, 2020) and arrived only from summer 1784 onward – too late to mitigate the very high mortality in spring 1784 in the northeast. As opposed to others in need, farmers and refugees from near the eruption site also received monetary aid from the Danish government (Gunnlaugsson, 1984a, b; Jónsson and Sigurðsson, 1784; Finnsson, 1785; Skúlason, 1784), probably not least because the Danish government was more interested in relieving victims of the spectacular destruction wrought by the eruption and keeping farms functional than in preventing starvation (Einarsson, 2022).
Timing of food shortage. The timing of the food shortage explains why mortality in the northeast peaked almost a year earlier than in the southwest. The northeast experienced a harsh winter in 1781–1782, poor grass growth in 1782, and again a harsh winter in 1782–1783 (Guðjónsson, 2010, Wieners20SM). The bad weather led to the loss of animals in the northeast even before the eruption. In Þingeyjarsýsla, only three cows were reportedly left on the northern peninsula of Melrakkaslétta and similarly few in the neighbouring Langanes (Guðjónsson, 2010). In mid-April 1783, the county commissioner of Þingeyjarsýsla wrote that in the northern half of the county, many farms were without a single horse, cow, or sheep, and while not many people had died yet, many were bed-ridden from weakness, unable to work, or had left their farms and would become a burden on the better-off southern half of the county (Jónsson, 1783). Mortality in Þingeyjarsýsla in 1783 was about 60 % above the 1773–1782 average (Fig. 2a), suggesting a relatively minor local famine. Neighbouring Eyjafjarðarsýsla also had some loss of animals in 1782–1783 (Wieners20SM) but no excess mortality. The early reduction in livestock likely led to a depletion of reserves – from food stores to human strength and body fat – prior to the eruption. This may help explain why Eyjafjarðar and especially Þingeyjarsýsla were hit not just badly but also early. To exacerbate the food shortage, milk yields from cows and ewes dropped dramatically after the eruption began. In the northeast, the drop in yield per animal thus coincided with an already low number of animals.
In contrast, the southwest and west from Rangárvalla- to Snæfellsnessýsla had only low excess mortality in the first half of 1784. These regions were much less affected by cold weather prior to the eruption and may have had food reserves to last most households through the first winter. However, the southwest, especially Rangárvalla- and Árnessýsla, had a wet summer in 1784, which greatly hindered the hay harvest (Wieners20SM). It seems therefore possible that part (but only part) of the livestock loss in this region only occurred a year after the eruption. By the time the number of animals reached its minimum, the milk yield per animal may have recovered. Also some, albeit modest, help from Denmark arrived in summer 1784, and the inhabitants of Rangárvalla- and Árnessýsla were able to sell some of the animals they could not feed to farmers from the north and east (Gunnlaugsson and Rafnsson, 1984).
Migration. Migration towards the western regions modulated mortality in several ways. First, it affected the death counts, as dying migrants were registered in the location of burial, not in the places from which they had fled. Second, migration was directed toward the areas of relatively high food supply (fish); therefore, it probably mitigated the shortage in the worst-hit areas and saved the lives of some migrants that might otherwise have died. The inhabitants of the parish closest to the volcano may have been “lucky” in the sense that the destruction of the livestock manifested itself already in summer–autumn 1783, giving the people time to flee before winter arrived. On the other hand, immigration increased food shortages in the receiving regions, especially if the migrants were too weakened to work. The county commissioner of Snæfellsnessýsla complained in 1784 that hundreds of weakened refugees from the north formed “no small burden to this county”, while a lack of able-bodied seasonal fishers from the northern counties prevented 50 boats from being crewed (Wieners20SM). Finally, migration might have helped the spread of infectious diseases by causing people from different regions to mix, making weakened homeless persons walk from house to house in the search of shelter and leading to overcrowded accommodation, for example, fishing huts.
Disease. To what extent the increase in (endemic) diseases in 1784–1785 can be attributed to hunger is difficult to determine. Comparing landfarsótt, the most frequent disease, with hunger, it is clear that the two follow somewhat different dynamics. On the national level, landfarsótt only seems to surge in summer 1784, after the first peak in hunger deaths, and remained somewhat elevated after hunger subsided in summer 1785. Unless systematically underreported, landfarsótt seems to have been rare in the northeast in 1784, where hunger was rampant. On the other hand, in the Westfjords where hunger was mostly absent in spring 1784 and remained comparatively mild, landfarsótt (and tak) caused a peak in mortality in autumn 1784. In addition, hunger was relatively more likely to kill persons in their prime of life, while landfarsótt preferentially attacked age groups that were at high risk in normal times, i.e. the elderly and the very young. Hunger was also more likely to kill people in lower social positions – paupers and farmhands – while landfarsótt also killed farmers and their families (see also Sect. S3.2 in the Supplement). Landfarsótt was thus more than a plain deficiency disease, otherwise its distribution should resemble that of hunger (Hálfdanarson, 1984).
This does not imply that the rise in lethal diseases in 1784–1785 was a coincidence. It is typical during famines that mortality from endemic diseases increases (Mokyr and Ó Gráda, 2002), probably due to lowered physical resistance and/or disruption in peoples' habits, e.g. because of migration. Diseases may then also infect the better-off, who would not have been at risk of direct starvation. In other words, (endemic) disease may amplify famine mortality.
The smallpox epidemic of 1785–1787 is different case. Smallpox was not endemic in Iceland but came sporadically to the distant island (Steffensen, 1972; Hálfdanarson, 1984), in this case with a Danish trade ship. When smallpox epidemics occurred, they tended to be severe and mostly killed people born after the last smallpox epidemic – in this case, the early 1760s (see also Fig. S2). That smallpox arrived in 1785 is surely coincidence. It is hard to tell, however, whether the famine affected its lethality. When the smallpox arrived, the famine was already over, and many migrants had probably returned home or found a new home (Steingrímsson, 1788). We cannot exclude the possibility that people were still weakened and therefore more susceptible, but the famine may also have killed some particularly vulnerable persons.
Interestingly, mortality from seemingly unrelated causes of death such as accidents, unspecified and non-infectious diseases, and leprosy also strongly increased during the famine (Sect. S3.3 in the Supplement). Leprosy kills slowly, and mortality solely from this cause should be independent of short-term effects such as famine. Yet recorded deaths from leprosy rose in parallel with or even slightly ahead of hunger deaths. Physically weakened and socially marginalised, leprosy victims may have been among the first to lack sufficient food, and starvation rather than leprosy itself may have been the proximal cause of death. It seems likely that the famine caused more excess mortality than the nominal hunger deaths. It is plausible although impossible to prove that hunger directly or indirectly caused most of the excess mortality attributed to disease before the outbreak of the smallpox epidemic.
To summarise, the following storyline emerges, which can explain regional discrepancies in terms of hunger and disease. Close to the volcano, livestock loss was severe and rapid, but many people were able to flee, keeping the local death count lower. In the northeast, prior loss of livestock, a lack of alternative food sources and insufficient opportunity to flee made sure that the people were hit early and disproportionally hard. The Westfjords escaped lightly due to low exposure; in the west and southwest, most people had enough reserves and in coastal regions access to fishing to survive the first winter, but bad weather and immigration helped to deplete food availability enough to cause hunger in the second winter, while diseases (exacerbated by immigration and overcrowding) contributed strongly to mortality.
6.1 Mortality data outside Iceland – review
We did not analyse primary mortality data for regions outside Iceland but briefly review the existing literature.
For England, Grattan et al. (2003) find that mortality in England in July–September 1783 was 29 % above its 51 year truncated running mean2. The excess mortality was negligible in July (15 000 deaths in 1783 vs. 14 747 in the running mean), became notable in August (18 338 vs. 14 429), and peaked in September (22 751 vs. 14 372).
Witham and Oppenheimer (2004) estimate an excess mortality of 11 500 deaths for the whole of England in August and September 1783 (40 % above the 1759–1808 mean) and an additional 8200 during a second mortality peak in January and February 1784 (23 % above the mean). Overall, the east of England was hit hardest, but the spatial distribution of “crisis mortality” (Z score>2) showed considerable small-scale variation, with parishes that did or did not experience crisis mortality often side by side. Also, counties that experienced crisis mortality in the summer of 1783 did not necessarily show crisis mortality in the following winter and vice versa.
Using a larger set of parish data, Hellman (2021) finds that in England, the number of deaths in 1783 and 1784 were not extraordinarily high (1783 – 58 943, 1784 – 56 198; mean 1770–1799 – 58 298; standard deviation 1770–1799 – 3202). Looking at monthly data, the results qualitatively confirm those of Grattan et al. (2003) and Witham and Oppenheimer (2004) as Hellman too finds a mortality peak in August–October 1783 and a second one in early 1784. Unfortunately, a direct comparison is impossible due to discrepancies in reporting methods, in particular the lack of seasonal cycle data for normal years in Hellman (2021). In Wales, Hellman (2021) finds that 1783 and 1784 had the highest mortality in 1770–1799 (1783 – 2241, 1784 – 2474; mean – 1814, SD – 231), without giving seasonal data.
For France, Balkanski et al. (2018) report excess mortality during summer (June–September 1783) in the parishes with available data: 4093 persons died in that period3 compared to 3092 in the 1774–1789 mean, an increase of 32 %. Grattan et al. (2005) found that mortality was elevated by 38 % in August–October for a smaller set of French parishes. If representative of the whole country, this would amount to about 16 000 excess deaths. Hellman (2021) reports no unusual mortality on an annual level (1783 – 988, 1784 – 927; mean 1770–1799 – 882, SD – 102).
In a small dataset from the Netherlands, Hellman (2021) finds that 1783 had the third-highest morality in 1770–1799 (1783 – 2138, 1784 – 1682; mean – 1719, SD – 330). On a monthly level, a larger peak in late-summer–autumn 1783 (max in September) and a secondary peak in January 1784 are observed. For Sweden and Norway, Hellman (2021) finds no extraordinary mortality on an annual level, although Sweden shows a mortality increase in November 1783–February 1784. For Norway, the signal is less clear. The lack of background seasonal cycle data prevents any estimate of excess mortality for these months.
To summarise, the available data for central and western Europe suggest some excess mortality peaking in August–October and again in early 1784, although in most cases the signal was too weak to show in the annual data. In Sweden, absolute mortality increased only in November, but increases relative to the usual seasonal cycle could not be determined.
6.2 The role of hunger and disease outside Iceland
Despite widespread damage to vegetation (Grattan et al., 2003), historical records show no evidence for harvest failure in 1783 in west and central Europe (Halldórsson, 2013; Witham and Oppenheimer, 2004). So probably the vegetation damage, while dramatic in its sudden and unusual appearance, was not sufficiently large to cause massive harvest failure over most of Europe. Even if harvest failure had occurred, it would probably not have caused hunger already in summer and autumn 1783. Balkanski et al. (2018) point out that in France, the mortality did not affect the poor people more severely than the wealthy as would be expected if hunger had been a main cause.
Witham and Oppenheimer (2004) discuss the possibility that the warm summer of 1783 may have caused at least part of the excess mortality in England from August onward. July 1783 was the warmest July in their dataset, and they point out that hot summers tended to cause excess mortality after a few weeks, probably because the heat stimulated the spread of disease (for example, by fostering insects that could transmit disease). Anecdotal evidence (Grattan et al., 2003; Hellman, 2021) likewise points to the occurrence of fever. The second mortality peak in England, in early 1784, can at least partly be explained by cold, potentially aggravated by disease (for example, people huddling close together for warmth might spread typhus-infested lice). However, Witham and Oppenheimer (2004) find that the warm July of 1783 and the cold winter of 1784 only explain about one-third and one-half of the corresponding mortality peaks, which may be due to missing additional factors but also to limitations of their linear regression method.
One interesting aspect of the English mortality data is the fine-grained variability in space (Witham and Oppenheimer, 2004), with strongly and weakly affected parishes in close proximity. This might be consistent with disease outbreaks, depending on how much people travelled among parishes and how easily diseases were transmitted. Local geography might have also played a role, for example, the proximity to some insect-infested pond or swamp or regional climate effects (e.g. altitude reducing summer temperature).
To summarise, contagious diseases triggered by climate anomalies may explain at least a substantial part of the western European excess mortality, but it is unclear whether they can explain all of it.
The hypothesis that volcanic air pollution directly contributed to human mortality seems to rest on the fact that about a month after the haze began and associated respiratory symptoms were observed in Europe, significant excess mortality occurred. However, this does not prove that the concentration of harmful substances, particularly SO2 and PM2.5 (particulate matter of less than 2.5 µm diameter), really were a significant cause of death in 1783.
7.1 Morbidity vs. mortality
There is ample evidence for haze-induced respiratory symptoms in both Iceland and Europe. In Iceland, statements collected at the manntalsþing (annual farmers gatherings) in Eyjafjarðarsýsla, December 1783, reported “disgusting stench and ill odour, such that men with [pre-existing] chest diseases temporarily stayed in bed” (Wieners20SM), while Ólafur Stephensen in west Iceland wrote, “The sulfur stench is so strong, that people cannot draw their breath well, and it is not unreasonable, that this can cause disease” (cited in Thordarson, 1995). Close to the volcano, Reverend Jón Steingrímsson mentions respiratory disorders such as difficulty breathing, especially in persons suffering from pre-existing chest diseases, and irritated throats, skin, and eyes (Steingrímsson, 1788, p. 41). These symptoms persisted at least through spring 1784, possibly due to continuing outgassing from the lava flows. None of these sources mention human deaths directly connected to these symptoms or a mysterious increase in mortality in summer–autumn 1783.
In Europe, Grattan and others showed that health problems consistent with volcanic pollution were widespread (e.g. Durand and Grattan, 1999 and references therein). Some contemporary sources in Europe link the haze to illness and mortality (Grattan et al., 2003, and references therein), although as noted above, in some cases the wording suggests contagious disease rather than pollution.
Evidence for morbidity induced by long-term exposure to volcanic SO2 and sulfate aerosol is also documented for modern eruptions; see Stewart et al. (2022) for a review. Their Table 2 lists various cardiopulmonary symptoms in exposed persons, but the reviewed studies do not document severe illness or excess mortality. Probably this is at least in part because the studied populations were not large enough – typically a few hundred – to support mortality statistics.
By contrast, Wakisaka et al. (1988) found that long-term (11-year) exposure to SO2 and suspended particulate matter (sulfate aerosol and fine ash) from Sakurajima volcano were associated with increased mortality rates due to non-infectious respiratory disease (14 % risk increase in the area up to 30 km from the volcano), although only bronchitis showed a consistent relationship with both distance from the volcano and temporal variation in concentrations. However, the effect was not visible in total mortality rates.
Therefore, while haze from the Laki eruption clearly induced morbidity, this does not necessarily imply significant effects on (total) mortality.
7.2 The time lag between haze occurrence and mortality
As noted by Witham and Oppenheimer (2004), Grattan et al. (2003, 2005), and Hellman (2021), excess mortality in England and France only rose in August 1783, while strong haze had been present since the end of June (Thordarson and Self, 2003).
This is in contrast to modern pollution events, where faster responses are observed. For example, Micheaud (2004) found that hospital emergency room visits for asthma and chronic obstructive pulmonary disease (COPD) followed exposure to SO2 and fine sulfuric acid aerosol at Kilauea, Hawaii, at lags of 1–3 d. Similarly, Carlsen et al. (2021b, a) studied the effect of chemically young (SO2-rich) and chemically mature (aerosol-rich) plumes from the 2014 Bárðarbunga eruption in Reykjavík and found significantly increased demand for healthcare at a 0–2 d lag for both types of plumes.
Such findings do not exclude health effects at longer lags – these would be hard to discern or disprove with data from fluctuating plumes. More prolonged health effects probably occurred after a major non-volcanic pollution event, the London smog of December 1952 (Bell and Davies, 2001). The smog, which lasted 5 d, was accompanied by a sharp mortality peak. In the 9 d around the smog episode, mortality was strongly correlated with pollutant (SO2 and particulate matter) concentrations at a 0–1 d lag, but mortality remained elevated for several months following the smog, suggesting a long-term effect of pollution. However, this long-term effect followed a stronger immediate impact.
If these modern analogues are representative of historical haze-induced mortality, it is puzzling that mortality in England and France should only show a long-term response without an immediate impact. In Iceland, the lag between the strongest haze and the onset of the mortality crisis (December 1783) is even longer. As explained above, overall mortality in 1783 was below average in Iceland. In addition, the seasonal distribution of deaths in Iceland is close to that of normal non-famine years (Fig. 6). In particular, the fraction of deaths occurring in July and August is slightly below normal, whereas the fraction in December is elevated – the first increase leading to the mortality peak in spring 1784.
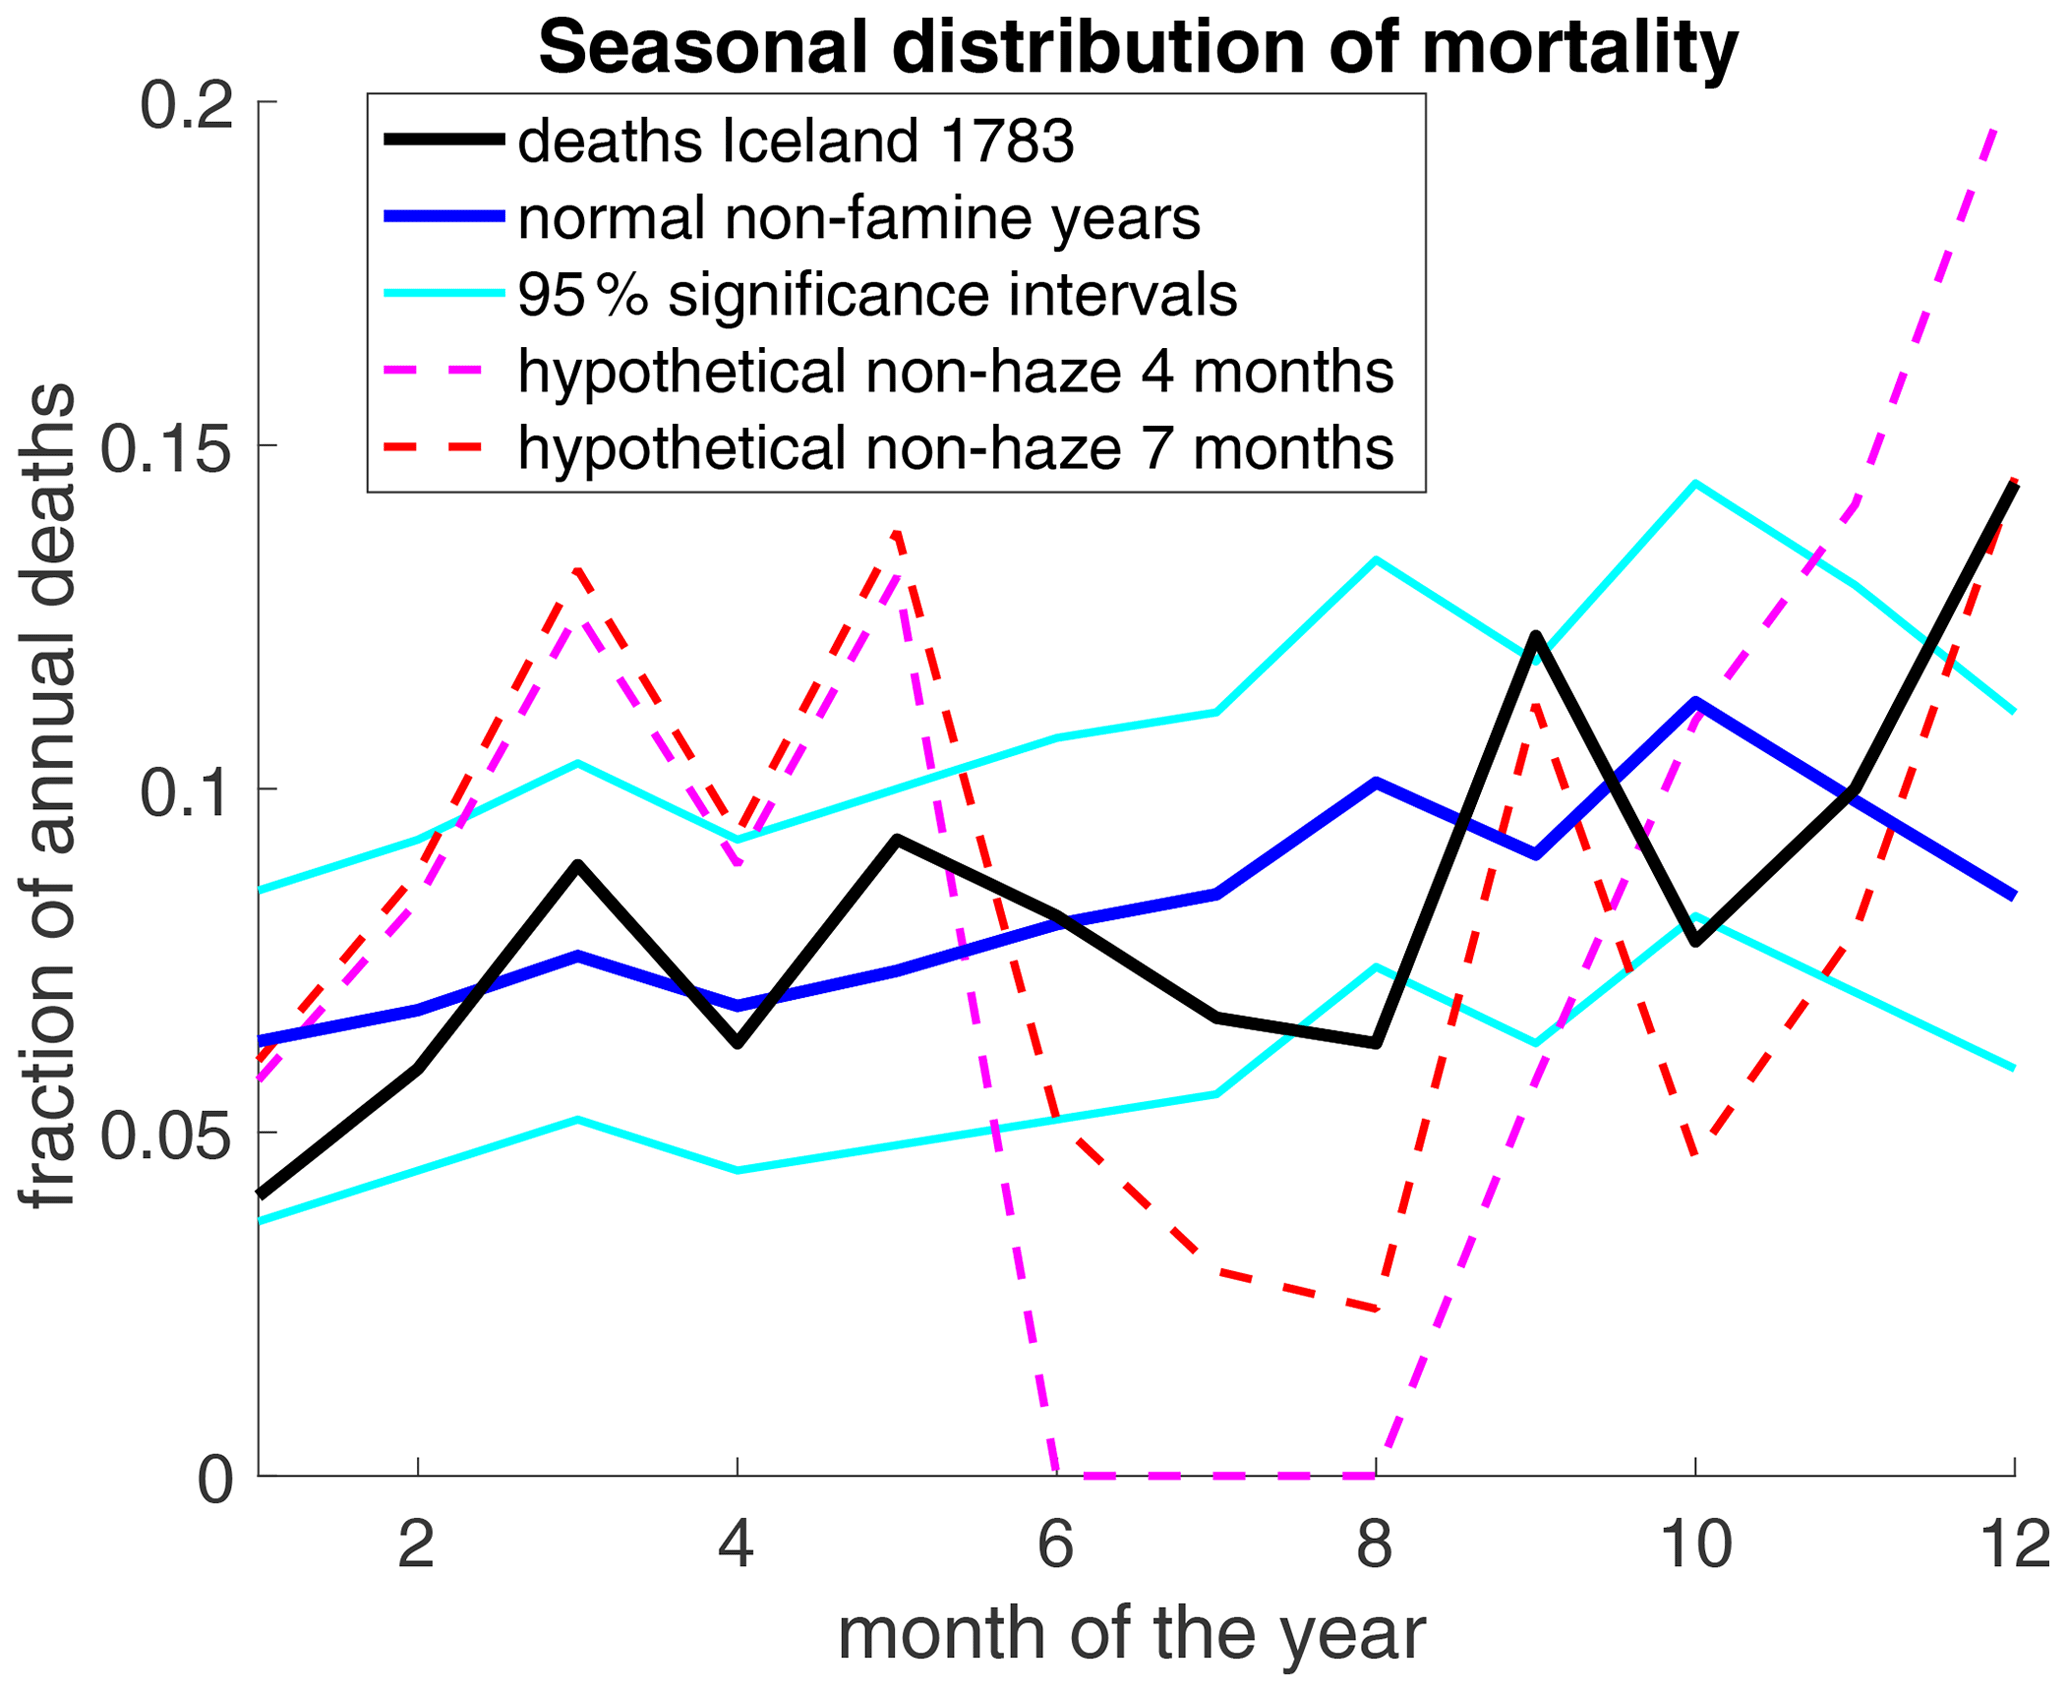
Figure 6Seasonal distribution of deaths in Iceland. For any period, the graph shows the fraction of deaths occurring in a given calendar month based on the parish registers. Data are shown for the N=270 deaths in 1783 covered in our parish data and for the mean over 4 famine-free decades (1740–1749, 1760–1769, 1770–1779, and 1790–1799; Vasey, 1991). The 95 % confidence intervals were computed by creating 10 000 randomised surrogate distributions and taking the 5th and 95th percentiles for each month. Each surrogate distribution was generated by randomly assigning a month of death to N=270 persons using the probability distribution of the famine-free years. The actual 1783 distribution is thus within normal fluctuations if it is inside the 95 % significance interval. The two “hypothetical” scenarios assume that out of the 1227 deaths that occurred in 1783, 400 can be attributed to haze, in line with Balkanski et al. (2018). These haze-related deaths are evenly spread over 4 months (June–September) or 7 months (June–December). The graph shows the seasonal distribution of the remaining 827 deaths. A slightly negative value for July in the 4-month curve was set to zero.
Apart from the timing, the strong differences in mortality between nearby parishes in England (Witham and Oppenheimer, 2004) do not seem to match with the Laki pollution as the main cause. The polluted air was transported to England at great height before descending in a high-pressure area (Thordarson and Self, 2003), which should have resulted in relatively homogenous concentrations of pollutants and hence mortality over scales of a few hundred kilometres – unless local variation in susceptibility (e.g. urban vs. rural populations) and small-scale geographic effects, such as sheltering from prevailing winds, played a major role. However, studying the latter would require simulating pollution at a much higher resolution (on the order of 1 km) than has hitherto been attempted (on the order of 100 km in Balkanski et al., 2018).
7.3 Modelling studies of the haze
Several modelling studies simulate concentrations of SO2 and PM2.5 after the Laki eruption. In Tables 3–5, their findings are compared to health guidelines and measurements from modern pollution events.
Table 3Annual and daily mean concentrations of SO2 and particulate matter not to be exceeded, according to national guidelines cited by the International Volcanic Health Hazard Network (IVHHN, 2022) The three values show the strictest guideline, the EU guideline, and the least strict guideline cited. All concentrations are in µg m−3. PMX refers to particulate matter (i.e. aerosol) with a diameter smaller than X µm. NA stands for not available.

Table 4Modelled concentrations of SO2 and particulate matter during the Laki haze (in µg m−3). PMX refers to particulate matter (i.e. aerosol) with a diameter smaller than X µm.
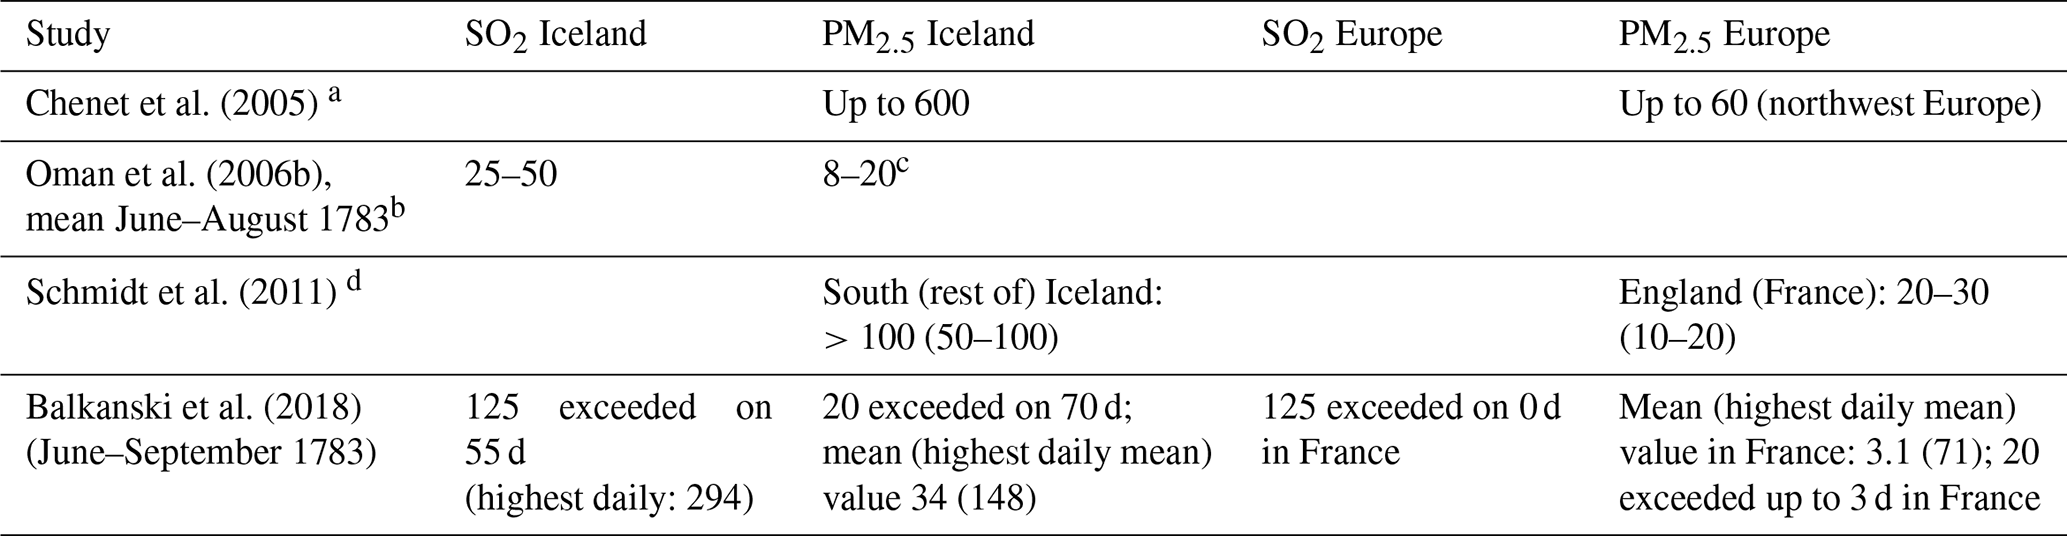
a Assuming 100 % conversion of SO2 to sulfate aerosol; hence aerosol was likely overestimated. First 2 months after eruption. b Average over a wide area, 30° W–45° E along 65° N. Local concentrations in Iceland likely higher. c Including all sulfate aerosol, not just PM2.5. Probably only a mild overestimate; see remark in Table 5. d Increase due to Laki-style eruption relative to present-day conditions, i.e. influenced by industrial activity.
Table 5Concentrations (in µg m−3) during historical pollution events with recorded impact on mortality. PMX refers to particulate matter (i.e. aerosol) with a diameter smaller than X µm.
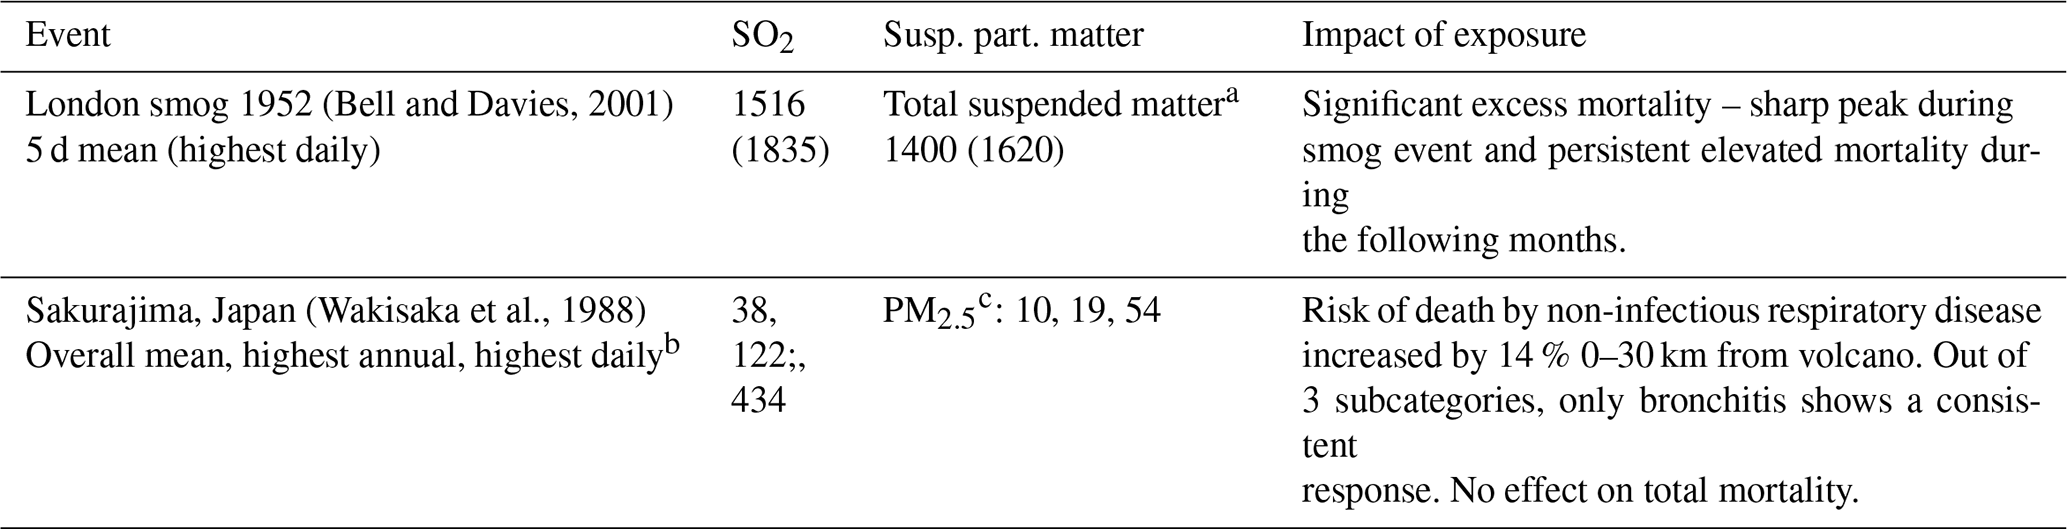
a PM2.5 is contained in total suspended matter (TSM), thus PM2.5 ≦ TSM. For sulfate, according to IVHHN volcanic aerosol is mostly in the PM2.5 range, thus PM2.5 ≈ TSM. For industrial smog and/or haze, Bell and Davies (2001) assumed 60 % of TSM to be PM10. Cho et al. (2013) suggests about 90 % of PM10 is PM2.5 and 80 % PM1. b Out of 4 measurement sites providing up to 11 years of data. c Much of the suspended matter was likely ash. Hillmann et al. (2012) suggest that nearly all suspended matter was small enough to be PM10. Horwell (2007) suggests that 50 % of PM10 from (not airborne) ash samples is PM4 and about 70 % of PM4 is PM2.5. For sulfate, TSM ≈ PM2.5. We take PM2.5 = 0.35 × TSM as a conservative estimate to convert the TSM values from Wakisaka et al. (1988) to PM2.5.
Reporting criteria vary widely across modelling studies, but collectively they suggest that health guidelines for SO2 and PM2.5 were at most mildly exceeded in Europe. The reported concentrations are generally lower than the concentrations measured around Sakurajima in Japan (Table 5), which caused no significant excess all-cause mortality despite a much longer exposure time. A caveat is that much of the PM2.5 from Sakurajima was probably ash, which may be less dangerous than sulfate because sulfate is acidic.
For Iceland, modelled concentrations differ widely but are generally of a similar magnitude to or higher magnitude than the results for Sakurajima. In addition, the model estimates for Iceland only contain sulfate but not (fine) ash. The model estimates are, however, far lower than for the fatal London smog. It is therefore not possible to exclude (moderate) excess mortality based on comparisons to the modern analogues considered here.
Balkanski et al. (2018) and Schmidt et al. (2011) also model the mortality effect of the Laki eruption itself or a present-day Laki-like eruption, respectively. This requires assumptions regarding the “response functions” of excess mortality to volcanic haze. As pointed out in these studies, response functions suffer from high uncertainty. Observations are scarce, in particular on intermediate timescales of a few months, as typical pollution events are either short-lived or chronic. In addition, pollution events tend to contain a mixture of pollutants whose effects are hard to disentangle, while response functions are based on generic particulate matter and ignore the fact that acidic aerosol may have stronger effects. Estimating response functions for pre-industrial times suffers additional uncertainties including different background exposure (less industrial pollution but likely more smokey houses), a different age profile, and a less developed healthcare system.
Balkanski et al. (2018) modelled increased risk of death for parishes in France where observations exist and found relative risk values of 0.4 %–3 % for June–September 1783, far below the observed excess mortality (32 % above average). They conclude that the haze alone cannot explain observations. Schmidt et al. (2011) find ≈140 000 additional deaths in Europe for a Laki-type eruption in modern settings. For England, they report 21 000 deaths, which amounts to a 3–6-times-lower excess mortality rate than was observed in 1783 (Grattan et al., 2003), although direct comparison is problematic seeing that they assume modern background pollution. Also, they include only the effect of PM2.5 not of SO2, although this might be acceptable at least for Europe where plumes are likely to be chemically mature. A follow-up study (Heaviside et al., 2021) finds 772 deaths for the UK as a best estimate (3350 as a worst-case scenario), i.e. even lower numbers.
For Iceland, Balkanski et al. (2018) find a 13 %–30 % increased risk of dying from SO2 and 60 % from PM2.5 for June–September 1783. Assuming the effects of SO2 and PM2.5 to be additive, this implies a risk increase by ≈80 % (73 %–90 %). For an average annual 1500 deaths in Iceland (mean 1750–1800), an 80 % increase in mortality rates over 4 (6) months implies about 400 (600) excess deaths. These numbers are small compared to the excess mortality following the eruption (≈8000 deaths in 1784–1785) but might suggest a modest contribution for 1783. Schmidt et al. (2011) find an excess mortality of 400 deaths for present-day Iceland, which implies lower deathrates than Balkanski et al. (2018) given the roughly 6-times-larger population in 2004 compared to 1783. The discrepancy may partly be due to the omission of the effect of SO2 in Schmidt et al. (2011).
No excess mortality was actually observed in Iceland as a whole in 1783. However, as mortality in Iceland fluctuated strongly (standard deviation 1750–1800 – 937 deaths yr−1), we cannot exclude the possibility that without the eruption, mortality in 1783 would have been below average, masking a possible impact of the haze. But assuming that 400 deaths out of the 1227 observed in 1783 were caused by haze, as suggested by Balkanski, it would leave only 827 deaths by other causes, which would imply a lower death rate than ever observed in 1750–1800 (16 deaths per 1000 inhabitants; actual minimum – 18.5) and a highly atypical seasonal pattern (Fig. 6). Assuming a smaller haze-induced mortality of 200 deaths over 7 months would still imply an unusually low non-haze relative summer mortality (not shown).
If Icelandic pollution-induced excess mortality in 1783 likely stayed below 200 (about 26 % of the normal death toll for half a year), it seems unlikely that northwestern Europe experienced an excess mortality on that order of magnitude, even though pollutant concentrations there were much lower than in Iceland.
To summarise, while there is clear evidence for haze-related morbidity in Iceland and Europe, this does not hold for mortality. In Europe, observed excess mortality was much stronger and followed a different timing than (imperfect) modern analogues suggest if haze had been the main cause. In Iceland, there is no evidence for any haze-related excess mortality in 1783. Of course, this does not exclude the possibility that some (up to ≈200) individuals did die from pollution. It is also conceivable that haze-induced morbidity contributed indirectly to excess mortality in Iceland and/or Europe, for example by weakening peoples' resistance and making them more vulnerable to hunger and disease. In fact, pollution from forest fires has been linked to increased risk of influenza months later (Landguth et al., 2020). However, evidence for direct haze-induced excess mortality in Iceland or Europe remains weak. In particular, air pollution does not seem to explain the large death toll in Iceland during 1784–1785.
As mentioned, ≈450 mg m−2 of fluorine fell over most of Iceland. Assuming a hay crop of (Friðriksson, 1972), this amounts to up to 11 250 mg per kg hay, which is an upper estimate because fluorine concentrations may have been reduced in between ash showers through dilution by rainwater or permanent adsorption to the soil (Thordarson, 1979; D'Alessandro, 2006). Assuming that a sheep eats the equivalent of 3 kg of dried grass per day (Sigurðarson and Pálsson, 1957) and weighs 50 kg, fluorine intake may have been well above the dose of 15 mg per day per kg body weight that may kill after 6 months (see Sect. 8.2).
There is no doubt that grazing animals died of fluorine poisoning after the Laki eruption (Pétursson et al., 1984). Symptoms described in contemporary records (Steingrímsson, 1788; Finnsson, 1796) such as feebleness, softened bones, growths (exosthoses) on the bones, and death match perfectly with later findings and experiments (Roholm, 1937, henceforth referred to as RoX, with X being a chapter number).
While there have been several cases of (lethal) fluorosis among livestock after ash-producing eruptions (Pétursson et al., 1984; Roholm, 1937), fluorine-related morbidity in humans mostly arises due to persistent volcanic activity causing contamination of drinking water by rock–water interaction or ash fall (D'Alessandro, 2006; Walser, 2020). This mostly concerns only dental fluorosis, i.e. stains on the enamel of teeth (Stewart et al., 2022), although fluorine concentrations sufficient to cause skeletal fluorosis may occur in some volcanic areas (D'Alessandro, 2006; Walser, 2020). Fluorosis from (non-permanent) eruptions seems to be rare (Stewart et al., 2022), the Laki eruption being the only example where such an effect has been suggested (D'Alessandro, 2006). In this section, we first review historical and archeological records and then provide rough estimates of potential fluorine uptake by humans.
8.1 Historical and archeological records
Many contemporaries considered it possible that humans and animals suffered from the same disease, described by some as “bone sickness” or “a kind of scurvy” (Stephensen, 1785, Wieners20SM). Parish registers do not list bone sickness as a cause of death. “Bone pain” occurs 15 times, mostly in connection with other symptoms (tak, headache, weakness, or old age). None of these cases occurred in 1783, five in 1784 (three of those in the first 6 months), six in 1785, and 4 in 1786–1787. This does not suggest a surge of fatal bone sickness in the months following the eruption, although cases in 1783–1784 may be slightly underrepresented due to higher proportions of unspecified deaths.
Parish registries list 99 deaths from scurvy. The fact that farming animals were wrongly diagnosed as having died from scurvy (obviously a misdiagnosis, as sheep, cows, and horses can produce vitamin C) may at first imply that human victims of fluorosis, if any, could have been misdiagnosed as scurvy victims. Of the 99 diagnosed scurvy cases, 88 occurred in Gullbringusýsla, mostly in the first half of 1785. These deaths thus occurred well after the fluorine exposure peaked but coincided with the peak in hunger deaths. Furthermore, Gullbringusýsla had the lowest animal loss, suggesting a relatively modest exposure to fluorine, whereas the local diet was high in fish and thus low in vitamin C. The recorded cases are thus probably due to genuine scurvy caused by the fish-based and hence vitamin-C-deficient diet rather than misdiagnosed fluorosis.
The rapid loss of livestock indicates that parishes closest to the eruption experienced the highest exposure to fluorine. As mentioned in the introduction, observations of a local pastor (Steingrímsson, 1788) and a young emissary of the Danish government (Stephensen, 1785) have been interpreted as symptoms of fluorosis in humans.
Steffensen (1972)Table 6Human symptoms recorded after the Laki eruption. Some very generic symptoms like feebleness and diarrhoea, which can be linked to all three causes, are omitted. So is the claim that some patients' tongues fell off (MS) because the generally more reliable report by JS says this was not the case, with one possible exception from hearsay only. Sources: OF – letters from Icelandic officials (Wieners20SM), JS – report by Jón Steingrímsson (Steingrímsson, 1788), MS – report by Magnús Stephensen (Stephensen, 1785), and RoX – (Roholm, 1937), chapter X.
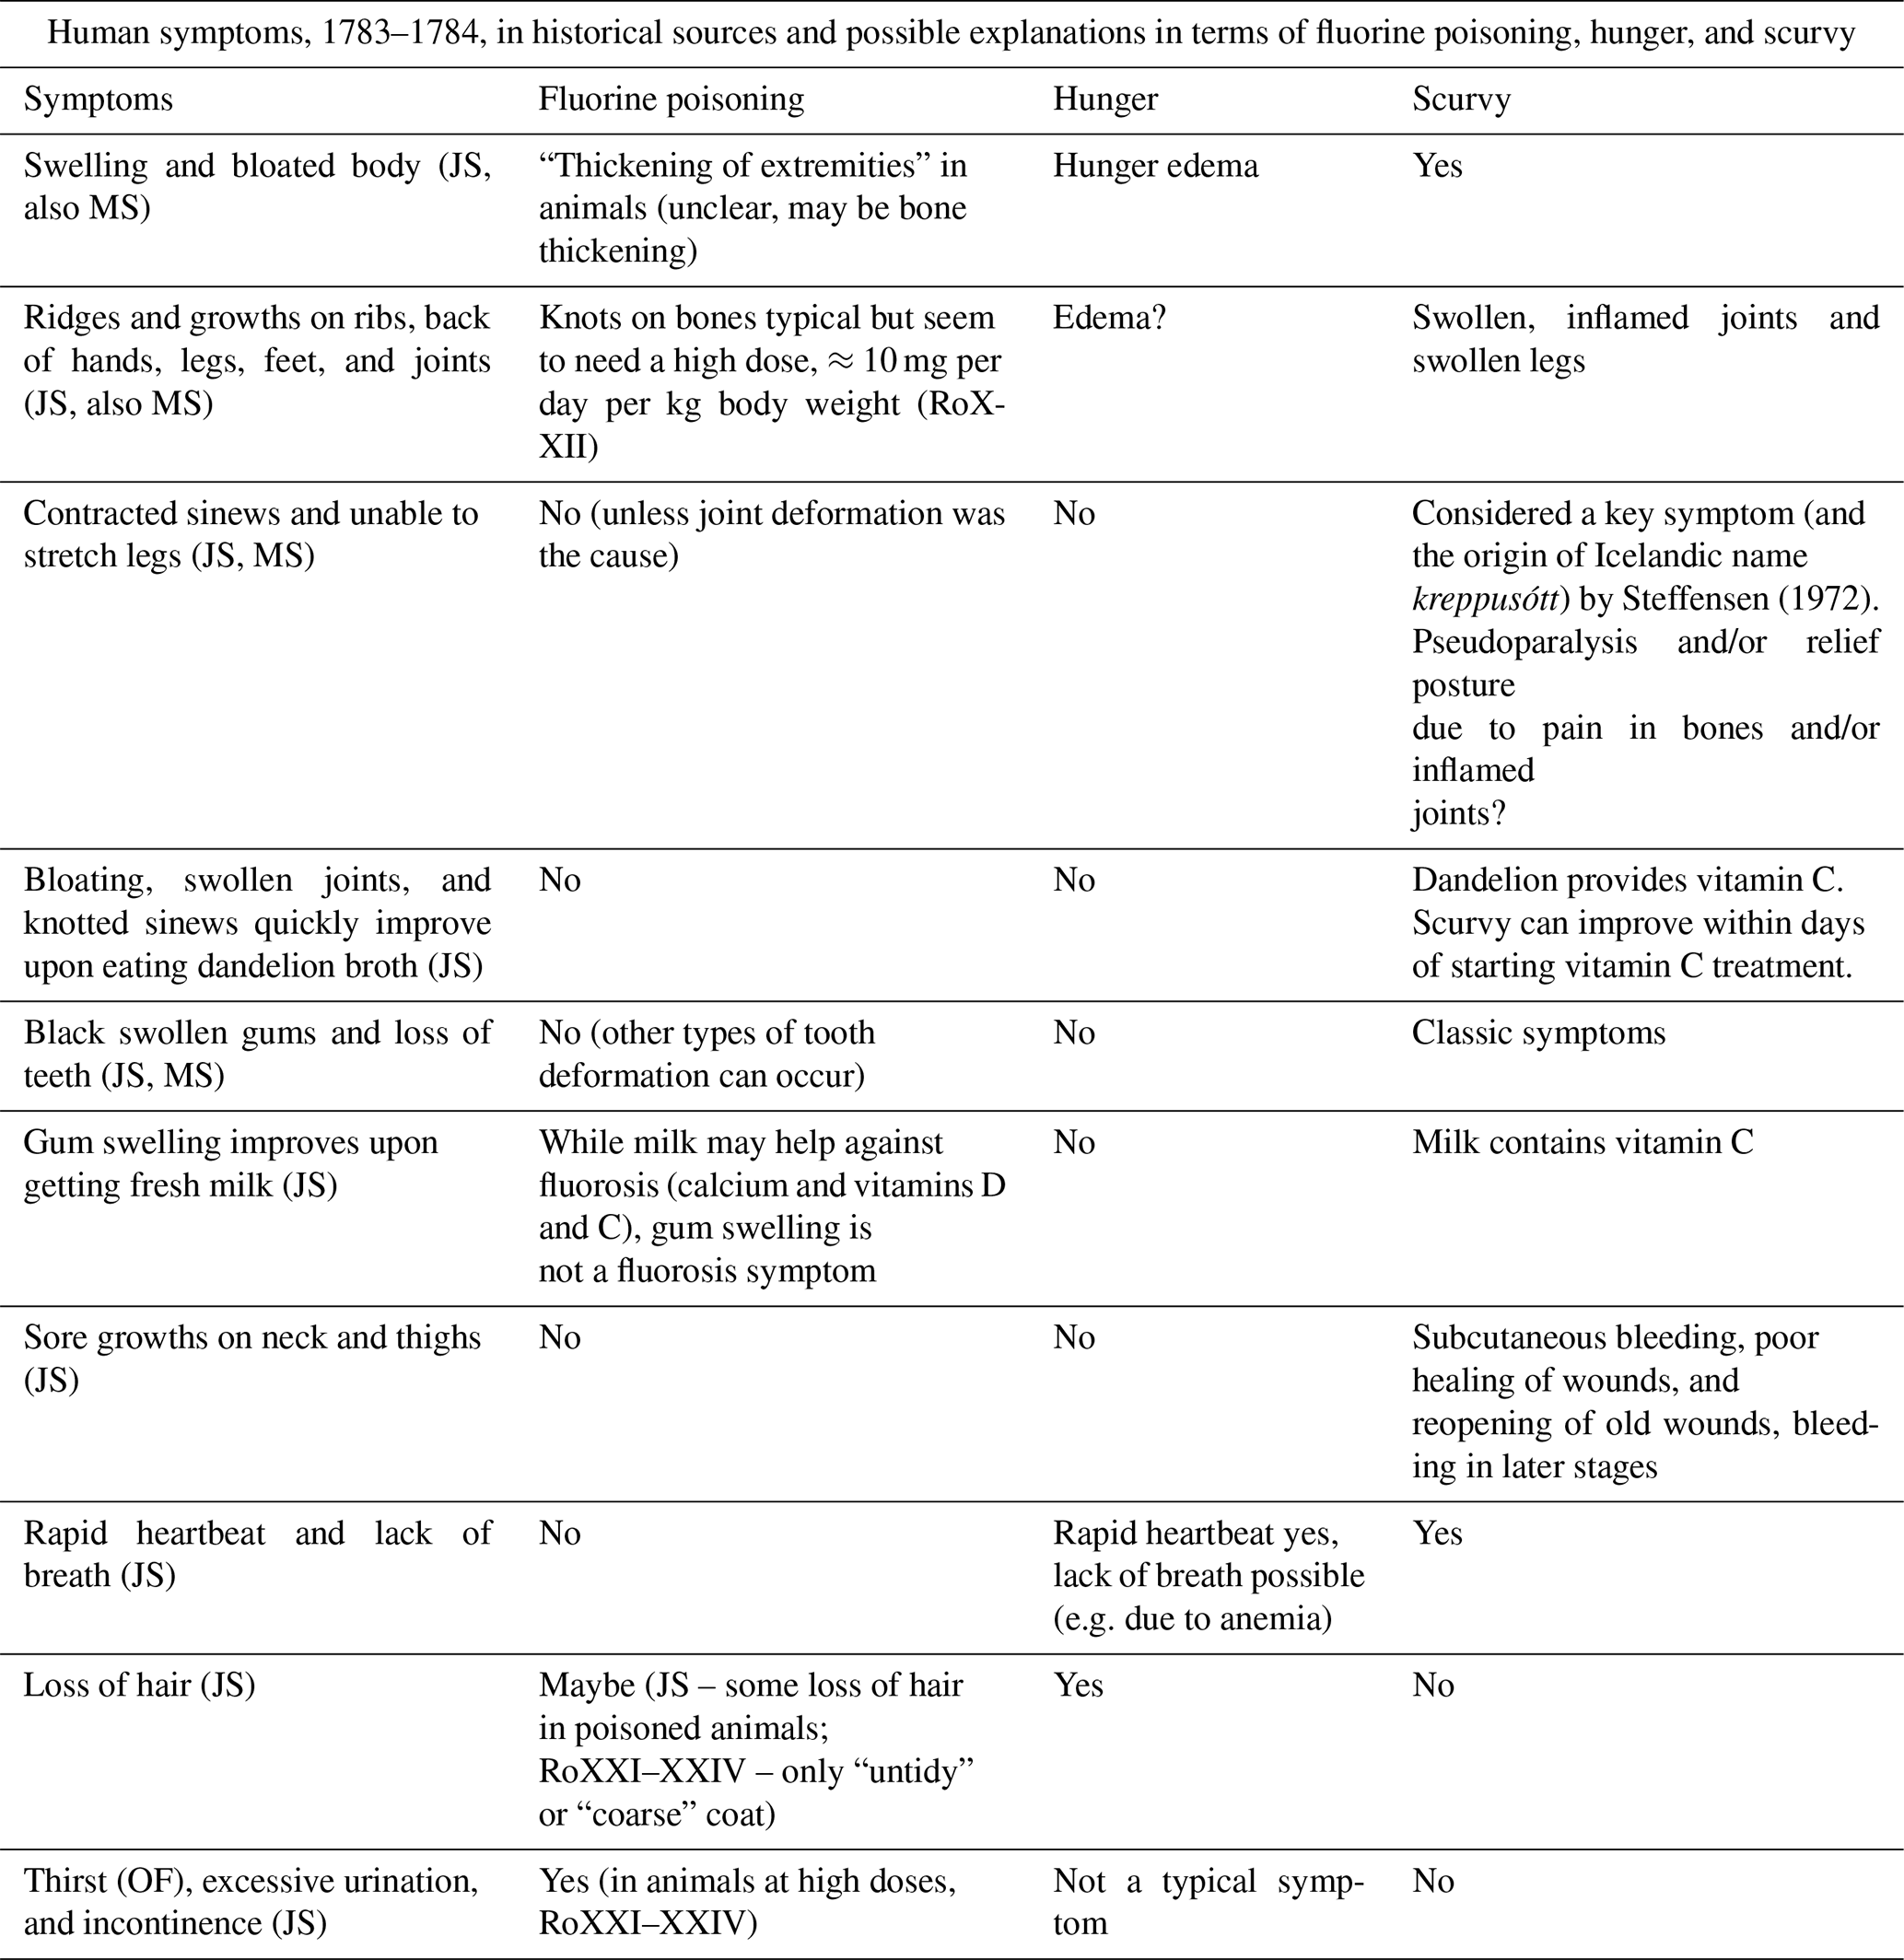
However, this assessment appears somewhat superficial, as most symptoms in these sources match hunger and scurvy better than fluorosis (Table 6). In particular, black swollen gums and loss of teeth are signature symptoms of scurvy. “Swellings and bloated bodies”, “Ridges and growths”, and inability of patients to stretch their legs could hint at deformation of joints or bones through exostoses (material accretion on the bones) caused by fluorosis. However, exostoses require a high fluorine intake of about 10 mg per day per kg body weight (RoXXII), far exceeding our estimates of human fluorine ingestion (Sect. 8.2). In addition, these symptoms can be explained well by scurvy, possibly combined with hunger edema. The fact that the above symptoms improved upon consuming food containing vitamin C also points to scurvy as the main cause. The only reported symptoms that fits better with (strong) fluorine poisoning are thirst and excessive urination.
Perhaps more conspicuous is the absence of two classic symptoms of chronic fluorosis from Table 6. First, skeletal fluorosis in humans leads to stiffness in the spine because of calcification of the ligaments; this key symptom was found by Roholm in cryolite workers (RoXIV) but is not mentioned in Iceland after 1783. If fluorosis had been severe enough to cause “ridges and growths” through exostoses, one would expect spinal stiffness to be observed as well. Second, prolonged exposure to fluorine, even at low doses, during childhood causes dental fluorosis (RoXIX). Bishop Hannes Finnsson carefully studied the phenomenon in animals in the years following the Laki eruption (Finnsson, 1796) but does not mention similar symptoms in humans. This suggests that even dental fluorosis was not widespread.
Archaeological investigations also do not provide evidence of lethal fluorine poisoning. Gestsdóttir et al. (2006) and Walser (2020) analysed human skeletal remains, including from the period of the Laki eruption, but found no signs of clinical fluorosis.
All in all, written and archeological records do not support the hypothesis of (widespread) lethal fluorosis in humans. One cannot exclude, however, that elevated fluorine intake exacerbated scurvy because fluorine might impede the utilisation of vitamin C by the human body (RoXXVII).
8.2 Estimates of fluorine ingestion
As a complementary line of evidence, we provide an upper estimate of human fluorine ingestion and a low estimate of the critical dose for morbidity and mortality. This will allow us to assess whether widespread illness and death by fluorine poisoning was at least plausible.
For a lower bound of the lethal dose of long-term fluorine intake, we use RoXXI–XXIV. The author induced chronic fluorosis in rats, pigs, calves, and dogs. Feeding these animals roughly 15 mg of fluorine per day per kg of body weight caused strong symptoms but was in most cases not lethal within half a year. One pig died on day 171 and some rats after 0.6 to 1.5 years. So 15 mg per day per kg of body weight may serve as a lower bound for the lethal dose of fluorine for half a year. For a human (or sheep) weighing 50 kg, this equals 750 mg d−1.
To obtain a lower estimate of fluorine intake causing symptoms other than dental fluorosis (stained teeth), we note that Prashuta et al. (2011) found that 10 mg d−1 ingested for 10 years or more can cause skeletal fluorosis (bone changes), and Sigurðarson and Pálsson (1957) found that 20–40 mg d−1 of fluorine for half a year caused mild skeletal fluorosis in sheep. RoXX estimated that a cryolite worker who showed significant skeletal fluorosis (stiffness in the vertebral column), but was otherwise in reasonable condition, had ingested 15 mg d−1 over 25 years. We take 10 mg d−1 for half a year as a lower estimate of the critical dose for mild skeletal fluorosis.
During the Laki eruption, people might theoretically have taken in fluorine in various ways: by inhaling gas (HF) or ash, in contaminated drinking water, through animal-based food, or through plant-based food.
Inhalation of HF. This is unlikely to be a major source of fluorine, except maybe at close proximity to the volcano, because the HF concentration in volcanic plumes is typically far below health guidelines (IVHHN, 2022).
Inhalation of ash. Dust (ash) of particle diameters up to 100 µm (PM100) can be inhaled. Particles larger than 10 µm are typically intercepted in the upper airways, but even there they may leach fluorine into moist tissue. We estimate daily fluorine ingestion from dust inhalation as follows:
where Vbreath≈10 m3 is the volume of air inhaled per day, the concentration of PM100 in µg m−3, and MF the mass fraction of fluorine in ash. To obtain a generous upper estimate for we start from the highest daily mean PM10 concentration measured in Vík after the 2010 Eyjafjallajökull eruption, which was 1230 µg m−3. The grain size distribution of Eyjafjallajökull ash from Thorsteinsson et al. (2012) suggests that the concentration of PM100 was 4 times that of PM10, which yields µg m−3 if the larger dust particles are suspended to an equal degree as the smaller ones. This is an upper estimate because locations far from Lakagígar had a far lower ash load (ash layer thickness <1 mm in most of Iceland) and likely experienced far lower PM100 values than Vík after the Eyjafjallajökull eruption. In addition, probably not all days were windy enough to allow resuspension of old ash. Thordarson and Self (2003) estimate the fluorine content of the Laki ash as MF=550 ppm (by mass). Inserting these values into Eq. (2) yields a daily intake of about 0.03 mg of fluorine, far below our estimated critical dose for morbidity.
Drinking water. Comparisons with Hekla eruptions allow some very rough estimates of fluorine concentration in drinking water. After the 1947 eruption, fluorine concentrations of up to 9.5 mg L−1 were found in nearby rivers (Stefánsson and Sigurjónsson, 1957, cited in Stewart et al., 2006). After the 1970 eruption, rivers were found to contain up to 10 mg L−1, which diminished to up to 0.5 mg L−1 within 2 weeks, while stagnant water contained 4–70 mg L−1 that reduced to 0.3–14 mg L−1 after 2 weeks (Georgsson and Pétursson, 1972, cited in Wilson et al., 2009). In 2000, a peak concentration of 0.7 mmol kg−1, or about 14 mg L−1, was measured in the spring-fed river Ytri-Rangá after steady rain had flushed the soluble fluorine into the groundwater. The next sample taken 5 d later showed greatly reduced fluorine levels. Higher values between measurements cannot be excluded.
For the last eruption, the ash burden near the river's source was 1–10 kg m−2 (Flaathen and Gíslason, 2007); assuming a fluorine content of 300 ppm near the volcano (Óskarsson, 1980) suggests a fluorine burden of 300–3000 mg m−2. For comparison, it has been estimated that the Laki eruption deposited 450 mg m−2 on average over a 200 000 km2 area (Sect. 2.2). However, this deposition was spread over a longer time period so that peak concentrations were likely lower, especially in regions far from the eruption.
Except for the inhabitants of small islands, Icelanders drank from (small) rivers or springs rather than stagnant pools. Assuming a generous drinking water consumption of 3 L d−1 and a fluorine concentration of 14 mg L−1 (the highest value measured near Hekla), the fluorine uptake would be 42 mg d−1, far below the lethal dose. Even the maximum concentration observed for stagnant water, 70 mg L−1, would result in a lower intake than the lethal dose of 750 mg d−1. In addition, it is unlikely that such high concentrations were sustained for months on end, especially further away from the volcano.
Animal-based food. Pétursson et al. (1984) state that fluorine does not penetrate into milk, suggesting that dairy products would have been safe to consume. However, RoXIX found moderately mottled teeth in children whose mothers had experienced prolonged exposure to cryolite dust during or before breast feeding. The children's symptoms were consistent with a fluorine content of 1–2 mg L−1 in the mothers' milk. Assuming that cow or ewe milk had similar fluorine concentrations, 4 L of milk per day (providing a daily allowance of 2500 kcal), or the equivalent in dairy products, would result in a fluorine intake of 8 mg d−1. RoXXII found no elevated fluorine content in blood, muscles, and organs of fluorine-poisoned pigs, except for the kidneys (fluorine content elevated by a factor of 4). This suggests that meat products were safe to consume. Fluorine does accumulate in bones in significant quantities (RoXXII–XXIV). However, it seems that bone broth was not a common food in Iceland; it is not even mentioned as famine food (Jónasson, 1961). In addition, fluorine in bones is embedded the form of fluorapatite, a mineral with poor solubility in water. Wei et al. (2013) found concentrations below 38 mg L−1 (2 mmol L−1) in highly acidic solutions and far lower values otherwise, suggesting that bone broth, if produced, would not have contained lethal fluorine concentrations.
Plant-based food. This is the most uncertain potential source of fluorine. Plants can take up fluorine from the air (Jacobson et al., 1966) and from the soil (Hong et al., 2016), with fluorine accumulation differing widely per plant type; in addition, fluorine-rich ash may have been attached to plants. Mild washing can reduce fluorine content in plant leaves (Jacobson et al., 1966). As grazing animals contracted lethal fluorosis from plant-based food, human-edible plants might have contained dangerous quantities of fluorine as well. However, Icelanders' diet was low in plants, although wild plants such as berries, angelica root, and herbs were eaten. In addition, Iceland moss (Cetraria islandica, a lichen) was harvested in significant quantities in some regions; farmers in Eyjafjarðarsýsla tried to live on “moss and water” in the summer of 1783 (Wieners20SM). Unfortunately, we have not been able to obtain data on the fluorine content of these plants and Iceland moss. It seems plausible that, given the generally low consumption of plants as well as extensive washing typically applied to Iceland moss (Jónasson, 1961, 39–40), human fluorine intake was much lower than that of grazing animals, but we cannot give an upper bound on plant-related fluorine ingestion. Roholm found that animals' condition quickly improved after reducing the daily fluorine intake. Thus, the fact that mortality in Eyjafjarðarsýsla only started to rise months after the farmers had switched from moss to meat and (spoilt) grain from the trade post (Wieners20SM) suggests that fluorosis was not the main cause of death there.
To summarise, our rough estimates suggest that it is rather unlikely for humans to have ingested enough fluorine to reach the estimated lethal dose of 750 mg d−1, although plant-based food is an uncertain factor. However, we cannot exclude that fluorine intake exceeded 10 mg d−1. Since we deliberately used high estimates of fluorine content and low estimates of critical doses, the fact that we cannot exclude fluorine-induced morbidity should not be seen as a proof that it did indeed occur on a large scale.
While traditionally the large death toll in Iceland after the Laki eruption has been attributed to hunger and an increase in endemic disease (with the latter probably largely caused by the former), two additional hypotheses were formed in the 1970s to 1980s (Grattan et al., 2003, 2005; Blong, 1984; Friðriksson, 1983): first, that air pollution may have directly contributed to human mortality in Iceland and (northwestern) Europe and second, that humans in Iceland may have died from fluorine poisoning. Both hypotheses are sometimes referred to in the scientific literature (Schmidt et al., 2011; D'Alessandro, 2006) and have found their way into popular science (Witze, 2016) but have received little scrutiny, especially as regards comparison with contemporary Icelandic data.
Using county-level demographic data and parish registries (Sect. 3), we show that many features of the data, especially regional discrepancies (Sect. 4), can be satisfactorily explained by hunger and diseases when not just the effect of the eruption but also local effects such as the weather and availability of alternative food sources are taken into account (Sect. 5). However, the existence of one explanation does not exclude alternative or additional explanations; hence, we also discussed the possible contributions of air pollution and fluorine poisoning.
For air pollution (Sect. 7), comparisons with modern eruptions and other pollution events suggest that air pollution has immediate effects on human morbidity and mortality. In 1783, mortality in northwestern Europe only started to increase more than a month after the first appearance of the thick Laki haze, and in Iceland no increase in mortality is noted during summer–autumn 1783. Furthermore, modelling studies suggest that, at least in Europe, concentrations of fine dust and SO2 were too low to have significant impacts on mortality. Indirect effects such as pollution increasing the susceptibility to disease are impossible to prove or disprove. The weakness of evidence for a major contribution of air pollution to human mortality in 1783 does not imply that a similar eruption against modern background pollution would not have serious consequences (Schmidt et al., 2011; Heaviside et al., 2021).
Regarding fluorine poisoning (Sect. 8), reported symptoms in humans that were used as evidence for possible fluorosis seem to match hunger and scurvy better, while classic symptoms of fluorosis such as mottled teeth and spine stiffness were not recorded for humans. In addition, even generous upper estimates of fluorine intake via gaseous fluorine compounds, inhalation of ash, or ingestion via drinking water or meat are far below even a conservative estimate for the lethal dose. One remaining uncertainty is possible ingestion through plant-based food, for which fluorine concentrations could not be estimated, but plant-based food played only a small role in the Icelandic diet.
While it is quite possible that some individuals died of air pollution or fluorine poisoning, there is no compelling evidence that either made a significant direct contribution to the large death toll in Iceland and to elevated mortality in northwestern Europe. Unless further evidence emerges, both hypotheses should be treated with caution.
The parish and county level demographic data from Iceland are available under https://doi.org/10.34894/9YT5BK (Wieners and Hálfdanarson, 2023).
The supplement related to this article is available online at: https://doi.org/10.5194/nhess-24-2971-2024-supplement.
CEW conceived the study, while GH compiled the parish- and county-level demographic data. CEW and GH analysed the demographic data. CEW researched and analysed material on the direct impact of air pollution and fluorosis and made the figures. CEW and GH both wrote the paper.
The contact author has declared that neither of the authors has any competing interests.
Publisher's note: Copernicus Publications remains neutral with regard to jurisdictional claims made in the text, published maps, institutional affiliations, or any other geographical representation in this paper. While Copernicus Publications makes every effort to include appropriate place names, the final responsibility lies with the authors.
The authors thank Marianne T. Schöneich, Amelie E. G. Wieners, Gerhard U. Wieners, and Clemens Wirries for fruitful discussions and comments on an earlier version of the manuscript. We also thank the three reviewers for useful suggestions.
This paper was edited by Amy Donovan and reviewed by Jón Kristinn Einarsson, Niklaus Emanuel Bartlome, and one anonymous referee.
Balkanski, Y., Menut, L., Garnier, E., Wang, R., Evangeliou, N., Jourdain, S., Eschstruth, C., Vrac, M., and Yiou, P.: Mortality induced by PM2.5 exposure following the 1783 Laki eruption using reconstructed meteorological fields, Sci. Rep.-UK, 8, 15896, https://doi.org/10.1038/s41598-018-34228-7, 2018. a, b, c, d, e, f, g, h, i
Bell, M. L. and Davies, B. L.: Reassessment of the Lethal London Fog of 1952: Novel Indicators of Acute and Chronic Consequences of Acute Exposure to Air Pollution, Environ. Health Persp., 109, 389–394, 2001. a, b, c
Blong, J. R.: Volcanic Hazards, a sourcebook, Academic Press, https://doi.org/10.1016/C2009-0-21853-8, 1984. a, b
Carlsen, H. K., Ilinskaya, E., Baxter, P. J., Schmidt, A., Thorsteinsson, T., Pfeffer, M. A., Barsotti, S., Dominici, F., Finnbjörnsdottir, R. G., Jóhansson, T., Aspelund, T., Gislason, T., Valdimarsdóttir, U., Briem, H., and Gudnason, T.: Increased respiratory morbidity associated with exposure to a mature volcanic plume from a large Icelandic fissure eruption, Nat. Commun., 12, 2161,https://doi.org/10.1038/s41467-021-22432-5, 2021a. a
Carlsen, H. K., Valdimarsdóttir, U., Briem, H., Dominici, F., Finnbjörnsdottir, R. G., Jóhansson, T., Aspelund, T., Gislason, T., and Gudnason, T.: Severe volcanic SO2 exposure and respiratory morbidity in the Icelandic population – a register study, Environmental Health, 20, 23, https://doi.org/10.1186/s12940-021-00698-y, 2021b. a
Chenet, A.-L., Fluteau, F., and Courtillot, V.: Modelling massive sulphate aerosol pollution, following the large 1783 Laki basaltic eruption, Earth Planet. Sc. Lett., 236, 721–731, https://doi.org/10.1016/j.epsl.2005.04.046, 2005. a, b
Cho, C., Park, G., and Kim, B.: An Effectiveness of Simultaneous Measurement of PM10, PM2.5, and PM1.0 Concentrations in Asian Dust and Haze Monitoring, Journal of Environmental Science International, 22, 651–666, https://doi.org/10.5322/JESI.2013.22.6.651, 2013. a
D'Alessandro, W.: Human fluorosis related to volcanic activity: A review, WIT Tr. Biomed. Health, 10, 21–30, https://doi.org/10.2495/ETOX060031, 2006. a, b, c, d, e, f
D'Arrigo, R., Seager, R., Smerdon, J. E., LeGrande, A. N., and Cook, E. R.: The anomalous winter of 1783–1784: Was the Laki eruption or an analog of the 2009–2010 winter to blame?, Geophys. Res. Lett., 5, 38, https://doi.org/10.1029/2011GL046696, 2011. a
Durand, M. and Grattan, J. P.: Extensive respiratory health effects of volcanogenic dry fog in 1783 inferred from European documentary sources, Environ. Geochem. Hlth., 21, 371–376, https://doi.org/10.1023/A:1006700921208, 1999. a
Einarsson, J. K.: Jón Steingrimsson og Skaftáreldar (Jón Steingrímsson and the Laki eruption), Sögufélag, Reykjavik, ISBN 9789935466303, 2022. a
Finnsson, H.: Um mannfæckun af Hallærum á Íslandi (decimation of the population in Iceland due to famines), Rit þess Konúngliga Islenzka Lærdóms-Lista-Félags, 14, 30–226, 1796, Republished as: Mannfækkun af hallærum, Almenna bókafélagið, Reykjavík, https://baekur.is/bok/50a103eb-7590-4e09-8811-63dced2281a9/0/6/Mannfaekkun_af#page/n5/mode/2up (last access: 23 August 2024), 1796. a, b
Finnsson, S.: Report to the governor of Iceland about the refugees from Vestur-Skaftafellsýsla living in Árnessýsla and the aid they had received (April 1785). Preserved in the National Archive of Iceland as NAI. Stm. III, no. 132. Bréf til stiftamtmanns úr Árnessýslu 1751–1785, 1785. a
Flaathen, T. K. and Gíslason, S. R.: The effect of volcanic eruptions on the chemistry of surface waters: The 1991 and 2000 eruptions of Mt. Hekla, Iceland, J. Volcanol. Geoth. Res., 164, 293–316, https://doi.org/10.1016/j.jvolgeores.2007.05.014, 2007. a
Friðriksson, S.: Grass and grass utilization in Iceland, Ecology, 53, 785–796, 1972. a
Friðriksson, S.: Fluoride problems following volcanic eruption, in: Fluorides – Effect on vegetation, animals and humans, edited by: Shupe, J. L., Peterson, H. B., and Leone, N. C., Pearagon Press, UT, 339–344, 1983. a, b
Gestsdóttir, H., Baxter, P., and Gisladóttir, G.: Fluorine poisoning in victims of the 1783–84 eruption of the Laki fissure, Iceland, Fornleifastofnun Íslands, Reykjavík, FS328-04291, https://fornleif.is/wp-content/uploads/2023/07/FS328-04291-Fluorosis.pdf (last access: 23 August 2024), 2006. a
Grattan, J. P. and Brayshay, M. B.: An amazing and portentous summer: environmental and social responses in Britain to the 1783 eruption of an Iceland Volcano, Geogr. J., 161, 2, 125–134, https://doi.org/10.2307/3059970, 1996. a
Grattan, J. P., Durand, M., and Taylor, S.: Illness and elevated human mortality in Europe coincident with the Laki Fissure eruption, Geological Society, London, Special Publications, 213, 401–441, https://doi.org/10.1144/GSL.SP.2003.213.01.24, 2003. a, b, c, d, e, f, g, h, i, j
Grattan, J. P., Rabartin, R., Self, S., and Thordarson, T.: Volcanic air pollution and mortality in France 1783–84, C. R. Geosci., 337, 7, https://doi.org/10.1016/j.crte.2005.01.013, 2005. a, b, c, d
Guðbergsson, G. M. and Theodórsson, T.: Áhrif Skaftárelda á byggð og mannfjölda í Leiðvallahreppi og Kleifahreppi (Consequences of the Laki eruption on settlement and population numbers in Leiðvallahreppur and Kleifahreppur), in: Skaftáreldar 1783–84: ritgerðir og heimildir (The Laki eruption 1783–84: articles and sources), edited by: Gunnlaugsson, G. A., Guðbergsson, G. M., Þórarinsson, S., Rafnsson, S., and Einarsson, Þ., Mál og Menning, Reykjavík, 99–118, 1984. a
Guðjónsson, S. Þ.: Íslenskir annálar og aðrar gamlar veðurheimildir (Icelandic Annals and Other Old Weather Sources), https://www.vedur.is/media/vedurstofan/utgafa/hlidarefni/annalar_sig-th.pdf (last access: 23 August 2024), 2010. a, b, c
Gunnarsson, G.: Monopoly trade and economic stagnation: studies in the foreign trade of Iceland 1602–1787, Lund University, https://catalog.hathitrust.org/Record/006669555 (last access: 23 August 2024), 1983. a
Gunnlaugsson, G. Á.: Fólksflótti úr Vestur-Skaftafellssýslu í kjölfar Skaftárelda (Emigration from Vestur-Skaftárfellssýsla following the Laki eruption), in: Skaftáreldar 1783–84: ritgerðir og heimildir (The Laki eruption 1783–84: articles and sources), edited by: Gunnlaugsson, G. A., Guðbergsson, G. M., Þórarinsson, S., Rafnsson, S., and Einarsson, Þ., Mál og Menning, Reykjavík, 119–128, 1984a. a, b, c
Gunnlaugsson, G. Á.: Viðbrögð stjórnvalda í Kaupmannahöfn við Skaftáreldum (The reaction of the central government in Copenhagen to the Laki eruption), in: Skaftáreldar 1783–84: ritgerðir og heimildir (The Laki eruption 1783–84: articles and sources), edited by: Gunnlaugsson, G. A., Guðbergsson, G. M., Þórarinsson, S., Rafnsson, S., and Einarsson, Þ., Mál og Menning, Reykjavík, 187–214, 1984b. a
Gunnlaugsson, G. A. and Rafnsson, S.: Heimildir til sögu Skaftáreldanna og Móðuharðinda (Sources on the history of the Laki eruption and the Haze Hardships), in: Skaftáreldar 1783–84: ritgerðir og heimildir (The Laki eruption 1783–84: articles and sources), edited by: Gunnlaugsson, G. A., Guðbergsson, G. M., Þórarinsson, S., Rafnsson, S., and Einarsson, Þ., Mál og Menning, Reykjavík, 265–435, 1984. a, b
Hálfdanarson, G.: Mannfall í Móðuharðindin (Human mortality during the Haze Hardships), in: Skaftáreldar 1783–84: ritgerðir og heimildir (The Laki eruption 1783–84: articles and sources), edited by: Gunnlaugsson, G. A., Guðbergsson, G. M., Þórarinsson, S., Rafnsson, S., and Einarsson, Þ., Mál og Menning, Reykjavík, 139–162, 1984. a, b, c, d
Halldórsson, E.: The Dry Fog of 1783: Environmental Impact and Human Reaction to the Lakagígar Eruption, Master thesis at Vienna University, Austria, https://www.semanticscholar.org/paper/The-Dry-Fog-of-1783:-Environmental-Impact-and-Human-Halldorsson/fb0958e508de9a4882b2bbe30b8b09cced368dfc (last access: 23 August 2024), 2013. a, b, c
Heaviside, C., Witham, C., and Vardoulakis, S.: Potential health impacts from sulphur dioxide and sulphate exposure in the UK resulting from an Icelandic effusive volcanic eruption, Sci. Total Environ., 774, 145549, https://doi.org/10.1016/j.scitotenv.2021.145549, 2021. a, b, c
Hellman, G.: The Laki volcanic eruption of 1783–1784: a reappraisal and reinterpretation of the consequences of the event in Europe. Villain or fall guy?, PhD Thesis, History, Université Rennes 2, https://theses.hal.science/tel-03533049 (last access: September 2023), 2021. a, b, c, d, e, f, g, h
Highwood, E.-J. and Stevenson, D. S.: Atmospheric impact of the 1783–1784 Laki Eruption: Part II Climatic effect of sulphate aerosol, Atmos. Chem. Phys., 3, 1177–1189, https://doi.org/10.5194/acp-3-1177-2003, 2003. a
Hillman, S. E., Horwell, C. J., Densmore, A. L., Damby, D. E., Fubini, B., Ishimine, Y., and Tomatis, M.: Sakurajima volcano: a physico-chemical study of the health consequences of long-term exposure to volcanic ash, B. Volcanol., 74, 913–930, https://doi.org/10.1007/s00445-012-0575-3, 2012. a
Hong, B. D., Joo, R. N., Lee, K. S., Lee, D. S., Rhie, J. H., Min, S. W., Song, S. G., and Chung, D. Y.: Fluoride in soil and plant, Korean Journal of Agricultural Science, 43, 522–536, https://doi.org/10.7744/kjoas.20160054, 2016. a
Horwell, C. J.: Grain-size analysis of volcanic ash for the rapid assessment of respiratory health hazard, J. Environ. Monitor., 9, 1107–1115, https://doi.org/10.1039/B710583P, 2007. a
IVHHN – International Volcanic Health Hazard Network: Volcanic Gases and Aerosols Guidelines, https://www.ivhhn.org/images/pdf/gas_guidelines.pdf (last access: 22 August 2022), 2022. a, b
Jacobson, J. S., Weinstein, L. H., Mccune, D. C., and Hitchcock, A. E.: The Accumulation of Fluorine by Plants, JAPCA J. Air Waste Ma., 16, 412–417, https://doi.org/10.1080/00022470.1966.10468494, 1966. a, b
Jónasson, J.: Íslenzkir þjóðhættir (Icelandic folk customs), 3rd Edn., Ísafoldarprentsmiðja H. F., Reykjavík, ISBN 9789935100320, 1961. a, b
Jónsson, G. and Magnússon, M. S. (Eds.): Hagskinna. Sögulegar hagtölur um Ísland (Icelandic Historical Statistics), Hagstofa Íslands, https://baekur.is/bok/8f318e69-dc49-4a9f-a8ec-805b2352bad0 (last access: April 2023), 1997. a, b, c, d, e
Jónsson, J. and Sigurðsson, S.: Report to the governor of Iceland about the refugees from Vestur-Skaftafellsýsla living in Rangárvallasýsla and the aid they had received (October 1784). Preserved in the National Arcive of Iceland as NAI. Stm. III, no. 121, Bréf til stiftamtmanns úr Rangárvallasýslu 1751–1785, 1784. a
Jónsson, V.: Report based on testimonies from local farmers' assemblies in Þingeyjarsýsla, taken on April 16th, 1783, preserved in the National Archive of Iceland as NAI. Rtk. B10-8, örk 1, 1783. a
Karlsson, G.: The History of Iceland, Univ. of Minnesota Press, Minneapolis, ISBN 978-0816635894, 2000. a
Landguth, E. L., Holden, Z. A., Graham, J., Stark, B., Mokhtari, E. B., Kalaczyc, E., Anderson, S., Urbanski, S., Jolly, M., Semmens, E. O., Warren, D. A., Swanson, A., Stone, E., and Noonan, C.: The delayed effect of wildfire season particulate matter on subsequent influenza season in a mountain west region of the USA, Environ. Int., 139, 105668, https://doi.org/10.1016/j.envint.2020.105668, 2020. a
Magnússon, S.: Forsøg til en kort Beskrivelse af Island (Attempt of a short description of Iceland), 1786.
Michaud, J.-P., Crove, J. S., and Krupitsky D.: Emergency department visits and “vog”-related air quality in Hilo, Hawai'i, Environ. Res., 95, 11–19, https://doi.org/10.1016/S0013-9351(03)00122-1, 2004. a
Mokyr, J. and Ó Gráda, C.: What do people die of during famines: the Great Irish Famine in comparative perspective, Eur. Rev. Econ. Hist., 6, 339–363, https://doi.org/10.1017/S1361491602000163, 2002. a
NAI – National Archive of Iceland: Rtk. D1-24, Manntalstöflur (Census Tables), 1769. a
Oman, L., Robock, A., Stenchikov, G. L., and Thordarson, T.: High-latitude eruptions cast shadow over the African monsoon and the flow of the Nile, Geophys. Res. Lett., 33, L18711, https://doi.org/10.1029/2006GL027665, 2006a. a
Oman, L., Robock, A., Stenchikov, G. L., Thordarson, T., Koch, D., Shindell, D. T., and Gao, C.: Modeling the distribution of the volcanic aerosol cloud from the 1783–1784 Laki eruption, J. Geophys. Res.-Atmos., 111, D12209, https://doi.org/10.1029/2005JD006899, 2006b. a, b
Óskarsson, N.: The interaction between volcanic gases and tephra: fluorine adhering to tephra of the 1970 Hekla eruption, J. Geophys. Res.-Atmos., 111, 251–266, 1980. a
Pausata, F. S. R., Karamperidou, C., Caballero, R., and Battisti, D. S.: ENSO response to high-latitude volcanic eruptions in the Northern Hemisphere: the role of the initial conditions, Geophys. Res. Lett., 43, 8694–8702, https://doi.org/10.1002/2016GL069575, 2011. a
Pétursson, G., Pálsson, A. A., and Georgsson, G.: Um eituráhrif af völdum Skaftárelda (On the poisoning effects of the Laki eruption), in: Skaftáreldar 1783–84: ritgerðir og heimildir (The Laki eruption 1783–84: articles and sources), edited by: Gunnlaugsson, G. A., Guðbergsson, G. M., Þórarinsson, S., Rafnsson, S., and Einarsson, Þ., Mál og Menning, Reykjavík, 163–178, 1984. a, b, c, d, e, f, g, h, i, j
Pratusha, N. G., Banji, O. J., Banji, D., Ragini, M., and Pavani, B.: Fluorine Toxicity – a harsh reality, 79–85, 2011. a
Prestsþjónustubækur: Prestsþjónustubækur (parish registries), available online through the National Archive of Iceland's website, https://www.skjalasafn.is (last access: November 2022), 1782–1787. a
Rafnsson, K.: Búfé og byggð við lok Skaftárelda og Móðuharðinda (Livestock and settlement at the end of the Laki eruption and Haze Hardships), in: Skaftáreldar 1783–84: ritgerðir og heimildir (The Laki eruption 1783–84: articles and sources), edited by: Gunnlaugsson, G. A., Guðbergsson, G. M., Þórarinsson, S., Rafnsson, S., and Einarsson, Þ., Mál og Menning, Reykjavík, 163–178, 1984. a, b, c
RÞÍL: Rit þess íslenzka lærdómslistafélags (The Proceedings of the Icelandic Learned Society), https://timarit.is/page/963912#page/n0/mode/1up (last access: April 2023), 1781–1797. a
Roholm, K.: Fluorine Intoxication, A Clinical-Hygienic Study with a review of the literature and some experimental investigations, Nyt Nordisk Forlag, Copenhagen, https://doi.org/10.1002/jctb.5000564412, 1937. a, b, c
Schmidt, A., Ostro, B., Carslaw, K. S., Wilson, M., Thordarson, T., Mann, G. W., and Simmons, A. J.: Excess mortality in Europe following a future Laki-style Icelandic eruption, P. Natl. Acad. Sci. USA, 108, 15710–15715, https://doi.org/10.1073/pnas.1108569108, 2011. a, b, c, d, e, f, g, h, i
Sigurðarson, B. and Pálsson, P.: The eruption of Hekla 1947–1948 – Fluorosis of farm animals during the Hekla eruption of 1947–1948, Soc. Sci. Isl., Spec. Publ., 3, 1–12, 1957. a, b
Skúlason, J.: Report to the governor of Iceland about refugees from Vestur-Skaftafellsýsla living in Gullbringusýsla and the aid they had received and still needed for the next winter and spring (October 1784). Preserved in the National Arcive of Iceland as NAI. Stm. III, 87. Landfógetabréf til stiftamtmanns, 1750–1785, 1784. a
Steffensen, J.: Hungursóttir á Íslandi (Deficiency diseases in Iceland), Reykjavík, 1972. a, b
Steingrímsson, J.: The fires of the earth. The Laki eruption of 1783–1784 (translated from Icelandic by K. Kunz), ISBN 978-9979542445, 1788/1998. a, b, c, d, e, f, g, h, i, j, k, l, m, n
Stephensen, M.: Kort Beskrivelse over den nye Vulcans Ildsprudning i Vester-Skaptefields-Syssel paa Island i Aaret 1783 (Short description of the new volcanic eruption in Vestur-Skaftafellssýsla on Iceland in the year 1783), Copenhagen, 1785. a, b, c, d
Stephensen, O. and Sigurðsson, J.: Lovsamling for Island (Law collection for Iceland), Copenhagen, https://baekur.is/bok/000195669/Lovsamling_for (last access: August 2022), 1854. a
Stevenson, D. S., Johnson, C. E., Highwood, E. J., Gauci, V., Collins, W. J., and Derwent, R. G.: Atmospheric impact of the 1783–1784 Laki eruption: Part I Chemistry modelling, Atmos. Chem. Phys., 3, 487–507, https://doi.org/10.5194/acp-3-487-2003, 2003. a, b
Stewart, C., Johnson, D. M., Leonard, G. S., Horwell, C. J., Thordarson, T., and Cronin, S. J.: Contamination of water supplies by volcanic ashfall: A literature review and simple impact modelling, J. Volcanol. Geoth. Res., 158, 296–306, https://doi.org/10.1016/j.jvolgeores.2006.07.002, 2006. a
Stewart, C., Damby, D. E., Horwell, C. J., Elias, T., Ilyinskaya, E., Tomasek, I., Longo, B. M., Schmidt, A., Carlsen, H. K., Mason, E., Baxter, P. J., Cronin, S., and Witham, C.: Volcanic air pollution and human health: recent advances and future directions, B. Volcanol., 84, 11, https://doi.org/10.1007/s00445-021-01513-9, 2022. a, b, c
Svanberg, I. and Ægisson, S.: Edible wild plant use in the Faroe Islands and Iceland, Acta Soc. Bot. Pol., 81, 233–238, https://doi.org/10.5586/asbp.2012.035, 2012.
Thorarinsson, S.: On the damage caused by volcanic eruptions with special reference to tephra and gases, Volcanic Activity and Human Ecology, 125–159, ISBN 0-12-6391203, https://doi.org/10.1016/B978-0-12-639120-6.50010-8, 1979. a
Thordarson, T.: Volatile release and atmospheric effects of basaltic fissure eruptions, PhD thesis, University of Hawaiï, https://scholarspace.manoa.hawaii.edu/items/07d21ec4-2516-4134-9a44-51e3b21517ce (last access: October 2019), 1995. a, b, c, d, e
Thordarson, T. and Self, S.: The Laki (Skaftár Fires) and Grimsvötn eruptions in 1783–1785, B. Volcanol., 55, 233–263, 1993. a
Thordarson, T. and Self, S.: Sulfur, chlorine and fluorine degassing and atmospheric loading by the Roza eruption. Columbia River Basalt group, Washington, USA, J. Volcanol. Geoth. Res., 74, 49–73, https://doi.org/10.1016/S0377-0273(96)00054-6, 1996. a
Thordarson, T. and Self, S.: Atmospheric and environmental effects of the 1783–1784 Laki eruption: A review and reassessment, J. Geophys. Res.-Atmos., 108, 233–263, https://doi.org/10.1029/2001JD002042, 2003. a, b, c, d, e, f, g, h
Thorsteinsson, T., Jóhannsson, J., Stohl, A., and Kristiansen, N. I.: High levels of particulate matter in Iceland due to direct ash emissions by the Eyjafjallajökull eruption and resuspension of deposited ash, J. Geophys. Res., 117, B00C05, https://doi.org/10.1029/2011JB008756, 2012. a
Vasey, D. E.: Population, agriculture, and famine: Iceland, 1784–1785, Hum. Ecol., 19, 323–350, 1991. a, b
Wakisaka, I., Yanagihashi, Y., Tomari, T., and Ando, T.: Effects of Volcanic Activity on the Mortality Figures for Respiratory Diseases, Jpn. J. Hyg., 1101–1110, 1988. a, b, c
Walser, J. W., Gowland, R. L., Desnica, N., and Kristjánsdóttir, S.: Hidden dangers? Investigating the impact of volcanic eruptions and skeletal Fluorosis in medieval Iceland, Archaeol. Anthrop. Sci., 12, 77, https://doi.org/10.1007/s12520-020-01026-0, 2020. a, b, c
Wei, C., Zhu, Y., Li, F., Yang, J., Zhu, Z., and Zhu, H.: Dissolution and solubility of hydroxylapatite and fluorapatite at 25 °C at different pH, R. J. Chem. Environ., 17, 57–61, 2013. a
Weinstein, P.: Palaeopathology by proxy: the case of Egil's bones, J. Archaeol. Sci., 32, 1077–1082, https://doi.org/10.1016/j.jas.2005.02.008, 2005. a
Wieners, C. E.: Haze, Hunger, Hesitation: Disaster aid after the 1783 Laki eruption, J. Volcanol. Geoth. Res., 406, 107080, https://doi.org/10.1016/j.jvolgeores.2020.107080, 2020. a, b, c, d, e
Wieners, C. E. and Hálfdanarson, G.: Parish and County level demographic data from Iceland during the Lakagígar eruption 1783, V1, DataverseNL [data set], https://doi.org/10.34894/9YT5BK, 2023. a
Wilson, T., Stewart, C., Cole, J., Johnston, D., and Cronin, S.: Vulnerability of farm water supply systems to volcanic ash fall, Environ. Earth Sci., 61, 675–688, https://doi.org/10.1007/s12665-009-0380-2, 2009. a
Witham, C. and Oppenheimer, C.: Mortality in England during the 1783–84 Laki Craters eruption, B. Volcanol., 67, 15–26, https://doi.org/10.1007/s00445-004-0357-7, 2004. a, b, c, d, e, f, g, h
Witze, A.: Island on Fire, Pegasus books, New York, ISBN 978-1-60598-674-6, 2016. a, b
Zambri, B., Robock, A., Mills, M. J., and Schmidt, A.: Modeling the 1783–1784 Laki Eruption in Iceland: 1. Aerosol Evolution and Global Stratospheric Circulation Impacts, J. Geophys. Res.-Atmos., 124, 6750–6769, https://doi.org/10.1029/2018JD029553, 2019a. a
Zambri, B., Robock, A., Mills, M. J., and Schmidt, A.: Modeling the 1783–1784 Laki Eruption in Iceland: 2. Climate impacts, J. Geophys. Res.-Atmos., 124, 6770–6790, https://doi.org/10.1029/2018JD029554, 2019b. a, b
Thordarson and Self (2003) give ≈500 mg km−2, which contains a typo in the unit.
Grattan et al. (2003) mention a higher increase, 69 %, but Table 3 of that paper seems to contain an error in the long-term mean of summer deaths, giving 33 159, while the sum over the mean values for July, August, and September equals 43 548. Using the latter, the corrected value also yields results that look roughly consistent with their Fig. 1.
They made a minor typo, writing 4193 instead of 4093.
- Abstract
- Introduction
- Socioeconomic and environmental situation
- Data and methods
- Mortality in Iceland, 1783–1786
- Hunger and disease alone may explain excess mortality in Iceland
- Mortality outside Iceland
- Human death by haze?
- Human death by fluorine poisoning?
- Conclusions
- Data availability
- Author contributions
- Competing interests
- Disclaimer
- Acknowledgements
- Review statement
- References
- Supplement