the Creative Commons Attribution 4.0 License.
the Creative Commons Attribution 4.0 License.
 | 01 Jul 2024
Catchment-scale assessment of drought impact on environmental flow in the Indus Basin, Pakistan
Khalil Ur Rahman
Khaled Saeed Balkhair
Hamza Farooq Gabriel
Khan Zaib Jadoon
Kifayat Zaman
The impact of drought on environmental flow (EF) in 27 catchments of the Indus Basin is studied from 1980–2018 using indicators of hydrologic alterations (IHAs). The standardized precipitation evapotranspiration index (SPEI) was systematically propagated from one catchment to another using principal component analysis (PCA). Threshold regression is used to determine the severity of drought (scenario 1, drought severity that causes low flows) and the month (scenario 2, months where drought has resulted in low flows) that trigger low flows in the Indus Basin. The impact of drought on low EFs is quantified using range of variability analysis (RVA), which is an integrated component of the IHA used to study the hydrological alterations in environmental flow components (EFCs) by comparing the pre- and post-impact periods of human and/or climate interventions in EFCs. The hydrological alteration factor (HAF) is calculated for each catchment in the Indus Basin. The results show that most of the catchments were vulnerable to drought during the periods of 1984 to 1986, 1991/1992, 1997 to 2003, 2007 to 2008, 2012 to 2013, and 2017 to 2018. On a longer timescale (SPEI-12), drought is more severe in the lower Indus Basin (LIB) than in the upper Indus Basin (UIB). The IHA pointed out that drought significantly impacts the distribution of EFCs, particularly extremely low flow (ELF) and low flow (LF). The magnitude and frequency of the ELF and LF events increase as drought severity increases. The threshold regression provided useful insights, indicating that moderate drought can trigger ELF and LF at shorter timescales (SPEI-1 and SPEI-6) in the UIB and middle Indus Basin (MIB). Conversely, severe and extreme droughts trigger ELF and LF at longer timescales (SPEI-12) in the LIB. The threshold regression also divided the entire study period (1980–2018) into different time periods (scenario 2), which is useful for quantifying the impact of drought on low EFs using the SPEI coefficient. Higher SPEI coefficients are observed in the LIB, indicating high alterations in EF due to drought. HAF showed high alterations in EF in most of the catchments throughout the year except in August and September. Overall, this study provided useful insights for analysing the effects of drought on EF, especially during low flows.
- Article
(7084 KB) - Full-text XML
-
Supplement
(460 KB) - BibTeX
- EndNote


Environmental flow (EF) refers to the quantity, timing, and quality of freshwater flows in rivers that are necessary to support/sustain ecosystem services, e.g. aquatic life, human requirements, biodiversity, and livelihoods (Arthington et al., 2018; Virkki et al., 2022). However, EFs are under moderate to severe threat due to the rapidly growing population, anthropogenic activities (i.e. damming and flow regulations), and climate and land use changes (Benjankar et al., 2018; Best, 2019; Gudmundsson et al., 2021; Pardo-Loaiza et al., 2022). On a global scale, it is estimated that approximately 65 % of the discharge (in terms of quantity) in rivers poses a moderate to severe threat to biodiversity (Vörösmarty et al., 2010), connectivity of 48 % of rivers is diminished (Grill et al., 2019), and fish biodiversity has been significantly altered in 53 % of rivers (Su et al., 2021). The main causes of such degradation and alteration in river flow regimes around the globe are associated with anthropogenic activities and climate change (Richter et al., 2006; Stamou et al., 2018; Wineland et al., 2021). Therefore, there is a need to rethink and properly manage water resources in regions subjected to water scarcity and, most importantly, severe changes in regional climate.
The Indus River basin is an example of one of the most depleted basins due to substantial climate and land use changes, resulting in limited water availability (Immerzeel et al., 2010; Laghari et al., 2012; Sharma et al., 2010). The upper Indus Basin (UIB) is a hotspot for climate change, whereas the middle Indus Basin (MIB) and lower Indus Basin (LIB) are dependent on the availability of water from the UIB. Several studies have reported an increase in future precipitation and temperature (Forsythe et al., 2014; Nepal and Shrestha 2015; Rajbhandari et al., 2015); however, Shahid and Rahman (2021) reported that the findings in most of the studies are not consistent with global trends for a number of reasons. Precipitation in the Indus Basin is highly erratic and has decreased over time (Rahman et al., 2020a), while temperature has shown an increasing trend, which has consequently resulted in a decreased river flow over time (Dahri et al., 2021; Shahid and Rahman, 2021). The erratic nature of precipitation and increased temperature resulted in a significant decline in riverine flows (i.e. 90 % reduction in flow to the Indus Delta) due to the hydrological alterations in the flow regime (Salik et al., 2016; Syvitski et al., 2013). Therefore, the limited availability of surface water has substantially increased groundwater withdrawal (Rahman et al., 2022), which poses severe threats to sustainable surface and groundwater management in the Indus Basin. In conclusion, freshwater resources are highly vulnerable to climate and land use changes in the Indus Basin, where EF can serve as an integral component for sustainable water management.
EFs in the Indus Basin can be severely impacted by climate change through shifts in precipitation (pattern and intensity) and temperature, glacier melting, and extreme weather events (Immerzeel et al., 2015; Rees and Collins, 2006). Pakistan (i.e. the Indus Basin) is highly vulnerable to climate change and is placed in the eighth position among the countries most affected by climate change (Eckstein et al., 2018). Therefore, the Indus Basin has experienced more frequent and severe extreme events in recent decades. Among these extreme events, drought is the most significant and is experienced most frequently (three times per decade) due to its arid and hyper-arid nature (Ahmed et al., 2020). Drought is broadly classified into four major classes, including meteorological, hydrological, agricultural, and socio-economic droughts (Stephan et al., 2021). Several studies reported that the intensity of drought increases from the UIB to LIB, where the climate (temperature) plays an important role (Rahman et al., 2023a). Similar to meteorological drought, the severity and duration of hydrological drought are higher in the LIB compared with the UIB (Rahman et al., 2023a). The persistent meteorological drought results in a hydrological drought, resulting in a decrease in water availability and, thus, insufficient EFs (Peña-Guerrero et al., 2020). This implies that drought can alter the distribution of EFs both spatially and temporally, which the Indus Basin, particularly the LIB in arid and hyper-arid areas, will be extremely vulnerable to.
The intensity and frequency of droughts are increasing around the world and particularly in the Indus Basin (Chiang et al., 2021; Vicente-Serrano et al., 2019; Wen et al., 2019); therefore, it is extremely important to analyse the impact of drought on water availability, especially the variations and alterations in EFs. Very few studies have assessed the impact of drought (meteorological) on EF. For instance, Młyński et al. (2021) have studied the impact of drought (standardized precipitation index, SPI) on EF across mountainous catchments in Poland. The study reported that drought has the potential to alter the EF, whereas the alterations in EF are dependent on several factors, such as topography (slope), local climate, and hydrogeological conditions. However, the impact of drought on EFs is yet to be investigated in detail. To the best of our knowledge, no such study has quantified the alterations in river flow due to drought and identified thresholds (drought severity and month) that can trigger the alterations in river flow and result in low EFs. Bearing in mind the importance of conserving minimum flow in rivers to protect the ecosystem, this study for the first time evaluates the impact of drought on EF using indicators of hydrologic alterations (IHAs).
The objectives of the current study are to (i) assess the environmental flow components (EFCs), particularly extremely low flow (ELF) and low flow (LF), for the 27 catchments of the Indus Basin; (ii) investigate the drought severity and drought months that trigger low EFs in the Indus River using threshold regression; (iii) apply the range of variability analysis (RVA) to quantify the impact of drought on low EFs; and (iv) analyse the degree of alterations in each catchment using the hydrological alteration factor (HAF).
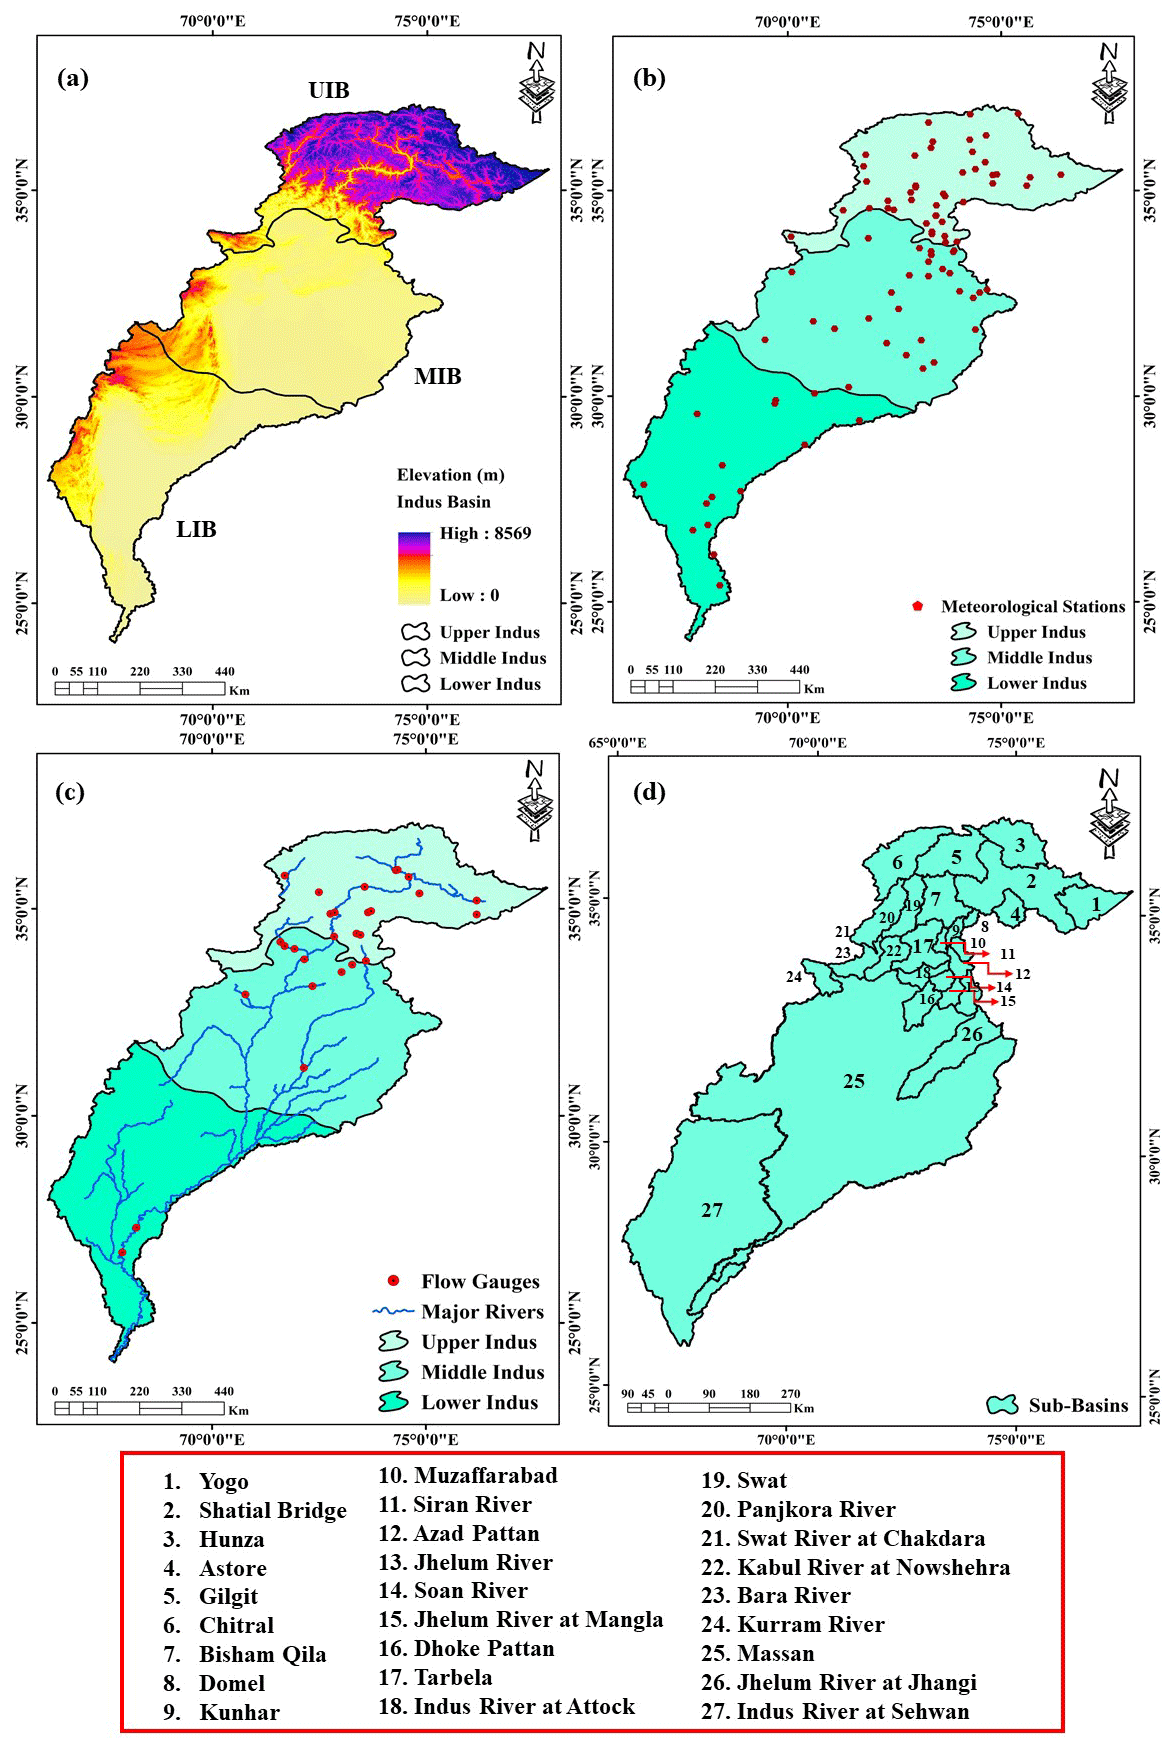
Figure 1(a) Division of the Indus Basin into the UIB, MIB, and LIB with elevation (m), (b) distribution of rain gauges (RGs) and temperature stations, (c) distribution of flow stations, and (d) delineated catchments of the Indus Basin.
The Indus Basin is the 12th largest basin in the world and is situated in four countries, including Pakistan, China, India, and Afghanistan (Laghari et al., 2012). The largest part of the Indus Basin lies in Pakistan, covering an area of 855 045 km2 between 24.02–37.07° N and 66.20–82.50° E. The Indus Basin in Pakistan has a complex topography and diverse climate, where more than 40 % of the Indus Basin has an elevation greater than 2000 m (Rahman et al., 2023a). Based on climate and topography, the Indus Basin is classified into the UIB, MIB, and LIB (shown in Fig. 1) following the demarcation of Aftab et al. (2022), Rajbhandari et al. (2015), and Shahid et al. (2021).
The UIB is the glacial region of the Indus Basin, has an arid climatic nature, and is comprised of permanent snow and glacier reservoirs. The UIB is comprised of the famous Hindu Kush Himalaya mountain ranges, which are the origin of freshwater in the Indus River and its tributaries (Laghari et al., 2012; Rahman et al., 2023a).
The MIB has a humid to arid climate comprised of the Indus Plain, and most of the MIB area consists of a well-developed irrigation network. The entire Indus Basin has 228 694 km2 (21 % of the basin area) of irrigated area, where 60.9 % is situated in Pakistan (Laghari et al., 2012). The Indus Basin Irrigation System (IBIS), one of the largest irrigation networks in the world, covers most of the area in the MIB (Rahman et al., 2023a). IBIS is an integral part of sustainable water and food supply in Pakistan because it supports approximately 90 % of Pakistan's agricultural production (Yang et al., 2013). LIB is located downstream of the Indus Basin, which covers the Indus Plain and Indus Delta, and the climate varies from arid to hyper-arid (Young et al., 2019). The Indus Plain in the MIB and LIB is covered by the Indus River and several other major rivers in the west, including the Sutlej, Jhelum, Chenab, and Ravi rivers (Kalair et al., 2019).
The UIB is characterized by mild precipitation and low temperature and thus low potential evapotranspiration (PET). The UIB (the areas between 34–36° N) receives less than 100 mm of precipitation during the monsoon season (Rahman et al., 2020a), while the downstream area (southern UIB) receives relatively more precipitation. On the other hand, the MIB has a humid climatic nature and receives more than 700 mm of precipitation during the monsoon season. The precipitation decreases to less than 100 mm from the MIB to LIB, especially between 24 and 28° N (Iqbal and Athar, 2018). The temperature in the LIB and southern MIB is warmer, making these regions more vulnerable to severe and frequent drought events (Rahman et al., 2023a). Overall, the Indus Basin receives maximum precipitation of approximately 1500 mm a−1 in the mountainous regions, while the Indus Plain receives less precipitation of about 100 mm a−1 (Dimri et al., 2015). The high temperature and low precipitation make the Indus Basin, especially the LIB, heavily dependent on freshwater availability from the UIB (Laghari et al., 2012).
Major rivers in Pakistan, including transboundary rivers such as the Kabul, Jhelum, Ravi, Sutlej, and Chenab rivers, contribute approximately 70 % of freshwater to the Indus Basin (Karimi et al., 2013; Young et al., 2019). The above-mentioned rivers along with the Indus River serve as a source of water for irrigation and are extremely critical for the LIB (Masood et al., 2020). However, river flow in the Indus Basin is highly seasonal and depends on the temperature and precipitation intensity, i.e. low flow in winter and high flow in summer due to glacial melt (Ali et al., 2009). Extreme events induced by climate change, such as drought, have a substantial impact on river flows. Most studies reported a decreasing trend in river flow in different parts of the Indus Basin (Azmat et al., 2020; Hasson et al., 2017; Mukhopadhyay et al., 2015; Shahid and Rahman, 2021; Shrestha et al., 2019).
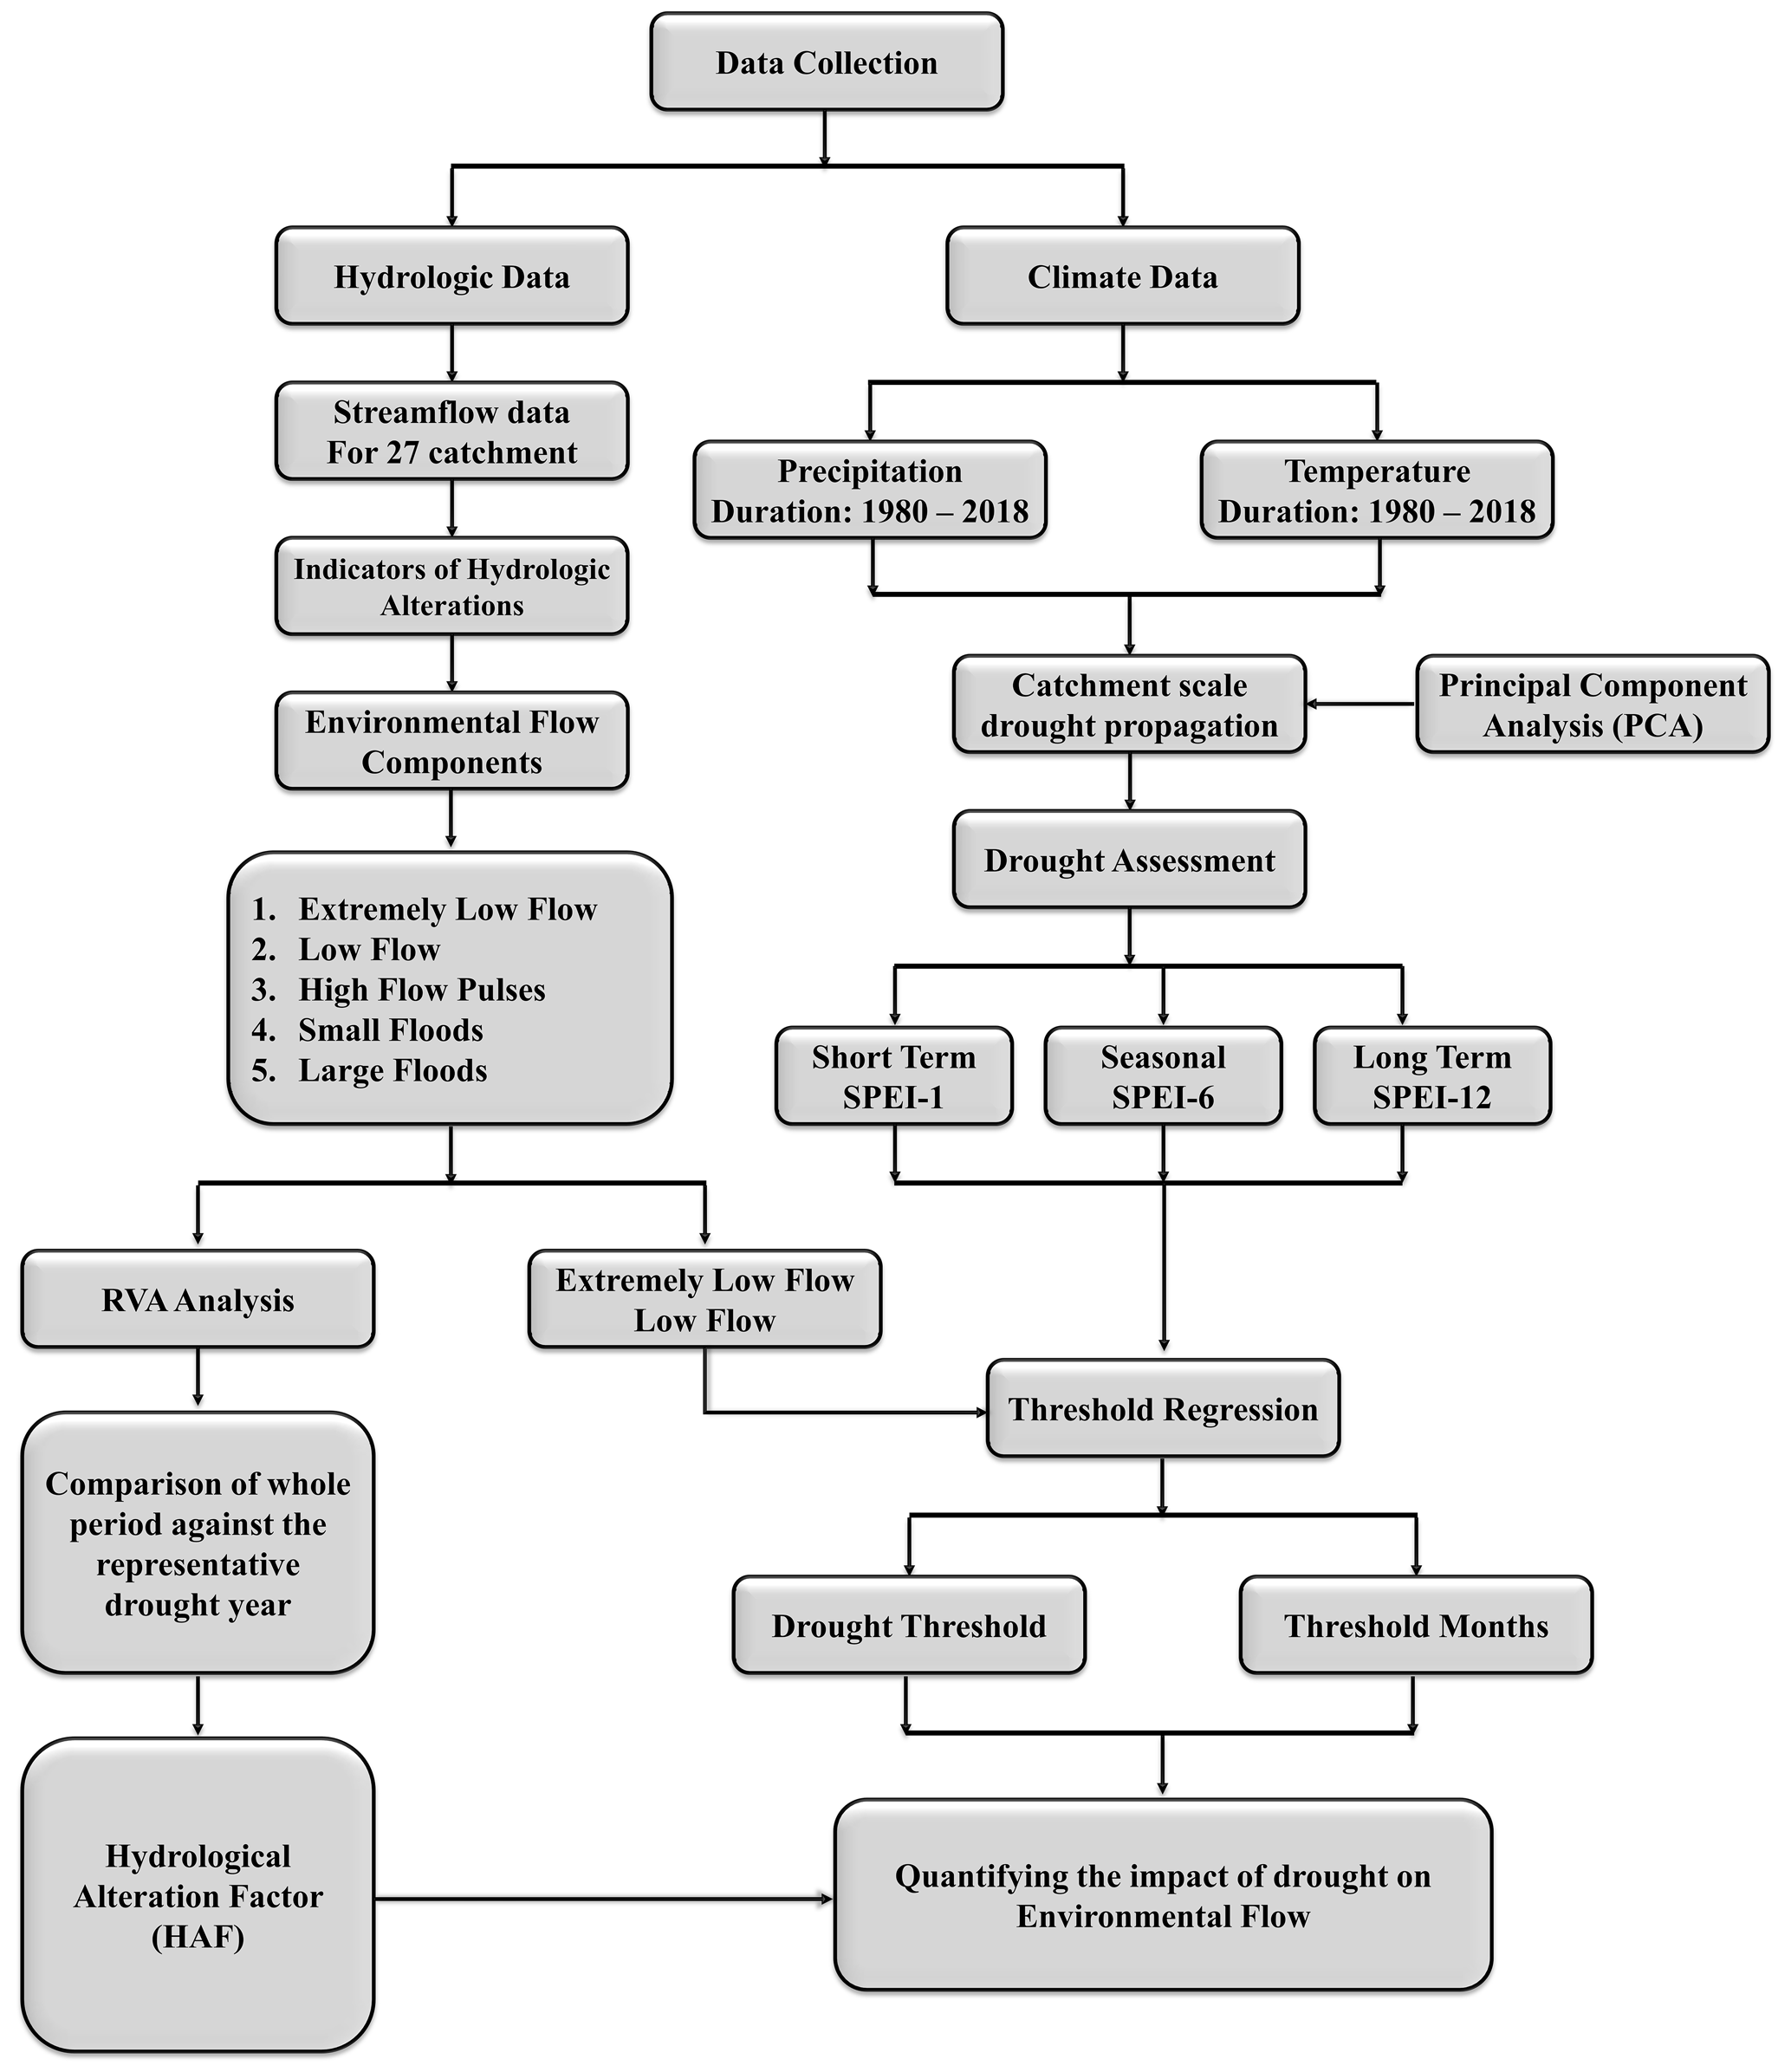
The schematic diagram of methods used in the current study is shown in Fig. 2. The methodology is broadly divided into two main categories, i.e. an estimation of EFCs and an assessment of the impact of drought on EF. The IHA consists of a total of 67 parameters, which are grouped into IHA parameters (33) and EFCs (34). The EFC parameters are grouped into five main EFC classes: (i) extremely low flow (ELF), (ii) low flow (LF), (iii) high-flow pulses, (iv) small floods, and (v) large floods (https://www.conservationgateway.org/Documents/IHAV7.pdf, last access: 17 October 2022). Of the five EFC classes, we focus on the first two classes only because the flow in rivers is minimal during the drought period, and it may threaten the survival of biodiversity and harm the ecosystem when the river flow decreases. On the other hand, drought is estimated using SPEI and systematically propagated from one catchment to a downstream one using PCA. Drought is assessed at three timescales, i.e. short term (1 month) using SPEI-1, seasonal (6 months) using SPEI-6, and long term (12 months) using SPEI-12. The impact of drought on ELF and LF is assessed using threshold regression. Threshold regression is used to identify the drought severity that triggers ELF and LF at the catchment scale. Moreover, the months of ELF and LF under the influence of drought are also assessed using threshold regression. Finally, RVAs are used to assess the impact of drought on EF in each catchment of the Indus Basin.
3.1 Datasets
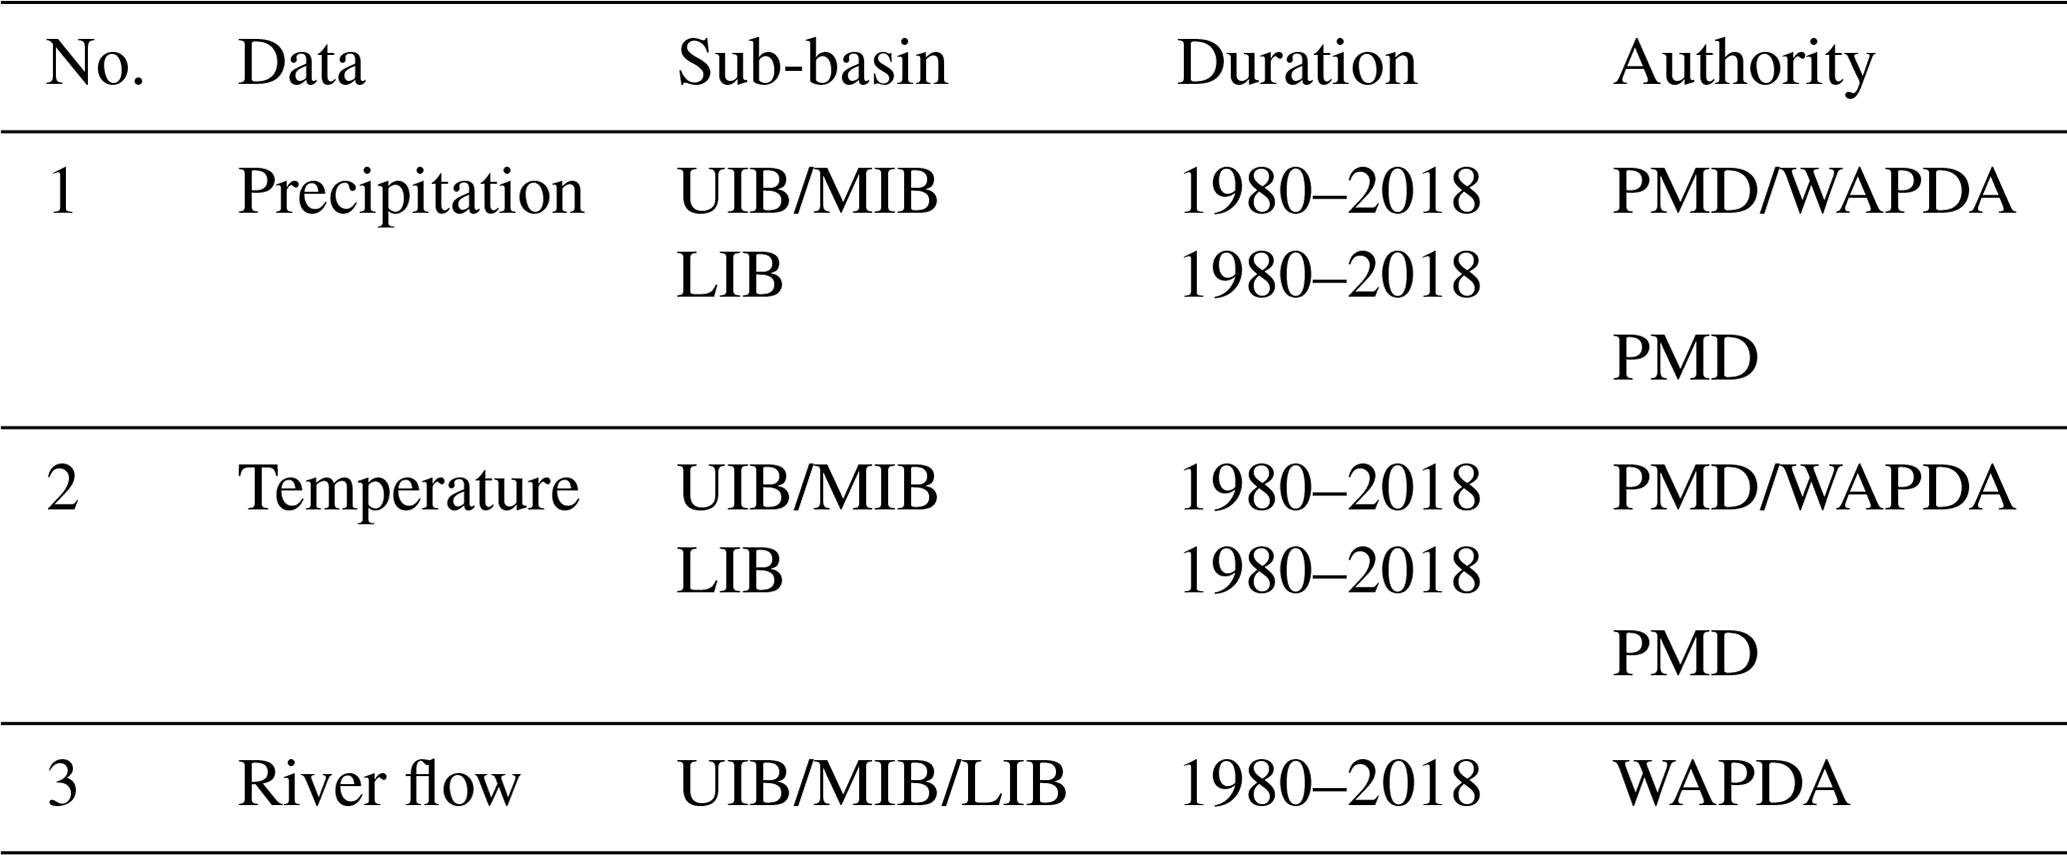
The temperature and precipitation data used to calculate drought (SPEI) at 79 climate stations and rain gauges (RGs) (Fig. 1) were acquired from the Pakistan Meteorology Department (PMD) and Water and Power Development Authority (WAPDA). A high proportion of data was acquired from PMD, i.e. 61 stations/RGs, while the remaining 18 stations were from WAPDA. Stations/RGs collected from WAPDA are operated under the Snow and Ice Hydrology Project (SIHP) and mostly located in the UIB and in the elevated regions of the MIB (Rahman et al., 2022). The river flow data at 27 flow stations are collected solely from WAPDA. After thoroughly analysing all the collected data (i.e. checking the date/years of available data at most of the in situ stations), a period from 1980–2018 is chosen to demonstrate the drought impact on EF where all the in situ stations have data with few or no missing values. However, few catchments have data for shorter periods of time, e.g. the Indus River at the Shatial bridge (1984–2014), the Hunza catchment (1995–2018), and the Indus River at Tarbela (1983–2015). Detailed information about the data collected is given in Table 1.
Data in Pakistan (Indus Basin) are usually manually collected by PMD and WAPDA. Therefore, the collected data have several issues, including personal and instrumental errors; splashing error due to climate; and errors due to winds, topography, etc. These errors result in poor quality and missing data. Initial attempts have been made by PMD and WAPDA to rectify the data following the standard code of WMO-N issued by the World Meteorological Organization. Moreover, we have also performed data quality tests, including kurtosis and skewness methods, to check the data quality (Tables S1 and S2), and the missing data are filled in by zero-order methods following Rahman et al. (2020a).
3.2 Estimation and propagation of drought
The Indus Basin of Pakistan has a data scarcity issue, where RGs/stations are sparsely distributed and not enough to represent the local climate. Therefore, PCA is used to calculate the principal components of precipitation and temperature before the estimation of drought. In this study, we followed the procedure recommended by Rahman et al. (2023a) to systematically propagate drought from one catchment to another, i.e. from catchment 1 (Yugo) to catchment 27 (the Indus River at the Sehwan catchment). However, it was ensured that the maximum variance is retained in the principal components estimated from RGs/stations inside the particular catchment. This step helped us to retain the most information about the catchment while including the influence of surrounding catchments. Overall, the computed representative datasets (principal components) of precipitation and temperature have a linear combination that reflects original RGs/station data information.
Drought in this study is appraised using the most widely used SPEI (Vicente-Serrano et al., 2010), which is developed using the standardized precipitation index (SPI) algorithm proposed by McKee et al. (1993). The principal components of precipitation and temperature propagated from upstream to downstream of the Indus Basin are used to compute SPEI. Most of the studies recommended the application of SPEI because it uses both temperature and precipitation data to calculate water balance and estimate the surplus water (Liang et al., 2021; Liu et al., 2019; Rahman et al., 2023a). Furthermore, SPEI also considers the variations in climate by avoiding too many zeros in precipitation estimates that are true particularly across arid and hyper-arid regions (Wu and Qian, 2017), especially across the Indus Basin. Moreover, SPEI has better distribution fitting and thus better captures the drought severity (Stagge et al., 2015). Following Rahman et al. (2023a), log-logistic distribution is used to compute SPEI to better reflect drought at the catchment scale.
SPEI in this study is estimated at different timescales, i.e. SPEI-1, SPEI-6, and SPEI-12, representing short-term (1 month), seasonal (6 months), and long-term (12 months) drought events, respectively. The time period is selected based on the climatological and hydrological characteristics of the Indus Basin, as the river flows in the UIB and MIB are extremely seasonal and subjected to significant hydrological alterations (dam operation and water diversion to IBIS). The severity of SPEI generally ranges from −2 to 2, where the drought and wet events are represented by negative and positive SPEI values, respectively. However, this study uses a threshold value of SPEI<−1.0 to differentiate the drought impact period for RVAs. When the SPEI value is in the range of −1.0 to −1.5, −1.5 to −2.0, or less than −2.0, the drought event is classified as extreme drought, severe drought, or moderate drought (Table S3), respectively.
3.3 Indicators of hydrologic alterations (IHAs)
The Nature Conservancy has developed IHAs (http://www.nature.org/, last access: 17 October 2022), which have been successfully used to quantify the alterations in river flows (Lee et al., 2014; Rahman et al., 2020b; Richter et al., 1996). Assessing the hydrological alterations in river flows is extremely important for sustainable water resource management, quantifying anthropogenic impacts on river flow and associated ecology, and maintaining a healthy ecosystem (Hart and Breaker, 2019; Lytle and Poff, 2004; Poff and Zimmerman, 2010). IHAs are gaining more attention nowadays and have been used in several hydrological applications, including ecology, water resource management, assessing alterations in streamflow, and others (Lee et al., 2014; Mathews and Richter, 2007; Rahman et al., 2020b).
IHAs consist of a total of 67 parameters, categorized into two groups, i.e. hydrologic (33 parameters) and EFCs (34 parameters). IHAs characterize the inter- and intra-annual variations in river flows based on 33 hydrologic parameters following the five major flow regimes: (i) the magnitude of monthly flows, (ii) duration and magnitude of annual extreme flows, (iii) timing of extreme flows, (iv) duration and frequency of low- and high-flow pulses, and (v) frequency and magnitude of changes in flow (Mathews and Richter, 2007). IHAs categorize streamflow into several components, including low flows (where the streamflow values are less than or equal to the 25th percentile), moderate flows (where the streamflow values range between the 25th to 75th percentiles), and high flows (where the streamflow values are greater than the 75th percentile). Moreover, when the flow is less than the 10th percentile, we classified it as extremely low flow. The hydrologic parameters of IHAs are interconnected; i.e. these parameters are proposed based on ecological relevance between them, and they reflect human-induced alterations in river flows (Arthington et al., 2006; Olden and Poff, 2003). These alterations include dam operations, groundwater withdrawal, water diversions, and land use changes (Mathews and Richter, 2007). Further details about IHAs and its parameters can be found in Gao et al. (2009), the Nature Conservancy (http://www.nature.org, last access: 7 December 2022), and Richter et al. (1996). IHAs in this study are used to compute the EFCs, particularly the ELF and LF components in 27 catchments of the Indus Basin.
IHAs are calibrated using the advanced calibration option following the guidelines mentioned in the user manual. To calibrate IHAs, it is first ensured that IHAs provide a clear distinction between low flows (during the drought years) and high flows (major floods) by adjusting the EFC parameters. Since we are interested in assessing individual events (both high flows and low flows), the high- and low-flow thresholds were adjusted for individual flow peaks. Therefore, during the calibration process, IHA hydrographs were compared with major flood events across each catchment. After splitting the river flow into high-flow and low-flow peaks, the hydrograph is further calibrated for five major EFC classes by adjusting the small- and large-flood minimum peaks and extreme-low-flow thresholds.
3.4 Range of variability analysis (RVA)
Several methods have been proposed to assess the alterations in flow regimes. Among these methods, the RVA approach developed by Richter et al. (2003) and Richter et al. (1996) has been widely used to assess hydrological alterations (Pal and Sarda, 2021; Rahman et al., 2020b; Shiau and Wu, 2006; Zheng et al., 2021). RVA is incorporated into IHA software and is used when no or minimal ecological information is available to support the EF. RVA is used to develop the initial flow management goals for river flows, illustrating the linkage between river flow and ecosystem that would accrue over a certain time and flow targets (Richter et al., 1997; Richter et al., 2003). RVA is generally used to compare the pre-impact and post-impact periods to analyse the human-induced impact on river flow regimes (hydrologic alterations).
Major steps in implementing RVA include (i) characterizing the natural range of variability in hydrologic conditions, such as rate, magnitude, frequency, and duration; (ii) quantifying the degree of alterations; (iii) developing the hypothesis for the impact assessment; (iv) addressing the identified alterations based on the proposed hypothesis; and (v) implementing the designed ecosystem measures (Mathews and Richter, 2007). The hypothesis developed in this study is that drought significantly impacts the ELF and LF classes of EFCs. To investigate the impact of drought on EF in the current study, the whole period (1980–2018) is considered to be a pre-impact period (without differentiating between drought and wet events, which can also be considered to be normal flow years without focusing on specific drought years), while the specific drought years (i.e. years with average SPEI values of less than −1, also considered to be representative drought years as identified by Rahman et al., 2023a, b) are considered to be a post-impact period.
The hydrological alteration factor (HAF) is calculated based on the results of RVAs, i.e. comparing the whole period with drought years. HAF is used to demonstrate the vulnerability of EF to drought in all the catchments of the Indus Basin. The HAF range is divided into three main categories following Richter et al. (1997), including no alterations (0.00 < HAF < 0.33), moderate alterations (0.34 < HAF < 0.67), and high alterations (0.68 < HAF < 1.00). HAF is calculated using the following equation:
where observed frequency represents the years where a particular EFC falls in a specified range, e.g. between the 25th and 75th percentiles, during the drought years. The expected frequency is calculated as follows:
where P is the probability of the specified range of the EFC, i.e. 50 % for the range between the 25th and 75th percentiles, and Np represents the number of drought years.
3.5 Threshold regression
Threshold regression is a regression model that links the predictors with outcomes based on a threshold parameter, also known as a change point. Threshold regression provides a very interpretable and elegant way to model the non-linear relationship between the predictor and outcome (Hansen, 2011). The results from threshold regression are dependent on the threshold parameter; i.e. threshold regression can take different forms depending on the threshold parameter. Threshold regression differs from change-point analysis (Hansen, 2000; Yu, 2012), which is mostly applied to time series data and mainly detects the structural changes along the natural axis, e.g. time or space. There are several main reasons for selecting threshold regression over change-point analysis in this study. First, the threshold regression is capable of understanding the non-linear relationship between the threshold variables (drought and EF in our case), while the change-point analysis can be used to see the changing trend in time series data (for instance, we can only see the change point in drought or in EF) (Hansen, 2011). In change-point analyses, time series data are divided into successive sub-periods, where the relationship between outcome and predictors changes from one sub-period to another (Muggeo, 2008). Second, the threshold regression is more robust than the change-point analysis in dealing with the non-linear relationship between the variables and is comparable with other non-linear regression models (e.g. spline regression model). Third, the threshold regression has the potential to adapt any shape (explained by Fong et al., 2017) depending on the threshold variable and its threshold value. Further details about threshold regression can be found in Hansen (2011).
In this study, threshold regression is applied to study two different scenarios (1) to determine the drought severity (classified into different classes following the recommendations from McKee et al., 1993) that causes ELF and LF in different catchments of the Indus Basin and (2) to determine the months where drought has caused ELF and LF in the Indus Basin. Two different threshold parameters are considered to achieve the above two goals, i.e. drought severity (SPEI) and month (time):
where yt is the dependent variable (EFC), xt is a vector of the independent variables (time/month for scenario 1 and SPEI for scenario 2), zt is the threshold variable (SPEI for scenario 1 and time/month for scenario 2), εt is the independent and identically distributed (IID) error with a mean of 0 and variance of σ2, and β and δ are the coefficients of the corresponding variables.
Following the methodology shown in Fig. 2, the Results section is mainly divided into the time series assessment of drought, distribution of EFCs in selected catchments of the Indus Basin, quantification of the drought impact on EFCs (i.e. ELF and LF), and RVA to investigate the drought impact on the ELF and LF (alterations in river flow at catchment scale).
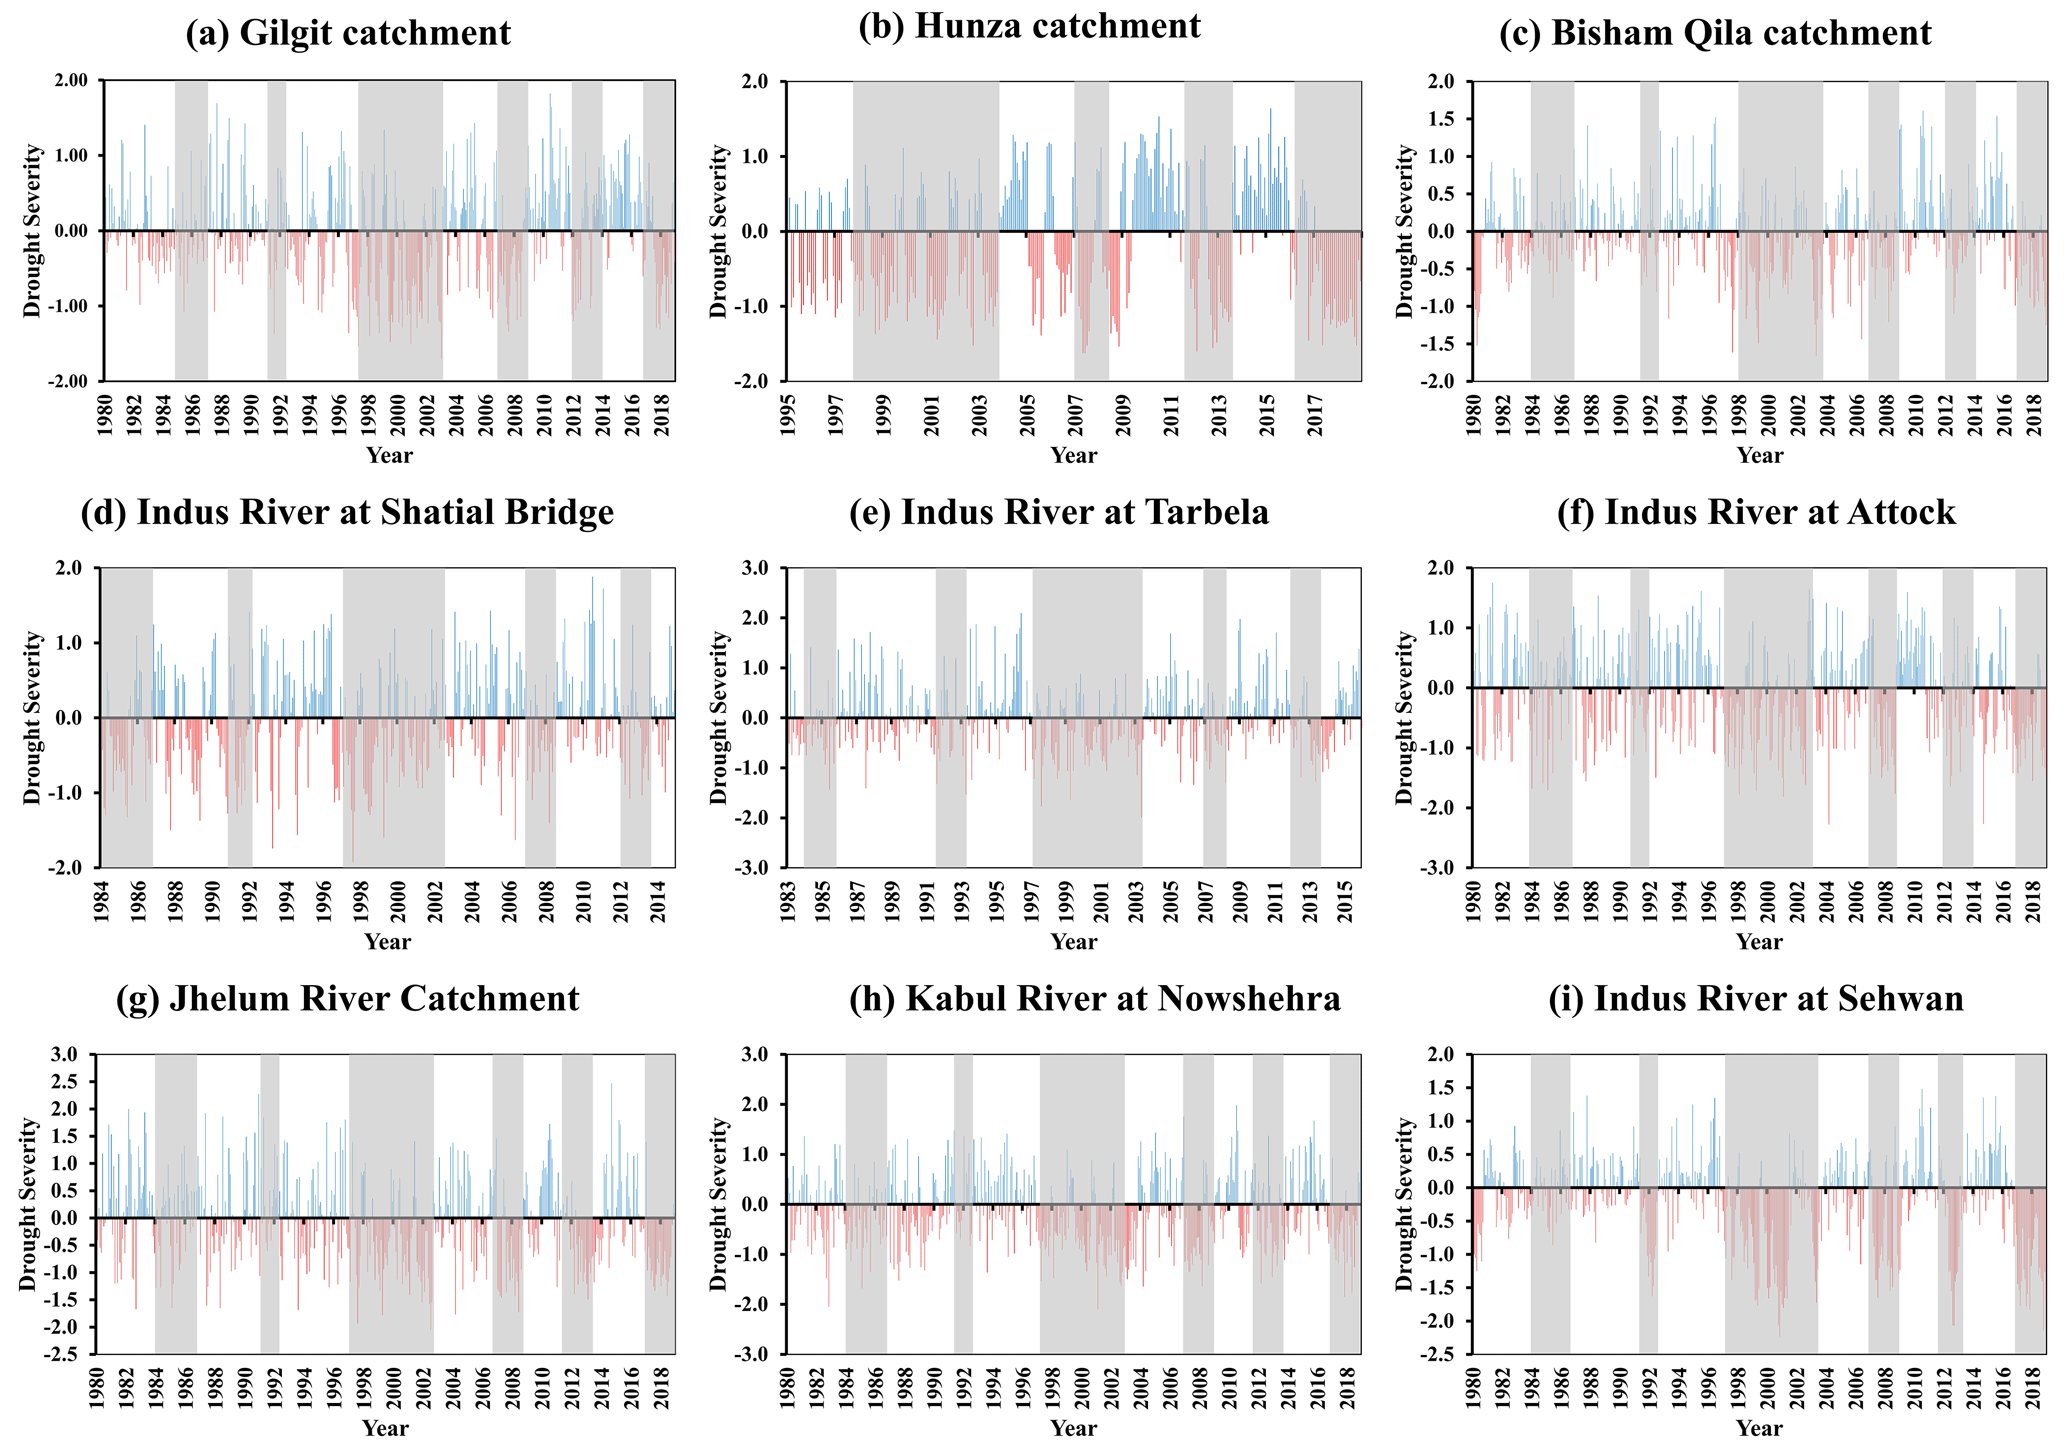
Figure 3Temporal variations in SPEI-1 across the representative catchments of the Indus Basin. Shaded portions represent major drought periods.
4.1 Evaluation of drought in representative catchments of the Indus Basin
The temporal variations in drought at short-term (SPEI-1), seasonal (SPEI-6), and long-term (SPEI-12) timescales in representative catchments of the Indus Basin are shown in Figs. 3–5, respectively. The selected representative catchments are the Gilgit, Hunza, and Indus rivers at Bisham Qila and the Shatial bridge in the UIB; the Indus River at Tarbela (outflow), the Indus River at Attock, and the Jhelum and Kabul rivers at Nowshehra in the MIB; and the Indus River at Sehwan in the LIB. The temporal variations in SPEI-1 (Fig. 3) show that catchments in the Indus Basin were vulnerable to drought in 1986, 1991, 1997–2003, 2007–2008, 2012–2013, and 2017–2018. However, no consistent drought trend is observed in SPEI-1 because of its relatively short duration. The numbers of extreme, severe, and moderate drought events in the UIB are 11, 54, and 202 out of 468 months. Similarly, the extreme, severe, and moderate drought events in the MIB (LIB) are 5 (27), 40 (63), and 181 (199), respectively. Overall, the severity and frequency of drought events are the highest in the LIB, followed by the UIB and MIB.
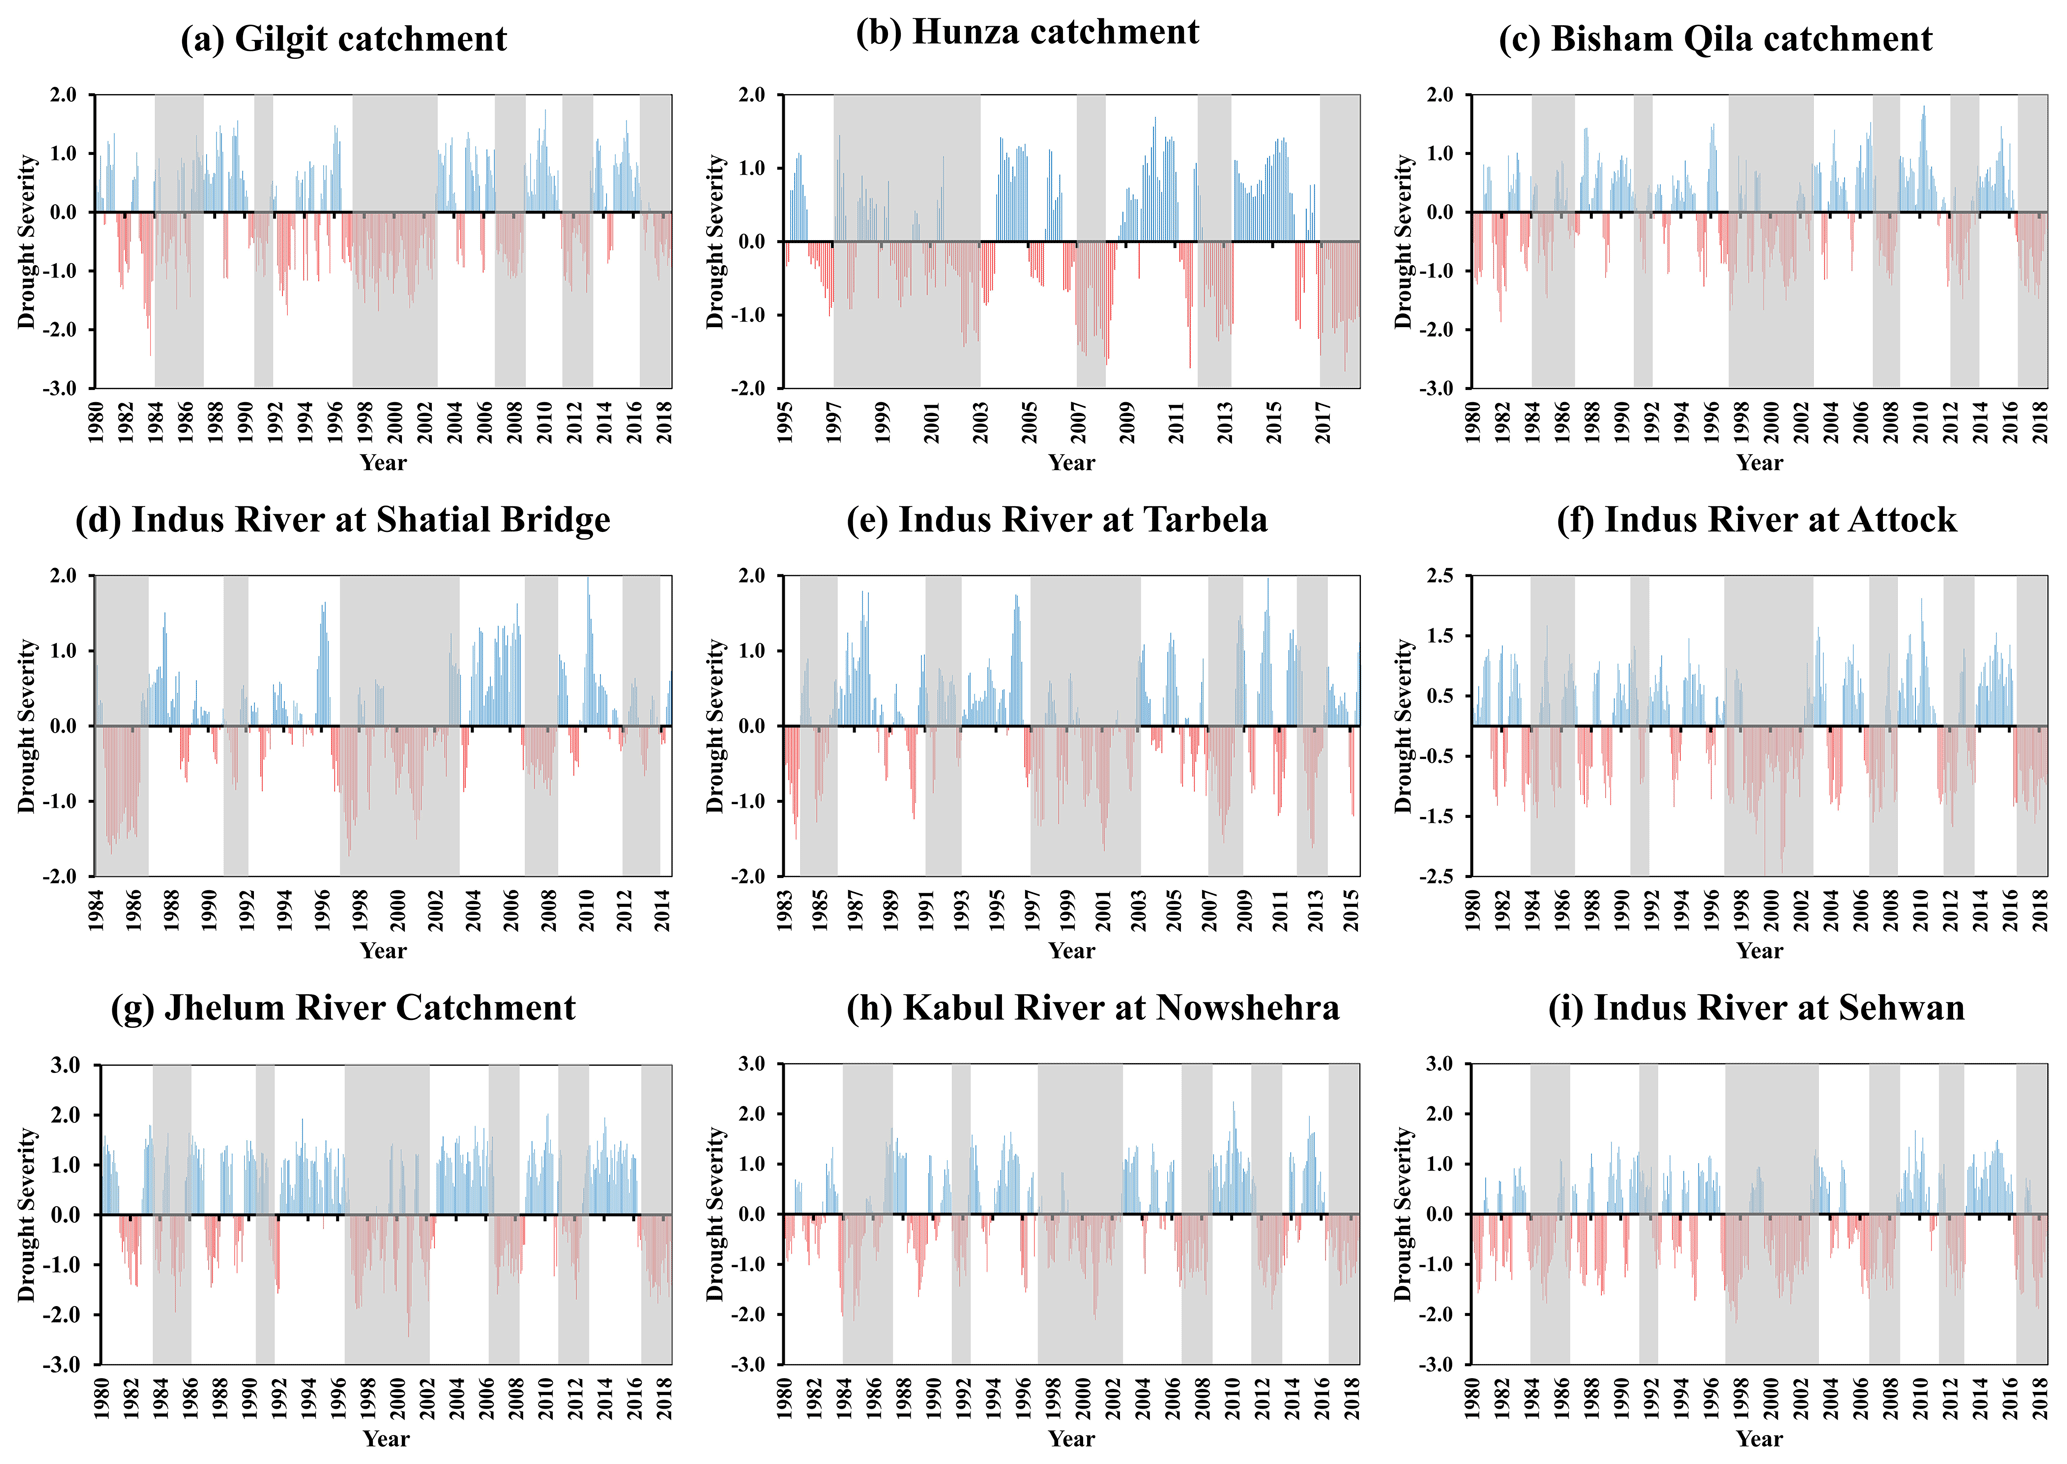
Figure 4Temporal variations in SPEI-6 across the representative catchments of the Indus Basin.
The temporal variation in SPEI-6 in the representative catchments of the Indus Basin is shown in Fig. 4. The vulnerable drought years at a 6-month timescale are 1984–1986, 1991/1992, 1997–2003, 2007–2008, 2012–2013, and 2017–2018 (highlighted in the shaded portion). SPEI-6 follows a similar trend to that of SPEI-1; i.e. the frequency and severity of drought events are the highest in the LIB, followed by the UIB and MIB. Drought severity is high in the Indus River at the Sehwan catchment and in Kabul River at Nowshehra. The highest number of extreme events is in the LIB, followed by the UIB sub-basins of the Indus Basin. For instance, there are 36 (15), 98 (67), and 170 (141) events of extreme, severe, and moderate droughts in the LIB (UIB), respectively. However, the number significantly decreases to 9 (extreme), 55 (severe), and 150 (moderate) in the MIB.
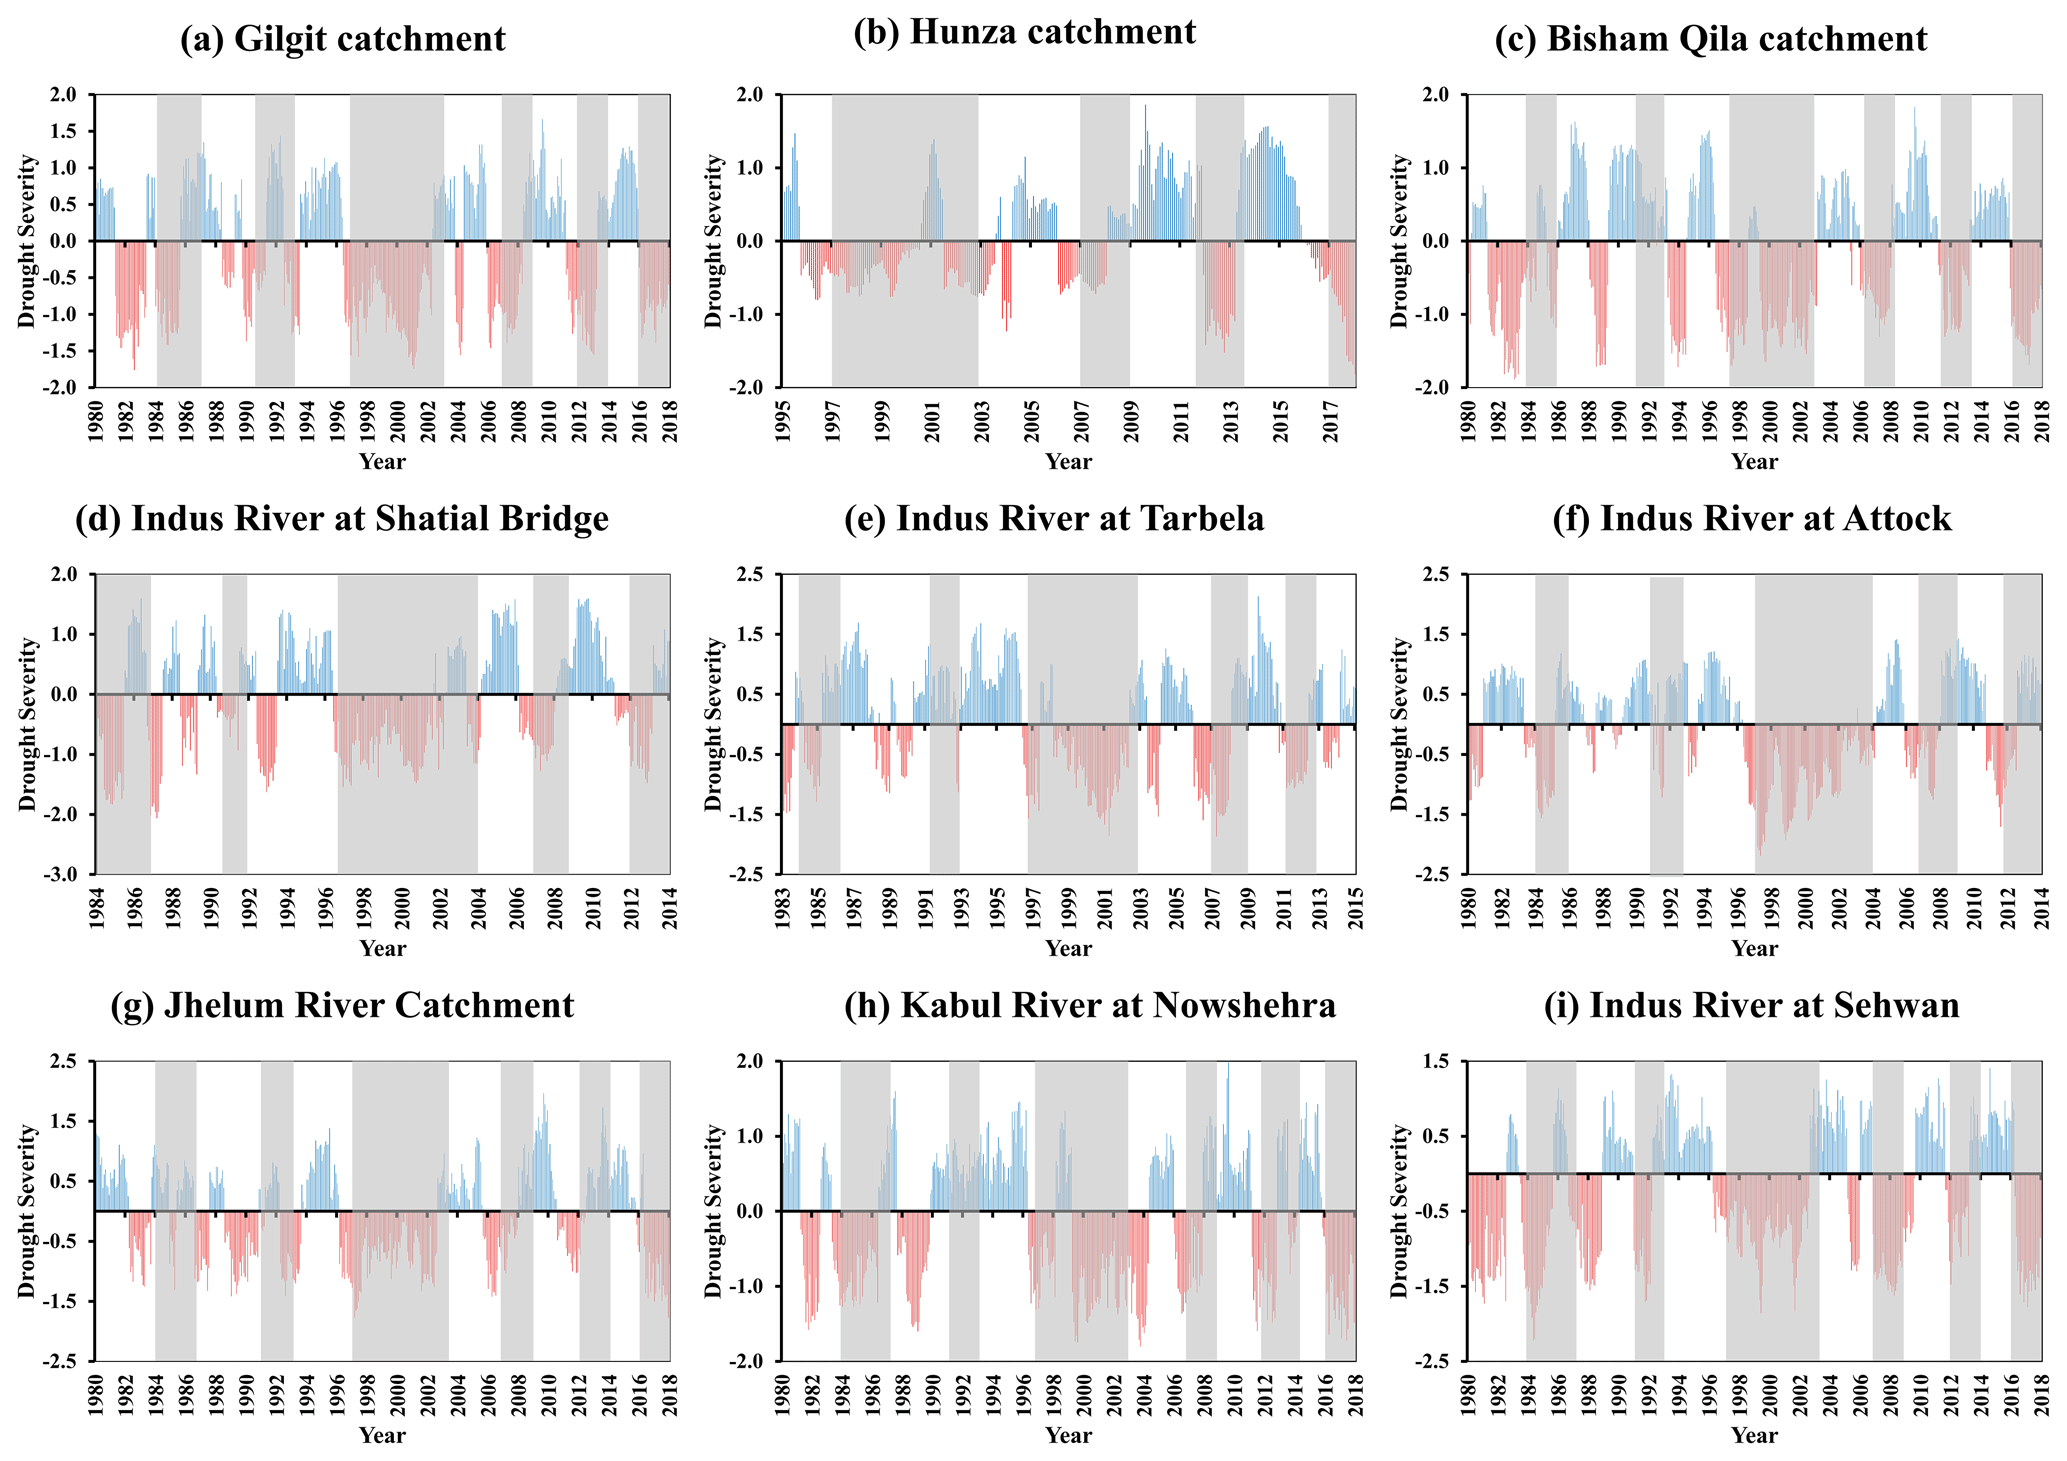
Figure 5Temporal variations in SPEI-12 across the representative catchments of the Indus Basin.
The drought and wet periods are more apparent on a 12-month timescale than a 6- and 1-month timescale (Fig. 5). SPEI-12 depicted the same drought period as SPEI-6, where catchments in the Indus Basin were more vulnerable to drought during 1984–1986, 1991/1992, 1997–2003, 2007–2008, 2012–2013, and 2017–2018. The figure shows that the Gilgit and Indus rivers at the Bisham Qila catchments are more vulnerable to frequent and severe drought events compared with other catchments in the UIB. The severity and frequency of drought increase from the MIB to LIB, which is more evident across Kabul River at the Nowshehra catchment and the Indus River at the Sehwan catchment. These catchments showed high vulnerability to drought due to their arid and hyper-arid climatic nature. The average number of extreme, severe, and moderate drought events decreases from the UIB (18, 77, and 144) to MIB (15, 68, and 117). However, the number of extreme, severe, and moderate drought events in the LIB are 44, 104, and 172, respectively.
The variability of and vulnerability to drought in each catchment are subjected to the topography and local climate of the catchment. For example, catchments in the UIB are comparatively less vulnerable to extreme and severe drought than in the LIB because of relatively more precipitation and lower temperature. More frequent severe and extreme droughts are observed in the LIB, which is characterized by high temperature (up to 50 °C in summer) and low precipitation (annual average below 100 mm) (Dimri et al., 2015; Rahman et al., 2022). The MIB, being a humid region, is less vulnerable to drought compared to the UIB and LIB, where the precipitation is high; i.e. precipitation is more than 700 mm during the monsoon season (the annual precipitation ranges from 300 mm in the south to 800 mm in the north and northeast of the humid region), and PET is comparatively less. However, it is worth mentioning that this study did not consider the entire hyper-arid region, and drought is propagated from the UIB to LIB using PCA; thus, the drought severity is comparatively lower. The results from this study are consistent with previous studies, including Adnan et al. (2017) and Rahman et al. (2021), who reported 1997–2003, 2007–2008, 2012–2013, and 2017–2018 as being the major drought years. These studies also reported that drought is more severe in the arid and hyper-arid regions compared to the humid and sub-humid regions (MIB) of the Indus Basin.
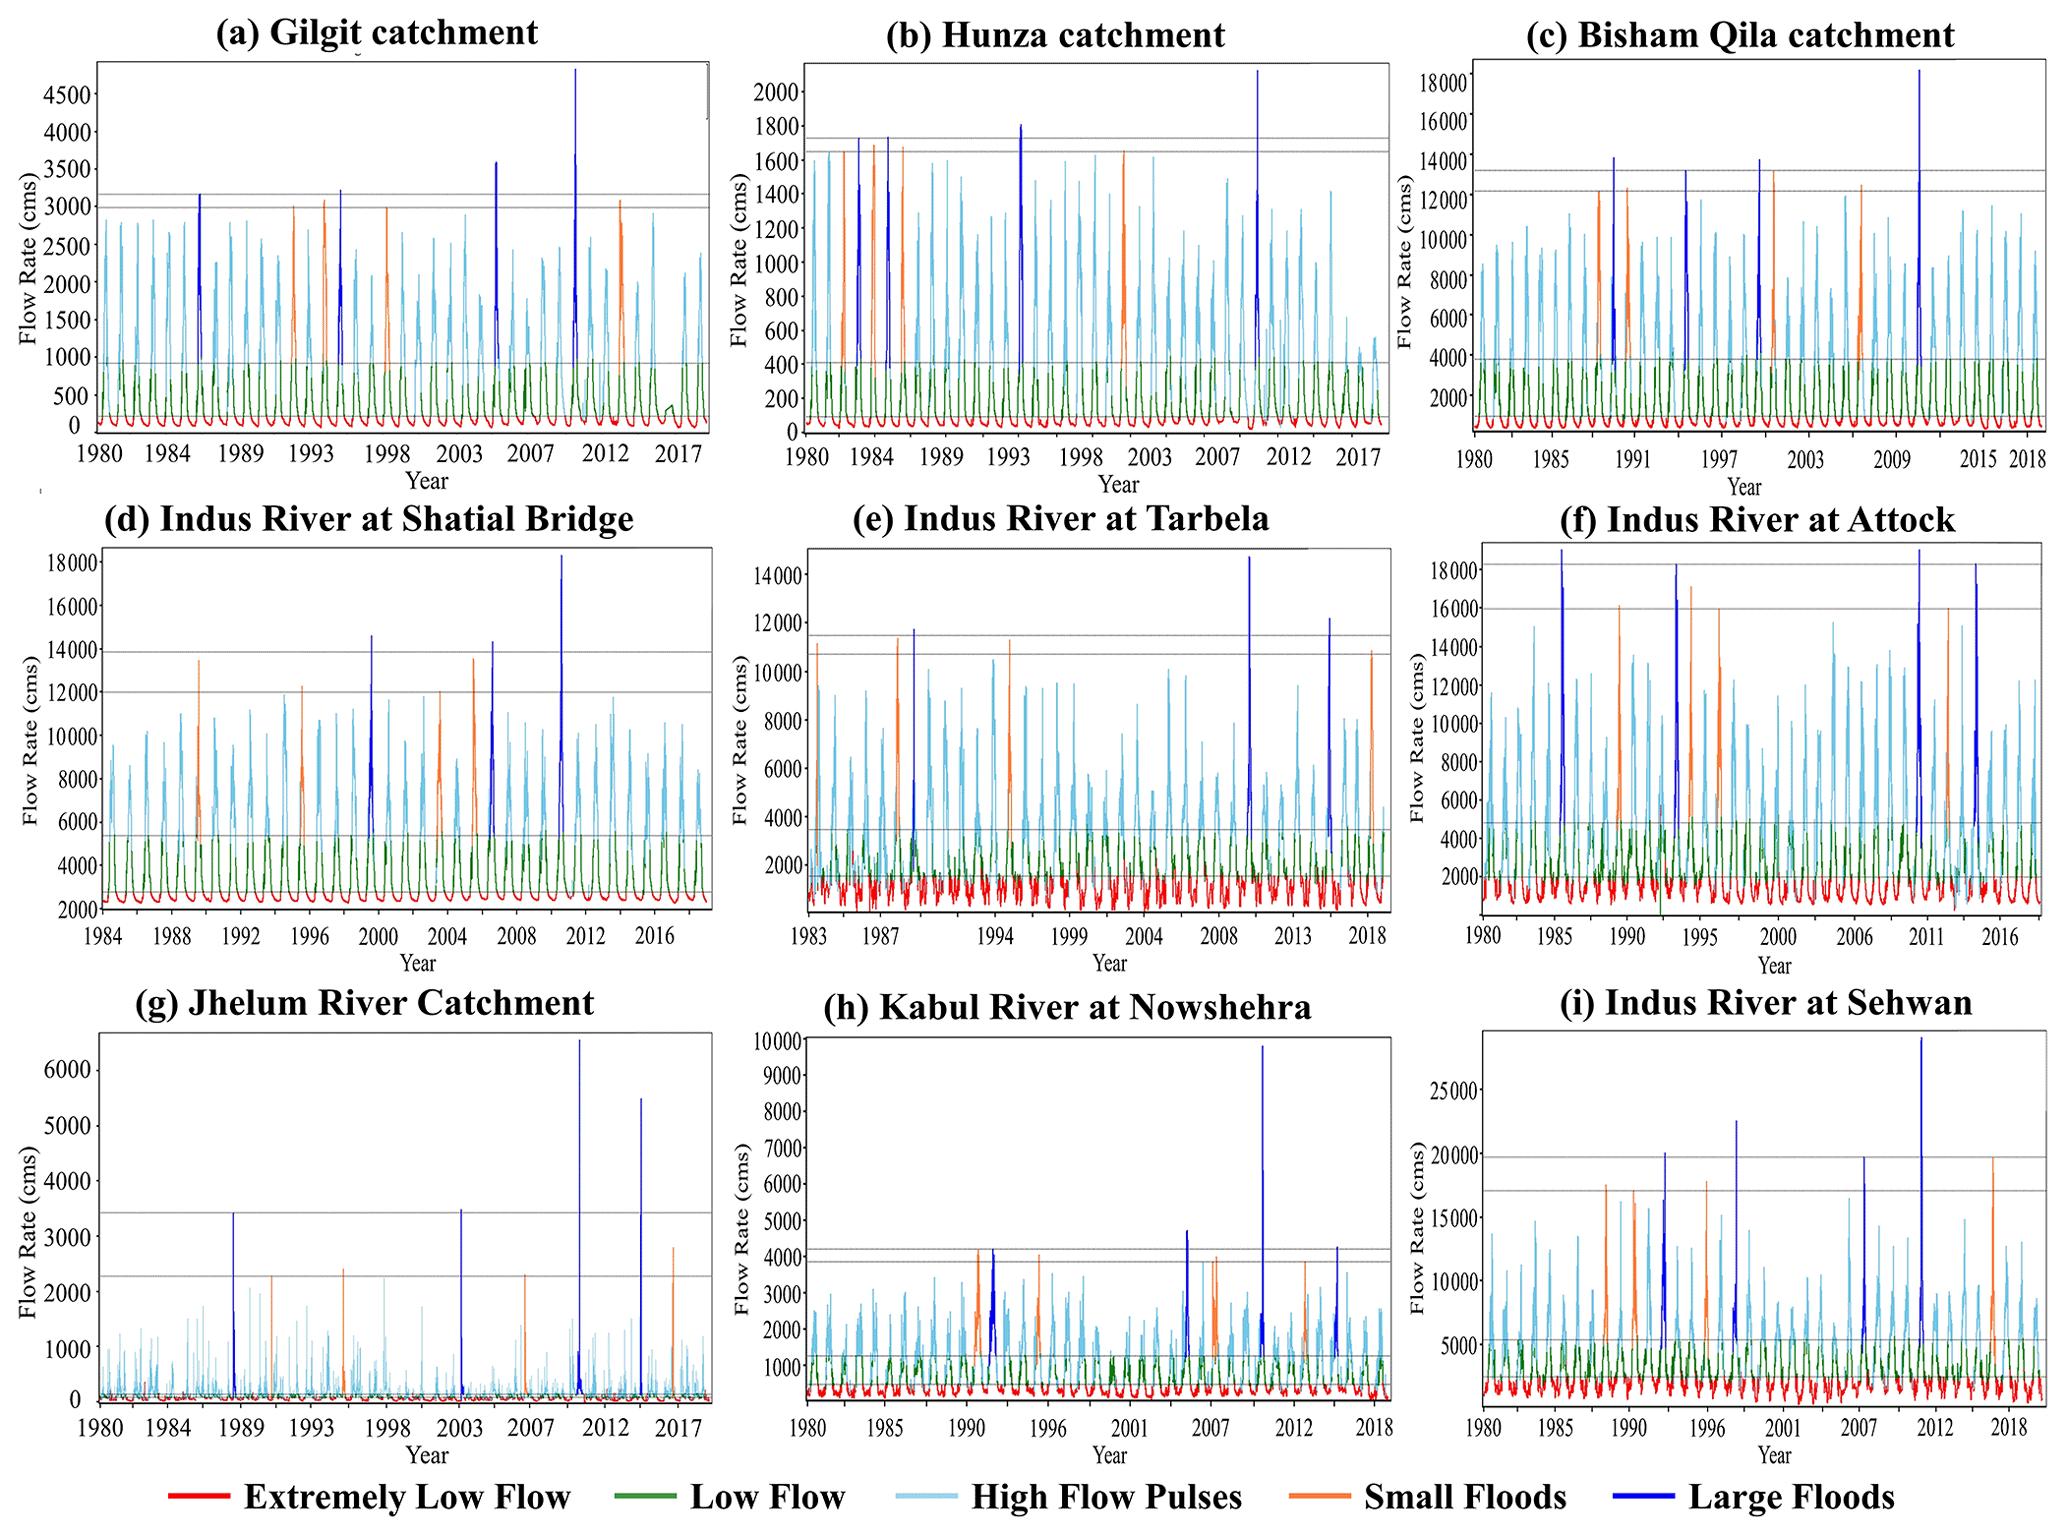
4.2 Environmental flow components (EFCs) of the Indus Basin
EFCs for the representative catchments of the Indus Basin are shown in Fig. 6, where EFCs are mainly divided into ELF, LF, high-flow pulses, small floods, and large floods. All the catchments show a significant reduction in the magnitude of river flow during the drought years. For instance, flow reduction is clearly visible in 1986, 1991, 1998–2002 (except for a few catchments in the UIB), 2007–2008, and 2017–2018. The magnitude of ELF and LF is comparatively low in the UIB, which increases in magnitude towards the MIB (Indus River at Tarbela and Attock and Kabul River at the Nowshehra catchment) and LIB (Indus River at Sehwan). The Jhelum River catchment is located in a humid region that experienced large flood events in 2010 and 2014; therefore, the ELF and LF components of EFCs are comparatively low in magnitude. On the other hand, the transboundary river catchment (Kabul River at Nowshehra) and the Indus River at the Attock catchment have significant fluctuations in EFCs. Besides the transboundary river issues, climate plays a critical role in the fluctuation in EFCs across the Kabul River at the Nowshehra catchment. However, the Indus River at the Attock catchment is located beneath the Tarbela dam and depends on the flow from Tarbela dam; thus, it shows considerable fluctuations. A high magnitude of ELFs and LFs is observed in the LIB in the Indus River at the Sehwan catchment. Overall, the results showed that the magnitude and frequency of ELF and LF events increase with the severity of the drought, where most of the catchments show ELF and LF during drought years, especially from 1998–2003 and 2017–2018.
4.3 Assessing the impact of drought on environmental flow
Threshold regression is run under two different scenarios to quantify the impact of drought on EF. The first scenario is used to determine the severity of drought that can trigger the ELF and LF events in the river flow. The second scenario illustrates the months where the drought significantly alters the EF, i.e. months where consistent ELF and LF events are observed. In the first scenario, SPEI (1 month, 6 months, and 12 months) is considered the threshold variable, while time (month) is considered the threshold variable in the second scenario.
4.3.1 Scenario 1: drought as a threshold variable
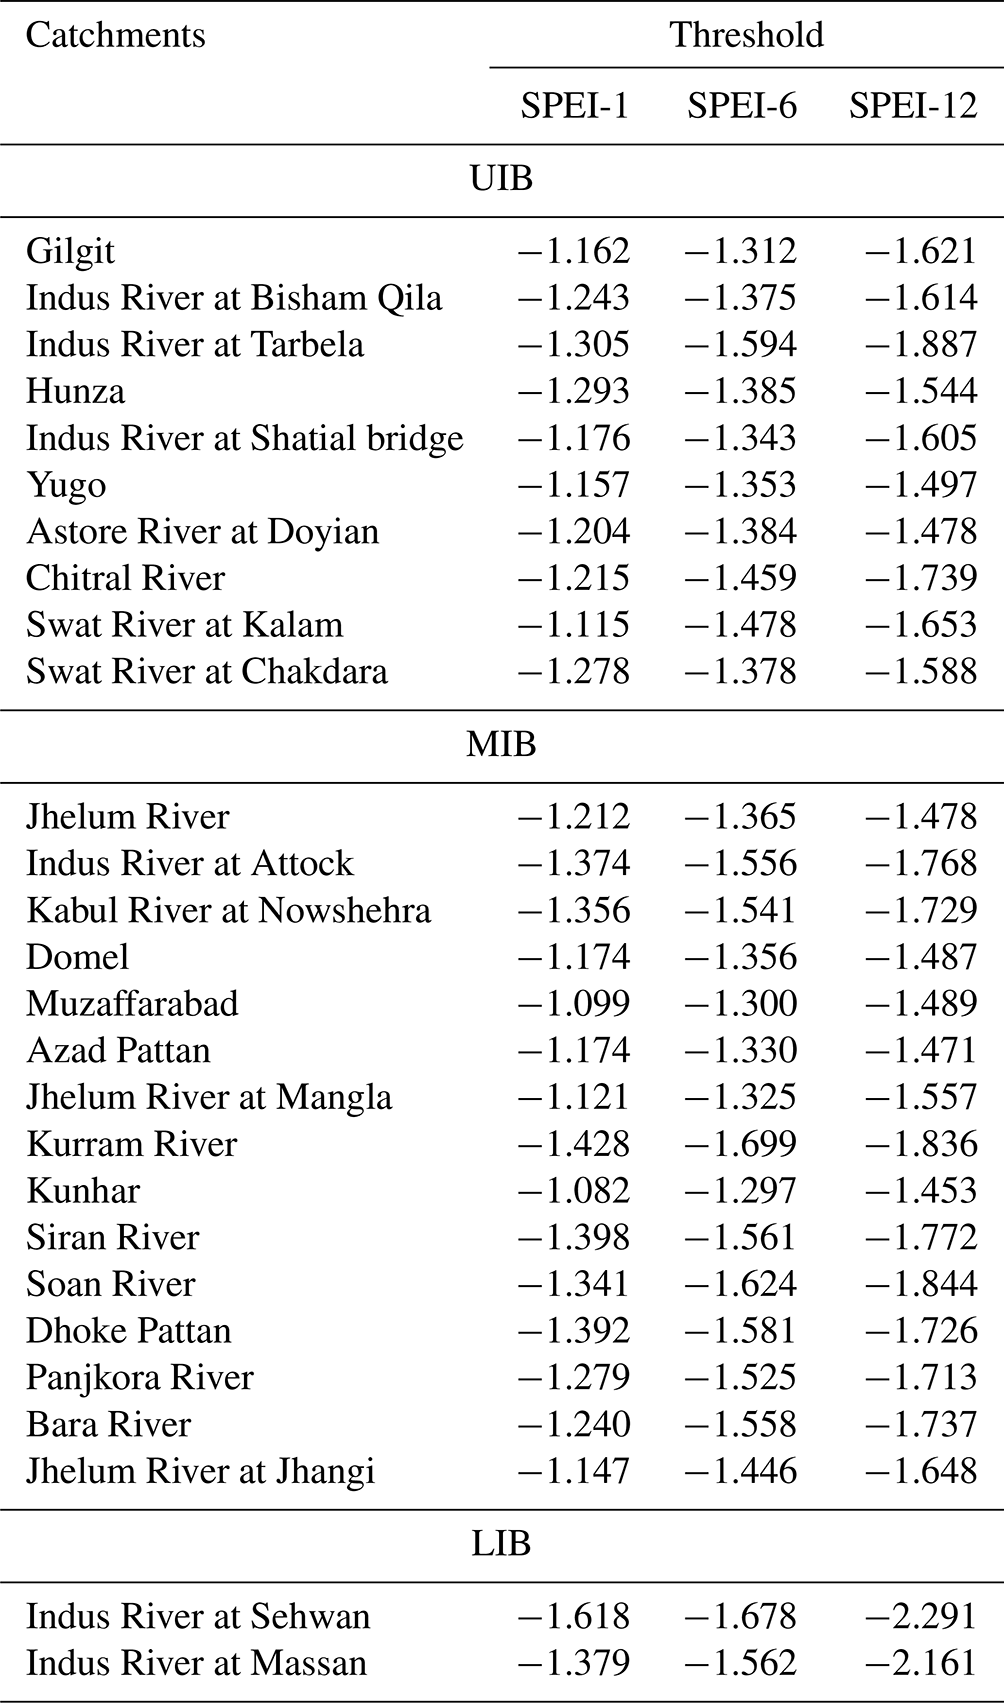
Table 2 shows the drought severity as a threshold for SPEI-1, SPEI-6, and SPEI-12 that causes ELF and LF events in the catchments of the Indus Basin. Most of the catchments in the UIB depicted moderate drought as a threshold for SPEI-1 and SPEI-6, while they depicted severe drought as a threshold for SPEI-12 (except for a few catchments). The results showed that the intensity of drought increases from SPEI-1 to SPEI-12 because the drought in the short term (SPEI-1) is not developed and evident (as shown in Fig. 3). In other words, frequent wet and moderate drought events are observed at a short timescale. Thus, most catchments show moderate drought as a threshold triggering ELF and LF. However, as the timescale increases to 6 and 12 months, i.e. where precipitation has accumulated for several months, the drought becomes more evident and consistent, and thus the severity of drought increases. Moreover, catchments in the extreme north and northeast, including the Yugo, Hunza, and Astore rivers at Doyian catchments, demonstrated moderate drought as a threshold causing ELF and LF in their respective rivers irrespective of the drought severity. The Indus River at Tarbela (the last catchment of the UIB) depicted changes in river flow at moderate (SPEI-1) and severe (SPEI-6 and SPEI-12) droughts. The threshold is relatively high for the Indus River at the Tarbela and Attock catchments, which might be influenced by anthropogenic activities, e.g. the Tarbela dam operation.
Table 2Threshold of drought severity that causes ELF and LF in the Indus Basin.
Catchments in the MIB depicted relatively mild drought severity that causes changes in river flow. Most of the catchments depicted moderate drought as a threshold that triggers ELF and LF events in rivers. This is especially true for eastern catchments of the MIB (e.g. Jhelum River, Domel, Kunhar, Muzaffarabad), which have a humid nature, and usually there is less drought compared to the western MIB, e.g. the Panjkora River, Bara River, and Kurram River. Furthermore, the catchment size also contributes to lower drought severity in these catchments. The northeastern catchments (catchments from nos. 8 to 16 shown in Fig. 1) are subjected to land use changes, transboundary river issues, water withdrawal for IBIS and other hydraulic structures, and other anthropogenic activities (Shahid and Rahman, 2021). Therefore, changes in river flow regimes across these catchments are more influenced by human-induced changes rather than climate change. Overall, the general trend in the MIB is that the threshold of drought severity triggering ELF and LF events increases with the timescale, i.e. from SPEI-1 to SPEI-12. Moreover, climate-induced activities also play a critical role in altering river flow regimes, e.g. particularly in the Bara River, Kurram River, Panjkora River, Swat River at Kalam and Chakdara, Kabul River at Nowshehra, Soan River, Siran River, and Jhelum River at Jhangi catchments (Rahman et al., 2023a).
Catchments in the LIB are more sensitive to drought, where severe and extreme drought events are frequently observed due to a smaller magnitude of precipitation and high temperature (Rahman et al., 2023a). Therefore, the Indus River at the Massan and Sehwan catchments depicted mostly severe and extreme drought severity as a threshold for ELF and LF in the LIB. Meanwhile, the threshold of drought severity increases from SPEI-1 towards SPEI-12.
Overall, the results showed a significant contribution of drought in changing river flow regimes across all the catchments of the Indus Basin. The threshold (drought severity) increases with the timescale (SPEI-1 to SPEI-12) and from the MIB to LIB. Most of the catchments depicted severe drought as a threshold that causes ELF and LF at SPEI-6 and SPEI-12. The catchments in the LIB demonstrated extreme drought as a threshold at SPEI-12 that triggers ELF and LF events in the Indus Basin.
Table 3Results of the threshold regression when time is used as the threshold variable, where the study duration is divided into different time periods and drought severity classes based on SPEI-1.
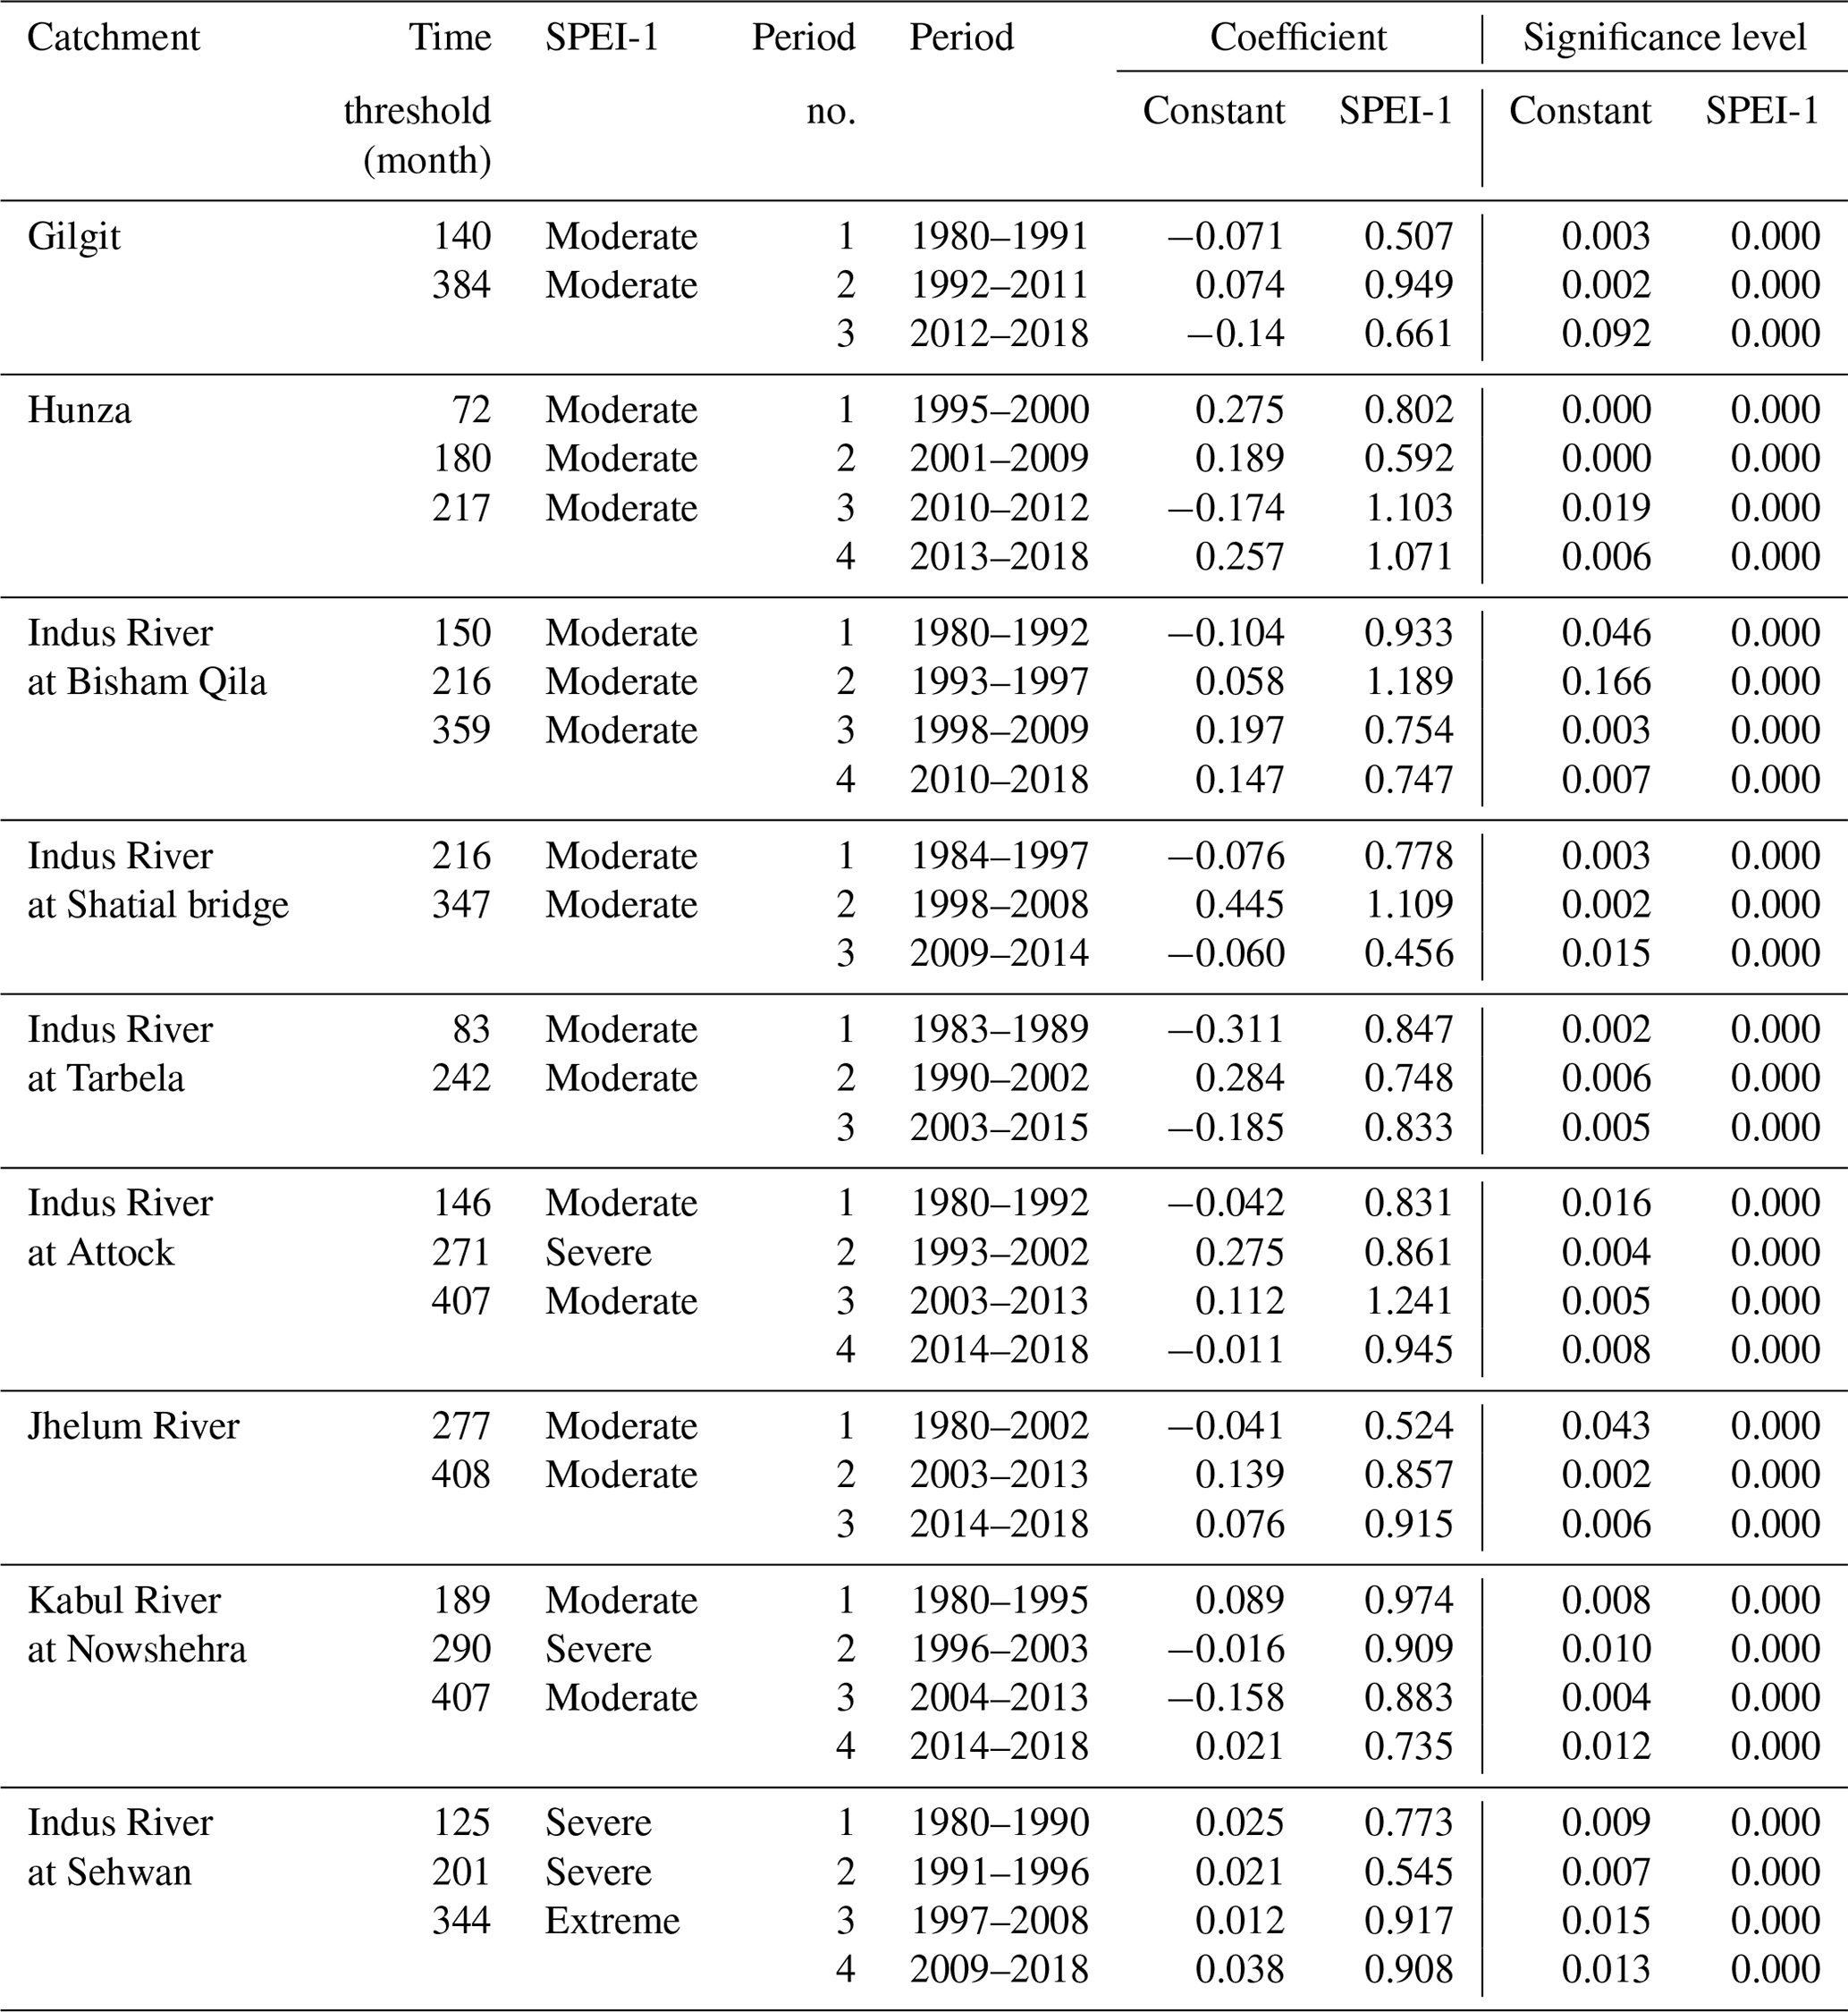
4.3.2 Scenario 2: time as a threshold variable
Time is selected as a threshold variable to analyse the different time periods and their associated drought severity (SPEI) as an independent variable. Each time period shows significant alterations where the river flows have almost similar characteristics within a particular time period, i.e. no significant alterations in flow regimes within each time period. Drought severity in Tables 3–5 represents the drought in a specific month, which separates one time period from another. Results for SPEI-1 across the selected catchments of the Indus Basin are shown in Table 3. Threshold regression has divided most of the catchments into four periods, where the drought severity differs from one time period to another and from catchment to catchment. Most of the catchments in the UIB depicted moderate drought as the drought severity, while the study duration (1980–2018) is divided into three (Gilgit, the Indus River at the Shatial bridge, and Tarbela catchments) and four (remaining basins of the UIB) time periods. The coefficient in Table 3 quantifies the impact of drought on EF. For instance, the coefficient in the Gilgit catchment shows that drought had a significant impact (0.949) on EF during the period of 1992–2011. During the mentioned period, the Indus Basin experienced frequent extreme drought events which impacted not only the surface water availability but also other sectors including agriculture (Rahman et al., 2023b). It should be noted that the coefficient of SPEI-1 varies significantly from one catchment to another and from one period to another due to significant variations in climatic and land use characteristics accompanied by frequent fluctuations in SPEI-1 estimates.
In contrast to other catchments in the MIB, the Indus River at the Attock catchment and Kabul River at the Nowshehra catchment depicted severe drought as a threshold for the periods of 1993–2002 and 1996–2003, respectively. The river flow to the Indus River at the Attock catchment depends on the outflow from Tarbela dam, where the outflow is extremely low during drought periods. Similarly, river flow in the Kabul River is influenced by transboundary river issues between Afghanistan and Pakistan along with regional climate (arid climatic nature). Therefore, these catchments demonstrated severe drought as a threshold, where severe drought was observed during 1998–2002 in the history of Pakistan. The remaining catchments depicted moderate drought as a threshold in different time periods. On the other hand, the Indus River at Sehwan catchments depicted severe drought as a threshold in period 1 and period 2 (1980–1990 and 1991–1996) and extreme drought in period 3 (1997–2008). Overall, the regression results of SPEI are significant at the 1 % levels in all the catchments.
Table 4Results of the threshold regression when time is used as the threshold variable, where the study duration is divided into different time periods and drought severity based on SPEI-6.
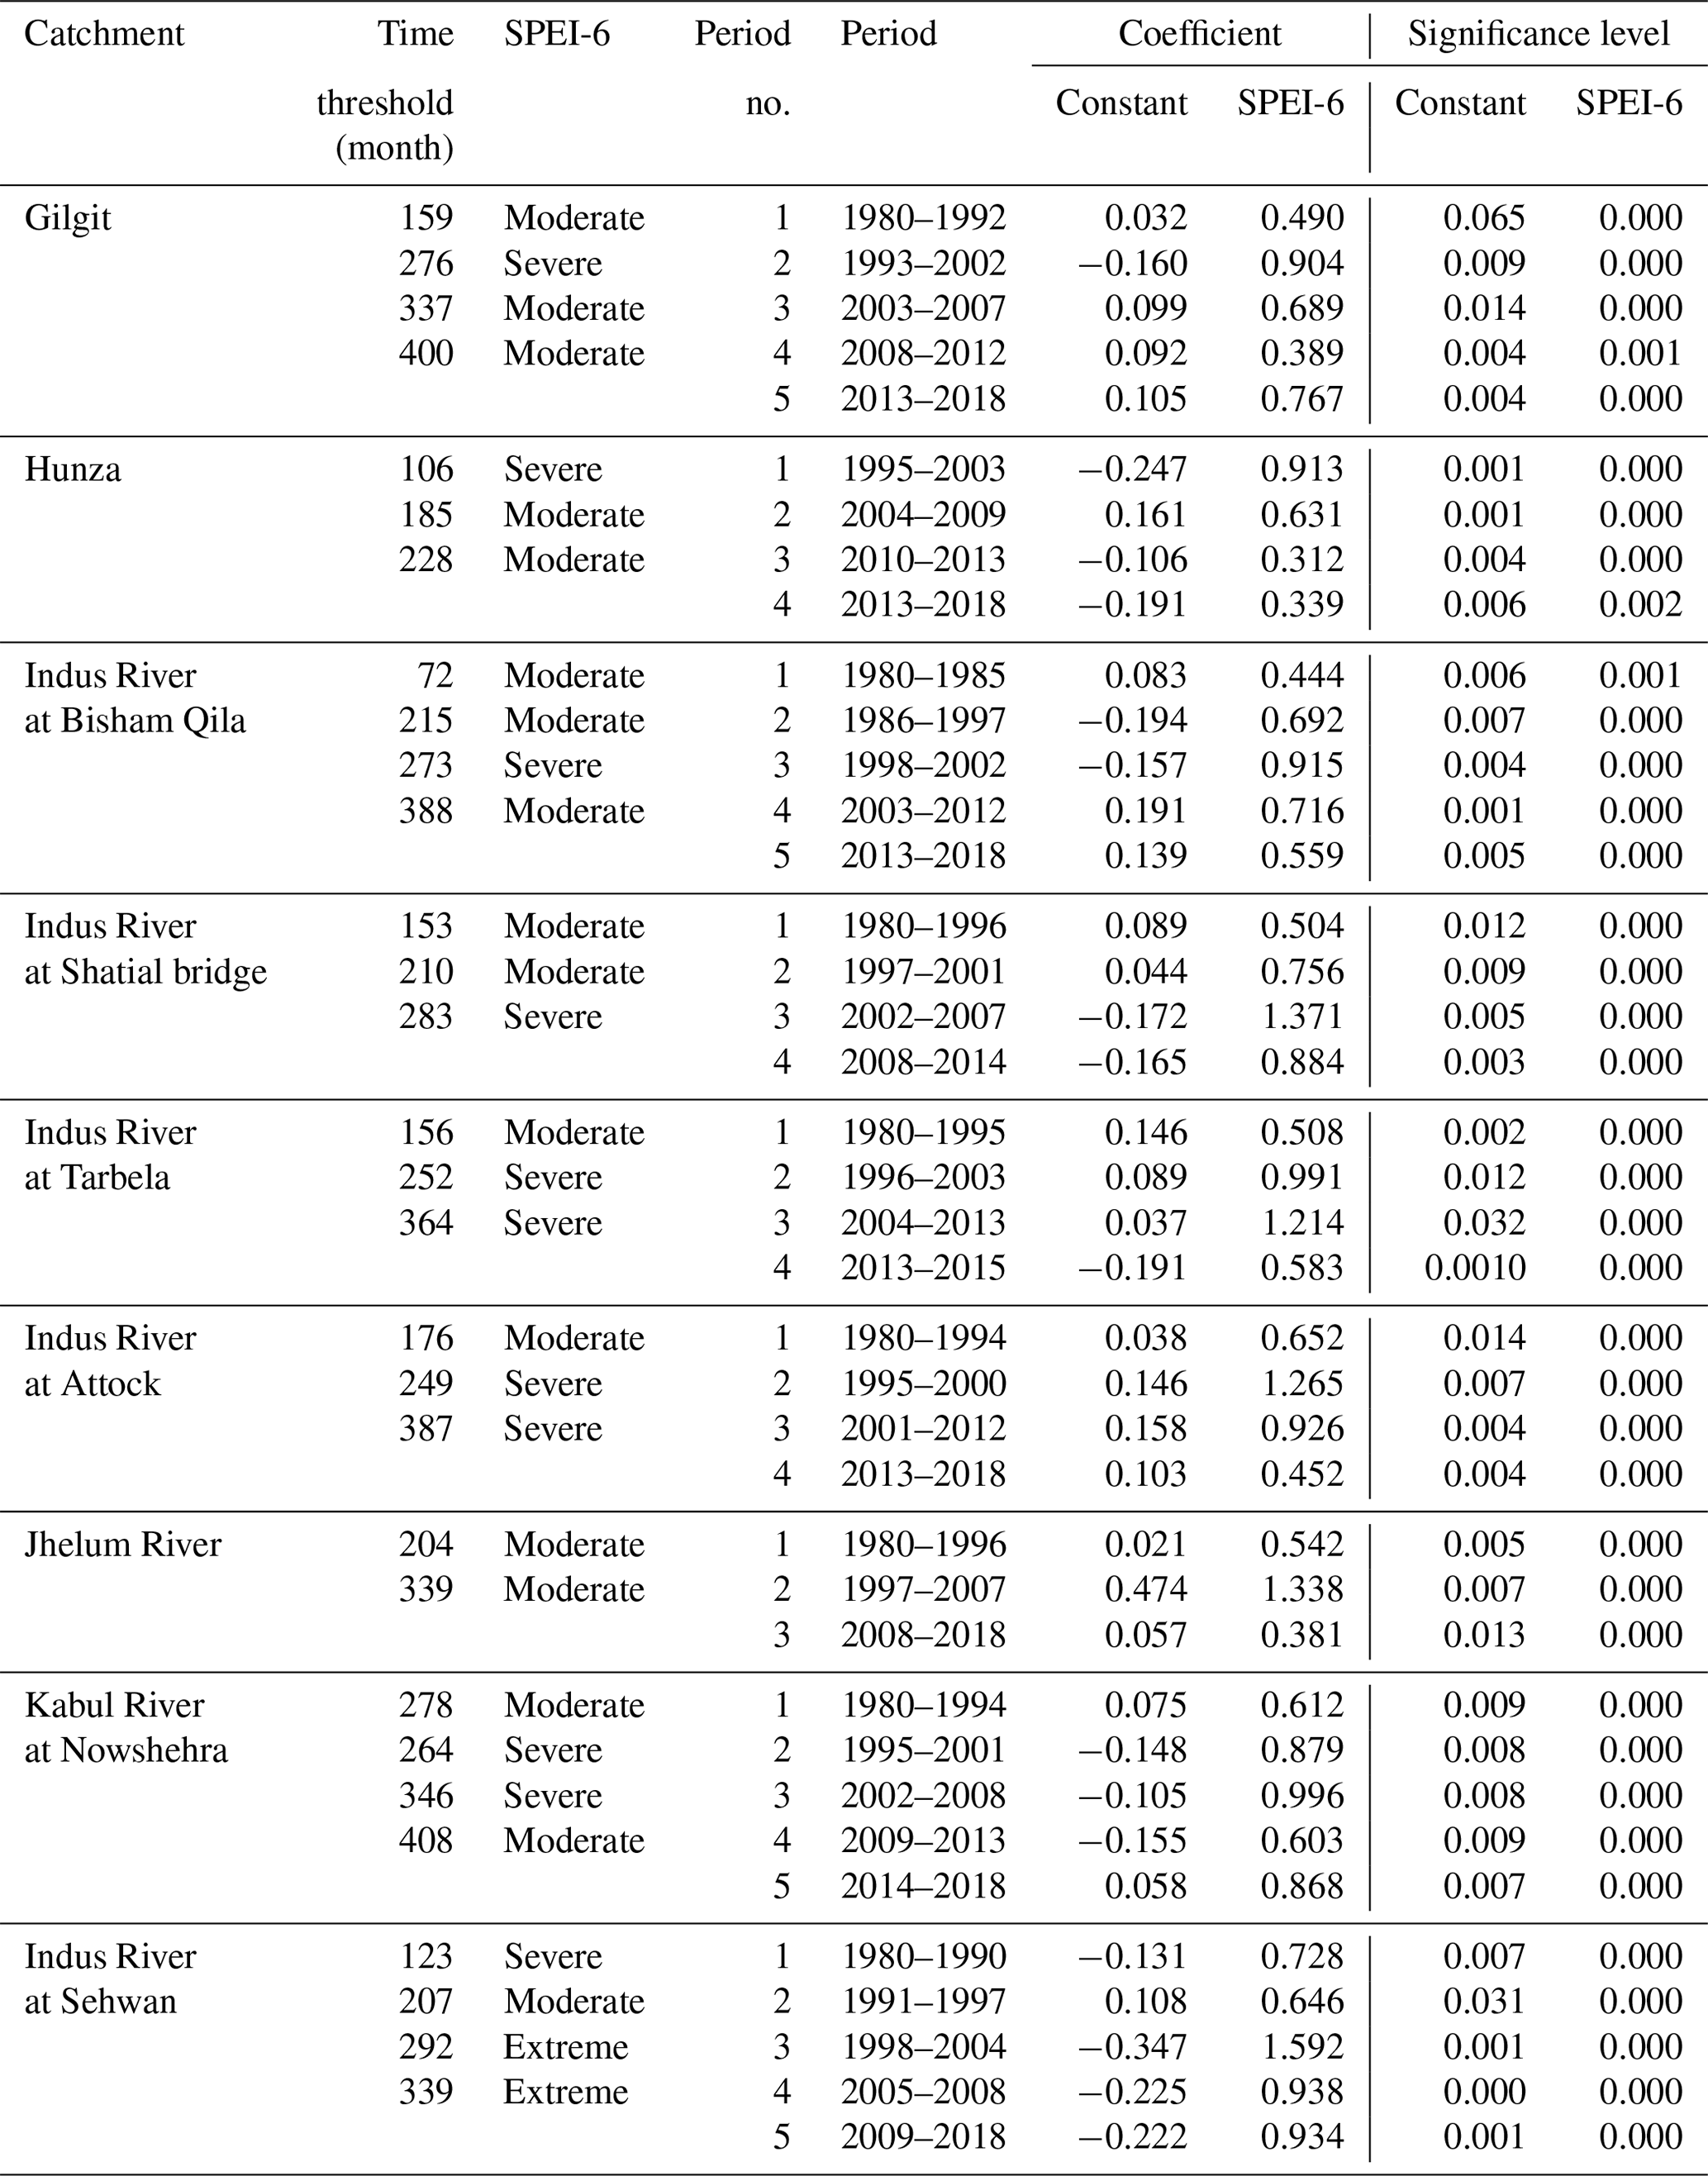
Table 4 shows the results for SPEI-6, where the study duration is divided into different time periods by considering time as a threshold variable. It should be noted that both the number of time periods and the drought severity have increased significantly for SPEI-6 compared with SPEI-1. For instance, the number of time periods for the Gilgit catchment is five in the case of SPEI-6 compared with three time periods in the case of SPEI-1. A similar increase in the number of time periods is observed for other catchments in the UIB, MIB, and LIB. In addition to the increase in the number of time periods, the drought severity also increases where a severe drought corresponding to the time threshold is observed in almost all the catchments of the UIB and MIB.
Catchments in the UIB depicted moderate drought across each individual time period as a threshold that separates one time period from another. The drought severity is the highest in the LIB among all the catchments of the Indus Basin, where the Indus River at the Sehwan and Massan catchments depicted severe/extreme drought as a threshold. Jhelum River in the MIB is divided into three distinct time periods where drought is of moderate severity. However, the Indus River at the Attock catchment (dependent on the outflow from Tarbela) and the Kabul River at the Nowshehra catchment (transboundary river catchment) depicted both moderate and severe drought as a threshold that divides the study duration into different time periods. Overall, the results show more severe or extreme drought as an indicator in the pronounced drought periods, e.g. 1998–2002, 2007–2008, and 2012–2013. Table 4 shows that the SPEI coefficients are significant at 1 % in all the catchments.
Table 5Results of the threshold regression when time is used as the threshold variable, where the study duration is divided into different time periods and drought severity based on SPEI-12.
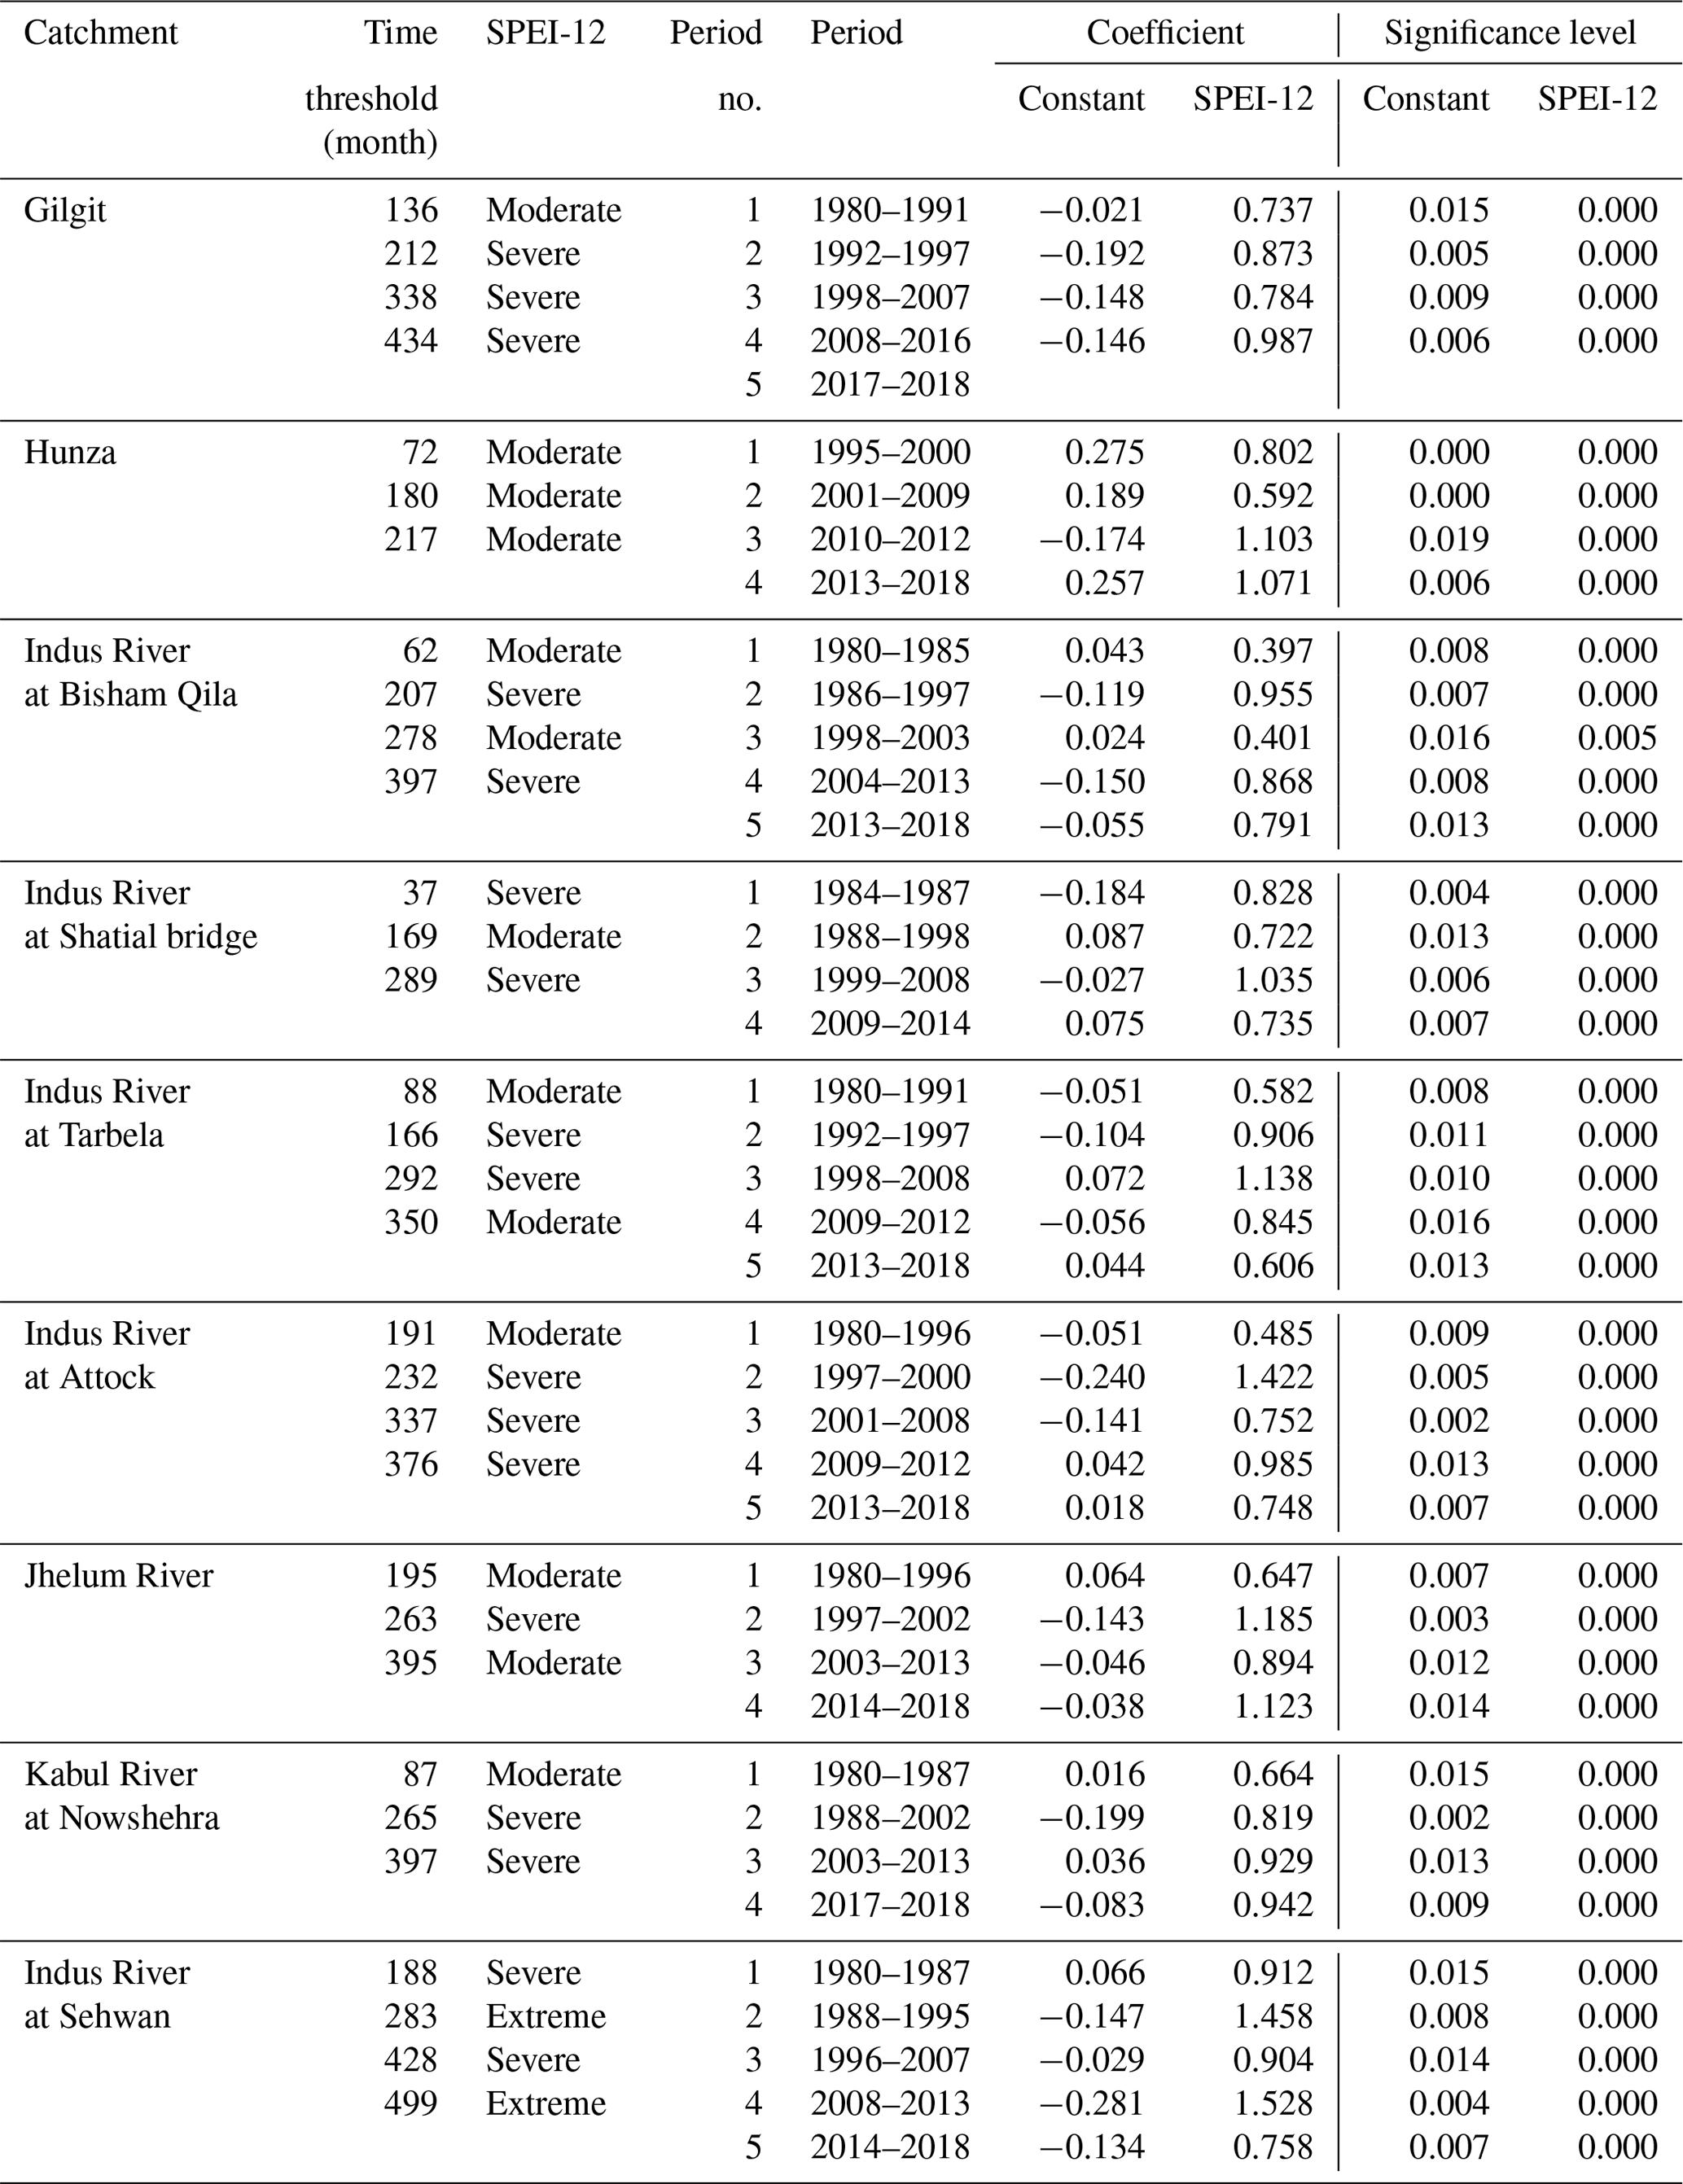
Table 5 represents the results for SPEI-12 where the study duration is divided into different time periods by considering time as a threshold variable. The results show that SPEI-12 has the same number of time periods as SPEI-6 (across most of the catchments); however, the drought severity is increased significantly compared with SPEI-6. Moreover, the results are significant at the significance level of 1 % for SPEI-12. Overall, the results show that catchments are vulnerable to severe and extreme drought events at SPEI-12 across the Indus Basin. For instance, the drought severity for catchments in the UIB and MIB increases from moderate drought to severe drought; however, the LIB depicted severe drought as a threshold that divides the study period into different time periods.
Generally, the results show that EF can be divided into different time periods, where drought severity varies from one time period to another and from SPEI-1 to SPEI-12. For instance, SPEI-1 showed moderate drought as a threshold that divided the study duration into different periods across different catchments. The drought severity increases to severe drought in most of the catchments when SPEI-12 is considered an independent variable. Moreover, the catchments in the MIB depicted relatively lower vulnerability to drought compared with those in the UIB and LIB. Besides the climate-induced impacts on river flow, anthropogenic activities and transboundary river issues further worsen the impact of climate on ELFs and LFs.
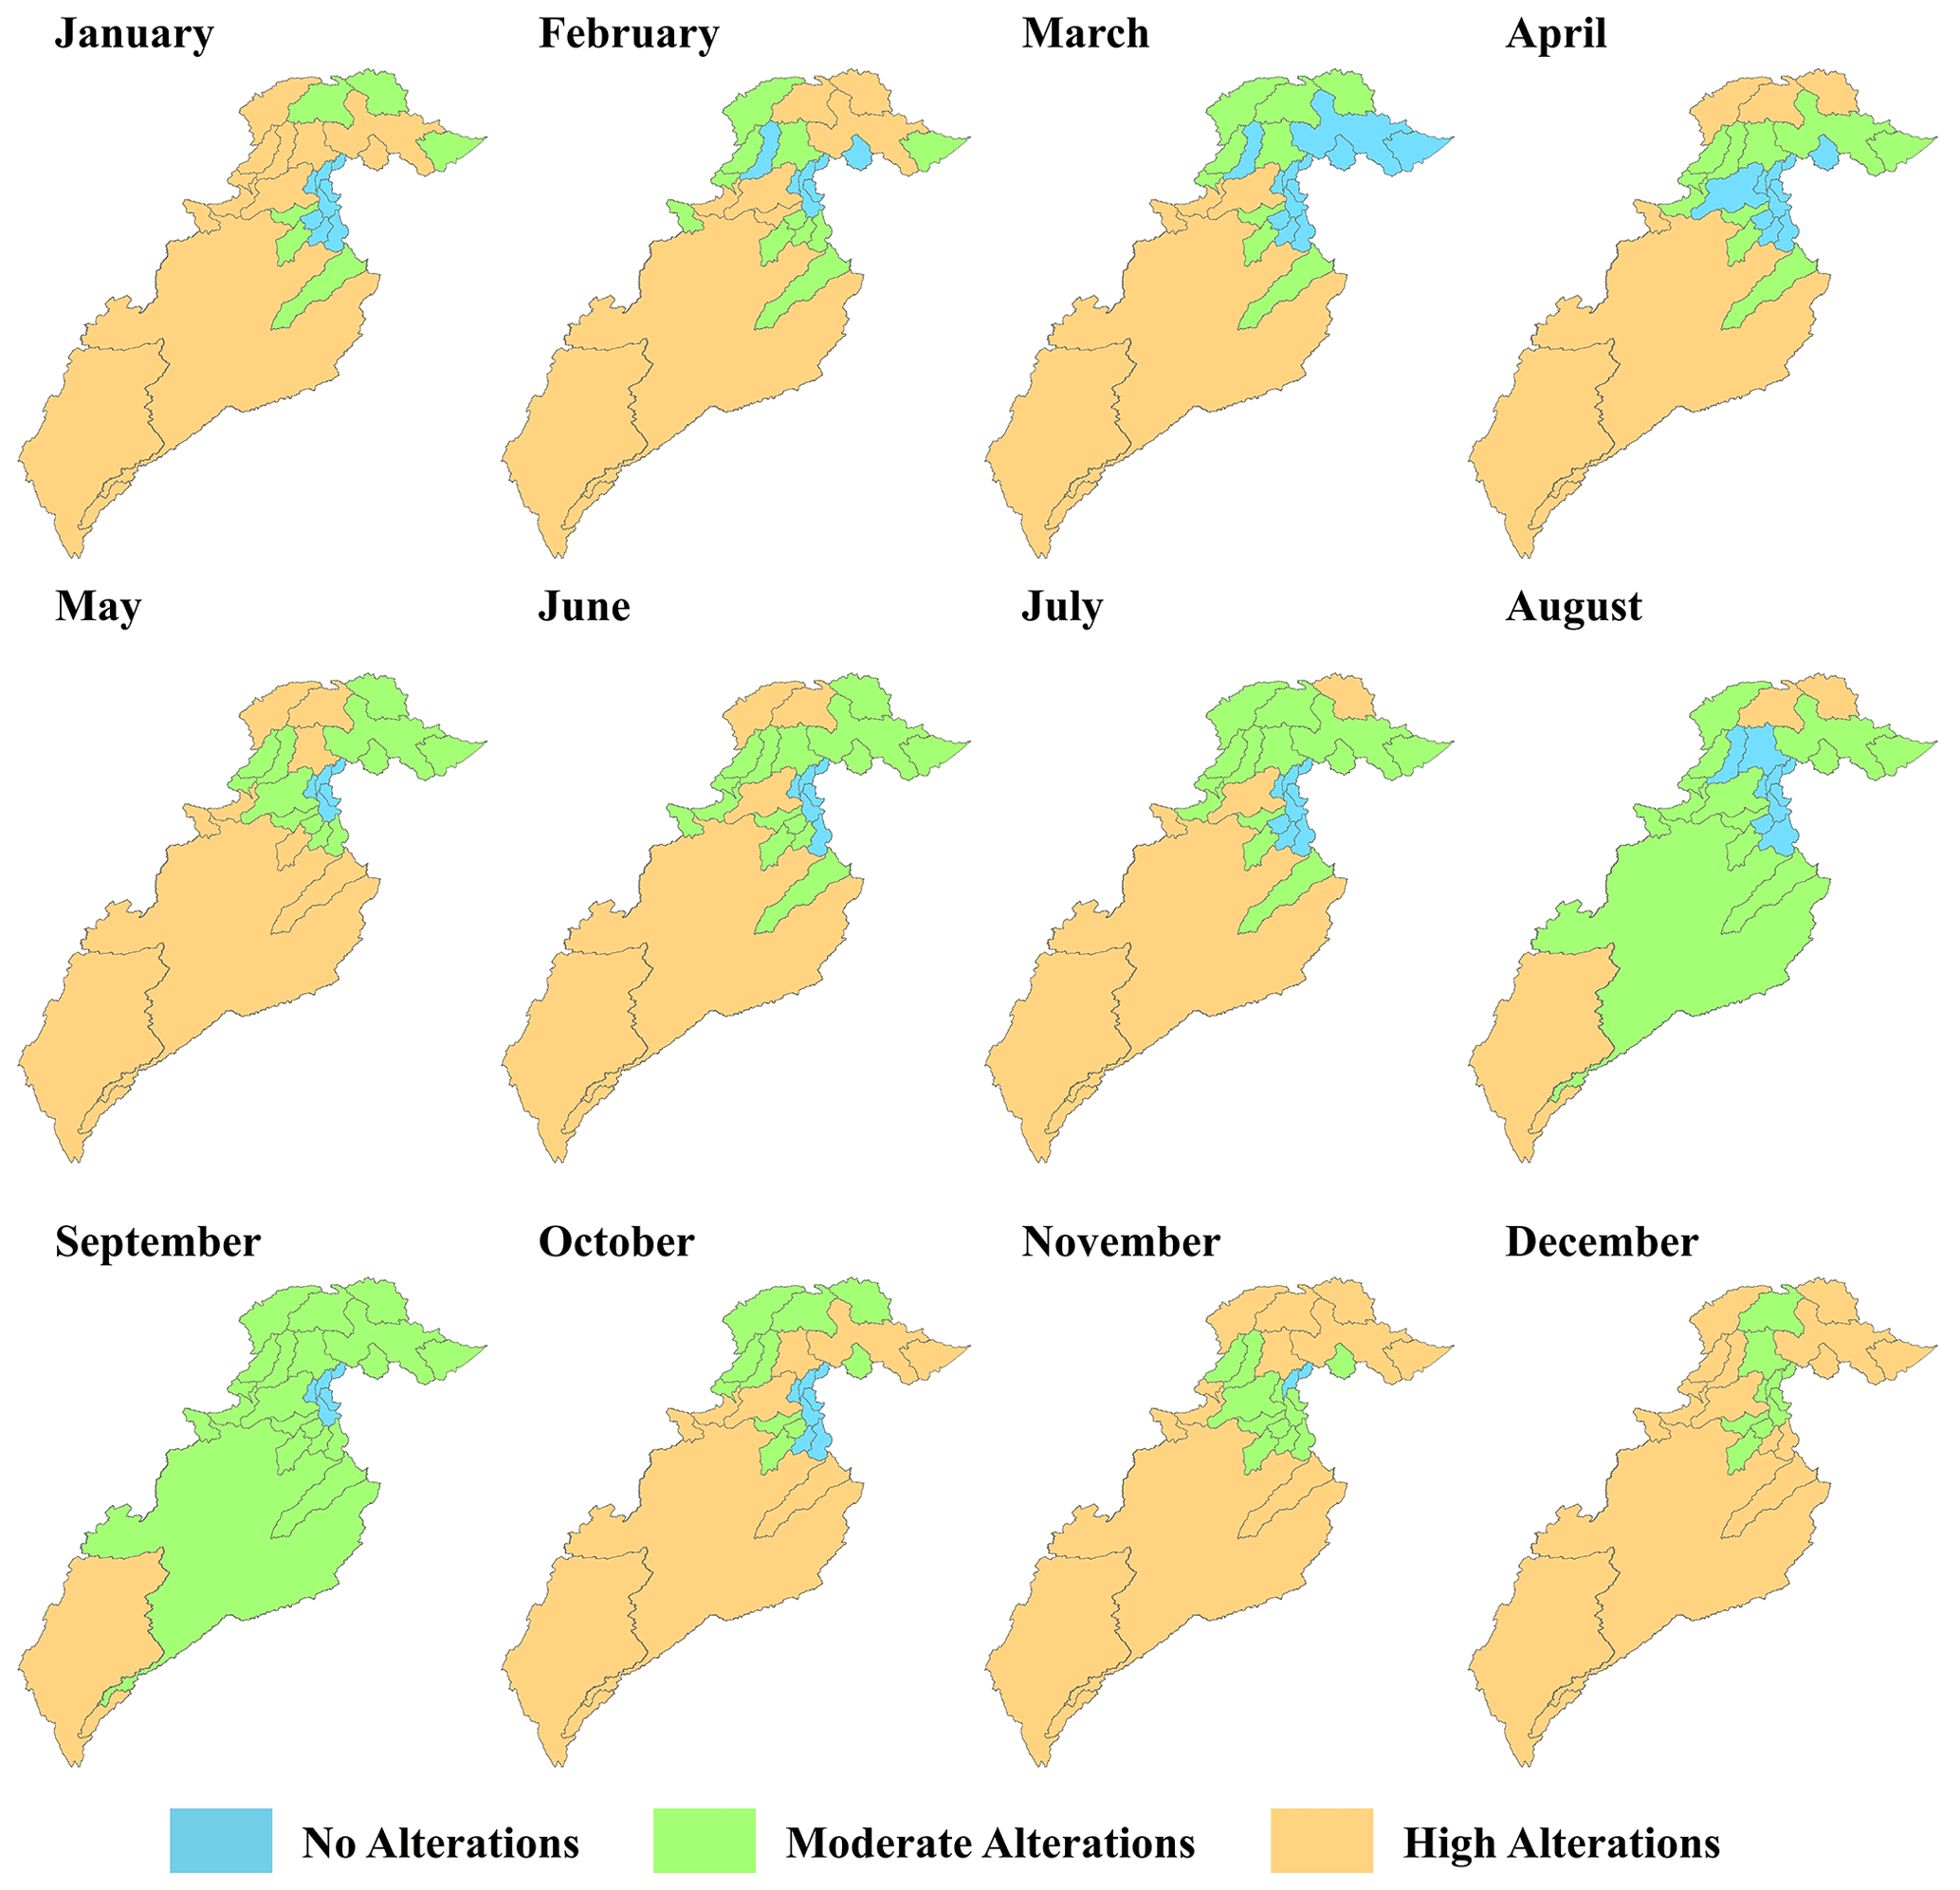
Figure 7Hydrological alterations in environmental flow due to drought at a monthly scale averaged over the entire study period in the Indus Basin.
4.4 Hydrological alterations in the Indus Basin
RVA is mostly used to analyse the hydrological alterations in flow regimes by comparing the flow in the pre-impact period against the post-impact period. In this study, we used the whole period (1980–2018) as a pre-impact period and the specific drought years as a post-impact period to assess the impact of drought on EF. HAF is calculated from the results of RVA and is spatially distributed to demonstrate the hydrological alterations in the Indus Basin for 18 EFCs. The selected EFCs are related to low EF (i.e. ELF and LF) during the drought period, which is calculated at the catchment scale. Figure 7 demonstrates that most of the catchments in the Indus Basin are subjected to high alterations during most months of the year, except August and September, which are dominated by moderate alternations. Overall, EF in the catchments of the UIB is comparatively less vulnerable to drought compared with catchments in the LIB. Further, low vulnerability (moderate alterations) is observed in most of the catchments of the Indus Basin during the monsoon season (July–September), during which Pakistan receives the most intense precipitation with a magnitude of 55 %–60 % of the annual precipitation (Dimri et al., 2015). The monsoon precipitation contributes to the irrigation of most of the irrigation areas with approximately 30 billion m3 of water (Rahman et al., 2023a). High precipitation results in no or moderate drought events during the monsoon season. Moreover, flow is also relatively high in the monsoon season due to relatively high temperature that accelerates the snow and glacier melting process in the UIB (Hasson et al., 2017). Therefore, hydrological alterations in the Indus Basin are comparatively lower in the monsoon season compared with other seasons. The alterations increase from the monsoon to post-monsoon (October–November) and winter (December–March) seasons. During the winter season, except for March, most of the catchments depicted high alterations due to moderate precipitation and relatively low flow in the rivers (Archer, 2003; Sharif et al., 2013).
On the basis of geographical division of the Indus Basin, most of the catchments in the UIB depicted high to moderate alterations in different months (Fig. 7). The Hunza, Gilgit, and Chitral catchments experience high alterations in most of the months compared to the remaining catchments of the UIB. The river flows in glacial regions are extremely seasonal, i.e. minimum flow in the winter period due to snow accumulation and a relatively pronounced melting in the summer period (Huss and Hock, 2018), especially in the UIB (Khan et al., 2020). However, the contribution of glacier melt to river flow decreases due to intense precipitation (Bashir et al., 2017). The “Karakoram anomaly” is defined as glaciers in the western Karakoram, eastern Hindu Kush, and northwestern Himalayan mountain ranges that are not responsive to global warming in the same way as their counterparts (Bashir et al., 2017). In other words, the rates of their retreat are usually less than the global average, where some of the glaciers are stable or increasing. Therefore, this local phenomenon may further contribute to high alterations in ELF and LF events in the UIB. Climate change is one of the most prominent factors that can further intensify both low-flow and high-flow events. River flows in the Indus Basin depend on the snowmelt from the UIB; thus, most of the catchments in the MIB and particularly LIB depicted high alterations during different seasons. The eastern catchments of the MIB receive comparatively more precipitation than the western catchment and thus depicted no significant alterations in most of the months, except the winter season (November and December).
The LIB is the most vulnerable to drought due to low precipitation and high temperature; thus high hydrological alterations due to drought are observed at the Indus River at the Massan and Sehwan catchments (Fig. 7). Besides the local changes in climate, water withdrawal from the Indus River system to IBIS for irrigation purposes makes a significant contribution to the high vulnerability of LIB catchments. The Indus River system, comprised of eastern and western rivers along with their tributaries, has an annual average runoff of approximately 180 billion m3 (BCM), out of which 128 BCM is diverted to the IBIS to irrigate an approximately 22.14 million ha area (Basharat, 2019). Therefore, the impact of drought on EF is further intensified in the LIB due to such a huge amount of water diversion. Overall, the seasonal evaluation showed that catchments in the Indus Basin have moderate alterations in the monsoon season. Further, catchments in the MIB and parts of the UIB are less vulnerable to drought compared to the LIB.
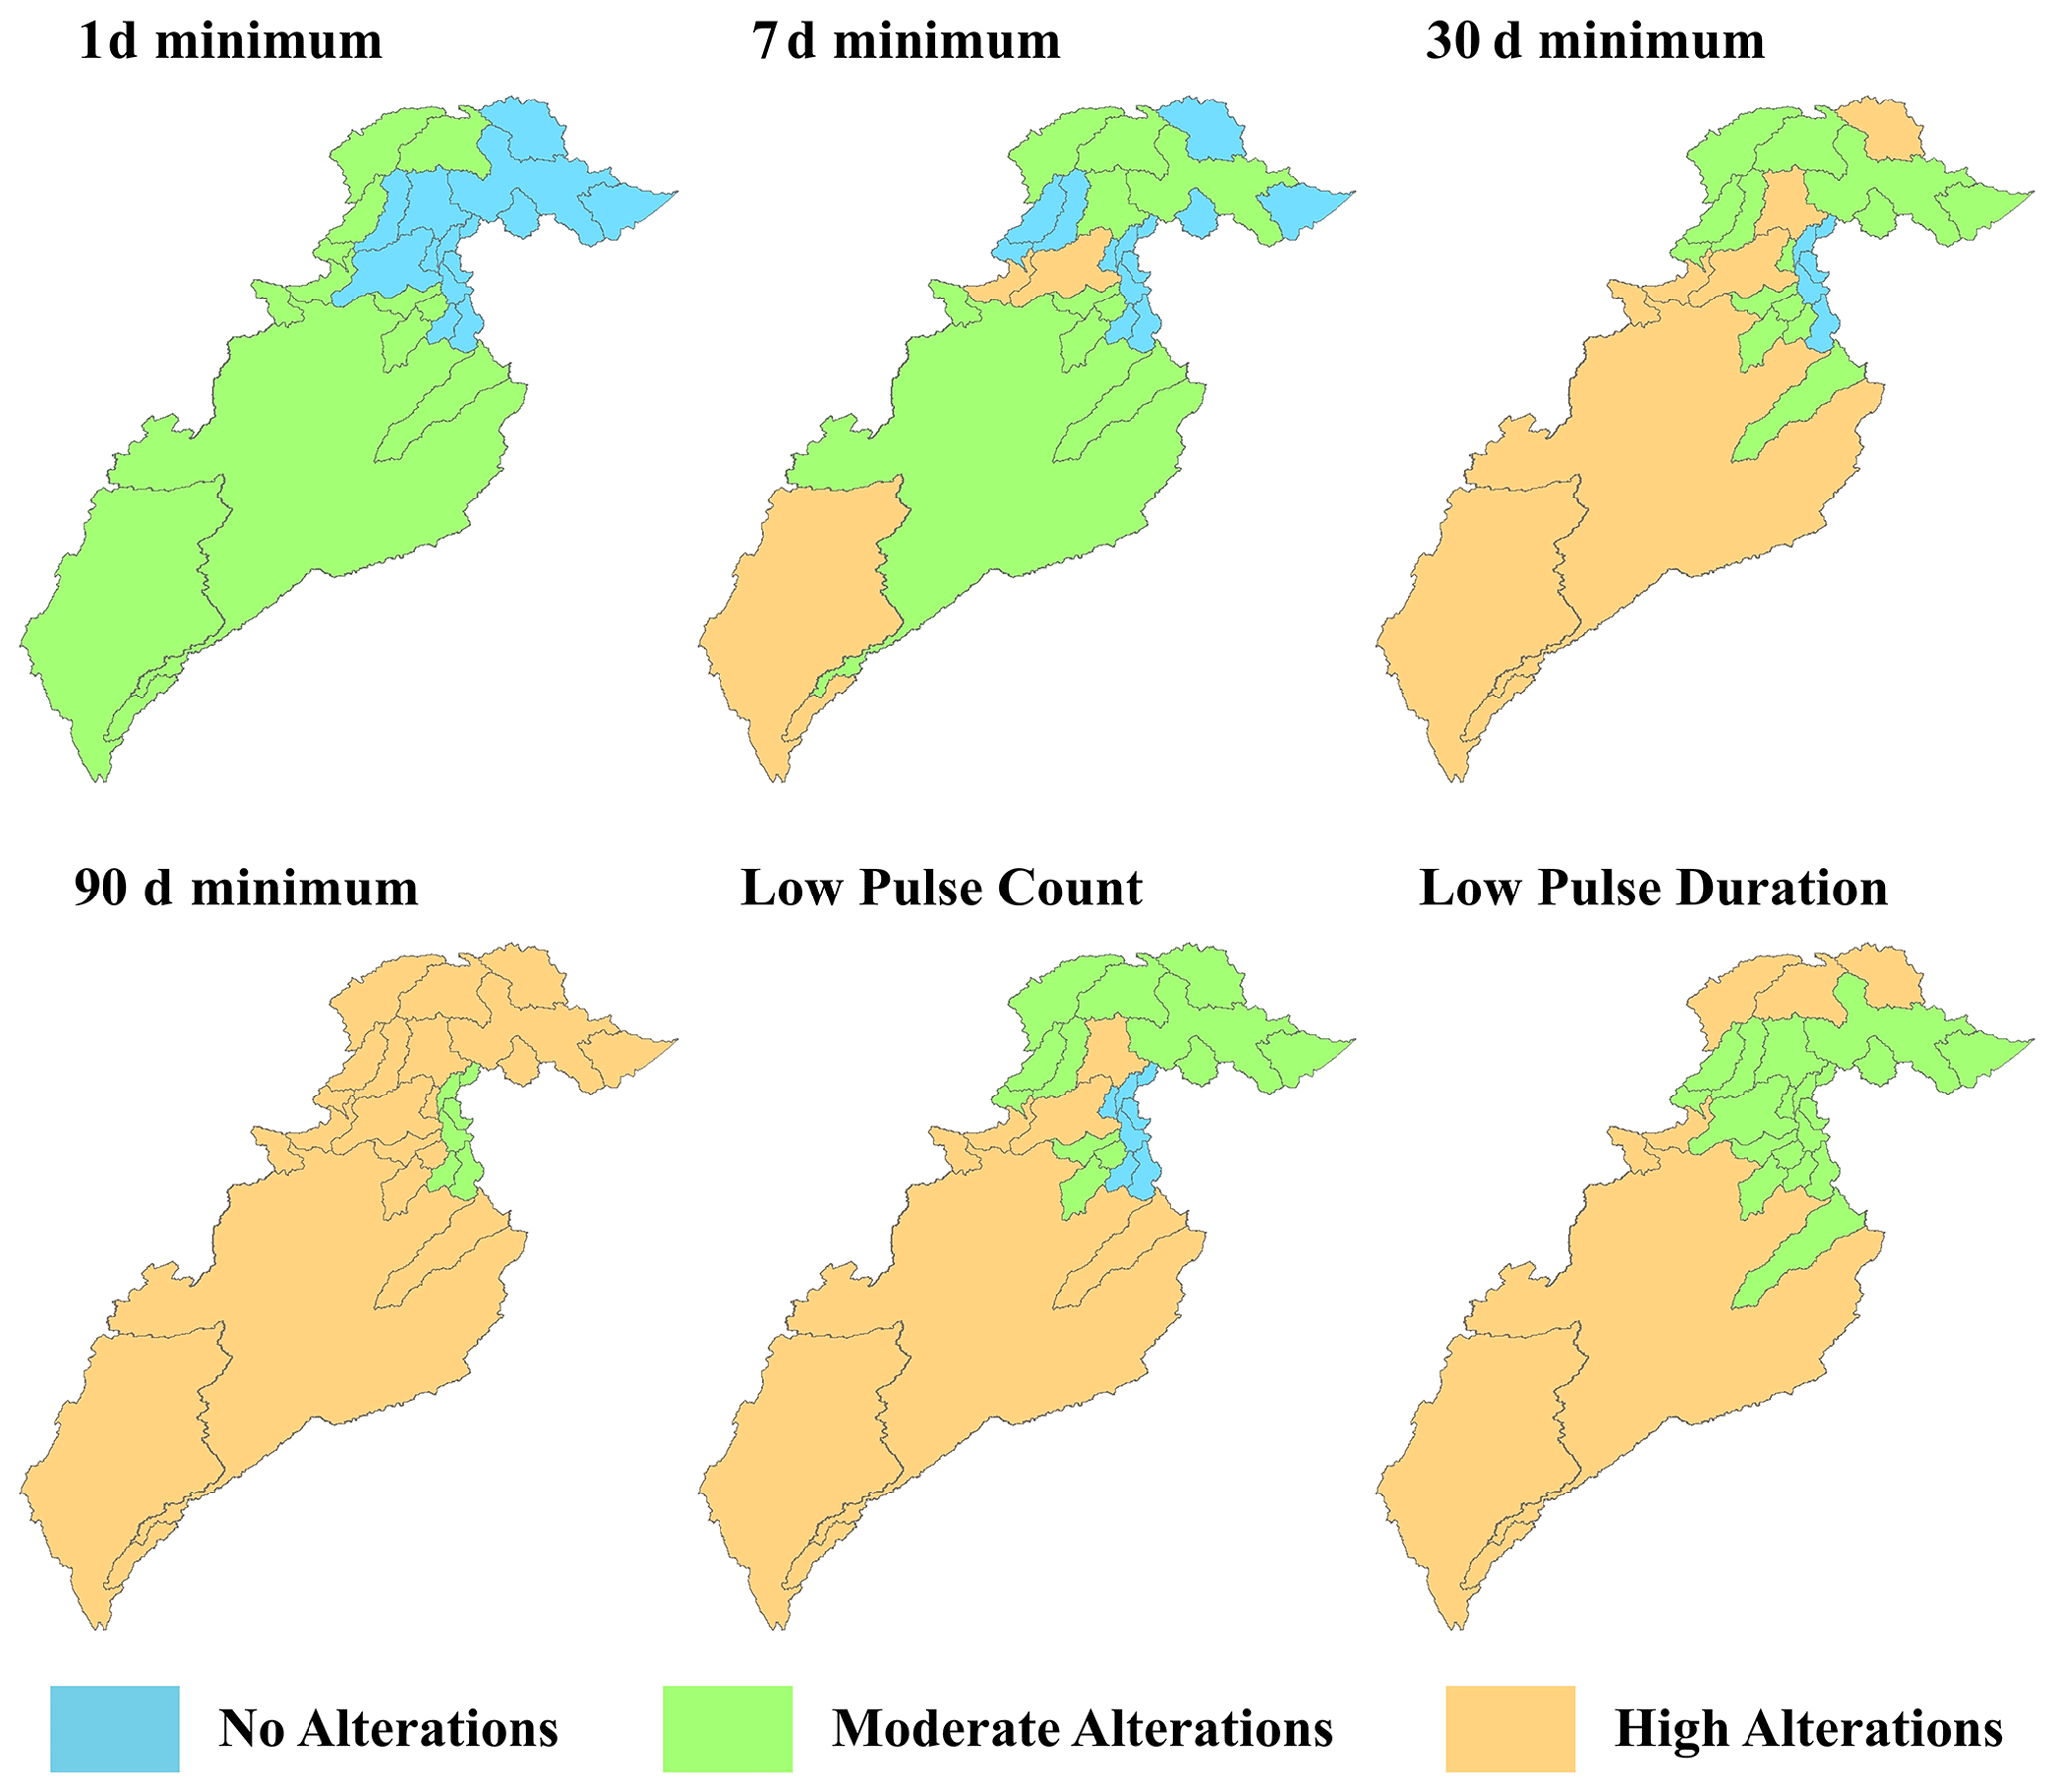
Figure 8Hydrological alterations in environmental flow components due to drought in the Indus Basin.
Other EFCs considered in this study include ELF and LF events at 1, 7, 30, and 90 d; low pulse count; and low pulse duration (Fig. 8). The results show increased alterations with an increase in cumulative time. For instance, most of the catchments depicted no alterations (UIB and MIB) at a 1 d minimum EFC, which increases gradually to high alterations with an increase in accumulated time (30 and 90 d minimum). On the other hand, alterations in low pulse count are moderate in most of the catchments of the UIB, there are no alterations in eastern catchments of the MIB, and there are high alterations in the remaining catchments of the MIB and LIB. On the contrary, the results show that the Hunza, Gilgit, and Chitral catchments in the UIB have high alterations in terms of low pulse duration. In other words, these catchments have persistent ELF and LF events for an extended period of time. The remaining catchments of the UIB and most of the catchments in the MIB (except the arid/hyper-arid regions) depicted moderate alterations in terms of the duration of low pulses. Similar to low pulse count, catchments in the LIB depicted high alterations in low-pulse-duration conditions.
Pakistan has been added to the list of water-stressed countries due to water scarcity issues under severe climate change and land use change scenarios. However, it is relatively difficult to precisely assess the impact of climate change on water availability in the Indus Basin because of uncertainties due to topographic complexity, local changes in climate that influence the natural glacial melt and snowmelt process, glacial retreat, and shifts in precipitation pattern (Janjua et al., 2021). The UIB contributes approximately 45 % of the flow to the main rivers in the Indus Basin, suggesting the high vulnerability of glacial melt to climate change and resulting in a 40 % surge in riverine flow (Janjua et al., 2021). However, in the long run, the average flows in the main tributaries of the Indus Basin are reduced by almost 60 % (Briscoe and Qamar, 2005). This reduction in river flow is mainly associated with global warming; i.e. the evapotranspiration is likely to increase significantly in the irrigated areas of the Indus Basin, resulting in an increase in water demand for irrigation (National Research Council, 2012). The Indus Basin (Pakistan) receives the highest magnitude of precipitation (50 %–60 %) during the monsoon season, resulting in approximately 85 % of the annual discharge in the Indus Basin, which will be significantly altered in a couple of decades due to climate change (National Research Council, 2012).
Extreme events, i.e. droughts and floods that resulted due to climate change, have tested the inhabitants of the Indus Basin in a number of ways. Pakistan is an agricultural country whose economic development depends on sustainable agricultural production (Rahman et al., 2023b). Besides the direct impact of droughts on agricultural productivity, droughts also cause significant reduction in surface water availability and consequently the irrigation water supply. The estimated water consumption by municipal and industrial sectors in Pakistan is approximately 5.3 km3, which is projected to increase to 14 km3 by 2025 (Condon et al., 2014). Therefore, there will be limited available water for irrigation purposes, and water availability in rivers will be significantly impacted, in turn affecting sustainable EFs.
The Indus Basin Irrigation System (IBIS) irrigates approximately 150 000 km2 out of 190 000 km2 of cultivated crop area in the Indus Basin, resulting in the deterioration of environmental water and the Indus Delta ecosystem because of a lack of sustainable minimum flow in the riverine system (Janjua et al., 2021). The conditions required for minimum flow in rivers become more critical during the drought periods; for instance, the difference between water demand and supply was 20 % during the 2000–2002 drought period (Briscoe and Qamar, 2005). Keeping in mind the worse condition of EF in the Indus Basin, it was suggested by experts in 2005 that we should sustain a minimum of 141.58 m3 s−1 flow in rivers at Kotri Barrage to the sea (González et al., 2005). Due to the extensive withdrawal of surface water from rivers by the IBIS, it was decided to ensure a 30 km3 cumulative flow for a period of 5 years in the Indus River (González et al., 2005).
In addition to the water withdrawal through the IBIS, drought makes significant contributions to reducing the flow in rivers of the Indus Basin (Rahman et al., 2023a). The persistent meteorological drought reduces the water availability in river flows, which then ultimately translates into insufficient release of EF (Peña-Guerrero et al., 2020). The frequency and intensity of drought in the Indus Basin have increased substantially in recent decades, which has resulted in high variability in meteorological and hydrological droughts. Rahman et al. (2023a) propagated drought from one catchment to another with a systematic approach using the principal component analysis (PCA) to understand the variability in both meteorological and hydrological droughts. Results showed high variability in hydrological droughts compared to meteorological droughts in most of the catchments in the Indus Basin. In other words, most of the catchments experience a decrease in river flow associated with meteorological drought, thus depicting drought as one of the major threats to sustainable ecosystems and EF.
This study is the first of its kind to evaluate the impact of drought on EF under two distinct scenarios using threshold regression: (i) drought severity that causes LFs and ELFs in rivers and (ii) months where drought caused LFs and ELFs. Keeping in mind the importance of maintaining minimum flow in rivers and frequent severe drought events in the Indus Basin, the relationship between drought and EF in the Indus Basin should be investigated further in more detail. More investigations on how other extreme events, floods for instance, affect the EF would also be required. This study is conducted across a data-scarce region; therefore, we used PCA to estimate and propagate drought from one catchment to another. Although the PCA algorithm retains maximum variance and keeps the original structure of the data of the catchment under investigation, some uncertainties might exist in the propagated data. Therefore, it is recommended to use dense in situ data or continuous data (retrieved from remote sensing products) for the sake of comparison and detailed investigation. Moreover, the threshold regression failed to identify thresholds for specific events (i.e. extremely low flow and low flow). It would be interesting to use machine learning techniques to determine drought severity that causes extremely low flows and low flows in the future.
In this study, the impact of drought on environmental flow in 27 catchments of the Indus Basin is assessed using indicators of hydrologic alterations (IHAs). The standardized precipitation evapotranspiration index (SPEI) is used to calculate drought from the systematically propagated principal components of precipitation and temperature estimated using principal component analysis (PCA). Threshold regression is used to identify a specific drought severity and month that trigger the low flows. In addition, range of variability analysis (RVA) is used to quantify the impact of drought on extremely low flows. The RVA results are also used to calculate the hydrological alteration factor (HAF), which indicates the category of alteration (no alteration, moderate alteration, and high alteration) in each catchment. The main conclusions are as follows.
Most of the catchments in the Indus Basin showed persistent drought events during the periods of 1984 to 1986, 1991/1992, 1997 to 2003, 2007 to 2008, 2012 to 2013, and 2017 to 2018. The drought is evident on a longer timescale, i.e. SPEI-12 compared to SPEI-6 and SPEI-1. Moreover, the drought is more severe in the lower Indus Basin (LIB) than in the upper Indus Basin (UIB). The analyses have shown that temperature plays a crucial role in the occurrence of droughts. In addition, local climate, topography, the length of the period, and seasonality contribute significantly to drought variability.
The distribution of environmental flow components (EFCs) shows a significant decrease in river flow during drought years. The magnitude of extremely low flow (ELF) and low flow (LF) is low in the UIB, while it increases significantly toward the LIB. In the transboundary river catchments, significant changes are observed in the ELF and LF events. Overall, the magnitude and frequency of the ELF and LF events increase with an increase in drought severity.
Threshold regression results (scenario 1, where drought severity is considered the threshold variable) showed that most of the catchments were affected by moderate drought at shorter timescales (SPEI-1 and SPEI-6). However, at longer timescales (SPEI-12), the threshold of drought severity increases to severe and extreme drought. The drought severity threshold is the highest at the LIB at all timescales. Catchments in the MIB (eastern catchments) are mainly influenced by human-induced activities, while the changes in river flow across the UIB and western MIB are triggered by climate-induced activities such as drought. Similar observations apply to the LIB, where catchments are mainly influenced by climatic factors.
Scenario 2 (where time is considered a threshold variable) provided clear insight into the impact of drought on environmental flow by dividing the study duration into different time periods characterized by different characteristics, i.e. significant alterations in the flow regime between the different time periods and almost similar characteristics in each one considering the severity of the drought. The study duration is divided into three to five time periods where moderate to severe drought triggered ELF and LF in most of the catchments. Drought severity increases from moderate in the UIB and MIB to extreme in the LIB, and this increase is associated with an increase in timescale from SPEI-1 to SPEI-12.
Threshold regression analysis was useful for quantifying alterations in environmental flow due to drought. The LIB experienced significant alterations in environmental flow compared to the UIB and MIB. In addition, the SPEI coefficient from threshold regression in scenario 2 (shown in Tables 3 and 4) increases with an increase in drought severity, suggesting that SPEI has a significant impact on environmental flow in specific catchments.
Most of the catchments were subject to high alterations in all months of the year. Drought impacts on environmental flow are more severe in the LIB, followed by the UIB, and less severe in the MIB. Climate change, topography, land use, and anthropogenic activities have significant impacts on the environmental flow. For example, moderate or no alterations are observed during the monsoon season, while high alterations occur in winter. In addition to seasonal variations in river flow, temperature plays a critical role in the variability of drought and its impact on environmental flow. The Karakoram anomaly is one of the key factors contributing to high alterations in ELF and LF events in the UIB and thus in the MIB and LIB.
Understanding the impact of climate-induced changes (especially droughts) on environmental flow is extremely important to ensure the minimum flow required to maintain ecosystem services. This study provided detailed insights into changes in environmental flow with changes in drought severity that will serve as a useful guide for researchers, government organizations, policymakers, and local authorities to reconsider decisions in light of climate change impacts on environmental flow.
This study used the freely available SPEI in the R code/package (https://github.com/sbegueria/SPEI, Beguería et al., 2017) to calculate drought and principal component analysis (PCA) to propagate drought from one catchment to another. Moreover, IHA software was used to calculate the EFCs and perform RVA.
Data are available on request from the first author (khalil_rahman@sdu.edu.cn).
The supplement related to this article is available online at: https://doi.org/10.5194/nhess-24-2191-2024-supplement.
KUR conceptualized the idea, developed the methodology, conducted the analysis, validated the results, and wrote the original draft; SS and KSB contributed to conceptualization, analysis, methodology, and validation and supervised the research; HFG, KZJ, and KZ were involved in the data curation and methodology. All authors were involved in reviewing and editing the paper.
The contact author has declared that none of the authors has any competing interests.
Publisher's note: Copernicus Publications remains neutral with regard to jurisdictional claims made in the text, published maps, institutional affiliations, or any other geographical representation in this paper. While Copernicus Publications makes every effort to include appropriate place names, the final responsibility lies with the authors.
This article is part of the special issue “Hydro-meteorological extremes and hazards: vulnerability, risk, impacts, and mitigation”. It is not associated with a conference.
We are grateful to the Pakistan Meteorology Department (PMD) and Water and Power Development Authority (WAPDA) for providing the meteorological and hydrological data.
This research has been supported by the National Natural Science Foundation of China (grant nos. 51839006 and 52250410336), the China Postdoctoral Science Foundation (grant no. 2022M721872), and the Higher Education Commission, Pakistan (grant no. CPEC-161).
This paper was edited by Efthymios Nikolopoulos and reviewed by three anonymous referees.
Adnan, S., Ullah, K., Gao, S., Khosa, A. H., and Wang, Z.: Shifting of agro-climatic zones, their drought vulnerability, and precipitation and temperature trends in Pakistan, Int. J. Climatol., 37, 529–543, 2017.
Aftab, F., Zafar, M., Hajana, M. I., and Ahmad, W.: A novel gas sands characterization and improved depositional modeling of the Cretaceous Sembar Formation, Lower Indus Basin, Pakistan, Front. Earth Sci., 10, 1039605, https://doi.org/10.3389/feart.2022.1039605, 2022.
Ahmed, K., Sachindra, D. A., Shahid, S., Iqbal, Z., Nawaz, N., and Khan, N.: Multi-model ensemble predictions of precipitation and temperature using machine learning algorithms, Atmos. Res., 236, 104806, https://doi.org/10.1016/j.atmosres.2019.104806, 2020.
Ali, G., Hasson, S., and Khan, A. M.: Climate change: Implications and adaptation of water resources in Pakistan, Global Change Impact Studies Centre (GCISC), Islamabad, Pakistan, 2009.
Archer, D.: Contrasting hydrological regimes in the upper Indus Basin, J. Hydrol., 274, 198–210, 2003.
Arthington, A. H., Bunn, S. E., Poff, N. L., and Naiman, R. J.: The challenge of providing environmental flow rules to sustain river ecosystems, Ecol. Appl., 16, 1311–1318, 2006.
Arthington, A. H., Bhaduri, A., Bunn, S. E., Jackson, S. E., Tharme, R. E., Tickner, D., Young, B., Acreman, M., Baker, N., Capon, S., and Horne, A. C.: The Brisbane declaration and global action agenda on environmental flows, Front. Environ. Sci., 6, 45, https://doi.org/10.3389/fenvs.2018.00045, 2018.
Azmat, M., Wahab, A., Huggel, C., Qamar, M. U., Hussain, E., Ahmad, S., and Waheed, A.: Climatic and hydrological projections to changing climate under CORDEX-South Asia experiments over the Karakoram–Hindukush–Himalayan water towers, Sci. Total. Environ., 703, 135010, https://doi.org/10.1016/j.scitotenv.2019.135010, 2020.
Basharat, M.: Water management in the Indus Basin in Pakistan: challenges and opportunities, in: Indus River Basin, edited by: Khan, S. I. and Adams, T. E., Elsevier, 375–388, https://doi.org/10.1016/B978-0-12-812782-7.00017-5, 2019.
Bashir, F., Zeng, X., Gupta, H., and Hazenberg, P.: A hydrometeorological perspective on the Karakoram anomaly using unique valley-based synoptic weather observations, Geophys. Res. Lett., 44, 10470–10478, 2017.
Beguería, S., Vicente-Serrano, S. M., and Beguería, M. S.: Package “spei”. Calculation of the Standardised Precipitation-Evapotranspiration Index, GitHub [code], https://github.com/sbegueria/SPEI (last access: 28 November 2022), 2017.
Benjankar, R., Tonina, D., McKean, J. A., Sohrabi, M. M., Chen, Q., and Vidergar, D.: Dam operations may improve aquatic habitat and offset negative effects of climate change, J. Environ. Manage., 213, 126–134, 2018.
Best, J.: Anthropogenic stresses on the world's big rivers, Nat. Geosci., 12, 7–21, 2019.
Briscoe, J. and Qamar, U.: Pakistan's water economy: Running dry, Oxford University Press, Oxford, https://documents1.worldbank.org/curated/en/989891468059352743/pdf/443750PUB0PK0W1Box0327398B01PUBLIC1.pdf (last access: 16 June 2024), 2005.
Chiang, F., Mazdiyasni, O., and AghaKouchak, A.: Evidence of anthropogenic impacts on global drought frequency, duration, and intensity, Nat. Commun., 12, 1–10, 2021.
Condon, M., Kriens, D., Lohani, A., and Sattar, E.: Challenge and response in the Indus Basin, Water Policy, 16, 58–86, 2014.
Dahri, Z. H., Ludwig, F., Moors, E., Ahmad, S., Ahmad, B., Shoaib, M., Ali, I., Iqbal, M. S., Pomee, M. S., Mangrio, A. G., and Ahmad, M. M.: Spatio-temporal evaluation of gridded precipitation products for the high-altitude Indus basin, Int. J. Climatol., 41, 4283–4306, 2021.
Dimri, A., Niyogi, D., Barros, A. P., Ridley, J., Mohanty, U. C., Yasunari, T., and Sikka, D. R.: Western disturbances: a review, Rev. Geophy., 53, 225–246, 2015.
Eckstein, D., Hutfils, M.-L., and Winges, M.: Global climate risk index 2019. Who suffers most from extreme weather events, Germanwatch e.V., Bonn, ISBN 978-3-943704-70-9, https://www.burmalibrary.org/sites/burmalibrary.org/files/obl/GLOBAL-CLIMATE-RISK-INDEX-2019-en.pdf (last access: 15 December 2022), 2018.
Fong, Y., Huang, Y., Gilbert, P. B., and Permar, S. R.: chngpt: Threshold regression model estimation and inference, BMC Bioinformatics, 18, 1–7, 2017.
Forsythe, N., Fowler, H. J., Blenkinsop, S., Burton, A., Kilsby, C. G., Archer, D. R., Harpham, C., Hashmi, M. Z.: Application of a stochastic weather generator to assess climate change impacts in a semi-arid climate: The Upper Indus Basin, J. Hydrol., 517, 1019–1034, 2014.
Gao, Y., Vogel, R. M., Kroll, C. N., Poff, N. L., and Olden, J. D.: Development of representative indicators of hydrologic alteration, J. Hydrol., 374, 136–147, 2009.
González, F. J., Basson, T., and Schultz, B.: Final Report of IPOE for Review of Studies on Water Escapages Below Kotri Barrage, https://doi.org/10.13140/RG.2.2.28670.02885, 2005.
Grill, G., Lehner, B., Thieme, M., Geenen, B., Tickner, D., Antonelli, F., Babu, S., Borrelli, P., Cheng, L., Crochetiere, H., and Ehalt Macedo, H.: Mapping the world's free-flowing rivers, Nature, 569, 215–221, 2019.
Gudmundsson, L., Boulange, J., Do, H. X., Gosling, S. N., Grillakis, M. G., Koutroulis, A. G., Leonard, M., Liu, J., Müller Schmied, H., Papadimitriou, L., and Pokhrel, Y.: Globally observed trends in mean and extreme river flow attributed to climate change, Science, 371, 1159–1162, 2021.
Hansen, B. E.: Sample splitting and threshold estimation, Econometrica, 68, 575–603, 2000.
Hansen, B. E.: Threshold autoregression in economics, Stat. Interface, 4, 123–127, 2011.
Hart, R. M. and Breaker, B. K.: Quantifying hydrologic alteration in an area lacking current reference conditions—The Mississippi alluvial plain of the south-central United States, River Res. Appl., 35, 553–565, 2019.
Hasson, S., Böhner, J., and Lucarini, V.: Prevailing climatic trends and runoff response from Hindukush–Karakoram–Himalaya, upper Indus Basin, Earth Syst. Dynam., 8, 337–355, https://doi.org/10.5194/esd-8-337-2017, 2017.
Huss, M. and Hock, R.: Global-scale hydrological response to future glacier mass loss, Nat. Clim. Change, 8, 135–140, 2018.
Immerzeel, W. W., Van Beek, L. P., and Bierkens, M. F.: Climate change will affect the Asian water towers, Science, 328, 1382–1385, 2010.
Immerzeel, W. W., Wanders, N., Lutz, A. F., Shea, J. M., and Bierkens, M. F. P.: Reconciling high-altitude precipitation in the upper Indus basin with glacier mass balances and runoff, Hydrol. Earth Syst. Sci., 19, 4673–4687, https://doi.org/10.5194/hess-19-4673-2015, 2015.
Iqbal, M. F. and Athar, H.: Validation of satellite based precipitation over diverse topography of Pakistan, Atmos. Res., 201, 247–260, 2018.
Janjua, S., Hassan, I., Muhammad, S., Ahmed, S., and Ahmed, A.: Water management in Pakistan's Indus Basin: challenges and opportunities, Water Policy, 23, 1329–1343, 2021.
Kalair, A. R., Abas, N., Hasan, Q. U., Kalair, E., Kalair, A., and Khan, N.: Water, energy and food nexus of Indus Water Treaty: Water governance, Water-Energy Nexus, 2, 10–24, 2019.
Karimi, P., Bastiaanssen, W. G. M., Molden, D., and Cheema, M. J. M.: Basin-wide water accounting based on remote sensing data: an application for the Indus Basin, Hydrol. Earth Syst. Sci., 17, 2473–2486, https://doi.org/10.5194/hess-17-2473-2013, 2013.
Khan, A. J., Koch, M., and Tahir, A. A.: Impacts of climate change on the water availability, seasonality and extremes in the Upper Indus Basin (UIB), Sustainability, 12, 1283, https://doi.org/10.3390/su12041283, 2020.
Laghari, A. N., Vanham, D., and Rauch, W.: The Indus basin in the framework of current and future water resources management, Hydrol. Earth Syst. Sci., 16, 1063–1083, https://doi.org/10.5194/hess-16-1063-2012, 2012.
Lee, A., Cho, S., Kang, D. K., and Kim, S.: Analysis of the effect of climate change on the Nakdong river stream flow using indicators of hydrological alteration, J. Hydro-Environ. Res., 8, 234–247, 2014.
Liang, Z., Su, X., and Feng, K.: Drought propagation and construction of a comprehensive drought index based on the Soil and Water Assessment Tool (SWAT) and empirical Kendall distribution function (): a case study for the Jinta River basin in northwestern China, Nat. Hazards Earth Syst. Sci., 21, 1323–1335, https://doi.org/10.5194/nhess-21-1323-2021, 2021.
Liu, Y., Zhu, Y., Ren, L., Singh, V. P., Yong, B., Jiang, S., Yuan, F., and Yang, X.: Understanding the spatiotemporal links between meteorological and hydrological droughts from a three-dimensional perspective, J. Geophy. Res.-Atmos., 124, 3090–3109, 2019.
Lytle, D. A. and Poff, N. L.: Adaptation to natural flow regimes, Trends Ecol. Evol., 19, 94–100, 2004.
Masood, A., Mushtaq, H., Bukhari, S. A. A., Ahmad, B., and Tahir, A. A.: Exploring climate change impacts during first half of the 21st century on flow regime of the transboundary kabul river in the hindukush region, J. Water Clim. Change, 11, 1521–1538, 2020.
Mathews, R. and Richter, B. D.: Application of the Indicators of hydrologic alteration software in environmental flow setting 1., J. Am. Water Resour. As., 43, 1400–1413, 2007.
McKee, T. B., Doesken, N. J., and Kleist, J.: The relationship of drought frequency and duration to time scales, Proceedings of the 8th Conference on Applied Climatology, Boston, MA, USA, 17–22 January 1993, 179–183, https://climate.colostate.edu/pdfs/relationshipofdroughtfrequency.pdf (last access: 22 November 2022), 1993.
Młyński, D., Wałęga, A., and Kuriqi, A.: Influence of meteorological drought on environmental flows in mountain catchments, Ecol. Indic., 133, 108460, https://doi.org/10.1016/j.ecolind.2021.108460, 2021.
Muggeo, V. M.: Segmented: an R package to fit regression models with broken-line relationships, R News, 8, 20–25, 2008.
Mukhopadhyay, B., Khan, A., and Gautam, R.: Rising and falling river flows: contrasting signals of climate change and glacier mass balance from the eastern and western Karakoram, Hydrolog. Sci. J., 60, 2062–2085, 2015.
National Research Council: Himalayan Glaciers: Climate Change, Water Resources, and Water Security, National Academic Press, Washington, DC, https://doi.org/10.17226/13449, 2012.
Nepal, S. and Shrestha, A. B.: Impact of climate change on the hydrological regime of the Indus, Ganges and Brahmaputra river basins: a review of the literature, Int. J. Water Resour. D. 31, 201–218, 2015.
Olden, J. D. and Poff, N.: Redundancy and the choice of hydrologic indices for characterizing streamflow regimes, River Res. Appl., 19, 101–121, 2003.
Pal, S. and Sarda, R.: Measuring the degree of hydrological variability of riparian wetland using hydrological attributes integration (HAI) histogram comparison approach (HCA) and range of variability approach (RVA), Ecol. Indic., 120, 106966, https://doi.org/10.1016/j.ecolind.2020.106966, 2021.
Pardo-Loaiza, J., Bergillos, R., Solera, A., Paredes-Arquiola, J., and Andreu, J.: Habitat alteration assessment for the management of environmental flows in regulated basins, J. Environ. Manage., 319, 115653, https://doi.org/10.1016/j.jenvman.2022.115653, 2022.
Peña-Guerrero, M. D., Nauditt, A., Mu noz-Robles, C., Ribbe, L., and Meza, F.: Drought impacts on water quality and potential implications for agricultural production in the Maipo River Basin, Central Chile, Hydrolog. Sci. J., 65, 1005–1021, 2020.
Poff, N. L. and Zimmerman, J. K.: Ecological responses to altered flow regimes: a literature review to inform the science and management of environmental flows, Freshwater Biol., 55, 194–205, 2010.
Rahman, K. U., Shang, S., Shahid, M., Wen, Y., and Khan, A. J.: Development of a novel weighted average least squares-based ensemble multi-satellite precipitation dataset and its comprehensive evaluation over Pakistan, Atmos. Res., 246, 105133, https://doi.org/10.1016/j.atmosres.2020.105133, 2020a.
Rahman, K. U., Shang, S., Shahid, M., and Wen, Y.: Hydrological evaluation of merged satellite precipitation datasets for streamflow simulation using SWAT: a case study of Potohar Plateau, Pakistan, J. Hydrol., 587, 125040, https://doi.org/10.1016/j.jhydrol.2020.125040, 2020b.
Rahman, K. U., Shang, S., and Zohaib, M.: Assessment of merged satellite precipitation datasets in monitoring meteorological drought over Pakistan, Remote Sens.-Basel, 13, 1662, https://doi.org/10.3390/rs13091662, 2021.
Rahman, K. U., Hussain, A., Ejaz, N., Shahid, M., Duan, Z., Mohammadi, B., Hoai, P. N., Pham, Q. B., Khedher, K. M., and Anh, D. T.: Evaluating the impact of the environment on depleting groundwater resources: a case study from a semi-arid and arid climatic region, Hydrolog. Sci. J., 67, 791–805, 2022.
Rahman, K. U., Shang, S., Khaled, S. B., and Nusrat, A.: Catchment-Scale Drought Propagation Assessment in the Indus Basin of Pakistan Using a Combined Approach of Principal Components and Wavelet Analyses, J. Hydrometeorol., 24, 601–624, 2023a.
Rahman, K. U., Hussain, A., Ejaz, N., Shang, S., Balkhair, K. S., Khan, K. U. J., Khan, M. A., and Rehman, N. U.: Analysis of production and economic losses of cash crops under variable drought: A case study from Punjab province of Pakistan, Int. J. Disast. Risk Re., 85, 103507, https://doi.org/10.1016/j.ijdrr.2022.103507, 2023b.
Rajbhandari, R., Shrestha, A. B., Kulkarni, A., Patwardhan, S. K., Bajracharya, S. R.: Projected changes in climate over the Indus river basin using a high resolution regional climate model (PRECIS), Clim. Dynam. 44, 339–357, 2015.
Rees, H. G. and Collins, D. N.: Regional differences in response of flow in glacier-fed Himalayan rivers to climatic warming, Hydrol. Process., 20, 2157–2169, 2006.
Richter, B., Baumgartner, J., Wigington, R., and Braun, D.: How much water does a river need?, Freshwater Biol., 37, 231–249, 1997.
Richter, B. D., Baumgartner, J. V., Powell, J., and Braun, D. P.: A method for assessing hydrologic alteration within ecosystems, Conserv. Biol., 10, 1163–1174, 1996.
Richter, B. D., Mathews, R., Harrison, D. L., and Wigington, R.: Ecologically sustainable water management: managing river flows for ecological integrity, Ecol. Appl., 13, 206–224, 2003.
Richter, B. D., Warner, A. T., Meyer, J. L., and Lutz, K.: A collaborative and adaptive process for developing environmental flow recommendations, River Res. Appl., 22, 297–318, 2006.
Salik, K. M., Hashmi, M. Z.-U.-R., and Ishfaq, S.: Environmental flow requirements and impacts of climate change-induced river flow changes on ecology of the Indus Delta, Pakistan, Reg. Stud. Marine Sci., 7, 185–195, 2016.
Shahid, M. and Rahman, K. U.: Identifying the annual and seasonal trends of hydrological and climatic variables in the Indus Basin Pakistan, Asia-Pac. J. Atmos. Sci., 57, 191–205, 2021.
Shahid, M., Rahman, K. U., Haider, S., Gabriel, H. F., Khan, A. J., Pham, Q. B., Mohammadi, B., Linh, N. T. T., and Anh, D. T.: Assessing the potential and hydrological usefulness of the CHIRPS precipitation dataset over a complex topography in Pakistan, Hydrolog. Sci. J., 66, 1664–1684, 2021.
Sharif, M., Archer, D. R., Fowler, H. J., and Forsythe, N.: Trends in timing and magnitude of flow in the Upper Indus Basin, Hydrol. Earth Syst. Sci., 17, 1503–1516, https://doi.org/10.5194/hess-17-1503-2013, 2013.
Sharma, B., Amarasinghe, U., Xueliang, C., de Condappa, D., Shah, T., Mukherji, A., Bharati, L., Ambili, G., Qureshi, A., Pant, D., and Xenarios, S.: The Indus and the Ganges: river basins under extreme pressure, Water Int., 35, 493–521, 2010.
Shiau, J. T. and Wu, F. C.: Compromise programming methodology for determining instream flow under multiobjective water allocation criteria, JAWRA J. Am. Water Res. Ass., 42, 1179–1191, 2006.
Shiau, J. T. and Wu, F. C.: A histogram matching approach for assessment of flow regime alteration: application to environmental flow optimization, River Res. Appl., 24, 914–928, 2008.
Shrestha, A. B., Wagle, N., and Rajbhandari, R.: A review on the projected changes in climate over the Indus Basin, in: Indus River Basin, edited by: Khan, S. I. and Adams, T. E., Elsevier, 145–158, https://doi.org/10.1016/B978-0-12-812782-7.00007-2, 2019.
Stagge, J. H., Tallaksen, L. M., Gudmundsson, L., Van Loon, A. F., and Stahl, K.: Candidate distributions for climatological drought indices (SPI and SPEI), Int. J. Climatol., 35, 4027–4040, 2015.
Stamou, A., Polydera, A., Papadonikolaki, G., Martinez-Capel, F., Mu noz-Mas, R., Papadaki, C., Zogaris, S., Bui, M. D., Rutschmann, P., and Dimitriou, E.: Determination of environmental flows in rivers using an integrated hydrological–hydrodynamic-habitat modelling approach, J. Environ. Manage., 209, 273–285, 2018.
Stephan, R., Erfurt, M., Terzi, S., Žun, M., Kristan, B., Haslinger, K., and Stahl, K.: An inventory of Alpine drought impact reports to explore past droughts in a mountain region, Nat. Hazards Earth Syst. Sci., 21, 2485–2501, https://doi.org/10.5194/nhess-21-2485-2021, 2021.
Su, G., Logez, M., Xu, J., Tao, S., Villéger, S., and Brosse, S.: Human impacts on global freshwater fish biodiversity, Science, 371, 835–838, 2021.
Syvitski, J. P., Kettner, A. J., Overeem, I., Giosan, L., Brakenridge, G. R., Hannon, M., and Bilham, R.: Anthropocene metamorphosis of the Indus Delta and lower floodplain, Anthropocene, 3, 24–35, 2013.
Vicente-Serrano, S. M., Beguería, S., and López-Moreno, J. I.: A multiscalar drought index sensitive to global warming: the standardized precipitation evapotranspiration index, J. Climate, 23, 1696–1718, 2010.
Vicente-Serrano, S. M., Azorin-Molina, C., Peña-Gallardo, M., Tomas-Burguera, M., Domínguez-Castro, F., Martín-Hernández, N., Beguería, S., El Kenawy, A., Noguera, I., and García, M.: A high-resolution spatial assessment of the impacts of drought variability on vegetation activity in Spain from 1981 to 2015, Nat. Hazards Earth Syst. Sci., 19, 1189–1213, https://doi.org/10.5194/nhess-19-1189-2019, 2019.
Virkki, V., Alanärä, E., Porkka, M., Ahopelto, L., Gleeson, T., Mohan, C., Wang-Erlandsson, L., Flörke, M., Gerten, D., Gosling, S. N., Hanasaki, N., Müller Schmied, H., Wanders, N., and Kummu, M.: Globally widespread and increasing violations of environmental flow envelopes, Hydrol. Earth Syst. Sci., 26, 3315–3336, https://doi.org/10.5194/hess-26-3315-2022, 2022.
Vörösmarty, C. J., McIntyre, P. B., Gessner, M. O., Dudgeon, D., Prusevich, A., Green, P., Glidden, S., Bunn, S. E., Sullivan, C. A., Liermann, C. R., and Davies, P. M.: Global threats to human water security and river biodiversity, Nature, 467, 555–561, 2010.
Wen, S., Wang, A., Tao, H., Malik, K., Huang, J., Zhai, J., Jing, C., Rasul, G., and Su, B.: Population exposed to drought under the 1.5 °C and 2.0 °C warming in the Indus River Basin, Atmos. Res., 218, 296–305, 2019.
Wineland, S. M., Fovargue, R., York, B., Lynch, A. J., Paukert, C. P., and Neeson, T. M.: Is there enough water? How bearish and bullish outlooks are linked to decision maker perspectives on environmental flows, J. Environ. Manage., 280, 111694, https://doi.org/10.1016/j.jenvman.2020.111694, 2021.
Wu, H. and Qian, H.: Innovative trend analysis of annual and seasonal rainfall and extreme values in Shaanxi, China, since the 1950s, Int. J. Climatol., 37, 2582–2592, 2017.
Yang, Y.-C. E., Brown, C. M., Yu, W. H., and Savitsky, A.: An introduction to the IBMR, a hydro-economic model for climate change impact assessment in Pakistan's Indus River basin, Water Int., 38, 632–650, 2013.
Young, W. J., Anwar, A., Bhatti, T., Borgomeo, E., Davies, S., Garthwaite III, W. R., Gilmont, E. M., Leb, C., Lytton, L., Makin, I., and Saeed, B.: Pakistan: getting more from water, World Bank, http://documents.worldbank.org/curated/en/251191548275645649/pdf/133964-WP-PUBLIC-ADD-SERIES-22-1-2019-18-56-25-W.pdf (last access: 2 December 2022), 2019.
Yu, P.: Likelihood estimation and inference in threshold regression, J. Econometrics, 167, 274–294, 2012.
Zheng, X., Yang, T., Cui, T., Xu, C., Zhou, X., Li, Z., Shi, P., and Qin, Y.: A revised range of variability approach considering the morphological alteration of hydrological indicators, Stoch. Env. Res. Risk A., 35, 1783–1803, 2021.