the Creative Commons Attribution 4.0 License.
the Creative Commons Attribution 4.0 License.
 | 27 Jun 2024
Regional seismic risk assessment based on ground conditions in Uzbekistan
Vakhitkhan Alikhanovich Ismailov
Sharofiddin Ismatullayevich Yodgorov
Akhror Sabriddinovich Khusomiddinov
Eldor Makhmadiyorovich Yadigarov
Bekzod Uktamovich Aktamov
Shuhrat Bakhtiyorovich Avazov
The assessment of losses from strong earthquakes and the reduction in earthquake consequences are of great importance in maintaining seismic safety. Special attention is given to evaluating the magnitude of economic losses caused by earthquakes, particularly the assessment of different levels of seismic risk, in order to protect the population and territories located in seismically active areas. To ensure sustainable development of countries, it is essential to estimate the economic losses that will occur in regions due to strong earthquakes and forecast them within the specified return periods at given probabilities. Measures can then be implemented to mitigate the consequences of earthquakes.
For the basis of seismic risk assessment, maps of seismic intensity increment and an improved map of seismic hazard have been developed, taking into account the engineering-geological conditions of the territory of Uzbekistan and the seismic characteristics of soils.
For seismic risk map development, databases were created based on GIS platforms, allowing us to systematize and evaluate the regional distribution of information on seismic hazards, the number of buildings and construction types, the coefficient of the seismic vulnerability of buildings, the cadastral value of buildings, etc.
- Article
(2633 KB) - Full-text XML
- BibTeX
- EndNote


As of 1 January 2022, the permanent population of Uzbekistan reached 35 271 276 people. Currently, approximately half of all Uzbekistan citizens (17.9 million people) live in urban areas, and 17.4 million people live in rural areas (https://countrymeters.info/ru/Uzbekistan#population_densit, last access: 2 April 2023). In the territory of Uzbekistan and adjacent regions, both during the historical period and recent years, earthquakes with a local magnitude ML≥5 and an intensity at the epicenter I0 reaching VI-X according to the Medvedev–Sponheuer–Karnik (MSK-)64 scale have been recorded, such as the Chatkal (1946), Gazli (1976), and Tashkent (1966) earthquakes, among others. Many relatively strong earthquakes have occurred in Uzbekistan.
Therefore, the problem of ensuring seismic safety in the territory of Uzbekistan is very relevant. The geological structure of Uzbekistan is very diverse, but the territory basically consists of two tectonic structures of the Tien Shan orogenic region and Turan plate. In the territory of Uzbekistan, tectonic movements are actively continuing nearly everywhere. In the geological history of Uzbekistan, throughout all stages of development, in particular in the formation of the modern structural plan, faults, especially zones of deep faults, have played an important role. These faults transect the entire Earth's crust, often penetrate into the mantle, and are the natural boundaries of large structural elements. One of the challenges in assessing seismic risk involves considering the influence of soil conditions on the modification of seismic effects on the ground surface. Thus, a key objective of this study was to investigate the geological and lithological structure of the upper strata.
Risk assessment is crucial for preventing major disasters in the event of a significant seismic threat. The first systematic studies on seismic risk assessment, conducted about 60 years ago, laid the groundwork for future activities (Cornell, 1968; Algermissen et al., 1972; Kontorovich et al., 1973; Whitman et al., 1975; Lomnitz and Rosenblueth, 1976). In recent decades, particularly during the International Decade for Natural Disaster Reduction (IDNDR; 1990–2000), the global community has increasingly recognized the significance of the issue. The shift in focus from hazard to risk, driven by a series of devastating earthquakes worldwide, has prompted the development of procedures and techniques for assessing seismic vulnerability and damage and conducting risk analysis on various geographical scales, e.g., PELEM (1989), Chen et al. (1996, 2002), Papadopoulos and Arvanitides (1996), King et al. (1997), McCormack and Rad (1997), Zonno et al. (1998), Faccioli and Pessina (2000), RADIUS (2000), Bendimerad (2001), Fah et al. (2001), Coburn and Spence (2002), Lang (2002), Frolova et al. (2003), Giovinazzi and Lagomarsino (2004), Mouroux et al. (2004), Trendafiloski and Milutinovic (2004), Tyagunov et al. (2006), Di Pasquale et al. (2005), Wang et al. (2005), and many others. Different interpretations of the risk concept can be found in different publications, although the general consensus is that risk is a quantified possibility of losses.
In the study by Rashidov et al. (2003), the seismic risk of Tashkent was evaluated using a scenario earthquake. Similarly, in the Risk Assessment Tools for Diagnosis of Urban Areas against Seismic Disasters (RADIUS, 2000) project, the seismic risk of the city was assessed employing a scenario earthquake. The estimated total damage resulting from this scenario earthquake, encompassing the disruption of life support systems and infrastructure in Tashkent, amounts to approximately UZS 1 billion. (These loss figures are determined based on 1991 prices and are considerably underestimated.)
Given Tashkent's status as the capital, responsible for a quarter of the country's gross domestic product, the repercussions of an earthquake are poised to impact the entire nation. The potential disruption of numerous international commercial, banking, and insurance networks was anticipated. Human casualties are projected to be significant, with economic recovery likely to span several years. Furthermore, the cessation of industrial production is anticipated to result in losses totaling around USD 1 billion. Preliminary calculations indicate that the scenario earthquake could incur damages exceeding USD 10 billion, considering the book value of fixed assets determined at 1991 prices. Expert assessments suggest that roughly 80 % of communication facilities may remain inoperative for an extended duration, while ongoing construction projects may suffer irreparable damage estimated at approximately USD 1 billion.
Tyagunov et al. (2012) evaluated the seismic risk of central Asian countries. As of today, Peresan et al. (2023a, b), Poggi et al. (2021), Bragato et al. (2020), Petrovic et al. (2022), Scaini et al. (2021, 2024), Bhochhibhoya et al. (2022), and Xin et al. (2021) explore contemporary methods for assessing seismic risk and hazard using modern information technologies. Bhochhibhoya et al. (2022) integrated earthquake risk assessments with vulnerability parameters (social and economic factors) in Nepal. The calculation of the social vulnerability index (SoVI) used a principal component analysis method. OpenQuake, based on classical probabilistic seismic hazard analysis (PSHA), was utilized for calculating annual average losses from engineering risk. In the work of Peresan et al. (2023a, b), the focus is on data collection about buildings through crowdsourcing and distance learning, creating new opportunities to engage students in seismic risk reduction.
The combined aspects of seismic hazard distribution, seismic vulnerability, and exposed assets provide the necessary basis for seismic risk analysis. A similar analysis of the territory of Uzbekistan was the goal of this study, conducted as part of the implementation of the above paragraphs of the Decree of the President of the Republic of Uzbekistan dated 30 July 2020, no. 4794, by the Institute of Seismology of the Academy of Sciences of the Republic of Uzbekistan.
To develop a seismic risk map for the territory of Uzbekistan, databases were created based on GIS platforms, allowing systematization and evaluation of the regional distribution of information on seismic hazard, the number of buildings and structural types, the geographical location of residential buildings, the coefficient of the seismic vulnerability of buildings and territories, the cadastral building value, etc.
Seismic vulnerability analysis was conducted using the GESI_Program software, which is based on the methodology for the assessment of seismic damage to buildings. At the same time, the existing buildings in the territory of the republic were collected and classified according to the building structural type. There are five types of buildings: buildings built using local clay materials, brick buildings, wooden buildings, buildings constructed using a metal frame, and reinforced concrete buildings. In previous studies of urban and regional territories, seismic data analysis considered the influence of local soil conditions (microzoning and detailed zoning), inventory of buildings, and asset values (element-by-element inventories or based on representative units) (V. Ismailov et al., 2022, V. A. Ismailov et al., 2022, Ismailov et al., 2023).
The developed seismic risk map of the territory of the Republic of Uzbekistan was based on an assessment of probable economic losses within administrative districts combined with seismic hazard factors, seismic vulnerability, and concentration of values, ranging from zero to hundreds of trillions of Uzbekistan soums. It is important to emphasize that the level of seismic hazard used in the calculation of physical and economic damage corresponds to a 90 % probability of not exceeding seismic impacts over a period of 50 years, which corresponds to an average return period of 475 years. This level of probability is the generally accepted standard in seismic hazard assessment during the design and construction of conventional buildings and structures. Of course, considering a different probability, the level of hazard and, consequently, the assessment of damage and potential losses may differ from the data presented.
During the development of the map of seismic risk for the territory of the Republic of Uzbekistan and the implementation of this research, the following were considered: seismological and macroseismic databases of the Institute of Seismology of the Academy of Sciences of the Republic of Uzbekistan (https://seismos.uz/, last access: 1 April 2023); a database on the housing stock of Uzbekistan of the state Cadastral Agency under the Tax Committee of Uzbekistan (https://kadastr.uz/uz, last access: 3 April 2023); and research experience and publications of the Institute of Seismology, the Institute of Mechanics and Seismic Stability of Structures of the Academy of Sciences of the Republic of Uzbekistan (https://instmech.academy.uz/ru, last access: 5 April 2023), and JSC Toshuyjoyliti (https://toshuyjoyliti.uz/, last access: 6 April 2023).
The present study is concentrated on the assessment of direct economic losses that may be caused by structural damage to residential buildings as a result of seismic actions. At the same time, given that residential buildings predominate in the development of cities and administrative districts in Uzbekistan, the presented results could serve as a clear reference for a comparative analysis of seismic risk in various administrative districts.
2.1 Characteristics of the engineering-geological conditions
Based on the analysis of geomorphological and geological–lithological structures, as well as groundwater distribution and exogenous geological processes, engineering-geological zoning has been conducted.
The peculiarities of the engineering-geological conditions in the territory of Uzbekistan have been identified and described in the works of Mavlyanov et al. (1987), Kasymov (1979), Islamov et al. (1979), and others. In the territory of the Republic of Uzbekistan there are 14 typical types of soils: rock soils, limestones, sands and sandstones, and others. More detailed information and a map are provided in Fig. 1.
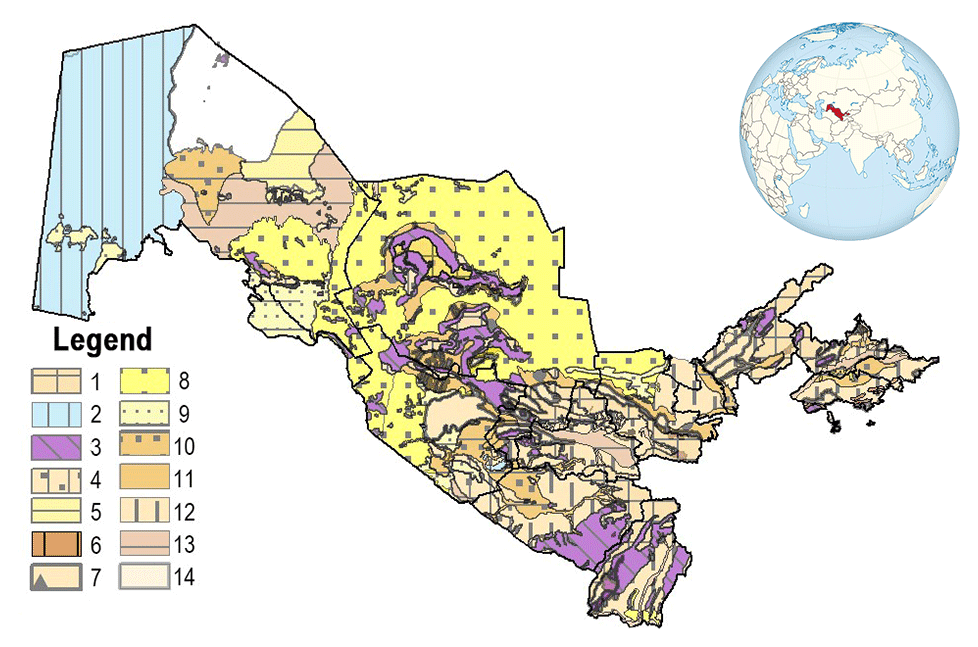
Figure 1Engineering-geological map of the Republic of Uzbekistan. Authors: Islamov et al. (1979). 1 – rock soil; 2 – limestone; 3 – sand and sandstone; 4 – clay and sand; 5 – clay, marl, and sandstone; 6 – clay, sandy clay, and sand; 7 – gravel; 8 – sand; 9 – sand, sandy clay, and sand; 10 – sandy loam and sand; 11 – gravel, pebble, and rubble; 12 – loess, loess loam, and sandy clay; 13 – clay, loam, and sandy clay; 14 – gypsum, loam, and clay.
The complexity of the geological structure of the upper soil layers (10–15 m), the diversity of petrographic and lithological composition of soils, the geomorphological characteristics, and the unique climate determine the variety of engineering-geological conditions in the territory of Uzbekistan. The main features of the republic's orography are closely related to the peculiarities of the geological structure of numerous mountain ranges. Wide plains, intermountain uplifts, and depressions are located between the mountain ranges, characterized by an abundance of weathering products (Kasymov, 1979).
The complexity and diversity of the engineering-geological conditions in Uzbekistan can be explained by the broad distribution of different geological and lithological strata, which exhibit a certain zoning. While metamorphic, igneous, and sedimentary rocks are developed in mountainous and foothill areas, gravel, pebbles, sands, and loamy deposits are prevalent in the vicinity of mountains. Aeolian and alluvial loams, loess soils, and sands are widespread in lowland areas.
The first groundwater tables are distributed at various depths depending on the geomorphological structure. The highest groundwater levels are observed in the plains, especially in areas with active agricultural land development. Groundwaters in rock deposits are mainly confined to fractures and fault zones.
Exogenous geological processes are primarily developed in mountainous and foothill plains and are represented by landslides, rockfalls, and soil erosion.
The seismic risk probability and economic map of the administrative districts of the Republic of Uzbekistan were developed based on the engineering-geological conditions and maps of general seismic zoning (GSZ-2017) (Artikov et al., 2020). Subsequently, seismic vulnerability levels were assessed using the GESI_Program software developed by the RADIUS program of the International Federation of Red Cross and Red Crescent Societies during 1999–2001. The assessment considered various construction materials based on cadastral information, considering the types of buildings and their vulnerability functions. The seismic vulnerability levels of buildings were then evaluated in the districts of the republic. Considering the ground conditions, the economic map of seismic risk probability in the administrative districts of Uzbekistan was developed, showing the probability of not exceeding 50 % within 90 years (in trillion soums).
2.2 Seismic hazard and seismic risk
2.2.1 Assessment of seismic hazard considering soil conditions and comparison with previous studies
Variation in seismic intensity increments across the territory of Uzbekistan has been examined. An improved map of seismic zoning of the territory of the Republic of Uzbekistan (Artikov et al., 2020) has been compiled, considering the seismic properties of soils of different categories (Fig. 2).
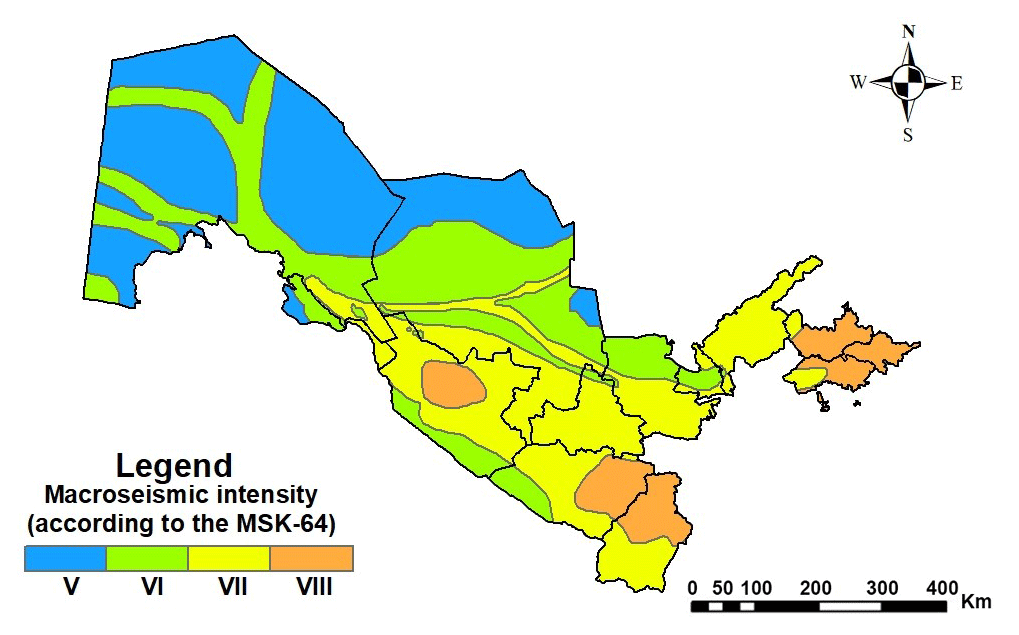
Figure 2Map of general seismic zoning (GSZ-2017) of the Republic of Uzbekistan with a probability of not exceeding P=90 % in 50 years. Authors: T. Artikov, R. Ibragimov, T. Ibragimova, and M. Mirzaev (adapted from Artikov et al., 2020).
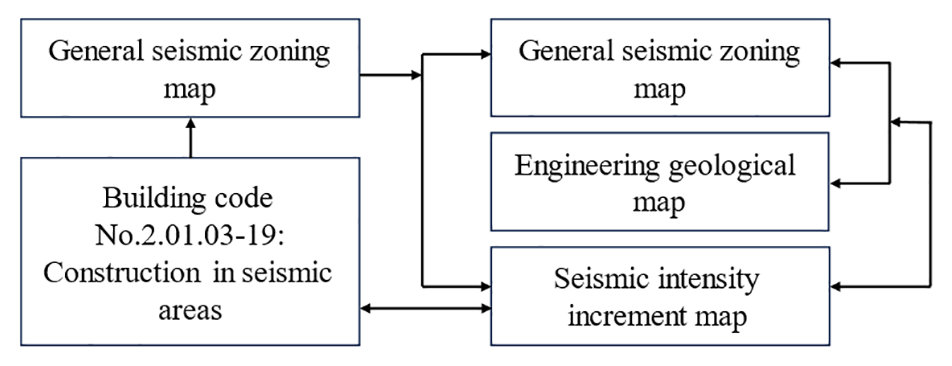
In the national building code no. 2.01.03-19, “Construction in Seismic Areas” (Ismailov et al., 2023), soils have been systematically classified into three categories based on their seismic properties, with corresponding seismic intensity increments established for each category, taking into account the engineering-geological conditions of the soils. The assessment specifically targeted the upper 10 m strata. For the first category, encompassing rock soils, the seismic intensity increment is reduced by 1. This adjustment is based on the observation that structures within the region tend to experience a lower intensity, typically differing by approximately −1 from the regional intensity during an earthquake. Similarly, the second category, comprising sandy and analogous soils, maintains the same seismic intensity as the considered region. In contrast, the third category, encompassing clays, loess, and other soils with limited seismic resistance, witnesses a seismic intensity increment increased by 1. The GSZ-2017 (Fig. 2) is calculated based on the second category of soils. Using the lithological data of rocks located within the territory of the Republic of Uzbekistan depicted in Fig. 1, along with the GSZ-2017 (Fig. 2), we have created a schematic map illustrating seismic intensities across the Republic of Uzbekistan (Fig. 3).
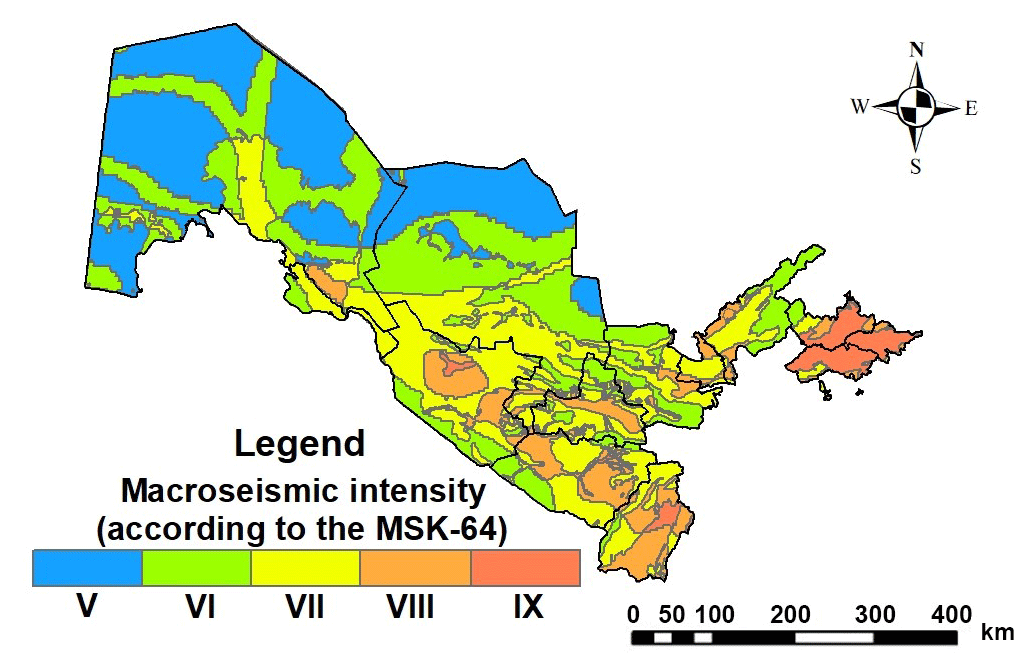
Figure 3The schematic map of seismic intensity in the territory of the Republic of Uzbekistan.
The assessment of seismic risk in the territory of the Republic of Uzbekistan was conducted taking into account the experience of countries such as Germany (Tyagunov et al., 2006), Italy (Pasquale et al., 2005), and Russia (Zaalishvili et al., 2019). The basis for this assessment was the GSZ-2017 map for a 90 % probability of not exceeding seismic effects over a 50-year period. Therefore, we utilized the GSZ-2017 map of the territory of Uzbekistan (Artikov et al., 2020) for the evaluation of seismic hazard of the territory.
In accordance with the local building code, all soils have been systematically classified into three categories based on their seismic properties, and corresponding seismic intensity increments have been determined for each category. The evaluation focused on the upper 10 m strata. For the first category, encompassing rock soils, the seismic intensity increment was reduced by 1. This adjustment is rooted in the observation that when the region is subjected to an earthquake, structures within it experience a lower intensity, typically differing by approximately −1 from the regional intensity. Similarly, the second category, consisting of sandy and analogous soils, maintains the same seismic intensity as the considered region. In contrast, the third category, which includes clays, loess, and other soils with limited seismic resistance, witnesses a seismic intensity increment increased by 1. Consequently, a seismic intensity increment map has been compiled at a scale of 1:1 000 000. The Republic of Uzbekistan has been partitioned into zones reflecting seismic intensity increments of −1, 0, and 1. In simpler terms, this map delineates areas where the same earthquake may induce more significant destruction due to unfavorable soil conditions and areas where the impact would be comparatively reduced.
Based on the compiled map of seismic intensity increments, adjustments have been made to the map of GSZ-2017 (Artikov et al., 2020) (Fig. 2). As a result, the seismic intensity for the entire territory of Uzbekistan has been determined, taking into account the soil categories based on seismic properties. Figure 3 shows the map of seismic intensity in macroseismic units developed using a methodology (Fig. 4) that incorporates soil conditions in assessing earthquake intensity. As can be seen on the map (Fig. 3), a zone with an intensity of 9 has appeared, which indicates that there were unfavorable soil conditions, such as areas with clays or loess soils with a high level of water table (Table 1).
Table 1Comparison of the ratio of areas with different intensities (based on the MSK-64 macroseismic scale) between two seismic hazard maps, one considering ground conditions and the other not.
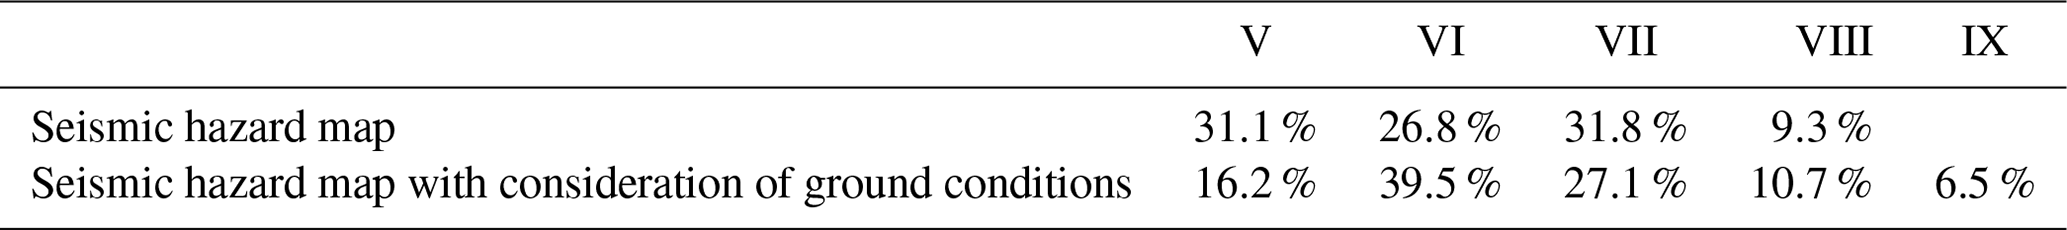
There are some differences in values and established boundaries of seismic hazard zones between the map of GSZ-2017 of the Republic of Uzbekistan and the compiled map of seismic intensity in the territory of the Republic of Uzbekistan. These differences are due to the delineation of different zones based on seismic intensity parameters, related to the distribution of soils of Categories I and III. For example, in the map of GSZ-2017 of the Republic of Uzbekistan, the zone with a Category I of VII is subdivided into zones with intensities of VI, VII, and VIII on the seismic intensity map, depending on the soil conditions. However, the entire territory of the republic is divided into zones with seismic intensities of V, VI, VII, VIII, and IX.
2.2.2 The regional seismic risk assessment
The pilot project titled Regional Seismic Risk Assessment Based on Soil Conditions in Uzbekistan encompassed the entirety of Uzbekistan's territory. We conducted seismic risk assessments for both the Jizzakh region (Aktamov et al., 2020) and the city of Tashkent (Rashidov et al., 2003). Utilizing geological, seismotectonic, and seismological data, earthquake scenarios were formulated to evaluate the seismic risk in these areas (RADIUS). Additionally, social (individual) seismic risk was calculated for the Andijan region based on the earthquake scenario.
In the RADIUS project (1992), the seismic risk of Tashkent was evaluated using an earthquake scenario. The estimated total damage from such a scenario earthquake, accounting for the disruption of life support systems and infrastructure in Tashkent, stands at approximately UZS 1 billion. (These loss figures, based on 1991 prices and book values, are significantly underestimated.) Given Tashkent's status as the capital, where a quarter of the country's gross domestic product is generated, the earthquake's repercussions are expected to extend nationwide. Numerous international commercial, banking, and insurance connections are likely to face temporary disruptions, and the toll on human lives will be significant. Economic recovery is projected to span years, with industrial production shutdowns expected to result in losses of approximately USD 1 billion. Preliminary calculations indicate that a scenario earthquake could incur damages exceeding USD 10 billion (taking into account the book value of fixed assets determined at 1991 prices). Expert estimates suggest that roughly 80 % of communication facilities may remain inoperative for an extended duration, while ongoing construction projects could suffer approximately USD 1 billion in irreparable damage.
For individual (social) seismic risk assessment, a scenario earthquake map was developed using the GIS tool Extremum, jointly developed by the Center for Emergency Situations and Disaster Risk Reduction, the Seismological Center of the Institute of Geoecology of the Russian Academy of Sciences, and the Research Institute of Geoecology of the Russian Academy of Sciences under the Ministry of Civil Defense, Emergencies and Disaster Relief of Russia. Data from the 1902 Andijan earthquake were utilized. Based on these calculations, a map depicting individual seismic risk was produced for the Andijan region and surrounding areas (Inagamov et al., 2005). It is estimated that casualties among the population could reach 8260, with total casualties (including injuries) potentially reaching 13 440.
During the assessment of seismic hazards, a seismic hazard map of the Republic of Uzbekistan was developed based on the engineering-geological conditions of the research areas and general seismic zoning maps. Subsequently, seismic vulnerability levels were evaluated, utilizing the GESI_Program software developed under the international RADIUS project of the United Nations from 1999 to 2001, and data were provided by the Cadastral Agency of the Republic of Uzbekistan. Accordingly, considering the types of construction materials based on the information provided by the Cadastral Agency, the vulnerability functions were established, and based on these functions, the seismic vulnerability levels of buildings constructed in districts across the republic were assessed in a systematic manner. Taking into account soil conditions, an economic map of seismic risk in the administrative districts of the Republic of Uzbekistan was developed, with a probability of seismic risk not exceeding 50 % within 90 years (in billion soums).
2.3 Seismic vulnerability
The seismic vulnerability of buildings is the ratio of the expected costs of restoring structures that may be subjected to destructive seismic events of a given intensity to their initial cost. Vulnerability ranges from 0 (no damage) to 1.0 (irreparable). By knowing the current value of a structure, the monetary damage can be determined. The relationship between vulnerability and seismic impact (e.g., in degrees) is referred to as the vulnerability function. Vulnerability functions play a central role in regional seismic loss assessment.
A vulnerability function represents the relationship used to forecast statistics (such as mean value or standard deviation) of seismic loss distribution. It predicts the extent of damage that a structure (e.g., residential building or bridge) will experience under the probability of seismic events. It should be noted that vulnerability functions are calculated separately for each type of building listed in the cadaster.
Vulnerability functions for the identified structural building types within the territory of the Republic of Uzbekistan were developed using the GESI_Program software, which is a computer program based on the assessment of structural damage under specified seismic events (Fig. 5), which we used for the vulnerability of buildings to assess the seismic risk of the territory of the Republic of Uzbekistan. This software was developed as part of the United Nations' Global Earthquake Safety Initiative (GESI) pilot project in 1999–2001. The primary data used for the program's development were collected within the framework of the international Risk Assessment Tools for Diagnosis of Urban Areas against Seismic Disasters (RADIUS) project, conducted by the UN-IDNDR Secretariat in 1998–1999. The vulnerability function used to assess seismic risk was created in an experiment involving cities such as Addis Ababa (Ethiopia), Antofagasta (Chile), Bandung (Indonesia), Guayaquil (Ecuador), Zigong (China), Izmir (Turkey), Skopje (Macedonia), Tashkent (Uzbekistan), and Tijuana (Mexico). The experiment utilized identical building materials in the respective cities. The vulnerability index for the city of Tashkent in the experiment did not exceed 10 % of the total (RADIUS, 2000).
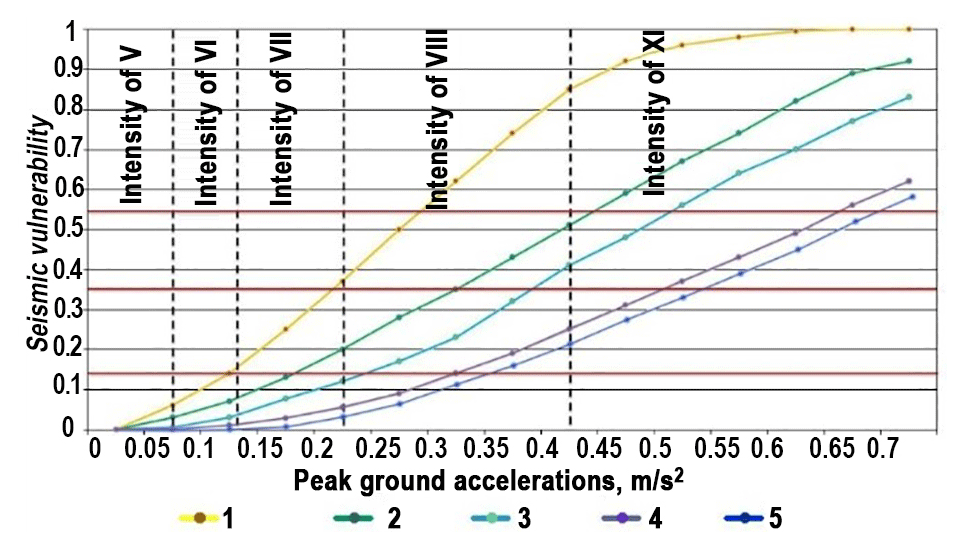
Figure 5Vulnerability function for the different building types. 1 – adobe (local), 2 – masonry, 3 – wooden, 4 – concrete, 5 – metal frame.
In Fig. 5, in addition to the vulnerability functions, the boundary conditions of damage are also presented, characterized by the overall direct costs of restoring buildings to their initial condition, and the relationship between peak ground acceleration (PGA) and intensity (according to the MSK-64 macroseismic scale) was calculated using the equation ± 0.08 (Aptikaev, 2012).
The different building types include buildings built using local materials (adobe, guvalyak, pakhsa, and raw bricks), masonry buildings, wooden (chopped or panel) residential buildings, concrete (panel, large-panel, monolithic, and reinforced concrete) buildings, and buildings with a metal frame or a frame with diaphragms (ties).
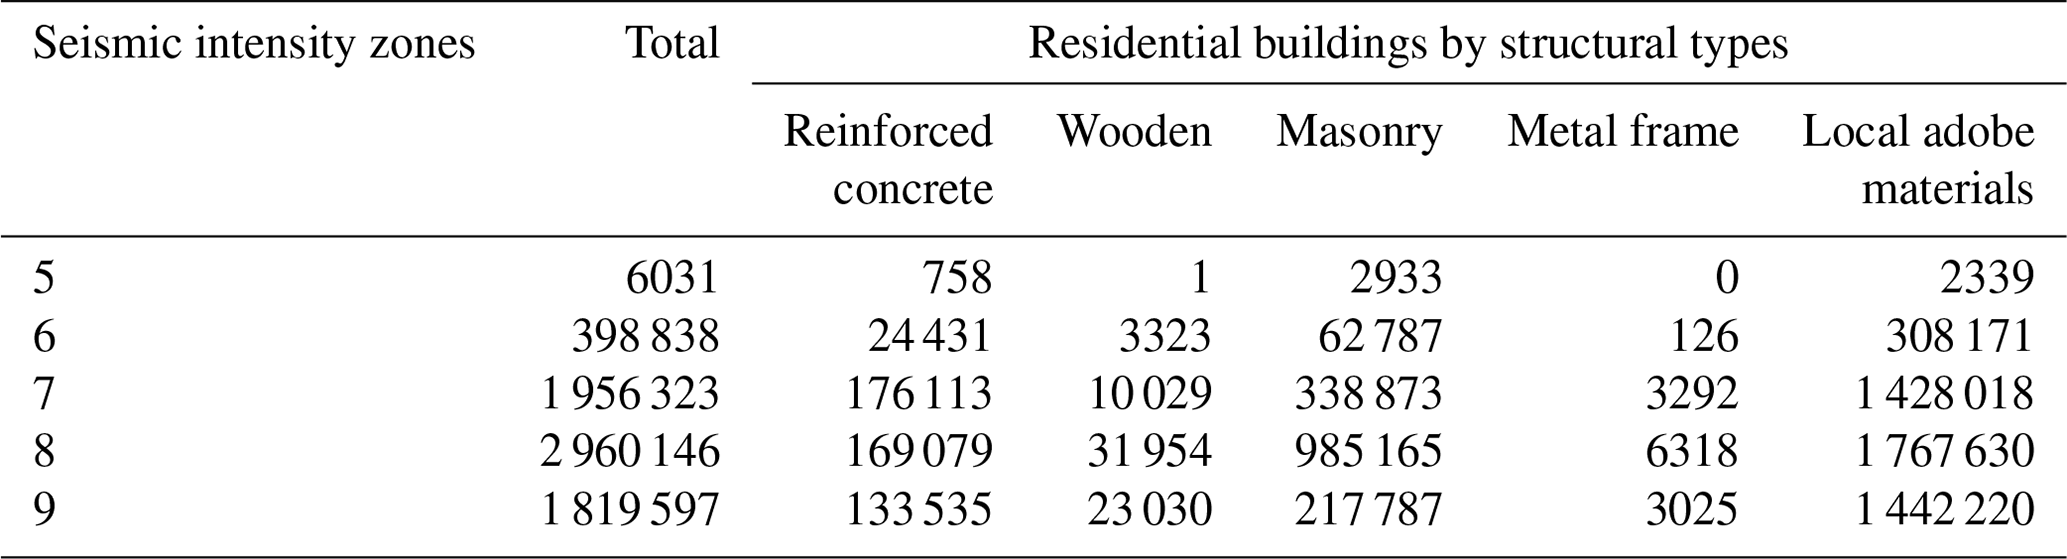
As of 1 February 2021, at the republican level, 7 135 881 residential buildings were analyzed and systematized by employees of the Institute of Seismology of the Academy of Sciences of Uzbekistan with a total area of 4.4×10⁹ m2. These buildings were categorized by the material of the structural system and aggregated by administrative regions (Table 2).
Table 2Residential buildings categorized by the material of the structural system within zones of different seismic intensities.
The vulnerability function for each structural type of buildings was determined using the GESI_Program software, which served as the basis for calculating seismic vulnerability by administrative regions. For the aggregation of values of the seismic vulnerabilities of buildings, the equation proposed by Tyagunov et al. (2007) was used (Eq. 1).
Here, MVR represents the average value of seismic vulnerability for the territory of the district, MVRi represents the average value of seismic vulnerability for the identified structural types of buildings, and N represents the number of buildings by structural type within the administrative district.
Thus, administrative districts with seismic vulnerability values of 0–0.15, 0.16–0.3, 0.31–0.45, 0.46–0.6, and 0.61–0.75 were identified. These values were aggregated to create a schematic map of seismic vulnerability for the administrative districts of the Republic of Uzbekistan (see Fig. 6).
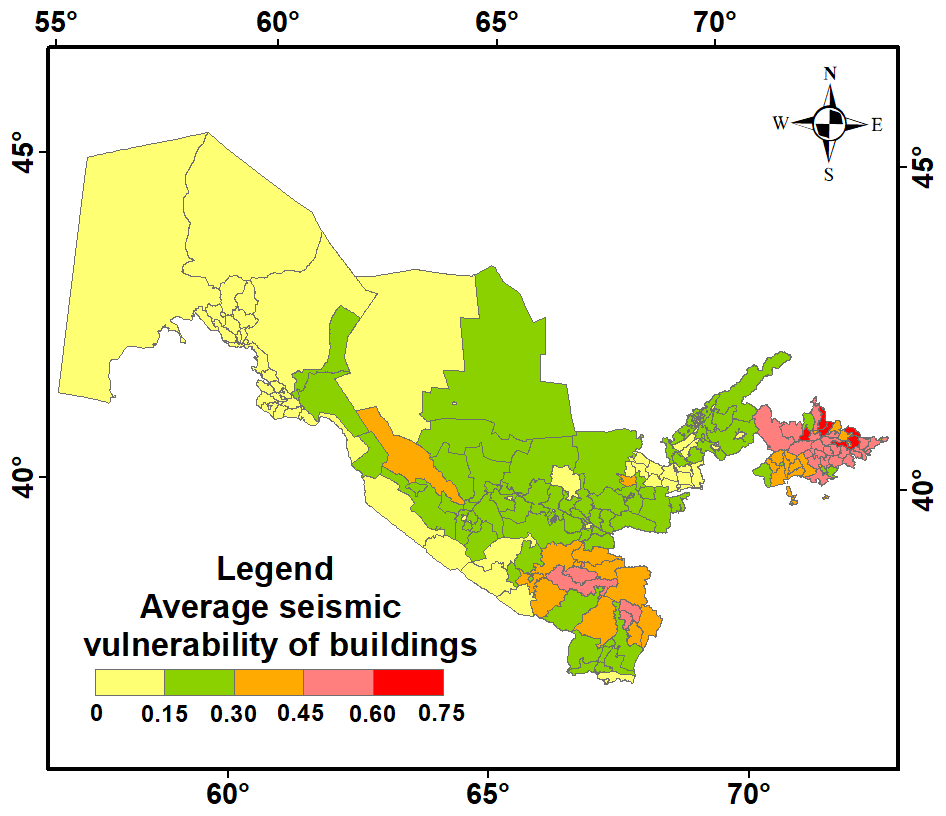
Figure 6Map of the average values of the seismic vulnerability of buildings for the administrative districts of the Republic of Uzbekistan.
The schematic map of seismic vulnerability is the basis for the assessment of possible damage at given values of seismic impacts.
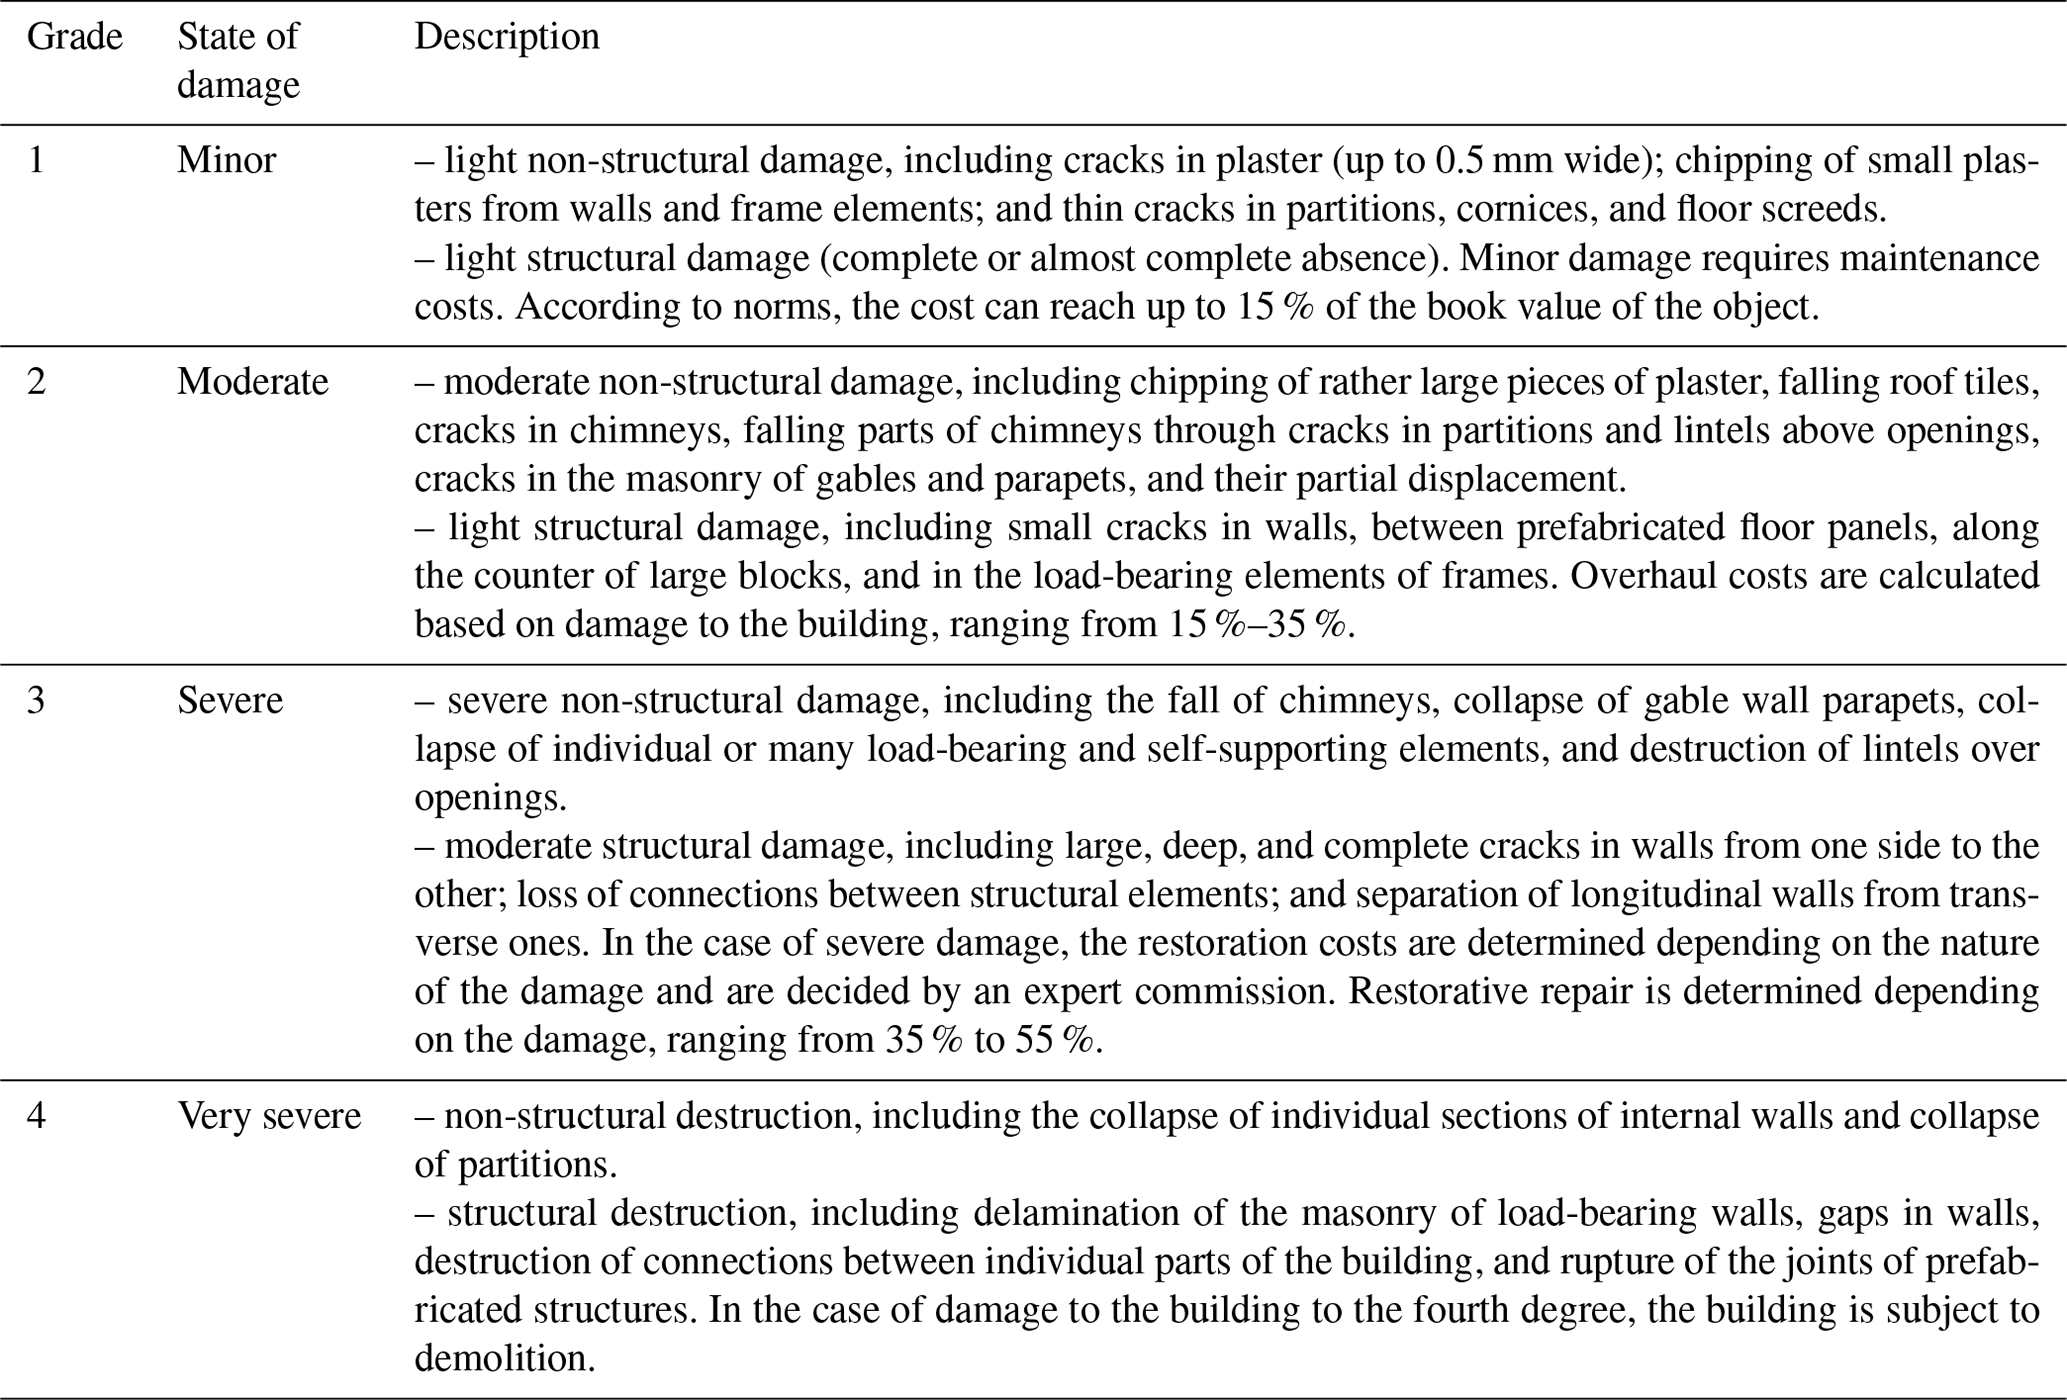
The GESI_Program1 consists of five sets of input parameters that characterize the type of structure, design features, quality of construction, quality of building materials, and level of seismic impacts in the peak acceleration process. Based on these input parameters, a damage diagram and building vulnerability function are constructed. Damage to buildings is rated at four levels: light, moderate, heavy, and very heavy (Table 3).
The seismic vulnerability is estimated as a percentage of the damage due to peak acceleration.
According to this definition, the vulnerability of buildings is considered a property of a given structure capturing the loss of qualitative or quantitative indicators of reliability and safety due to any impact. The vulnerability ranges from 0 (no damage) to 1 (irreparable). The dependence of the vulnerability on seismic impact (for example, in intensity) is denoted as the vulnerability function.
The vulnerability function relating the degree of damage to the level of seismic impact, given in intensity, is usually determined empirically.
For a detailed assessment of the damage to buildings under different intensities of seismic impacts and to compile vulnerability functions for specific structural types of buildings, calculations were performed in GESI_Program.
A comparison of the results revealed (Fig. 7) that macroseismic observations of the damage to the buildings under consideration greatly differ from the calculation results obtained with GESI_Program, but at the intensity of 7.3 the observations and calculation results coincide. Closer matches are shown in graphs obtained via calculation using GESI_Program (RADIUS, 2000) and experimental data of Khakimov (2017). Based on these data, it can be assumed that the use of GESI_Program in the assessment of the vulnerability of various construction types of buildings yields better results, at least excluding subjective opinions when comparing the vulnerability of buildings.
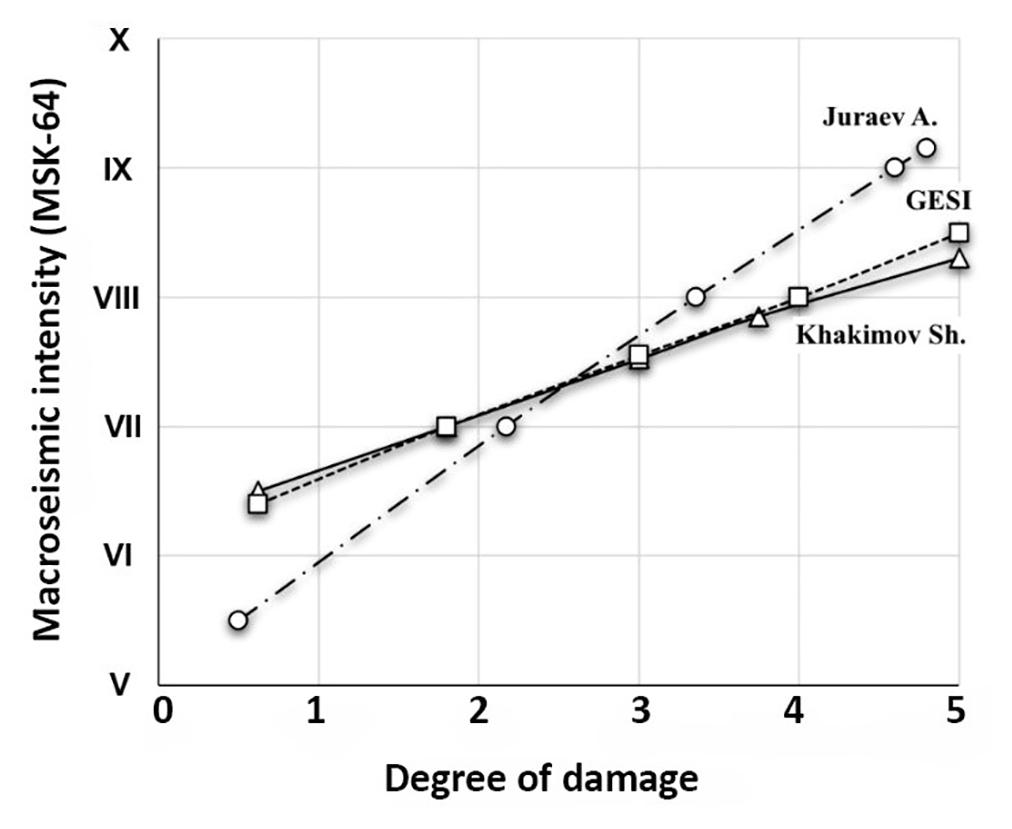
Figure 7Graph of changes in the average degree of damage to individual mud-brick houses depending on the seismic intensity according to different authors.
The vulnerability function, which relates the degree of damage to the level of seismic impact, given in MSK-64 intensity or peak ground acceleration values, is usually determined empirically or via calculation methods. When studying the engineering consequences of strong local earthquakes, world statistics of damage data for classes of objects located in the study area under similar seismogeological conditions are involved. To date, the Institute of Seismology of the Academy of Sciences of Uzbekistan has accumulated a large amount of data on the consequences of strong earthquakes. However, the range of observed intensities remains insufficient to obtain full-fledged regional loss matrices. Therefore, at this stage, we limited ourselves to using the GESI_Program software, which, at the moment, is the best way to model and evaluate the relationship between the degree of damage and level of seismic impact.
This paper represents the first attempt to compile an extensive database of residential buildings in Uzbekistan and involves significant efforts to include the most at-risk assets in the territory. At the same time, a database of the housing stock in the republic was formed based on the database of the state Cadastral Chamber of the Cadastral Agency under the Tax Committee of Uzbekistan.
Residential buildings in the territory of Uzbekistan could be divided into five main types of structural systems:
-
type A – local adobe materials (guvalyak, pakhsa, and raw bricks)
-
type B – masonry
-
type C: – wooden (chopped or panel)
-
type D – concrete (panel, monolithic, and reinforced concrete)
-
type E – metal frame or a frame with diaphragms (ties).
These 5 types of buildings could be subdivided into 20 different subtypes according to their structural features and year of construction (Table 4). This classification of the buildings is typical not only for Tashkent, but also for other cities in Uzbekistan and central Asia. The buildings were also classified according to the number of stories and type of material of the supporting structures.
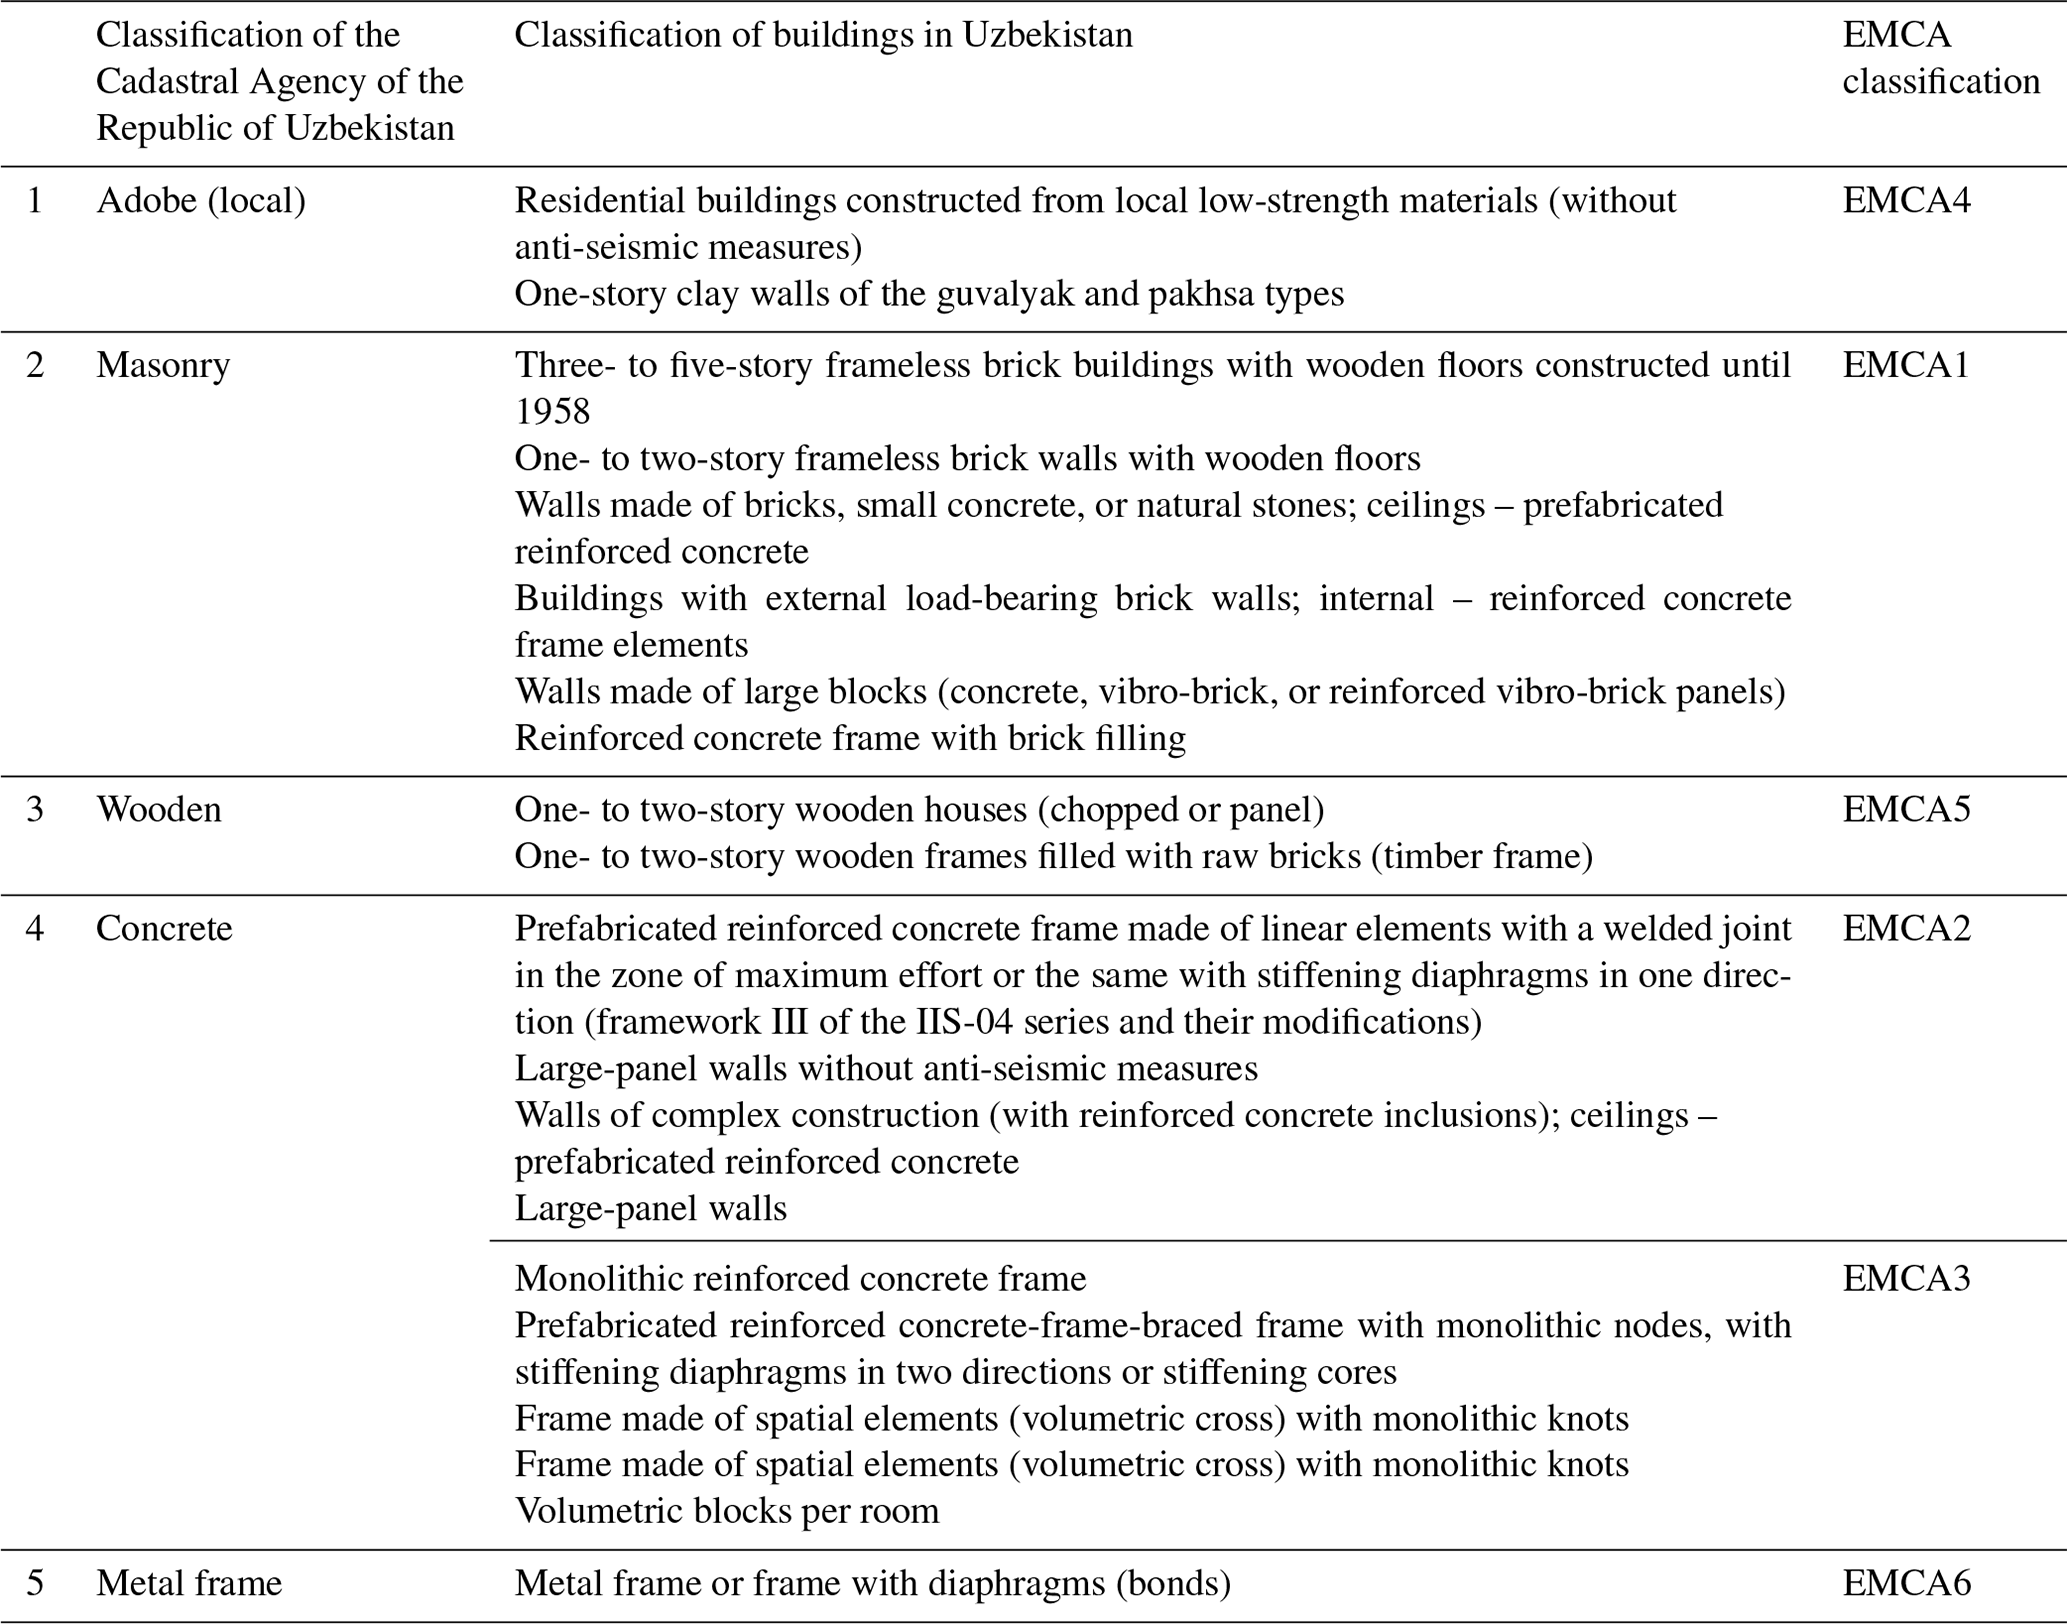
We have taken the classification data of buildings from the database of the Cadastral Agency of Uzbekistan. For reference, the comparison between our data and EMCA (Earthquake Model Central Asia) is presented in Table 4.
2.4 Distribution of residential buildings by the material and their cadastral value
According to cadastral data, as of 1 February 2021, the housing stock in Uzbekistan consisted of 7 135 881 houses and apartments.
Depending on the demographic situation, the number of residential buildings in the territory of the republic exhibits a very uneven distribution. The housing stock in Uzbekistan is divided into two main types: individual houses (80.1 %) and multi-story residential buildings (19.9 %). Individual houses are typically one- or two-story buildings intended for one or two families, while residential buildings consist of multiple separate apartments.
It should be noted that in the housing stock of the republic, there are 44 827 multi-story buildings consisting of 1 375 623 apartments, which are also considered when compiling the residential building database.
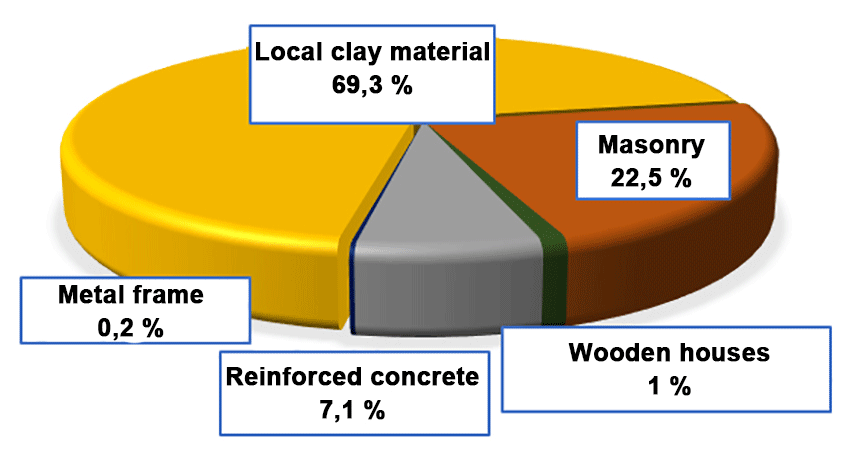
These types of buildings are distributed unevenly in quantitative terms and spatially, so among these buildings, buildings built using local materials are the most widespread. These buildings are highly represented in rural areas (settlements, towns, cities, etc.) and comprise about 70 % of the total number of residential buildings in Uzbekistan. The buildings built of wood (including panel houses) or metal frames comprise less than 1 % of the total number of residential buildings. Figure 8 shows the distribution of residential buildings by the material of the structural system.
The cadastral value of residential buildings in the administrative areas is also important information for developing maps of seismic risk, as well as for the government implementing policies to increase the seismic resilience of buildings and structures. Figure 9 shows the cadastral value of housing stock within the Republic of Uzbekistan and its administrative areas.
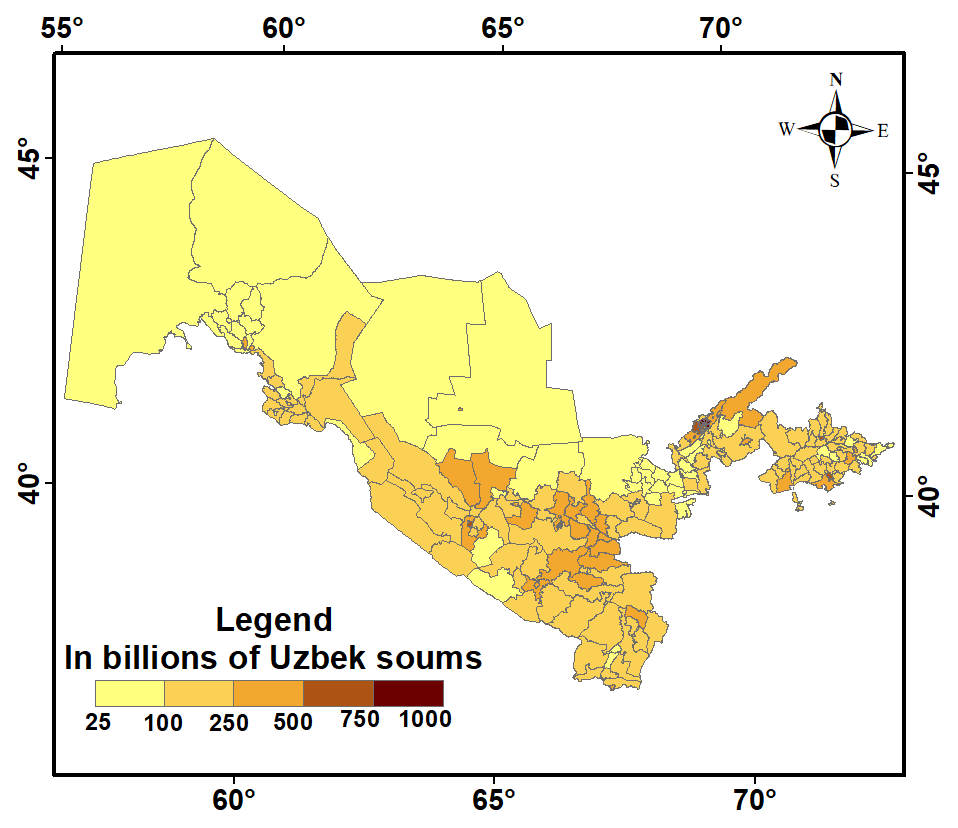
Figure 9Map of the total cadastral value of the housing stock within the administrative regions of the Republic of Uzbekistan.
Based on given data, seismic risk assessment of the territory of the Republic of Uzbekistan is performed in the next section.
Analysis of given data demonstrates a large spread in the number of buildings by structural types. For example, in the Kashkadarya region, the share of buildings built from local clay material exceeds 83 % (UZS 27 trillion) of the total number of residential buildings; in the Samarkand (UZS 40 trillion) and Andijan regions (UZS 21 trillion), the share is 82 %; and in the Tashkent region, the share is 48.3 % (UZS 16 trillion). In large cities, the percentage of adobe residential buildings is smaller and ranges from 13 % to 27 %. This circumstance must be considered when assessing the seismic risk, since the amount of damage due to an earthquake in the selected territorial units depends on the proportion of the specific structural types of buildings.
To assess the seismic risk within the context of the administrative districts of the Republic of Uzbekistan, it is necessary to take into account the share of the housing stock across all administrative districts, considering zones with different intensities. The number of residential buildings located in the territory with different seismicity values, expressed by peak ground accelerations, is shown in Fig. 10. This diagram shows that a large number of buildings, approximately 31 % of the total number of residential buildings, is located in the territory, with PGA ranging from 0.1 to 0.15 m s−2; 27 % of the buildings are located in areas with PGA of 0.15–0.20 m s−2; and more than 30 % are located in areas with peak accelerations higher than 0.20 m s−2, representing the zone with an intensity of VIII (according to EMS-98, https://www.franceseisme.fr/EMS98_Original_english.pdf, last access: 10 April 2023).
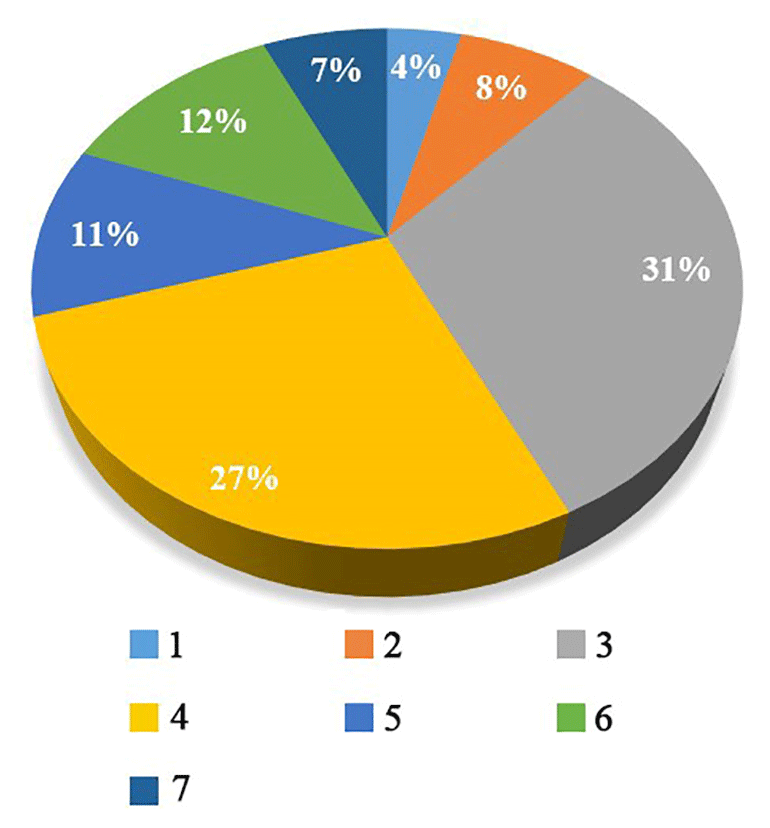
Figure 10Distribution of residential buildings in areas with different seismic effects (values of the peak ground acceleration are given in meters per second squared). 1: 0–0.05, 2: 0.05–0.10, 3: 0.10–0.15, 4: 0.15–0.20, 5: 0.20–0.25, 6: 0.25–0.30, 7: 0.30–0.35.
Information on the distribution of residential buildings by the material of the structural system depending on zones with different seismic effects is given in Table 5.
Table 5Distribution of residential buildings by the material of the structural system (as of 1 February 2021).
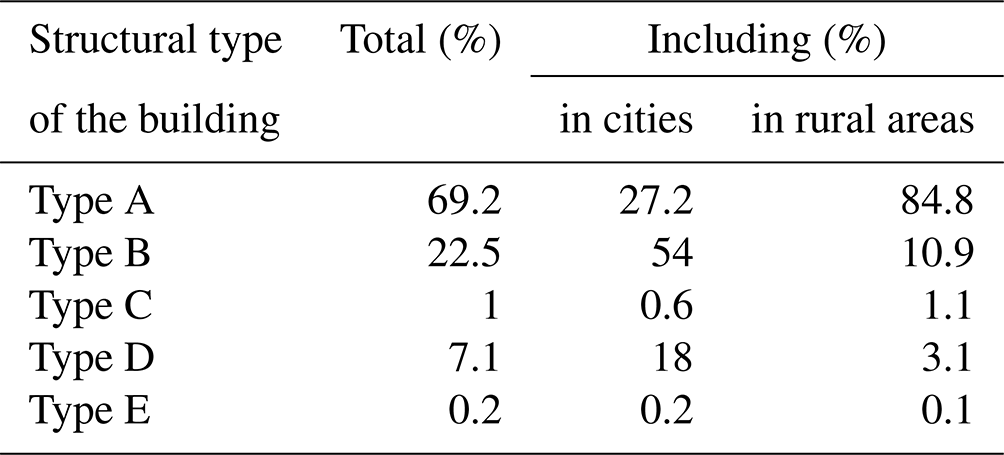
Figure 11 shows a microscale map depicting the seismic risk assessment of potential economic losses across the territory of the Republic of Uzbekistan. This seismic risk map assesses the probability of economic damage within the administrative districts under the maximum level of seismic impact for a return period of T=475 years.
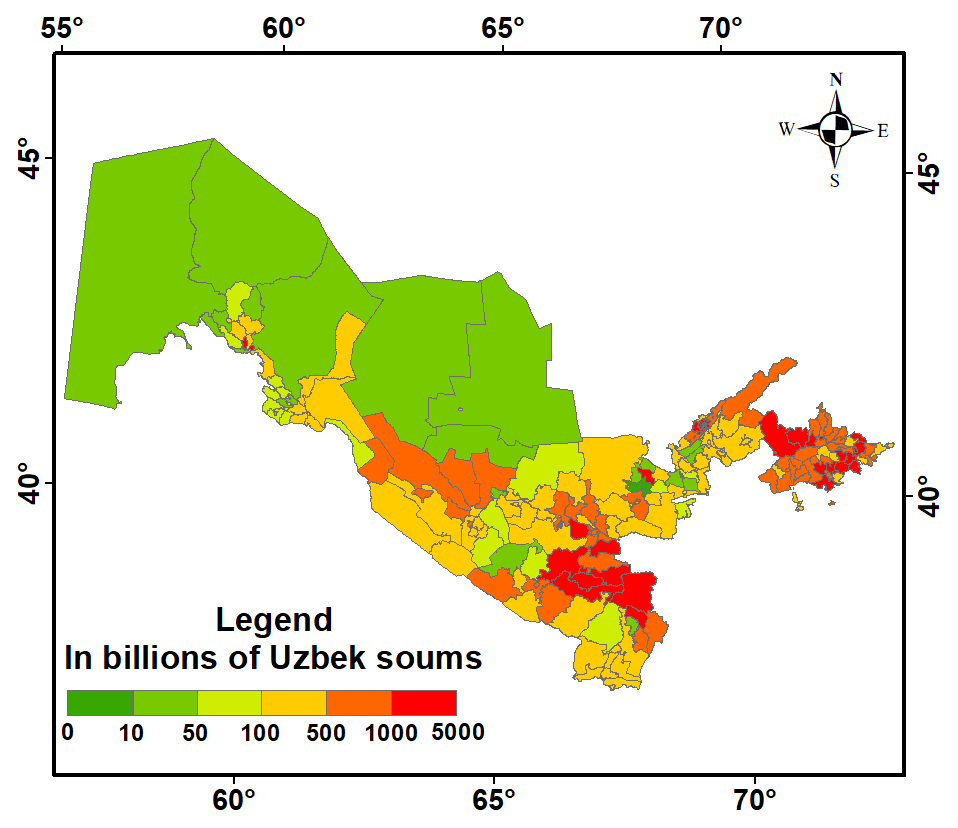
Figure 11Seismic risk assessment of the probable economical losses (in billions of Uzbekistan soums) by administrative regions of the Republic of Uzbekistan.
The developed map of seismic risk of the territory of the Republic of Uzbekistan is based on the assessment of probable economic losses within administrative regions, depending on the combination of seismic hazard factors, seismic vulnerability, and concentration of values. It is important to emphasize that the level of seismic hazard used in the calculation of physical and economic damage corresponds to a 90 % probability of not exceeding seismic impacts for 50 years, which corresponds to an average return period of 475 years. This study is limited to the use of the return period of 475 years because this level of probability is the generally accepted standard in seismic hazard assessment during the design and construction of conventional buildings and structures. Of course, considering a different probability, the level of danger and estimates of damage and potential losses may differ from the data presented.
The present study covered only the assessment of direct economic losses that may be caused by structural damage to residential buildings as a result of seismic events. At the same time, given that residential buildings predominate in the development of cities and administrative districts of the Republic of Uzbekistan, the presented results could serve as a clear reference for a comparative analysis of the seismic risk in various administrative districts.
Based on the study of geomorphological and geological structures, as well as changes in the composition of the upper 10 m soil strata, features of changes in engineering-geological conditions and seismic resistance of soils in the territory of Uzbekistan have been identified. Using the map of general seismic zoning (GSZ-2017) of the country with a 90 % probability of not exceeding seismic impacts over a 50-year period and considering seismic intensity increments, a microscale seismic intensity map (1:1 000 000) for the entire republic has been developed. The seismicity of the territory has been calculated, taking into account soil categories by their seismic properties. Seismically hazardous areas consist of different soil conditions, whereas the GSZ map considers average soil conditions. By meticulous consideration of soil conditions of the regions, the reliability of the assessment of seismic hazard in regions has been increased.
At the national level, as of 1 February 2021, a systematic electronic database has been created, containing information on 7 135 881 real estate properties, specifically residential buildings. Each property has been grouped based on its construction type and coordinates in relation to administrative districts. This comprehensive database has been established to facilitate the quantitative assessment of potential building damage during strong earthquakes, enabling the identification of preventive measures to mitigate possible losses.
Based on the compiled schematic map of seismic intensity for the territory of Uzbekistan and the vulnerability functions established for each construction type, the seismic vulnerability of the developed areas within the administrative districts has been determined. The values of seismic vulnerability for the administrative districts fall within the following ranges: 0–0.15, 0.16–0.3, 0.31–0.45, 0.46–0.6, and 0.61–0.75. From these vulnerability values, it is possible to determine the degree of vulnerability for each region.
Seismic vulnerability analysis and assessment were conducted using GESI_Program. Vulnerability models built depending on the construction types of residential buildings characterized the vulnerability of residential buildings in all administrative regions of Uzbekistan, which are subsequently considered to be calculation cells. To assess the magnitude of potential damage in monetary terms, cost indicators of the restoration of residential buildings were used. Seismic impacts were considered within the framework of the project in the form of a probabilistic seismic hazard map. This approach allows for a comparative analysis of the distribution of seismic risk across seismically hazardous areas.
The present study covered only the estimation of direct economic losses of residential buildings in the Republic of Uzbekistan. At the same time, considering that residential construction predominates in the development of many states, the presented results can serve as a clear guide for a comparative analysis of risks across the entire seismically hazardous territory. The obtained results and such seismic risk maps can serve as a basis for the development of plans and measures to reduce the existing level of risk and prevent catastrophic consequences of future earthquakes for government agencies dealing with emergency situations.
The seismic hazard map of Uzbekistan (Artikov et al., 2020) was used as a basis for creation seismic risk maps of the territories of Uzbekistan Any other information used is licensed for public use.
VAI, SIY, and ASK: conceptualization, validation, development of methods for assessing seismic risk on a regional scale, formal analysis, and writing (review and editing). EMY, BUA, and SBA: data collection, formal analysis, software, mapping, and risk assessment.
The contact author has declared that none of the authors has any competing interests.
Publisher's note: Copernicus Publications remains neutral with regard to jurisdictional claims made in the text, published maps, institutional affiliations, or any other geographical representation in this paper. While Copernicus Publications makes every effort to include appropriate place names, the final responsibility lies with the authors.
This article is part of the special issue “Regionally consistent risk assessment for earthquakes and floods and selective landslide scenario analysis in Central Asia”. It is not associated with a conference.
This work was funded by grants from the Academy of Sciences of the Republic of Uzbekistan under the Development of scientific foundations for assessing various levels of seismic risk and reducing earthquake losses in seismically active areas project and the Research of the compaction properties of dispersed soils during strong earthquakes in laboratory and field conditions and development of its classification project, as well as the Agency for Innovation Development (nos. ALM202311142839, AL5822012294, AL5822012298) under the following projects: Creation of a simulation digital model of the city of Tashkent allowing to assess the level of economic damage from strong earthquakes, Development of technology for predicting the risk of strong earthquakes, Create an electronic database on seismological soil characteristics to replace Table 1.1 in the regulatory document: seismological part of KMK construction of seismic areas, and Regionally coordinated assessment of earthquake and flood risks and selective analysis of landslide scenarios to strengthen financial resilience and accelerate risk reduction in Central Asia, funded by the Strengthening Financial Resilience and Accelerating Risk Reduction (SFRARR) EU program under the European Union and implemented by the World Bank. We sincerely thank all the project team members, in particular Sergey Tyagunov, Paola Ceresa, Antonella Peresan, Gabriele Coccia, Denis Sandron, and Stefano Parolai, and the World Bank specialists, in particular Stuart Alexander Fraser and Madina Nizamitdin, for their constructive contributions to the project. We are grateful for the suggestions and feedback from the editor and the two reviewers, which substantially improved the paper.
This paper was edited by Chiara Scaini and reviewed by two anonymous referees.
Aktamov, B. U., Ismailov, V. A., and Yodgorov, Sh. I.: Earthquake damage assessment of buildings in rural areas (in the sample of Jizzakh region), Int. J. Geol., 10, 35–42, 2020.
Algermissen, S. T., Riehart, W., Dewey, J., Steinbrugge, K. V., Lagorio, H. J., Degenkolb, H. J., McClure, F. E., Scott, S., and Gordon, R. F.: A study of earthquake losses in the San Francisco Bay area: Data and analysis, NOAA – National Oceanic and Atmospheric Administration, Washington, D.C., https://repository.library.noaa.gov/view/noaa/55706 (last access: 20 April 2023), 1972.
Aptikaev, F. F.: Instrumental scale of seismic intensity, Nauka i Obrazovanie, Moscow, 175, ISBN 978-5-906235-02-2, 2012.
Artikov, T. U., Ibragimov, R. S., Ibragimova, T., and Mirzaev, M. A.: Complex of General Seismic Zoning (GSZ-2017) of Uzbekistan, Geodesy and Geodynamics, 11, 273–292, https://doi.org/10.1016/j.geog.2020.03.004, 2020.
Bendimerad F.: Modeling and Quantification of Earthquake Risk: Application to Emerging Economies: Mitigation and financing of seismic risks, edited by: Kleindorfer, P. R. and Sertel, M. R., Kluwer Acad. Publ., 40, ISBN 9780792370987, 2001.
Bhochhibhoya, S. and Maharjan, R.: Integrated seismic risk assessment in Nepal, Nat. Hazards Earth Syst. Sci., 22, 3211–3230, https://doi.org/10.5194/nhess-22-3211-2022, 2022.
Bragato, P. L., Barnaba, C., Scaini, C., and Sugan, M.: Time-invariance and geographical divide of earthquake mortality in Italy since 1800, Ann. Geophys., 63, 660, https://doi.org/10.4401/ag-8406, 2020.
Chen, Y., Chen, X. L., Fu, Z. X., Ying, Z. Q., and Yang, M. D.: Estimating Losses from Future Earthquakes in China, Adv. Nat. Technol. Haz., 6, 211–220, https://doi.org/10.1007/978-94-009-0243-5_14, 1996.
Chen, Y., Chen, Q. F., Liu, J., Chen, L., and Li, J.: Seismic Hazard and Risk Analysis: A Simplified Approach, Science Press, Beijing, 228, ISBN 9781108425056, 2002.
Coburn, A. and Spence, R.: Earthquake Protection, 2nd edn., John Wiley & Sons Ltd., 448, ISBN 978-0-470-85517-1, 2002.
Cornell, C. A.: Engineering seismic risk analysis, B. Seismol. Soc. Am., 58, 1583–1606, 1968.
Di Pasquale, G., Orsini, G., and Romeo, R. W.: New developments in seismic risk assessment in Italy, B. Earthq. Eng., 3, 101–128, https://doi.org/10.1007/s10518-005-0202-1, 2005.
Faccioli, E. and Pessina, V.: The Catania Project: Earthquake damage scenarios for high risk area in the Mediterranean, CNR-GNDT, Roma, 17–25, http://hdl.handle.net/2122/12181 (last access: 25 April 2023), 2000.
Fah, D., Kind, F., Lang, K., and Giardini, D.: Earthquake scenarios for the city of Basel, Soil Dyn. Earthq. Eng., 21, 405–413, 2001.
Frolova, N., Larionov, V., Sushchev, S., and Ugarov, A.: Extremum system for earthquake risk and loss assessment, in: Proc. of the Conference Skopje Earthquake – 40 Years of European Earthquake Engineering (SE-40EEE), Ohrid, Macedonia, August 26–29, CD-ROM, 2003.
Giovinazzi, S. and Lagomarsino, S.: A macroseismic method for the vulnerability assessment of buildings, in: Proc. of the 13th World Conference on Earthquake Engineering, 1–6 August, Vancouver, Canada, 56194052, 896 pp., 2004.
Inagamov, R. Sh. and Mavlyanova, N. G.: Seismic risk criteria for zoning seismically active territories, Problems of Seismology in Uzbekistan, 2, 194–201, 2005.
Islamov, A. I.: Engineering-geological basis for the development of the territory of Uzbekistan. Toshkent, Publishing House “Fan” of the UzSSR, 1979, Paper No. 214, 1979.
Ismailov, A. I., Yodgorov, Sh. I., Khusomiddinov, A. S., Yadigarov, E. M., Allayev, S. B., and Aktamov, B. U.: New classification of soils by seismic properties for the building code in Uzbekistan, Geomechanics and Geoengineering – An International Journal, https://doi.org/10.1080/17486025.2023.2296975, in press, 2023.
Ismailov, V., Khusomiddinov, S., Khusomiddinov, A., Yodgorov, Sh., Aktamov, B., and Avazov, S.: Seismic Risk Assessment of Jizzakh Region, AIP Conf. Proc. 2432, 030035, 1–7, https://doi.org/10.1063/5.0089664, 2022.
Ismailov, V. A., Yodgorov, Sh. I., and Allayev, Sh. B.: Seismic microzoning of the Tashkent territory based on calculation methods, Soil Dyn. Earthq. Eng., 152, 107045, https://doi.org/10.1016/j.soildyn.2021.107045, 2022.
Kasymov, S. M.: Engineering-geological basis of detailed seismic zoning and microzoning (on the example of Uzbekistan), Tashkent, Fan, 32020000, 224 pp., 1979.
Khakimov, S. A.: Seismic safety of structural systems of modern residential and civil buildings of the Central Asian region, Georisk., 10, 33–38, 2017.
King, S. A., Kiremidjian, A. S., Basoz, N., Law, K., Vucetic, M., Doroudian, M., Olson, R. A., Eidinger, J. M., Goettel, K. A., and Horner, G.: Methodologies for evaluating the socio-economic consequences of large earthquakes, Earthq. Spectra, 13, 565–584, 1997.
Kontorovich, L. V., Keilis-Borok, V. I., and Molchan, G. M.: Seismic risk and principles of seismic zoning, Computational and statistical methods of seismic data interpretation, Science, 3–20, ISBN 978-5-396-00545-7, 1973.
Lang, K.: Seismic vulnerability of existing buildings, Dissertation, Inst. of Struct. Eng., Swiss Federal Inst. Technology, Zurich, 170–178, https://doi.org/10.3929/ethz-a-004333389, 2002.
Lomnitz, C. and Rosenblueth, E.: Seismic Risk and Engineering Decisions, Elsevier, Amsterdam, 425, ISBN 0444414940, 1976.
Mavlyanov, G. A., Kasymov, S. M., and Shermatov, M. S.: The Uzbekistan loess, genesis and distribution, GeoJournal, 15, 145–150, https://doi.org/10.1007/BF00157940, 1987.
McCormack, T. C. and Rad, F. N.: An earthquake loss estimation methodology for buildings based on ATC-13 and ATC-21, Earthq. Spectra, 13, 605–621, https://doi.org/10.1193/1.1585971, 1997.
Mouroux, P., Bertrand, E., Bour, M., Le Brun, B., Depinois, S., and Masure, P.: The European RISK-UE Project: An Advanced Approach to Earthquake Risk Scenarios, in: Proceedings of the 13th World Conference on Earthquake Engineering, 1–6 August 2004, Vancouver, Canada, 56194052, paper no. 3329, 2004.
Papadopoulos, G. A. and Arvanitides, A.: Earthquake Risk Assessment in Greece, in: Earthquake Hazard and Risk, edited by: Schenk, V., Kluwer Acad. Publ., 221–229, https://doi.org/10.1007/978-94-009-0243-5_15, 1996.
Pasquale, G. D., Orsini, G., and Romeo, R. W.: New developments in seismic risk assessment in Italy, B. Earthq. Eng., 3, 101–128, https://doi.org/10.1007/s10518-005-0202-1, 2005.
PELEM – Panel of Earthquake Loss Estimation Methodology: Estimating Losses from Future Earthquakes, National Academy Press, 1–104, https://doi.org/10.17226/1361, 1989.
Peresan, A., Scaini, C., and Barnaba, C.: Crowd-Sourced Buildings Data Collection and Remote Training: New Opportunities to Engage Students in Seismic Risk Reduction, Earth Sci. Syst. Soc., 3, 10088, https://doi.org/10.3389/esss.2023.10088, 2023a.
Peresan, A., Scaini, C., Tyagunov, S., and Ceresa, P.: Capacity Building Experience for Disaster Risk Reduction in Central Asia, Nat. Hazards Earth Syst. Sci. Discuss. [preprint], https://doi.org/10.5194/nhess-2023-156, in review, 2023b.
Petrovic, B., Scaini, C., and Parolai, S.: Applying the damage assessment for rapid response approach to the August 24 M6 event of the seismic sequence in central Italy (2016), Front. Earth Sci., 312, 1–14, https://doi.org/10.3389/feart.2022.932110, 2022.
Poggi, V., Scaini, C., Moratto, L., Peressi, G., Comelli, P., Bragato, P. L., and Parolai, S.: Rapid Damage Scenario Assessment for Earthquake Emergency Management, Seismol. Res. Lett., 92, 2513–2530, https://doi.org/10.1785/0220200245, 2021.
RADIUS: Risk Assessment Tools for Diagnosis of Urban Areas against Seismic Disasters, IDNDR Secretariat, United Nations, Geneva, Switzerland, 38–63, https://www.unisdr.org/files/2752_RADIUSRiskAssessment.pdf, (last access: 27 April 2023), 2000.
Rashidov, T., Kuzmina, E., Mamysheva, D., and Rashidov, I.: Assessment and reduction of seismic risk in Tashkent, Uzbekistan, Problems of Preventing the Consequences of Destructive Earthquakes, Reports of the Second Kazakh-Japanese Seminar, 19–27, 2003.
Scaini, C., Petrovic, B., Tamaro, A., Moratto, L., and Parolai, S.: Near-real-time damage estimation for buildings based on strong-motion recordings: An application to target areas in northeastern Italy, Seismol. Res. Lett., 92, 3785–3800, https://doi.org/10.1785/0220200430, 2021.
Scaini, C., Tamaro, A., Adilkhan, B., Sarzhanov, S., Ismailov, V., Umaraliev, R., Safarov, M., Belikov, V., Karayev, J., and Faga, E.: A new regionally consistent exposure database for Central Asia: population and residential buildings, Nat. Hazards Earth Syst. Sci., 24, 929–945, https://doi.org/10.5194/nhess-24-929-2024, 2024.
Trendafiloski, G. and Milutinovic, Z.: GIS-oriented method for elaboration of probabilistic earthquake scenarios, in: Proc. of the 13th World Conference on Earthquake Engineering, 1–6 August, Vancouver, Canada, 56194052, 1809 pp., 2004.
Tyagunov, S., Grünthal, G., Wahlström, R., Stempniewski, L., and Zschau, J.: Seismic risk mapping for Germany, Nat. Hazards Earth Syst. Sci., 6, 573–586, https://doi.org/10.5194/nhess-6-573-2006, 2006.
Tyagunov, S., Abakanov, T., Abdrakhmatov, K., Begaliev, U., Bindi, D., Charyev, M., Ilyasov, I., Ishuk, A., Mavlyanova, N., Mikhailova, N., Moldobekov, M., Ospanov, A., Parolai, S. M., Pilz, M., Pittore, M., Rashidov T., Saidiy, S., Ullah, Sh., Usmanova, M., Wieland, M., Yasunov, P., Ziyautdinov, F., and Zschau, J.: Seismic risk assessment in the countries of central asia, ResearchGate, https://doi.org/10.13140/2.1.2443.5207, 2012.
Tyagunov, S. A., Shtimpnieviske, L., Gryuntal, G., Valstryom, R., and Shau, Y.: Seismic vulnerability and seismic risk in Germany, Problemy analiza riska, naucno-prakticeskij zurnal, 4, 60–66, 2007.
Wang, Y., Shi, P. J., and Wang J. A.: The housing loss assessment of rural villages caused by earthquake disaster in Yunnan Ptovince, Acta Seismol. Sinica, 18, 590–601, 2005.
Whitman, R. V., Biggs, J. M., Brennan, J. E., Cornell, C. A., Neufville, R. L., and Vanmarcke, E. H.: Seismic design decision analysis, ASCE Struct. Eng. J., 101, 1067–1084, 1975.
Xin, D., Daniell, J. E., Tsang, H.-H., and Wenzel, F.: Residential building stock modelling for mainland China targeted for seismic risk assessment, Nat. Hazards Earth Syst. Sci., 21, 3031–3056, https://doi.org/10.5194/nhess-21-3031-2021, 2021.
Zaalishvili, V., Burdzieva, O., Kanukov, A., and Melkov, D.: Seismic risk of modern city, The Open Construction and Building Technology Journal, 13, 308–318, https://doi.org/10.2174/1874836801913010308, 2019.
Zonno, G., Cella, F., Luzi, L., Menoni, S., Meroni, F., Ober, G., Pergalani, F., Petrini, V., Tomasoni, R., Carrara, P., Musella, D., Garcia-Fernandez, M., Jimenez, M. J., Canas, J. A., Al Faro, A. J., Barbat, A. H., Mena, U., Pujades, L. G., Soeters, R., Terlien, M. T. J., Cherubini, A., Angeletti, P., Di Benedetto, A., Caleffi, M., Wagner, J. J., and Rosset, P.: Assessing seismic risk at dif- ferent geographical scales: concepts, tools and procedures, in: Proc. of the 11th European Conference on Earthquake Engineering, 6–11 September, ISBN 10: 905410923, 9054109823, 9058090272, Paris, France, CD-ROM, 1998.
https://iisee.kenken.go.jp/net/saito/gesi_program/index.html (last access: 21 September 2023).