the Creative Commons Attribution 4.0 License.
the Creative Commons Attribution 4.0 License.
 | 21 Jun 2024
Brief communication: Implications of outstanding solitons for the occurrence of rogue waves at two additional sites in the North Sea
Ralf Weisse
Sander Wahls
We investigate rogue waves in buoy and radar measurement data from shallow depths in the southern North Sea. We analyze the role of solitons for the occurrence of rogue waves by computing discrete soliton spectra using the nonlinear Fourier transform for the Korteweg–de Vries equation with vanishing boundary conditions. In a previous study, data from a single measurement site were considered. The comparison of soliton spectra from time series with and without rogue waves suggested a connection between the shape of the soliton spectrum and the occurrence of rogue waves. In this study, results for two additional sites are reported.
- Article
(1930 KB) - Full-text XML
- BibTeX
- EndNote


Rogue waves refer to waves that are exceptionally high and/or possess an exceptionally large crest, with respect to the surrounding wave field (Hayer and Andersen, 2000). The surrounding wave field is characterized by its significant wave height, which is the average height of the highest third of waves in a record. In this paper, we consider waves that exceed twice the significant wave height of the surrounding wave field and/or have a crest height exceeding 1.25 times the significant wave height to be rogue waves. Rogue waves often appear unexpectedly and thus pose a threat to ships and offshore installations (Bitner-Gregersen and Gramstad, 2016). They can occur in both deep and shallow water (Didenkulova, 2020). Attempts to predict rogue waves based on sea state parameters have not proven useful for reliable warning systems (Cattrell et al., 2018; Häfner et al., 2021). In our approach, we have transferred the investigation from the time domain to the nonlinear spectral domain, similarly to the procedure in linear spectral analysis. In this study, shallow water is defined as kh≤1.36, where k is the wave number and h is the water depth. This condition is equivalent to the frequency cut-off for the applicability of the Korteweg–de Vries (KdV) equation used in Osborne (1995). The KdV equation describes weakly nonlinear dispersive unidirectional waves in shallow water with constant depth (Korteweg and De Vries, 1895). The equation can be solved with the inverse scattering method (Gardner et al., 1967). The forward transform in this method can be considered a nonlinear Fourier transform (NLFT) (Ablowitz et al., 1974). It yields a continuous spectrum of oscillatory waves and a discrete spectrum of solitons. The NLFT reveals hidden solitons in a time series that will become visible only later when the series evolve spatially with respect to the KdV (Gardner et al., 1967; Ablowitz and Kodama, 1982). In a previous study (Teutsch et al., 2023), we applied the NLFT for the KdV equation with vanishing boundary conditions to time series measured at a specific site in the southern North Sea and analyzed the resulting soliton spectra. We pointed out that the NLFT was applied as a spectral analysis method, similar to the Fourier transform in the linear case. However, the difference to the linear case is that under ideal conditions, the nonlinear spectrum does not change during wave propagation. Thus, the nonlinear spectral analysis may give an indication on the behavior of the wave train further downstream. The method sheds light on the role that nonlinearity plays in the formation of rogue waves. We found that soliton spectra calculated from time series with rogue waves were more likely to contain a large outstanding soliton. In this study, we extended this analysis to time series measured at additional shallow-water locations in the southern North Sea and also considered radar next to buoy measurements. Based on these new data, the objective was to determine whether or not rogue wave time series at the additional measurement sites showed the same characteristic signatures in the soliton spectra as derived from the analysis of one individual station in the original analysis.
2.1 Measurement region and data
We consider half-hour time series from three measurement devices deployed along the German and Dutch coasts in comparably low water depths (Fig. 1). The time series were recorded between 2011 and 2016. At the site WES off the coast of the island Sylt in a water depth of h=13 m, a Waverider buoy with a measurement frequency of 1.28 Hz was installed, similarly to the site SEE off Norderney that was discussed in Teutsch et al. (2023). At the site AWG in a water depth of h=6.3 m, a down-looking radar device was mounted to a fixed platform, measuring the air gap to the sea surface at a frequency of 2 Hz in 2011 and at 4 Hz later in the measurement period.
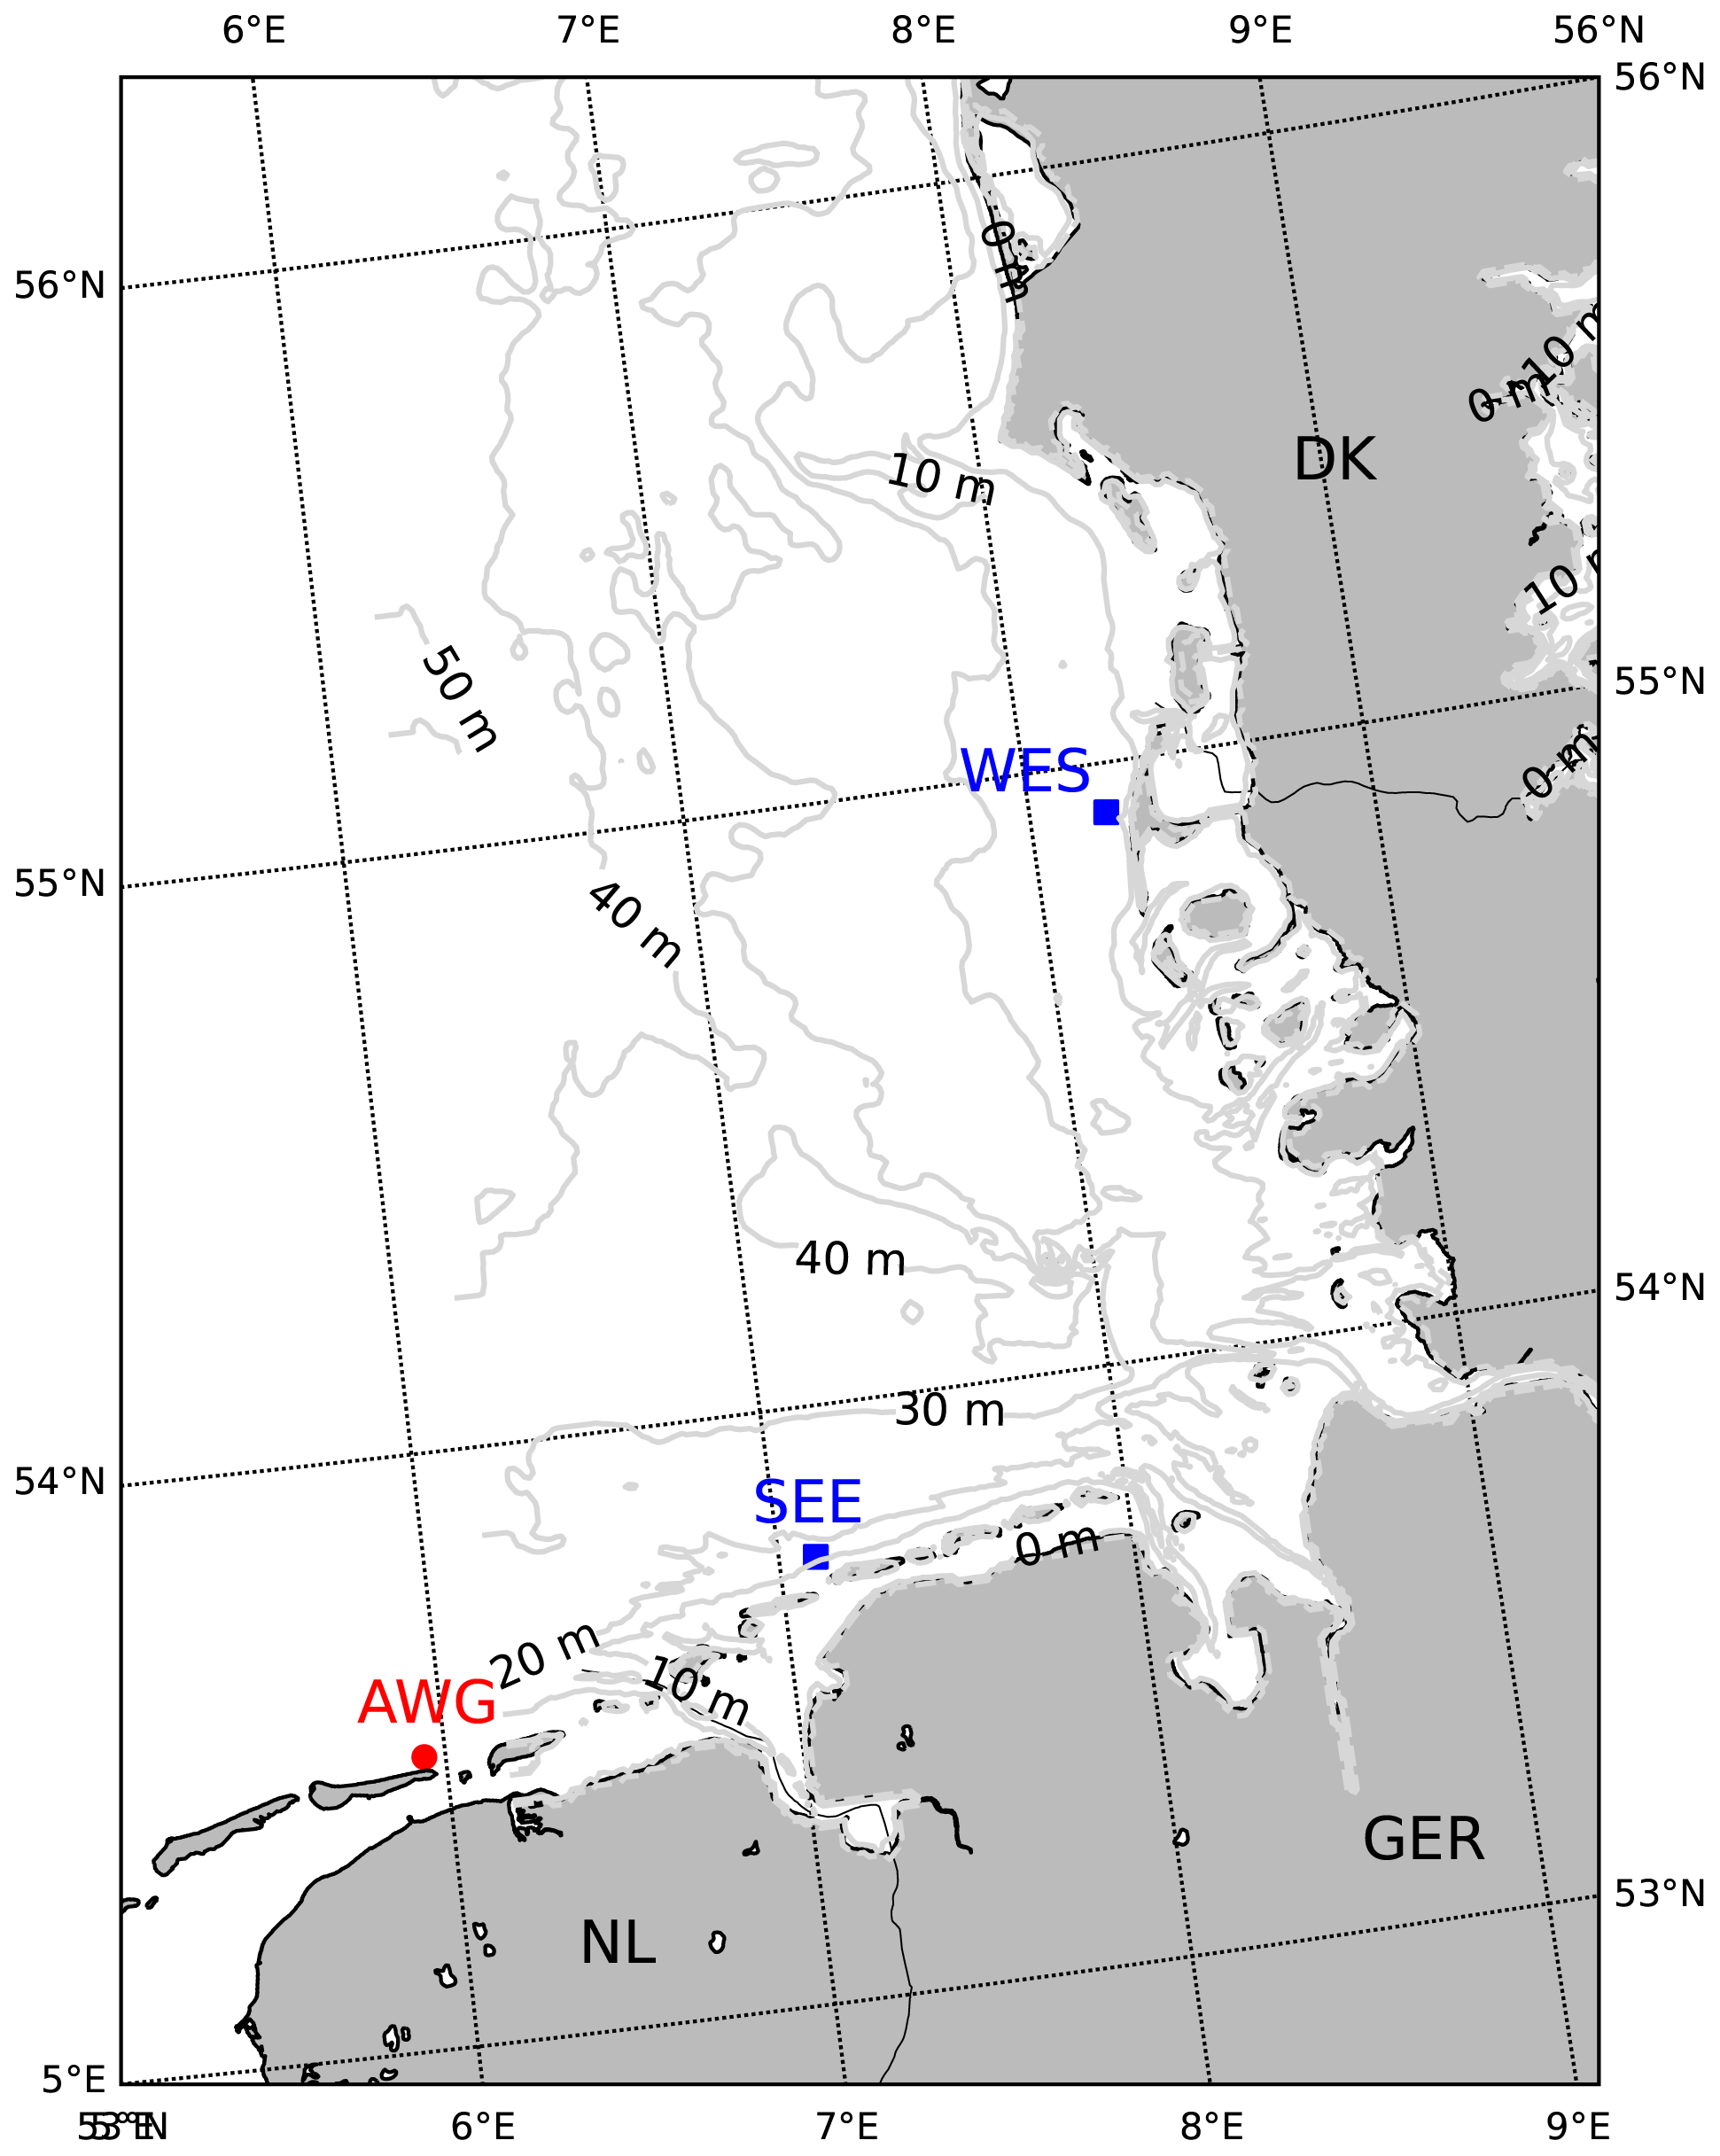
Figure 1Map of the measurement region in the southern North Sea. Blue squares mark the buoy measurement sites; the red dot indicates the location of the radar device. The grey lines refer to isobaths (Dick and Kleine, 2006).
Only samples with large significant wave heights exceeding the local 70th percentile were considered, to exclude measurement uncertainties and to include only large rogue waves relevant for offshore activities. Furthermore, only samples that satisfy the aforementioned condition of kh≤1.36 were considered. The data set was split into five categories, based on the largest wave height H and crest height C of individual waves with respect to the significant wave height Hs of the half-hour sample: (i) non-rogue samples ( and ), (ii) height rogue samples ( and ), (iii) crest rogue samples ( and ), (iv) double rogue samples ( and ), and (v) extreme rogue waves ().
2.2 Analysis method
The time-like KdV equation (Osborne, 1993) describes the evolution of waves in shallow depths:
Here, represents the surface elevation at position x and time t. The subscripts x and t denote partial derivatives in space and time, respectively, Furthermore, represents the phase speed in shallow water, where g denotes gravity and h is the water depth. The NLFT for vanishing boundary conditions was used to compute the soliton spectra:
The soliton spectrum is obtained from the discrete part of the NLFT spectrum, which we calculated using the Matlab (2019) interface to version 0.5.0 of the software library FNFT (Wahls et al., 2018, 2023). This version contains some improvements1 over the development version used in Teutsch et al. (2023). We reanalyzed the data from the station SEE considered in Teutsch et al. (2023) and found only minor differences compared to the results of the previous version. We therefore used the original values from Teutsch et al. (2023) in our discussions of the new results to avoid confusion.
We remark that the choice of the NLFT boundary conditions is not that important in practice for the detection of solitons (e.g., Brühl et al., 2022).
We compared the discrete soliton spectra of time series in the different sample categories. We refer to the spectra as containing an “outstanding soliton” when the ratio , where A1 and A2 refer to the amplitude of the largest and the second-largest soliton in the spectrum. A spectrum with a “strongly outstanding soliton” is defined as one where .
A comparison between the soliton spectra of time series with and without rogue waves has revealed noticeable differences at the measurement site SEE (Teutsch et al., 2023). Rogue wave time series more often had spectra with exceptionally large outstanding solitons than time series without rogue waves. On the other hand, time series with strongly outstanding solitons very likely contained rogue waves. The measurement data from SEE were part of a larger data set, which was presented in Teutsch et al. (2020). To assess to what extent the previous findings hold at other stations or can be generalized, we here repeated the analysis for the only two other shallow-water stations in the North Sea measurement data set.
At all three sites, the percentages of soliton spectra containing an outstanding soliton for the different categories of samples were determined (Table 1). In principle, similar results were found: outstanding solitons in the discrete spectrum were more typical for time series containing a rogue wave than for time series without rogue waves. The majority of samples with an extreme rogue wave showed an outstanding soliton. The fraction of samples in the data set for which this finding was true differed at the considered stations. The distribution was comparable at the two buoy stations (Table 1). Here, samples containing rogue waves with a particularly high crest showed an outstanding soliton in the discrete spectrum more often than height rogue samples. At the radar station AWG, outstanding solitons in the discrete spectrum were rarer in general, but the difference between non-rogue samples and extreme rogue samples was even more pronounced. At this station, the spectra of height rogue samples contained an outstanding soliton more often than those of crest rogue samples. It seems likely that the differences between buoy and radar sites are caused by the measurement techniques: as described in Teutsch et al. (2020), a high-resolution radar instrument is able to identify more rogue waves than a surface-following wave buoy with a lower sampling frequency. Beyond the aspect of the measurement instrument, potential reasons for the differences seen in Table 1 are the different depths, bathymetries and directional spreads at the respective sites. With a water depth of only 6.3 m, AWG is located in a significantly shallower area than the two buoy stations. In very shallow areas, additional nonlinear phenomena not modeled by the KdV equation play a significant role (Kharif and Pelinovsky, 2003). The interaction of waves with the bathymetry also gives rise to different processes that can encourage rogue wave formation (Prevosto, 1998; Soomere, 2010). The finding of fewer outstanding solitons together with the larger number of rogue waves at AWG thus suggests that additional mechanisms may contribute to the formation of rogue waves at this site. While the KdV equation assumes a constant water depth and unidirectional propagation, this is not true under real conditions in the southern North Sea. All measurement sites are located close to the coast, and the sea floor at the considered stations is not flat but rather inclined to different degrees (Fig. 1). The slope of the sea floor has an influence on the nonlinearity of waves and the occurrence frequency of rogue waves (e.g., Zeng and Trulsen, 2012).
Table 1Share of samples in each category that showed an outstanding soliton, compared to the remaining solitons in the spectrum. Each row represents one of the considered measurement sites.
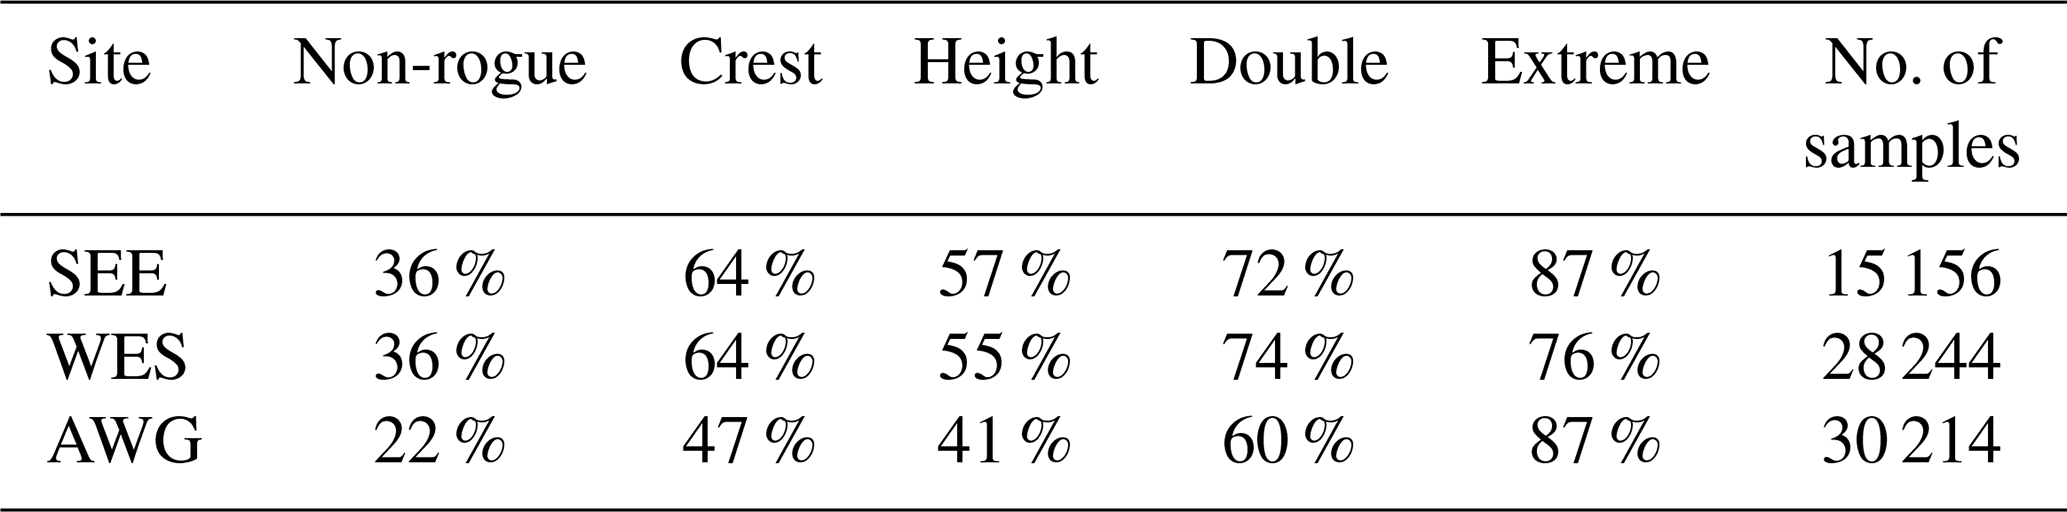
Figure 2 shows more detailed information on the ratio between the largest and second-largest soliton in the discrete spectrum, for one measurement site in each plot. WES and AWG show qualitatively similar results, which are comparable to the result at the site SEE presented in Teutsch et al. (2023). The bulk of non-rogue time series is located above the 80 % line (64 % at WES, 78 % at AWG), thus not showing an outstanding soliton in the discrete spectrum, while the largest fraction of extreme rogue time series is located below the 80 % line, thus containing an outstanding soliton in the discrete spectrum (76 % at WES, 87 % at AWG). At station SEE, it was found that the largest part of samples on and below the 30 % line, thus containing a “strongly outstanding soliton”, were rogue wave samples (83 % of the samples, instead of 7.7 % in the full data set). We therefore concluded that a strongly outstanding soliton in the spectrum can be interpreted as a strong indicator of a rogue wave in the corresponding time series. At the sites WES and AWG, although rogue wave samples do not represent the majority in , the share of rogue wave samples is still larger than in the full data set (WES: 41 % instead of 7.6 %; AWG: 21 % instead of 6.3 %). Thus, also at the additional sites, the presence of a strongly outstanding soliton in the NLFT spectrum indicates that the corresponding time series is several times more likely to contain a rogue wave. The statistical connection between the relation and the physical occurrence of rogue waves suggests that outstanding solitons typically transform already large individual waves into rogue waves (Teutsch et al., 2023). The indicator is expected to remain approximately constant during wave propagation, at least over shorter distances, which suggests the possibility of detecting strongly outstanding solitons before they eventually contribute to the formation of rogue waves. Thus, the indicator may be a useful addition to future rogue wave warning systems.
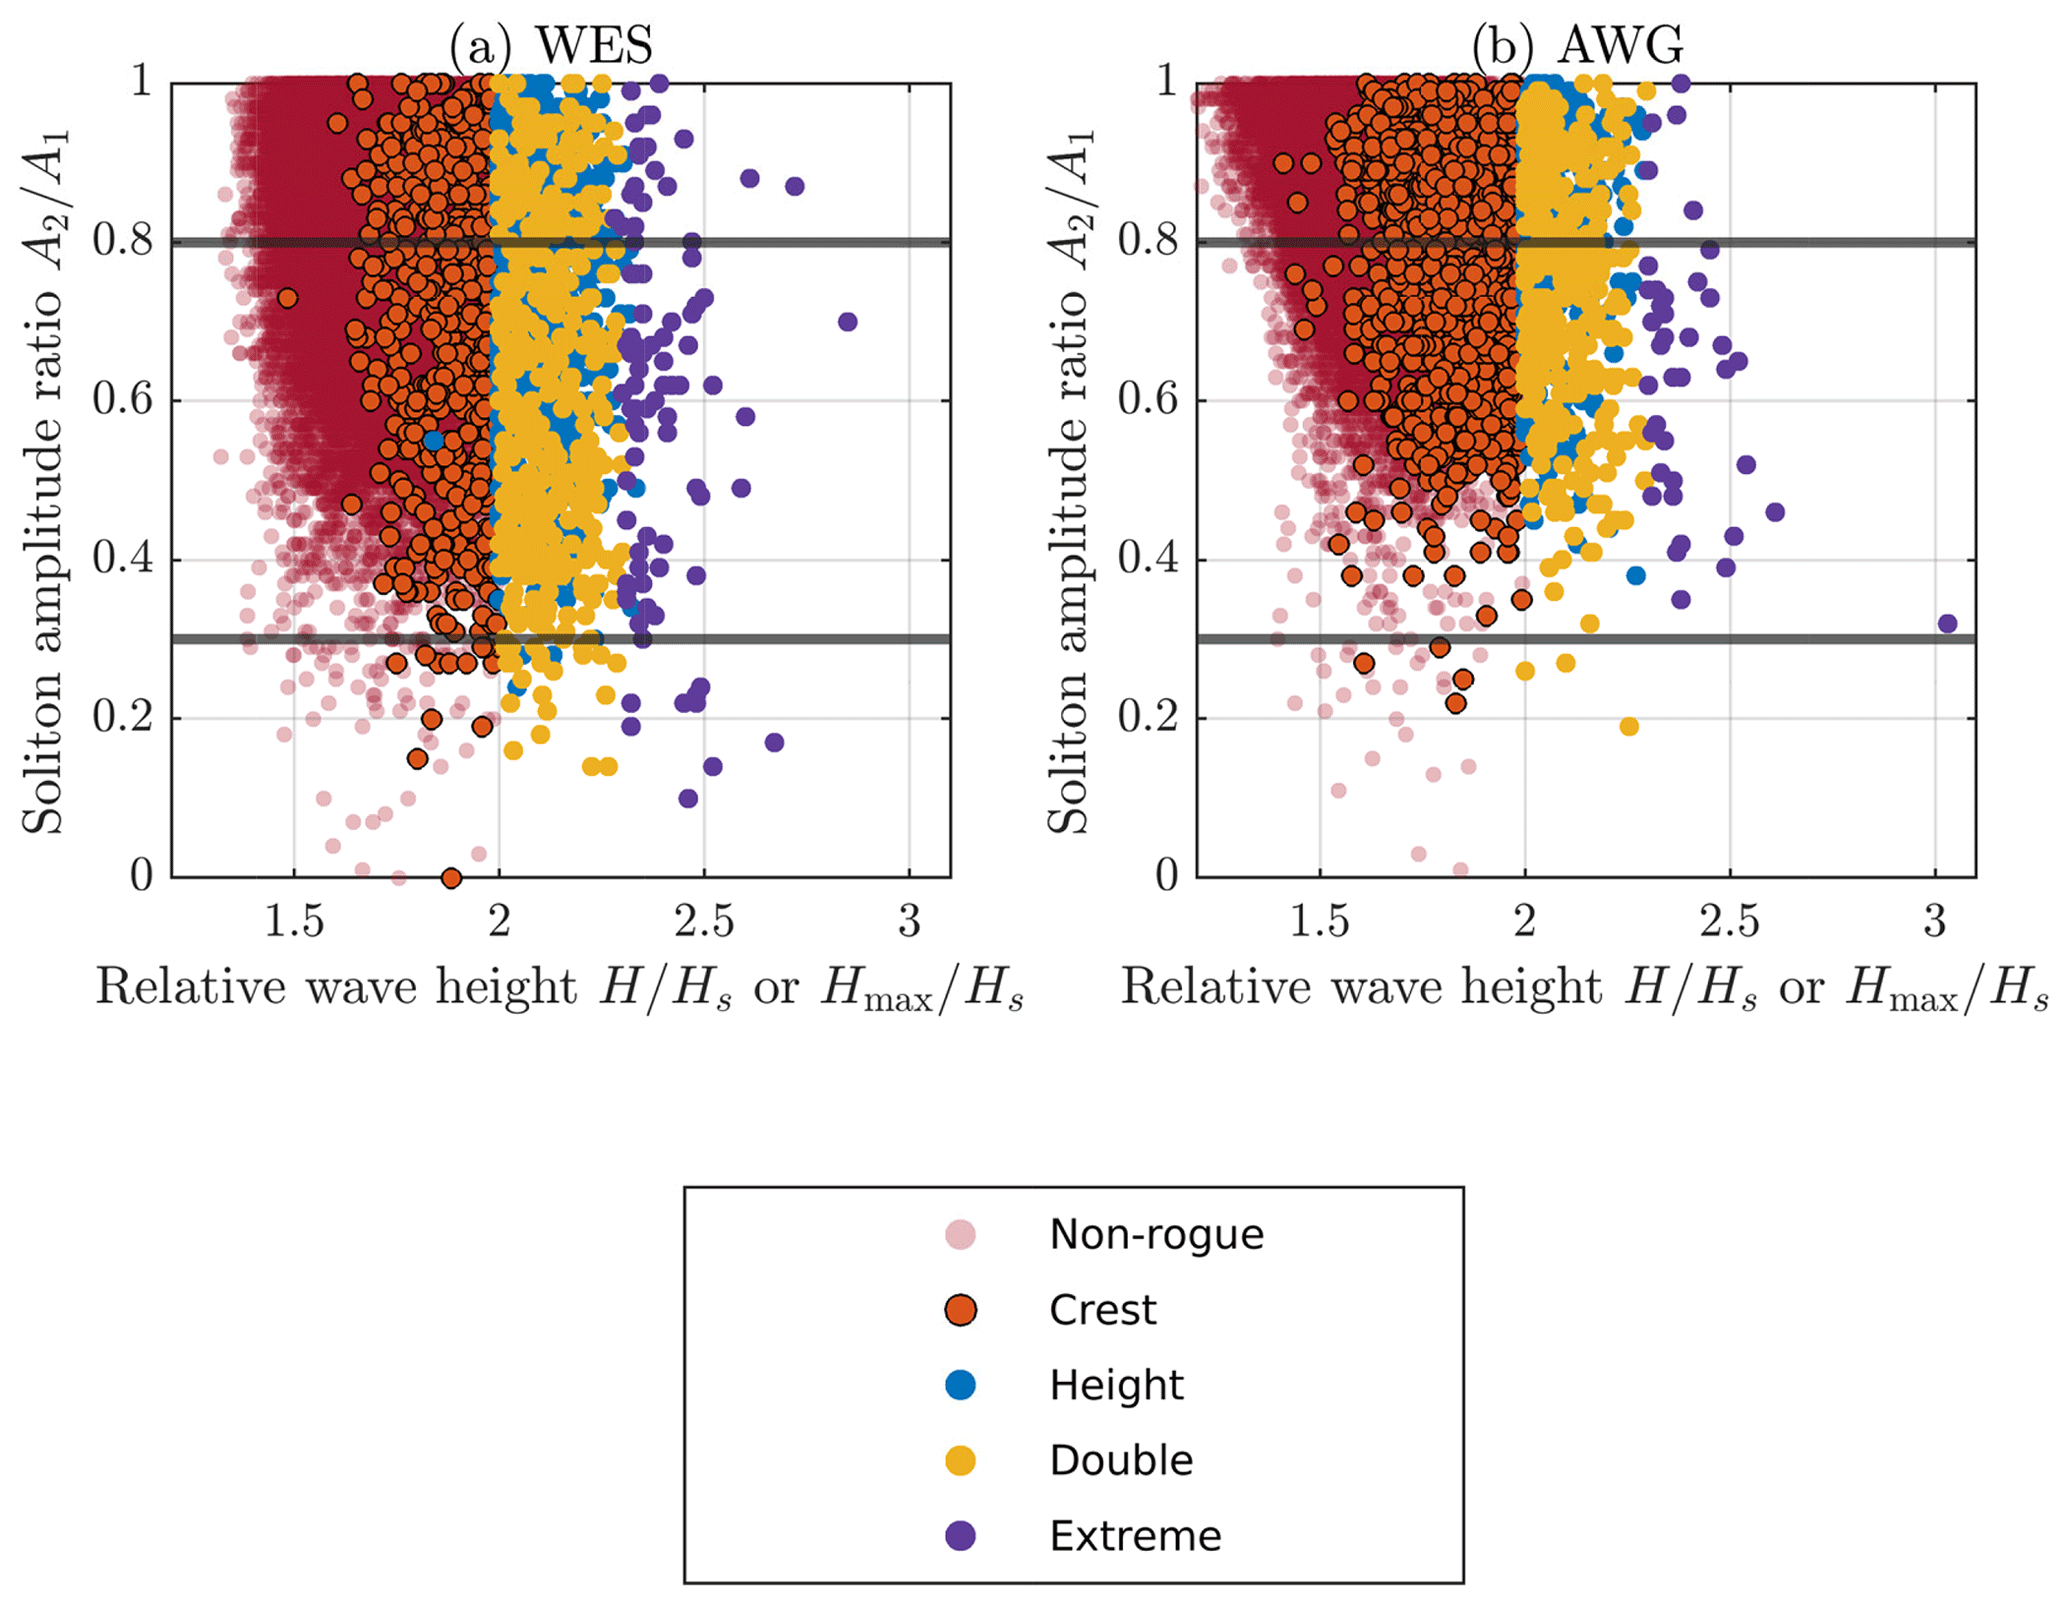
Figure 2Ratio between the second-largest soliton and the largest soliton in the discrete spectrum of measured time series as a function of relative wave height or Hmax for the different categories of time series. Below the horizontal line denoting 80 %, the highest soliton in the spectrum is classified as outstanding. Below the horizontal line denoting 30 %, the highest soliton in the spectrum is referred to as strongly outstanding. (a) Results from site WES. (b) Results from site AWG.
Based on new data, we confirmed our recent finding that the presence of a large outstanding soliton in the NLFT spectrum is more likely for time series containing a rogue wave than for time series without rogue waves. This was shown at two additional sites in the southern North Sea, of which one was equipped with a different instrument. Therefore, this behavior does not appear to be site-specific (with respect to the southern North Sea). On the other hand, the presence of a strongly outstanding soliton in the NLFT spectrum indicated a rogue wave in the corresponding time series, although the indication was not as strong at the additional sites. The detection of strongly outstanding solitons in the nonlinear spectrum could be a useful addition to rogue wave warning systems. Future research should investigate how well the detected solitons are preserved under realistic propagation conditions.
The FNFT software library is available at https://github.com/FastNFT/FNFT/ (last access: 19 June 2024). The version 0.5.0 used for this work is furthermore archived at https://doi.org/10.5281/zenodo.8164765 (Wahls et al., 2023).
The discussed wave buoy and radar data are the property of and were made available by the Lower Saxony Water Management, Coastal Defence and Nature Conservation Agency (buoy SEE), the Federal Maritime and Hydrographic Agency, Germany (buoy WES), and Shell, UK (radar AWG), respectively. They can be obtained upon request from these organizations.
All authors contributed to the idea and scope of the paper. IT performed the analyses and wrote the manuscript. RW and SW provided help with data analysis, discussed the results and contributed to writing the paper.
The contact author has declared that none of the authors has any competing interests.
Publisher's note: Copernicus Publications remains neutral with regard to jurisdictional claims made in the text, published maps, institutional affiliations, or any other geographical representation in this paper. While Copernicus Publications makes every effort to include appropriate place names, the final responsibility lies with the authors.
Ina Teutsch received funding for this work from the Federal Maritime and Hydrographic Agency (BSH).
The article processing charges for this open-access publication were covered by the Helmholtz-Zentrum Hereon.
This paper was edited by Ira Didenkulova and reviewed by two anonymous referees.
Ablowitz, M. J. and Kodama, Y.: Note on Asymptotic Solutions of the Korteweg–de Vries Equation with Solitons, Stud. Appl. Math., 66, 159–170, 1982. a
Ablowitz, M. J., Kaup, D. J., Newell, A. C., and Segur, H.: The inverse scattering transform-Fourier analysis for nonlinear problems, Stud. Appl. Math., 53, 249–315, 1974. a
Bitner-Gregersen, E. and Gramstad, O.: Rogue Waves-Impact on ships and offshore structures, No. 5-2015 in DNV GL Position Paper, DNV GL Strategic Research & Innovation, https://www.dnv.com/Publications/rogue-waves-60134 (last access: 19 June 2024), 2016. a
Brühl, M., Prins, P. J., Ujvary, S., Barranco, I., Wahls, S., and Liu, P. L.-F.: Comparative analysis of bore propagation over long distances using conventional linear and KdV-based nonlinear Fourier transform, Wave Motion, 111, 102905, https://doi.org/10.1016/j.wavemoti.2022.102905, 2022. a
Cattrell, A. D., Srokosz, M., Moat, B. I., and Marsh, R.: Can Rogue Waves Be Predicted Using Characteristic Wave Parameters?, J. Geophys. Res.-Oceans, 123, 5624–5636, https://doi.org/10.1029/2018jc013958, 2018. a
Dick, S. and Kleine, E.: The BSH's new operational circulation model using general vertical co-ordinates, in: 2006 IEEE US/EU Baltic International Symposium, 23–26 May 2006, Klaipeda, Lithuania, https://doi.org/10.1109/baltic.2006.7266135, 2006. a
Didenkulova, E.: Catalogue of rogue waves occurred in the World Ocean from 2011 to 2018 reported by mass media sources, Ocean Coast. Manage., 188, 105076, https://doi.org/10.1016/j.ocecoaman.2019.105076, 2020. a
Gardner, C. S., Greene, J. M., Kruskal, M. D., and Miura, R. M.: Method for solving the Korteweg-deVries equation, Phys. Rev. Lett., 19, 1095–1097, https://doi.org/10.1103/PhysRevLett.19.1095, 1967. a, b
Häfner, D., Gemmrich, J., and Jochum, M.: Real-world rogue wave probabilities, Sci. Rep., 11, 10084, https://doi.org/10.1038/s41598-021-89359-1, 2021. a
Hayer, S. and Andersen, O. J.: Freak waves: rare realizations of a typical population or typical realizations of a rare population?, in: The Tenth International Offshore and Polar Engineering Conference, OnePetro, Seattle, USA, 27 May–2 June 2000, International Society of Offshore and Polar Engineers, ISBN 978-1-880653-46-3, 2000. a
Kharif, C. and Pelinovsky, E.: Physical mechanisms of the rogue wave phenomenon, Eur. J. Mech. B, 22, 603–634, https://doi.org/10.1016/j.euromechflu.2003.09.002, 2003. a
Korteweg, D. J. and De Vries, G.: XLI. On the change of form of long waves advancing in a rectangular canal, and on a new type of long stationary waves, Lond. Edinburgh Dublin Philos. Mag. and J. Sci., 39, 422–443, 1895. a
Matlab: 9.6. 0.1072779 (R2019a), The MathWorks Inc., Natick, MA, USA, https://www.mathworks.com/downloads/web_downloads/download_release?release=R2019a (last access: 19 June 2024), 2019. a
Osborne, A.: Behavior of solitons in random-function solutions of the periodic Korteweg–de Vries equation, Phys. Rev. Lett., 71, 3115–3118, https://doi.org/10.1103/physrevlett.71.3115, 1993. a
Osborne, A.: The inverse scattering transform: tools for the nonlinear Fourier analysis and filtering of ocean surface waves, Chaos, Solit. Fract., 5, 2623–2637, 1995. a
Prevosto, M.: Effect of Directional Spreading and Spectral Bandwidth on the Nonlinearity of the Irregular Waves, in: Eighth ISOPE conference, Montreal, Canada, 24–29 May 1998, International Society of Offshore and Polar Engineers (ISOPE), ISOPE-I-98-212, https://onepetro.org/ISOPEIOPEC/proceedings-abstract/ISOPE98/All-ISOPE98/ISOPE-I-98-212/24544 (last access: 19 June 2024), 1998. a
Soomere, T.: Rogue waves in shallow water, Eur. Phys. J. Spec. Top., 185, 81–96, https://doi.org/10.1140/epjst/e2010-01240-1, 2010. a
Teutsch, I., Weisse, R., Moeller, J., and Krueger, O.: A statistical analysis of rogue waves in the southern North Sea, Nat. Hazards Earth Syst. Sci., 20, 2665–2680, https://doi.org/10.5194/nhess-20-2665-2020, 2020. a, b
Teutsch, I., Brühl, M., Weisse, R., and Wahls, S.: Contribution of solitons to enhanced rogue wave occurrence in shallow depths: a case study in the southern North Sea, Nat. Hazards Earth Syst. Sci., 23, 2053–2073, https://doi.org/10.5194/nhess-23-2053-2023, 2023. a, b, c, d, e, f, g, h
Wahls, S., Chimmalgi, S., and Prins, P. J.: FNFT: A software library for computing nonlinear Fourier transforms, J. Open Sour. Softw., 3, 597, https://doi.org/10.21105/joss.00597, 2018. a
Wahls, S., Chimmalgi, S., Prins, P. J., and Brehler, M.: FastNFT/FNFT: Version 0.5.0, Zenodo [code], https://doi.org/10.5281/zenodo.8164765, 2023. a, b
Zeng, H. and Trulsen, K.: Evolution of skewness and kurtosis of weakly nonlinear unidirectional waves over a sloping bottom, Nat. Hazards Earth Syst. Sci., 12, 631–638, https://doi.org/10.5194/nhess-12-631-2012, 2012. a
For the vanishing KdV-NLFT, the improvements are that spacing of the numerical grid used to localize solitons is now guaranteed to stay below a user-provided parameter and that the scattering process is normalized to avoid numerical overflow. The grid spacing parameter used in this study was 0.001.