the Creative Commons Attribution 4.0 License.
the Creative Commons Attribution 4.0 License.
 | 14 Jun 2024
Quantitative study of storm surge risk assessment in an undeveloped coastal area of China based on deep learning and geographic information system techniques: a case study of Double Moon Bay
Lichen Yu
Hao Qin
Shining Huang
Wei Wei
Haoyu Jiang
Storm surges are a common natural hazard in China's southern coastal area which usually cause a great loss of human life and financial damages. With the economic development and population concentration of coastal cities, storm surges may result in more impacts and damage in the future. Therefore, it is of vital importance to conduct risk assessment to identify high-risk areas and evaluate economic losses. However, quantitative study of storm surge risk assessment in undeveloped areas of China is difficult, since there is a lack of building character and damage assessment data. Aiming at the problem of data missing in undeveloped areas of China, this paper proposes a methodology for conducting storm surge risk assessment quantitatively based on deep learning and geographic information system (GIS) techniques. Five defined storm surge inundation scenarios with different typhoon return periods are simulated by the coupled FVCOM–SWAN (Finite Volume Coastal Ocean Model–Simulating WAves Nearshore) model, the reliability of which is validated using official measurements. Building footprints of the study area are extracted through the TransUNet deep learning model and remote sensing images, while building heights are obtained through unoccupied aerial vehicle (UAV) measurements. Subsequently, economic losses are quantitatively calculated by combining the adjusted depth–damage functions and overlaying an analysis of the buildings exposed to storm surge inundation. Zoning maps of the study area are provided to illustrate the risk levels according to economic losses. The quantitative risk assessment and zoning maps can help the government to provide storm surge disaster prevention measures and to optimize land use planning and thus to reduce potential economic losses in the coastal area.
- Article
(17539 KB) - Full-text XML
- BibTeX
- EndNote


Storm surge is defined as the abnormal rise in water over and above the normal astronomical tide and is expressed in terms of height above predicted or expected tide levels. Usually, the surge is generated by a strong atmospheric disturbance, and it becomes particularly catastrophic when it happens to coincide with an astronomical high tide. In that case, the surge-driven coastal flooding may inundate buildings and cropland and cause a significant number of casualties and economic losses. Storm surges have caused widespread damage worldwide. In 2013, Super Typhoon Yolanda became the worst typhoon in the last 30 years, pounding the Philippines. It resulted in the reported deaths of 6293 individuals, 28 689 injuries, and 1061 missing individuals, with estimated damages totaling USD 864 million (McPherson, 2015). Hurricane Harvey struck Texas in August 2017, resulting in approximately 100 deaths and economic losses exceeding USD 125 billion (Lee, 2021). In China, storm surges also pose a frequent threat in coastal cities. In the last decade, China has experienced an average of 8.5 storm surge disasters annually, with an average damage amount of CNY 6815.8 million per year, with the provinces of Guangdong and Zhejiang being the most affected coastal areas (China Marine Disaster Bulletin, 2023). For example, Typhoon Hato in 2017, Typhoon Mangkhut in 2018, and Typhoon Lekima in 2019 caused significant damage to coastal cities in China and resulted great losses of life and property (Zhou et al., 2021; Yang et al., 2019). Over the past few years, potential monetary loss has grown in accordance with rapid population and economic development in China's coastal area (Fang et al., 2021; Ji et al., 2020; McGranahan et al., 2007; Seto et al., 2011). Therefore, it is crucial to implement risk assessment and mapping strategies to effectively reduce these risks and mitigate the impact of storm surges.
Storm surge hazard assessment is an essential component of storm surge risk assessment and zoning, aiming to evaluate the hazard intensity of disasters through the numerical simulation of storm surge processes, estimation of storm surge for selected return periods, and computation of the probable maximum storm surge (Shi et al., 2013). Therefore, the numerical simulation of storm surge is a key step for storm surge risk assessment. Because of the limitation of historical storms and the nondeterminacy of future storms, the numerical simulation of storm surges is usually used to determine storm levels. Hydrodynamic models such as Advanced CIRCulation (ADCIRC), Delft3D, and the Finite Volume Coastal Ocean Model (FVCOM) have been widely used (Vijayan et al., 2021; N. Wang et al., 2021; Liu and Huang, 2020; Hu et al., 2022; Lyddon et al., 2019; Zhang et al., 2020; Zhu et al., 2022). It has been demonstrated that it is critical to include tide and seawater level variations in shelf and nearshore wave simulations (Masson, 1996). Furthermore, the seawater level could be significantly affected by strong tides and typhoon-induced wind in complex coastal seas and then modulate the wave properties (Yang et al., 2020). The coupled FVCOM–SWAN (Simulating WAves Nearshore) model, with the foundation of FVCOM's finite-volume method, unstructured grid, and adaptable boundary condition handling capability, integrating the hydrodynamic and wave processes of SWAN, possesses the ability to provide a simulation result more quickly and accurately. In this circumstance, the coupled FVCOM–SWAN model is used in this research for simulating the inundation of storm surge.
Coastal risk assessment can be categorized into two primary classifications: qualitative and quantitative. In the realm of qualitative assessment, the entropy weight method, analytic hierarchy process (AHP), and other methods are widely used. Ramkar and Yadav (2021) used AHP in combination with geographic information system (GIS) techniques for proposing a flood risk map, which can identify high-risk areas efficiently. Malekinezhad et al. (2021) combined the entropy weight method and GIS and conducted a flood vulnerability analysis for the city of Hamadan. The results highlighted the advantages of the entropy weight method compared to the normal spatial overlay method. Furthermore, Pathan et al. (2022) and Rafiei-Sardooi et al. (2021) made use of the Technique for Order of Preference by Similarity to Ideal Solution (TOPSIS). The former pointed out the advancement of TOPSIS by comparing it with AHP, and the latter combined machine learning and TOPSIS to analyze urban flood vulnerability. Unlike qualitative risk assessment, quantitative risk assessment enables the quantification of damages and risks in monetary terms. The most commonly used approach to assess direct damage is based on depth–damage curves (De Moel and Aerts, 2011; Merz et al., 2007; Smith, 1994). Thieken et al. (2008) presented the Flood Loss Estimation Model for the private sector (FLEMOps) using German flood loss data from August 2002, and the group further established the model for the commercial sector in 2010 (Kreibich et al., 2010). Zhai et al. (2005) derived multi-factor loss functions for buildings in Nagoya, Japan, using empirical data from the Tokai flood in 2000, and Grahn and Nyberg (2014) established functional relationships utilizing house insurance claim data in connection with lake flooding. Excluding buildings, Yazdi and Salehi Neyshabouri (2012) and Hess and Morris (1988), respectively, built several univariate functions and multi-factor functions for different kinds of crops and grassland. In recent years, machine learning has also been introduced in quantitative loss assessment; for example, Merz et al. (2013) developed a tree-based approach using regression trees and bagging regression trees as machine learning methods to analyze direct building damage to private homes. Paprotny et al. (2020) proposed a Bayesian network damage model (a method of supervised machine learning) and reached a good accuracy regarding predictions of building losses.
The essence of quantitative risk assessment lies in analyzing the interaction between exposure factors and hazards (Adnan et al., 2020; Armenakis and Nirupama, 2013; Granger, 2003; Kron, 2005). Therefore, it is crucial to quantify the direct tangible damage of elements at risk. Buildings are important exposure elements, as they are the gathering place of people and property. Building footprint data are necessary for evaluating the vulnerabilities of a building, as it provides essential information about the buildings, including spatial location, distribution, and boundaries (Mharzi Alaoui et al., 2022). They are also of great significance in risk assessment, primarily due to their ability to identify high-risk areas, assess building vulnerability, and estimate potential damage (Gacu et al., 2023; Wu et al., 2019). Extracting building footprints from remote sensing images has been widely used in many fields, such as urban management, disaster management, and navigation (Zhou et al., 2004; Tang et al., 2006; Liu et al., 2019, 2020; Rousell and Zipf, 2017; Chen and Gao, 2019). However, there is a lack of building footprint extraction and application in the realm of storm surge assessment.
When a building is inundated, there are a variety of factors that may influence the amount of monetary loss, for example, building type, building structure, private precaution, and maintenance status (Marvi, 2020; Thieken et al., 2008). Taramelli et al. (2022) pointed out that building height is one of the factors for determining the susceptibility due to flooding and evaluate the buildings' potential damage by flood hazards. Hasanzadeh Nafari et al. (2016) developed a new loss model in which buildings with a different number of stories were divided into different categories in the modeling process. To conclude, height is an important factor that affects the vulnerability of buildings when they serve as inundation-exposed elements. Therefore, in the process of quantitative storm surge risk assessment, it is necessary to adjust the depth–damage functions to make buildings of different heights correspond to different functions.
Moreover, different than the field research and statistics required for the acquisition of other data, the data of building height are more accessible from multiple sources. For example, public DSM (digital surface model) data have been utilized for building height estimation (Huang et al., 2022); some satellite companies also offer services to customize DSM data for selected regions. Nonetheless, they, respectively, suffer from a lack of precision and high costs. Building height can also be obtained via remote sensing techniques, such as synthetic-aperture radar (SAR) (Li et al., 2020; Frantz et al., 2021), or be determined by taking advantage of shadows in remote sensing images (Comber et al., 2011; Shao et al., 2011). However, in addition to the lack of precision, the absence of data necessary for modeling and the crowded character of rural buildings in China make the above methods difficult to be implemented. Compared to the methods above, acquiring building height through UAV measurements ensures high accuracy while being relatively efficient, and the method is quite simple, which also reduces the required costs.
In view of the aforementioned information, regarding storm surge qualitative risk assessment, there is a stringent requirement for both the quality and timeliness of land use data, which means that the risk assessment cannot be generated in real time and the qualitative risk assessment also cannot evaluate the risk level through the intuitive value of economic loss. In the realm of quantitative risk assessment, building a univariate or multi-factor empirical model requires complete and substantial data, and the published models generally only provide univariate functions ignoring the building height as a factor or have regional limitations. Additionally, for the coastal regions of China, which are often affected by storm surge disasters, they tend to have relatively low levels of economic development. Under these circumstances, the data needed to conduct flood risk assessment are generally lacking.
In response to the challenges mentioned above, the scientific goal of this paper is to propose a quantitative storm surge risk assessment method for underdeveloped areas based on deep learning and GIS techniques. First, on the basis of high-resolution DEM data and seawall data measurements, five defined storm surge inundation scenarios with different typhoon return periods are simulated by employing the coupled FVCOM–SWAN model. Subsequently, TransUNet is introduced as a deep learning method to extract the building footprint, and building height data are acquired through UAV measurement. Since data on relevant disaster losses in underdeveloped regions are lacking, empirical modeling was deemed impractical. Therefore, the adjustment of the Joint Research Centre's (JRC) depth–damage curves by Hazus is chosen to take the impact building height into consideration, thus to conduct a quantitative assessment with more accuracy. Finally, combining hazard maps, exposure elements, and adjusted depth–damage curves, quantitative risk zoning maps are created. The risk zoning maps can assist decision-makers in identifying high-risk sub-zones and planning disaster prevention measures. Accordingly, this approach is novel in obtaining refined exposure elements data through deep learning and UAV, addressing the lack of historical storm surge economic loss data, and considering the effect of building height on economic loss through the adjustment of existing depth–damage curves.
2.1 Study area
As a shipping hub in the South China Sea, since 1989, the province of Guangdong, located in southern China, has grown to become the Chinese province with the largest economic output, with a gross domestic product (GDP) of CNY 129 118.6 billion in 2022. However, as mentioned above, Guangdong is relatively vulnerable to storm surges, such as Typhoon Hato and Typhoon Mangkhut, due to its geographical characteristics.
Huizhou is a city in the province of Guangdong and also one of the central cities of Pearl River Delta region. It is located on the eastern coast of the Guangdong–Hong Kong–Macao Greater Bay Area, and the GDP reached CNY 540.1 billion in 2022, with the highest growth rate in Guangdong. The town of Pinghai is located at the southernmost edge of Huizhou and has a registered population of about 40 000. Its economy mainly depends on various crops and seafood products. Due to its coastal geographical characteristics and the presence of the Pinghai Ancient City, the town has become a cultural-tourist destination and can therefore be defined as a cultural-tourist town.
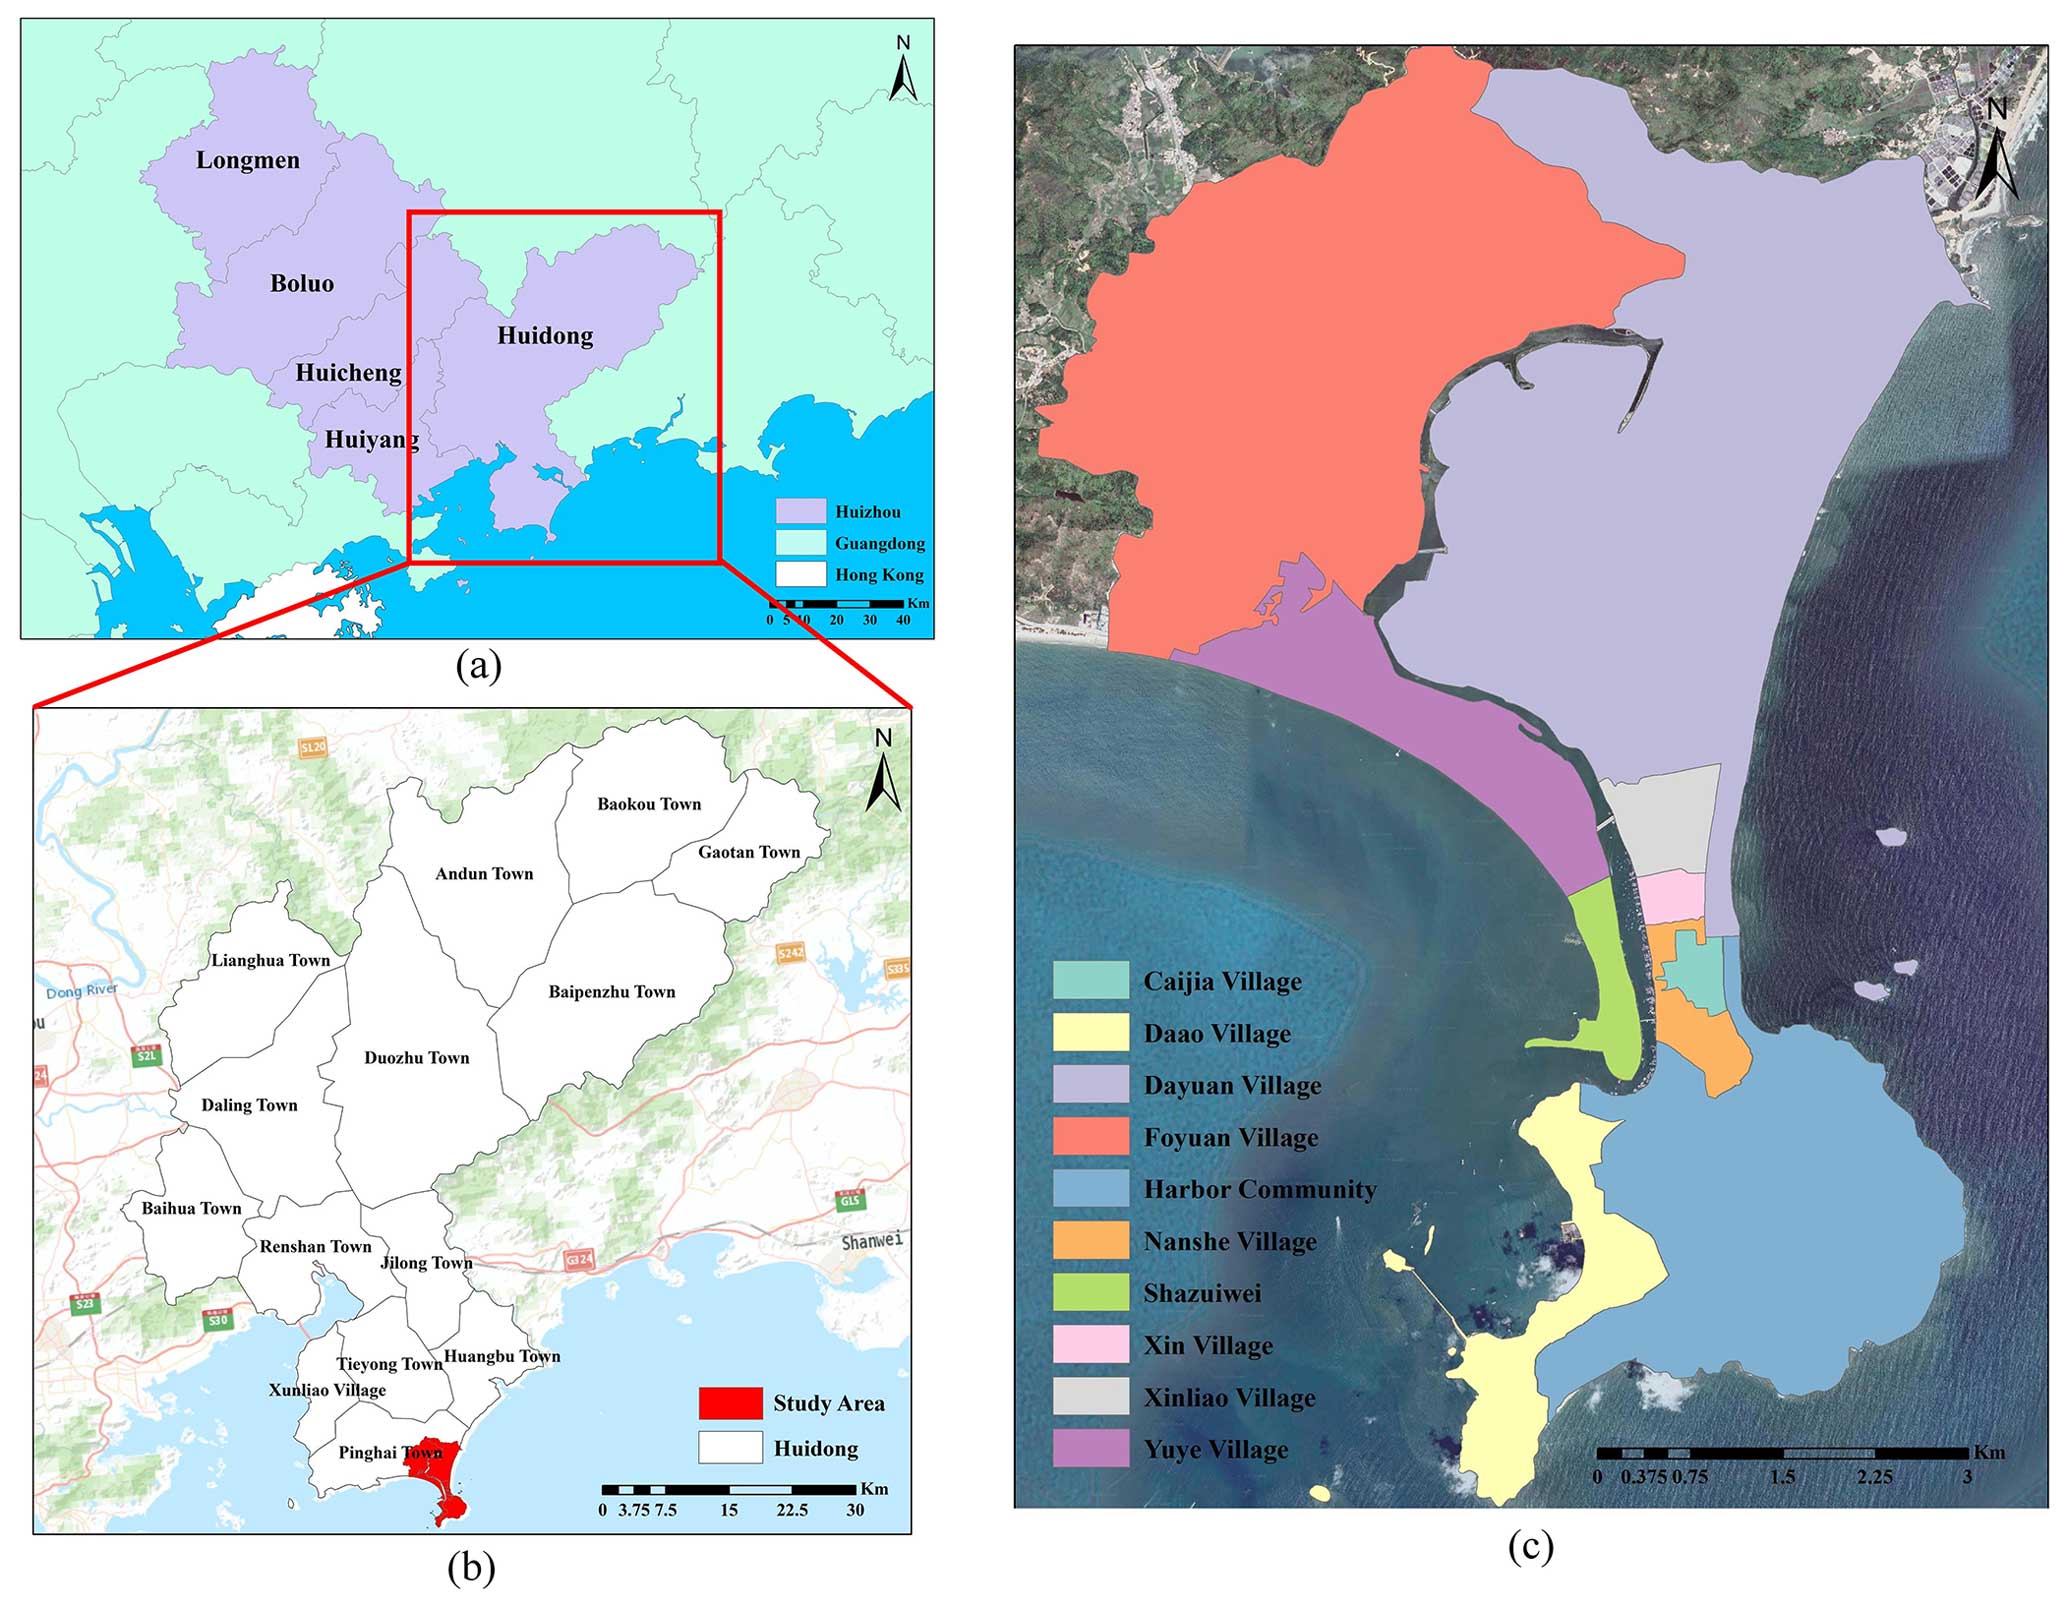
Figure 1Maps of locations in the study. (a) Map of Huizhou. (b) Map of the study area in Huidong; the base map was obtained from Esri. (c) Village map of the study area; the base map was obtained from © Google Maps (map data © 2023 Google).
In this paper, the chosen study region is the coastal area of the town of Pinghai, named Double Moon Bay. It covers 10 villages in total, including Foyuan, Dayuan, Yuye, Xinliao, Xin, Shazuiwei, Caijia, Nanshe, Daao, and Harbor Community. In recent years, the region has been developed for tourism and real estate, including through the construction of hotels, resorts, and high-end business districts, which has spurred its financial development. It is foreseeable that the population and economy of the region will grow rapidly. However, the economic status of the region remains relatively low, which presents a challenge due to data scarcity and limited accessibility. In addition, the region is susceptibly affected by tropical cyclones during the season running from April to November (S. Wang et al., 2021). In recent years, more than 10 typhoons have affected the study area, including Typhoon Lekima, Typhoon Haishen, and Typhoon Khanun. The general location and information about the study area are shown in Fig. 1.
2.2 Data sources
In order to accomplish the research, the data used are obtained from various sources. Below the different data types are described.
-
Land cover type data. These data were obtained from the Department of Natural Resources of Huizhou Bureau. They contain multiple land cover types including forest, cropland, and residential land. They are used to calculate the vulnerability level.
-
Remote sensing image data. Remote sensing images were obtained from the Chang Guang Jilin-1 satellite. Chang Guang Satellite technology Co., Ltd., was founded on 1 December 2014 and is the first and the largest commercial satellite corporation in China. Jilin-1 is the first independently developed commercial high-resolution satellite. The images from Jilin-1 satellite have a resolution of 50 cm and have five spectral channels: the panchromatic band, blue band, red band, green band, and near-infrared band. The images, consisting of data from the blue band, red band, and green band, are utilized in a combined deep learning method to extract buildings.
-
Unoccupied aerial vehicle (UAV) data. UAV data are generated by oblique photography and are organized in the OpenSceneGraph binary format. The UAV data were obtained from the Department of Natural Resources of Huizhou Bureau, and the data are utilized for building height calculation.
-
Digital elevation model (DEM) data. DEM data were captured by manual observation in 2018, with a resolution of 0.3 m. The coordinate system and file organization originally followed CGCS2000 (China Geodetic Coordinate System 2000) as text files, and they were further transformed to WGS84 (World Geodetic System 1984) in a raster format to make use of these data in the research. The data contain the elevation information for the study region. Moreover, the seawall data were also obtained manually. Both types of data are used in the modeling of storm surges for simulating the hazard maps.
-
Hybrid wind field data. ERA5 is the fifth generation of the European Reanalysis dataset produced by the European Centre for Medium-Range Weather Forecasts (ECMWF), and it provides comprehensive and high-resolution atmospheric and climate data. The Holland (1980) typhoon wind field model was proposed in 1980 and introduced the Holland B parameter on the basis of the Schloemer exponential pressure distribution model. In this study, these two data types are fused to generate hybrid wind field data, which are subsequently utilized for storm surge simulations.
-
Historical typhoon data. Historical typhoon data including typhoon track, typhoon pressure, and velocity were obtained through the China Meteorological Administration typhoon network website. The historical data are employed to assess the reliability and validity of the model.
-
Administrative-boundary data. These data were obtained from the National Platform for Common Geospatial Information Services and contain administrative boundaries at the village level. There are 10 villages in the study area.
The methods in this study aim to assess quantitative, directly tangible damage over the study area and consist of the following steps: hazard assessment, exposure assessment, vulnerability assessment, and risk assessment. A flowchart of the procedure is illustrated in Fig. 2.
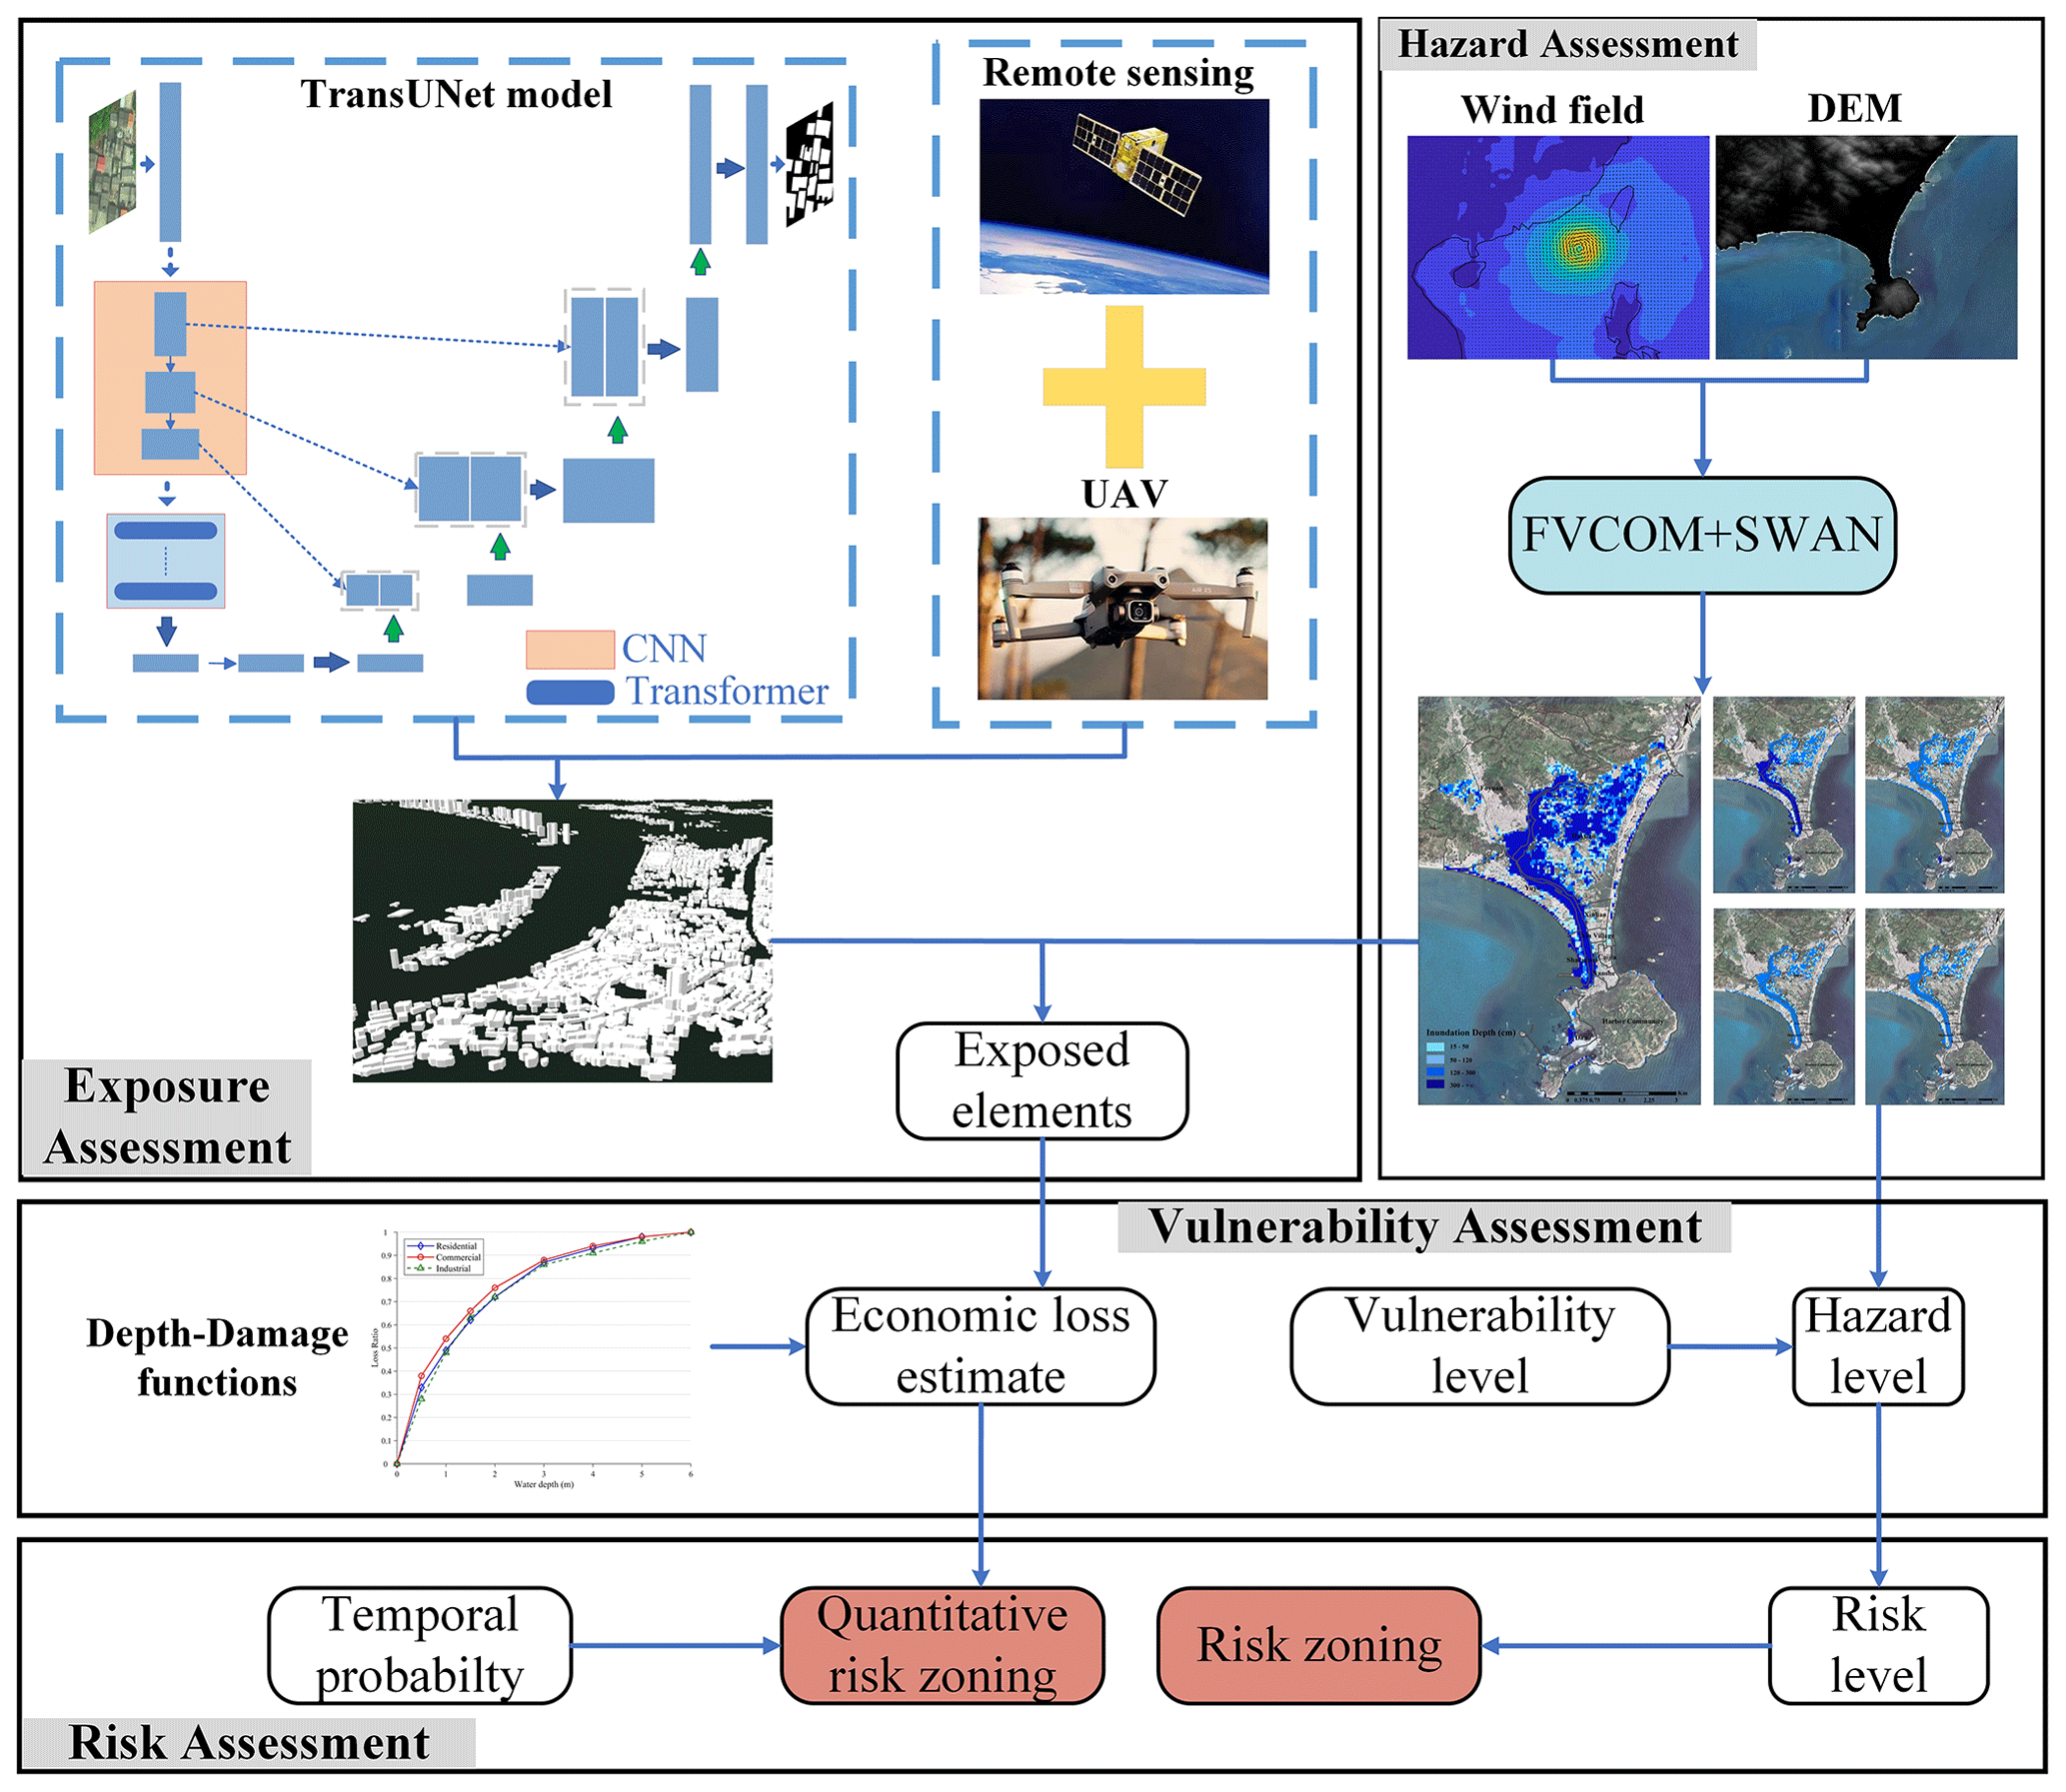
Figure 2Flowchart of the presented storm surge quantitative risk assessment method. The base map was obtained from © Google Maps (map data © 2023 Google).
First, with respect to hazard assessment, five storm surge scenarios are defined. After constructing a wind field through the Holland (1980) model, the inundation area and depth of different typhoon return periods are simulated by utilizing the coupled FVCOM–SWAN model. In exposure assessment, building footprints and heights are extracted by introducing the TransUNet deep learning method and shadow calculation. Then the hazard maps are overlaid to identify the elements at risk. Considering the effect of building floors on flood monetary loss estimation, the JRC's depth–damage functions are adapted, representing the vulnerability of different exposed elements. Finally, the economic loss of different typhoon scenarios can be summarized, and the risk assessment is conducted by multiplying the temporal probability. Moreover, the quantitative zoning maps of four risk levels are generated through a zonal statistic.
3.1 Strom surge inundation simulation
The Finite Volume Coastal Ocean Model (FVCOM) is a coastal ocean circulation model which was originally developed by Chen et al. (2003) and further improved by the University of Massachusetts and the Woods Hole Oceanographic Institution. The following are the governing equations of FVCOM, comprising momentum, continuity, temperature, salinity, and density equations:
where x, y, and z, respectively, represent the eastern, northern, and vertical coordinate axes in the Cartesian coordinate system; u, v and w are the velocity components in the x, y, and z directions; T, S, and ρ are the temperature, salinity, and density; P is the pressure and f stands for the Coriolis parameter; Km is the vertical eddy viscosity coefficient and Kh is the vertical eddy diffusivity coefficient for heat; g is gravitational acceleration; and Fu, Fv, FT, and FS are the horizontal diffusion terms.
Simulating WAves Nearshore (SWAN) is the third-generation offshore wave model developed by Delft University of Technology, and it was originally proposed by Booij et al. (1996). The governing equation of the model is shown as
where N is the wave action density; θ is the propagation direction; Cx and Cy are, respectively, the x and y components of propagation speed; Cy and Cθ are the γ and θ components of propagation speed; and γ and S, respectively, represent the frequency and the source term for the wave energy.
The potential storm surge inundation maps in different typhoon scenarios have been updated by institutions such as the National Oceanic and Atmospheric Administration (NOAA), the National Hurricane Center, and other departments since the 1990s (Glahn et al., 2009). In the field of risk assessment research, it is common to set up different typhoon scenarios using storm surge simulation models to obtain various scenarios of typhoon-induced inundation (Zhang et al., 2023; Rizzi et al., 2017). The hazard maps of under various typhoon intensity scenarios are helpful for decision-makers and researchers in analyzing multiple aspects of potential hazards in the study area.
Typhoon Mangkhut, as one of the largest typhoons to affect South China Sea region in recent years, is a strong representative. It is characterized by high intensity, a wide area of influence, high wind speed, etc. In this study, the path of Typhoon Mangkhut is shifted to pass through the Huizhou tidal station as the input typhoon path of the coupled model to maximize the impact area of the simulation result. In terms of the center pressure, S. Wang et al. (2021) presented statistical analyses of historical typhoon data in Huizhou and designed five typhoon scenarios, which are, respectively, the typhoon minimum central pressures of 880, 910, 920, 930, and 940 hPa. Therefore, these five parameters are introduced as the setup for five typhoon scenarios.
FVCOM and SWAN both use the unstructured triangular grid to subdivide the South China Sea, and the latitude and longitude range of the region is 13–29° N, 109–122° E. The SWAN parameters are set as follows. The wind input growth term and whitecap dissipation term follow the Komen scheme. The bottom friction dissipation is parameterized using the Madsen vortex viscosity model. The nonlinear interactions are implemented using three-wave and four-wave nonlinear interaction schemes. The input wind field is the fusing wind field derived from ERA5 and the Holland (1980) method. The open-boundary-forced tidal elevation of FVCOM is conducted by calculating the harmonic constants for the 11 major astronomical tidal constituents, namely M2, N2, S2, K2, K1, O1, P1, Q1, MS4, M4, and M6. The forcing field is the fusing wind field and the wave data generated by SWAN. The external model time step for the model is set to 0.75 s, while the internal model time step is set to 7 s.
In summary, the FVCOM–SWAN coupling method is utilized for simulating the inundation caused by storm surge. Specifically, following the modification of Typhoon Mangkhut's central pressure, velocity, and track data, the data are utilized as input for the Holland (1980) typhoon wind field model, subsequently yielding the wind field outcome. The hybrid wind field data generated are fed into the SWAN model to generate wave data. Then, both the wind data and wave data are input into the FVCOM model to calculate the extent of inundation.
3.2 Building extraction
The deep learning model used in the research is TransUNet (Chen et al., 2021), which was originally proposed for segmentation of medical images. TransUNet incorporates a transformer in the encoder within the architecture of the U-shaped network, consequently making use of the advantage of global information extraction while fusing the superficial and deep features. With the goal of building extraction, the target is to segment the building's area precisely. The TransUNet model can effectively identify the boundary between buildings and a background, which enables the model to be a competent for extracting the buildings with a different size and shape.
The following is a relevant introduction of the structure of the model.
3.2.1 Transformer in TransUNet
The transformer was first proposed by Sutskever et al. (2014), which was originally utilized for machine translation. However, as more variants of the transformer were developed, people found that transforming also performed well in multiple tasks, such as natural language processing (NLP), computer vision (CV), and automatic speech recognition (ASR).
The transformer encoder is composed of L layers of multi-head self-attention (MSA), layer normalization (LN), and multi-layer perceptron (MLP). The structure is shown in the Fig. 3a, and the equations of query–key–value (QKV) self-attention and MSA are shown below:
where Q, K, and V are, respectively, the query, key, and value matrix; is the scaled dot-product attention; and WO, , , and are, respectively, the corresponding linear mapping, which convert to Q, K, V, and the output to the specified dimension.
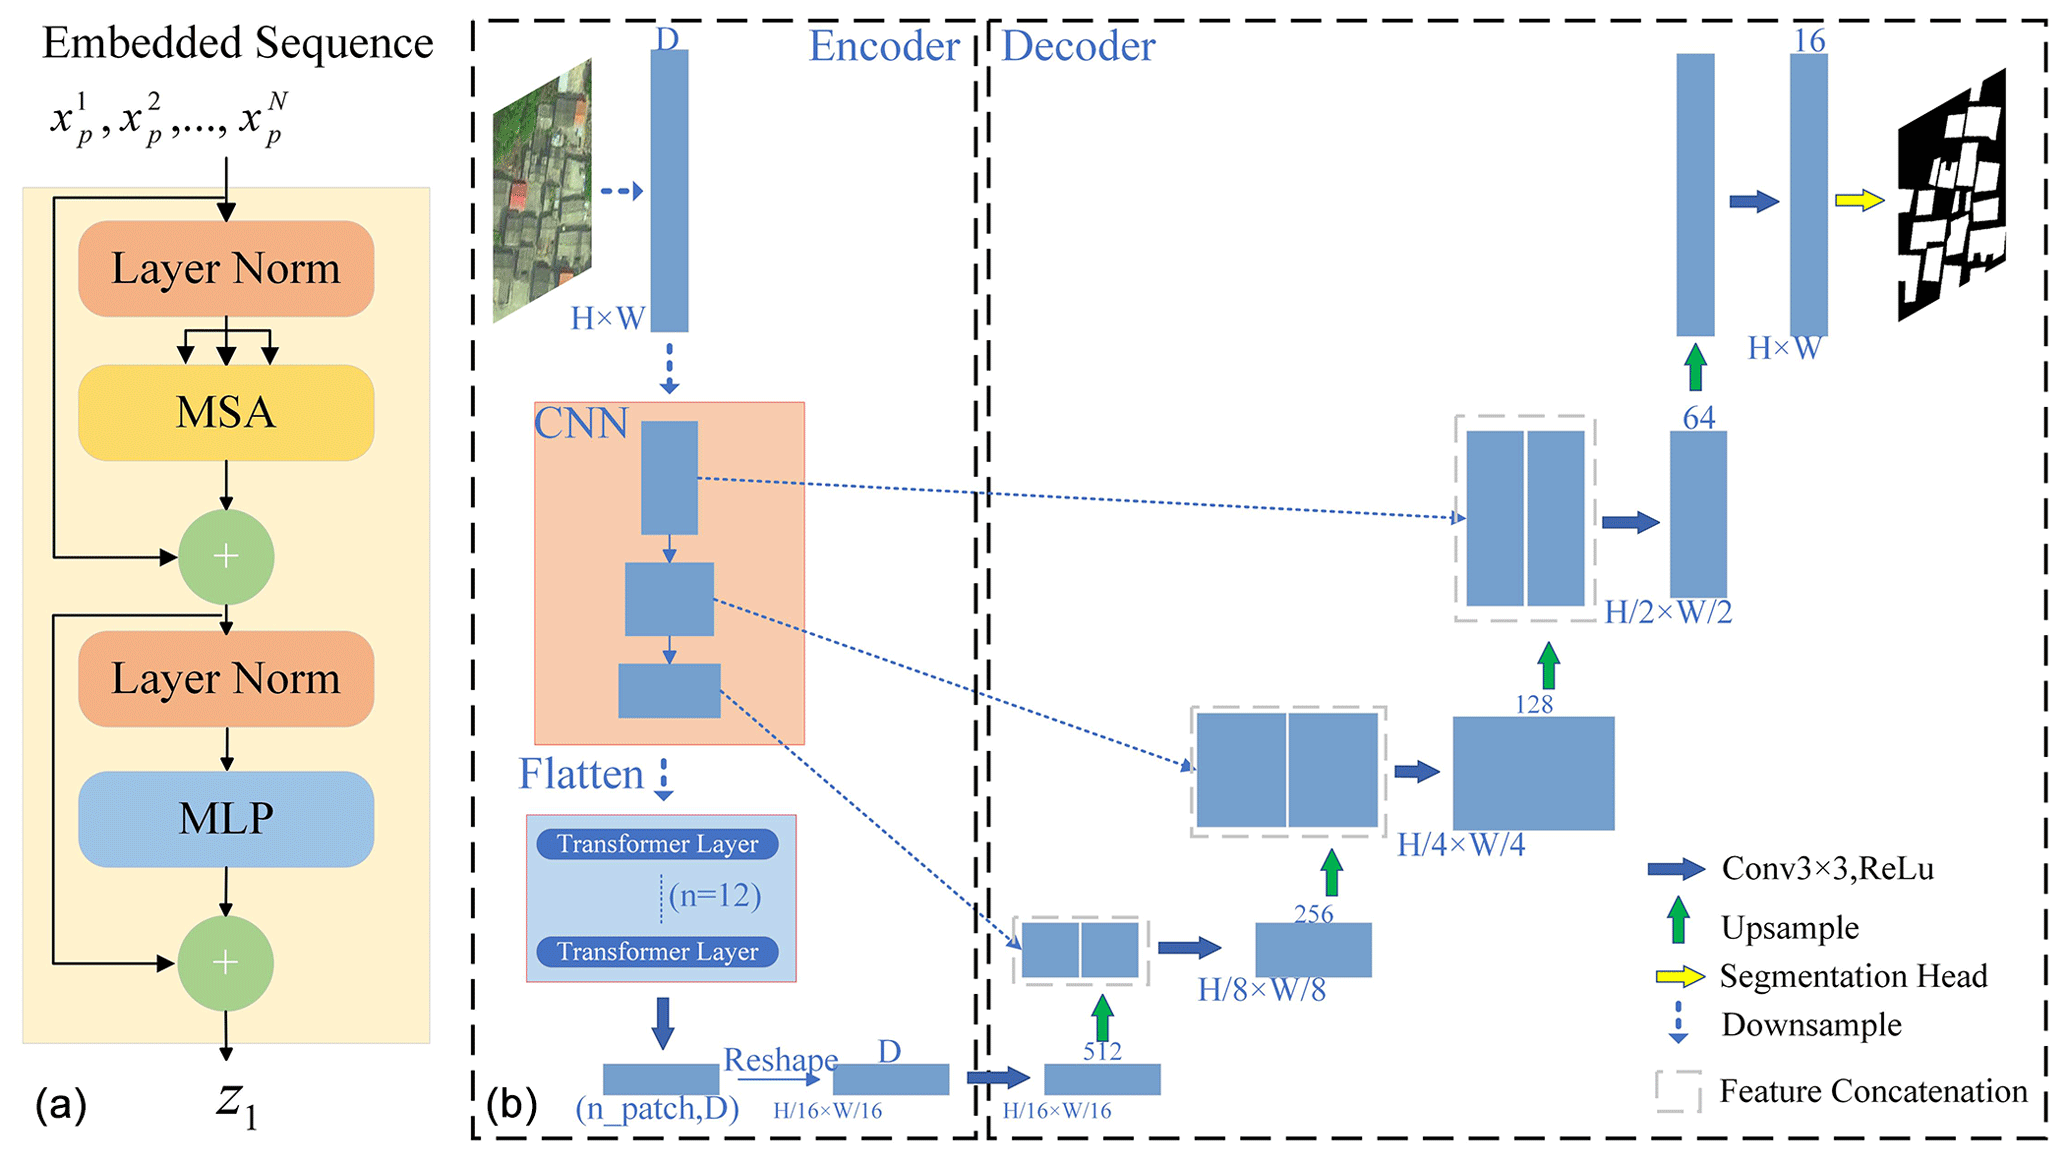
Figure 3Overview of the TransUNet framework (adapted from Chen et al., 2021). (a) Schematic diagram of the transformer layer. (b) Structure diagram of TransUNet. ReLu: rectified linear unit.
MSA has a positive effect on helping the model to identify the target objects and background; thus the neutral network can learn more information from the target. LN is deemed to stabilize the deep network training, which can prevent an unstable gradient, model degradation, etc. The module receives the 2D flatted patches from the image's patches. Due to it being different from a CNN (convolutional neural network) or RNN (recurrent neural network), apart from mapping the vectorized patches to D-dimensional embedding space, the transformer needs to apply additional position encoding to retain the patch's positional information.
3.2.2 Structure of TransUNet
The overall structure of TransUNet is a reference to U-Net, which has a U-shaped encoder–decoder structure, and the structure diagram is shown in the Fig. 3b.
In the encoder, the origin image is put into the CNN part for feature extraction. After the processing of the position encoding and flattening, the patches are further put into the transformer module. The transformer module consists of 12 transformer layers. The CNN part is implemented through using ResNet50, which includes three blocks in total, with each block outputting the hidden feature for a skip connection.
The decoder reshapes the output sequence from the encoder and then performs cascade upsampling after transforming the number of channels. During the process, the skip connection is introduced using the feature map hereinbefore. In the end, the segmentation result is generated.
In conclusion, TransUNet is the combination of U-Net and the transformer, which is designed to make use of advantages from both structures. The global attention from the transformer can contribute to learning global information, while the skip connection from the U-shaped network can contribute to getting more information from shallow feature map output from the CNN, and also the CNN performs better in extracting the local information. In this research, building images are similar to medical images, with features like a high complexity level and large range of gray values. The skip connection structure can perform simultaneously acquisition of low-level semantic features and high-level semantic features, and the transformer can conduce identification of the buildings from the background; thus TransUNet achieves high accuracy in building segmentation.
3.3 Building height acquisition
UAV tilt photography modeling technology can combine control point encryption from a massive amount of image data with a small number of ground control points to obtain accurate external orientation elements (Kang et al., 2020). The 3D model reflects the true condition of the ground, and the data are selected to be in the WGS84 coordinate system. The ground resolution is one of the most intuitive and important parameters in tilt photography, and it is also a key factor in determining the quality of the 3D modeling. In the process of performing aerial triangulation for tilted-image automation, it is necessary to ensure that the resolution of the different images is as consistent as possible while taking into account the resolution of the side-view image, thus ensuring accuracy and image overlap. Hence, the combinatory analysis of image resolution at a tilted viewing angle is required. The resolutions of the tilted-image center point, near point, and far point are expressed as follows:
where GSD is the ground sampling distance; δ is the sensor cell size; h is flight height; f refers to the camera focal length; and αy and βy are, respectively, the dip angle and half of the angle of view. Normally, the ground resolution at the center of the tilted and vertical images should be comparable, and the minimum resolution of tilted images should less than 3 times the resolution of a vertical image.
There are multiple formats available for storing 3D models, including OBJ, STL, FBX, and OSGB. In this study, the generated 3D model is saved in the OSGB format. The OSGB format was originally proposed by the Ordnance Survey for storing British geographic spatial data. It combines binary encoding and compression algorithms to improve the data storage and transmission efficiency. Normally, the OSGB data contain information of geographic coordinates, elevations, texture mapping, and geometric shapes, which can be used in GIS, virtual reality (VR), and other applications.
A digital surface model (DSM) is a digital terrain model that contains elevation information about trees, buildings, and bridges. Compared to a DEM, a DSM can reflect the true surface condition of the earth; thus a DSM has a wide range of applications in city management or forest stewardship. In this research, the UAV data can be transformed to DSM data using SuperMap software, and the DSM result is shown in Fig. 4b. After generating the DSM, the elevations of the roof of buildings and corresponding elevations of the ground around the buildings are extracted by manual selection, and then the height of buildings can be calculated using Eq. (15).
where DSMRoof is the DSM value of the building's roof, DSMGround represents the corresponding DSM value of the ground, and H is the result of building height.
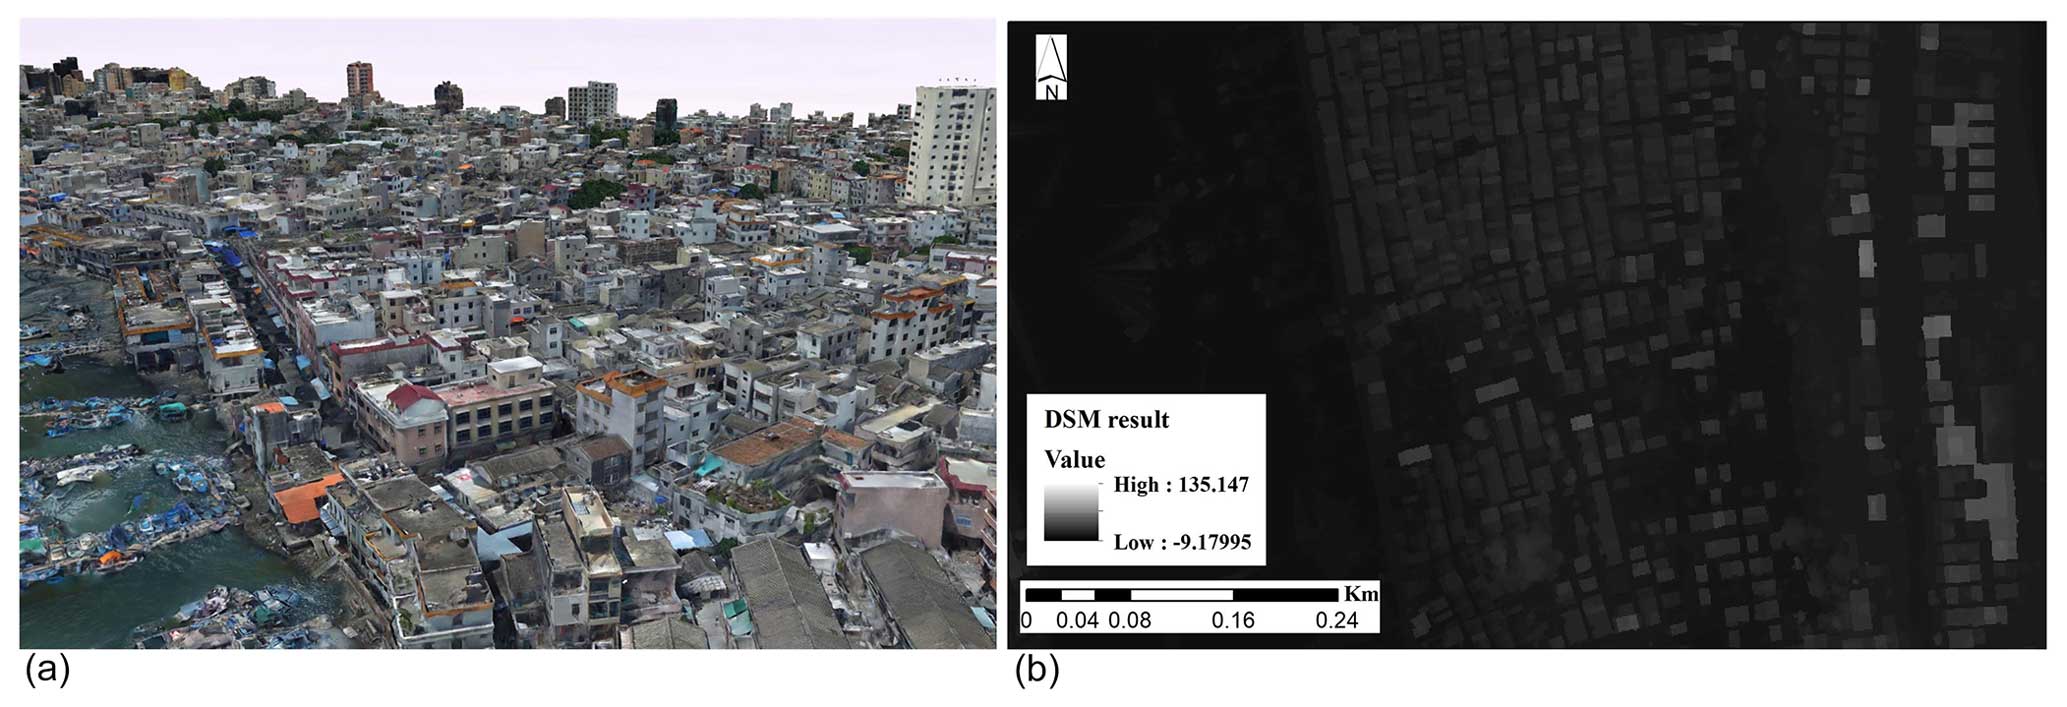
Figure 4Building height acquisition. (a) Schematic diagram of UAV tilt photography data. (b) Generated DSM results for building height data extraction.
3.4 Exposure and vulnerability assessment
The process of storm surge risk assessment involves two key components: exposure and vulnerability. Exposure represents the elements exposed to hazardous spaces, while vulnerability refers to the level of the exposure elements' susceptibility to damage. When doing an exposure assessment, the disaster-affected elements can be analyzed by overlaying the building footprint data and land cover data with the hazard layer, which is the inundation data in this research. The process can be accomplished using overlay analysis in ArcGIS software.
3.4.1 Adaptation of flood vulnerability functions
Constructing an empirical stage–damage curve is a commonly used method for conducting vulnerability assessments. However, as is mentioned above, China lacks data about flood loss or insurance compensation in flood disasters; as a result, it is not practicable to develop exclusive functions for the study region, so the depth–damage functions developed by Huizinga et al. (2017) of the Joint Research Centre (JRC) are introduced. The depth–damage functions manifest the loss ratio of the exposure elements at different inundation depths from 0 to 6 m, and the ratio ranges from 0 to 1, which represents no damage to fully damaged. Moreover, the JRC also provides the maximum economic losses per square meter for six different exposure element types including residential, industrial, infrastructure, road, agricultural land, and transport. In this study, the original functions and maximum loss data for China region are used, and the economic loss can be calculated by multiplying the loss ratio, the maximum loss, and the disaster-affected area.
However, the JRC's vulnerability functions do not provide the specific function of each height category. In this case, the depth–damage functions in Hazus are introduced. Hazus was first released for earthquakes in 1997 by the Federal Emergency Management Agency (FEMA), when the Hazus flood model first started to be developed (Scawthorn et al., 2006). In 2004, a multi-hazard version called Hazus-MH was created that was a standardized GIS-based model that included the earthquake, flood, and hurricane models (Nastev and Todorov, 2013). The Hazus-MH flood model is designed primarily for local and regional hazard planners and emergency managers developing emergency management plans and mitigation strategies (Tate et al., 2015). However, the depth–damage functions in Hazus-MH are restricted to regions within the United States; hence the Hazus's functions are introduced to adapt the JRC's functions.
The approach to modifying functions refers to the method proposed by Dabbeek et al. (2020). In the process, the Hazus loss ratios of each height category (buildings with one, two, and three or more stories) are averaged, which is shown in Eq. (16). Then the contribution of each height category relative to the average loss is calculated as shown in Eq. (17). In the end, multiplying the value obtained in the previous step by the JRC's vulnerability functions yields the adapted functions for each height category.
where di,h represents the loss ratio at inundation depth i for each height category h. is the average loss ratio of all heights.
3.4.2 Quantitative risk assessment
A quantitative financial loss estimation is calculated by overlaying the following data: the inundation simulation result generated by FVCOM and SWAN modeling, the spatial distribution of three types of exposure elements, the depth–damage functions of industrial and commercial elements, and the adapted depth–damage functions for residential elements in three height categories. The process of loss estimation can be shown in the following equation:
where C stands for the economic loss estimation result, n represents the total number of exposure elements, x(i) is the type of the ith element and Dx(i) is the maximum loss of the ith element, di is the depth of submergence of the ith element and f(di) is the loss ratio of the ith element, and Ai refers to the area of the ith element.
The monetary loss of residential buildings in 2010 of EUR 984 per square meter, whereas the monetary loss of infrastructure and agriculture are, respectively, EUR 12 per square meter and EUR 0.02 per square meter according to the JRC, only accounting for 1 % or less. Therefore, the monetary loss estimate of infrastructure and agriculture is excluded in the study.
In this research, five storm surge scenarios are settled and 10 administrative sub-zones are given four different risk levels for each defined typhoon scenario.
4.1 Validation
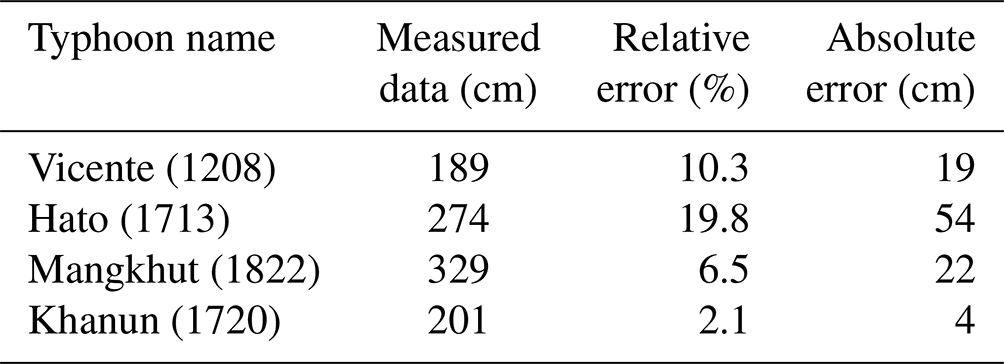
The performance of the coupled FVCOM–SWAN model is evaluated. Four typical typhoons (Vicente, Hato, Mangkhut, Khanun) are selected to validate the coupled model for the study region. The measured data of each typhoon are captured by the Department of Natural Resources of Huizhou Bureau. Figure 5 shows the maximum predicted water level and highest measured water level of the chosen typhoons. Relative error and absolute error are introduced to evaluate the model, and Table 1 displays the statistical results from the Huizhou tidal station. It is seen that the predicted results are in good agreement with the measurements. The statistical result shows that the relative errors of the four typhoons range from 2.1 % to 19.8 % and the absolute error varies from 4 to 54 cm. Therefore, the coupled FVCOM–SWAN model demonstrates reliable competence in accomplishing the storm surge simulation task.
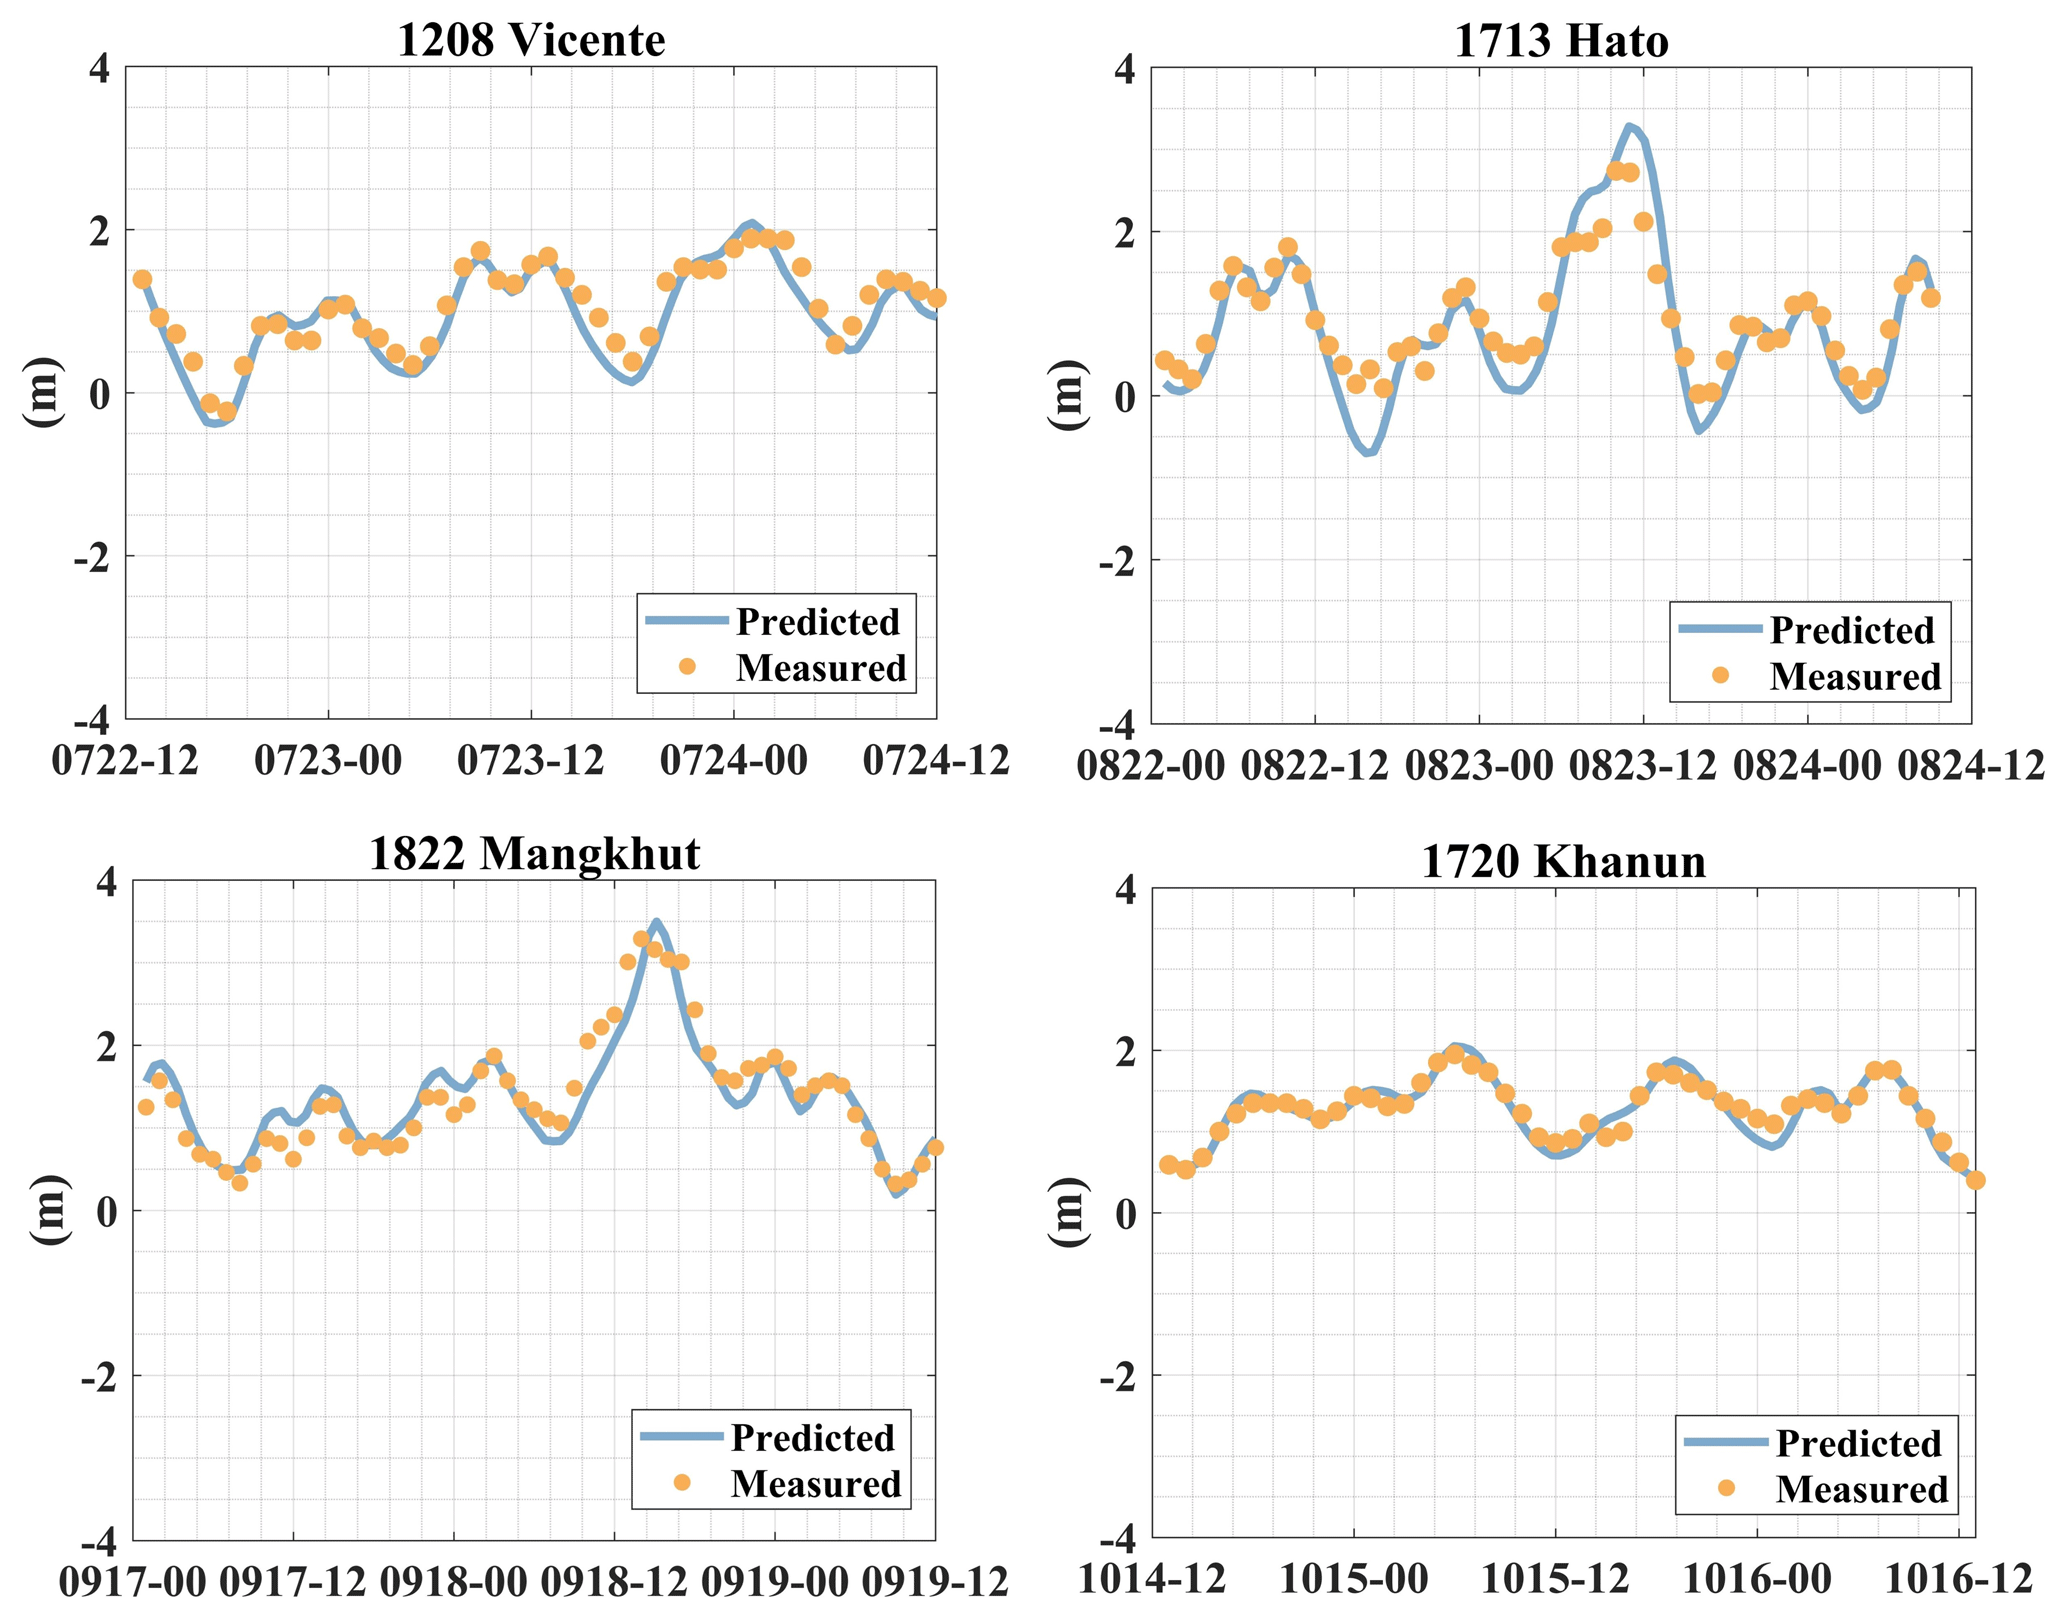
Figure 5The predicted water level and highest measured water level recorded by the Huizhou tidal station during different typhoon events.
Table 1The relative error and absolute error between the maximum predicted water levels and highest measured water levels from the Huizhou tidal station during different typhoon events.
4.2 Hazard assessment
In the present research, five storm surge inundation scenarios are defined that represent five different typhoon return periods: 10, 20, 50, 100, and 1000 years, respectively, corresponding to minimum central pressures of 940, 930, 920, 910, and 880 hPa and probabilities of occurrence of 10 %, 5 %, 2 %, 1 %, and 0.1 %. The simulation result is displayed through ArcGIS 10.8 software, and the inundation area and depth simulation results for each scenario are shown in Fig. 6. It is seen that the inundation area is spread over the coastal area in the southwest of the study area. In particular, for the 1000-year return period scenario, the inundation area exceeds 13 km2 in the study area. Moreover, the presence of Double Moon Bay leads to the extension of the inundation along the bay, contributing to severe disasters inland.
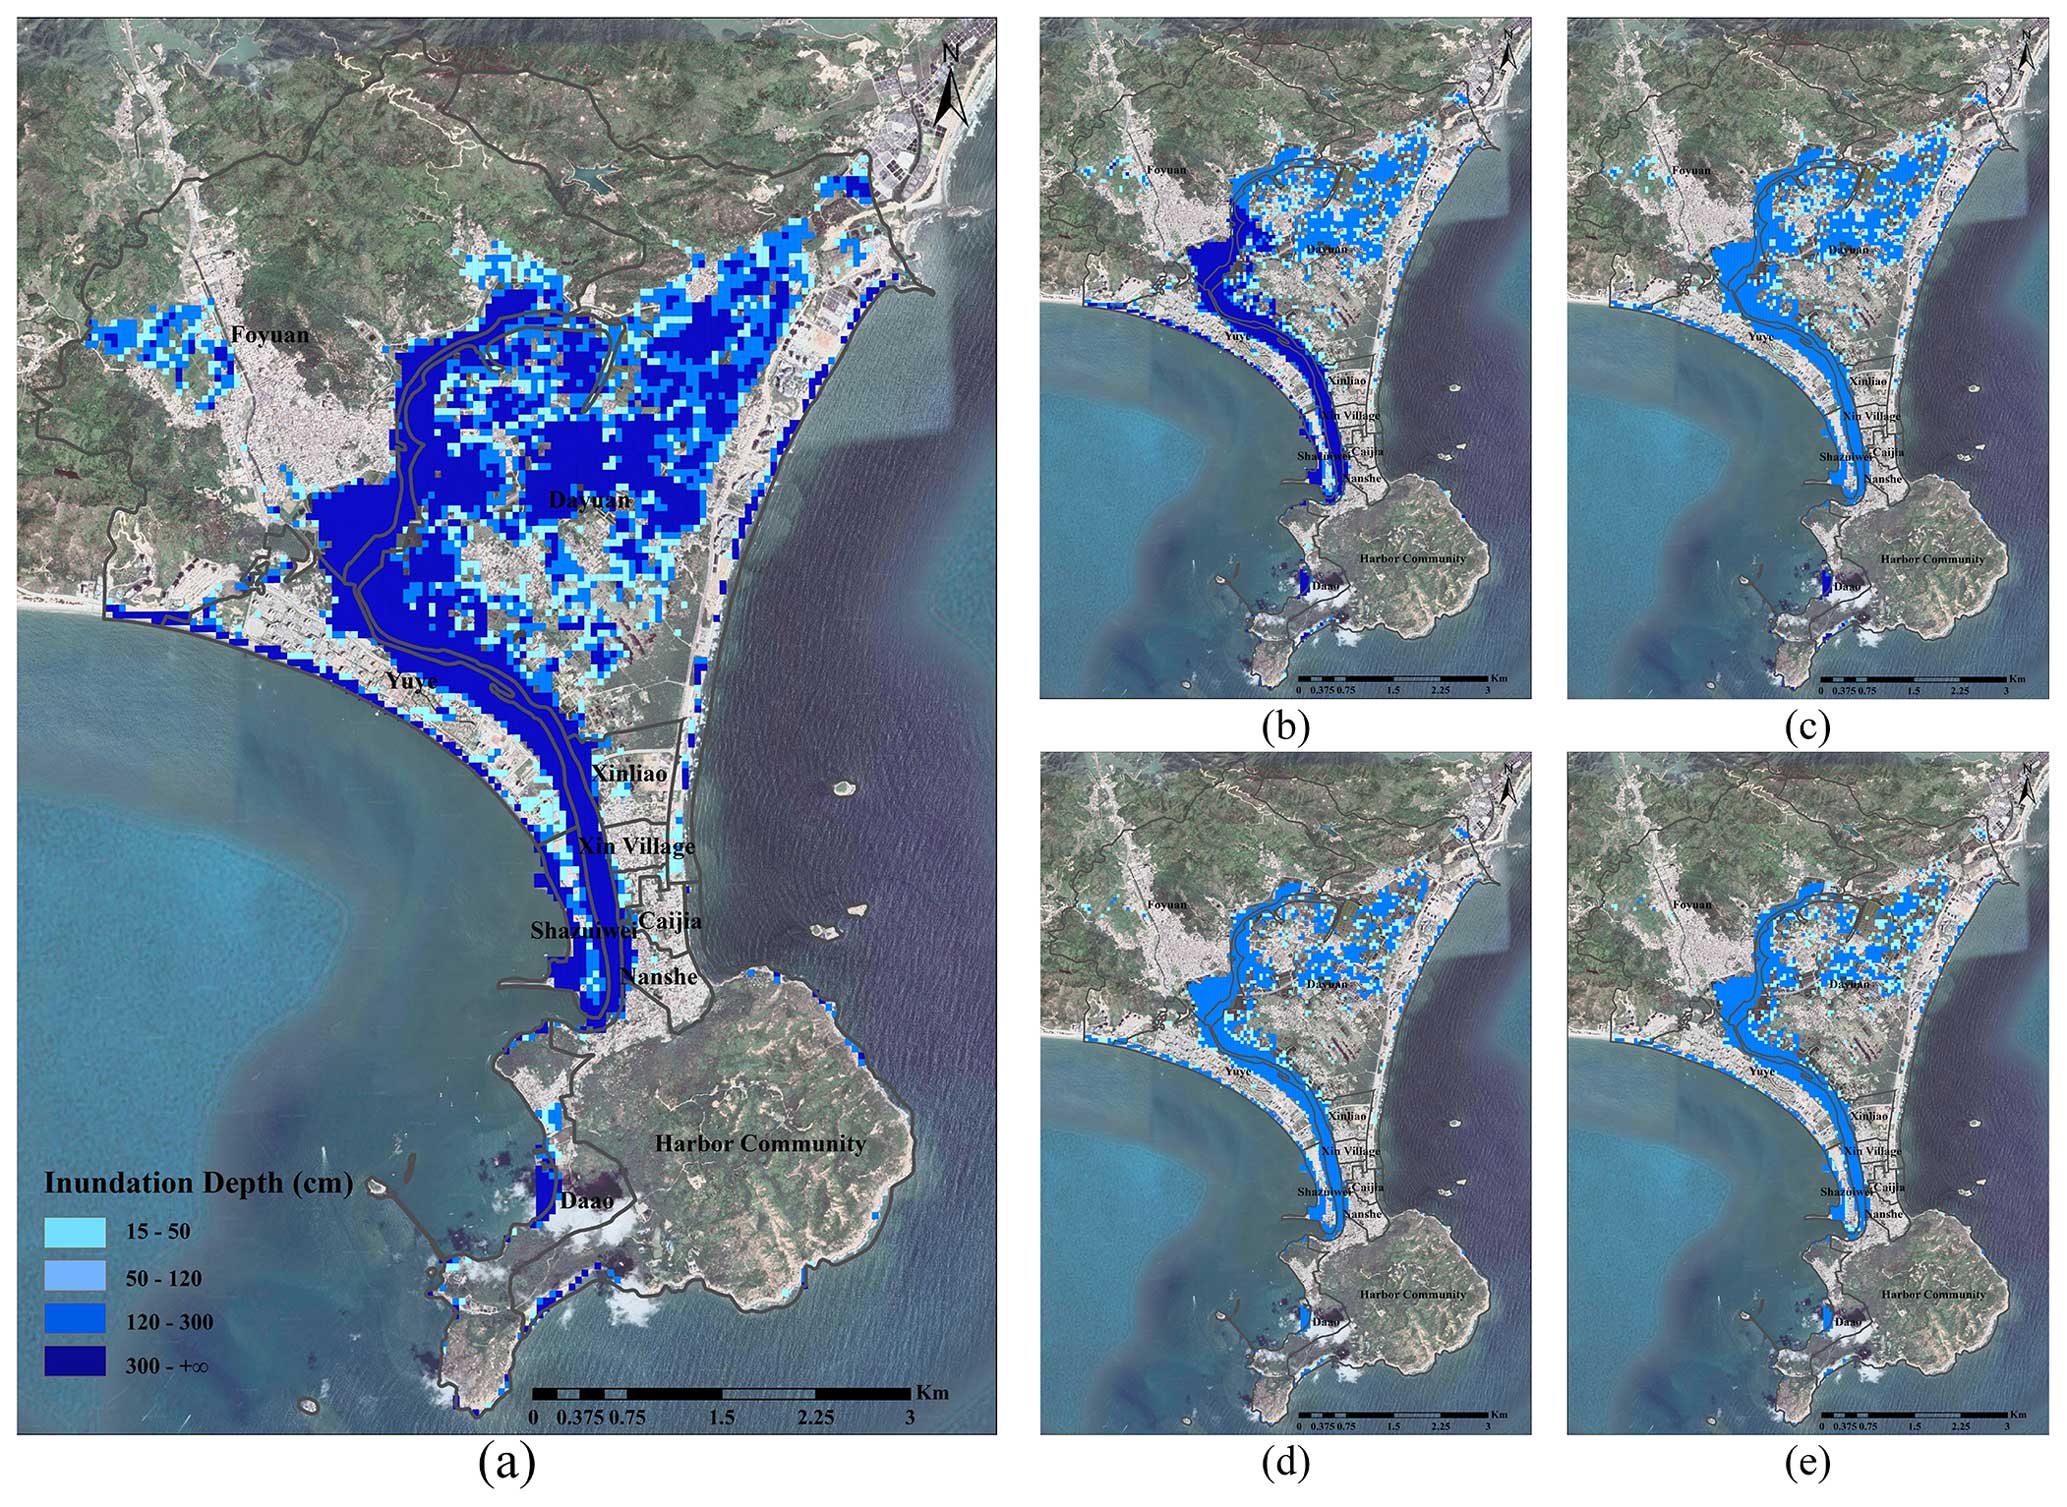
Figure 6Storm surge inundation simulation results of five different typhoon scenarios with return periods of (a) 1000, (b) 100, (c) 50, (d) 20, and (e) 10 years. The base map was obtained from © Google Maps (map data © 2023 Google).
From the point of view of different scenarios, the area of inundation in direct proportion to the typhoon's return period and in proportion to the inundation area increases from 14 % to 31 % of the study area. When the return period is less than 50 years, most of the flooded area is considered to be in a high-level hazard zone, accounting for 75 % for a 10-year return period and 67 % for a 20-year return period, with no zone in a very high-level hazard. Basically, the inundation area covers land such as grassland, saline land, and some buildings near the estuary as the area is more susceptible to flooding because of the lower elevation and drainage from the estuary. As the return period goes up to 100 years, 34 % and 36 % of the flooded area are defined as a high-level hazard and very high-level hazard. When it is 1000 years, the situation worsens, with approximately half of the inundation area being considered a very high-level hazard. Typically, the flood extends from the margin of the terrene; however, the southernmost region of the investigated area is characterized by a knoll covered by forest vegetation, which serves the dual purpose of water absorption and flood mitigation. In addition, the construction of embankments on both sides of Double Moon Bay effectively withstands flooding. Nevertheless, because of the presence of the estuary, the inadequate water absorption ability of coastal saline soil, and the hydrological system, the inundation flows in through the estuary and spreads inland.
4.3 Building character extraction
4.3.1 TransUNet model training
The dataset construction area is chosen to be the southwestern waterfront region of the town of Renshan. The specific location is shown in Fig. 7. The chosen area is an area typical of the Huizhou coastal area. Apart from the seaside bungalows, the area contains some high-rise buildings that are identified as commercial hotels or resorts, while a dense residential area is also widely distributed throughout the inland region. In conclusion, the chosen area contains different kinds of buildings with strong representativeness. Since most of the buildings in Chinese coastal towns have similar characteristics, the model trained on the representative region has the ability to identify buildings in other regions rapidly.
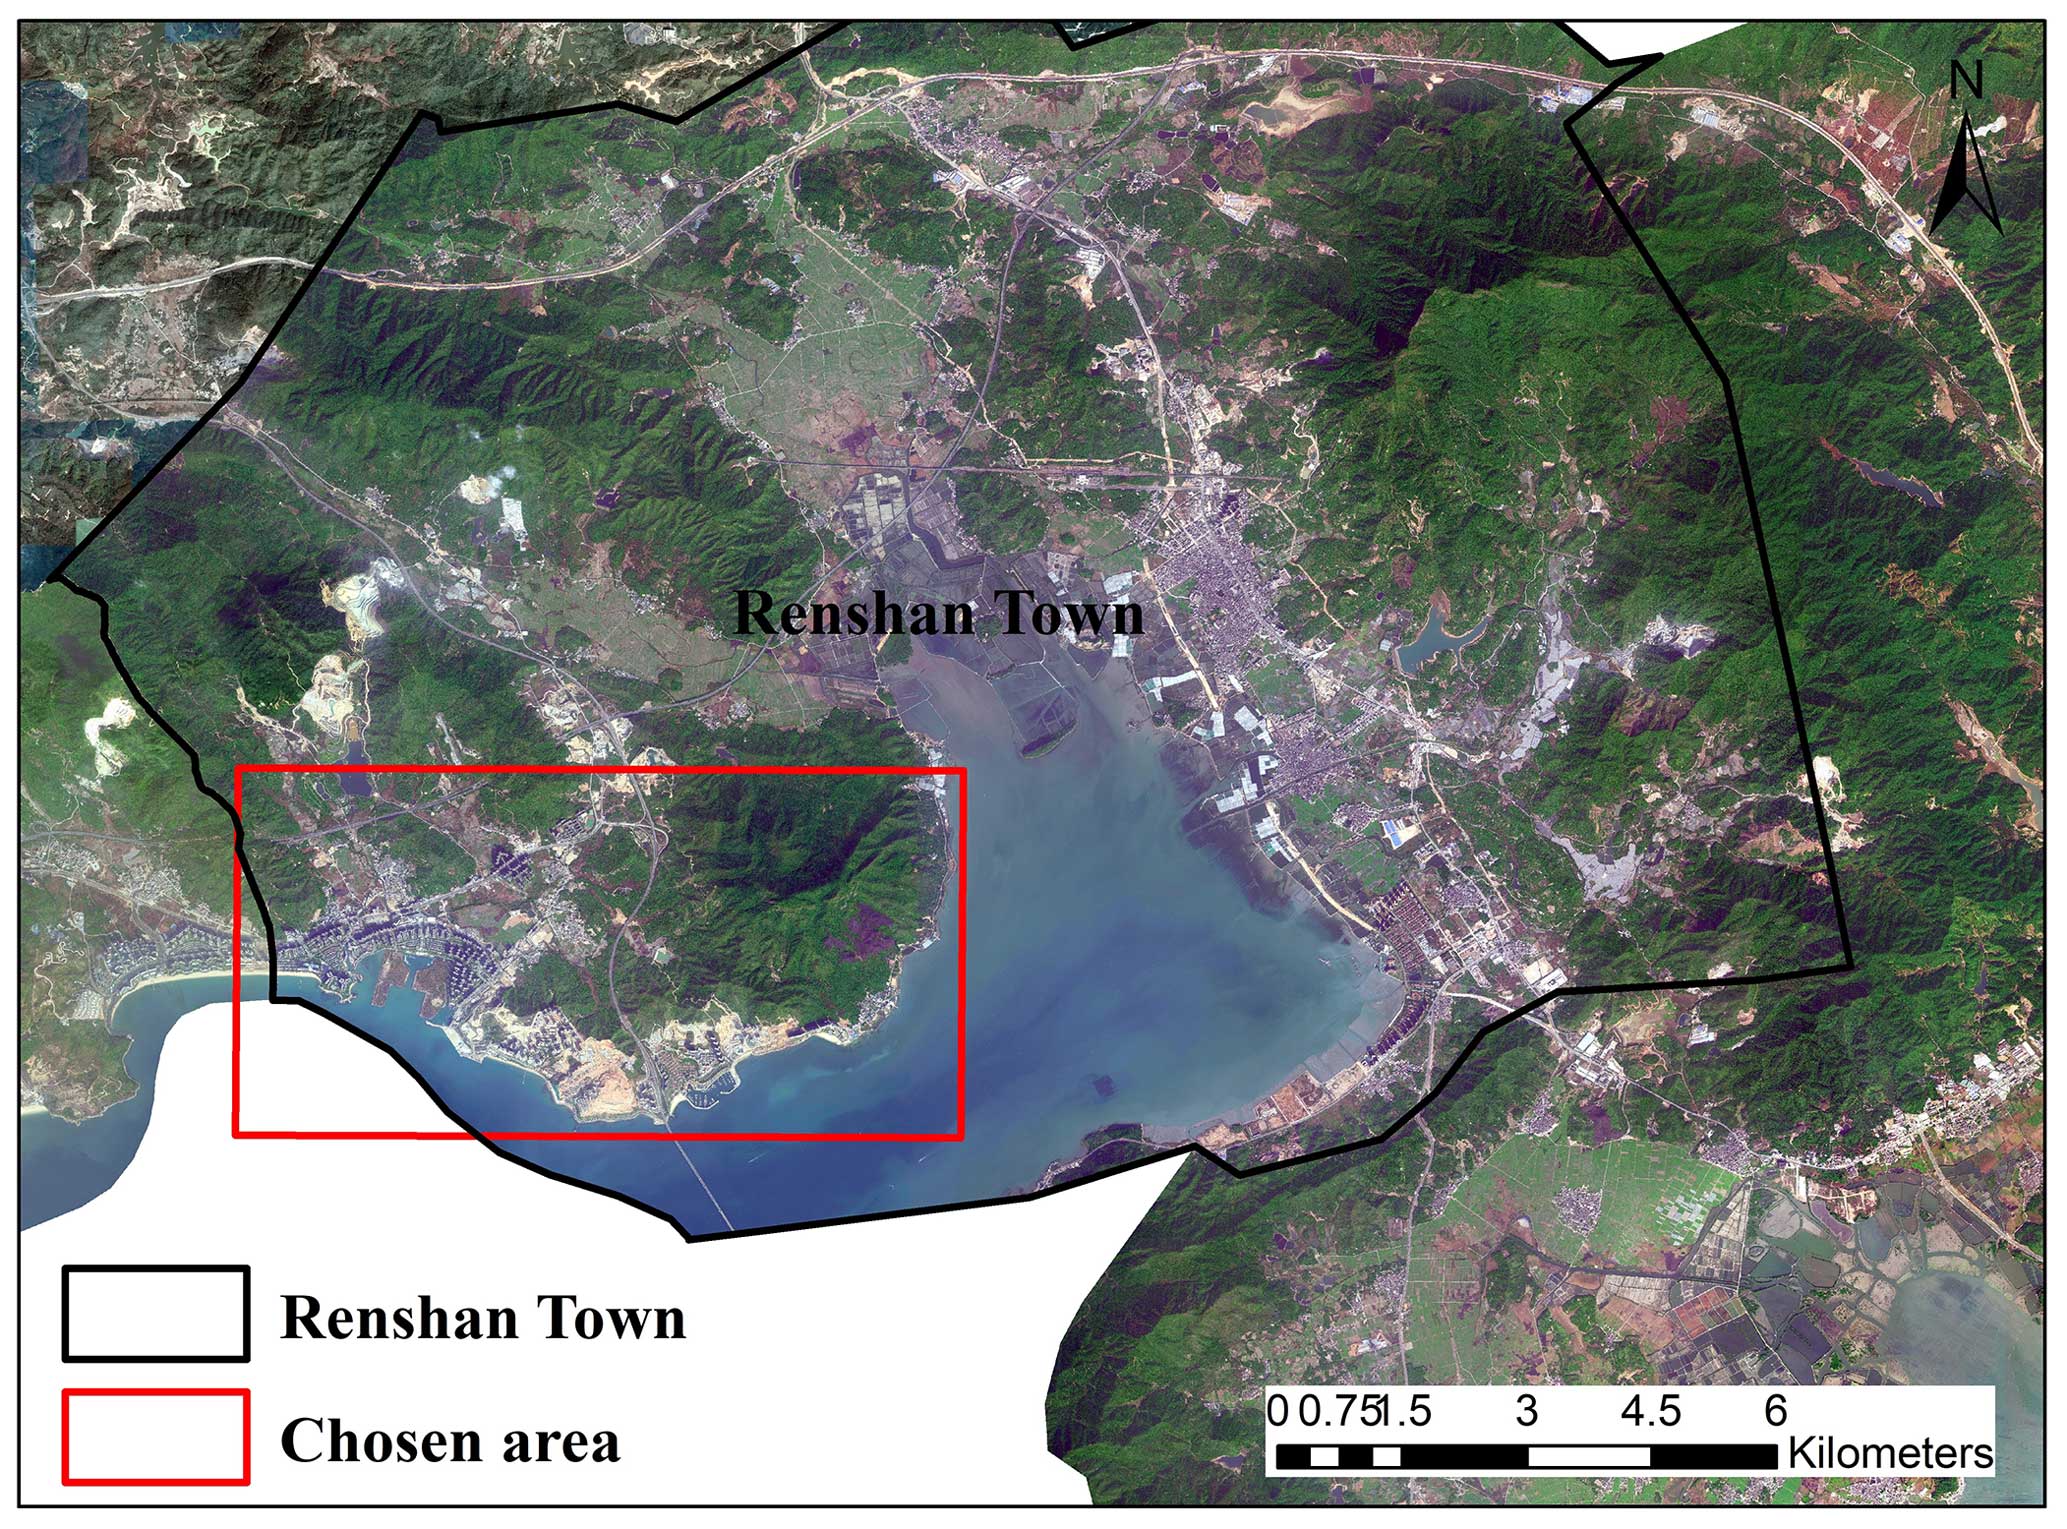
Figure 7The area chosen to make the training samples. The base map was obtained from © Google Maps (map data © 2023 Google).
The labels of the buildings in the area are generated by manual annotation, and the image is cropped into small patches with a size of 256 pixels × 256 pixels. Moreover, some of the images without buildings are filtered to prevent the effect of imbalance between the building samples and background samples. In the end, a dataset with a total of 1200 labeled buildings is constructed, and the dataset size is deemed sufficient when compared to previous studies (Dixit et al., 2021; Ji et al., 2018). The dataset is then divided into a training set and a test set, with the ratio of 8:2. Data enhancement techniques, such as using a random hue saturation value, random shift scale rotation, flip, and rotation, are implemented during model training to improve the deep learning model's generalization performance and prevent overfitting.
The initial training learning rate is set to , and the learning rate adjustment strategy is used for improved training. The batch size is specified as 4, and the number of training epochs is 100. The model is trained on NVIDIA RTX 3060 GPUs.
4.3.2 Extraction result
Several effective indicators are introduced, including recall, precision, F1 score, and the mean intersection over union (mIoU), to evaluate the performance of the deep learning model. Recall is the probability of being predicted as positive among actual positive samples. Precision, on the other hand, is the probability of being actually positive among samples predicted as positive. The F1 score serves as an indicator that achieves a balance point between precision and recall, essentially being the harmonic average of precision and recall. mIoU is the mean ratio of the intersection to the union between predicted and true values for each category. True positive (TP) indicates the true samples that are predicted correctly by the model. False positive (FP) indicates the positive samples that the model incorrectly predicted. True negative (TN) and false negative (FN) refer to the number of samples that are correctly and incorrectly predicted as negative by the model. The equations of recall, precision, F1 score, and mIoU are as follows:
The quantitative evaluation result is shown in Table 2, and the visualization results are illustrated in Fig. 8. As Table 2 shows, the recall score reaches 87 %, indicating that most of the true building pixels are predicted correctly, and precision indicates that 82 % of all building pixels are correctly detected. Moreover, both the mIoU score and F1 score exceed 80 %, demonstrating that the model can balance well between precision and recall. These results reflect the strong performance of TransUNet in the building extraction task. After post-processing the result, such as through boundary simplification, the building vectorization results can be used for further research in risk assessment. The overall result is shown in Fig. 9b and c.
Table 2Statistical accuracy assessment of building footprint extraction.
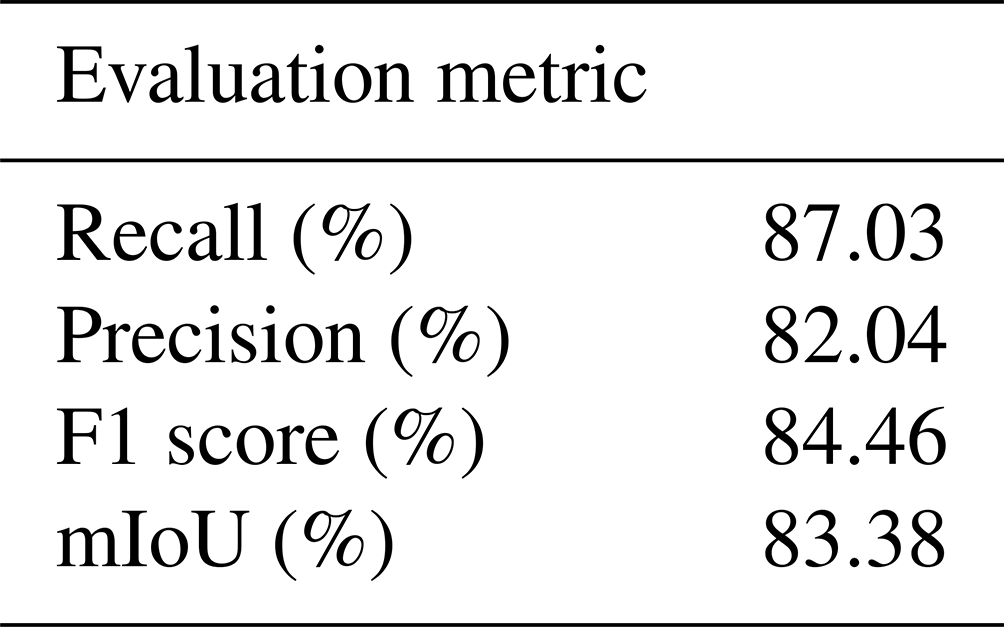
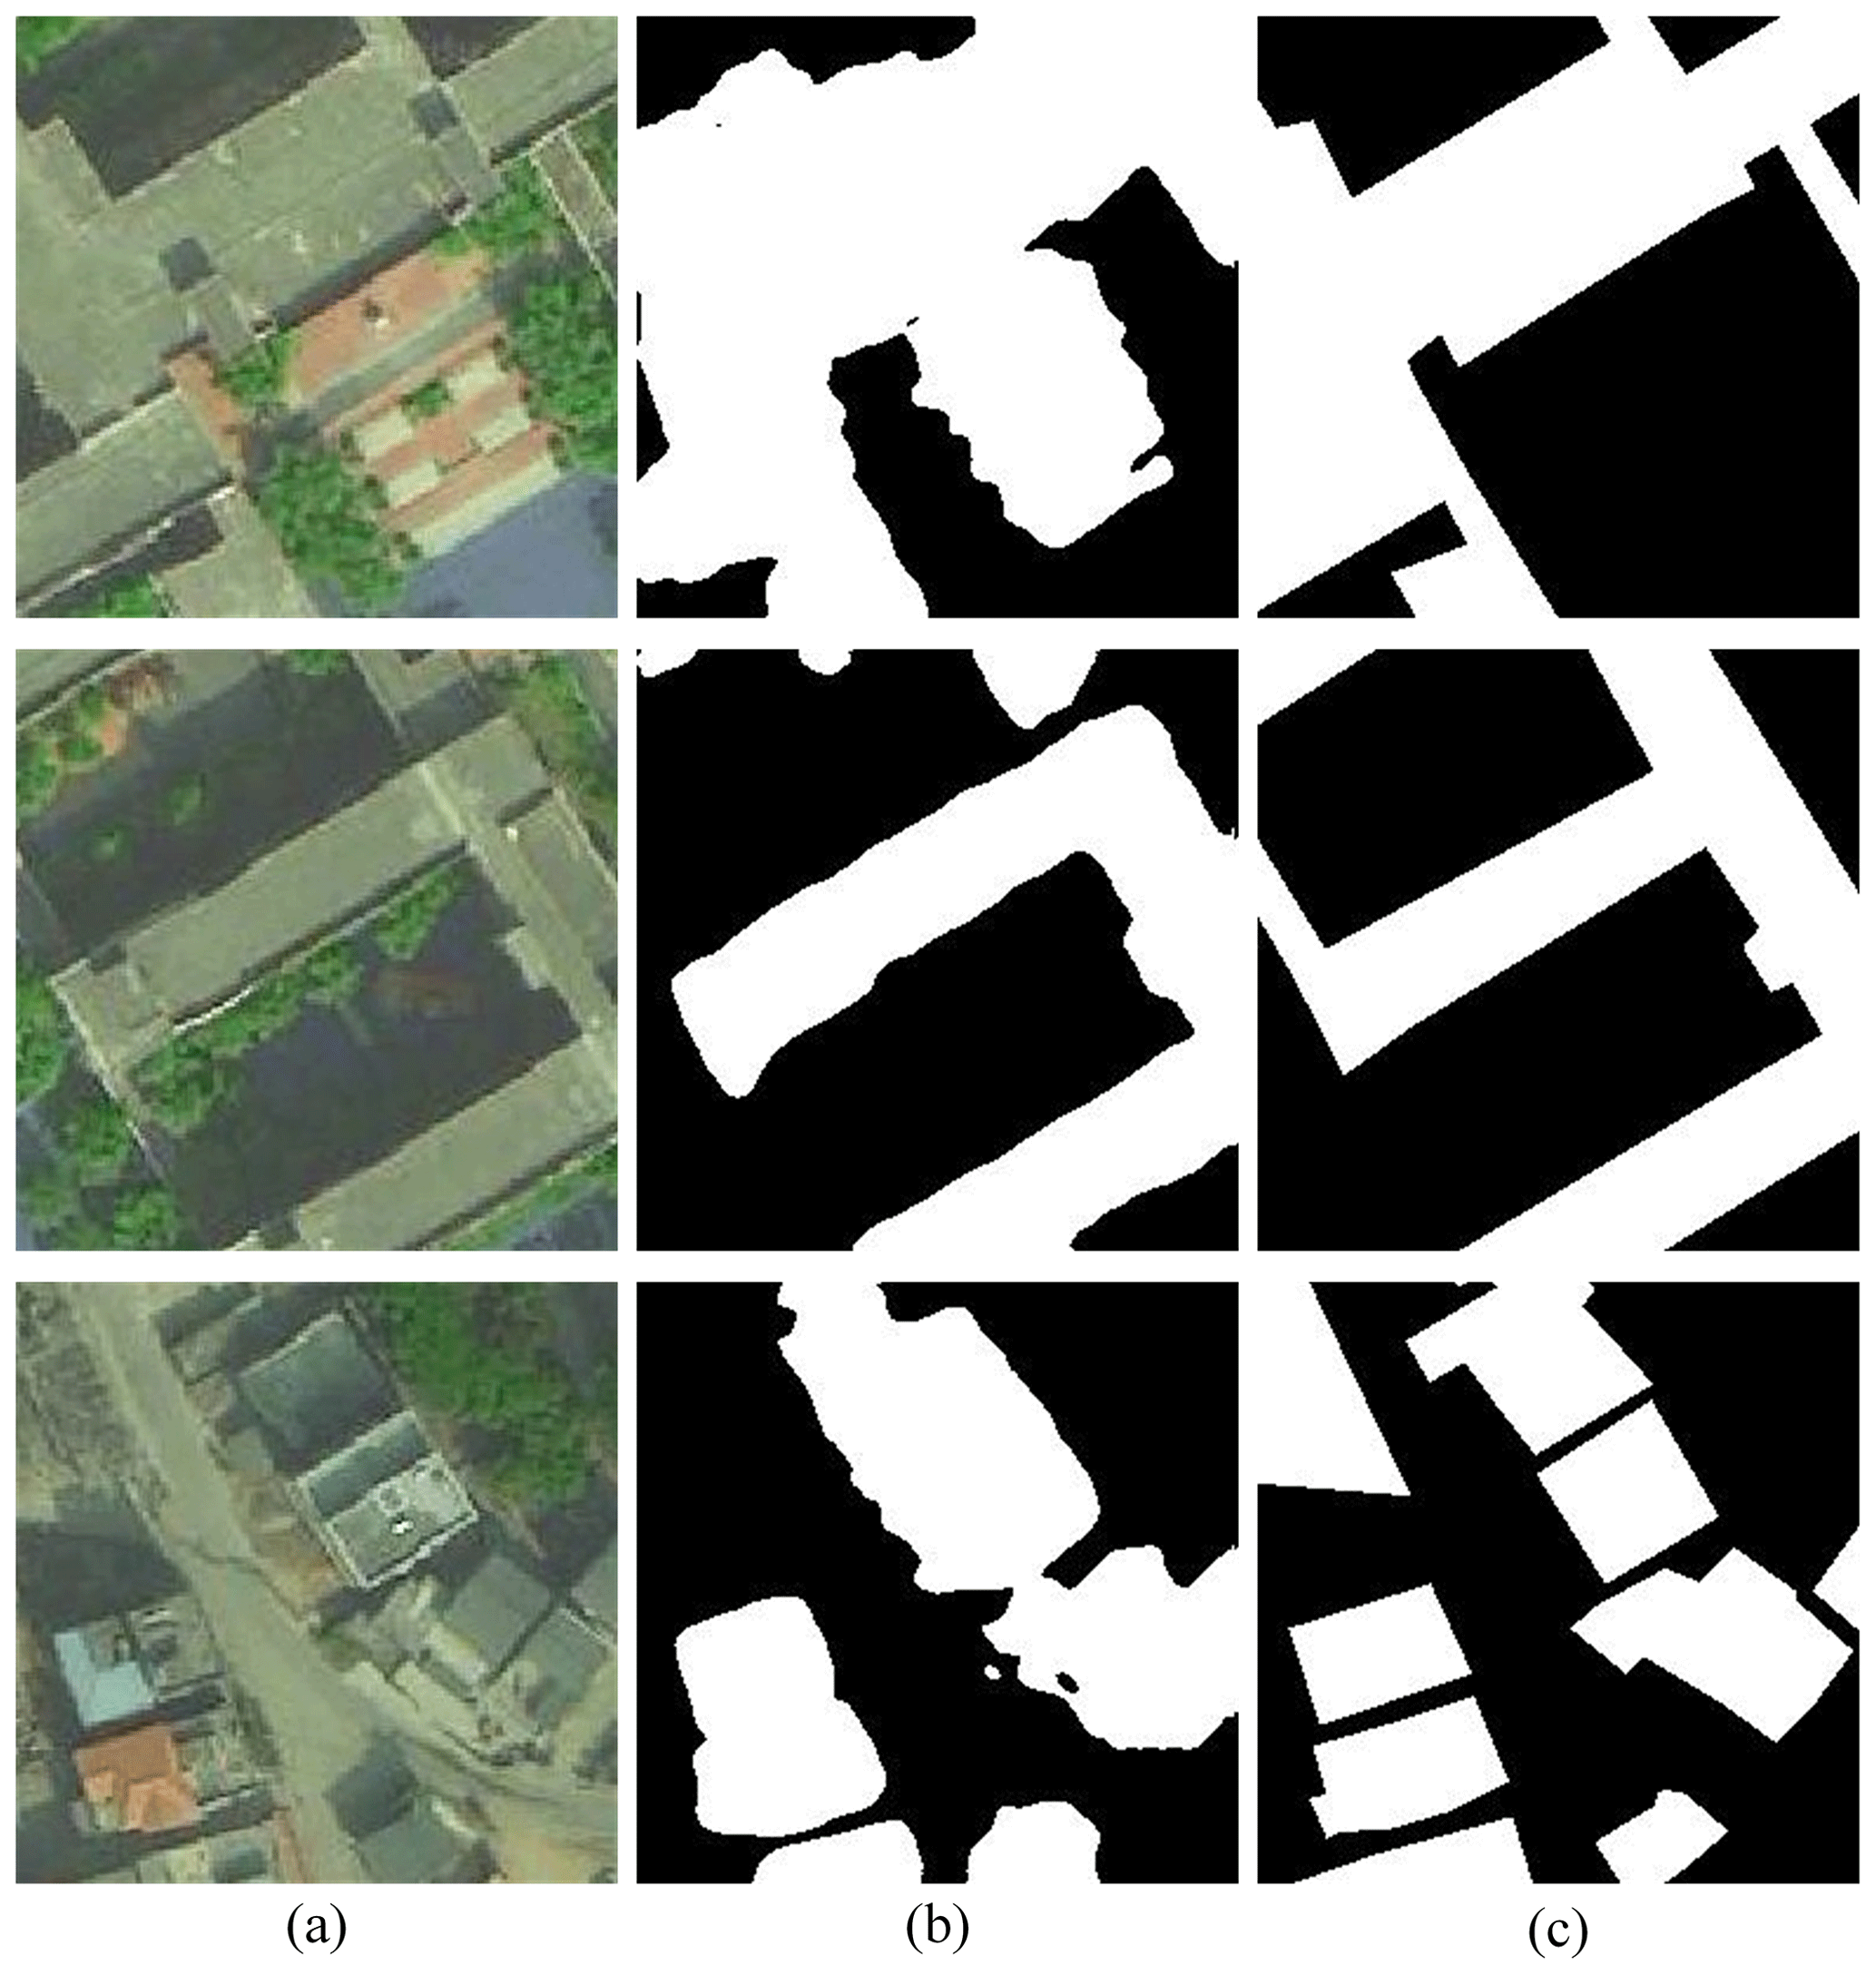
Figure 8Building footprint extraction results in the study area. (a) Remote sensing images obtained from the Jilin-1 satellite (© Chang Guang Satellite Technology Co., Ltd.). (b) Extraction result. (c) Ground truth. The building is marked in white, and the background is marked in black.
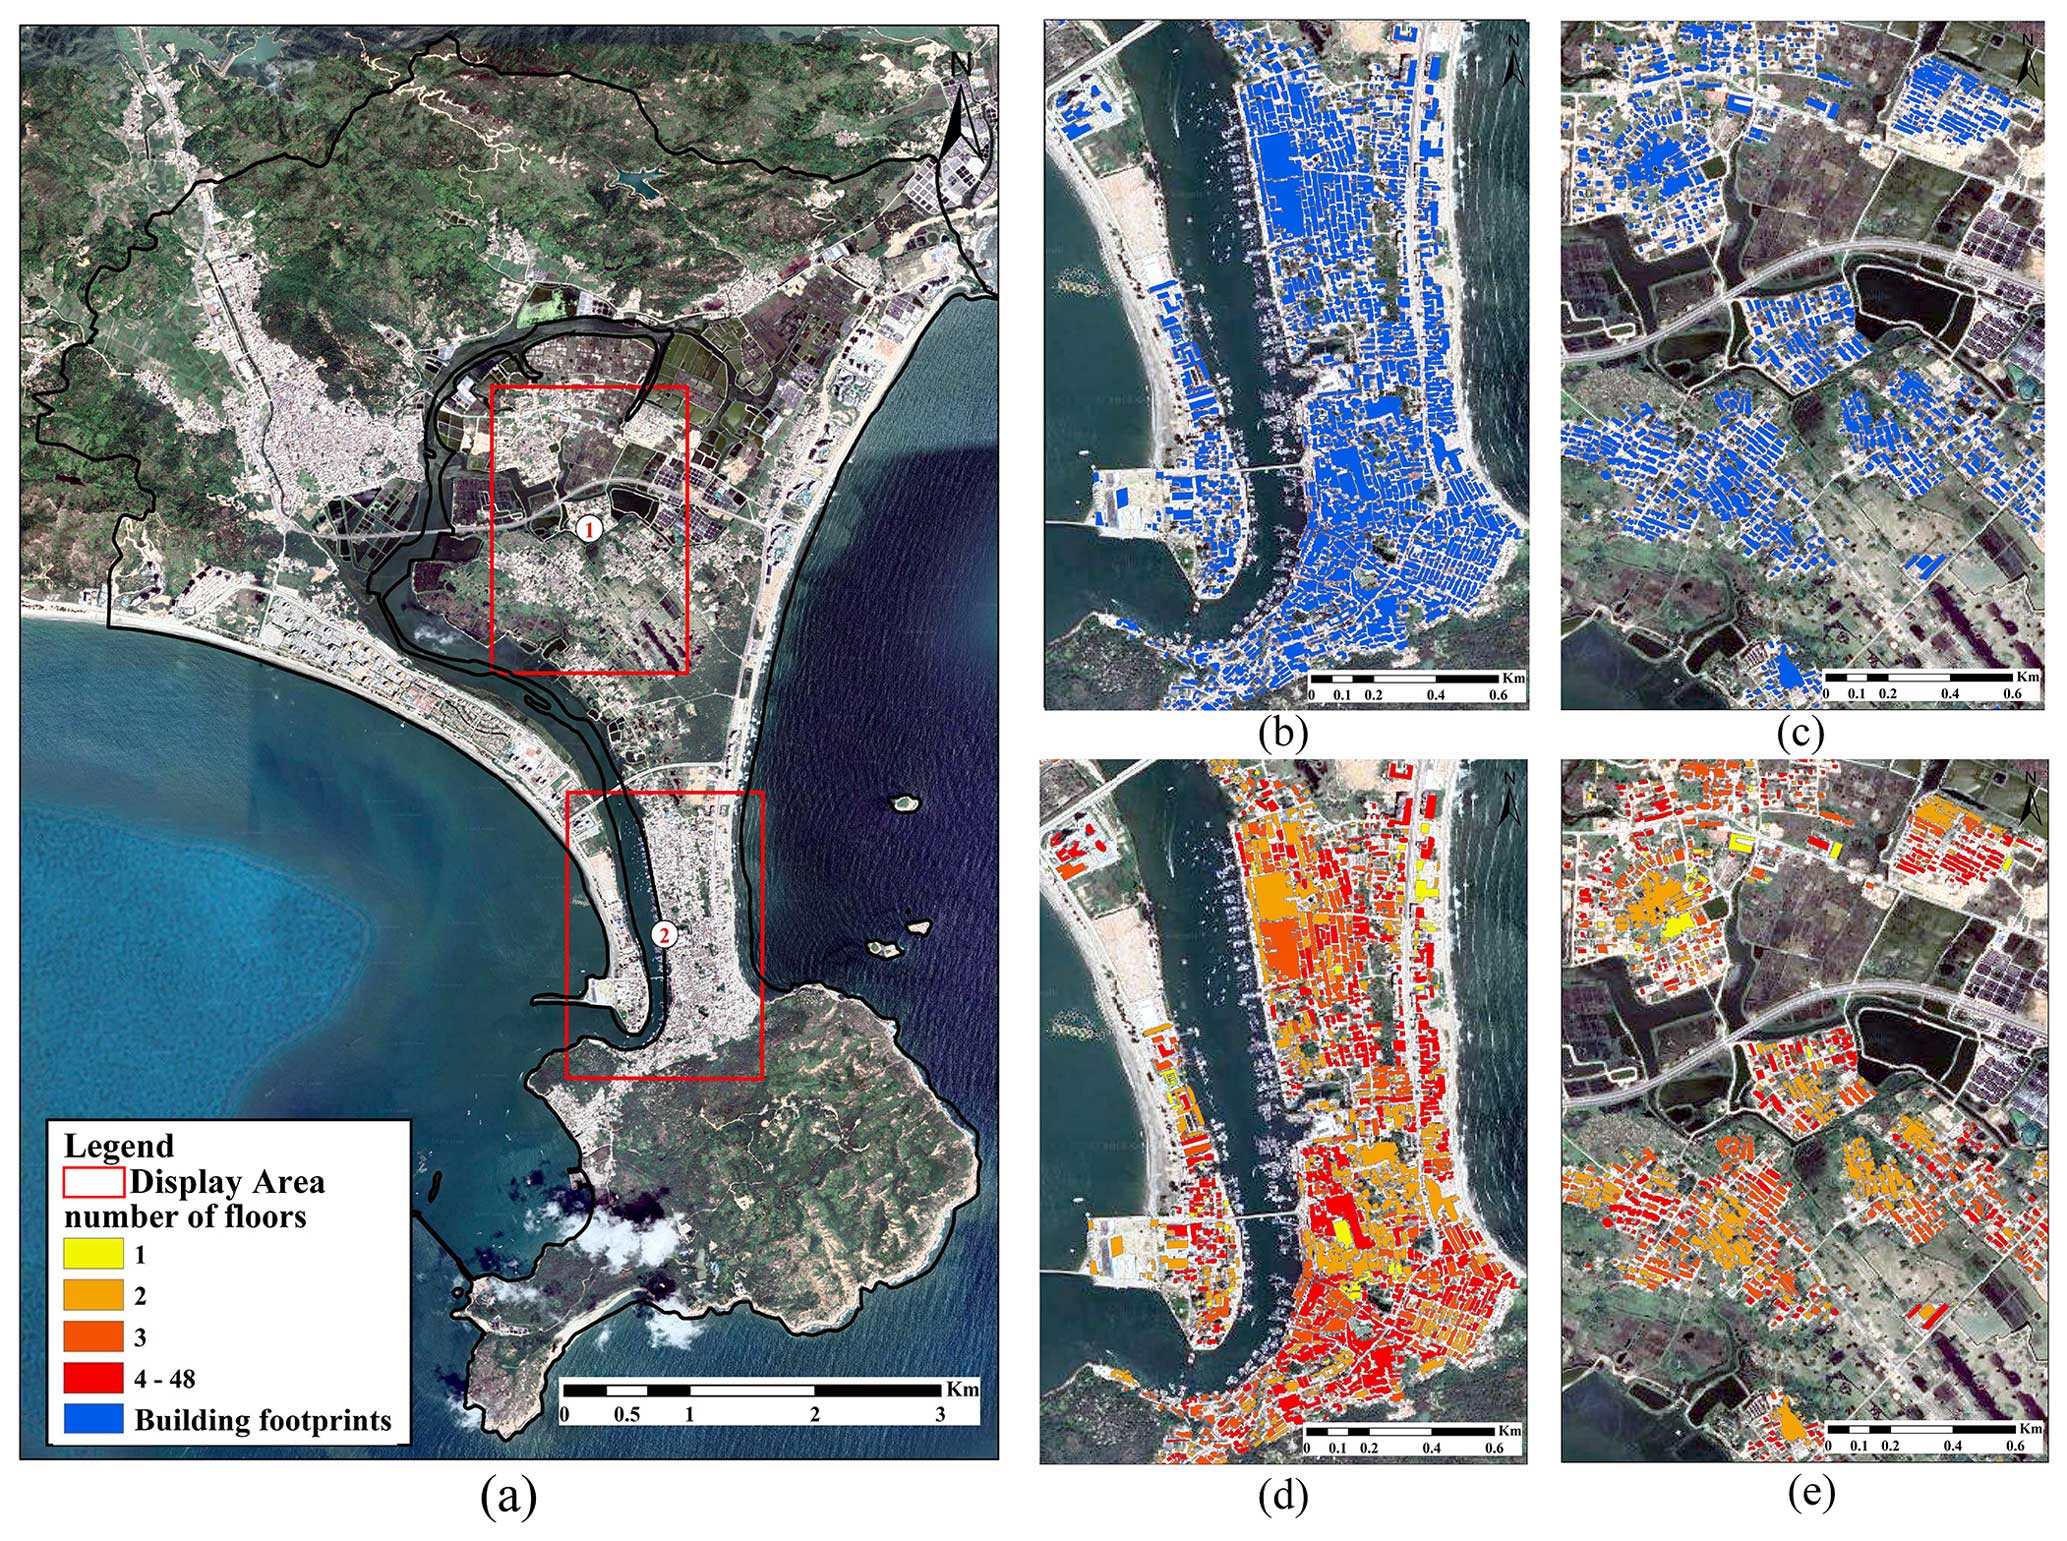
Figure 9Building character extraction results. (a) Schematic of the display area. (b, c) Building footprint result in areas 1 and 2. (d, e) Building height result in areas 1 and 2. The base map was obtained from © Google Maps (map data © 2023 Google).
4.3.3 Building height calculation
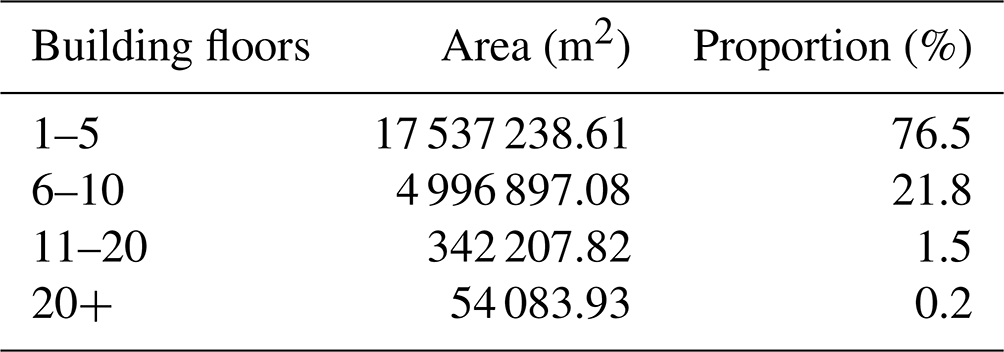
Through combining two methods mentioned above, the height information is acquired in meters. The number of floors is derived by dividing the acquired height information by the specified standard height of 3 m, according to Chinese residential design standards. The general condition of building floors is shown in Table 3. As mentioned above, the buildings in the study area are mainly for residential and commercial use. Since the study area is undeveloped, high buildings and large mansions are relatively less common, and most of them are built for seaside resorts. Instead, buildings with five floors or fewer are mainstream in the study area, with the proportion reaching 76.5 %. The building footprint extraction result and building height information extraction result can be found in Fig. 9d and e.
Table 3Statistical results of building height in the study area.
4.4 Qualitative risk assessment
A risk matrix is a risk assessment approach firstly developed by the Electronic System Center, which was originally designed to assess the risk in the life cycle of a purchase project (Garvey and Lansdowne, 1998). Additional qualitative risk assessment is conducted using the risk matrix method, incorporating improved land use data to highlight the superiority of building extraction in flood risk assessment. The concrete representation of the risk matrix is shown in Table 4.
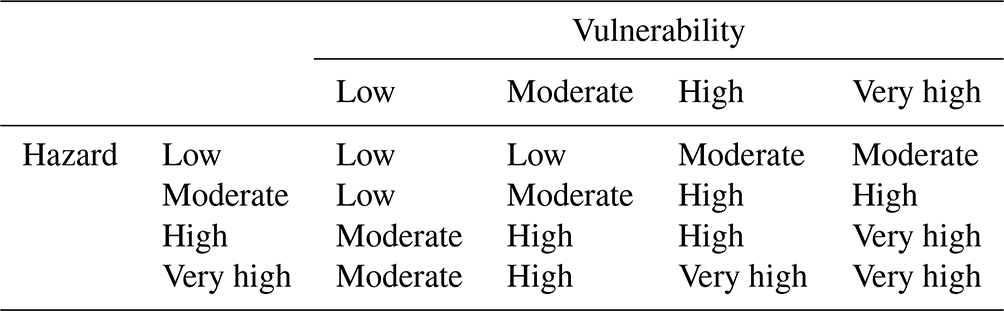
As is shown in Fig. 10a, the concentration of organics in the village of Dayuan and Shazuiwei places it at a very high vulnerability level. Within a defined 880 hPa storm surge scenario, the inundation area spreads inland, defining the majority of Dayuan as a moderate-risk area and a only fraction of Shazuiwei and north of the village of Dayuan as a very high-risk area. In the village of Yuye, part of the southern coastal area is considered to be at a moderate- or high-risk level. That is mainly because the majority of Yuye is defined as resort district except for a few areas of tidal flats, which have high vulnerability. However, after referring to the result of hazard assessment, buildings in the area are not actually inundated, meaning the area should not be at risk.
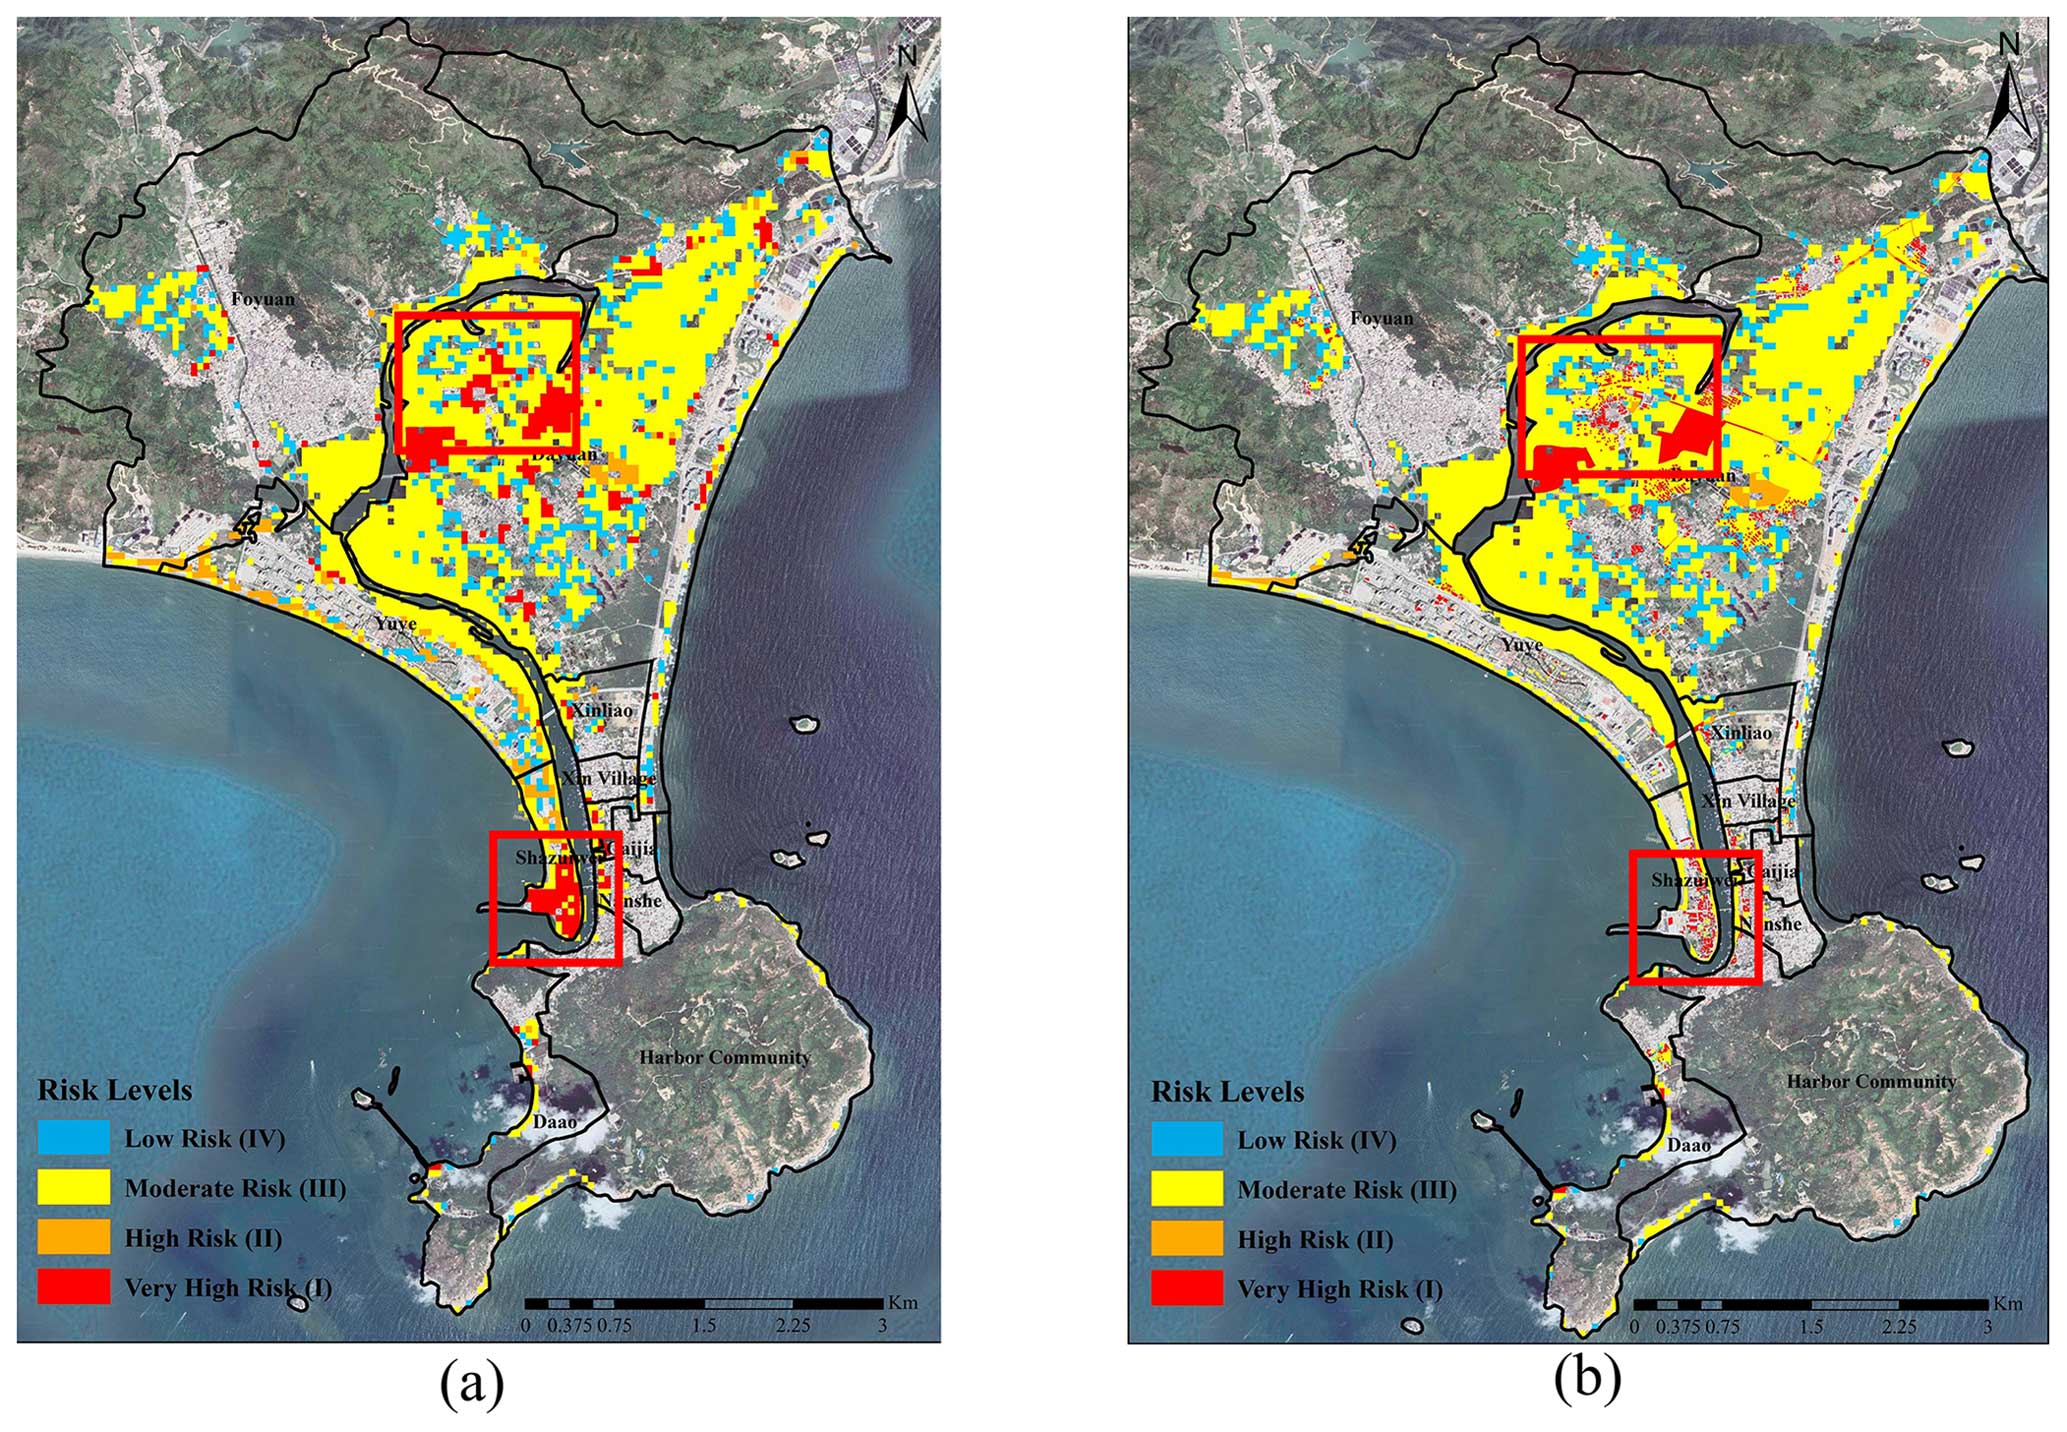
Figure 10Risk assessment maps (a) before and (b) after improvement of storm surge scenarios with a 1000-year return period. The base map was obtained from © Google Maps (map data © 2023 Google).
Comparing Fig. 10a and b, the enhanced land use data in the present research demonstrate a higher ability to recognize vulnerability elements, which is the type of buildings in the present research. The two red boxes in the figure highlight the noticeable disparity between the original and current results. The present risk assessment provides a more refined risk assessment result compared to the original result, as the previously identified large hazardous areas are replaced with more detailed and smaller zones. This refinement is conducive for government or decision-makers to conduct disaster prevention measures, propose quick guidance for personnel evacuation, and organize rescue operations in the event of a disaster.
4.5 JRC's depth–damage function adaption
Figure 11 illustrates the damage ratio given the flood depth after adjustment for residential buildings with one, two, and three or more stories. After adjustment, the functional damage of a one-story residential building is significantly enhanced, and the loss ratio reaches 1 early, which is understandable as 2 m flood depth almost submerges the entire building, resulting in a potential loss of the maximum property value. On the contrary, the loss ratio for a multi-story residential building is decreased relative to the original function, and it reaches the same level as in the original function when the water depth reaches 5 m. Furthermore, the function of a two-story residential building is quite similar to that of a building with three or more stories. This can be attributed to the flood's effect on buildings with 6 m or less of flood depth being nearly the same, on account of the flood being unable to overwhelm entire buildings.
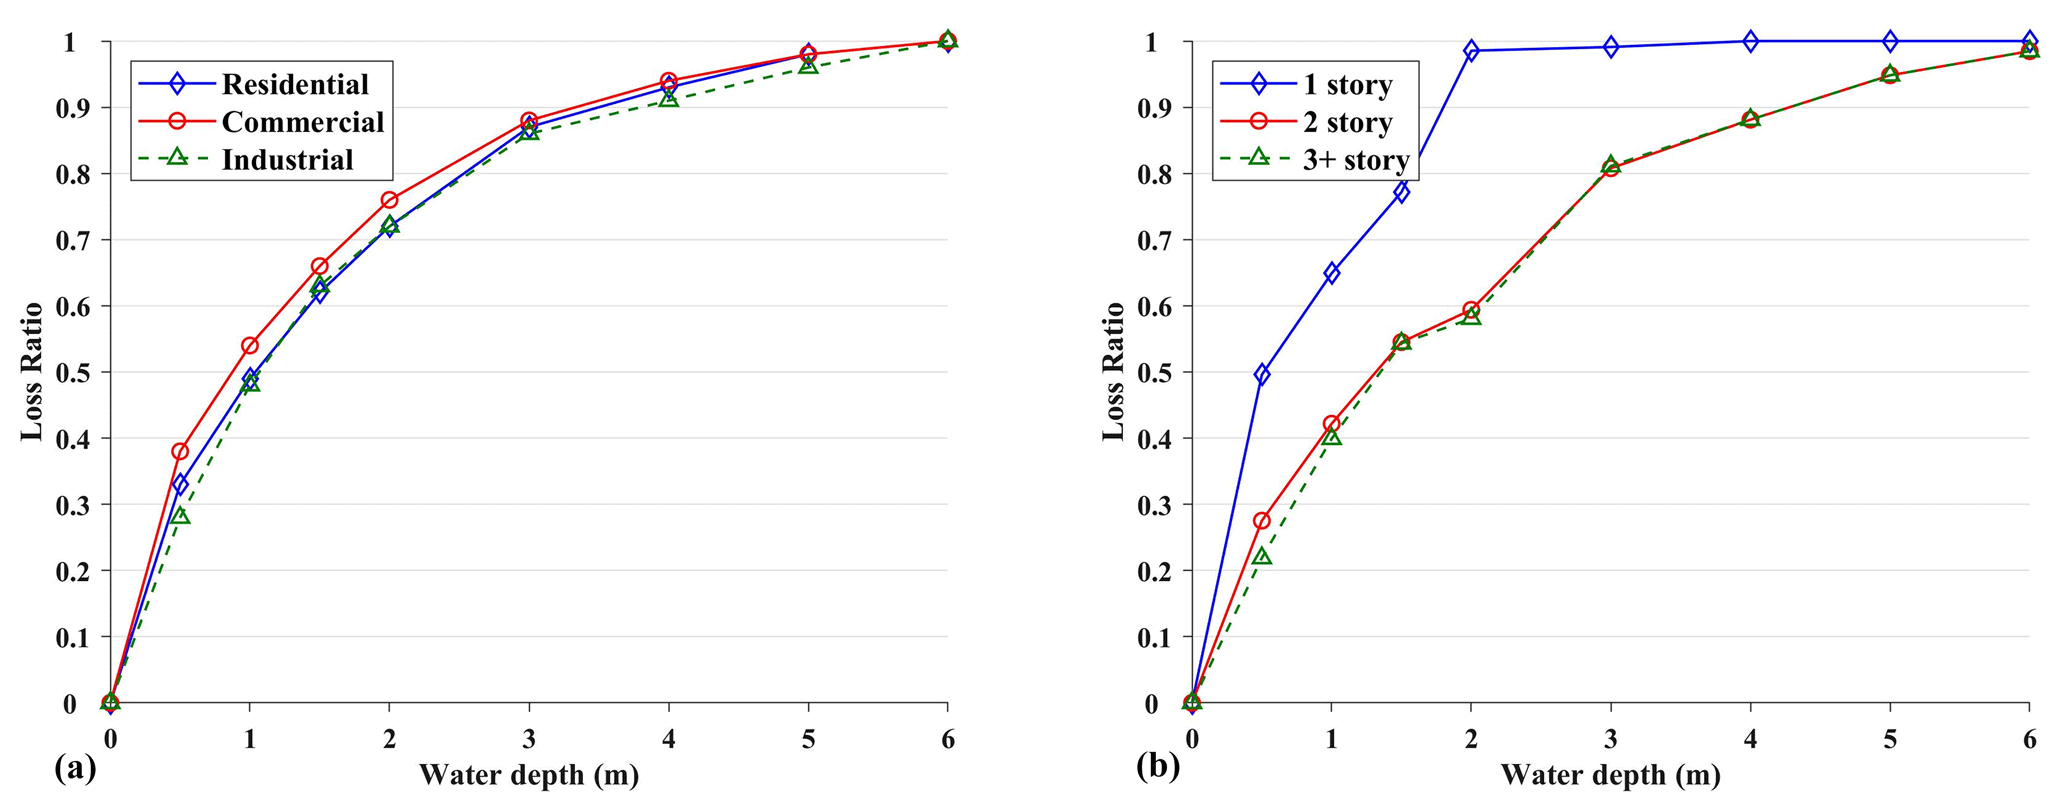
Figure 11(a) Depth–damage functions proposed by the JRC. (b) Adapted depth–damage functions for residential buildings in different floors.
The Joint Research Centre provides information on the maximum damage per square meter for each type of building. This refers to the maximum monetary damage incurred when buildings are inundated, which is the monetary damage value when the damage ratio in the depth–damage curve reaches 100 %. Although the maximum monetary damages are provided, they are computed for Beijing in 2010. However, there is a substantial difference in the level of development between Beijing and the study area. To better match the financial level in study area, adjustment can be achieved based on a scaling of the maximum monetary damage value with the GDP ratio according to Huizinga (2007). Based on Beijing's 2010 GDP of CNY 14 113 558 million and Huizhou's GDP of CNY 172 995 million, the maximum monetary damage is adjusted by equal proportions. Moreover, the price level also needs to be adjusted to the 2022 price level. According to the World Bank, the Chinese consumer price index (CPI) has changed from 100 in 2010 to 131.9 in 2022; the tendency of variation and the adjusted maximum monetary damages are shown in Fig. 12.
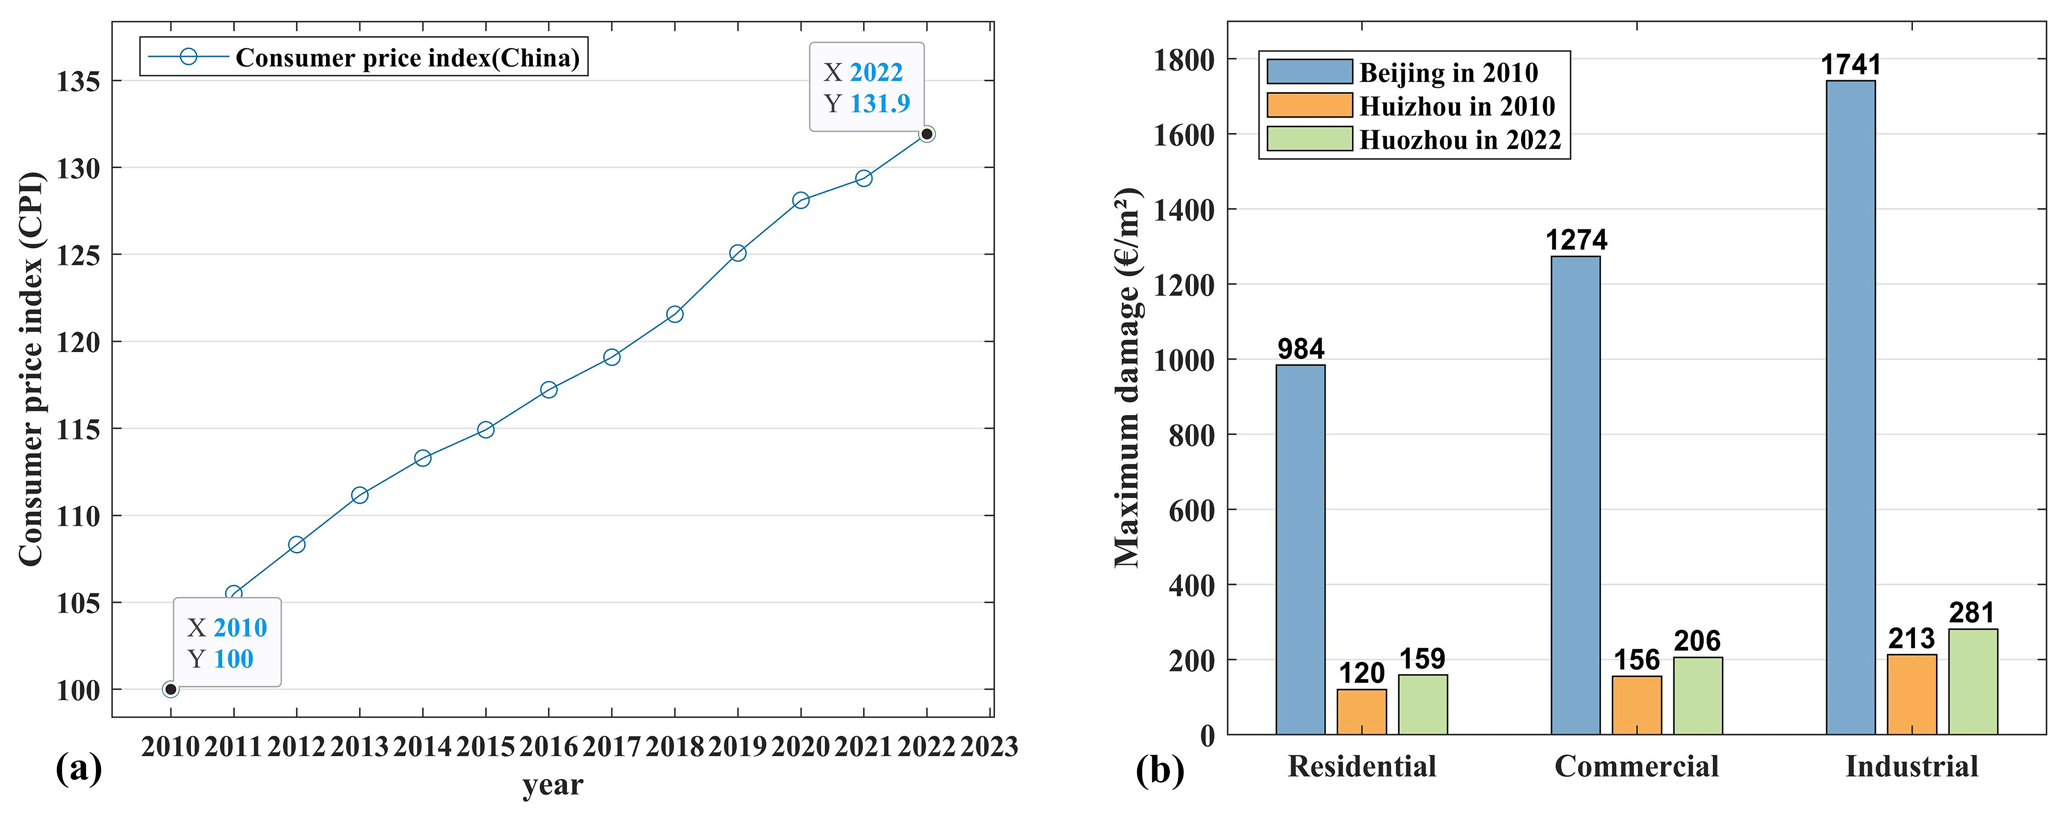
Figure 12(a) Variation trend of the consumer price index released by the World Bank. (b) Maximum monetary damage per square meter for each type of exposed element in China (in 2010 and in 2022).
4.6 Quantitative risk assessment
Loss assessments of five storm surge scenarios are computed for return periods of 10, 20, 50, 100, and 1000 years by employing the method in Sect. 3. The estimate monetary damage is summarized in Table 5.
Table 5Statistical result of the quantitative risk assessment for five defined typhoon scenarios.
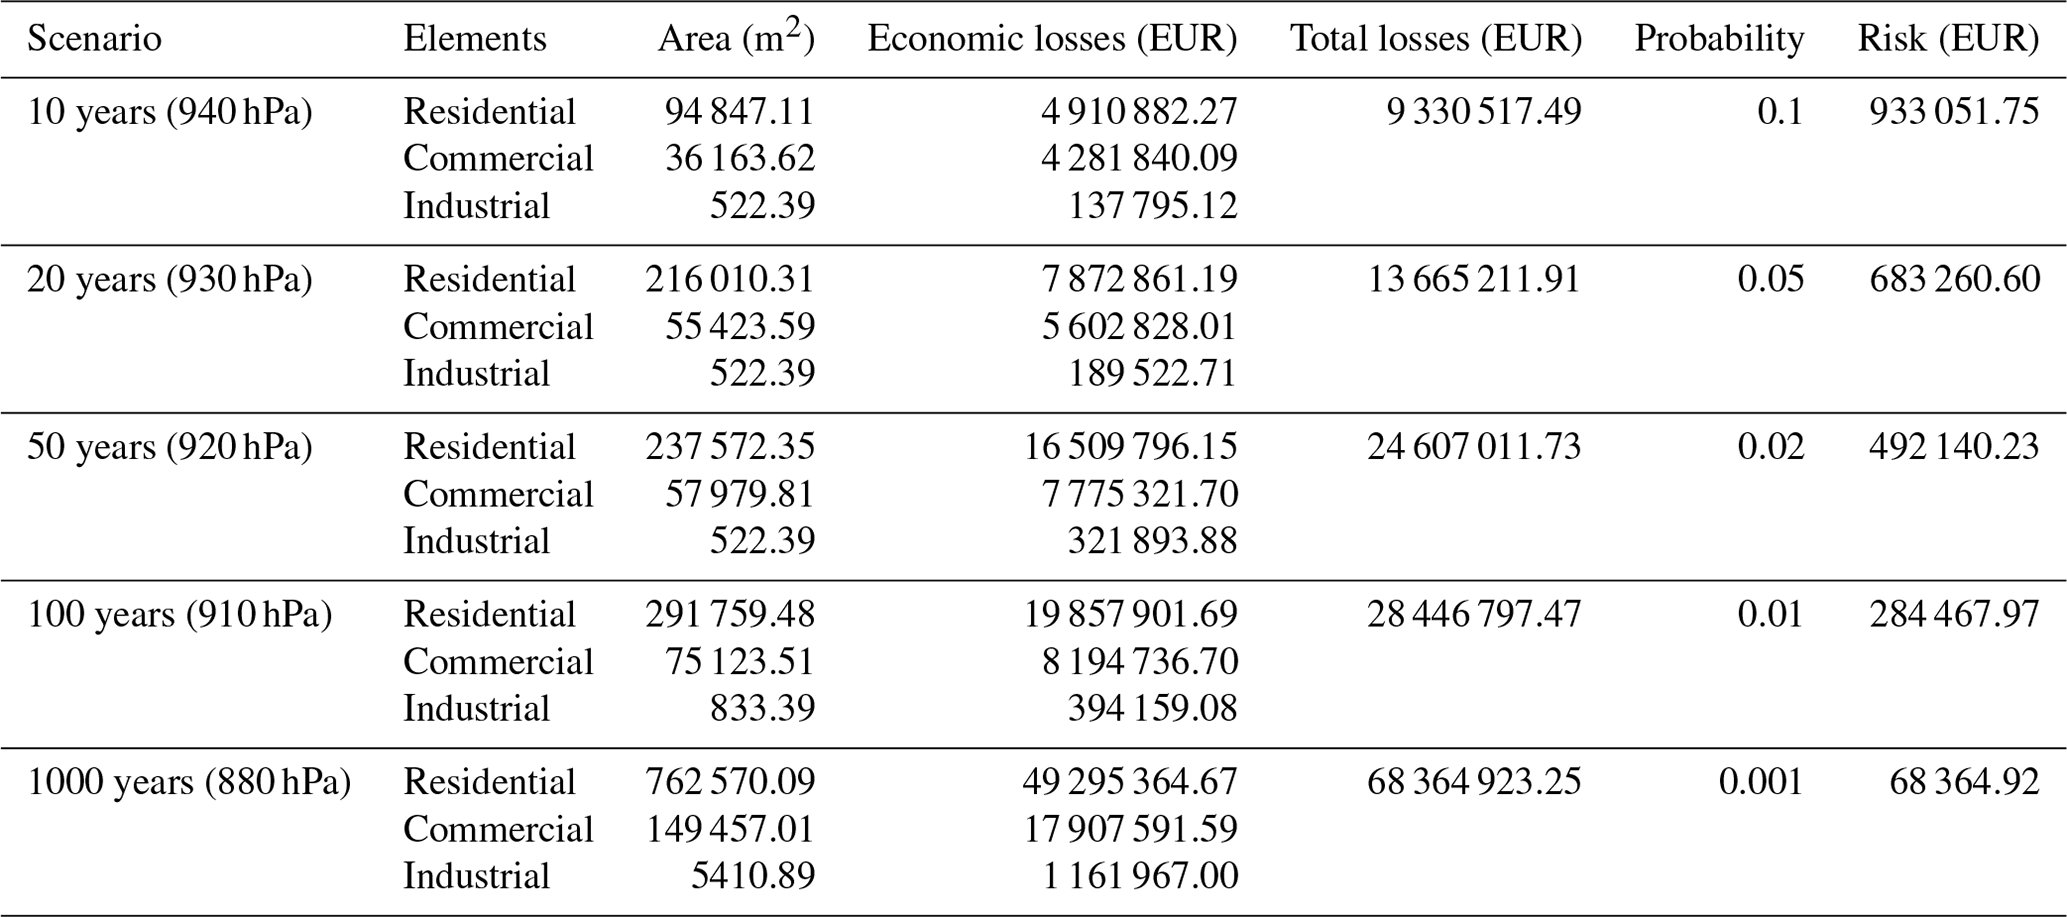
The statistical data in Table 5 demonstrate an increase in the affected area and total economic loss with an increasing return period. Compared to the total affected area of 131 533.12 m2 and the total economic losses of EUR 9 330 517.49 with the 10-year return period, the corresponding estimate result with a 1000-year return period is 917 437.99 m2 and EUR 68 364 923.25, which is both approximately 7 times higher. This indicates a proportional relationship between the extent of regional impairment and the return period of a typhoon. Although the impacted area for the 20- and 50-year return periods exhibits a relative proximity with a difference of 24 118.26 m2, there is still a significant disparity in economic losses. According to the inundation result above, that is because the inundation area of the two return periods is nearly the same except for the slight difference in the northeast of the study region, but the 50-year flood depth intensified, causing more monetary damage. In terms of inundated building types, in the case that study area is characterized as a tourism and fish-breeding area, the proportion of economic losses in industrial areas is relatively low. The loss of residential buildings and commercial buildings is comparatively close, up until storm surge reaches the severity of a 50-year return period. At this point, the losses experienced by residential buildings exceed those incurred by commercial buildings by more than double. This fact can be explained by commercial buildings being mainly constructed by the seaside for better turnover; therefore both types of waterfront buildings are impacted. However, as the severity of the typhoon worsens, more residential settlements inland are flooded, resulting in a swift increase in economic losses for residential buildings.
Based on the economic loss estimation result for five storm surge scenarios, using the method of zonal statistics on the data of administrative sub-zones in the study area, quantitative risk assessment is conducted. The economic losses and spatial distribution of storm surge risk for 10 sub-zones in five different scenarios are shown in Fig. 13. The zonal statistics result map of each sub-zone is defined at four different risk levels (very high, high, moderate, low). The classification of risk levels is obtained by categorizing all results of zonal statistics based on quantiles.
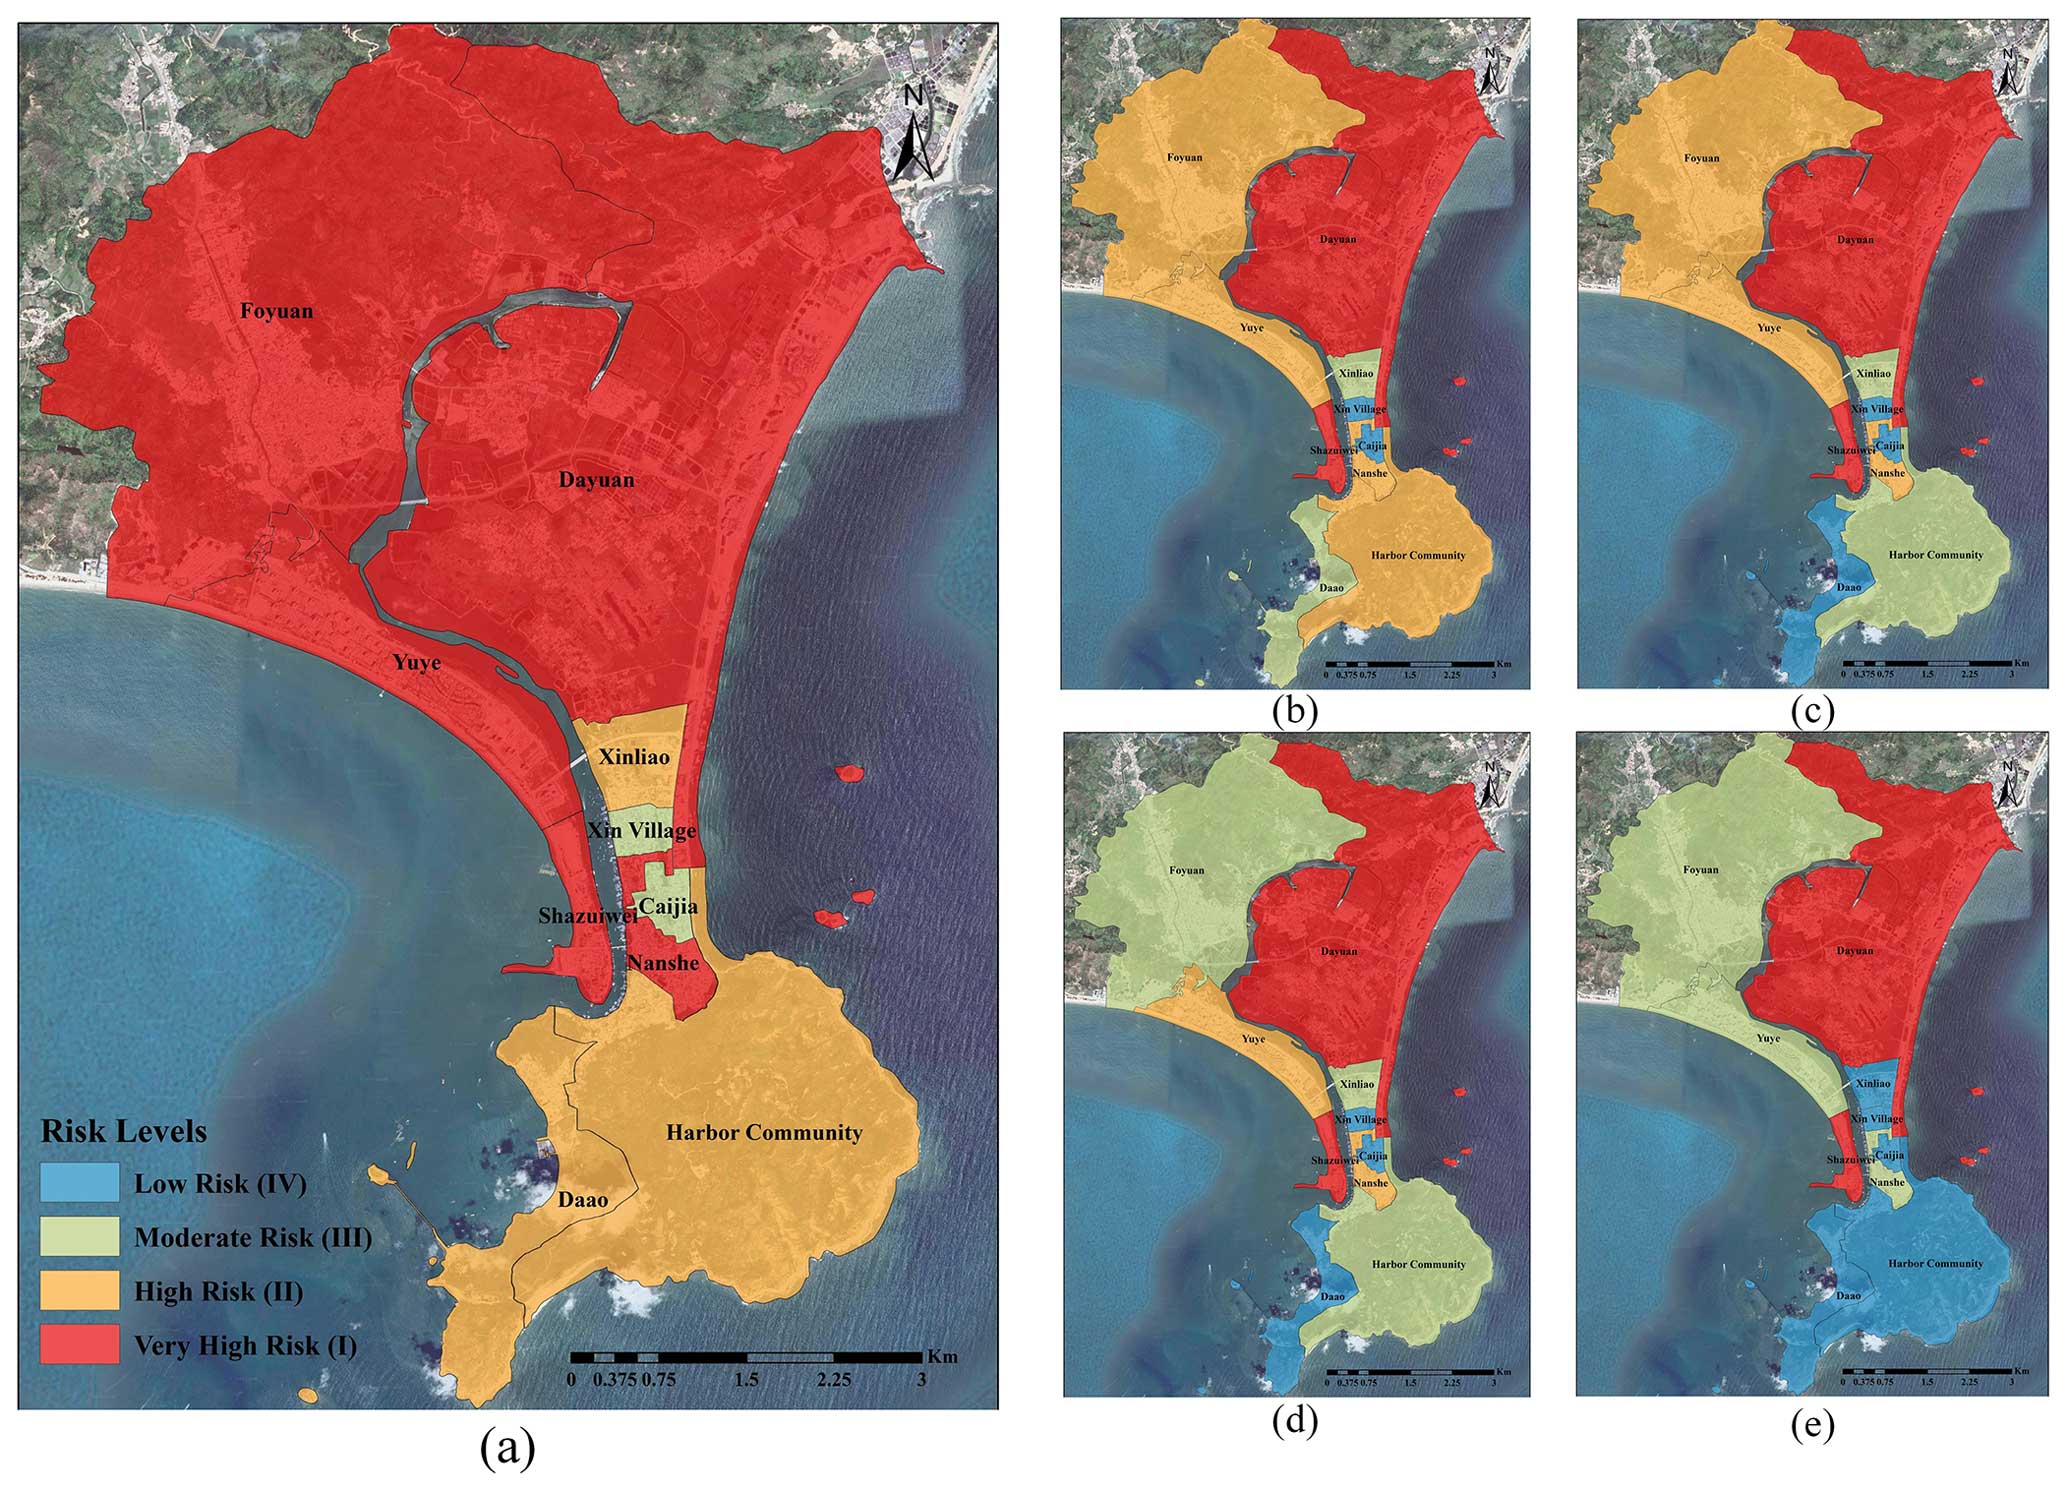
Figure 13Zoning maps of the quantitative risk assessment for five defined typhoon scenarios with return periods of (a) 1000, (b) 100, (c) 50, (d) 20, and (e) 10 years. The base map was obtained from © Google Maps (map data © 2023 Google).
As is shown in Fig. 13, the village of Dayuan is considered to be at very high risk for every defined typhoon scenario. Through analyzing the geographical characteristics of the study area, it can be found that although Dayuan is a relatively inland village, it is surrounded by the watercourse of the estuary of Double Moon Bay. Due to the existence of a flood control dam, both sides of the bay offer a measure of protective effectiveness, which results in water level rises in the inland watercourse and further causes flooding of residential buildings in the village of Dayuan, leading to massive financial losses. In contrast, the village of Foyuan is also a village with a relatively large area. The risk is at a moderate level for 10- and 20-year return periods, and the level increases to high risk for 50- and 100-year return periods, reaching very high risk for 1000-year return periods. Considering the presence of the knoll, the spread of inundation is hindered. However, as typhoons become more severe, the inundation hits the western buildings in the region, leading to the phenomenon of a progressively escalating risk level. In terms of those villages with relatively smaller sizes, due to the protection of a dam, the villages of Xinliao, Xin, and Caijia all are defined as being at a relatively low-risk level, although the region has a high density of buildings. Shazuiwei and the village of Yuye are considered to have different risk levels at different return periods; the cause of this phenomenon might be that apart from the higher density of buildings, the buildings in Shazuiwei are distributed in the coastal area, combining the impact of inundation of both sides as it is located at the outermost part of the gulf. Consequently, the risk level in Shazuiwei remains consistently high as opposed to gradually increasing like in the village of Yuye. Although they are located at the outermost part of the study area, the quantitative risk level of the village of Daao and Harbor Community gradually increases for different return periods, but it is not as serious as in the other village, which can be explained by the fact that these locations exhibit elevated topography.
Comparing the qualitative risk assessment result and the quantitative risk assessment result, the first difference to be noticed is that the two results focus on different scales. For the qualitative result, the emphasis is on delineating the regions at different risk levels, which leads to the prevention and control of priority areas, whereas for the quantitative result, the scale of the result is limited to the village level zoning, as the estimated monetary loss amounts are summarized at the village level. Furthermore, while the qualitative results suggest that certain regions may not be at a moderate- or high-risk level, the quantitative result reveals that the estimated monetary loss for those villages is not insignificant. In conclusion, the qualitative risk assessment provides new results from a completely different perspective than the qualitative risk assessment. The results can provide intuitive information about the potential monetary loss to secondary government departments, thus helping to provide constructive suggestions in terms of risk prevention and control.
The quantitative risk assessment and zonal risk maps can assist the government or decision-makers in recognizing the specific economic losses of each sub-zone, so it is helpful to identify the areas that are more susceptible to experiencing significant losses, which allows them to develop disaster prevention measures, for example, constructing disaster prevention facilities, allocating a budget for disaster prevention, and planning evacuation strategies. Moreover, establishing the quantitative risk for different typhoon periods can enhance decision-makers' understanding of the potential vulnerability in each sub-zone and facilitates the implementation of appropriate preventive and disaster relief measures at different typhoon intensities.
In recent years, academic research on storm surge risk assessment has greatly increased due to climate change and financial growth in coastal areas. However, quantitative risk assessment is unable to be performed in undeveloped areas on account of the lack of building character and damage assessment data. Targeting the question above, the purpose of this paper is to propose a method for conducting refined storm surge risk assessment quantitatively based on deep learning and GIS techniques. Firstly, the reliable coupled FVCOM–SWAN model is utilized to simulate five defined storm surge scenarios. Facing the challenge of a lack of data, the TransUNet deep learning method is applied to extract the building footprint data for refined extraction of exposed elements; building height data are acquired through UAV measurements. To compensate for that the available depth–damage functions not taking building height into account, the functions are adjusted for buildings with different numbers of floors and consequently to perform more refined monetary loss calculations in five defined scenarios. Eventually, the quantitative risk assessment and zoning maps of the study area are generated based on GIS techniques.
The quantitative risk assessment result of the study region shows that on account of the existence of the estuary and the gathering of buildings, the village of Dayuan is at a high-risk level in all defined typhoon scenarios, and the economic loss risk is large. The flood control dam provides protection to the villages of Xinliao, Xin, and Caijia, which prevents the region suffering large economic loss as the typhoon return period is 10 and 20 years. However, storm surges in the typhoon scenarios which have a return period of greater than 50 years can overwhelm the existing dikes, and both the commercial buildings and residential buildings would suffer heavy economic losses. Therefore, it is necessary to perform land use planning and adjustment especially in Dayuan and Shazuiwei as they are at a very high-risk level to prevent the impact and losses caused by storm surges. Moreover, regions being nearest to the sea does not mean they suffer greater potential economic loss, as the risk level of the village of Daao and Harbor Community are considered to be relatively low level because of the topographical characteristics and the distribution of buildings.
In the context of global warming and increased climate extremes, the occurrence of large-scale typhoons has become more frequent, such as Typhoon Rammasun and Typhoon Meranti (corresponding to a 100-year return period). Therefore, the modified typhoon parameters are utilized for the simulation of five typhoon scenarios in order to demonstrate different storm surge disaster situations in the future. On the basis of the above, the study provides a framework for refined quantitative storm surge risk assessment targeting the problem of acquiring exposure elements and the establishing of multi-variable empirical depth–damage functions as a consequence of missing data in underdeveloped regions. The generated results can help decision-makers to identify the areas that are susceptible to experiencing significant losses efficiently and help the respective authorities with disaster prevention, future land use planning, and material deployment. Furthermore, it is important to remark that the methodology of this paper has general applicability, since the applied models are publicly available. Thus, there is also potential for further application. For example, the framework can be applied in other coastal areas in China, as they have similar characteristics, which also means there is a possibility for utilization in larger scales. Furthermore, the framework can also be utilized for other types of disasters, such as floods, earthquakes, and mudslides. Consequently, the proposed methodology demonstrates an extensive relevance to the scientific community.
There is still room for improvement in this study. The current study relied on manual labeling in terms of distinguishing between functional areas to conduct risk assessment. In future studies, efforts will be made to distinguish the types of exposure elements in a more objective way, based on diverse data sources such as social media points of interest (POIs). Additionally, exploring the activity patterns of the population through multiple sources of data including taxi trajectories and smart cards can contribute to the consideration of population risks in different storm surge scenarios, thereby prompting more comprehensive risk assessments.
Remote sensing images were obtained from the Chang Guang Jilin-1 satellite. The wind field dataset was generated by ERA5 and the Holland (1980) method. The administrative-boundary data were obtained from the national Geographic Information Public Service Platform. The datasets can be obtained from https://doi.org/10.6084/m9.figshare.24586605 (Yu, 2023). DEM data and UAV data were obtained from the Department of Natural Resources of Huizhou Bureau; these datasets are not publicly available due to the policy of the Department of Natural Resources of Huizhou Bureau.
LY: investigation, methodology, data curation, visualization, formal analysis, writing (original draft). SH: investigation, data source, data curation, visualization, formal analysis. HQ: conceptualization, methodology, validation, supervision, writing (original draft), project administration, funding acquisition. WW: validation, data curation, visualization. HJ: remote sensing data processing, article revision, data curation. LM: conceptualization, supervision, project administration, funding acquisition.
The contact author has declared that none of the authors has any competing interests.
Publisher's note: Copernicus Publications remains neutral with regard to jurisdictional claims made in the text, published maps, institutional affiliations, or any other geographical representation in this paper. While Copernicus Publications makes every effort to include appropriate place names, the final responsibility lies with the authors.
Thanks go to the Department of Natural Resources of Huizhou Bureau for collecting and processing the UAV data and for providing official government data on land use and land cover, which became the data foundation for this study.
This work was supported by the Shenzhen Science and Technology Program (grant no. KCXFZ20211020164015024), National Natural Science Foundation of China (grant no. 52101332), and Guangdong Basic and Applied Basic Research Foundation (grant nos. 2024A1515011805, 2023A1515240047, 2024A1515012032).
This paper was edited by Philip Ward and reviewed by two anonymous referees.
Adnan, M. S. G., Abdullah, A. Y. M., Dewan, A., and Hall, J. W.: The effects of changing land use and flood hazard on poverty in coastal Bangladesh, Land Use Policy, 99, 104868, https://doi.org/10.1016/j.landusepol.2020.104868, 2020.
Armenakis, C. and Nirupama, N.: Estimating spatial disaster risk in urban environments, Geomat. Nat. Haz. Risk, 4, 289–298, 2013.
Booij, N., Holthuijsen, L. H., and Ris, R. C.: The “SWAN” wave model for shallow water, American Society of Civil Engineers, 668–676, https://doi.org/10.1061/9780784402429.053,1996.
Chen, C., Liu, H., and Beardsley, R. C.: An unstructured grid, finite-volume, three-dimensional, primitive equations ocean model: application to coastal ocean and estuaries, J. Atmos. Ocean. Tech., 20, 159–186, 2003.
Chen, D. and Gao, G. X.: Probabilistic graphical fusion of LiDAR, GPS, and 3D building maps for urban UAV navigation, Navigation, 66, 151–168, 2019.
Chen, J., Lu, Y., Yu, Q., Luo, X., Adeli, E., Wang, Y., Lu, L., Yuille, A. L., and Zhou, Y.: Transunet: Transformers make strong encoders for medical image segmentation, arXiv [preprint], https://doi.org/10.48550/arXiv.2102.04306, 2021.
China Marine Disaster Bulletin: Historical Marine disasters in China, http://www.mnr.gov.cn/sj/sjfw/hy/gbgg/zghyzhgb/ (last access: 12 November 2023), 2023.
Comber, A., Umezaki, M., Zhou, R., Ding, Y., Li, Y., Fu, H., Jiang, H., and Tewkesbury, A.: Using shadows in high-resolution imagery to determine building height, Remote Sens. Lett., 3, 551–556, https://doi.org/10.1080/01431161.2011.635161, 2011.
Dabbeek, J., Silva, V., Galasso, C., and Smith, A.: Probabilistic earthquake and flood loss assessment in the Middle East, Int. J. Disast. Risk Re., 49, 101662, https://doi.org/10.1016/j.ijdrr.2020.101662, 2020.
de Moel, H. and Aerts, J. C. J. H.: Effect of uncertainty in land use, damage models and inundation depth on flood damage estimates, Nat. Hazards, 58, 407–425, 2011.
Dixit, M., Chaurasia, K., and Kumar Mishra, V.: Dilated-ResUnet: A novel deep learning architecture for building extraction from medium resolution multi-spectral satellite imagery, Expert Syst. Appl., 184, 115530, https://doi.org/10.1016/j.eswa.2021.115530, 2021.
Fang, J., Wahl, T., Fang, J., Sun, X., Kong, F., and Liu, M.: Compound flood potential from storm surge and heavy precipitation in coastal China: dependence, drivers, and impacts, Hydrol. Earth Syst. Sci., 25, 4403–4416, https://doi.org/10.5194/hess-25-4403-2021, 2021.
Frantz, D., Schug, F., Okujeni, A., Navacchi, C., Wagner, W., van der Linden, S., and Hostert, P.: National-scale mapping of building height using Sentinel-1 and Sentinel-2 time series, Remote Sens. Environ., 252, 112128, https://doi.org/10.1016/j.rse.2020.112128, 2021.
Gacu, J. G., Monjardin, C. E. F., de Jesus, K. L. M., and Senoro, D. B.: GIS-Based Risk Assessment of Structure Attributes in Flood Zones of Odiongan, Romblon, Philippines, Buildings, 13, 506, https://doi.org/10.3390/buildings13020506, 2023.
Garvey, P. R. and Lansdowne, Z. F.: Risk matrix: an approach for identifying, assessing, and ranking program risks, Air Force Journal of Logistics, 22, 18–21, 1998.
Glahn, B., Taylor, A., Kurkowski, N., and Shaffer, W. A.: The role of the SLOSH model in National Weather Service storm surge forecasting, Natl. Weather Digest, 33, 3–14, 2009.
Grahn, T. and Nyberg, R.: Damage assessment of lake floods: Insured damage to private property during two lake floods in Sweden 2000/2001, Int. J. Disast. Risk Re., 10, 305–314, 2014.
Granger, K.: Quantifying storm tide risk in Cairns, Nat. Hazards, 30, 165–185, 2003.
Hasanzadeh Nafari, R., Ngo, T., and Lehman, W.: Calibration and validation of FLFArs – a new flood loss function for Australian residential structures, Nat. Hazard. Earth Sys., 16, 15–27, https://doi.org/10.5194/nhess-16-15-2016, 2016.
Hess, T. M. and Morris, J.: Estimating the value of flood alleviation on agricultural grassland, Agr. Water Manage., 15, 141–153, 1988.
Holland, G. J.: An analytic model of the wind and pressure profiles in hurricanes, Mon. Weather Rev., 108, 1212–1218, https://doi.org/10.1175/1520-0493(1980)108<1212:AAMOTW>2.0.CO;2, 1980.
Hu, K., Meselhe, E., Rhode, R., Snider, N., and Renfro, A.: The Impact of Levee Openings on Storm Surge: A Numerical Analysis in Coastal Louisiana, Appl. Sci.-Basel, 12, 10884, https://doi.org/10.3390/app122110884, 2022.
Huang, H., Chen, P., Xu, X., Liu, C., Wang, J., Liu, C., Clinton, N., and Gong, P.: Estimating building height in China from ALOS AW3D30, ISPRS J. Photogramm., 185, 146–157, https://doi.org/10.1016/j.isprsjprs.2022.01.022, 2022.
Huizinga, H. J.: Flood damage functions for EU member states, Technical Report, HKV Consultants, implemented in the framework of the contract #382441-F1SC awarded by the European Commission, Joint Research Centre, 2007.
Huizinga, J., De Moel, H., and Szewczyk, W.: Global flood depth-damage functions: Methodology and the database with guidelines, Publications Office of the European Union, https://doi.org/10.2760/16510, 2017.
Ji, S., Wei, S., and Lu, M.: Fully convolutional networks for multisource building extraction from an open aerial and satellite imagery data set, IEEE T. Geosci. Remote, 57, 574–586, 2018.
Ji, T., Li, G., Liu, Y., Liu, R., and Zhu, Y.: Spatiotemporal Features of Storm Surge Activity and Its Response to Climate Change in the Southeastern Coastal Area of China in the Past 60 years, J. Geophys. Res.-Atmos., 126, e2020JD033234, https://doi.org/10.1029/2020JD033234, 2020.
Kang, C. L., Cheng, Y., Wang, F., Zong, M. M., Luo, J., and Lei, J. Y.: The Application of UAV Oblique Photogrammetry in Smart Tourism: A Case Study of Longji Terraced Scenic Spot in Guangxi Province, Int. Arch. Photogramm., XLII-3/W10, 575–580, 2020.
Kreibich, H., Seifert, I., Merz, B., and Thieken, A. H.: Development of FLEMOcs – a new model for the estimation of flood losses in the commercial sector, Hydrolog. Sci. J., 55, 1302–1314, 2010.
Kron, W.: Flood risk = hazard ⋅ values ⋅ vulnerability, Water Int., 30, 58–68, 2005.
Lee, J.: The economic aftermath of Hurricanes Harvey and Irma: The role of federal aid, Int. J. Disast. Risk Re., 61, 102301, https://doi.org/10.1016/j.ijdrr.2021.102301, 2021.
Li, X., Zhou, Y., Gong, P., Seto, K. C., and Clinton, N.: Developing a method to estimate building height from Sentinel-1 data, Remote Sens. Environ., 240, 111705, https://doi.org/10.1016/j.rse.2020.111705, 2020.
Liu, W.-C. and Huang, W.-C.: Investigating typhoon-induced storm surge and waves in the coast of Taiwan using an integrally-coupled tide-surge-wave model, Ocean Eng., 212, 107571, https://doi.org/10.1016/j.oceaneng.2020.107571, 2020.
Liu, Y., Li, Z., Wei, B., Li, X., and Fu, B.: Seismic vulnerability assessment at urban scale using data mining and GIScience technology: application to Urumqi (China), Geomat. Nat. Haz. Risk, 10, 958–985, 2019.
Liu, Y., So, E., Li, Z., Su, G., Gross, L., Li, X., Qi, W., Yang, F., Fu, B., and Yalikun, A.: Scenario-based seismic vulnerability and hazard analyses to help direct disaster risk reduction in rural Weinan, China, Int. J. Disast. Risk Re., 48, 101577, https://doi.org/10.1016/j.ijdrr.2020.101577, 2020.
Lyddon, C. E., Brown, J. M., Leonardi, N., Saulter, A., and Plater, A. J.: Quantification of the Uncertainty in Coastal Storm Hazard Predictions Due to Wave-Current Interaction and Wind Forcing, Geophys. Res. Lett., 46, 14576–14585, 2019.
Malekinezhad, H., Sepehri, M., Pham, Q. B., Hosseini, S. Z., Meshram, S. G., Vojtek, M., and Vojteková, J.: Application of entropy weighting method for urban flood hazard mapping, Acta Geophys., 69, 841–854, 2021.
Marvi, M. T.: A review of flood damage analysis for a building structure and contents, Nat. Hazards, 102, 967–995, https://doi.org/10.1007/s11069-020-03941-w, 2020.
Masson, D.: A case study of wave–current interaction in a strong tidal current, J. Phys. Oceanogr., 26, 359–372, 1996.
McGranahan, G., Balk, D., and Anderson, B.: The rising tide: assessing the risks of climate change and human settlements in low elevation coastal zones, Environ. Urban., 19, 17–37, 2007.
McPherson, M.: Responding to Typhoon Haiyan in the Philippines, Western Pacific Surveillance and Response Journal, 6, 1–4, 2015.
Merz, B., Thieken, A. H., and Gocht, M.: Flood risk mapping at the local scale: concepts and challenges, in: Flood risk management in Europe: innovation in policy and practice, Springer, Dordrecht, 231–251, https://doi.org/10.1007/978-1-4020-4200-3_13, 2007.
Merz, B., Kreibich, H., and Lall, U.: Multi-variate flood damage assessment: a tree-based data-mining approach, Nat. Hazard. Earth Sys., 13, 53–64, https://doi.org/10.5194/nhess-13-53-2013, 2013.
Mharzi Alaoui, H., Radoine, H., Chenal, J., Hajji, H., and Yakubu, H.: Deep building footprint extraction for urban risk assessment–Remote sensing and Deep learning based approach, Int. Arch. Photogramm., 48, 83–86, 2022.
Nastev, M. and Todorov, N.: Hazus: A standardized methodology for flood risk assessment in Canada, Can. Water Resour. J., 38, 223–231, 2013.
Paprotny, D., Kreibich, H., Morales-Nápoles, O., Castellarin, A., Carisi, F., and Schröter, K.: Exposure and vulnerability estimation for modelling flood losses to commercial assets in Europe, Sci. Total Environ., 737, 140011, https://doi.org/10.1016/j.scitotenv.2020.140011, 2020.
Pathan, A. I., Girish Agnihotri, P., Said, S., and Patel, D.: AHP and TOPSIS based flood risk assessment – a case study of the Navsari City, Gujarat, India, Environ. Monit. Assess., 194, 509, https://doi.org/10.1007/s10661-022-10111-x, 2022.
Rafiei-Sardooi, E., Azareh, A., Choubin, B., Mosavi, A. H., and Clague, J. J.: Evaluating urban flood risk using hybrid method of TOPSIS and machine learning, Int. J. Disast. Risk Re., 66, 102614, https://doi.org/10.1016/j.ijdrr.2021.102614, 2021.
Ramkar, P. and Yadav, S. M.: Flood risk index in data-scarce river basins using the AHP and GIS approach, Nat. Hazards, 109, 1119–1140, 2021.
Rizzi, J., Torresan, S., Zabeo, A., Critto, A., Tosoni, A., Tomasin, A., and Marcomini, A.: Assessing storm surge risk under future sea-level rise scenarios: a case study in the North Adriatic coast, J. Coast. Conserv., 21, 453–471, https://doi.org/10.1007/s11852-017-0517-5, 2017.
Rousell, A. and Zipf, A.: Towards a Landmark-Based Pedestrian Navigation Service Using OSM Data, ISPRS Int. Geo-Inf., 6, 64, https://doi.org/10.3390/ijgi6030064, 2017.
Scawthorn, C., Blais, N., Seligson, H., Tate, E., Mifflin, E., Thomas, W., Murphy, J., and Jones, C.: HAZUS-MH flood loss estimation methodology. I: Overview and flood hazard characterization, Nat. Hazards Rev., 7, 60–71, 2006.
Seto, K. C., Fragkias, M., Güneralp, B., and Reilly, M. K.: A meta-analysis of global urban land expansion, PloS one, 6, e23777, https://doi.org/10.1371/journal.pone.0023777, 2011.
Shao, Y., Taff, G. N., and Walsh, S. J.: Shadow detection and building-height estimation using IKONOS data, Int. J. Remote Sens., 32, 6929–6944, https://doi.org/10.1080/01431161.2010.517226, 2011.
Shi, X., Tan, J., Guo, Z., and Liu, Q.: A review of risk assessment of storm surge disaster, Adv. Earth Sci., 28, 866, https://doi.org/10.11867/j.issn.1001-8166.2013.08.0866, 2013.
Smith, D. I.: Flood damage estimation – A review of urban stage-damage curves and loss functions, Water SA, 20, 231–238, 1994.
Sutskever, I., Vinyals, O., and Le, Q. V.: Sequence to sequence learning with neural networks, Adv. Neur. In., 27, 3104–3112, 2014.
Tang, J., Wang, L., and Yao, Z.: Analyzing urban sprawl spatial fragmentation using multi-temporal satellite images, GISci. Remote Sens., 43, 218–232, 2006.
Taramelli, A., Righini, M., Valentini, E., Alfieri, L., Gatti, I., and Gabellani, S.: Building-scale flood loss estimation through vulnerability pattern characterization: application to an urban flood in Milan, Italy, Nat. Hazard. Earth Sys., 22, 3543–3569, https://doi.org/10.5194/nhess-22-3543-2022, 2022.
Tate, E., Munoz, C., and Suchan, J.: Uncertainty and sensitivity analysis of the HAZUS-MH flood model, Nat. Hazards Rev., 16, 04014030, https://doi.org/10.1061/(ASCE)NH.1527-6996.0000167, 2015.
Thieken, A. H., Olschewski, A., Kreibich, H., Kobsch, S., and Merz, B.: Development and evaluation of FLEMOps – a new Flood Loss Estimation MOdel for the private sector, WIT Trans. Ecol. Envir., 118, 315–324, https://doi.org/10.2495/friar080301, 2008.
Vijayan, L., Huang, W., Yin, K., Ozguven, E., Burns, S., and Ghorbanzadeh, M.: Evaluation of parametric wind models for more accurate modeling of storm surge: a case study of Hurricane Michael, Nat. Hazards, 106, 2003–2024, 2021.
Wang, N., Hou, Y., Mo, D., and Li, J.: Hazard assessment of storm surges and concomitant waves in Shandong Peninsula based on long-term numerical simulations, Ocean Coast. Manage., 213, 105888, https://doi.org/10.1016/j.ocecoaman.2021.105888, 2021.
Wang, S., Mu, L., Yao, Z., Gao, J., Zhao, E., and Wang, L.: Assessing and zoning of typhoon storm surge risk with a geographic information system (GIS) technique: a case study of the coastal area of Huizhou, Nat. Hazard. Earth Sys., 21, 439–462, https://doi.org/10.5194/nhess-21-439-2021, 2021.
Wu, J., Ye, M., Wang, X., and Koks, E.: Building Asset Value Mapping in Support of Flood Risk Assessments: A Case Study of Shanghai, China, Sustainability, 11, 971, https://doi.org/10.3390/su11040971, 2019.
Yang, J., Li, L., Zhao, K., Wang, P., Wang, D., Sou, I. M., Yang, Z., Hu, J., Tang, X., Mok, K. M., and Liu, P. L. F.: A Comparative Study of Typhoon Hato (2017) and Typhoon Mangkhut (2018) – Their Impacts on Coastal Inundation in Macau, J. Geophys. Res.-Oceans, 124, 9590–9619, https://doi.org/10.1029/2019jc015249, 2019.
Yang, Z., Shao, W., Ding, Y., Shi, J., and Ji, Q.: Wave Simulation by the SWAN Model and FVCOM Considering the Sea-Water Level around the Zhoushan Islands, J. Mar. Sci. Eng., 8, 783, https://doi.org/10.3390/jmse8100783, 2020.
Yazdi, J. and Salehi Neyshabouri, S. A. A.: Optimal design of flood-control multi-reservoir system on a watershed scale, Nat. Hazards, 63, 629–646, 2012.
Yu, L.: NHESS_dataset, https://doi.org/10.6084/m9.figshare.24586, 2023.
Zhai, G., Fukuzono, T., and Ikeda, S.: Modeling Flood Damage: Case of Tokai Flood 20001, J. Am. Water Resour. As., 41, 77–92, 2005.
Zhang, S., Zhang, J., Li, X., Du, X., Zhao, T., Hou, Q., and Jin, X.: Quantitative risk assessment of typhoon storm surge for multi-risk sources, J. Environ. Manage., 327, 116860, https://doi.org/10.1016/j.jenvman.2022.116860, 2023.
Zhang, Z., Chen, C., Song, Z., Zhang, D., Hu, D., and Guo, F.: A FVCOM study of the potential coastal flooding in apponagansett bay and clarks cove, Dartmouth Town (MA), Nat. Hazards, 103, 2787–2809, 2020.
Zhou, C., Chen, P., Yang, S., Zheng, F., Yu, H., Tang, J., Lu, Y., Chen, G., Lu, X., Zhang, X., and Sun, J.: The impact of Typhoon Lekima (2019) on East China: a postevent survey in Wenzhou City and Taizhou City, Front. Earth Sci., 16, 109–120, https://doi.org/10.1007/s11707-020-0856-7, 2021.
Zhou, G., Song, C., Simmers, J., and Cheng, P.: Urban 3D GIS from LiDAR and digital aerial images, Comput. Geosci., 30, 345–353, 2004.
Zhu, T., Ke, S., Li, W., Chen, J., Yun, Y., and Ren, H.: WRF-CFD/CSD analytical method of hydroelastic responses of ultra-large floating body on maritime airport under typhoon-wave-current coupling effect, Ocean Eng., 261, 112022, https://doi.org/10.1016/j.oceaneng.2022.112022, 2022.