the Creative Commons Attribution 4.0 License.
the Creative Commons Attribution 4.0 License.
 | 13 Jun 2024
Compound droughts under climate change in Switzerland
Christoph Nathanael von Matt
Regula Muelchi
Lukas Gudmundsson
Olivia Martius
The co-occurrence of meteorological, agricultural, and hydrological droughts (multivariate compound droughts) in Switzerland during growing season is problematic due to limitations in water abstractions from rivers during low-flow periods, while at the same time the need for irrigation is high. We analyse compound droughts for 52 catchments in Switzerland during the extended summer season (May–October) using the transient climate and hydrological scenarios for Switzerland (CH2018 and Hydro-CH2018) for both a scenario with mitigation (representative concentration pathway 2.6 (RCP2.6), 8 model chains) and a scenario without mitigation (RCP8.5, 20 model chains). In the RCP8.5 scenario the number of compound drought days is projected to significantly increase by mid-century across all greater regions of Switzerland. The increased frequency is mainly a result of more frequent events (significant) rather than longer event durations (non-significant). Models generally agree on the sign of change. By 2085, compound drought events are projected to occur in median once per catchment per extended summer season north of the Alps and every 1–2 years south of the Alps. Further, the increases in compound drought days mainly occur between May–October, leading to a shift in the main agricultural production season and a more pronounced seasonality with the highest occurrence probabilities between mid-July and the beginning of October. Coupled to the increase in days and events, significantly more catchments are projected to be affected by compound droughts at the same time. In the RCP2.6 (mitigation) scenario, the increase in the number of compound drought days and events is not significant by the end of the 21st century. In comparison with RCP8.5, the number of compound drought days is reduced by 50 %–55 % north of the Alps and by up to 75 % south of the Alps by the end of the century. This emphasizes the need for coordinated adaptation in combination with mitigation measures taken at an early stage.
- Article
(9594 KB) - Full-text XML
-
Supplement
(5818 KB) - BibTeX
- EndNote


Droughts are a globally recurring phenomenon of the natural hydrological cycle and describe a sustained period of below-normal water availability (Tallaksen and Van Lanen, 2004). In recent years, Switzerland has experienced several drought events, most notably in the years 2003, 2011, 2015, 2018, 2020, and 2022 (BAFU et al., 2019; BAFU, 2016; Brunner et al., 2019c; BUWAL, BWG, MeteoSchweiz, 2004; Scherrer et al., 2022). These droughts have led to severe ecological and economic impacts (BAFU et al., 2019; Keller and Fuhrer, 2004). In 2022, combined heat and drought conditions were in fact unprecedented in most parts of Europe (Tripathy and Mishra, 2023). Depending on the characteristics of a drought (e.g. type, severity, magnitude, timing and duration, spatial extent), various sectors are affected, such as agriculture (e.g. yield losses, reduced milk production), energy (e.g. hydropower generation), or the public (e.g. water supply, air quality), which is associated with substantial economic losses (Ranasinghe et al., 2021; Haile et al., 2020; BAFU, 2021; Hendrawan et al., 2023; Otero et al., 2023; Naumann et al., 2021). There is no single definition of droughts that covers all aspects of the drought phenomenon (Wilwhite and Glantz, 1985; Lloyd-Hughes, 2014; Van Loon, 2015; Brunner et al., 2021; Ault, 2020). Droughts are often classified into (1) meteorological droughts that are related to a precipitation deficit, (2) agricultural or soil moisture droughts that are related to soil moisture deficits, (3) hydrological droughts that are often defined as streamflow deficit, and (4) socio-economic droughts that include impacts resulting from all drought types (Wilwhite and Glantz, 1985; Haile et al., 2020; Van Loon, 2015; Mishra and Singh, 2010; Savelli et al., 2022). Droughts are commonly identified using drought indices which are derived from drought indicators (e.g. precipitation deficits, low soil moisture, low streamflow) (Mukherjee et al., 2018; Faiz et al., 2021; Van Loon, 2015; Yihdego et al., 2019; Bachmair et al., 2016). Most drought indices are representative of one specific drought type; for example the Standardized Precipitation Index (SPI; McKee et al., 1993) captures meteorological droughts, the Soil Moisture Anomaly (SMA; Orlowsky and Seneviratne, 2013) captures soil moisture drought, and the Standardized Runoff Anomaly (SRA; Gudmundsson and Seneviratne, 2015b) describes hydrological droughts. However drought indices can also serve as a proxy for several drought types depending on aggregation times (Cammalleri et al., 2019; Haslinger et al., 2014). Standardized indices such as the SPI have become popular in recent years and are now widely implemented in drought monitoring, drought prediction, and drought early warning systems (DEWSs; see e.g. Bachmair et al., 2016; Kchouk et al., 2022; Tijdeman et al., 2020). In addition, index combinations or combined multivariate drought indices (e.g. the Combined Drought Indicator (CDI)) exist (Bachmair et al., 2016; Cammalleri et al., 2021). However, no single drought index can capture all aspects of a drought and perform the best in all situations, regions, or climates, which makes the index selection process a site-specific task (Bachmair et al., 2016, 2018; Hayes et al., 2011; Myronidis et al., 2018; WMO and GWP, 2016; Hall and Leng, 2019; Van Loon, 2015). Droughts typically emerge from a period of anomalously low precipitation (meteorological drought). If such a period persists or co-occurs with a period of high evaporative demand, soil moisture storages may become depleted, resulting in a soil moisture deficit (soil moisture or agricultural drought) and eventually in plant water stress (Floriancic et al., 2020; Mishra and Singh, 2010; Seneviratne, 2012; Van Loon, 2015; Zhao et al., 2022). The drought signal may ultimately propagate into the hydrological system, causing a streamflow or even a groundwater deficit (hydrological or groundwater drought) (Haile et al., 2020; Van Loon, 2015; Mishra and Singh, 2010; Van Loon and Van Lanen, 2012). The exact sequence of the drought signal translation through the hydro-terrestrial system may differ depending on drought typology, drought-generating processes, and human interactions (e.g. water abstractions) and is often non-linear in nature (Brunner et al., 2023; Haile et al., 2020; Savelli et al., 2022; Tijdeman et al., 2018; Van Loon, 2015; Van Loon and Van Lanen, 2012). While meteorological droughts are tied to climate variability (precipitation), soil moisture and hydrological drought characteristics are spatio-temporally more variable due to the importance of local factors such as water storage and release or catchment characteristics (e.g. Apurv et al., 2017; Apurv and Cai, 2020; Denissen et al., 2020; Haslinger et al., 2014; Peña-Angulo et al., 2022; Staudinger et al., 2017, 2014; Sutanto and Van Lanen, 2022; Tijdeman et al., 2018; Van Lanen et al., 2013).
While assessing past drought trends has so far often been hampered by the length and availability of historical records (Brunner et al., 2021; Hasan et al., 2019; Sheffield et al., 2012; Vicente-Serrano et al., 2022; Kohn et al., 2019), many long-term drought drivers have changed in an unfavourable direction (de Jager et al., 2022). Further, many studies project significant future increases in drought hazards, risk, and impacts in many regions around the world (Arias et al., 2021; Forzieri et al., 2014; Grillakis, 2019; Gudmundsson and Seneviratne, 2016; Lehner et al., 2017; Naumann et al., 2021; Spinoni et al., 2020, 2018; Trenberth et al., 2014; Zeng et al., 2022). This goes along with an intensification of the water cycle and increased evaporative demand under global warming (Arias et al., 2021).
In Switzerland, future changes in annual precipitation and annual streamflow discharge are subject to uncertainties, with projections indicating only minor changes for both (Kotlarski et al., 2023; CH2018, 2018; BAFU, 2021; Muelchi et al., 2021b; Brunner et al., 2019b). This is partly due to the proximity to the Alps, which act as both a “water tower” and an “Alpine divide” (Viviroli et al., 2007; van Tiel et al., 2023; Haslinger et al., 2019), placing Switzerland in a transition zone between projected (winter) wetting trends in northern Europe and drying trends in southern Europe (Spinoni et al., 2018; Grillakis, 2019; Hirschi et al., 2020; Gudmundsson et al., 2017; Gudmundsson and Seneviratne, 2015a; CH2018, 2018; Forzieri et al., 2014). Changes are however more pronounced on a seasonal scale, with significant projected drying trends in summer without mitigation efforts for both meteorological and agricultural drought indices (CH2018, 2018; Fischer et al., 2015), minimum discharges (Brunner et al., 2019b), and moderate low-flow extremes (Muelchi et al., 2021a). Without mitigation, (meteorological) dry periods are projected to get longer, more frequent, and more severe (CH2018, 2018; Hirschi et al., 2020; Spinoni et al., 2018; Kotlarski et al., 2023). Along with rising temperatures, the evaporative demand is also projected to increase, leading to an augmented need for irrigation in many important agricultural regions of Switzerland (Allgaier Leuch et al., 2017; Fuhrer and Calanca, 2014; Hirschi et al., 2020; Holzkämper et al., 2020; Lanz, 2020; Remund et al., 2016; Vicente-Serrano et al., 2022). Water scarcity is currently not an issue in Switzerland in large catchments; however, some lower-lying small- to mid-size catchments in important agricultural regions of Switzerland do already face problems in extremely dry summers (BAFU et al., 2019; BAFU, 2021; Brunner et al., 2019a). Extreme summers like in the years 2003 and 2022 will become more average under climate change projections in the future (Calanca, 2007; Imfeld et al., 2022a, b; Miralles et al., 2019). As a consequence, water scarcity is projected to be further aggravated in regions where increased water demand may not be fully compensated for by current adaptive capacities (e.g. natural and artificial reservoirs) (Fuhrer and Calanca, 2014; Brunner et al., 2019a; Henne et al., 2018; Lanz, 2020).
Drought impacts may become particularly severe if meteorological, agricultural, and hydrological droughts occur simultaneously, forming compound drought events (Markonis et al., 2021; Wu et al., 2022). Compound events describe situations where multiple hazards or drivers of hazards occur simultaneously or consecutively, thereby contributing jointly to societal or environmental risk (Zscheischler et al., 2020; Seneviratne et al., 2012). In the case of compound drought events and following drought propagation principles, an extended period of precipitation deficit (meteorological drought) may lead to the propagation of the drought signal to a soil moisture deficit critical for plant water stress, resulting in an augmented need for (agricultural) irrigation. Irrigation may, however, not be possible due to (surface-)water abstraction restrictions imposed during a simultaneous hydrological drought, as was the case in Switzerland for example in 2018 (BAFU et al., 2019). Further, compound drought events can affect multiple mutually dependent regions or catchments at the same time, which can then pose additional challenges to water management and may aggravate drought-related impacts (Singh et al., 2021). In the case of such spatially extended compound drought events, local adaptation measures alone may not be sufficient anymore to address them (Brunner et al., 2019a; Fuhrer and Calanca, 2014; Singh et al., 2021; Tellman and Eakin, 2022; Kreibich et al., 2022; Kruse and Seidl, 2013). Studies investigating compound drought events often focus on compounding hot and dry extremes (Dirmeyer et al., 2021; Manning et al., 2019; Otero et al., 2023), temporal aspects (Brunner and Stahl, 2023; Li et al., 2022), or spatial concurrence (Brunner and Gilleland, 2021; Singh et al., 2021). Multiple drought types are more often considered in drought propagation contexts (Ding et al., 2021; Gu et al., 2020; Jiang et al., 2023; Tijdeman et al., 2022; Van Loon and Van Lanen, 2012; Wu et al., 2021), and few studies quantify co-occurrence in terms of compound drought events, thereby often focusing on two drought types (Brunner et al., 2019c; Manning et al., 2018; Wu et al., 2022).
In this work, compound drought events – defined as the simultaneous occurrence of meteorological, agricultural, and hydrological droughts – are investigated in 52 catchments in Switzerland for both present and future climates using the transient, downscaled climate and hydrological scenarios for Switzerland (CH2018, Hydro-CH2018) (CH2018, 2018; Muelchi et al., 2022). The main goal is to assess present and future characteristics of compound drought events in Switzerland to provide crucial information for future water resource management and adaptation planning and motivation for mitigation actions. The following questions are addressed:
-
How often do compound droughts, defined as the simultaneous occurrence of meteorological, agricultural, and hydrological drought, occur in Swiss catchments?
-
How are they characterized in terms of number of days, duration, frequency, and seasonality, and how do these characteristics change in the future?
-
Are there regional differences in compound drought occurrences and their characteristics?
-
How are compound droughts characterized in terms of spatial extent? Do compound droughts occur simultaneously over multiple catchments or regions in Switzerland (spatially compounding droughts)?
The remainder of this paper is structured as follows: in Sect. 2 the catchments and (model) simulations are introduced. In Sect. 3 drought indices are presented, compound events are defined, and the climate change assessment approach is described. Section 4 presents the results for compound droughts on the catchment level (aggregated on greater regions), while Sect. 5 presents results related to the spatial extent of compound droughts (across multiple catchments). In Sect. 6 the results from previous sections are wrapped up with a discussion on plausibility and uncertainties inherent to the present analysis, and Sect. 7 then concludes with the most important findings and future prospects in terms of mitigation and adaptation actions.
Compound droughts occurring during the extended summer season from May to October are analysed for 52 small- to mid-size (17–1702 km2) lower-lying catchments (mean altitude < 1500 m a.s.l.) in Switzerland. The catchments are distributed across the greater (natural) regions of Switzerland defined by the Federal Office for the Environment (NCCS, 2023): the pre-Alps (n=22), the Jura (n=13), the Southern Alps (n=4), and the Swiss Plateau region (n=13). The locations of the catchments, the catchment outlets, and the catchment affiliations to the greater regions are shown in Fig. 1. The restriction to lower-lying small- to mid-size catchments and to the extended summer season ensures a focus on classical rainfall deficit droughts and limited influence of snowmelt and glacier melt on streamflow discharge (Brunner et al., 2019b; Floriancic et al., 2020; Muelchi et al., 2021a, b). As such, all investigated catchments have a glaciation percentage of 0 %. A more detailed description of the investigated catchments including catchment and climate characteristics is presented in Table A1 in Appendix A. The following model variables are used (daily means): precipitation (P), actual evapo(transpi)ration (ET), potential evapo(transpi)ration (PET), and runoff (Q). Daily precipitation is taken from the gridded Swiss climate scenarios CH2018 (DAILY-GRIDDED; CH2018 Project Team, 2018; Kotlarski and Rajczak, 2018) and aggregated over the catchment area. The scenarios consist of transient daily simulations for the 1981–2099 period that were statistically downscaled and bias corrected from EURO-CORDEX simulations (Jacob et al., 2014; Kotlarski et al., 2014; Kotlarski and Rajczak, 2018). For daily ET, PET, and Q, we use the Hydro-CH2018-Runoff ensemble simulations (Muelchi et al., 2022), which were driven by temperature and precipitation data from the CH2018 scenarios. This ensures temporal consistency between the meteorological and hydrological variables. The hydrological simulations are run with the semi-distributed hydrological model PREVAH (Viviroli et al., 2009), which accounts for processes such as evapotranspiration, soil moisture, and snow processes. PET is calculated by the Hamon equations, which is a temperature-based estimation method which derives average PET based on the saturated water vapour density at the daily mean temperature adjusted for the number of daylight hours at the specific geographic location (long, lat) (Hamon-PET; Hamon, 1961). The actual ET consists of evaporation terms from both interception and soil moisture storages (see Viviroli et al., 2009). The hydrological PREVAH model was calibrated following the automated parameter estimation procedure PEST (Doherty, 2005) by using the objective function (Φ), which is defined as the squared sum of weighted residuals (see Muelchi et al., 2022):
where ri denotes the residual of the ith observation and wi the weight associated with the ith observation.
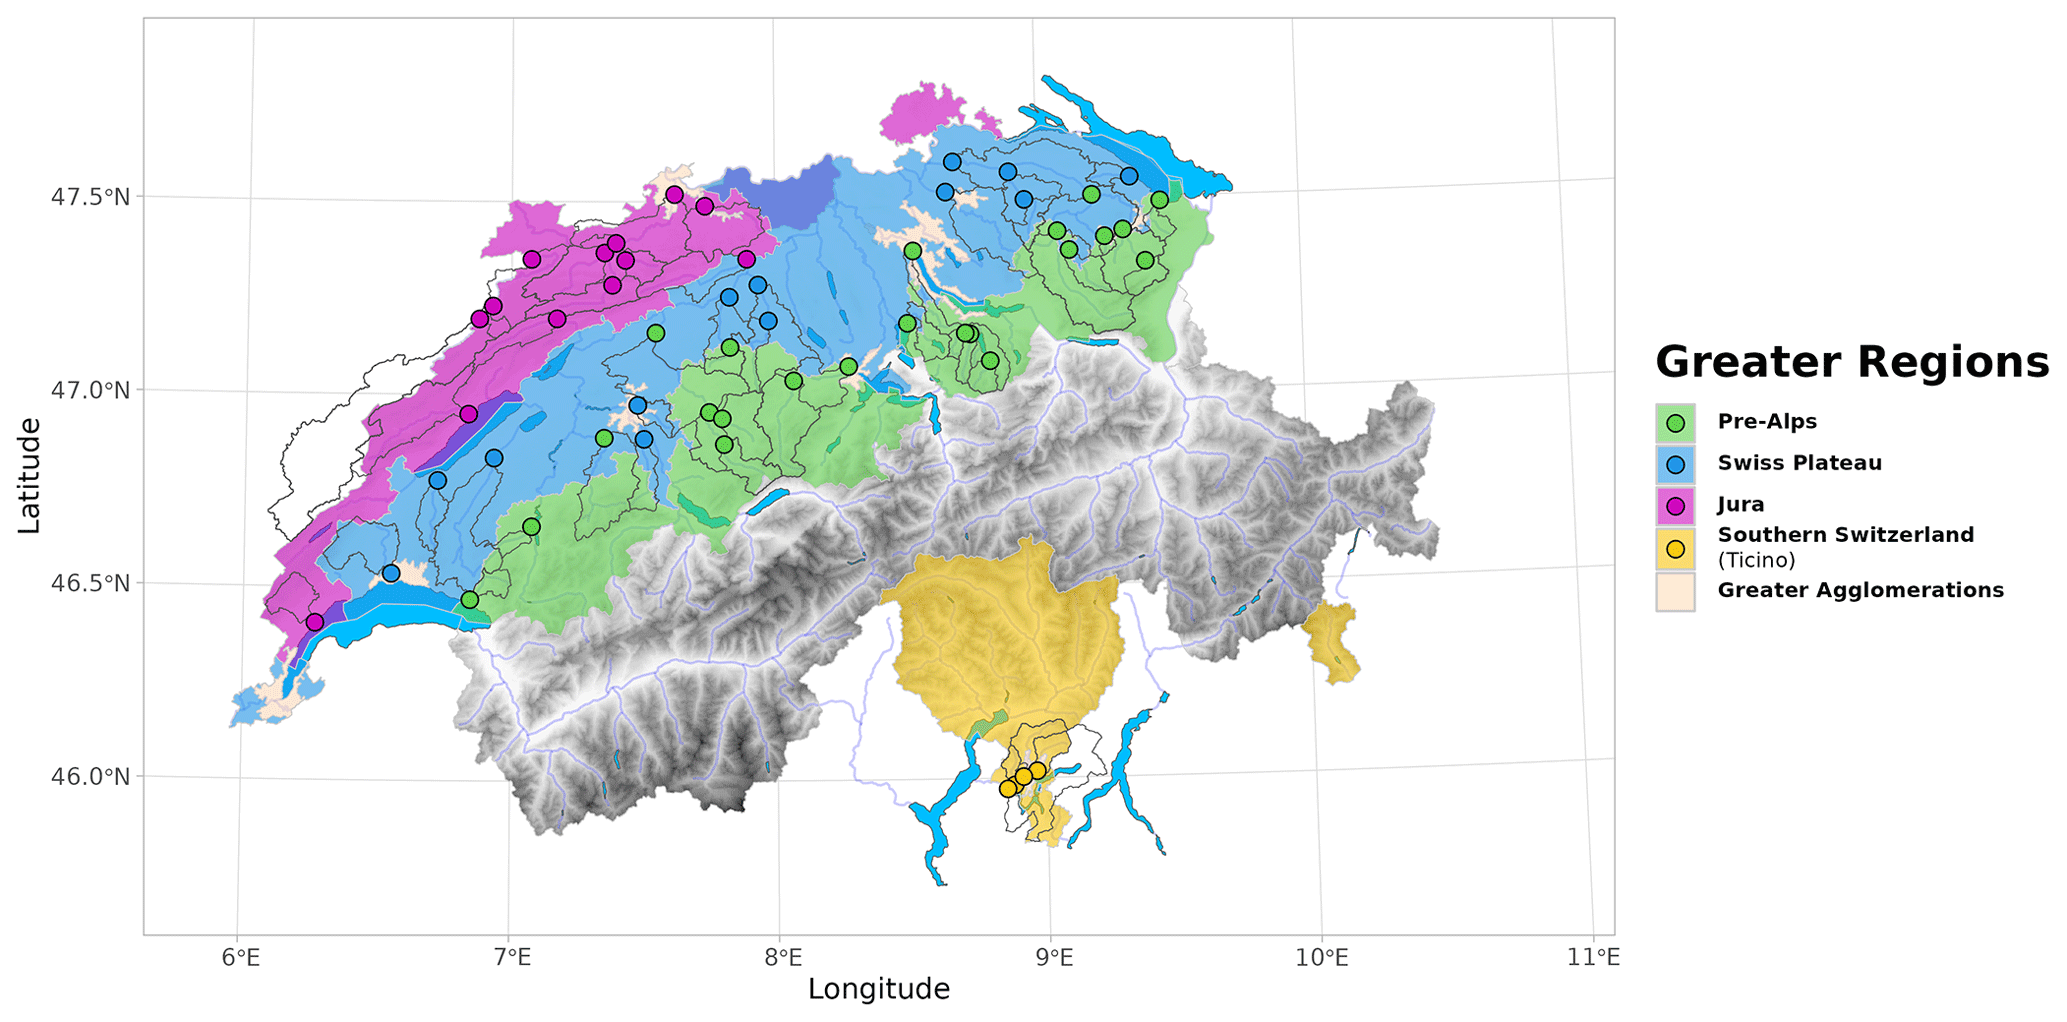
Figure 1Overview of study region: the 52 analysed catchments with a mean altitude < 1500 m a.s.l. (contours and outlet points) and their classification into four greater regions in Switzerland.
Four equally weighted observation groups were considered: (1) the observed runoff (Q), (2) the monthly mean runoff (Qmonth), (3) the yearly volumes (Qyear), and (4) a transformed (inverted) runoff () to add more weight to low-flow conditions. Therefore, the objective function is conditioned towards a better representation of river flow regimes and low-flow conditions (see Muelchi et al., 2022). Performance was assessed by both the Nash–Sutcliffe efficiency (NSE; Nash and Sutcliffe, 1970) and Kling–Gupta efficiency (KGE; Gupta et al., 2009) for calibration and validation periods separately. Calibration and validation metrics for all investigated catchments are presented in Table B1 in Appendix B. For more details see Muelchi et al. (2022).
All simulations are available for the following representative concentration pathways (RCPs): RCP2.6 represents a mitigation scenario and RCP8.5 a non-mitigation scenario (Moss et al., 2010; van Vuuren et al., 2011). In this study, we use the same model selection as described in Muelchi et al. (2021a) (see Table 1 therein), which consists in total of 28 GCM–RCM model chains (RCP2.6: 8; RCP8.5: 20) and an observation-driven validation simulation (hereafter CTRL). This CTRL simulation was driven by daily gridded precipitation (RhiresD) and temperature (TabsD) data provided by MeteoSwiss (MeteoSwiss, 2021a, b; Frei and Schär, 1998; Frei, 2014), which were also used for the bias correction of the CH2018 scenarios. For more information see Muelchi et al. (2022).
3.1 Drought indices, drought events, and event characteristics
Each drought type is represented by an individual drought index. Drought events are defined based on a fixed-threshold approach, and event characteristics are extracted by run theory principles (Yevjevich, 1967). We focus mainly on the characteristic event duration, event frequency or sample return period, event seasonality, and spatial extent. The event duration corresponds to the time span during which index values fall below the fixed threshold. The event frequency corresponds to the number of events occurring per a predefined period (e.g. extended summer season). The return period is derived from inversion of the empirical event frequencies (e.g. 1 / frequency). Event seasonality refers to the day of the year (DOY) on which a specific drought day occurs. The spatial extent is quantified by the number of catchments simultaneously affected by drought conditions. To account for statistical independence of consecutive and potentially dependent drought events, an additional inter-event distance pooling procedure is applied. If the time between two consecutive drought events is smaller than the inter-event distance (in days), the two drought events are pooled and considered to be one single event (see e.g. Sarailidis et al., 2019; Tallaksen et al., 1997). Indices and thresholds for event extraction are defined based on the chosen reference period of 1991–2020. For more details see the corresponding sections on individual drought types.
3.1.1 Meteorological drought – Standardized Precipitation Index (SPI-3)
To represent meteorological drought we use the Standardized Precipitation Index (SPI; McKee et al., 1993) on a 3-monthly scale (SPI-3). The SPI is a widely used meteorological drought index based only on precipitation and is also recommended by the World Meteorological Organization (WMO and GWP, 2016; Bachmair et al., 2016; Hayes et al., 2011). For each catchment time series, the retrospective 3-monthly (aggregated) precipitation data are fitted to a gamma distribution first and then transformed to a standard normal distribution (as recommended by Stagge et al., 2015). To calculate daily SPI values, the SCI R package (Gudmundsson and Stagge, 2016; Stagge et al., 2015) was used, and functions were adapted for daily temporal resolution. Following Stagge et al. (2015), all years of the time series were homogenized to 365 d by excluding the last day of the year in case of leap years. Gamma fits were derived separately for each day of the year for the 1991–2020 reference period. In the case of non-convergence of the gamma distribution fit, missing daily SPI values were interpolated by averaging the two adjacent SPI values. In this work, we focus on moderate SPI events which are commonly defined by a fixed threshold of SPI < −1 (Tschurr et al., 2020; McKee et al., 1993). Extracted SPI events are pooled by an inter-event distance of 7 d.
3.1.2 Agricultural drought – relative evapotranspiration (ET / PET)
Soil moisture drought or agricultural drought represents the next stage in the concept of drought propagation of classical rainfall deficit droughts (e.g. Seneviratne, 2012; Van Loon and Van Lanen, 2012). We aim to capture situations indicative of plant water stress that necessitate irrigation to avoid potential yield losses. A drought index frequently used to indicate plant water stress and irrigation need is the relative evapotranspiration index (ET / PET), which corresponds to the ratio of actual (ET) to potential evapo(transpi)ration (PET) (see e.g. Fu et al., 2022a; Fuhrer and Jasper, 2009; Otkin et al., 2018; Ranasinghe et al., 2021; Remund et al., 2016; Seneviratne et al., 2010; Walthert et al., 2015). We use ET / PET values averaged over 3 d. Studies investigating agricultural droughts based on ET / PET often use a threshold of ET / PET < 0.8 to identify situations with plant water stress (Remund et al., 2016; Allgaier Leuch et al., 2017; Walthert et al., 2015; Fuhrer and Jasper, 2009; Sawadogo et al., 2020). The threshold was (also analytically) derived for forest vegetation in Switzerland by Walthert et al. (2015). Plant responses to ET / PET may, however, differ among hydro-climatically different regions due to localized plant-evolutionary adaptations, which can complicate the choice of an adequate fixed threshold (Denissen et al., 2020; Fu et al., 2022a, b; Stocker et al., 2023; Miralles et al., 2019). By using a fixed threshold, this study focuses on hydro-climatic differences in agricultural drought conditions rather than local plant-specific extreme conditions. Like Fuhrer and Jasper (2009), an inter-event distance pooling of 2 d conditional on a 5 d event duration is applied.
3.1.3 Hydrological drought – 7 d average streamflow (M7Q or M7)
To represent hydrological drought, the 7 d average streamflow (M7Q) is used. M7Q also serves as a basis for low-flow indices analysed by the Federal Office for the Environment (see e.g. BAFU, 2019; Kohn et al., 2019). In Switzerland, article 4 of the water protection law specifies a residual flow (“Restwassermenge”) named Q347 that must be retained after water abstractions (BUWAL, 1997; Kohn et al., 2019; Weingartner and Schwanbeck, 2020; Tallaksen and Van Lanen, 2004; Aschwanden and Kan, 1999; Aschwanden, 1992). During hydrological drought situations with extreme low-flow conditions, restrictions based on Q347 may be imposed, inhibiting water abstraction for agricultural irrigation, as was the case for example in 2018 (BAFU et al., 2019). We define hydrological droughts similarly by using the 5th percentile of M7Q over the entire year and the full 30-year reference period based on the flow duration curve (hydroTSM R package, Zambrano-Bigiarini, 2020). Like in Van Loon and Van Lanen (2012), a combination of inter-event distance pooling and minimum event duration is used. Here, events are pooled using a 7 d inter-event distance, and only events with a minimum duration of 10 d are considered.
3.2 Compound drought types and their analysis
Compound events can be classified into preconditioned, multivariate, and temporally and spatially compounding events (Zscheischler et al., 2020). Here, two types of compound events are investigated, namely multivariate and spatially compounding events.
3.2.1 Multivariate compound droughts
Multivariate compound droughts are defined here as the simultaneous occurrence of multiple drought types (meteorological, agricultural, hydrological) within the same catchment. Based on the drought events of meteorological, agricultural, and hydrological droughts (see red phases in the time series of SPI-3, ET / PET, and M7Q in Fig. 2), the number of drought types occurring simultaneously in a drought phase is counted. Compound drought events occur if at least two different drought types occur simultaneously (yellow and red phases in bottom row of Fig. 2). Here we focus only on compound droughts of all three drought types (red phases). Compound droughts are analysed in terms of the number of days (count based), event frequency and duration, and seasonality. Compound drought events correspond to contiguous days with compound drought conditions (red phases in bottom row of Fig. 2). The event duration corresponds to the number of contiguous compound drought days of a specific event. Compound drought events were extracted analogous to individual drought types (see Sect. 3.1), but no further pooling was applied as event independence was addressed for individual drought types. The seasonality was quantified by the frequency of compound drought days for each day of the year (DOY) and subsequent estimation of (Gaussian kernel) density distributions with the tidyverse package (Wickham et al., 2019). Except for seasonality, all characteristics are assessed only for events and days occurring within the extended summer season (May–October). Events with at least 1 drought day occurring within the May–October period were considered in the analysis. The number of days and the event frequency are per extended summer season unless stated otherwise. Note that the spatial extent of compound droughts is introduced as a separate compound event type in Sect. 3.2.2.
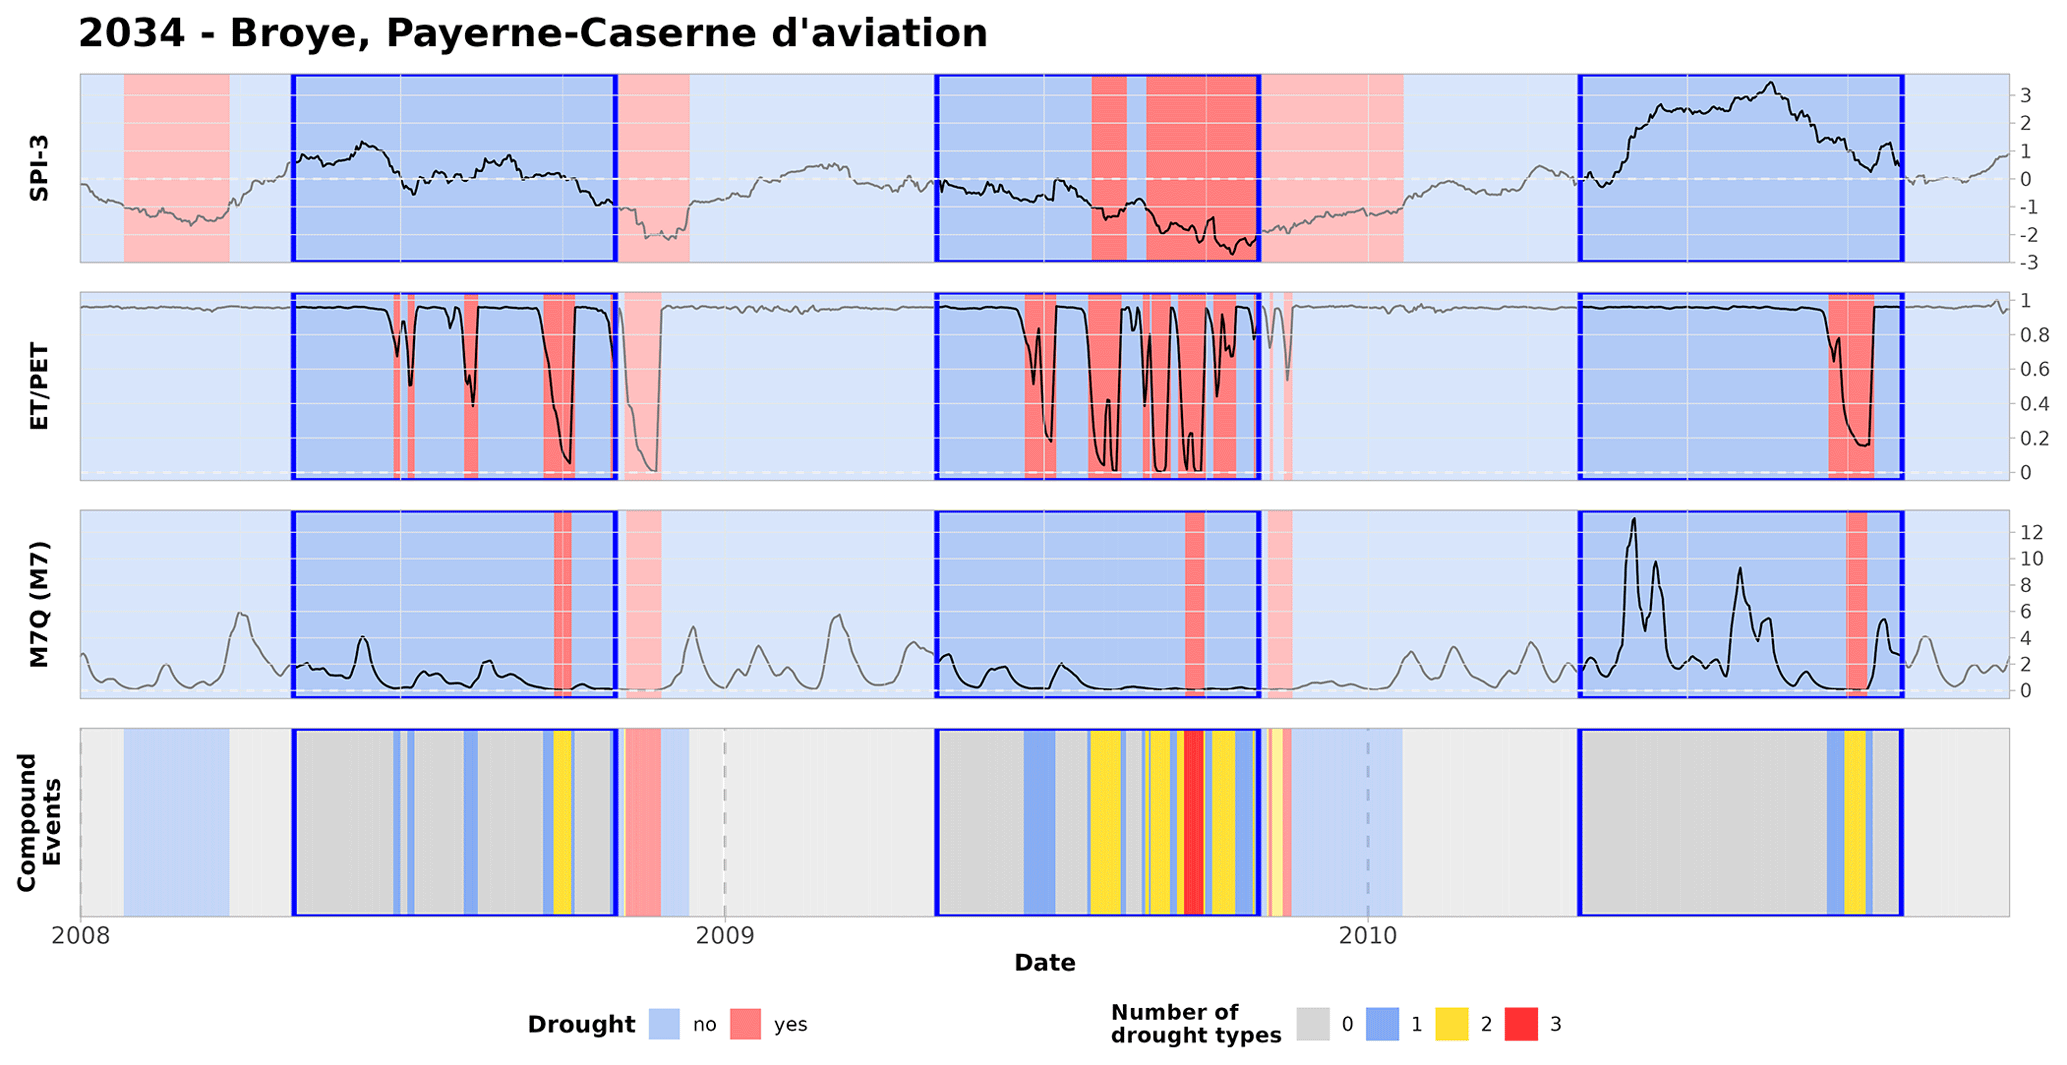
Figure 2Example time series for catchment 2034 – Broye, Payerne – Caserne d'aviation (Swiss Plateau region). Indicator time series for meteorological droughts represented by SPI-3 – units indicate standard deviations (top row), agricultural drought by ET / PET – units indicate the fraction (second row), and hydrological drought by M7Q – units indicate the discharge in millimetres per day (third row). Drought phases are indicated in red (left legend). The blue rectangles indicate the extended summer season. The number of drought types that occur simultaneously in a drought phase is indicated by colour (last row). Note the different colour scheme (right legend). Multivariate compound droughts with all drought types are marked in red, two concurrent drought types are indicated in yellow, one active drought type is indicated in blue, and no active drought type is indicated in grey.
To summarize the projected changes in compound drought event characteristics under climate change scenarios, catchments were aggregated into greater regions. An aggregation based on greater regions is equivalent to a simplified grouping by catchments with similar runoff regime types (see e.g. Weingartner and Schwanbeck, 2020; Muelchi et al., 2021b; Brunner et al., 2019b; Floriancic et al., 2020; Kohn et al., 2019; Aschwanden and Weingartner, 1985). Classification is based on the percentage overlap of catchment area with the greater regions and was manually checked for consistency. The catchment selection and grouping into the greater regions are shown in Fig. 1. The quality of the meteorological and hydrological data has previously been validated for dry-period lengths, SPI, simulated runoffs, and moderate runoff extremes (see e.g. Rajczak et al., 2016; Tschurr et al., 2020; Muelchi et al., 2022, 2021a). We use the observation-driven hydrological validation simulation (CTRL-run) to contextualize and validate our results (Muelchi et al., 2022). Characteristics and statistics were compared for the 1991–2014 period, which is the longest available period overlapping with the reference period of the scenario-driven simulations. The results of the validation are presented in the Supplement.
3.2.2 Spatial extent of the compound droughts (spatially compounding droughts)
The spatial extent of compound drought events (or spatially compounding events) is quantified by the number of catchments simultaneously affected by multivariate compound drought conditions over all 52 analysed catchments independent of greater regions. For each compound drought day, the number of catchments simultaneously affected by multivariate compound drought conditions (all three drought types, red phases) was determined for each climate model chain (see example time series in Fig. 3). We then analysed the median number of simultaneously affected catchments per compound drought day and cumulative distributions of days conditional on the number of simultaneously affected catchments. For the analysis only days within the extended summer season were considered. The results for individual models were then aggregated per emission scenario (RCP2.6 and RCP8.5).
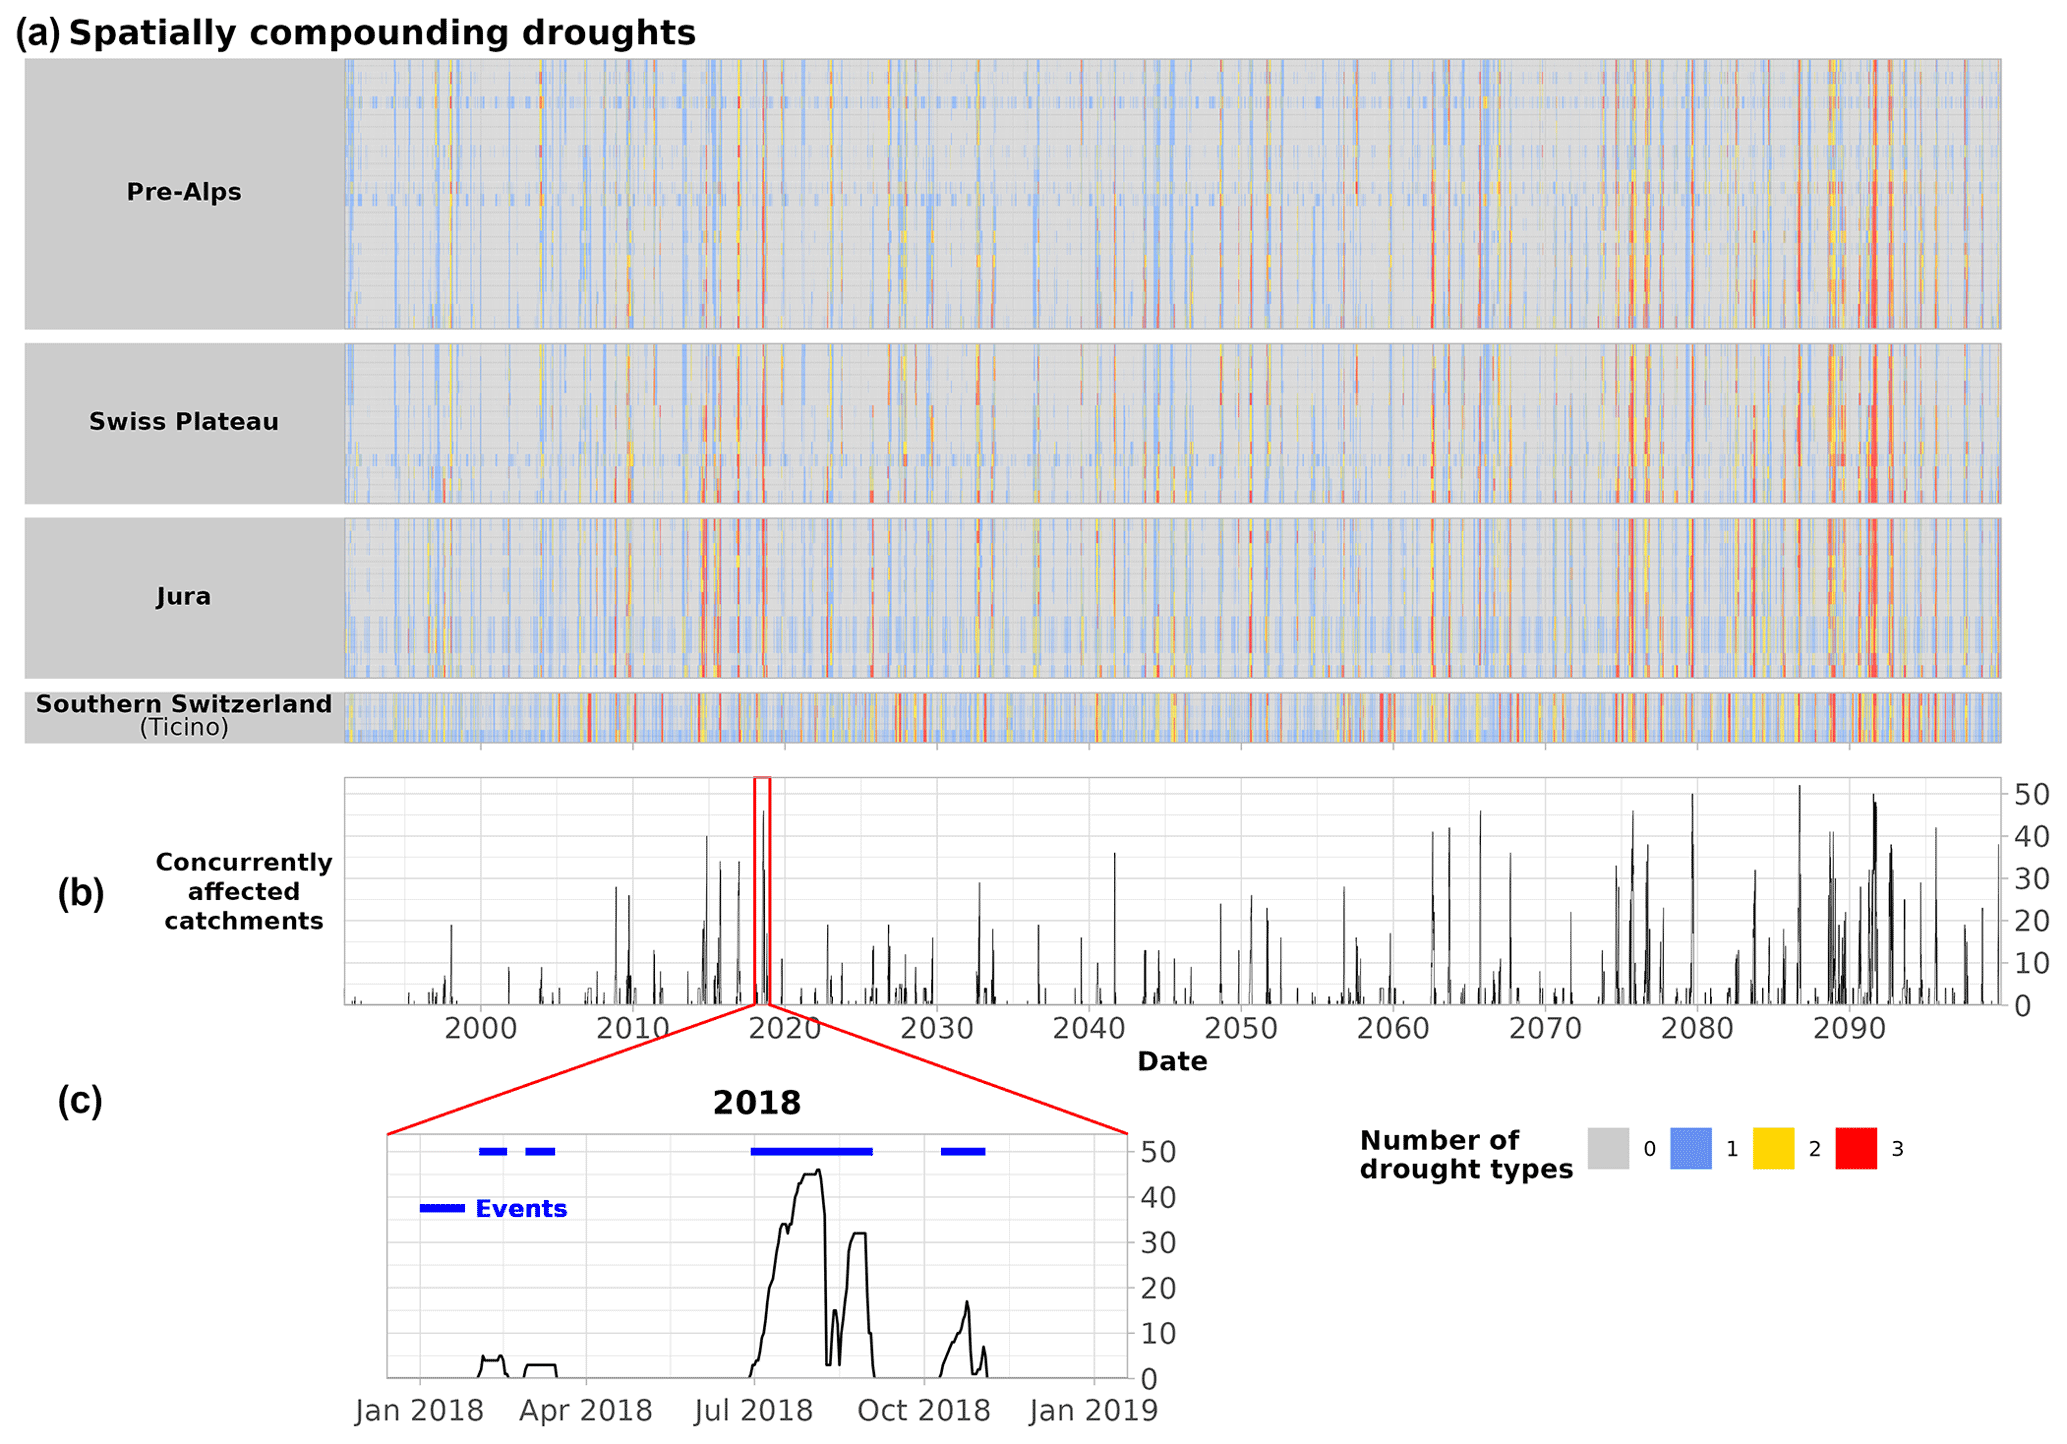
Figure 3The spatial extent of compound drought events over Switzerland. The figure shows (results of) an exemplary (hydrological) model simulation for an RCP8.5 scenario driven by GCM–RCM model chain CLMCOM-CCLM5-ECEARTH EUR-44 km. (a) Time series of the number of simultaneously active drought types (colour shading) for all 52 catchments. Each row corresponds to one catchment, and the catchments are sorted by greater regions and longitude (top – east, bottom – west) for 1991–2099. Multivariate compound drought days are highlighted in red (all three drought types active). (b) Time series of the number of catchments concurrently affected by multivariate compound drought conditions (red phases). (c) Zoomed-in view of the time series (b) for the year 2018. The blue stripes indicate extracted spatially compounding events.
For the event-based analysis, events were then extracted based on the time series of the number of simultaneously affected catchments (hence the separate event definition). Events are characterized by the number of events, the event duration, and the maximum number of simultaneously affected catchments over the entire duration of a specific event. The event duration spans contiguous days with at least one catchment affected by compound drought conditions and ends if no single catchment shows compound drought conditions. As for multivariate compound drought events, only events within the extended summer season were considered, and no pooling was conducted.
The timing of the maximum number of catchments concurrently experiencing compound drought conditions was not assessed and may occur at any time during an event. Further, catchments affected simultaneously by compounding drought events can be located anywhere in Switzerland (see individual catchment time series in Fig. 3), and we did not require spatial proximity or catchment connectivity. Note for the interpretation of our results that spatially compounding events do technically not occur until at least two catchments are simultaneously affected by compound droughts events. For the sake of clarity, we hereafter mainly refer to the spatial extent of compound droughts.
3.3 Assessment of the projected changes under climate change
Projected changes in compound drought characteristics related to climate change were assessed by comparing distributions over 30-year periods commonly used in climate change and climate impact assessments, namely 2035 (2020–2049 or the near future), 2060 (2045–2074 or mid-century), and 2085 (2070–2099 or the end of the century) with the 1991–2020 reference period (WMO, 2007; CH2018, 2018; Muelchi et al., 2021a). Note that the reference period was shifted compared to other studies (e.g. Muelchi et al., 2021a) to avoid inconsistencies in soil moisture resulting from the spin-up process of the hydrological model (not shown) and includes some years (ca. 10 years; see e.g. van Vuuren et al., 2011) that are forced with scenarios.
For all characteristics, multi-model median distributions are analysed considering all model chains per RCP scenario. Significance in differences in median among all models is then assessed by strict non-overlapping confidence intervals (CIs) of the median derived by the formula , where n denotes the sample size (McGill et al., 1978).
To quantify uncertainty and robustness of changes in the selected ensemble, an approach similar to that in the IPCC AR6 is used, which quantifies the significance of changes in multi-model medians in combination with indications on climate model agreement concerning the sign of change (CH2018, 2018; Lee et al., 2021). Changes are considered likely when at least 90 % of model chains per RCP agree on the sign of the change, which hereafter is referred to as general model agreement. Due to the potential effects of the forcing scenarios and due to the difference in sample size (RCP2.6: 8 model chains, RCP8.5: 20 model chains), the reference period was assessed separately for each scenario. An exception exists for the analysis of the relationship between the duration and maximum number of simultaneously affected catchments (see Sect. 5.2), where events of all models were pooled per scenario, and no differentiation among periods was made to increase sample sizes for more rare events affecting large parts of the country. In this case, significance was assessed for differences among scenarios rather than the reference period.
4.1 Compound drought days
The number of compound drought days and its percent change are depicted in Fig. 4 for different periods and RCP2.6 and RCP8.5 forcing. In the reference period the median number of compound drought days is 3–6 d per catchment and per extended summer season in Switzerland. Most compound drought days occur in the Jura and Swiss Plateau regions with approximately 6 d per extended summer season in median across all catchments. Fewer compound drought days per extended summer season occur in southern Switzerland (approx. 4 d) and in the pre-Alps (between 3–4 d).
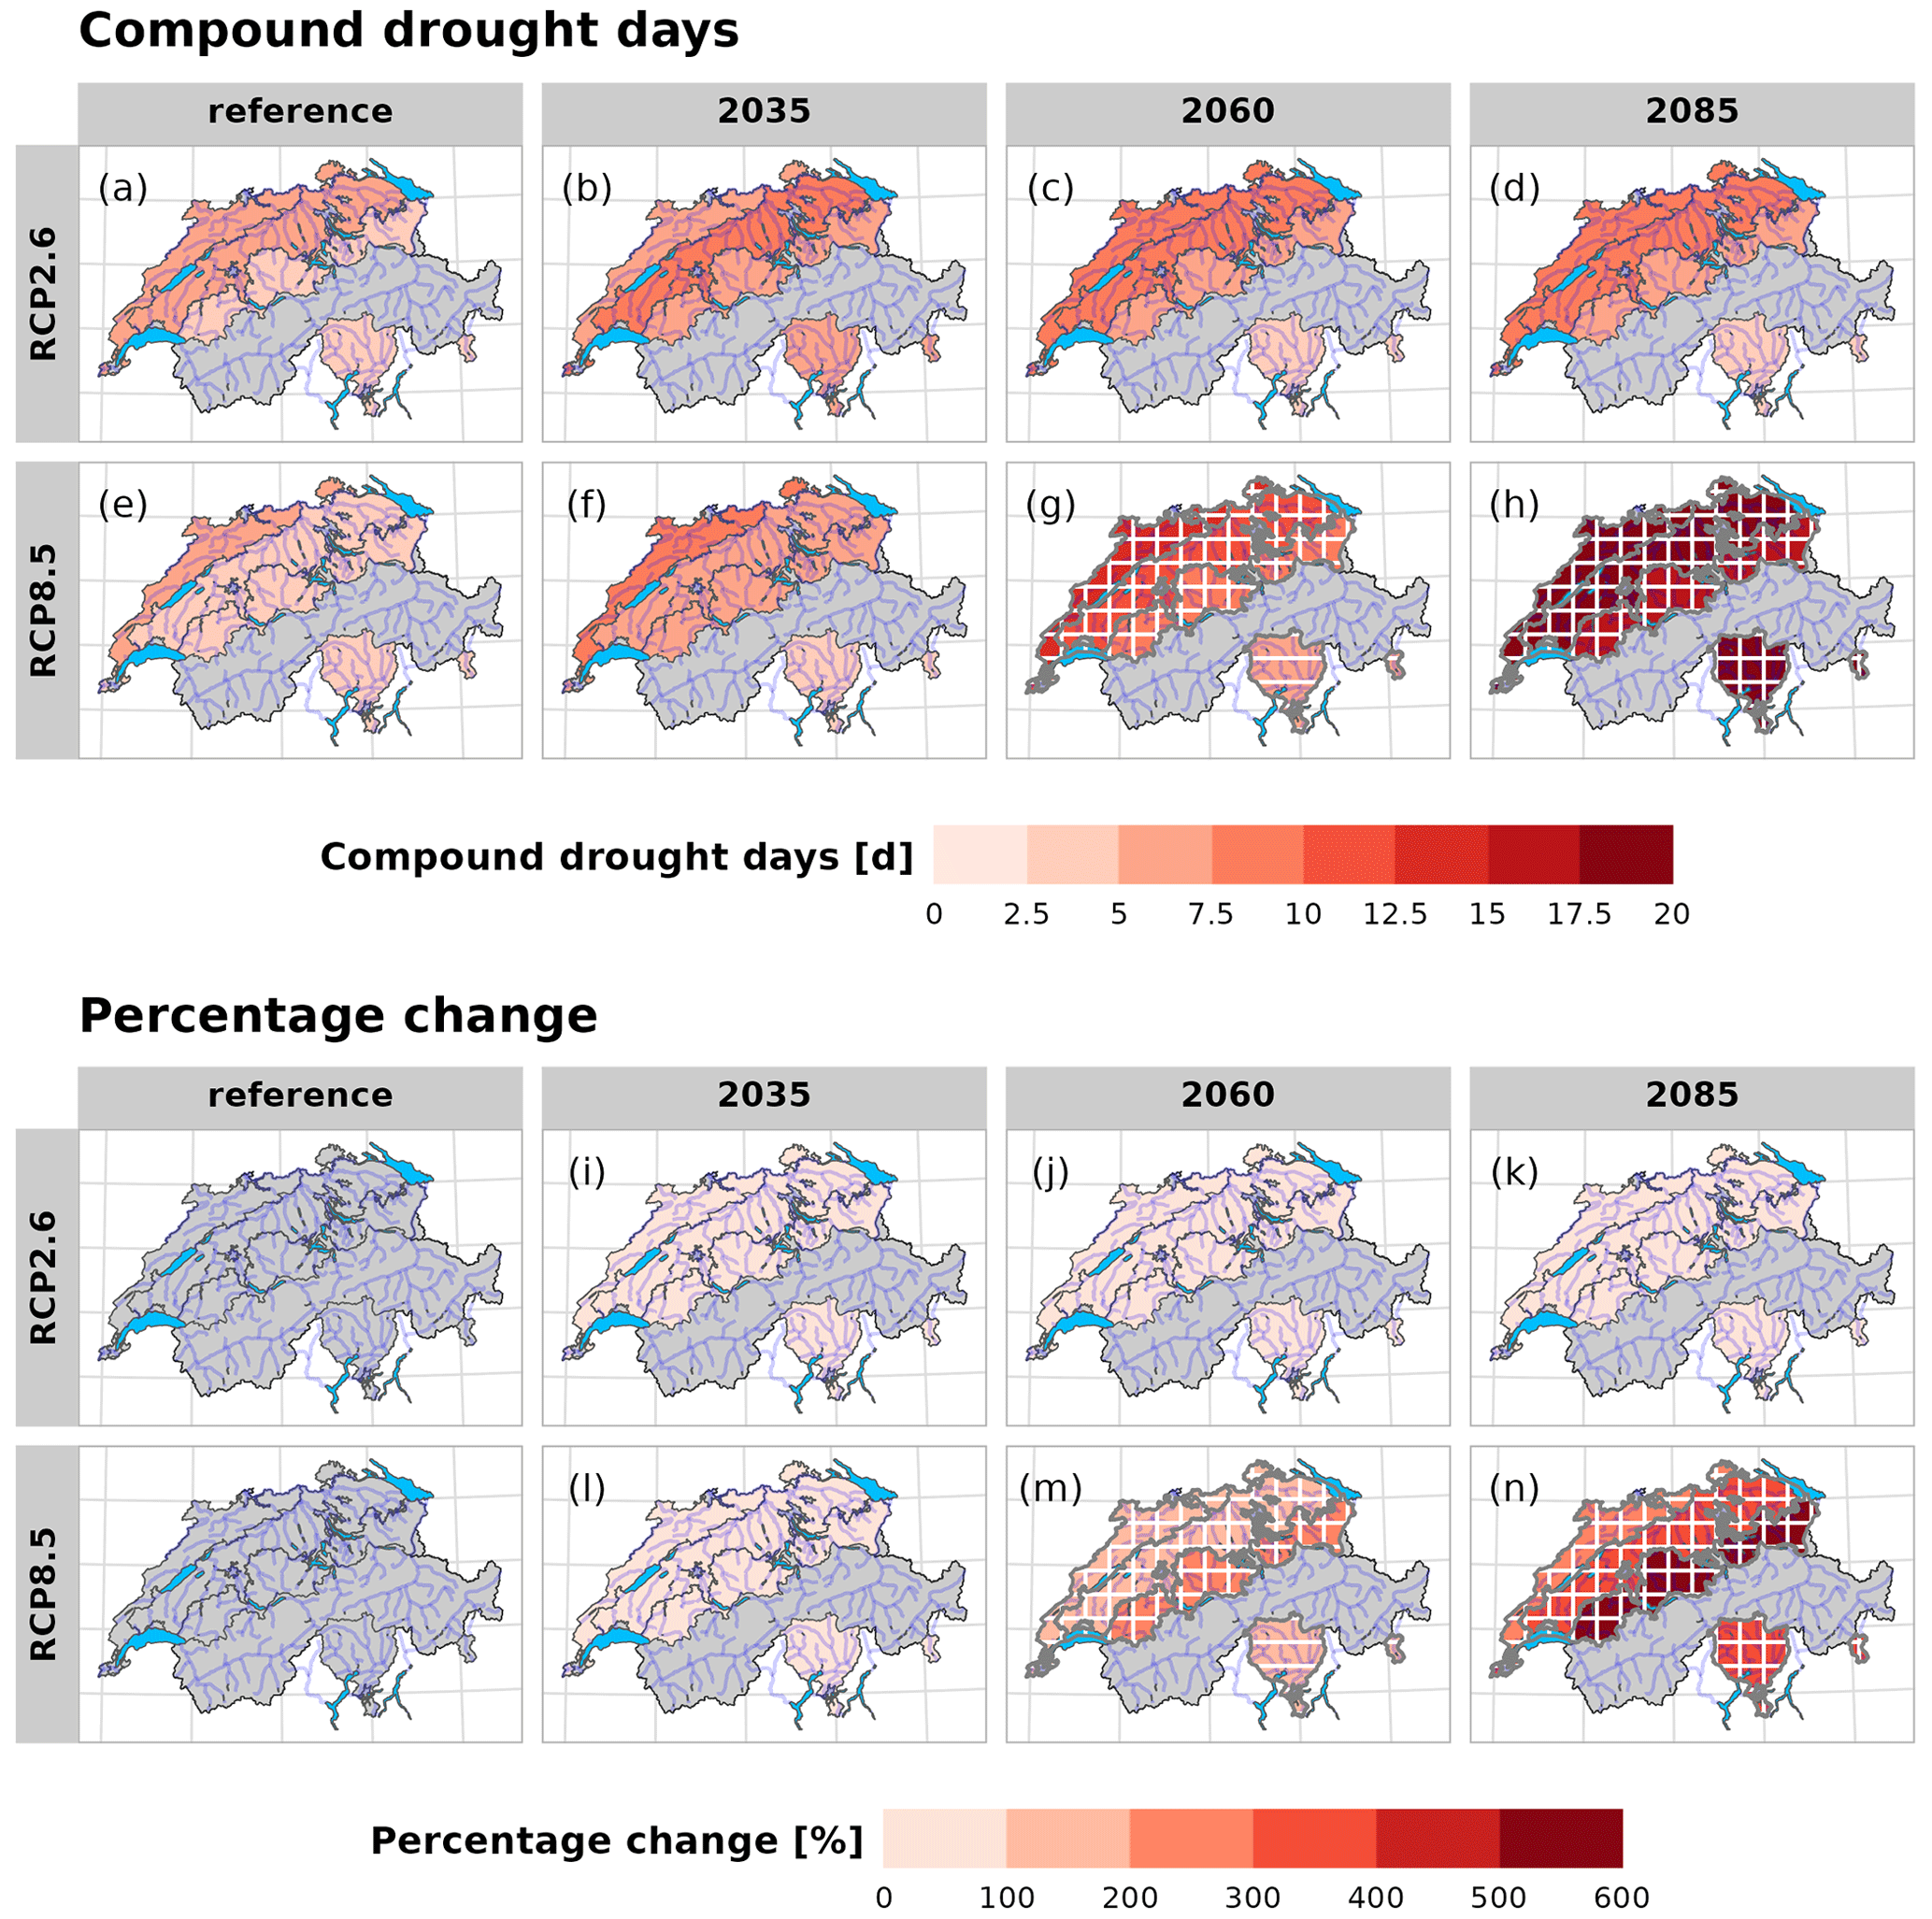
Figure 4Compound drought days per extended summer season for the reference climate and under climate change for the mitigation (RCP2.6) and non-mitigation (RCP8.5) scenarios aggregated on the greater regions (median over all catchments). Presented are both the median value (a–h) and the percentage change (i–n) over all model simulations per scenario. Hatching indicates if changes are significant compared to the reference period (horizontal lines) and whether ≥ 90 % of model simulations agree on the projected changes (per scenario; vertical lines). Significance and model agreement were evaluated only for absolute values and are identical for both median values and percentage changes.
In the near future (2035), no significant changes are projected for the greater regions for RCP2.6 and RCP8.5 (see Fig. 4b, f), and absolute numbers of compound drought days are comparable among greater regions and scenarios. Under RCP2.6, the number of compound drought days increases slightly but not significantly under climate change. Inter-regional differences remain constant by the end of the century under RCP2.6, with the Jura region still experiencing the most compound drought days with 9 d per extended summer season in the multi-model median, followed by the Swiss Plateau region with 8.5 d, and slightly fewer days in the pre-Alps with 7.2 d. Southern Switzerland is projected to experience 4.5 compound drought days in the multi-model median (Fig. 4d). Further, ranges in model median distributions increase by the end of the century, indicating increasing uncertainty in possible future changes north of the Alps (Jura, the Swiss Plateau, and the pre-Alps), while they decrease in southern Switzerland (not shown). The highest model agreement is projected for the pre-Alps and southern Switzerland, with 87.5 % () of models agreeing on more compound drought days, while changes are more uncertain for the Swiss Plateau (75 % ()) and Jura regions (62.5 % ()). Overall, the multi-model percentage increases correspond to less than a doubling of the number of compound drought days in all greater regions (see Fig. 4i–k).
Without mitigation (RCP8.5), significant increases in compound drought days are projected for all greater regions by mid-century, with models generally agreeing on an increase north of the Alps (Jura, the Swiss Plateau, and the pre-Alps), and by the end of the century also in southern Switzerland (Ticino) (Fig. 4g, h). The highest number of compound drought days is projected to occur in the Jura region, with a multi-model median of 12.6 d per catchment and per extended summer season by 2060 and 19.4 d by 2085. The second highest number of compound drought days is projected to occur in the Swiss Plateau region, with 11.4 d (2060) and 18 d (2085) per extended summer season (Fig. 4g, h). By 2085 the number of compound drought days in southern Switzerland is similar to that of the Swiss Plateau region, with a (multi-model) median of 17.6 compound drought days, while the pre-Alps experience fewer days with 15.8 d (Fig. 4h). Overall, the changes in the median of absolute numbers of compound drought days are similar for all greater regions, leading to smaller relative differences between regions. The projected increases under RCP8.5 correspond to a 3.8-fold (multi-model) increase in the Jura region, a 4.5-fold increase in southern Switzerland, a 5-fold increase in the Swiss Plateau region, and a 6.5-fold increase in the pre-Alps by the end of the century (Fig. 4n). By mid-century, model agreement in the Jura and pre-Alps reaches 95 % ( models agree). Most models do however also agree on an increase in southern Switzerland (75 % or models). By 2085 almost all models project an increase in the median number of compound drought days compared to the reference period in all greater regions (N-CH: 100 %, S-CH: 95 %), and compared to the mid-21st century the increase appears accelerated.
4.2 Compound drought event duration
In the reference period, events last 11 d in the Jura and the Swiss Plateau regions and 9 d in the pre-Alps, which is consistent with the regional differences in univariate hydrological droughts (Fig. 5a, e). Events last the longest in southern Switzerland, with a median event duration of 16 d (Fig. 5a, e). The median event duration increases by the end of the 21st century under RCP8.5 (Fig. 5). However, the increase is neither significant nor agreed upon by most models, with the exception of the Jura region for 2060 (see Fig. 5g). By 2085 and without mitigation, the projected non-significant median increase in duration is stronger in regions with longer event durations (+21 % for Jura and Swiss Plateau, +26 % in southern Switzerland, and +11 % in the pre-Alps; see Fig. 5n), with the longest events occurring in southern Switzerland (19 d), followed by the Jura and Swiss Plateau regions (13 d) and the pre-Alps (10 d) (Fig. 5h).
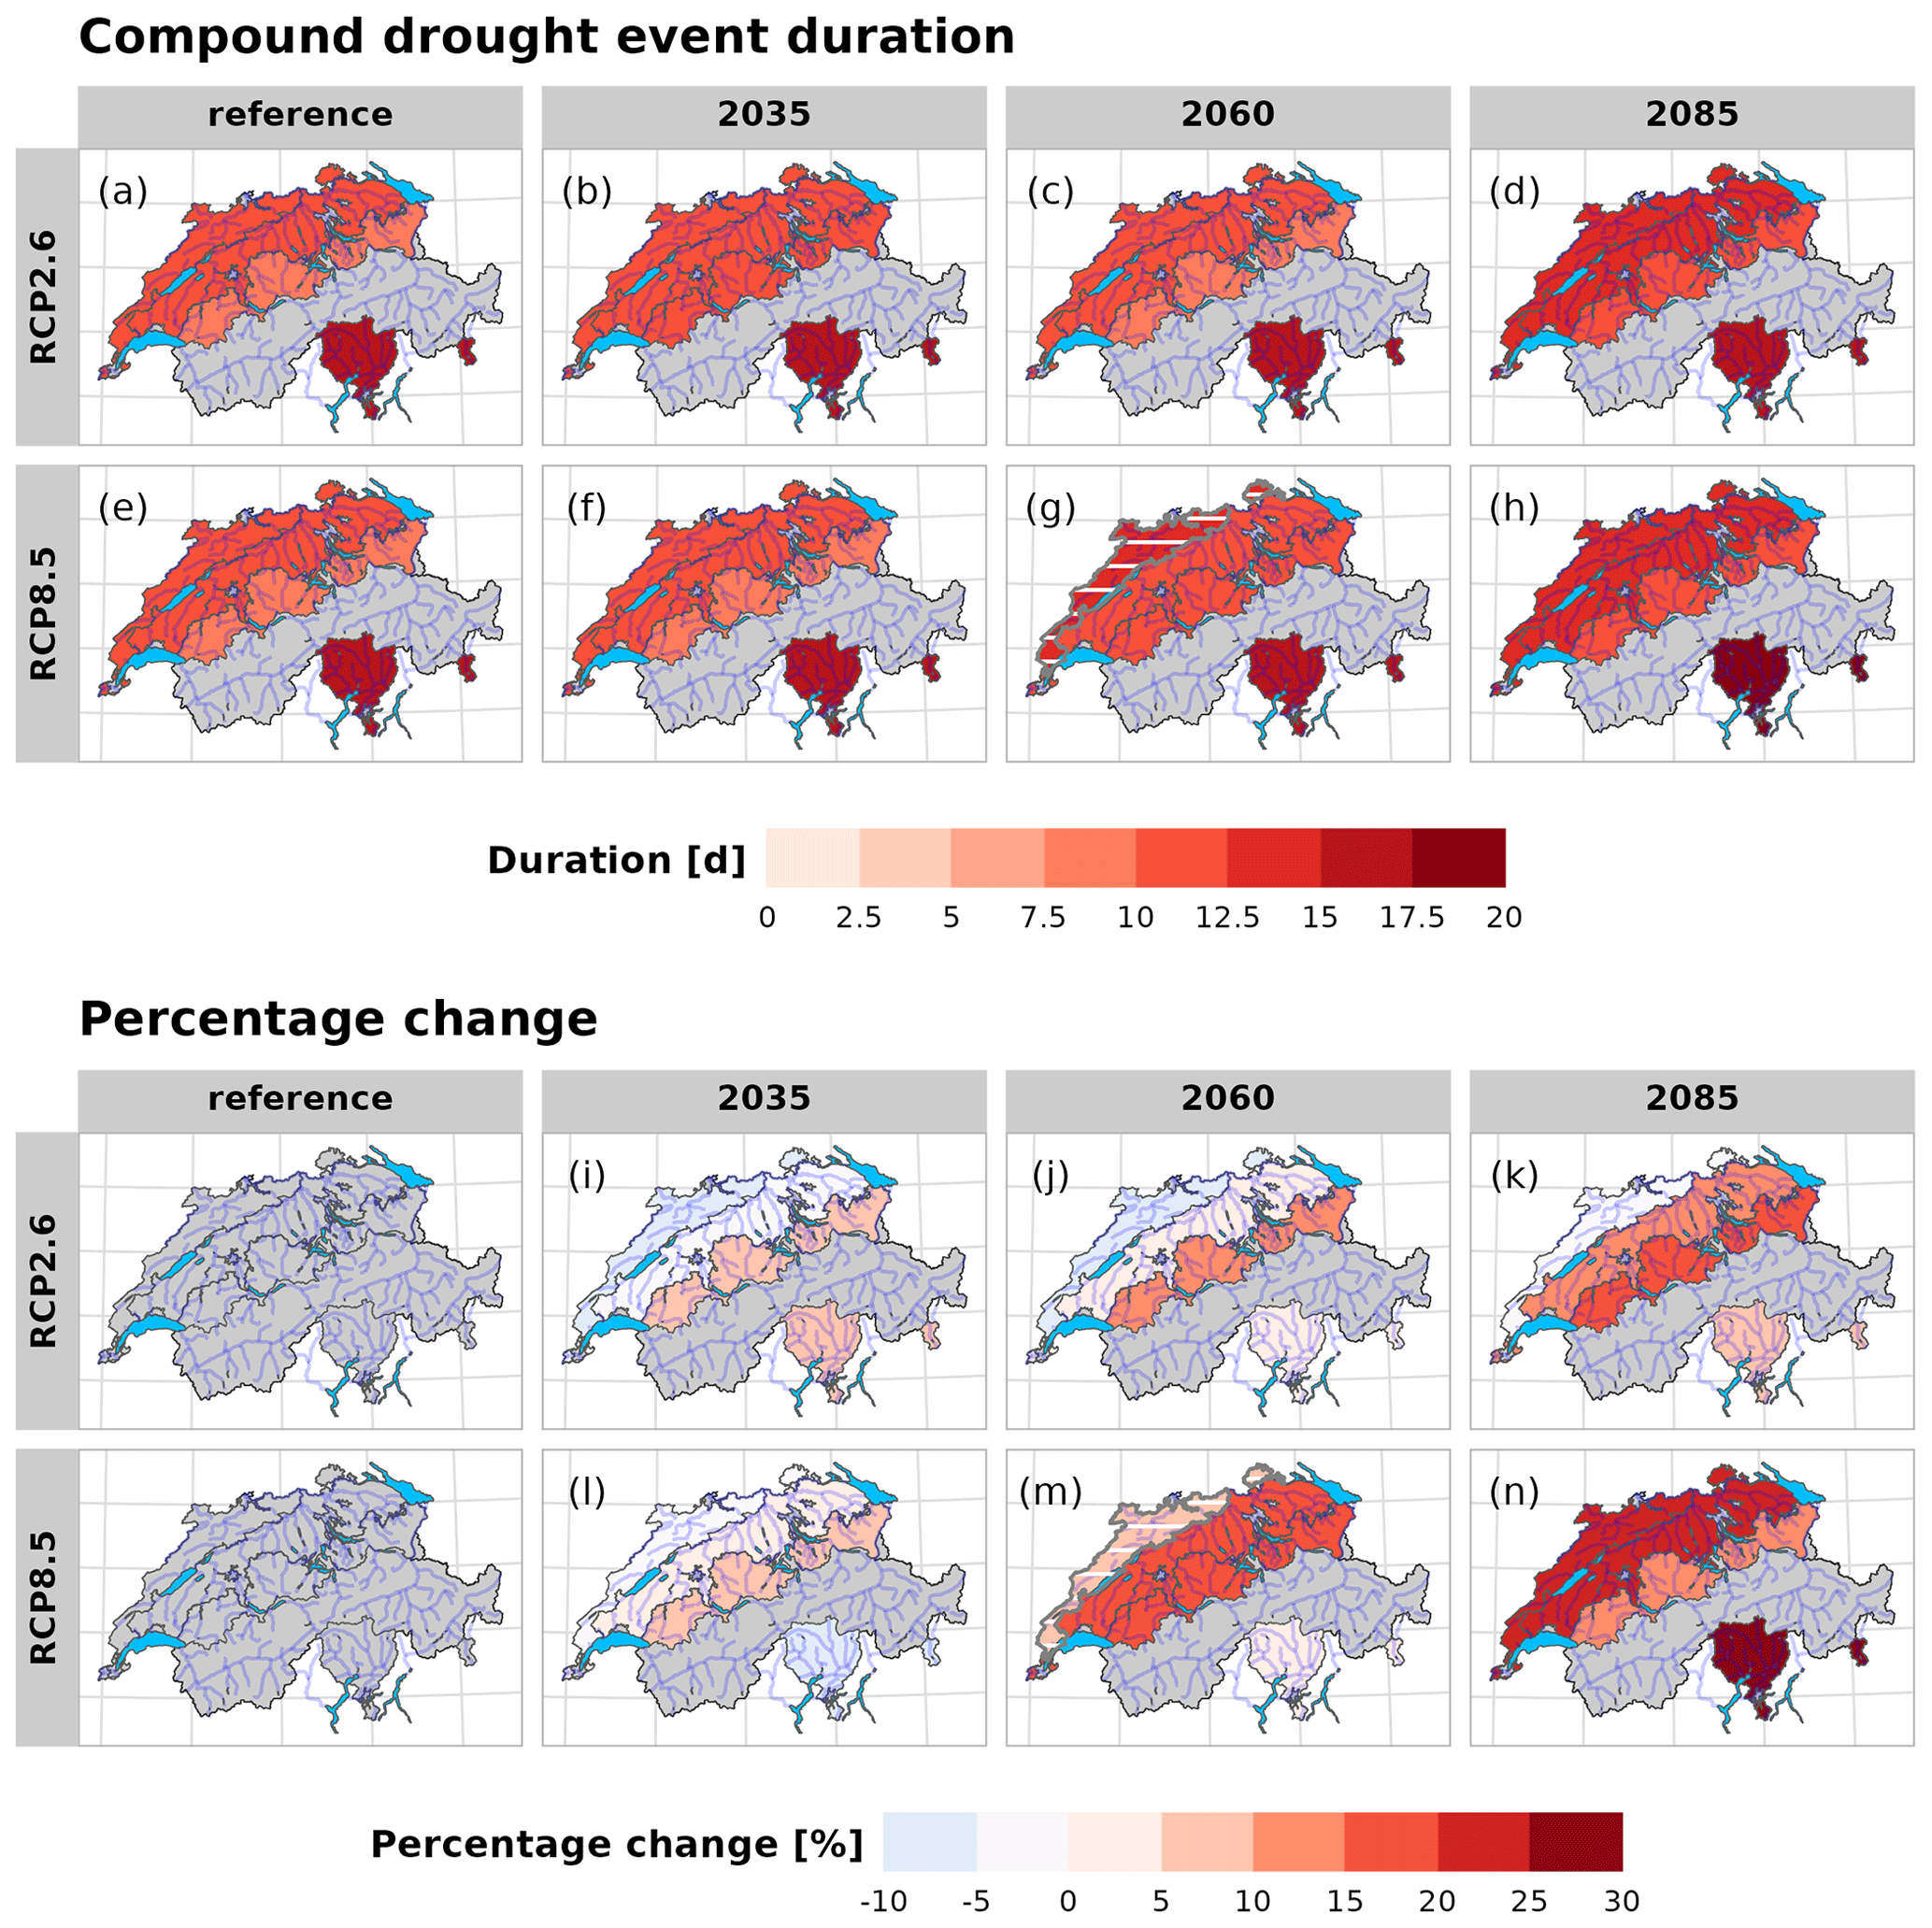
Figure 5Compound drought event duration per extended summer season and projected changes under climate change for the mitigation (RCP2.6) and non-mitigation (RCP8.5) scenarios aggregated across the greater regions (median over all catchments). Presented are both the median value (a–h) and the percentage change (i–n) over all model simulations per scenario. Hatching indicates if changes are significant compared to the reference period (horizontal lines) and whether ≥ 90 % of model simulations agree on the projected changes (per scenario; vertical lines). Significance and model agreement were evaluated only on absolute values and are identical for both median values and percentage changes.
4.3 Compound drought event frequency (sample return period)
Compound drought events occur in the (multi-model) median every 2.1 years in the Jura, every 2.5 years in the Swiss Plateau region, and every 3.2 years in the pre-Alps in the reference period. In southern Switzerland an event occurs in median every 4.4 years (Fig. 6a, e). Projected changes in event frequency are consistent and significant. Both RCP2.6 and RCP8.5 show more frequent compound drought events (see Fig. 6). Projected changes in frequency, significance, and model agreement are smaller and less consistent under RCP2.6 (Fig. 6a–d). By 2085, a compound drought event is projected to occur in the (multi-model) median every 1.8 to 2 years north of the Alps, while events remain rarer in southern Switzerland with an event occurring slightly more often than once in 4 years (every 3.9 years) (Fig. 6d). This corresponds to an overall (multi-model) relative median increase of less than 50 % (Swiss Plateau: +42.2 %; Jura: +28.6 %; southern Switzerland: +12 %) except for the pre-Alps (+68.4 %) (Fig. 6k). Model agreement is higher for the pre-Alps, southern Switzerland, and the Swiss Plateau region with at least 75 % of models agreeing on more frequent events, whereas changes are more uncertain in the Jura region (only 62.5 % models show more frequent events).
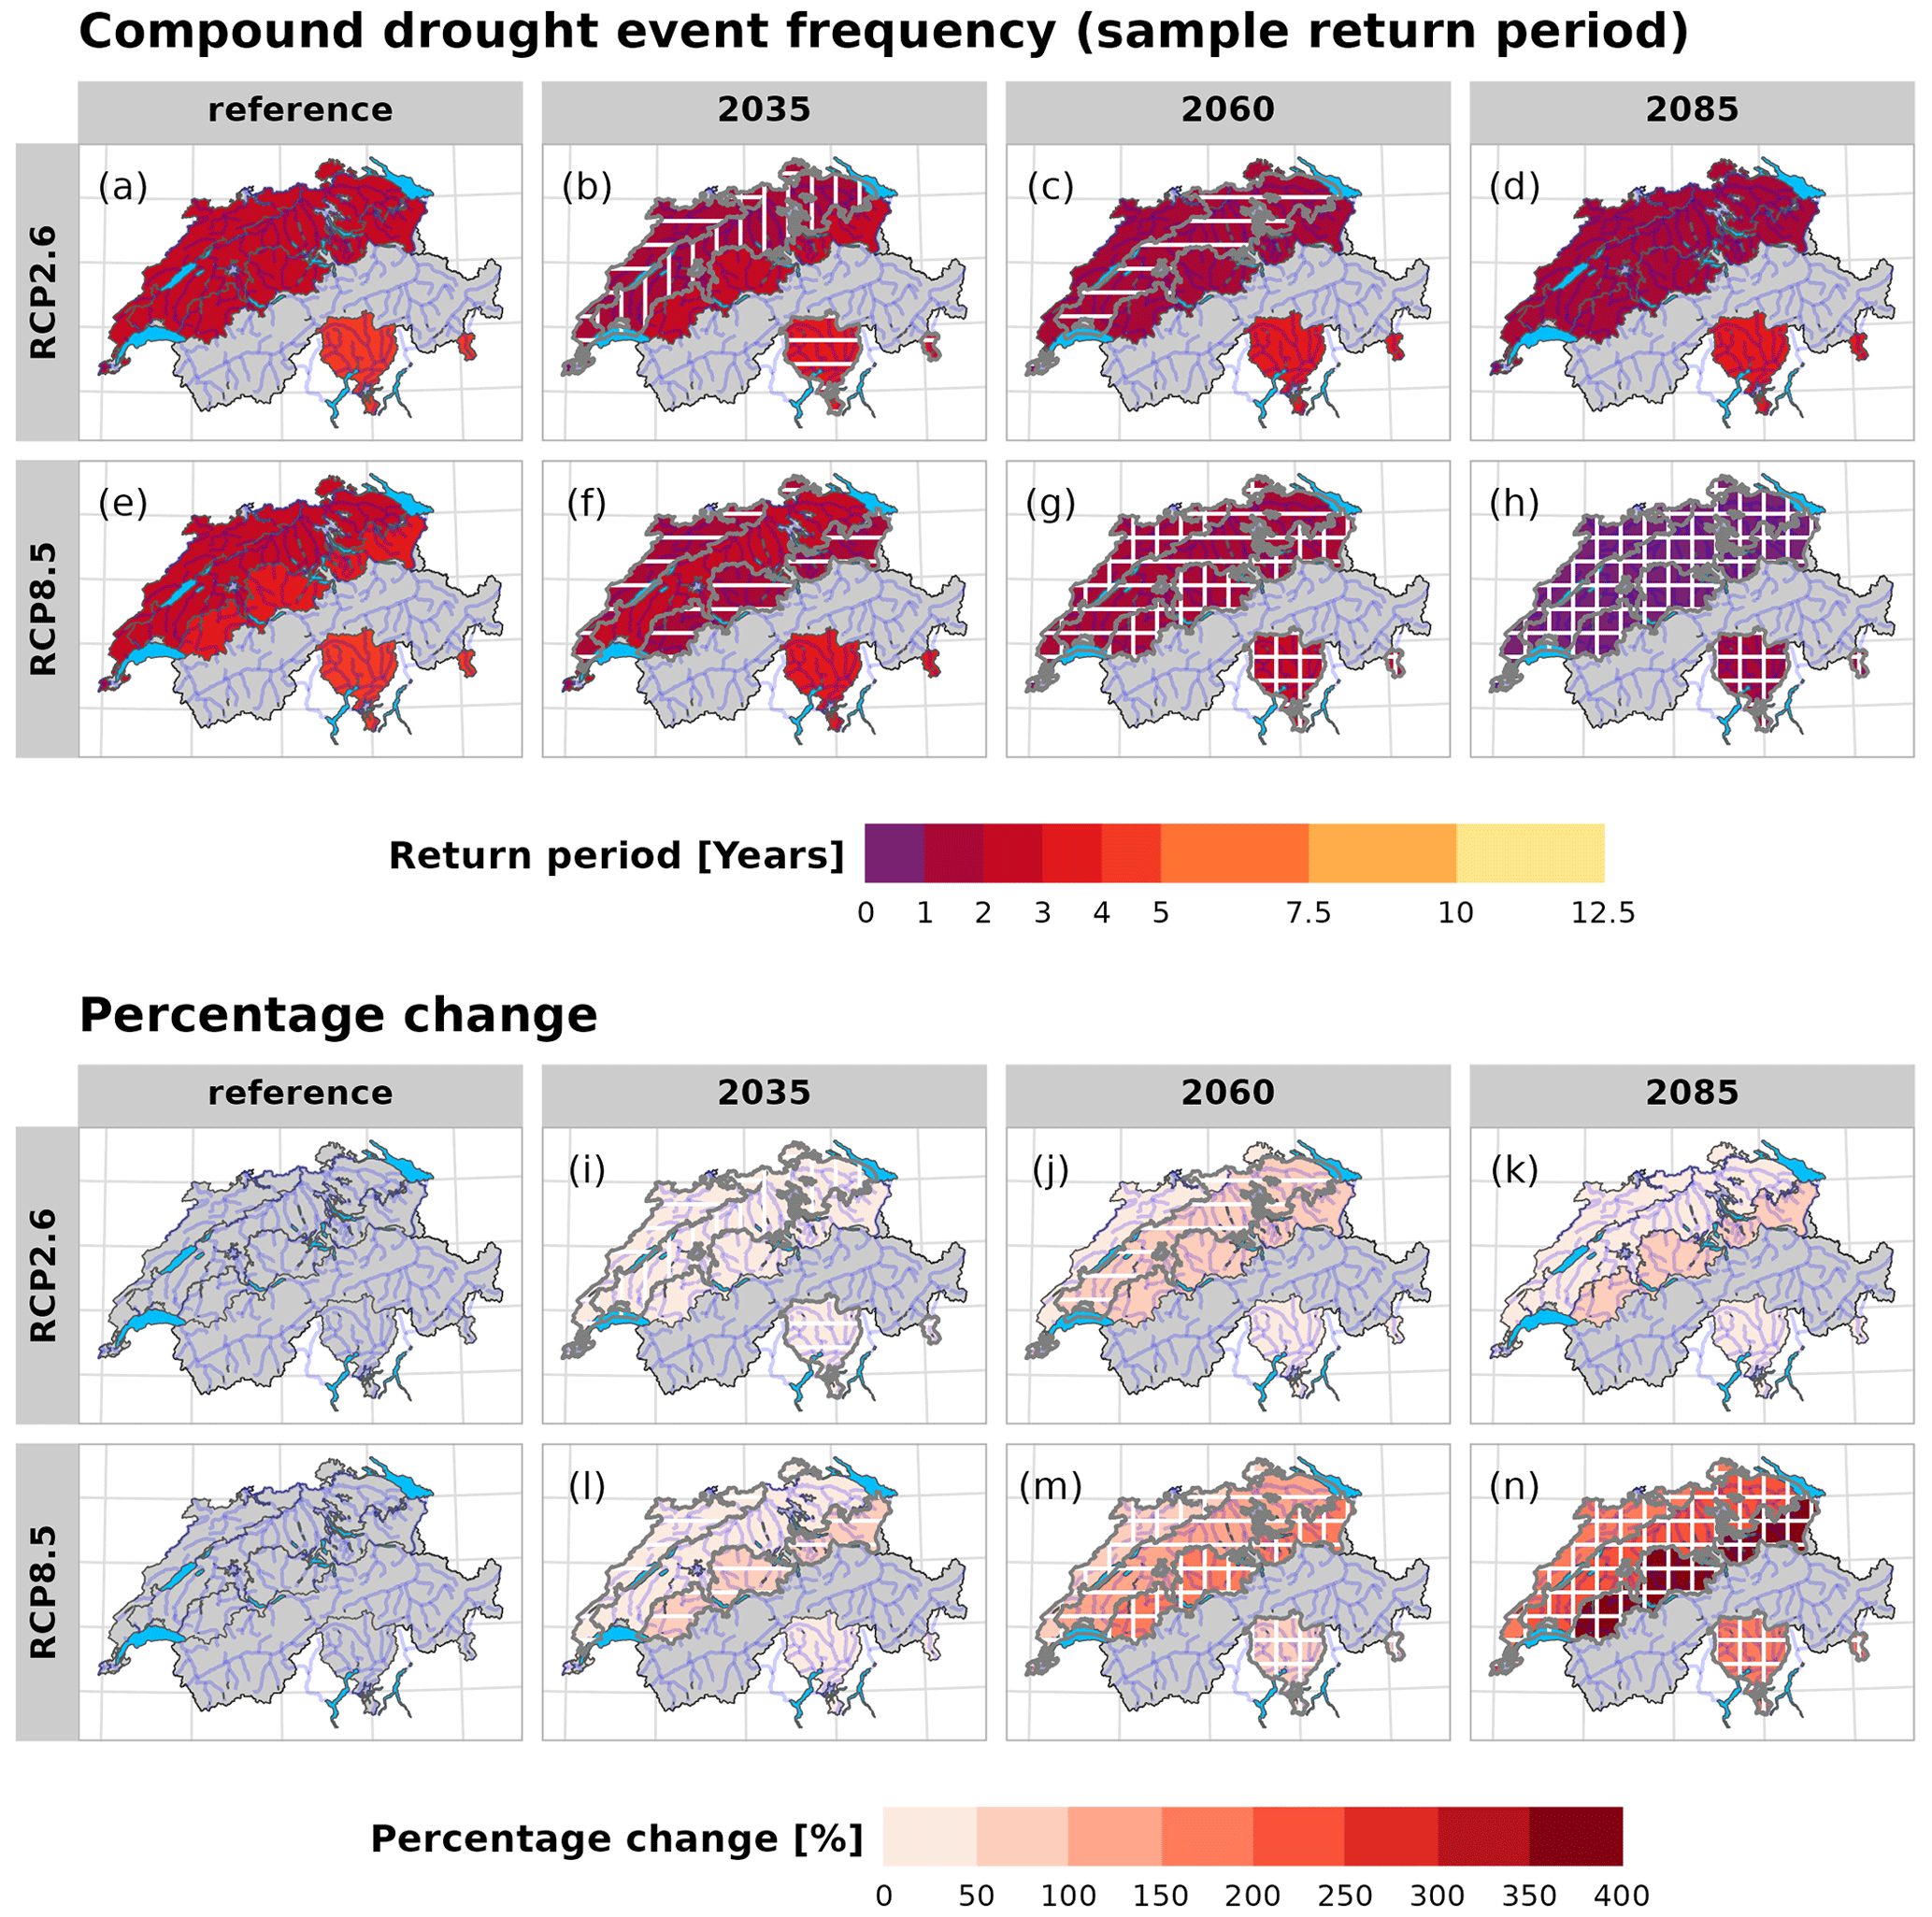
Figure 6Compound drought event return periods and projected changes under climate change for the mitigation (RCP2.6) and non-mitigation (RCP8.5) scenarios aggregated on the greater regions (median over all catchments). Presented are both the median value (a–h) and the percentage change (i–n) over all model simulations per scenario. Hatching indicates if changes are significant compared to the reference period (horizontal lines) and whether ≥ 90 % of model simulations agree on the projected changes (per scenario; vertical lines). Significance and model agreement were evaluated on absolute values only and are identical for both median values and percentage changes.
Under RCP8.5, projected increases in frequency become significant by 2035 for both the Jura and the pre-Alps with almost general model agreement in the pre-Alps (85 % of models agree) (Fig. 6f). By 2035, compound drought events are projected to occur in the (multi-model) median every 1.6 to 1.8 years in the Jura region and the pre-Alps, every second year in the Swiss Plateau region, and slightly more often than every 4 years (every 3.7 years) in southern Switzerland. This corresponds to 58 % more frequent compound drought events in the pre-Alps by 2035 (Fig. 6m). By mid-century, significantly more frequent compound events are projected in all greater regions, and models do generally agree in all regions but the Swiss Plateau region (Fig. 6g). Compound drought events are projected to occur every 1.25 years in the Jura region, every 1.3 to 1.4 years in both the Swiss Plateau and the pre-Alps, and every 2.7 years in southern Switzerland. This corresponds to an almost 3-fold (+178.7 %) increase in compound drought events in the pre-Alps and more than a doubling in the Swiss Plateau region (+113.3 %) in the (multi-model) median by 2060 (Fig. 6m). Percentage increases are lower for southern Switzerland (+71 %) and the Jura region (+62.9 %) where models show less than a doubling in frequency. With the more substantial and significant increase, the multi-model distributions between mitigation and non-mitigation scenarios also begin to differ more clearly by mid-century and become significantly different by the end of the century for all greater regions (Fig. 6h). A compound drought event is projected to occur at least once per extended summer season in regions north of the Alps, with the highest frequencies in the pre-Alps (median 1.43 events every 0.7 years) and slightly lower frequencies in the Swiss Plateau (1.28 events every 0.77 years) and Jura (1.13 events every 0.88 years) regions (Fig. 6h). In catchments in southern Switzerland, compound events are projected to occur in median in almost 3 out of 4 years (0.73 events every 1.36 years), which is less compared to north of the Alps but still represents a major increase compared to the reference period. Projected multi-model percentage increases are the strongest in the pre-Alps with around 4.5 times (+352.7 %) more frequent events, followed by 3.5 times more frequent events in the Swiss Plateau region (+248 %) and approximately 3 times more frequent events in southern Switzerland (+188 %) (Fig. 6n). In the Jura region, the increase corresponds to 2.5 times more frequent events (+153 %).
4.4 Seasonality
In the reference period, the seasonality of compound drought days is similar among all regions north of the Alps, with peak occurrence probabilities between mid-July and mid-September (Fig. 7a–c, e–g). Under RCP8.5, the probability density distributions are flatter, and higher probabilities for compound drought day occurrence extend to the beginning of October (Fig. 7e–g). Compound drought events are more evenly distributed across the summer months in the Jura region compared to the other regions, especially under RCP2.6. By 2085 and without mitigation, the probability of compound drought day occurrence increases mainly between mid-August to mid-September but remains generally high in the entire period from July to mid-October (see Fig. 7e–g). In contrast, a decrease in probability density is projected starting towards the end of the extended summer season in autumn and extending through winter to mid-March. Overall, projected changes under RCP8.5 lead to a more pronounced seasonality of compound drought days with higher occurrence probabilities in the critical summer months and early autumn (July–September; see e.g. Fuhrer and Jasper, 2009). The analysis of absolute frequencies of compound drought days indicates that the shift in seasonality is caused by a combination of decreases outside and increases within the extended summer season (not shown). Projected changes under RCP2.6 show similarities with changes under RCP8.5 (e.g. decrease outside of the extended summer season) but are generally not sufficiently consistent or evident (Fig. 7a–c).
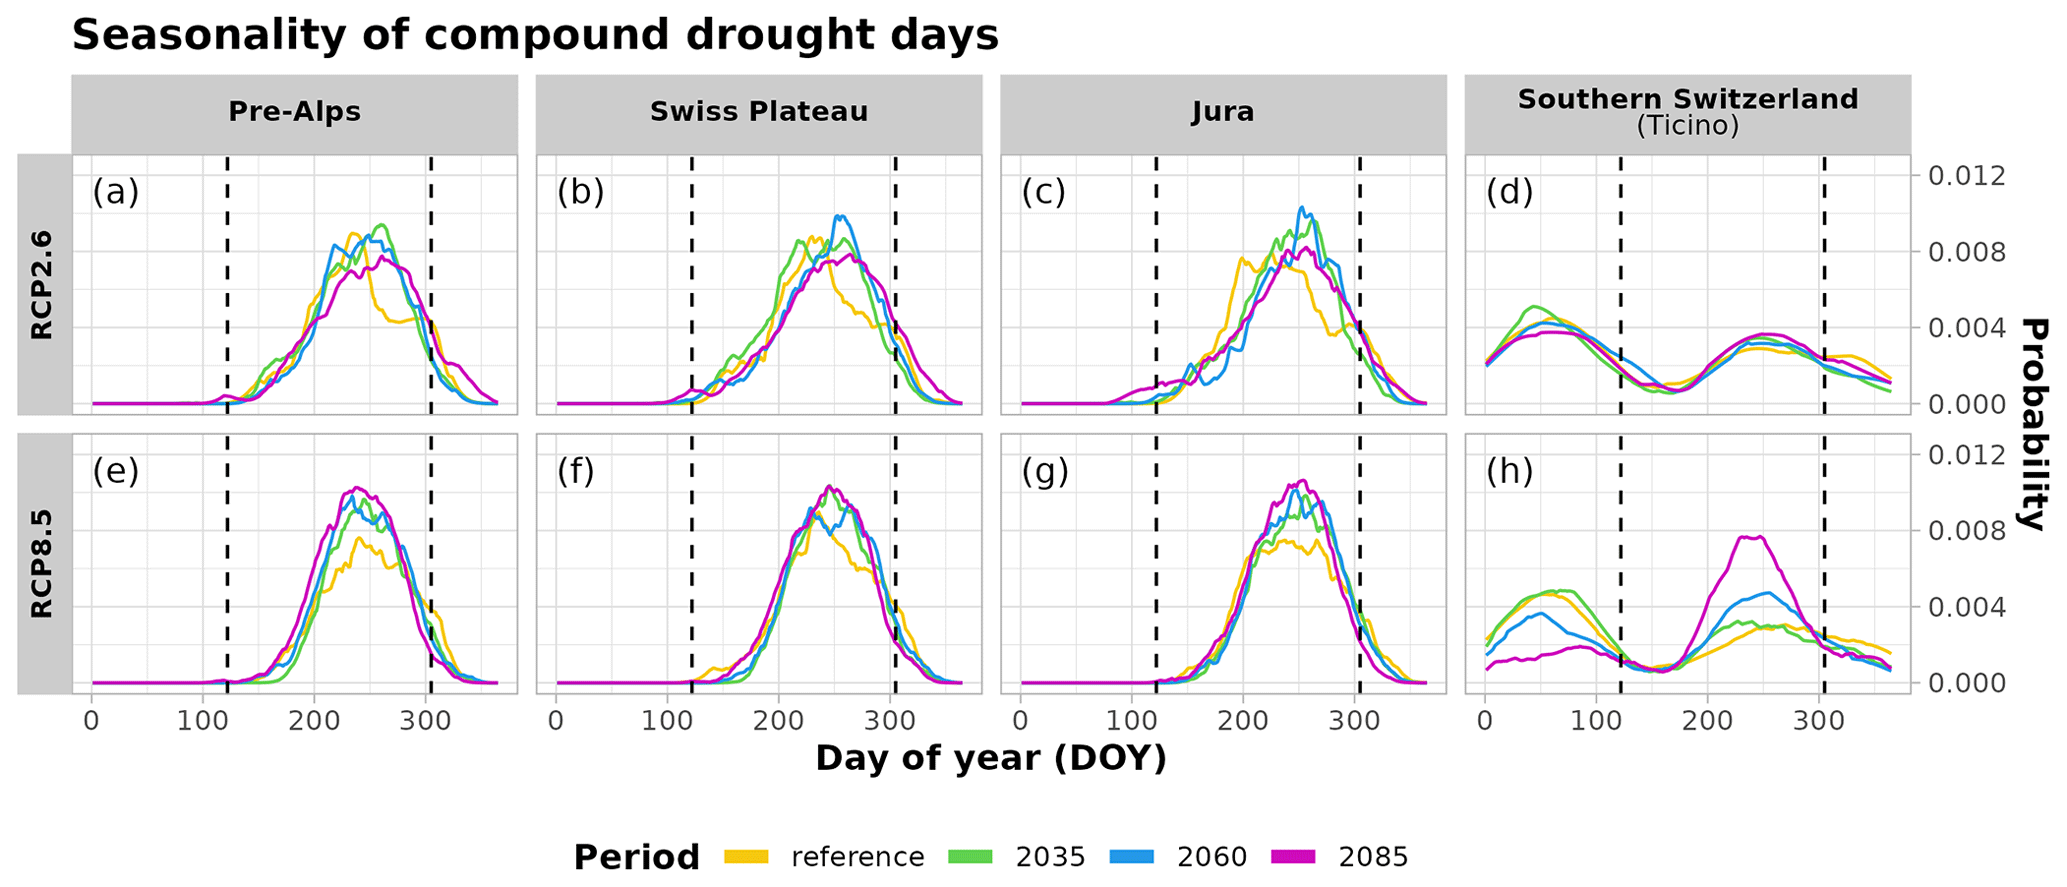
Figure 7Seasonality of compound drought days. Shown is the median value aggregated over all catchments per greater regions and day of year (DOY) (lines). Probability density distributions are shown for both the mitigation (RCP2.6) and the non-mitigation (RCP8.5) scenarios for the reference periods of 2035, 2060, and 2085 (coloured). The dashed lines indicate the extended summer season from (the beginning of) May (DOY 122) to (the end of) October (DOY 305).
In southern Switzerland the seasonality of compound drought days is distinctly different from the regions north of the Alps (Fig. 7d, h) following the bi-modal seasonality of hydrological droughts with periods of higher probability both in summer and in winter (not shown; see e.g. Muelchi et al., 2021b). A first period with high probability of compound drought occurrence ranges from the beginning of January to mid-April with the probability peaking around mid-February. A second period of higher probabilities of occurrence starts approximately in mid-July and extends towards the end of the year. Overall, more than 50 % of compound drought days occur outside of the extended summer season. Compared to regions north of the Alps, compound drought days in southern Switzerland are generally more equally distributed across the year, and the peak probabilities in the extended summer season are consequently less pronounced (Fig. 7d, h). Under RCP8.5, the probability of compound drought day occurrence strongly increases between the beginning of July and end of September, while strong decreases are projected outside of the extended summer season, most prominently between January and mid-April (Fig. 7h). Both decreases outside and strong increases within the extended summer season will lead to a gradual reversal of the bi-modal seasonality distribution towards the end of the century (Fig. 7h). For southern Switzerland, the absolute compound drought day frequencies indicate that the changes are more strongly driven by increases in frequency during the extended summer season, and decreases in absolute frequencies outside of the extended summer season first become evident by the end of the century (not shown). Without mitigation, compound drought day occurrence is projected to become most probable from the beginning of mid-July until the beginning of October, and this shift becomes more aligned with the seasonality of regions north of the Alps. Again, similarities exist under RCP2.6 but remain less evident (Fig. 7d).
5.1 Median number of simultaneously affected catchments
In the reference period, more than 10 catchments are simultaneously affected in about 20 % (RCP8.5) to 24 % (RCP2.6) of all compound drought days (Fig. 8b). The number of simultaneously affected catchments per compound drought day is projected to increase in the future. The increase is more pronounced in the non-mitigation scenario, RCP8.5 (Fig. 8a). By 2085 and without mitigation, in median on 46 % of days at least 10 catchments are simultaneously affected by compound drought conditions, on 27 % of days at least 20 catchments, and on 5.8 % of days more than 40 catchments (Fig. 8b). The projected increase in the median number of catchments simultaneously affected by compound drought conditions is also reflected in the distributions over all drought days (see Fig. 8a). In the reference period, four to five catchments are simultaneously under compound drought conditions. Under RCP8.5 the number of simultaneously affected catchments in the near future (2035) increases to six, and the increase is significant. However, only 55 % () of models agree on an increase. Model agreement gradually increases and reaches general model agreement (95 %) by the end of the century (Fig. 8a). By 2085, in median 8.5 catchments are projected to be simultaneously under compound drought conditions on a compound drought day. Note that the possible range of projected increases is large (min–max: 6–25 catchments; Fig. 8a). Comparing both mitigation and non-mitigation scenarios, multi-model distributions are however not significantly different for all periods (Fig. 8a).
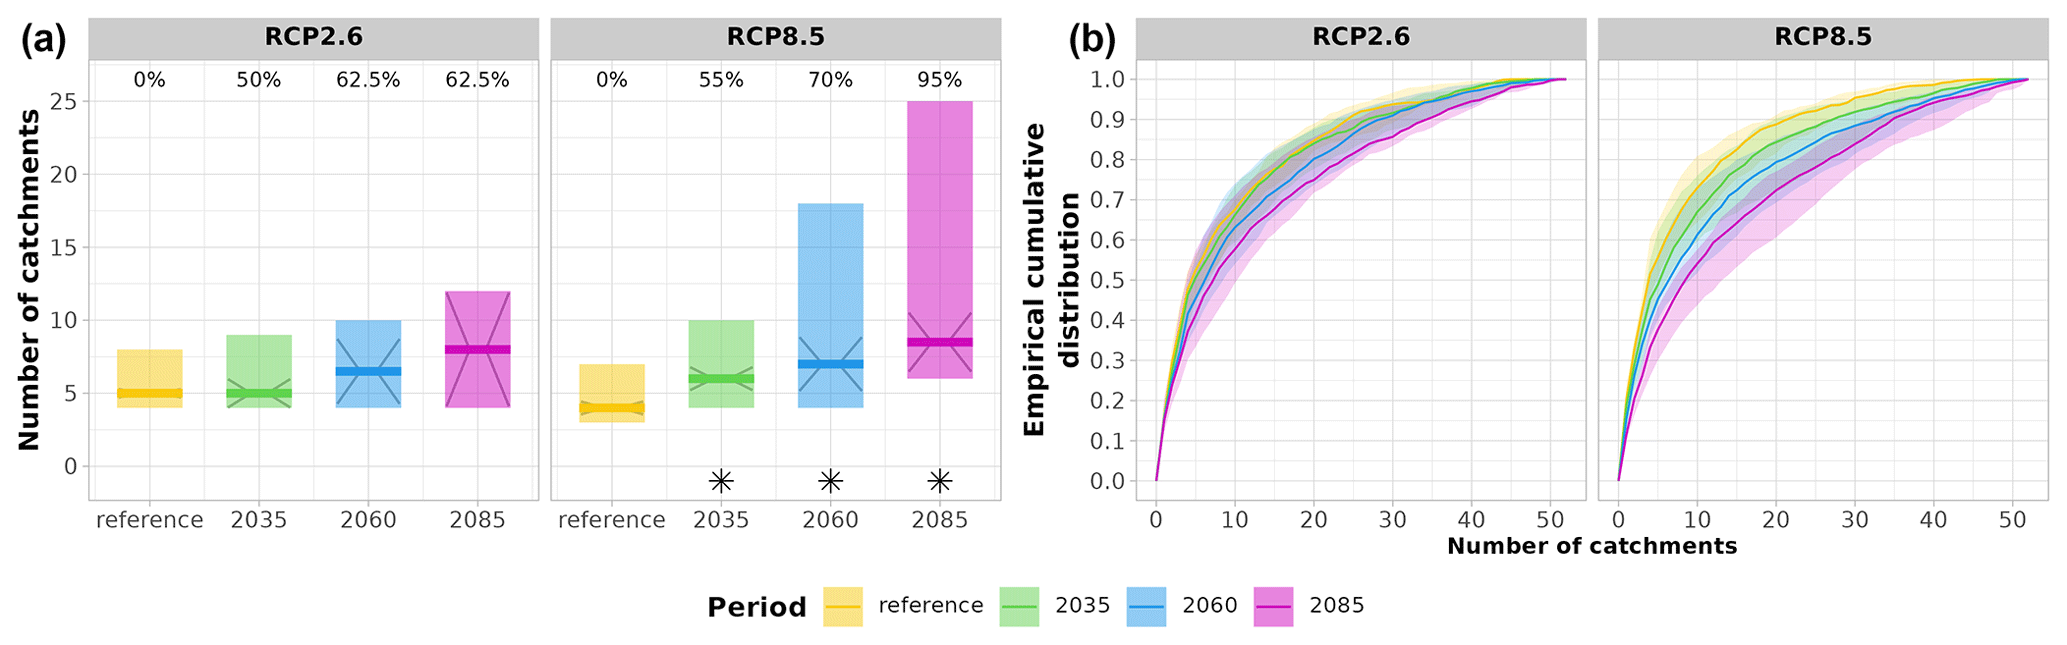
Figure 8Spatially compounding droughts and catchments simultaneously affected by compound drought conditions. (a) Median number of catchments simultaneously affected by compound drought conditions on a specific compound drought day and projected changes under climate change. Colour shading indicates the full range of (median) realizations (min–max). The median over all model simulations is indicated by the thick colour lines. Confidence intervals (CIs; see Sect. 3.3) of the median are shown with diagonal lines originating from the centre of the median. Significance based on strict non-overlapping of CIs is indicated by the asterisks. Model agreement is shown in percentage values on top. (b) Cumulative distribution of the number of catchments simultaneously affected by compound drought conditions on a specific compound drought day. Colour shading shows the interquartile range of cumulative distributions over all model simulations per scenario. Shown are distributions for both mitigation (RCP2.6) and non-mitigation (RCP8.5) scenarios and the 2035, 2060, and 2085 periods.
5.2 Event duration and maximum number of simultaneously affected catchments
As for spatially compounding days, most events affect at most 10 or fewer catchments (see Fig. 9). The median number of spatially compounding events is comparable among scenarios and does not differ by more than 10 % in most cases. Exceptions are shorter events affecting less catchments where 22.6 % more events are simulated under RCP8.5 and events affecting between 30–40 catchments simultaneously (+42.9 % more events under RCP8.5). Events potentially affecting all greater regions simultaneously occur in median only 2 times per model in the entire time series of 1991–2100 under RCP2.6 and approximately 2.5 times more (5 times) under RCP8.5 (Fig. 9). In scenario-driven simulations, spatially compounding events affecting at most 10 catchments simultaneously last 9 d in median, and with approximately 2 weeks (12–14 d) of persistence, 10 additional catchments transition into compound drought conditions (Fig. 9). Under RCP8.5, events tend to be longer in median. The distributions do however not significantly differ in median from RCP2.6 for events affecting at most more than 20–40 catchments. Differences in median exist for events affecting at least three greater regions (40–48 catchments) simultaneously with events lasting in median 56 d under RCP2.6 and 66 d under RCP8.5. More pronounced are differences for events affecting all greater regions and thereby potentially affecting the entire Switzerland (48–52 catchments). Potentially countrywide events may persist in median for 65.5 d under RCP2.6 and almost 40 % longer under RCP8.5 with a median event duration of 91 d (Fig. 9). Hence, there is an indication that spatially compounding drought events may potentially last longer without mitigation or that more and potentially longer countrywide events may occur in the future.
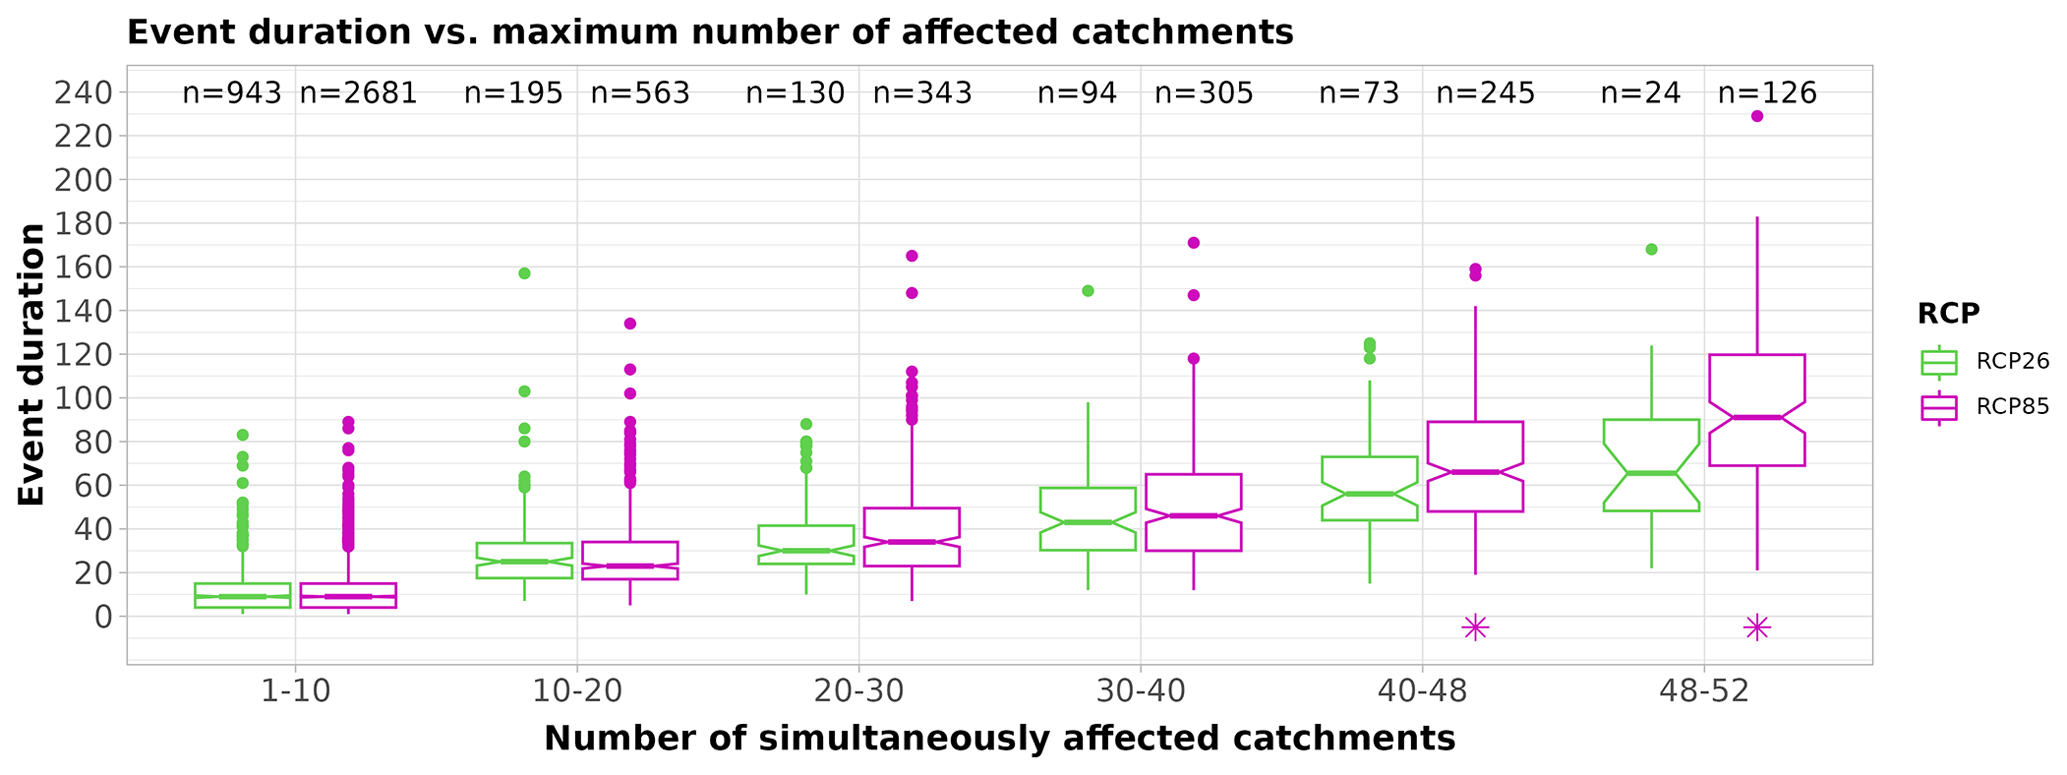
Figure 9Spatially compounding drought events, event duration, and maximum number of catchments simultaneously affected by compound drought conditions. The boxplots show the distributions of event durations conditional on the maximum number of simultaneously affected catchments for both the mitigation (RCP2.6) and the non-mitigation (RCP8.5) scenarios. Significant differences are indicated with the asterisks. Significance was assessed by comparing confidence intervals of the median (notches; see Sect. 3.3) of RCP8.5 median distributions with CIs of RCP2.6 distributions for each range of simultaneously affected catchments. Number of events contributing to distributions is indicated by n=.
Changes in individual drought types have been found for meteorological droughts (CH2018, 2018; Kotlarski et al., 2023; Scherrer et al., 2022), agricultural droughts (CH2018, 2018; Remund et al., 2016; Tschurr et al., 2020; Calanca, 2007), and hydrological droughts (Brunner et al., 2019b; Brunner and Tallaksen, 2019; Muelchi et al., 2021b; Brunner et al., 2023). This study shows that the concurrent occurrence of all three drought types is also projected to increase significantly under climate change in all regions of Switzerland. The simultaneous deficit of water in the atmosphere, soils, and rivers may aggravate impacts of droughts. Compound drought characteristics resemble characteristics of the hydrological drought which occur least frequently among individual drought types and may be a limiting factor for compound drought events. This is most prominent for seasonality, the number of compound drought days, and event frequency. However, the relative differences among greater regions weaken by the end of the century as the seasonality aligns across all greater regions, and more days and more frequent events occur in absolute terms. A difference from hydrological droughts exists for event duration with longer compound drought event durations in catchments in north-western Switzerland and especially in southern Switzerland. In southern Switzerland, compound drought events occur 40 %–50 % less frequently but last 45 %–77 % longer compared to northern Switzerland. The longer duration of compound droughts may be a result of higher event frequencies and longer event duration in agricultural drought in both southern Switzerland and the Jura region. The differences among greater regions are generally consistent with other studies showing that the Jura and Swiss Plateau regions and southern Switzerland are more strongly affected by projected changes in drought conditions (Brunner et al., 2019a; Hirschi et al., 2020; Kohn et al., 2019; Tschurr et al., 2020; Walthert et al., 2015). Further, catchments with the largest numbers of compound drought days or event frequencies are also found to be prone to water scarcity in other studies (Brunner et al., 2019a; Fuhrer and Jasper, 2012; Fuhrer and Calanca, 2014; Lanz, 2020). Given that in extreme summers (e.g. 2003, 2018) many catchments do already face water scarcity (Brunner et al., 2019a) and that our results are in line with other studies, we hence consider our results plausible. This holds true especially as extreme summers at present are projected to become more average with no mitigation in the future (Imfeld et al., 2022a, b; Calanca, 2007).
Our findings regarding the more widespread occurrence of (spatially compounding) compound droughts in the future are likely related to the general alignment of seasonality in compound droughts in Switzerland (see Sect. 4.4). Compound drought seasonality appears strongly linked to streamflow regimes, which further underlines that aggravation of water scarcity or resulting challenges in water management are also related to streamflow regimes (Brunner et al., 2019a; Fuhrer and Calanca, 2014). Streamflow transitioning towards more lowland characteristics is projected in the pre-Alps as a reaction to earlier snowmelt and less snowmelt contribution (Brunner and Tallaksen, 2019; Muelchi et al., 2021b). Although we restricted our analysis to lower-lying catchments with limited snow influence, this shift is visible especially for pre-Alpine catchments closer to the main Alpine ridge covering large elevation ranges. For the other regions a pronounced seasonality comprising the critical summer months and early autumn (July–September) is visible by 2085 under RCP8.5 and is consistent with projected changes in streamflow regimes and characteristics of individual droughts (see e.g. BAFU, 2021; CH2018, 2018; Hirschi et al., 2020; Remund et al., 2016; Walthert et al., 2015; Brunner et al., 2019b; Muelchi et al., 2021b). Further, the relationship between the duration of spatially compounding drought events and the number of simultaneously affected catchments is also consistent with the principles of spatial drought propagation (spatial spreading of droughts): the longer an event persists, the more catchments gradually experience compound drought conditions simultaneously due to catchment-specific response times to the drought signal (Fig. 9; see e.g. Van Loon and Van Lanen, 2012; Apurv and Cai, 2020; Tijdeman et al., 2022; Van Loon et al., 2014; Ho et al., 2021; Zhang et al., 2022; Sutanto and Van Lanen, 2022; Van Loon and Laaha, 2015). Drought projections based on climate–hydrological model chains contain major sources of uncertainty, which should be considered when interpreting the results of this study. This includes choices of model ensembles, (hydrological) model setup (including calibration and validation procedures), the representation of land–atmosphere interactions (e.g. plant-physiological processes), choice of drought index, multi-decadal variability, drought propagation, and catchment storage properties (Arias et al., 2021; Berg and Sheffield, 2018; Brunner et al., 2021; Lehner et al., 2017; Miralles et al., 2019; Orlowsky and Seneviratne, 2013; Scherrer et al., 2022; Vicente-Serrano et al., 2022). Current hydrological model calibration and validation mostly rely on calibration and validation metrics designed for specific applications (e.g. flood situations, Brunner et al., 2021). The Hydro-CH2018 hydrological scenarios use a multi-objective calibration scheme also accounting for the representation of low-flow conditions (see Sect. 2; see also Muelchi et al., 2022). See Table B1 in Appendix B for validation metrics (NSElog and KGElog) indicative of the representation of low-flow conditions for all catchments. We use standard indices for both meteorological and agricultural droughts and a widely used streamflow index closely related to water regulations in Switzerland. However, establishing direct links between drought indices and drought impacts is still challenging due to the scarcity of impact data and the extended duration of drought events, which make associations of impacts more challenging (Bachmair et al., 2016; Kchouk et al., 2022; Merz et al., 2020). Recent research on impact-relevant soil moisture thresholds and cumulative water deficits may lead to more consistent agricultural drought definitions in the future (Denissen et al., 2020; Fu et al., 2022b; Stocker et al., 2023). Implementations of evaporative responses vary among hydrological models and can have an influence on climate change projections (Melsen and Guse, 2019). Recent findings indicate that (agricultural) drought projections that use temperature-only-based estimations of PET result in the overestimation of future drying (Berg and Sheffield, 2018; Milly and Dunne, 2017, 2016). Comparisons of our simulations with hydrological simulations based on Penman–Monteith parameterization conducted with the same model (PREVAH) did however not show significant differences (Regula Muelchi, personal communication, 2023), and projected changes do not deviate substantially (BAFU, 2021). Markonis et al. (2021) further highlight that (agricultural) drought conditions are driven by actual evapotranspiration rather than solely by PET and are thus dependent on actual (soil) water availability and plant evaporative responses. By incorporating actual ET, a measure of actual water availability is included by using ET / PET (Fuhrer and Jasper, 2009). The validation of soil moisture and evapotranspiration is however often challenging due to limited availability of long-term observational data (Haile et al., 2020; Mukherjee et al., 2018; Hirschi et al., 2020). Agricultural droughts relying on soil moisture or evaporation data derived from hydrological model simulations driven by meteorological forcing data must thus generally be interpreted with caution (Mukherjee et al., 2018). However, we emphasize that PREVAH has shown to be able to represent the water balance of Switzerland. PREVAH has been used in similar water scarcity studies (Brunner et al., 2019a, and sources therein) and has also performed well in extreme situations outside of observational ranges (Zappa and Kan, 2007).
To validate of our results for the investigated multivariate compound drought characteristics, the hydrological control simulation driven by observations (CTRL) was used and compared with the multi-model median ranges (see Supplement). Characteristics derived from CTRL were mostly within the range of our model ensemble, and, if not, deviations were generally small with values of the same order of magnitude. CTRL-run characteristics were generally better aligned with RCP8.5 multi-model distributions. Direct comparisons with observations and information on uncertainty in both Hydro-CH2018 and CH2018 datasets regarding SPI and streamflow can be found in Tschurr et al. (2020) and Muelchi et al. (2022). For agricultural drought, comparisons with studies using a similar approach with either the same hydrological model and a different measure for water demand or vice versa revealed comparatively good agreement in both orders of magnitude of drought characteristics (see e.g. Fuhrer and Jasper, 2009; Walthert et al., 2015) and spatial patterns (see Brunner et al., 2019a; Fuhrer and Jasper, 2012, 2009; Hirschi et al., 2020; Remund et al., 2016; Walthert et al., 2015) given the associated uncertainties and in most cases limited comparability of our catchment-scale data to field-scale or point-location data. Also note that Fuhrer and Jasper (2009) showed that their threshold of ET / PET values for agricultural land are close to the threshold level of ET / PET < 0.8 at present and are comparable to our catchment level average ET / PET values. Here, we analysed ET / PET on the catchment level, which does not explicitly target a specific land use. At present much agricultural land in Switzerland already regularly falls below the critical threshold for several weeks or even months, and average ET / PET values are projected to be considerably lower under a non-mitigation scenario in the future (Allgaier Leuch et al., 2017; Remund et al., 2016; Walthert et al., 2015). An analysis targeting specific land use types (e.g. agricultural land) could consequently lead to more severe compound drought projections than reported here. Also, we do not account for distance to surface waters, which can make irrigation by surface-water abstraction unprofitable.
Van Loon (2015) suggest that the combined occurrence of agricultural and hydrological droughts without meteorological drought conditions is sufficient for impacts on irrigated agriculture. We also conducted a brief analysis on this type of compound drought event. Our analysis shows that combined agricultural and hydrological drought characteristics are qualitatively similar to the results discussed here, but the absolute number of compound drought days and event frequency is higher and events last longer (see Supplement).
The main goal of this study was to assess characteristics of compound droughts and changes under climate change. We therefore mainly grouped catchments by similarity of streamflow regime types and did not explicitly consider spatial proximity or catchment connectivity. Future studies on compound drought events and impacts on water management may focus on specific source regions relevant for water management actions. Further, hydrological catchments have been calibrated independently of each other but can in some cases be part of a larger catchment (Muelchi et al., 2022). Future studies could thus also investigate the temporal evolution of spatially compounding droughts and their downstream propagation behaviour by hydrological simulations of coupled (sub-)watersheds and/or by accounting for spatial connectivity by incorporating a spatial calibration/validation metric (Brunner et al., 2021).
A limitation of the present hydrological model simulations of the Hydro-CH2018 runoff ensemble is that they assume stationarity in many influence factors such as land cover, land use practices, and catchment storage characteristics (Savelli et al., 2022; Brunner et al., 2021; Melsen and Guse, 2019). Changes in drought propagation characteristics (e.g. onset and recovery) are likely to occur with climate change due to (projected) changes in catchment properties, drought-generating processes (Mukherjee et al., 2018; Zhang et al., 2022; Brunner and Tallaksen, 2019; Brunner et al., 2023), and climate characteristics (e.g. precipitation frequency and intensity; CH2018, 2018; Kotlarski et al., 2023; Tschurr et al., 2020; Eekhout et al., 2018). Implementations of drought-triggering processes vary among hydrological models, and important storage variables are often parameterized (Melsen and Guse, 2019; Brunner et al., 2021). Assumptions on (fixed) (maximum) storage volumes used in hydrological models are equivalent to an implicit limitation on deficit accumulation. Redesigned soil moisture storage implementations could therefore lead to more realistic hydrological model projections in the future (Fowler et al., 2021). Improved realism in projections is of utmost importance with regard to recent studies highlighting the potential for shifts in catchment-specific rainfall–runoff relationships usually caused by (prolonged) multi-year droughts (Fowler et al., 2022; Brunner and Tallaksen, 2019; Saft et al., 2015). Consequentially, climate risk assessments based on hydrological model projections might underestimate the future hydro-climatic risk concerning reductions in water supply (Fowler et al., 2022). More research and a better understanding of key processes, storages and human interactions, and their representation in hydrological models and their influence on characteristics of drought events and propagation characteristics are therefore crucial for future climate change assessments, which optimally rely on multi-hydrological climate ensembles (see e.g. Melsen and Guse, 2019), account for non-stationarity (see e.g. Brunner et al., 2021), and possibly make use of climate scenarios of the Coupled Model Intercomparison Project Phase 6 (CMIP6; Eyring et al., 2016) and shared socioeconomic pathways (SSPs; O’Neill et al., 2014).
Compound droughts, defined here as concurrent meteorological, agricultural, and hydrological droughts, pose a challenge to the water management in Switzerland because the water abstraction from rivers is limited during low-flow periods, and farmers need water for irrigation during agricultural drought conditions. We analyse projected changes in the frequency, duration, and spatial extent of compound droughts using data from numerical climate model simulations (CH2018, 2018) and hydrological model simulations (Hydro-CH2018, Muelchi et al., 2022) for 52 catchments in Switzerland. We compare ensemble projections based on an emission scenario with mitigation (RCP2.6, 8 model chains) and an emission scenario without mitigation (RCP8.5, 20 model chains). The key findings are as follows:
-
The number of days with compound meteorological, hydrological, and agricultural droughts in Switzerland is projected to increase significantly by the end of the 21st century in an emission scenario without mitigation in all greater regions of Switzerland. There is broad agreement among the model simulations on the sign of the change. The number of days with compound meteorological, hydrological, and agricultural droughts in Switzerland does not increase significantly by the end of the 21st century in an emission scenario with mitigation. With mitigation the number of compound drought days is reduced by 50 %–55 % north of the Alps and by up to 75 % in the Southern Alps, pointing to the importance of mitigation.
-
The number of days with compound droughts increases predominantly during the extended summer and hence the main agricultural production season.
-
The increase in the number of compound drought days is driven by an increasing number of events (significant increase) rather than by longer-lasting events (no significant change). Across all model chains compound drought events are projected to occur on average once per summer in the catchments on the north side of the Alps and once every one to two summer seasons in the catchments on the south side of the Alps.
-
Coupled to the projected increasing number of compound drought days, we find that significantly more catchments are affected at the same time.
The results hence point to (i) the benefits of mitigation measures taken at an early stage as distributions among scenarios begin to differ by mid-century (2060) and (ii) the need for coordinate adaptation as drought days that might affect agricultural production due to a lack of soil moisture combined with potential water abstraction limitations for irrigation are projected to occur on average once a summer. This strongly emphasizes the importance of mitigation measures, especially considering recent findings that adaptation alone is not always sufficient to avoid severe impacts (Kreibich et al., 2022; Tellman and Eakin, 2022).
Table A1Catchment and climate* characteristics for all investigated catchments.
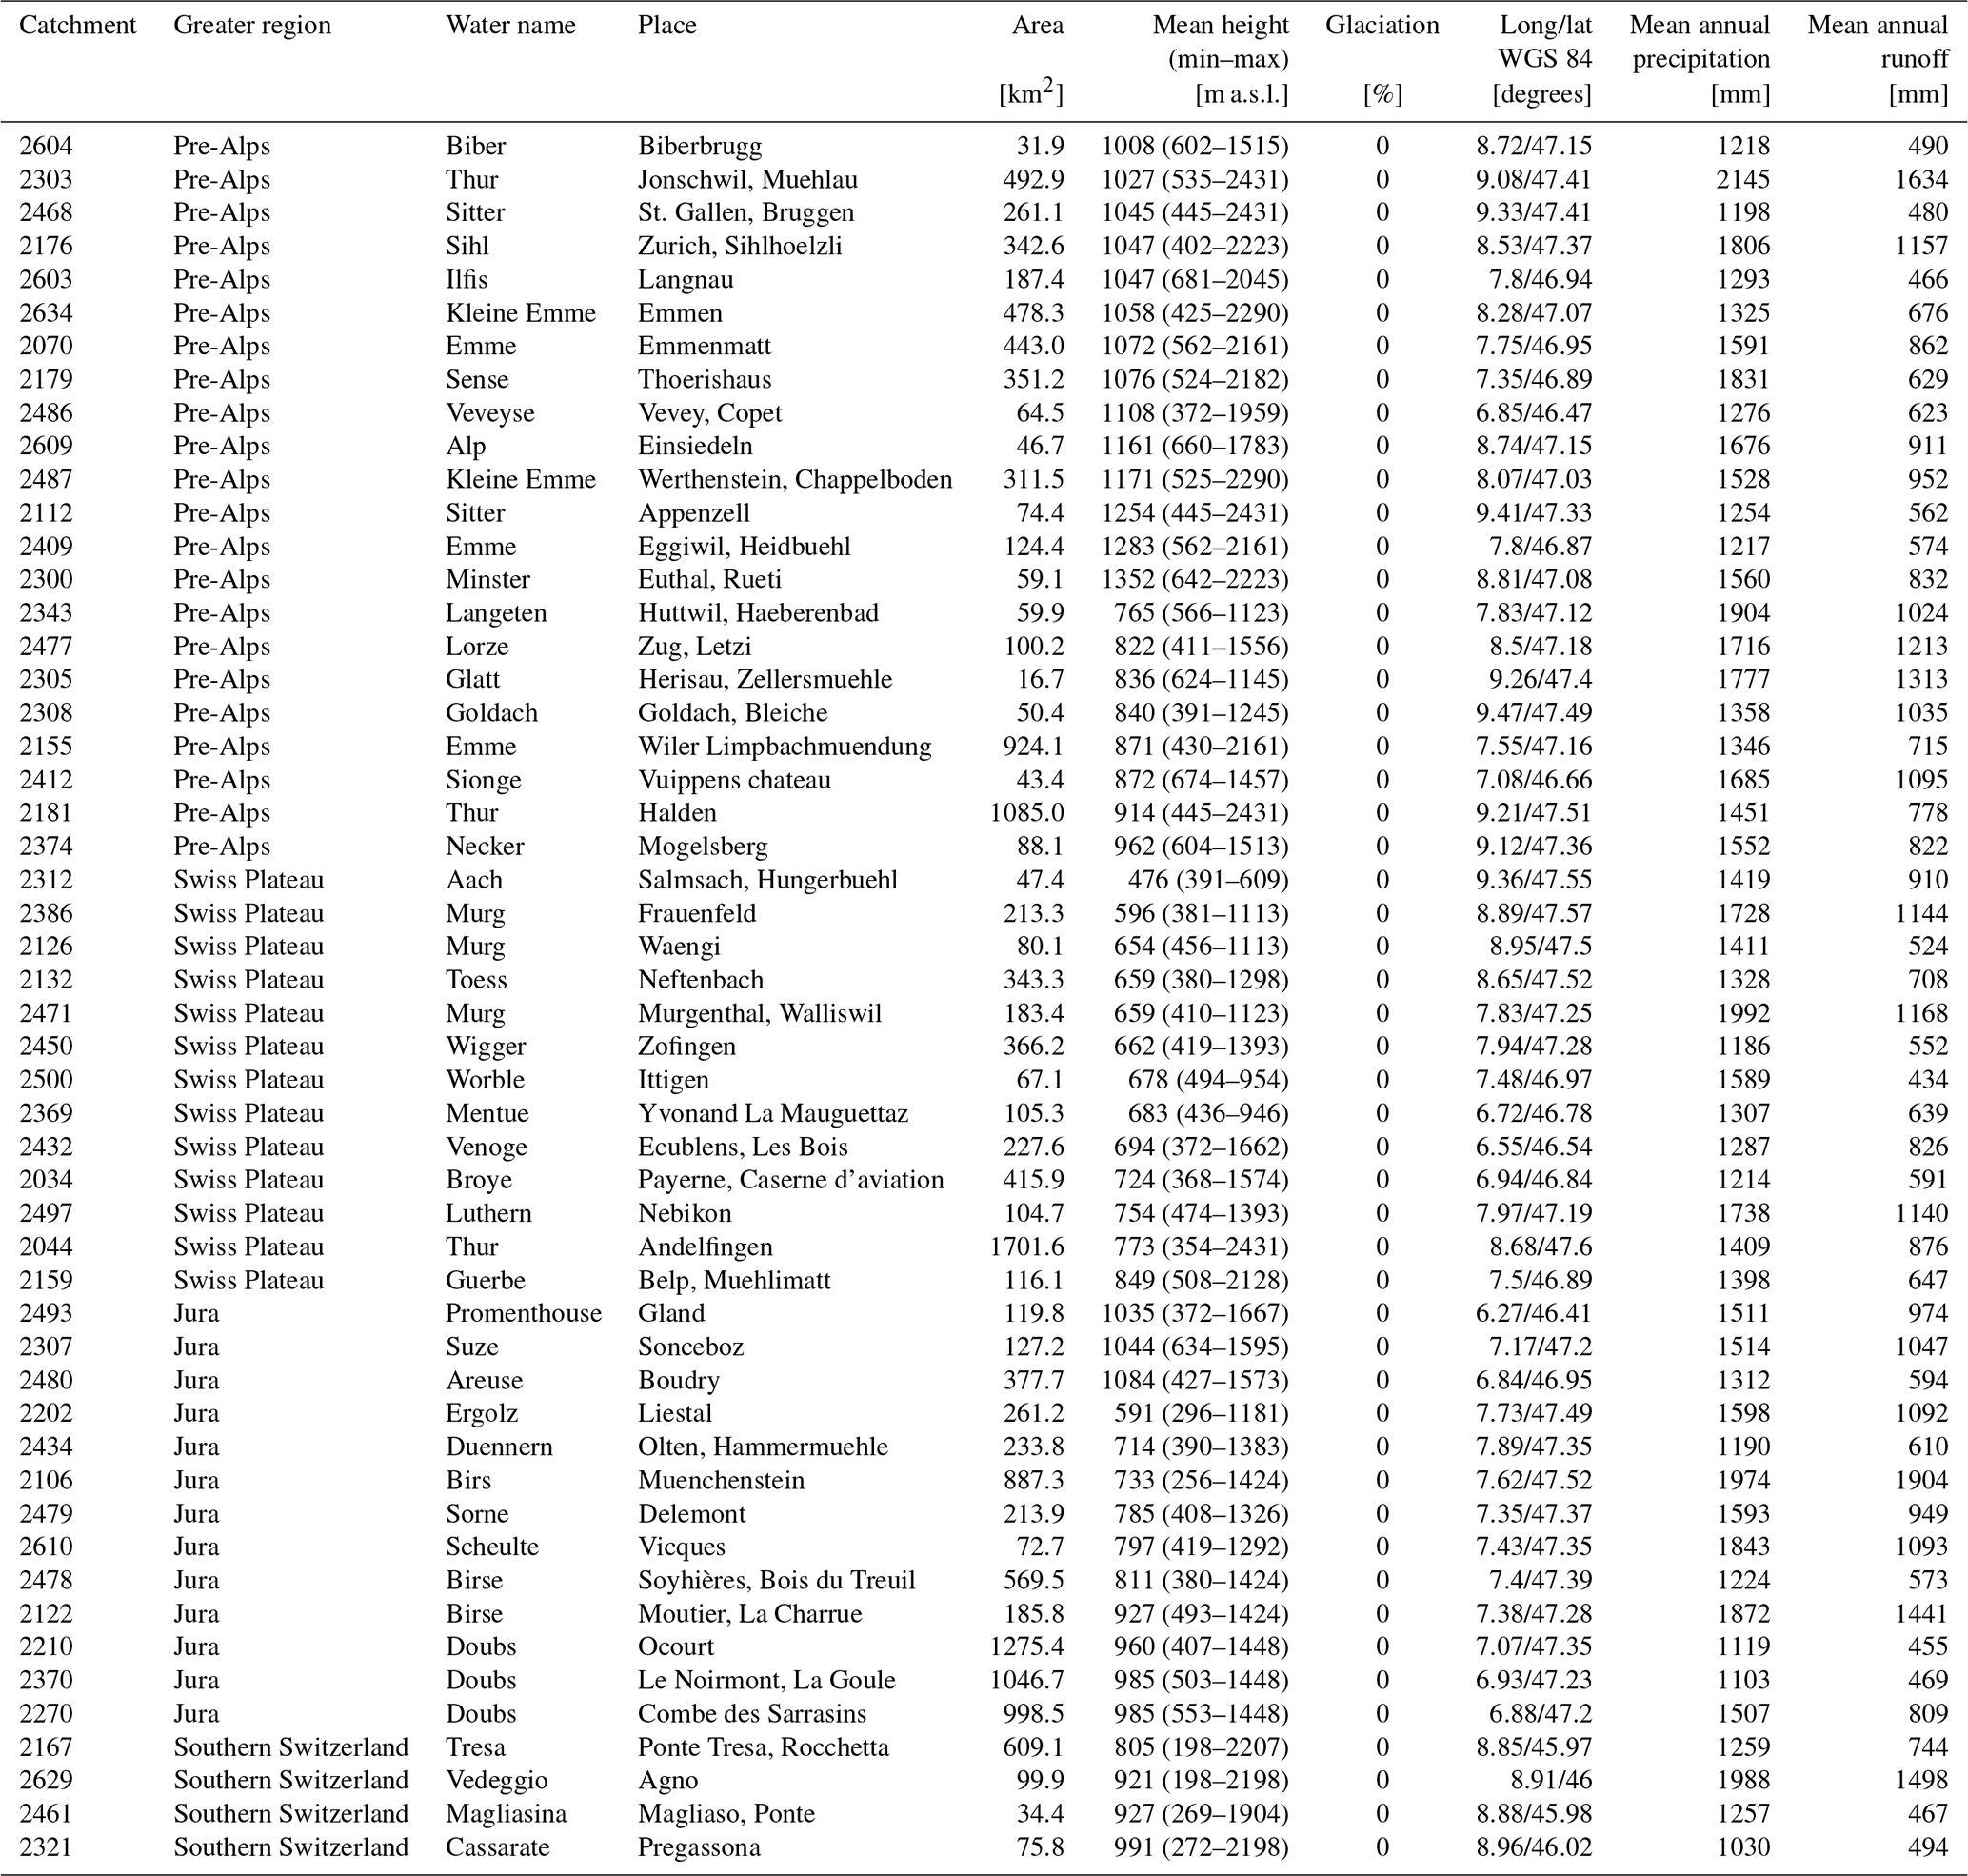
* Mean annual precipitation and mean annual runoff were derived based on the CTRL simulations driven by observations for the largest overlapping period (1991–2014) within the reference period (1991–2020). For precipitation this corresponds to the direct derivation from the RhiresD dataset (MeteoSwiss, 2021a; Frei and Schär, 1998) aggregated on the catchment level, while mean annual runoff is derived based on PREVAH model simulations (see Sect. 2; also see Muelchi et al., 2022).
Table B1Calibration and validation metrics for all investigated catchments*.
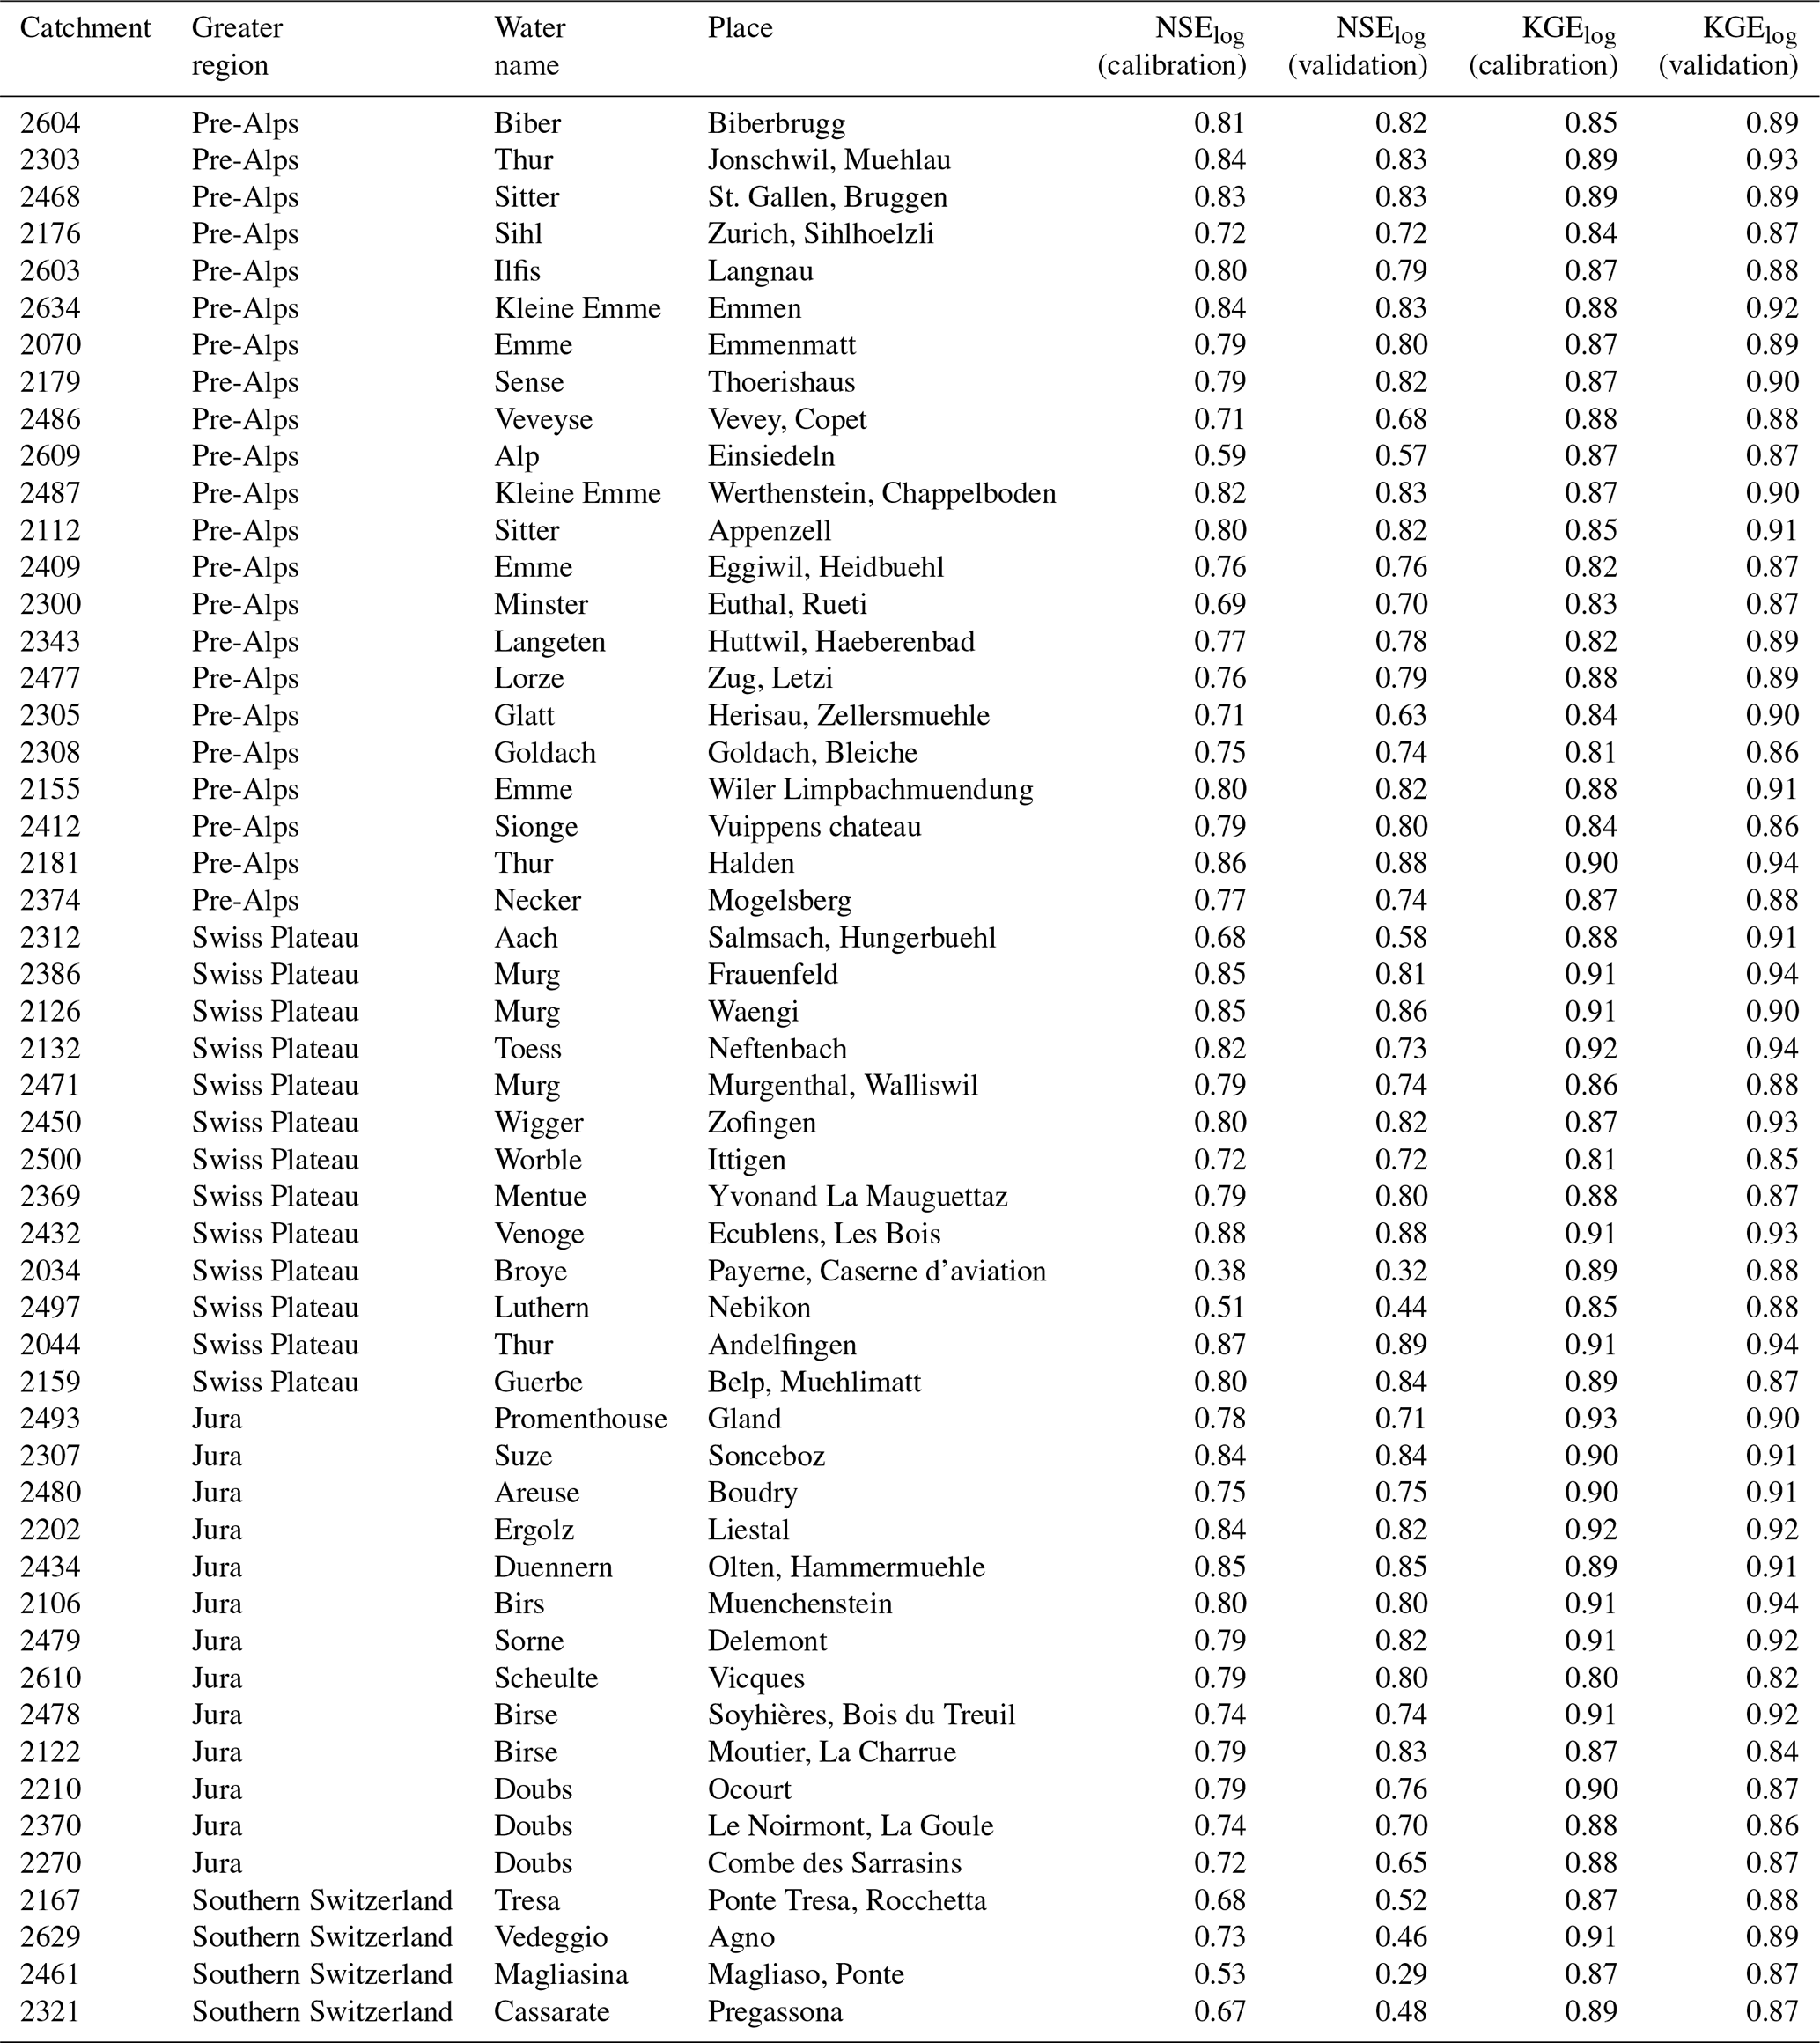
* The metrics NSElog and KGElog are indicative of the representation of low-flow conditions in the Hydro-CH2018 hydrological model simulations (see Muelchi et al., 2022). The calibration and validation periods cover the 1985–2014 period for most catchments. Even years were used for calibration and uneven years for validation. For more information see Muelchi et al. (2022).
The dataset is available from Zenodo (https://doi.org/10.5281/zenodo.10908410, von Matt et al., 2024). The original runoff simulations are documented in Muelchi et al. (2022) and can be downloaded via Zenodo (see https://doi.org/10.5281/zenodo.3937485, Muelchi et al. 2020). The CH2018 climate scenarios are documented and available from the National Centre for Climate Services (NCSS) (see https://doi.org/10.18751/Climate/Scenarios/CH2018/1.0, CH2018 Project Team, 2018). Data for the greater regions were kindly provided by the Federal Office for the Environment (FOEN) and can be requested via climate-adaptation@bafu.admin.ch. Data for the overview map of the study region (Fig. 1) and for the spatial maps (Figs. 4–6) are freely available from the Federal Office of Topography (Swisstopo) (digital height model DHM25; see https://www.swisstopo.admin.ch/de/hoehenmodell-dhm25, last access: 21 December 2023, Swisstopo, 2024) and FOEN (general hydrological background map; downloadable via opendata.swiss; see https://opendata.swiss/en/dataset/generalisierte-hintergrundkarte-zur-darstellung-hydrologischer-daten, last access: 21 December 2023, BAFU, 2014). For spatial visualization the sf R package (Pebesma, 2018) was used and can be downloaded via CRAN (https://cran.r-project.org/web/packages/sf/index.html, last access: 30 April 2023, Pebesma et al., 2023).
The supplement related to this article is available online at: https://doi.org/10.5194/nhess-24-1975-2024-supplement.
CNvM conceptualized and performed the formal analysis and drafted the article. OM, RM, and LG provided guidance on the methodological aspects and treatment of projection uncertainty. All authors assisted with writing the paper and revisions. RM conceptualized the project proposal and acquired funding from FOEN.
The contact author has declared that none of the authors has any competing interests.
Publisher’s note: Copernicus Publications remains neutral with regard to jurisdictional claims made in the text, published maps, institutional affiliations, or any other geographical representation in this paper. While Copernicus Publications makes every effort to include appropriate place names, the final responsibility lies with the authors.
This article is part of the special issue “Drought, society, and ecosystems (NHESS/BG/GC/HESS inter-journal SI)”. It is not associated with a conference.
Christoph Nathanael von Matt and Olivia Martius acknowledge the support from the Mobiliar Lab for Natural Risks and further thank Vincent Roth (FOEN) for providing the greater region data used for aggregation.
This research was funded by the Federal Office for the Environment (FOEN) under project “Droughts in Switzerland – Compound drought occurrence and meteorological drivers of drought events in Switzerland” (COM-DROUGHTS).
This paper was edited by Brunella Bonaccorso and reviewed by two anonymous referees.
Allgaier Leuch, B., Streit, K., and Brang, P.: La forêt suisse face aux changements climatiques: quelles évolutions attendre? Notice pour le practicien, vol. 59, Birmensdorf, Institut fédéral de recherches WSL, p. 12, https://www.wsl.ch/fr/publications/la-foret-suisse-face-aux-changements-climatiques-quelles-evolutions-attendre/ (last access: 21 Decemer 2023), 2017. a, b, c
Apurv, T. and Cai, X.: Drought Propagation in Contiguous U.S. Watersheds: A Process-Based Understanding of the Role of Climate and Watershed Properties, Water Resour. Res., 56, e2020WR027755, https://doi.org/10.1029/2020WR027755, 2020. a, b
Apurv, T., Sivapalan, M., and Cai, X.: Understanding the Role of Climate Characteristics in Drought Propagation, Water Resour. Res., 53, 9304–9329, https://doi.org/10.1002/2017WR021445, 2017. a
Arias, P. A., Bellouin, N., Coppola, E., Jones, R. G., Krinner, G., Marotzke, J., Naik, V., Palmer, M. D., Plattner, G.-K., Rogelj, J., Rojas, M., Sillmann, J., Storelvmo, T., Thorne, P. W., Trewin, B., Achuta Rao, K., Adhikary, B., Allan, R. P., Armour, K., Bala, G., Barimalala, R., Berger, S., Canadell, J. G., Cassou, C., Cherchi, A., Collins, W., Collins, W. D., Connors, S. L., Corti, S., Cruz, F., Dentener, F. J., Dereczynski, C., Di Luca, A., Diongue Niang, A., Doblas-Reyes, F. J., Dosio, A., Douville, H., Engelbrecht, F., Eyring, V., Fischer, E., Forster, P., Fox-Kemper, B., Fuglestvedt, J. S., Fyfe, J. C., Gillett, N. P., Goldfarb, L., Gorodetskaya, I., Gutierrez, J. M., Hamdi, R., Hawkins, E., Hewitt, H. T., Hope, P., Islam, A. S., Jones, C., Kaufman, D. S., Kopp, R. E., Kosaka, Y., Kossin, J., Krakovska, S., Lee, J.-Y., Li, J., Mauritsen, T., Maycock, T., Meinshausen, M., Min, S.-K., Monteiro, P. M. S., Ngo-Duc, T., Otto, F., Pinto, I., Pirani, A., Raghavan, K., Ranasinghe, R., Ruane, A. C., Ruiz, L., Sallée, J.-B., Samset, B. H., Sathyendranath, S., Seneviratne, S. I., Sörensson, A. A., Szopa, S., Takayabu, I., Tréguier, A.-M., van den Hurk, B., Vautard, R., von Schuckmann, K., Zaehle, S., Zhang, X., and Zickfeld, K.: Technical Summary, in: Climate Change 2021: The Physical Science Basis. Contribution of Working Group I to the Sixth Assessment Report of the Intergovernmental Panel on Climate Change, Cambridge University Press, Cambridge, United Kingdom and New York, NY, USA, 33–144, https://doi.org/10.1017/9781009157896.002, 2021. a, b, c
Aschwanden, H.: Die Niedrigwasserabflussmenge Q347 – Bestimmung und Abschätzung in alpinen schweizerischen Einzugsgebieten, Hydrologische Mitteilung der Landeshydrologie und -geologie, No. 18, Bern, https://www.bafu.admin.ch/bafu/de/home/themen/wasser/publikationen-studien/publikationen-wasser/die-niedrigwasserabflussmenge-q347.html (last access: 21 December2023), 1992. a
Aschwanden, H. and Kan, C.: Die Abflussmenge Q347 – eine Standortbestimmung, Hydrologische Mitteilung der Landeshydrologie und -geologie, Nr. 27, Bern, https://www.bafu.admin.ch/bafu/de/home/themen/wasser/publikationen-studien/publikationen-wasser/die-abflussmenge-q347.html (last access: 21 December 2023), 1999. a
Aschwanden, H. and Weingartner, R.: Die Abflussregimes der Schweiz, Tech. Rep. 65, Geographisches Institut der Universität Bern (GIUB), Bern, https://boris.unibe.ch/133660/ (last access: 21 December 2023), 1985. a
Ault, T. R.: On the essentials of drought in a changing climate, Science, 368, 256–260, https://doi.org/10.1126/science.aaz5492, 2020. a
Bachmair, S., Stahl, K., Collins, K., Hannaford, J., Acreman, M., Svoboda, M., Knutson, C., Smith, K. H., Wall, N., Fuchs, B., Crossman, N. D., and Overton, I. C.: Drought indicators revisited: the need for a wider consideration of environment and society, WIREs Water, 3, 516–536, https://doi.org/10.1002/wat2.1154, 2016. a, b, c, d, e, f
Bachmair, S., Tanguy, M., Hannaford, J., and Stahl, K.: How well do meteorological indicators represent agricultural and forest drought across Europe?, Environ. Res. Lett., 13, 034042, https://doi.org/10.1088/1748-9326/aaafda, 2018. a
BAFU: Generalisierte Hintergrundkarte zur Darstellung hydrologischer Daten, opendata.swiss [data set], https://opendata.swiss/en/dataset/generalisierte-hintergrundkarte-zur-darstellung-hydrologischer-daten (last access: 21 December 2023), 2014.
BAFU (Eds.): Hitze und Trockenheit im Sommer 2015. Auswirkungen auf Mensch und Umwelt, Bundesamt für Umwelt BAFU, Bern, Umwelt-Zustand Nr. 1629, Tech. rep., 108 pp., https://www.bafu.admin.ch/dam/bafu/de/dokumente/klima/uz-umwelt-zustand/Hitze und Trockenheit im Sommer 2015.pdf.download.pdf/UZ-1629-D.pdf (last access: 20 December 2023), 2016. a
BAFU: Niedrigwasserstatistik, https://www.bafu.admin.ch/bafu/de/home/themen/thema-wasser/wasser--daten--indikatoren-und-karten/wasser--messwerte-und-statistik/niedrigwasserstatistik.html (last access: 21 December 2023), 2019. a
BAFU (Eds.): Hitze und Trockenheit im Sommer 2018. Auswirkungen auf Mensch und Umwelt. Bundesamt für Umwelt, Bern, Umwelt-Zustand Nr. 1909, Tech. rep., 91 pp., https://www.bafu.admin.ch/dam/bafu/de/dokumente/klima/uz-umwelt-zustand/hitze_und_trockenheit_im_sommer_2018.pdf.download.pdf/UZ-1909-D_Hitzesommer2018.pdf (last access: 20 December 2023), 2019. a, b, c, d, e
BAFU (Eds.): Auswirkungen des Klimawandels auf die Schweizer Gewässer. Hydrologie, Gewässerökologie und Wasserwirtschaft, Bundesamt für Umwelt BAFU, Bern, Umwelt-Wissen Nr. 2101, Tech. rep., 134 pp., https://www.bafu.admin.ch/dam/bafu/de/dokumente/wasser/uw-umwelt-wissen/auswirkungen-des-klimawandels-auf-die-schweizer-gewaesser.pdf.download.pdf/UW-2101-D_HydroCH2018.pdf (last access: 14 December 2023), 2021. a, b, c, d, e
Berg, A. and Sheffield, J.: Climate Change and Drought: the Soil Moisture Perspective, Current Climate Change Reports, 4, 180–191, https://doi.org/10.1007/s40641-018-0095-0, 2018. a, b
Brunner, M. I. and Gilleland, E.: Complex High- and Low-Flow Networks Differ in Their Spatial Correlation Characteristics, Drivers, and Changes, Water Resour. Res., 57, e2021WR030049, https://doi.org/10.1029/2021WR030049, 2021. a
Brunner, M. I. and Stahl, K.: Temporal hydrological drought clustering varies with climate and land-surface processes, Environ. Res. Lett., 18, 034011, https://doi.org/10.1088/1748-9326/acb8ca, 2023. a
Brunner, M. I. and Tallaksen, L. M.: Proneness of European Catchments to Multiyear Streamflow Droughts, Water Resour. Res., 55, 8881–8894, https://doi.org/10.1029/2019WR025903, 2019. a, b, c, d
Brunner, M. I., Björnsen Gurung, A., Zappa, M., Zekollari, H., Farinotti, D., and Stähli, M.: Present and future water scarcity in Switzerland: Potential for alleviation through reservoirs and lakes, Sci. Total Environ., 666, 1033–1047, https://doi.org/10.1016/j.scitotenv.2019.02.169, 2019a. a, b, c, d, e, f, g, h, i
Brunner, M. I., Farinotti, D., Zekollari, H., Huss, M., and Zappa, M.: Future shifts in extreme flow regimes in Alpine regions, Hydrol. Earth Syst. Sci., 23, 4471–4489, https://doi.org/10.5194/hess-23-4471-2019, 2019b. a, b, c, d, e, f
Brunner, M. I., Liechti, K., and Zappa, M.: Extremeness of recent drought events in Switzerland: dependence on variable and return period choice, Nat. Hazards Earth Syst. Sci., 19, 2311–2323, https://doi.org/10.5194/nhess-19-2311-2019, 2019c. a, b
Brunner, M. I., Slater, L., Tallaksen, L. M., and Clark, M.: Challenges in modeling and predicting floods and droughts: A review, WIREs Water, 8, e1520, https://doi.org/10.1002/wat2.1520, 2021. a, b, c, d, e, f, g, h
Brunner, M. I., Götte, J., Schlemper, C., and Van Loon, A. F.: Hydrological Drought Generation Processes and Severity Are Changing in the Alps, Geophys. Res. Lett., 50, e2022GL101776, https://doi.org/10.1029/2022GL101776, 2023. a, b, c
BUWAL: Restwassermengen in Fliessgewässern. Wasserentnahmen, die insbesondere der Bewässerung dienen, Bern, Mitteilungen zum Gewässerschutz, No. 24, https://www.bafu.admin.ch/dam/bafu/de/dokumente/wasser/uw-umwelt-wissen/restwassermengeninfliessgewaessern.pdf.download.pdf/restwassermengeninfliessgewaessern.pdf (last access: 20 December 2023), 1997. a
BUWAL, BWG, MeteoSchweiz: Auswirkungen des Hitzesommers 2003 auf die Gewässer, Schriftenreihe Umwelt Nr. 369. Bern, Bundesamt für Umwelt, Wald und Landschaft, Tech. rep., 174 pp., https://www.bafu.admin.ch/dam/bafu/de/dokumente/wasser/uw-umwelt-wissen/auswirkungen_deshitzesommers2003aufdiegewaesser.pdf.download.pdf/auswirkungen_deshitzesommers2003aufdiegewaesser.pdf (last access: 14 December 2023), 2004. a
Calanca, P.: Climate change and drought occurrence in the Alpine region: How severe are becoming the extremes?, Global Planet. Change, 57, 151–160, https://doi.org/10.1016/j.gloplacha.2006.11.001, 2007. a, b, c
Cammalleri, C., Barbosa, P., and Vogt, J. V.: Analysing the Relationship between Multiple-Timescale SPI and GRACE Terrestrial Water Storage in the Framework of Drought Monitoring, Water, 11, 1672, https://doi.org/10.3390/w11081672, 2019. a
Cammalleri, C., Arias-Muñoz, C., Barbosa, P., de Jager, A., Magni, D., Masante, D., Mazzeschi, M., McCormick, N., Naumann, G., Spinoni, J., and Vogt, J.: A revision of the Combined Drought Indicator (CDI) used in the European Drought Observatory (EDO), Nat. Hazards Earth Syst. Sci., 21, 481–495, https://doi.org/10.5194/nhess-21-481-2021, 2021. a
CH2018: CH2018 – Climate Scenarios for Switzerland, Technical Report, National Centre for Climate Services, Zurich, Tech. rep., 271 pp., ISBN 978-3-9525031-4-0, 2018. a, b, c, d, e, f, g, h, i, j, k, l
CH2018 Project Team: CH2018 – Climate Scenarios for Switzerland, National Centre for Climate Services, NCCS [data set], https://doi.org/10.18751/Climate/Scenarios/CH2018/1.0, 2018. a
de Jager, A., Corbane, C., and Szabo, F.: Recent Developments in Some Long-Term Drought Drivers, Climate, 10, 31, https://doi.org/10.3390/cli10030031, 2022. a
Denissen, J. M., Teuling, A. J., Reichstein, M., and Orth, R.: Critical Soil Moisture Derived From Satellite Observations Over Europe, J. Geophys. Res.-Atmos., 125, e2019JD031672, https://doi.org/10.1029/2019JD031672, 2020. a, b, c
Ding, Y., Gong, X., Xing, Z., Cai, H., Zhou, Z., Zhang, D., Sun, P., and Shi, H.: Attribution of meteorological, hydrological and agricultural drought propagation in different climatic regions of China, Agr. Water Manage., 255, 106996, https://doi.org/10.1016/j.agwat.2021.106996, 2021. a
Dirmeyer, P. A., Balsamo, G., Blyth, E. M., Morrison, R., and Cooper, H. M.: Land-Atmosphere Interactions Exacerbated the Drought and Heatwave Over Northern Europe During Summer 2018, AGU Adv., 2, e2020AV000283, https://doi.org/10.1029/2020AV000283, 2021. a
Doherty, J.: PEST: model independent parameter estimation, User Manual, Brisbane, Australia: Watermark Numerical Computing, https://pesthomepage.org/documentation (last access: 20 March 2023), 2005. a
Eekhout, J. P. C., Hunink, J. E., Terink, W., and de Vente, J.: Why increased extreme precipitation under climate change negatively affects water security, Hydrol. Earth Syst. Sci., 22, 5935–5946, https://doi.org/10.5194/hess-22-5935-2018, 2018. a
Eyring, V., Bony, S., Meehl, G. A., Senior, C. A., Stevens, B., Stouffer, R. J., and Taylor, K. E.: Overview of the Coupled Model Intercomparison Project Phase 6 (CMIP6) experimental design and organization, Geosci. Model Dev., 9, 1937–1958, https://doi.org/10.5194/gmd-9-1937-2016, 2016. a
Faiz, M. A., Zhang, Y., Ma, N., Baig, F., Naz, F., and Niaz, Y.: Drought indices: aggregation is necessary or is it only the researcher's choice?, Water Supply, 21, 3987–4002, https://doi.org/10.2166/ws.2021.163, 2021. a
Fischer, A. M., Keller, D. E., Liniger, M. A., Rajczak, J., Schär, C., and Appenzeller, C.: Projected changes in precipitation intensity and frequency in Switzerland: a multi-model perspective, Int. J. Climatol., 35, 3204–3219, https://doi.org/10.1002/joc.4162, 2015. a
Floriancic, M. G., Berghuijs, W. R., Jonas, T., Kirchner, J. W., and Molnar, P.: Effects of climate anomalies on warm-season low flows in Switzerland, Hydrol. Earth Syst. Sci., 24, 5423–5438, https://doi.org/10.5194/hess-24-5423-2020, 2020. a, b, c
Forzieri, G., Feyen, L., Rojas, R., Flörke, M., Wimmer, F., and Bianchi, A.: Ensemble projections of future streamflow droughts in Europe, Hydrol. Earth Syst. Sci., 18, 85–108, https://doi.org/10.5194/hess-18-85-2014, 2014. a, b
Fowler, K., Peel, M., Saft, M., Nathan, R., Horne, A., Wilby, R., McCutcheon, C., and Peterson, T.: Hydrological Shifts Threaten Water Resources, Water Resour. Res., 58, e2021WR031210, https://doi.org/10.1029/2021WR031210, 2022. a, b
Fowler, K. J. A., Coxon, G., Freer, J. E., Knoben, W. J. M., Peel, M. C., Wagener, T., Western, A. W., Woods, R. A., and Zhang, L.: Towards more realistic runoff projections by removing limits on simulated soil moisture deficit, J. Hydrol., 600, 126505, https://doi.org/10.1016/j.jhydrol.2021.126505, 2021. a
Frei, C.: Interpolation of temperature in a mountainous region using nonlinear profiles and non-Euclidean distances, Int. J. Climatol., 34, 1585–1605, https://doi.org/10.1002/joc.3786, 2014. a
Frei, C. and Schär, C.: A precipitation climatology of the Alps from high-resolution rain-gauge observations, Int. J. Climatol., 18, 873–900, https://doi.org/10.1002/(SICI)1097-0088(19980630)18:8<873::AID-JOC255>3.0.CO;2-9, 1998. a, b
Fu, Z., Ciais, P., Feldman, A. F., Gentine, P., Makowski, D., Prentice, I. C., Stoy, P. C., Bastos, A., and Wigneron, J.-P.: Critical soil moisture thresholds of plant water stress in terrestrial ecosystems, Science Advances, 8, eabq7827, https://doi.org/10.1126/sciadv.abq7827, 2022a. a, b
Fu, Z., Ciais, P., Makowski, D., Bastos, A., Stoy, P. C., Ibrom, A., Knohl, A., Migliavacca, M., Cuntz, M., Šigut, L., Peichl, M., Loustau, D., El-Madany, T. S., Buchmann, N., Gharun, M., Janssens, I., Markwitz, C., Grünwald, T., Rebmann, C., Mölder, M., Varlagin, A., Mammarella, I., Kolari, P., Bernhofer, C., Heliasz, M., Vincke, C., Pitacco, A., Cremonese, E., Foltýnová, L., and Wigneron, J.-P.: Uncovering the critical soil moisture thresholds of plant water stress for European ecosystems, Glob. Change Biol., 28, 2111–2123, https://doi.org/10.1111/gcb.16050, 2022b. a, b
Fuhrer, J. and Calanca, P.: Bewässerungsbedarf und Wasserdargebot unter Klimawandel: eine regionale Defizitanalyse, Agrarforschung Schweiz+, 6, 256–263, 2014. a, b, c, d, e
Fuhrer, J. and Jasper, K.: Bewässerungsbedürftigkeit von Acker- und Grasland im heutigen Klima, Agrarforschung, 10, 396–401, 2009. a, b, c, d, e, f, g, h
Fuhrer, J. and Jasper, K.: Demand and Supply of Water for Agriculture: Influence of Topography and Climate in Pre-Alpine, Mesoscale Catchments, Natural Resources, 3, 145–155, https://doi.org/10.4236/nr.2012.33019, 2012. a, b
Grillakis, M. G.: Increase in severe and extreme soil moisture droughts for Europe under climate change, Sci. Total Environ., 660, 1245–1255, https://doi.org/10.1016/j.scitotenv.2019.01.001, 2019. a, b
Gu, L., Chen, J., Yin, J., Xu, C.-Y., and Chen, H.: Drought hazard transferability from meteorological to hydrological propagation, J. Hydrol., 585, 124761, https://doi.org/10.1016/j.jhydrol.2020.124761, 2020. a
Gudmundsson, L. and Seneviratne, S. I.: European drought trends, Proc. IAHS, 369, 75–79, https://doi.org/10.5194/piahs-369-75-2015, 2015a. a
Gudmundsson, L. and Seneviratne, S. I.: Towards observation-based gridded runoff estimates for Europe, Hydrol. Earth Syst. Sci., 19, 2859–2879, https://doi.org/10.5194/hess-19-2859-2015, 2015b. a
Gudmundsson, L. and Seneviratne, S. I.: Anthropogenic climate change affects meteorological drought risk in Europe, Environ. Res. Lett., 11, 044005, https://doi.org/10.1088/1748-9326/11/4/044005, 2016. a
Gudmundsson, L. and Stagge, J. H.: SCI: Standardized Climate Indices such as SPI, SRI or SPEI. R package version 1.0-2, The Comprehensive R Archive Network (CRAN) [code], https://cran.r-project.org/web/packages/SCI/index.html (last access: 4 June 2024), 2016. a
Gudmundsson, L., Seneviratne, S. I., and Zhang, X.: Anthropogenic climate change detected in European renewable freshwater resources, Nat. Clim. Change, 7, 813–816, https://doi.org/10.1038/nclimate3416, 2017. a
Gupta, H. V., Kling, H., Yilmaz, K. K., and Martinez, G. F.: Decomposition of the mean squared error and NSE performance criteria: Implications for improving hydrological modelling, J. Hydrol., 377, 80–91, https://doi.org/10.1016/j.jhydrol.2009.08.003, 2009. a
Haile, G. G., Tang, Q., Li, W., Liu, X., and Zhang, X.: Drought: Progress in broadening its understanding, WIREs Water, 7, e1407, https://doi.org/10.1002/wat2.1407, 2020. a, b, c, d, e
Hall, J. W. and Leng, G.: Can we calculate drought risk… and do we need to?, WIREs Water, 6, e1349, https://doi.org/10.1002/wat2.1349, 2019. a
Hamon, W. R.: Estimating potential evapotranspiration, J. Hydr. Eng. Div.-ASCE, 87, 107–120, https://doi.org/10.1061/JYCEAJ.0000599, 1961. a
Hasan, H. H., Mohd Razali, S. F., Muhammad, N. S., and Ahmad, A.: Research Trends of Hydrological Drought: A Systematic Review, Water, 11, 2252, https://doi.org/10.3390/w11112252, 2019. a
Haslinger, K., Koffler, D., Schöner, W., and Laaha, G.: Exploring the link between meteorological drought and streamflow: Effects of climate-catchment interaction, Water Resour. Res., 50, 2468–2487, https://doi.org/10.1002/2013WR015051, 2014. a, b
Haslinger, K., Holawe, F., and Blöschl, G.: Spatial characteristics of precipitation shortfalls in the Greater Alpine Region – a data-based analysis from observations, Theor. Appl. Climatol., 136, 717–731, https://doi.org/10.1007/s00704-018-2506-5, 2019. a
Hayes, M., Svoboda, M., Wall, N., and Widhalm, M.: The Lincoln Declaration on Drought Indices: Universal Meteorological Drought Index Recommended, B. Am. Meteorol. Soc., 92, 485–488, https://doi.org/10.1175/2010BAMS3103.1, 2011. a, b
Hendrawan, V. S. A., Kim, W., and Komori, D.: Crop response pattern to several drought timescales and its possible determinants: A global-scale analysis during the last decades, Anthropocene, 43, 100389, https://doi.org/10.1016/j.ancene.2023.100389, 2023. a
Henne, P. D., Bigalke, M., Büntgen, U., Colombaroli, D., Conedera, M., Feller, U., Frank, D., Fuhrer, J., Grosjean, M., Heiri, O., Luterbacher, J., Mestrot, A., Rigling, A., Rössler, O., Rohr, C., Rutishauser, T., Schwikowski, M., Stampfli, A., Szidat, S., Theurillat, J.-P., Weingartner, R., Wilcke, W., and Tinner, W.: An empirical perspective for understanding climate change impacts in Switzerland, Reg. Environ. Change, 18, 205–221, https://doi.org/10.1007/s10113-017-1182-9, 2018. a
Hirschi, M., Davin, E. L., Schwingshackl, C., Wartenburger, R., Meier, R., Gudmundsson, L., and Seneviratne, S. I.: Soil moisture and evapotranspiration, Report, ETH Zurich, https://doi.org/10.3929/ethz-b-000389455, 2020. a, b, c, d, e, f, g
Ho, S., Tian, L., Disse, M., and Tuo, Y.: A new approach to quantify propagation time from meteorological to hydrological drought, J. Hydrol., 603, 127056, https://doi.org/10.1016/j.jhydrol.2021.127056, 2021. a
Holzkämper, A., Cochand, F., Rössler, O., Brunner, P., and Hunkeler, D.: Landnutzungsänderungen auf Grundwasserressourcen im Berner Seeland, Im Auftrag des Bundesamts für Umwelt (BAFU), Bern, Schweiz, Tech. rep., 39 pp., https://doi.org/10.34776/nccs21aa, 2020. a
Imfeld, N., Stucki, P., Brönnimann, S., Bader, S., Bürgi, M., Calanca, P., Gubler, S., Holzkämper, A., Hövel, L., Isotta, F., Kestenholz, C., Kotlarski, S., Mastai, A., Nussbaumer, S. U., Raible, C. C., Röthlisberger, M., Scherrer, S. C., Staub, K., Vicedo-Cabrera, A., Vogel, M.-M., Wehrli, K., Wohlgemuth, T., and Zumbühl, H. J.: Hitze- und Trockensommer in der Schweiz. Ursachen und Folgen der Jahrhundertsommer 1947, 2003 und 2018, Reihe G Grundlagenforschung, Geographica Bernensia, G98, 33 pp., https://doi.org/10.4480/GB2022.G98.01, 2022a. a, b
Imfeld, N., Stucki, P., Brönnimann, S., Bürgi, M., Calanca, P., Holzkämper, A., Isotta, F., Nussbaumer, S. U., Scherrer, S., Staub, K., Vicedo-Cabrera, A., Wohlgemuth, T., and Zumbühl, H. J.: 2022: Ein ziemlich normaler zukünftiger Sommer, Geographica Bernensia, G100, 1–3, https://doi.org/10.4480/GB2022.G100, 2022b. a, b
Jacob, D., Petersen, J., Eggert, B., Alias, A., Christensen, O. B., Bouwer, L. M., Braun, A., Colette, A., Déqué, M., Georgievski, G., Georgopoulou, E., Gobiet, A., Menut, L., Nikulin, G., Haensler, A., Hempelmann, N., Jones, C., Keuler, K., Kovats, S., Kröner, N., Kotlarski, S., Kriegsmann, A., Martin, E., van Meijgaard, E., Moseley, C., Pfeifer, S., Preuschmann, S., Radermacher, C., Radtke, K., Rechid, D., Rounsevell, M., Samuelsson, P., Somot, S., Soussana, J.-F., Teichmann, C., Valentini, R., Vautard, R., Weber, B., and Yiou, P.: EURO-CORDEX: new high-resolution climate change projections for European impact research, Reg. Environ. Change, 14, 563–578, https://doi.org/10.1007/s10113-013-0499-2, 2014. a
Jiang, T., Su, X., Zhang, G., Zhang, T., and Wu, H.: Estimating propagation probability from meteorological to ecological droughts using a hybrid machine learning copula method, Hydrol. Earth Syst. Sci., 27, 559–576, https://doi.org/10.5194/hess-27-559-2023, 2023. a
Kchouk, S., Melsen, L. A., Walker, D. W., and van Oel, P. R.: A geography of drought indices: mismatch between indicators of drought and its impacts on water and food securities, Nat. Hazards Earth Syst. Sci., 22, 323–344, https://doi.org/10.5194/nhess-22-323-2022, 2022. a, b
Keller, F. and Fuhrer, J.: Die Landwirtschaft und der Hitzesommer 2003, Agrarforschung, 11, 403–410, 2004. a
Kohn, I., Stahl, K., and Stoelzle, M.: Low Flow Events – a Review in the Context of Climate Change in Switzerland, Comissioned by the Federal Office for the Environment (FOEN), Bern, Switzerland, Tech. rep., University of Freiburg i. Br., Germany, https://doi.org/10.6094/UNIFR/150448, 2019. a, b, c, d, e
Kotlarski, S. and Rajczak, J.: Documentation of the Localized CH2018 Datasets. Transient Daily Time Series at the Local Scale: DAILY-LOCAL, DAILY-GRIDDED Version 1.2, https://www.nccs.admin.ch/nccs/de/home/materialien-und-daten/daten/ch2018---klimaszenarien-fuer-die-schweiz.html (last access: 22 November 2023), 2018. a, b
Kotlarski, S., Keuler, K., Christensen, O. B., Colette, A., Déqué, M., Gobiet, A., Goergen, K., Jacob, D., Lüthi, D., van Meijgaard, E., Nikulin, G., Schär, C., Teichmann, C., Vautard, R., Warrach-Sagi, K., and Wulfmeyer, V.: Regional climate modeling on European scales: a joint standard evaluation of the EURO-CORDEX RCM ensemble, Geosci. Model Dev., 7, 1297–1333, https://doi.org/10.5194/gmd-7-1297-2014, 2014. a
Kotlarski, S., Gobiet, A., Morin, S., Olefs, M., Rajczak, J., and Samacoïts, R.: 21st Century alpine climate change, Clim. Dynam., 60, 65–86, https://doi.org/10.1007/s00382-022-06303-3, 2023. a, b, c, d
Kreibich, H., Van Loon, A. F., Schröter, K., Ward, P. J., Mazzoleni, M., Sairam, N., Abeshu, G. W., Agafonova, S., AghaKouchak, A., Aksoy, H., Alvarez-Garreton, C., Aznar, B., Balkhi, L., Barendrecht, M. H., Biancamaria, S., Bos-Burgering, L., Bradley, C., Budiyono, Y., Buytaert, W., Capewell, L., Carlson, H., Cavus, Y., Couasnon, A., Coxon, G., Daliakopoulos, I., de Ruiter, M. C., Delus, C., Erfurt, M., Esposito, G., François, D., Frappart, F., Freer, J., Frolova, N., Gain, A. K., Grillakis, M., Grima, J. O., Guzmán, D. A., Huning, L. S., Ionita, M., Kharlamov, M., Khoi, D. N., Kieboom, N., Kireeva, M., Koutroulis, A., Lavado-Casimiro, W., Li, H.-Y., LLasat, M. C., Macdonald, D., Mård, J., Mathew-Richards, H., McKenzie, A., Mejia, A., Mendiondo, E. M., Mens, M., Mobini, S., Mohor, G. S., Nagavciuc, V., Ngo-Duc, T., Thao Nguyen Huynh, T., Nhi, P. T. T., Petrucci, O., Nguyen, H. Q., Quintana-Seguí, P., Razavi, S., Ridolfi, E., Riegel, J., Sadik, M. S., Savelli, E., Sazonov, A., Sharma, S., Sörensen, J., Arguello Souza, F. A., Stahl, K., Steinhausen, M., Stoelzle, M., Szalińska, W., Tang, Q., Tian, F., Tokarczyk, T., Tovar, C., Tran, T. V. T., Van Huijgevoort, M. H. J., van Vliet, M. T. H., Vorogushyn, S., Wagener, T., Wang, Y., Wendt, D. E., Wickham, E., Yang, L., Zambrano-Bigiarini, M., Blöschl, G., and Di Baldassarre, G.: The challenge of unprecedented floods and droughts in risk management, Nature, 608, 80–86, https://doi.org/10.1038/s41586-022-04917-5, 2022. a, b
Kruse, S. and Seidl, I.: Social capacities for drought risk management in Switzerland, Nat. Hazards Earth Syst. Sci., 13, 3429–3441, https://doi.org/10.5194/nhess-13-3429-2013, 2013. a
Lanz, K.: Auswirkungen des Klimawandels auf die Wasserwirtschaft der Schweiz Beiträge zur Hydrologie der Schweiz, Nr. 43, Bern, Tech. rep., ISBN 978-3-9524235-5-4, 2020. a, b, c
Lee, J.-Y., Marotzke, J., Bala, G., Cao, L., Corti, S., Dunne, J. P., Engelbrecht, F., Fischer, E., Fyfe, J. C., Jones, C., Maycock, A., Mutemi, J., Ndiaye, O., Panickal, S., and Zhou, T.: Future Global Climate: Scenario-Based Projections and NearTerm Information, Tech. rep., Cambridge University Press, Cambridge, United Kingdom and New York, NY, USA, https://doi.org/10.1017/9781009157896.006, 2021. a
Lehner, F., Coats, S., Stocker, T. F., Pendergrass, A. G., Sanderson, B. M., Raible, C. C., and Smerdon, J. E.: Projected drought risk in 1.5 °C and 2 °C warmer climates, Geophys. Res. Lett., 44, 7419–7428, https://doi.org/10.1002/2017GL074117, 2017. a, b
Li, J., Bevacqua, E., Chen, C., Wang, Z., Chen, X., Myneni, R. B., Wu, X., Xu, C.-Y., Zhang, Z., and Zscheischler, J.: Regional asymmetry in the response of global vegetation growth to springtime compound climate events, Commun. Earth Environ., 3, 1–9, https://doi.org/10.1038/s43247-022-00455-0, 2022. a
Lloyd-Hughes, B.: The impracticality of a universal drought definition, Theor. Appl. Climatol., 117, 607–611, https://doi.org/10.1007/s00704-013-1025-7, 2014. a
Manning, C., Widmann, M., Bevacqua, E., Loon, A. F. V., Maraun, D., and Vrac, M.: Soil Moisture Drought in Europe: A Compound Event of Precipitation and Potential Evapotranspiration on Multiple Time Scales, J. Hydrometeorol., 19, 1255–1271, https://doi.org/10.1175/JHM-D-18-0017.1, 2018. a
Manning, C., Widmann, M., Bevacqua, E., Loon, A. F. V., Maraun, D., and Vrac, M.: Increased probability of compound long-duration dry and hot events in Europe during summer (1950–2013), Environ. Res. Lett., 14, 094006, https://doi.org/10.1088/1748-9326/ab23bf, 2019. a
Markonis, Y., Kumar, R., Hanel, M., Rakovec, O., Máca, P., and AghaKouchak, A.: The rise of compound warm-season droughts in Europe, Science Advances, 7, eabb9668, https://doi.org/10.1126/sciadv.abb9668, 2021. a, b
McGill, R., Tukey, J. W., and Larsen, W. A.: Variations of Box Plots, The American Statistician, 32, 12–16, https://doi.org/10.2307/2683468, 1978. a
McKee, T., Doesken, N., and Kleist, J.: The relationship of drought frequency and duration to time scales, Eight Conference on Applied Climatology, Anaheim, California, 17–22 January 1993, https://www.semanticscholar.org/paper/THE-RELATIONSHIP-OF-DROUGHT-FREQUENCY-AND-DURATION-McKee-Doesken/c3f7136d6cb726b295eb34565a8270177c57f40f (last access: 1 February 2022), 1993. a, b, c
Melsen, L. A. and Guse, B.: Hydrological Drought Simulations: How Climate and Model Structure Control Parameter Sensitivity, Water Resour. Res., 55, 10527–10547, https://doi.org/10.1029/2019WR025230, 2019. a, b, c, d
Merz, B., Kuhlicke, C., Kunz, M., Pittore, M., Babeyko, A., Bresch, D. N., Domeisen, D. I. V., Feser, F., Koszalka, I., Kreibich, H., Pantillon, F., Parolai, S., Pinto, J. G., Punge, H. J., Rivalta, E., Schröter, K., Strehlow, K., Weisse, R., and Wurpts, A.: Impact Forecasting to Support Emergency Management of Natural Hazards, Rev. Geophys., 58, e2020RG000704, https://doi.org/10.1029/2020RG000704, 2020. a
MeteoSwiss: Daily Precipitation (final analysis): RhiresD, https://www.meteoswiss.admin.ch/dam/jcr:4f51f0f1-0fe3-48b5-9de0-15666327e63c/ProdDoc_RhiresD.pdf (last access: 20 December 2022), 2021a. a, b
MeteoSwiss: Daily Mean, Minimum and Maximum Temperature: TabsD, TminD, TmaxD, https://www.meteoswiss.admin.ch/dam/jcr:818a4d17-cb0c-4e8b-92c6-1a1bdf5348b7/ProdDoc_TabsD.pdf (last access: 20 December 2022), 2021b. a
Milly, P. and Dunne, K. A.: A hydrologic drying bias in water-resource impact analyses of anthropogenic climate change, J. Am. Water Resour. As., 53, 822838, https://doi.org/10.1111/1752-1688.12538, 2017. a
Milly, P. C. D. and Dunne, K. A.: Potential evapotranspiration and continental drying, Nat. Clim. Change, 6, 946–949, https://doi.org/10.1038/nclimate3046, 2016. a
Miralles, D. G., Gentine, P., Seneviratne, S. I., and Teuling, A. J.: Land–atmospheric feedbacks during droughts and heatwaves: state of the science and current challenges, Ann. NY Acad. Sci., 1436, 19–35, https://doi.org/10.1111/nyas.13912, 2019. a, b, c
Mishra, A. K. and Singh, V. P.: A review of drought concepts, J. Hydrol., 391, 202–216, https://doi.org/10.1016/j.jhydrol.2010.07.012, 2010. a, b, c
Moss, R. H., Edmonds, J. A., Hibbard, K. A., Manning, M. R., Rose, S. K., van Vuuren, D. P., Carter, T. R., Emori, S., Kainuma, M., Kram, T., Meehl, G. A., Mitchell, J. F. B., Nakicenovic, N., Riahi, K., Smith, S. J., Stouffer, R. J., Thomson, A. M., Weyant, J. P., and Wilbanks, T. J.: The next generation of scenarios for climate change research and assessment, Nature, 463, 747–756, https://doi.org/10.1038/nature08823, 2010. a
Muelchi, R., Schwanbeck, J., Rössler, O., Weingartner, R., and Martius, O.: Hydro-CH2018-Runoff ensemble (Version v1), Zenodo [data set], https://doi.org/10.5281/zenodo.3937485, 2020.
Muelchi, R., Rössler, O., Schwanbeck, J., Weingartner, R., and Martius, O.: River runoff in Switzerland in a changing climate – changes in moderate extremes and their seasonality, Hydrol. Earth Syst. Sci., 25, 3577–3594, https://doi.org/10.5194/hess-25-3577-2021, 2021a. a, b, c, d, e, f
Muelchi, R., Rössler, O., Schwanbeck, J., Weingartner, R., and Martius, O.: River runoff in Switzerland in a changing climate – runoff regime changes and their time of emergence, Hydrol. Earth Syst. Sci., 25, 3071–3086, https://doi.org/10.5194/hess-25-3071-2021, 2021b. a, b, c, d, e, f, g
Muelchi, R., Rössler, O., Schwanbeck, J., Weingartner, R., and Martius, O.: An ensemble of daily simulated runoff data (1981–2099) under climate change conditions for 93 catchments in Switzerland (Hydro-CH2018-Runoff ensemble), Geosci. Data J., 9, 46–57, https://doi.org/10.1002/gdj3.117, 2022. a, b, c, d, e, f, g, h, i, j, k, l, m, n, o
Mukherjee, S., Mishra, A., and Trenberth, K. E.: Climate Change and Drought: a Perspective on Drought Indices, Current Climate Change Reports, 4, 145–163, https://doi.org/10.1007/s40641-018-0098-x, 2018. a, b, c, d
Myronidis, D., Fotakis, D., Ioannou, K., and Sgouropoulou, K.: Comparison of ten notable meteorological drought indices on tracking the effect of drought on streamflow, Hydrolog. Sci. J., 63, 2005–2019, https://doi.org/10.1080/02626667.2018.1554285, 2018. a
Nash, J. E. and Sutcliffe, J. V.: River flow forecasting through conceptual models part I – A discussion of principles, J. Hydrol., 10, 282–290, https://doi.org/10.1016/0022-1694(70)90255-6, 1970. a
Naumann, G., Cammalleri, C., Mentaschi, L., and Feyen, L.: Increased economic drought impacts in Europe with anthropogenic warming, Nat. Clim. Change, 11, 485–491, https://doi.org/10.1038/s41558-021-01044-3, 2021. a, b
NCCS: Grossregionen, https://www.nccs.admin.ch/nccs/de/home/regionen/grossregionen.html (last access: 23 November 2023), 2023. a
Orlowsky, B. and Seneviratne, S. I.: Elusive drought: uncertainty in observed trends and short- and long-term CMIP5 projections, Hydrol. Earth Syst. Sci., 17, 1765–1781, https://doi.org/10.5194/hess-17-1765-2013, 2013. a, b
Otero, N., Horton, P., Martius, O., Allen, S., Zappa, M., Wechsler, T., and Schaefli, B.: Impacts of hot-dry conditions on hydropower production in Switzerland, Environ. Res. Lett., 18, 064038, https://doi.org/10.1088/1748-9326/acd8d7, 2023. a, b
Otkin, J. A., Svoboda, M., Hunt, E. D., Ford, T. W., Anderson, M. C., Hain, C., and Basara, J. B.: Flash Droughts: A Review and Assessment of the Challenges Imposed by Rapid-Onset Droughts in the United States, B. Am. Meteorol. Soc., 99, 911–919, https://doi.org/10.1175/BAMS-D-17-0149.1, 2018. a
O’Neill, B. C., Kriegler, E., Riahi, K., Ebi, K. L., Hallegatte, S., Carter, T. R., Mathur, R., and van Vuuren, D. P.: A new scenario framework for climate change research: the concept of shared socioeconomic pathways, Climatic Change, 122, 387–400, https://doi.org/10.1007/s10584-013-0905-2, 2014. a
Pebesma, E.: Simple Features for R: Standardized Support for Spatial Vector Data, The R Journal, 10, 439–446, https://doi.org/10.32614/RJ-2018-009, 2018.
Pebesma, E., Bivand, R., Racine, E., Sumner, M., Cook, I., Keitt, T., Lovelace, R., Wickham, H., Ooms, J., Müller, K., Pedersen, T. L., Bastom, D., and Dunnington, D.: sf: Simple Features for R. R package version 1.0.12, The Comprehensive R Archive Network (CRAN) [code], https://cran.r-project.org/web/packages/sf/index.html (last access: 30 April 2023), 2023.
Peña-Angulo, D., Vicente-Serrano, S. M., Domínguez-Castro, F., Lorenzo-Lacruz, J., Murphy, C., Hannaford, J., Allan, R. P., Tramblay, Y., Reig-Gracia, F., and El Kenawy, A.: The Complex and Spatially Diverse Patterns of Hydrological Droughts Across Europe, Water Resour. Res., 58, e2022WR031976, https://doi.org/10.1029/2022WR031976, 2022. a
Rajczak, J., Kotlarski, S., and Schär, C.: Does Quantile Mapping of Simulated Precipitation Correct for Biases in Transition Probabilities and Spell Lengths?, J. Climate, 29, 1605–1615, https://doi.org/10.1175/JCLI-D-15-0162.1, 2016. a
Ranasinghe, R., Ruane, A. C., Vautard, R., Arnell, N., Coppola, E., Cruz, F. A., Dessai, S., Islam, A. S., Rahimi, M., Ruiz Carrascal, D., Sillmann, J., Sylla, M. B., Tebaldi, C., Wang, W., and Zaaboul, R.: Climate Change Information for Regional Impact and for Risk Assessment, in: Climate Change 2021: The Physical Science Basis, Contribution of Working Group I to the Sixth Assessment Report of the Intergovernmental Panel on Climate Change, Cambridge University Press, Cambridge, United Kingdom and New York, NY, USA, 1767–1926, https://doi.org/10.1017/9781009157896.014, 2021. a, b
Remund, J., Rihm, B., and Huguenin-Landl, B.: Klimadaten für die Waldmodellierung für das 20. und 21. Jahrhundert: Schlussbericht des Projektes im Forschungsprogramm Wald und Klimawandel, Report, ETH Zurich, https://doi.org/10.3929/ethz-a-010693673, 2016. a, b, c, d, e, f, g
Saft, M., Western, A. W., Zhang, L., Peel, M. C., and Potter, N. J.: The influence of multiyear drought on the annual rainfall-runoff relationship: An Australian perspective, Water Resour. Res., 51, 2444–2463, https://doi.org/10.1002/2014WR015348,2015. a
Sarailidis, G., Vasiliades, L., and Loukas, A.: Analysis of streamflow droughts using fixed and variable thresholds, Hydrol. Process., 33, 414–431, https://doi.org/10.1002/hyp.13336, 2019. a
Savelli, E., Rusca, M., Cloke, H., and Di Baldassarre, G.: Drought and society: Scientific progress, blind spots, and future prospects, WIREs Climate Change, 13, e761, https://doi.org/10.1002/wcc.761, 2022. a, b, c
Sawadogo, A., Kouadio, L., Traoré, F., Zwart, S. J., Hessels, T., and Gündoğdu, K. S.: Spatiotemporal Assessment of Irrigation Performance of the Kou Valley Irrigation Scheme in Burkina Faso Using Satellite Remote Sensing-Derived Indicators, ISPRS Int. Geo-Inf., 9, 484, https://doi.org/10.3390/ijgi9080484, 2020. a
Scherrer, S. C., Hirschi, M., Spirig, C., Maurer, F., and Kotlarski, S.: Trends and drivers of recent summer drying in Switzerland, Environmental Research Communications, 4, 2, https://doi.org/10.1088/2515-7620/ac4fb9, 2022. a, b, c
Seneviratne, S. I.: Historical drought trends revisited, Nature, 491, 338–339, https://doi.org/10.1038/491338a, 2012. a, b
Seneviratne, S. I., Corti, T., Davin, E. L., Hirschi, M., Jaeger, E. B., Lehner, I., Orlowsky, B., and Teuling, A. J.: Investigating soil moisture–climate interactions in a changing climate: A review, Earth-Sci. Rev., 99, 125–161, https://doi.org/10.1016/j.earscirev.2010.02.004, 2010. a
Seneviratne, S. I., Nicholls, N., Easterling, D., Goodess, C. M., Kanae, S., Kossin, J., Luo, Y., Marengo, J., McInnes, K., Rahimi, M., Reichstein, M., Sortenberg, A., Vera, C., and Zhang, X.: Changes in climate extremes and their impacts on the natural physical environment, in: Managing the Risks of Extreme Events and Disasters to Advance Climate Change Adaptation, edited by: Field, C. B., V. Barros, T. F. Stocker, D. Qin, D. J. Dokken, K. L. Ebi, M. D. Mastrandrea, K. J. Mach, G.-K. Plattner, S. K. Allen, M. Tignor, and P. M. Midgley, A Special Report of Working Groups I and II of the Intergovernmental Panel on Climate Change (IPCC), Cambridge University Press, Cambridge, UK, and New York, NY, USA, 109–230, ISBN 978-1-107-60780-4, 2012. a
Sheffield, J., Wood, E. F., and Roderick, M. L.: Little change in global drought over the past 60 years, Nature, 491, 435–438, https://doi.org/10.1038/nature11575, 2012. a
Singh, J., Ashfaq, M., Skinner, C. B., Anderson, W. B., and Singh, D.: Amplified risk of spatially compounding droughts during co-occurrences of modes of natural ocean variability, NPJ Clim. Atmos. Sci., 4, 1–14, https://doi.org/10.1038/s41612-021-00161-2, 2021. a, b, c
Spinoni, J., Vogt, J. V., Naumann, G., Barbosa, P., and Dosio, A.: Will drought events become more frequent and severe in Europe?, Int. J. Climatol., 38, 1718–1736, https://doi.org/10.1002/joc.5291, 2018. a, b, c
Spinoni, J., Barbosa, P., Bucchignani, E., Cassano, J., Cavazos, T., Christensen, J. H., Christensen, O. B., Coppola, E., Evans, J., Geyer, B., Giorgi, F., Hadjinicolaou, P., Jacob, D., Katzfey, J., Koenigk, T., Laprise, R., Lennard, C. J., Kurnaz, M. L., Li, D., Llopart, M., McCormick, N., Naumann, G., Nikulin, G., Ozturk, T., Panitz, H.-J., Rocha, R. P. d., Rockel, B., Solman, S. A., Syktus, J., Tangang, F., Teichmann, C., Vautard, R., Vogt, J. V., Winger, K., Zittis, G., and Dosio, A.: Future Global Meteorological Drought Hot Spots: A Study Based on CORDEX Data, J. Climate, 33, 3635–3661, https://doi.org/10.1175/JCLI-D-19-0084.1, 2020. a
Stagge, J. H., Tallaksen, L. M., Gudmundsson, L., Van Loon, A. F., and Stahl, K.: Candidate Distributions for Climatological Drought Indices (SPI and SPEI), Int. J. Climatol., 35, 4027–4040, https://doi.org/10.1002/joc.4267, 2015. a, b, c
Staudinger, M., Stahl, K., and Seibert, J.: A drought index accounting for snow, Water Resour. Res., 50, 7861–7872, https://doi.org/10.1002/2013WR015143, 2014. a
Staudinger, M., Stoelzle, M., Seeger, S., Seibert, J., Weiler, M., and Stahl, K.: Catchment water storage variation with elevation, Hydrol. Process., 31, 2000–2015, https://doi.org/10.1002/hyp.11158, 2017. a
Stocker, B. D., Tumber-Dávila, S. J., Konings, A. G., Anderson, M. C., Hain, C., and Jackson, R. B.: Global patterns of water storage in the rooting zones of vegetation, Nat. Geosci., 16, 250–256, https://doi.org/10.1038/s41561-023-01125-2, 2023. a, b
Sutanto, S. J. and Van Lanen, H. A. J.: Catchment memory explains hydrological drought forecast performance, Sci. Rep., 12, 2689, https://doi.org/10.1038/s41598-022-06553-5, 2022. a, b
Swisstopo: DHM25 – das digitale Höhenmodell der Schweiz, Swisstopo [data set], https://www.swisstopo.admin.ch/de/hoehenmodell-dhm25 (last acces: 21 December 2023), 2024.
Tallaksen, L. M. and Van Lanen, H. A. J. (Eds.): Hydrological drought: processes and estimation methods for streamflow and groundwater, no. 48 in Developments in Water Science, Elsevier Science B.V., Amsterdam, the Netherlands, ISBN 978-0-444-51688-6, 2004. a, b
Tallaksen, L. M., Madsen, H., and Clausen, B.: On the definition and modelling of streamflow drought duration and deficit volume, Hydrolog. Sci. J., 42, 15–33, https://doi.org/10.1080/02626669709492003,1997. a
Tellman, B. and Eakin, H.: Risk management alone fails to limit the impact of extreme climate events, Nature, 608, 41–43, https://doi.org/10.1038/d41586-022-02031-0, 2022. a, b
Tijdeman, E., Barker, L. J., Svoboda, M. D., and Stahl, K.: Natural and Human Influences on the Link Between Meteorological and Hydrological Drought Indices for a Large Set of Catchments in the Contiguous United States, Water Resour. Res., 54, 6005–6023, https://doi.org/10.1029/2017WR022412, 2018. a, b
Tijdeman, E., Stahl, K., and Tallaksen, L. M.: Drought Characteristics Derived Based on the Standardized Streamflow Index: A Large Sample Comparison for Parametric and Nonparametric Methods, Water Resour. Res., 56, e2019WR026315, https://doi.org/10.1029/2019WR026315, 2020. a
Tijdeman, E., Blauhut, V., Stoelzle, M., Menzel, L., and Stahl, K.: Different drought types and the spatial variability in their hazard, impact, and propagation characteristics, Nat. Hazards Earth Syst. Sci., 22, 2099–2116, https://doi.org/10.5194/nhess-22-2099-2022, 2022. a, b
Trenberth, K. E., Dai, A., van der Schrier, G., Jones, P. D., Barichivich, J., Briffa, K. R., and Sheffield, J.: Global warming and changes in drought, Nat. Clim. Change, 4, 17–22, https://doi.org/10.1038/nclimate2067, 2014. a
Tripathy, K. P. and Mishra, A. K.: How Unusual Is the 2022 European Compound Drought and Heatwave Event?, Geophys. Res. Lett., 50, e2023GL105453, https://doi.org/10.1029/2023GL105453, 2023. a
Tschurr, F., Feigenwinter, I., Fischer, A. M., and Kotlarski, S.: Climate Scenarios and Agricultural Indices: A Case Study for Switzerland, Atmosphere, 11, 535, https://doi.org/10.3390/atmos11050535, 2020. a, b, c, d, e, f
Van Lanen, H. A. J., Wanders, N., Tallaksen, L. M., and Van Loon, A. F.: Hydrological drought across the world: impact of climate and physical catchment structure, Hydrol. Earth Syst. Sci., 17, 1715–1732, https://doi.org/10.5194/hess-17-1715-2013, 2013. a
Van Loon, A. F.: Hydrological drought explained, WIREs Water, 2, 359–392, https://doi.org/10.1002/wat2.1085, 2015. a, b, c, d, e, f, g, h
Van Loon, A. F. and Laaha, G.: Hydrological drought severity explained by climate and catchment characteristics, J. Hydrol., 526, 3–14, https://doi.org/10.1016/j.jhydrol.2014.10.059, 2015. a
Van Loon, A. F. and Van Lanen, H. A. J.: A process-based typology of hydrological drought, Hydrol. Earth Syst. Sci., 16, 1915–1946, https://doi.org/10.5194/hess-16-1915-2012, 2012. a, b, c, d, e, f
Van Loon, A. F., Tijdeman, E., Wanders, N., Van Lanen, H. A. J., Teuling, A. J., and Uijlenhoet, R.: How climate seasonality modifies drought duration and deficit, J. Geophys. Res.-Atmos., 119, 4640–4656, https://doi.org/10.1002/2013JD020383, 2014. a
van Tiel, M., Weiler, M., Freudiger, D., Moretti, G., Kohn, I., Gerlinger, K., and Stahl, K.: Melting Alpine Water Towers Aggravate Downstream Low Flows: A Stress-Test Storyline Approach, Earths Future, 11, e2022EF003408, https://doi.org/10.1029/2022EF003408, 2023. a
van Vuuren, D. P., Edmonds, J., Kainuma, M., Riahi, K., Thomson, A., Hibbard, K., Hurtt, G. C., Kram, T., Krey, V., Lamarque, J.-F., Masui, T., Meinshausen, M., Nakicenovic, N., Smith, S. J., and Rose, S. K.: The representative concentration pathways: an overview, Climatic Change, 109, 5, https://doi.org/10.1007/s10584-011-0148-z, 2011. a, b
Vicente-Serrano, S. M., Peña-Angulo, D., Beguería, S., Domínguez-Castro, F., Tomás-Burguera, M., Noguera, I., Gimeno-Sotelo, L., and El Kenawy, A.: Global drought trends and future projections, Philos. T. R. Soc. A, 380, 20210285, https://doi.org/10.1098/rsta.2021.0285, 2022. a, b, c
Viviroli, D., Dürr, H. H., Messerli, B., Meybeck, M., and Weingartner, R.: Mountains of the world, water towers for humanity: Typology, mapping, and global significance, Water Resour. Res., 43, W07447, https://doi.org/10.1029/2006WR005653, 2007. a
Viviroli, D., Zappa, M., Gurtz, J., and Weingartner, R.: An introduction to the hydrological modelling system PREVAH and its pre- and post-processing-tools, Environ. Modell. Softw., 24, 1209–1222, https://doi.org/10.1016/j.envsoft.2009.04.001, 2009. a, b
von Matt, C., Muelchi, R., Martius, O., and Gudmundsson, L.: COM-DROUGHTS Drought Indices, Zenodo [data set], https://doi.org/10.5281/zenodo.10908410, 2024.
Walthert, L., Scherler, M., Stähli, M., Huber, M., Baltensweiler, A., Ramirez-Lopez, L., and Papritz, A. J.: Böden und Wasserhaushalt von Wäldern und Waldstandorten der Schweiz unter heutigem und zukünftigem Klima (BOWA-CH): Schlussbericht des Projektes, Report, ETH Zurich, https://doi.org/10.3929/ethz-a-010658682, 2015. a, b, c, d, e, f, g, h
Weingartner, R. and Schwanbeck, J.: Veränderung der Niedrigwasserabflüsse und der kleinsten saisonalen Abflüsse in der Schweiz im Zeitraum 1961 – 2018. Im Auftrag des Bundesamts für Umwelt (BAFU), Bern, Schweiz, Tech. rep., Bern, Schweiz, 42 pp., https://www.bafu.admin.ch/dam/bafu/de/dokumente/wasser/ext erne-studien-berichte/veraenderung-der-niedrigwasserabfluesse-und-der-kleinsten-saisonalen-abfluesse-in-der-schweiz-im-zeitraum-1961-2018.pdf.download.pdf/Schlussbericht_NQ.pdf (last access: 21 November 2023), 2020. a, b
Wickham, H., Averick, M., Bryan, J., Chang, W., McGowan, L. D., François, R., Grolemund, G., Hayes, A., Henry, L., Hester, J., Kuhn, M., Pedersen, T. L., Miller, E., Bache, S. M., Müller, K., Ooms, J., Robinson, D., Seidel, D. P., Spinu, V., Takahashi, K., Vaughan, D., Wilke, C., Woo, K., and Yutani, H.: Welcome to the Tidyverse, Journal of Open Source Software, 4, 1686, https://doi.org/10.21105/joss.01686, 2019. a
Wilwhite, D. A. and Glantz, M. H.: Understanding the drought phenomenon: The role of definitions, Water Int., 10, 111–120, 1985. a, b
WMO: The role of climatological normals in a changing climate, Tech. rep., World Meteorological Organization (WMO), Geneva, Switzerland, https://library.wmo.int/records/item/52499-the-role-of-climatological-normals-in-a-changing-climate?offset=45 (last access: 23 November 2023), 2007. a
WMO and GWP: Handbook of Drought Indicators and Indices, in: Integrated Drought Management Programme (IDMP), edited by: Svoboda, M. and Fuchs, B. A., Integrated Drought Management Tools and Guidelines Series 2, Geneva, ISBN 978-92-63-11173-9, 2016. a, b
Wu, J., Chen, X., Yao, H., and Zhang, D.: Multi-timescale assessment of propagation thresholds from meteorological to hydrological drought, Sci. Total Environ., 765, 144232, https://doi.org/10.1016/j.scitotenv.2020.144232, 2021. a
Wu, J., Yao, H., Chen, X., Wang, G., Bai, X., and Zhang, D.: A framework for assessing compound drought events from a drought propagation perspective, J. Hydrol., 604, 127228, https://doi.org/10.1016/j.jhydrol.2021.127228, 2022. a, b
Yevjevich, V.: An objective approach to definitions and investigations of continental hydrologie droughts, Hydrol. Papers 23, Colorado State University, Fort Collins, Colorado, USA, https://mountainscholar.org/items/caa939a5-98a9-4ca3-8ea3-308c310cdad7 (last access: 4 June 2024), 1967. a
Yihdego, Y., Vaheddoost, B., and Al-Weshah, R. A.: Drought indices and indicators revisited, Arab. J. Geosci., 12, 69, https://doi.org/10.1007/s12517-019-4237-z, 2019. a
Zambrano-Bigiarini, M.: hydroTSM: Time Series Management, Analysis and Interpolation for Hydrological ModellingR package version 0.6-0, Zenodo [code], https://doi.org/10.5281/zenodo.839864, 2020. a
Zappa, M. and Kan, C.: Extreme heat and runoff extremes in the Swiss Alps, Nat. Hazards Earth Syst. Sci., 7, 375–389, https://doi.org/10.5194/nhess-7-375-2007, 2007. a
Zeng, J., Li, J., Lu, X., Wei, Z., Shangguan, W., Zhang, S., Dai, Y., and Zhang, S.: Assessment of global meteorological, hydrological and agricultural drought under future warming based on CMIP6, Atmospheric and Oceanic Science Letters, 15, 100143, https://doi.org/10.1016/j.aosl.2021.100143, 2022. a
Zhang, X., Hao, Z., Singh, V. P., Zhang, Y., Feng, S., Xu, Y., and Hao, F.: Drought propagation under global warming: Characteristics, approaches, processes, and controlling factors, Sci. Total Environ., 838, 156021, https://doi.org/10.1016/j.scitotenv.2022.156021, 2022. a, b
Zhao, M., A, G., Liu, Y., and Konings, A. G.: Evapotranspiration frequently increases during droughts, Nat. Clim. Change, 12, 1024–1030, https://doi.org/10.1038/s41558-022-01505-3, 2022. a
Zscheischler, J., Martius, O., Westra, S., Bevacqua, E., Raymond, C., Horton, R. M., van den Hurk, B., AghaKouchak, A., Jézéquel, A., Mahecha, M. D., Maraun, D., Ramos, A. M., Ridder, N. N., Thiery, W., and Vignotto, E.: A typology of compound weather and climate events, Nature Reviews Earth & Environment, 1, 333–347, https://doi.org/10.1038/s43017-020-0060-z, 2020. a, b
- Abstract
- Introduction
- Data
- Methods
- Multivariate compound droughts
- Spatial extent of multivariate compound droughts (spatially compounding droughts)
- Discussion
- Conclusions
- Appendix A: Catchment and climate characteristics
- Appendix B: Calibration and validation metrics
- Code and data availability
- Author contributions
- Competing interests
- Disclaimer
- Special issue statement
- Acknowledgements
- Financial support
- Review statement
- References
- Supplement