the Creative Commons Attribution 4.0 License.
the Creative Commons Attribution 4.0 License.
 | 11 Jun 2024
Climatic characteristics of the Jianghuai cyclone and its linkage with precipitation during the Meiyu period from 1961 to 2020
Ran Zhu
Lei Chen
This study examines the climatic characteristics of 202 Jianghuai cyclones and their linkage with precipitation during the Meiyu period from 1961 to 2020. The results show that cyclones mainly originate from the eastern and western Hubei Province. Additionally, we explore the statistical characteristics of intensity, radius and their positive correlation. In studying the decadal variation of cyclones, we find a similar evolution between the cyclones and Meiyu precipitation. Therefore, we further investigate the correlation between the Jianghuai cyclones and the precipitation during the Meiyu period. There is a positive correlation coefficient of 0.77 between them. Notably, the percentage of precipitation affected by cyclone activities can reach up to 47 %. The anomalous increase in precipitation caused by cyclones north of 27° N can reach a maximum of 7 mm d−1. When a cyclone exists, a significant negative geopotential height anomaly at the 500 hPa level over Mongolia can be traced back to day −4. The abnormally enhanced WPSH (western Pacific subtropical high), southwesterly low-level jet and negative geopotential height are the dominant factors causing abnormal precipitation during Jianghuai cyclones. Before and after the cyclone develops, water vapor flux and divergence from low latitudes increase abnormally, providing sufficient water vapor conditions for the generation of cyclone precipitation.
- Article
(9537 KB) - Full-text XML
- BibTeX
- EndNote


Meiyu is a special rainy season resulting from the progression of the East Asian summer monsoon. The East Asian monsoon originates in the South China Sea in mid-May and then advances northward, forming rain bands in South China, the Jianghuai region, the Korean Peninsula and Japan (Ding, 2004; Ding et al., 2007; Qian and Lee, 2000). This special rainy season is called Meiyu in China, Changma in South Korea and Baiu in Japan (Ninomiya and Murakami, 1987; Oh et al., 1997; Saito, 1995). The Meiyu front is one of the important weather systems affecting summer precipitation in the middle and lower reaches of the Yangtze River (Pang et al., 2013; Wang et al., 2014; Zhou et al., 2022). From mid-June to early July, the east of Yichang in Hubei Province experiences continuous rain and short periods of sunshine. These conditions are accompanied by heavy rainfall, strong wind and other weather phenomena during the Meiyu period (Ding, 1992; Zhao et al., 2021; Zhou and Xia, 2017). In China, the mean annual precipitation during the Meiyu period in the Jianghuai River Basin can reach 300 mm, accounting for 30 %–40 % of the mean annual total precipitation, and even up to 500 mm or more in extreme Meiyu period (Liu and Ding, 2020). Historically, most summer flood disasters are caused by precipitation anomalies during the Meiyu period. Some scholars have studied and analyzed the representative floods of 1996, 1998, 2016 and 2020 (Bao, 2021; Su et al., 2021; Zhao et al., 2018; Zhong et al., 2023). These floods, caused by the Meiyu front, had adverse effects on people's safety, lives and property (Yan et al., 2021).
Scholars in China have categorized rainstorms caused by Meiyu fronts into three types (Zhang et al., 2004). The first type is the β mesoscale convective rainstorm on the Meiyu front. This type of rainstorm has a range of less than 300 km, with strong intensity and a rapid formation process (He et al., 2007). It is difficult to forecast more than 12 h and can only be detected using radar for proximity forecasting (Zhang et al., 2002). The second type is the persistent rainstorm located in front of the upper trough of low pressure in the western part of the Meiyu front. It is characterized by a long duration of approximately 5 d but appears less frequently, mainly in western Hubei and western Hunan and Sichuan (Cai et al., 2021; Wu et al., 2020a). The last type is the rainstorm caused by the Jianghuai cyclone located east of the origin of the Meiyu (Fig. 1). The Jianghuai cyclones are affected by the thermal conditions of the sea and land and likely occur in the eastern part of the Meiyu front (Wang et al., 2016). The positive vorticity advection in front of the high-altitude trough and the warm advection in front of the front promote the eastward movement and development of the cyclone (Shen et al., 2019; Zhang et al., 2016). During the development of the cyclone, the lower levels are dominated by the southwest warm and humid airflow, and the upper levels are mainly affected by dry and cold air (Zhao et al., 2008). This type of rainstorm has a large range, high intensity and long duration of precipitation (Wang and Wang, 2012; Xu et al., 2011).
Scholars' studies on Jianghuai cyclones during the Meiyu period were initially based on individual case analysis. Xu et al. (2013) studied a cyclone process in 2011 and found that the cyclone process lasted up to 36 h. The cyclone rainstorm is distributed on the south side of the cyclone, and the heavy precipitation mainly occurred in the lower reaches of the Yangtze River. Wu et al. (2020b) studied two different cyclone rainstorm processes and found that rainfall is directly proportional to cyclone intensity. There is a strong convergence center of water vapor flux during cyclone development. Zhou and Zheng (2020) found that a tornado is generated from the cyclone occlusion stage on 22 July. The tornado is under the influence of a strong and fast Jianghuai cyclone and produces heavy precipitation accompanied by thunderstorms.
With the improvement of cyclone identification methods and reanalysis data reconstruction, statistical studies of cyclones have been further developed (Simmonds and Murray, 1999; Simmonds and Keay, 2000; Wernli and Schwierz, 2006). Yang et al. (2010) modeled the rainstorm process in the lower reaches of the Yangtze River from 1998 to 2005. They found that cyclones account for 62.5 % of the rainstorm cases, and more than 70 % of the cyclones could develop and produce rainstorms. The Jianghuai cyclone, located in the lower reaches of the Yangtze River, generally exists in the lower troposphere at 700 hPa. The horizontal scale is within 400 km, and the life period on land is generally less than 48 h. Wang et al. (2015) found that the number of cyclones is lower and their intensity weaker in the 1980s and 1990s. In the early 2000s, cyclones become more frequent, and their intensity increases. After 2010, there is a decreasing trend again. Zhang et al. (2018) divided 60 cases of extreme precipitation in the middle reaches of the Yangtze River from 2008 to 2015 into five types. Among them, extreme precipitation of the Jianghuai cyclone type accounts for 30 %. The stable and maintained western Pacific subtropical high (WPSH) system is one of the important reasons for the strong precipitation produced by cyclones. Because of the weak cold air force, the intensity of the Jianghuai cyclone is weaker than that in spring (Zhou and Xia, 2017). The daily analysis of the Jianghuai cyclones during the Meiyu period is easily overlooked. All these studies indicate that the Jianghuai cyclone is an important weather system causing heavy rainfall during the Meiyu period in the middle and lower reaches of the Yangtze River (Wu et al., 2021; Zhang et al., 2018; Zhu et al., 1998).
Research on the climatic characteristics and precipitation effects of Jianghuai cyclones during the Meiyu period over the past 60 years has not yielded clear results. In this study, the relative vorticity method is used to objectively identify and track cyclones. We study the climatological characteristics of Jianghuai cyclones during this period and analyze the correlation between Jianghuai cyclone activity and precipitation. This study provides a reference for the long-term and short-term forecasting of precipitation during the Meiyu period.
The remainder of this paper is organized as follows: Sect. 2 presents the dataset and analytical methods. In Sect. 3, we show the climatology composite of the cyclone tracks, genesis locations, intensity, lifetime and other characteristics. We also study the relationship between cyclonic activity frequency and precipitation during the Meiyu period using geopotential height and water vapor flux anomalies. Section 4 offers the main discussion and findings of this study.
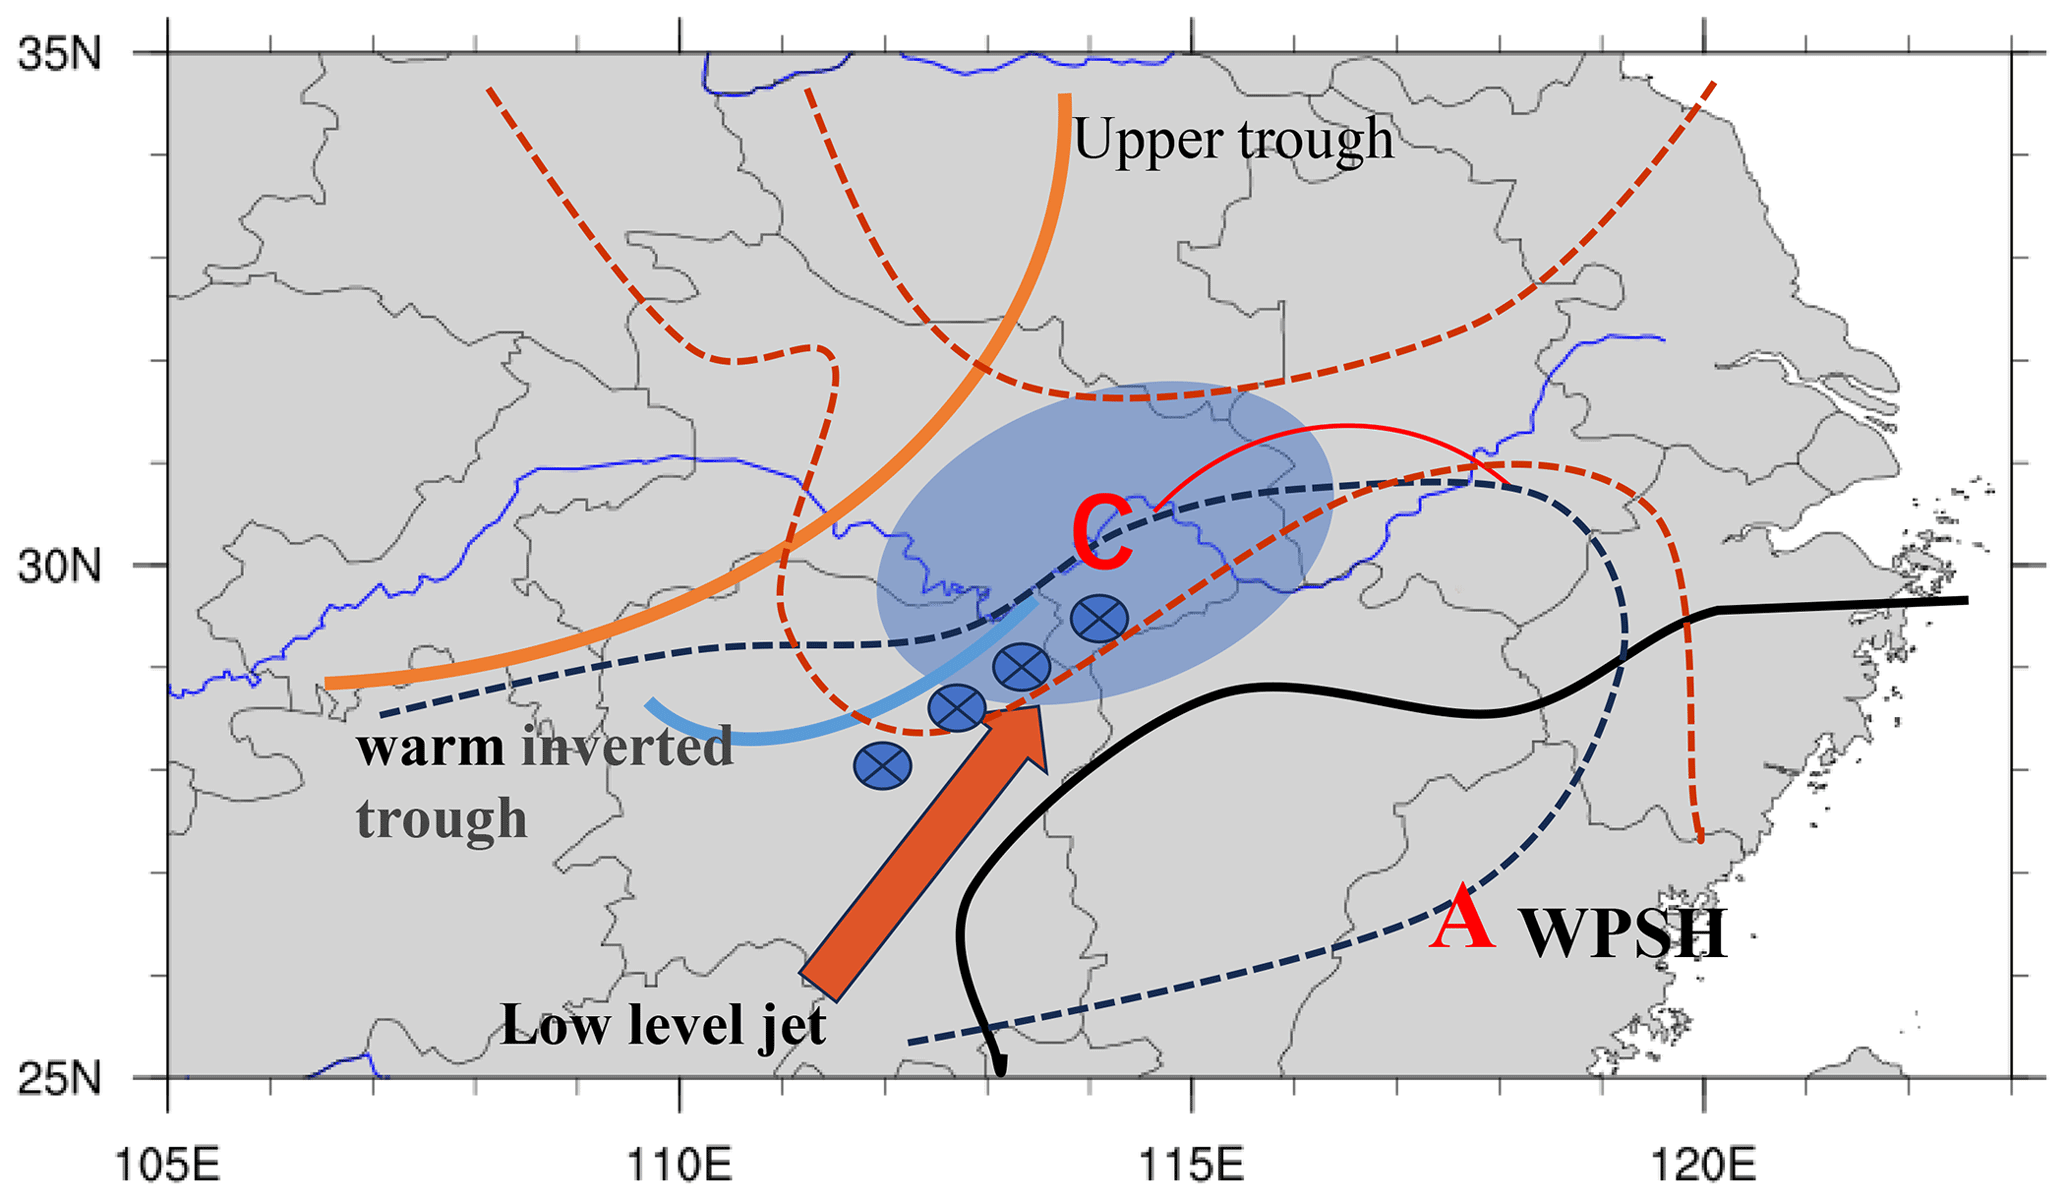
Figure 1Schematic diagram of the main weather system and the structure of temperature and pressure field in the middle and low levels of the Jianghuai cyclone. (Red dotted line: isotherm; solid black line: contour line; blue dot: precipitation area; solid orange line: 500 hPa upper-level trough; red arrow: low-level jet; black dotted line: warm inverted trough; solid red line: warm shear; solid blue line: cold shear; letter C: cyclone; letter A: WPSH.)
2.1 Data
The time span of all the data is 60 years from 1961 to 2020, and the study area is located at 27 to 34° N latitude and 108 to 123° E longitude. We use the ERA5 relative vorticity hourly data (850 hPa) provided by the European Centre for Medium-Range Weather Forecasts (ECMWF) for Jianghuai cyclone identification and tracking. These data have a spatial resolution of 0.25°×0.25° and a temporal resolution of every 6 h, with each step defined as a 6 h period. The geopotential height, wind field and specific humidity are daily values processed from ERA5 hourly data with a spatial resolution of 0.25°×0.25° (Hersbach et al., 2023). The geopotential height and wind field data include pressure levels approximately at 500 and 850 hPa. The specific humidity data include pressure levels approximately at 850 hPa. The precipitation data are from the CN05.1 grid point observation dataset compiled by the National Meteorological Information Center of the China Meteorological Administration with a resolution of 0.25°×0.25° (Wu and Gao, 2013; Xu et al., 2009).
The Meiyu intensity index is used to characterize the strength of Meiyu, and the data are from the National Climate Center of China. The calculation area of the Meiyu intensity index is defined in the government standard GB/T 33671-2017 (General Administration of Quality Supervision, 2017). The Meiyu intensity index is defined as
M is the Meiyu intensity index. L is the length of the Meiyu in a given year (unit: day), and L0 means the average length of the Meiyu over the years (units: day). R is the total precipitation of the Jianghuai River basin during Meiyu in a given year, and R0 is the average total precipitation of the Jianghuai River basin during Meiyu over the years. The average period is from 1961 to the current year. For example, L0 and R0 values for 2000 are the averages from 1961 to 2000. Where M is between −0.375 and 0.375, the China Meteorological Administration defines this year as normal. Where M is between 0.375 and 1.25, this year is defined as a little strong. Where M is greater than or equal to 1.25, this year is defined as strong. Where M is between −1.25 and −0.375, this year is defined as a little weak. Where M is less than or equal to −1.25, this year is defined as weak.
2.2 Methods
Scholars propose various methods for identifying extratropical cyclones. The vorticity tracking method suggested by Hodges (1994, 1995) is used in this paper for objective identification and tracking of cyclones. This method primarily uses the relative vorticity field at the 850 hPa to determine feature points of the cyclone, which are then matched within a given time span to correspond with the position and track of the cyclone. In addition to Hodges' relative vorticity method, other scholars have also proposed different methods for identifying cyclones. Lu (2017) improved the extratropical cyclone identification and tracking method involving the nine-point pressure minimum. Jiang et al. (2020) proposed an algorithm for identifying extratropical cyclones on the basis of gridded data. This algorithm is named the eight-section slope detection method.
Among them, the most commonly used cyclone tracking methods are the mean sea level pressure (SLP) method and the 850 hPa relative vorticity method. Mailier et al. (2006) and Zhang et al. (2012) studied the tracks of individual cyclones using these two methods. Both studies found that the 850 hPa relative vorticity method can identify and detect the cyclone center earlier than the SLP method (Mailier et al., 2006). The reason for this result is that SLP is easily influenced by topography and large-scale background circulation shear vorticity (Hodges, 1994). Therefore, based on this advantage of the relative vorticity method, we select the 850 hPa relative vorticity tracking method. This tracking method can detect low vortex systems earlier and track cyclones for a longer period of time with better stability. Even When closed pressure levels are not visible on satellite maps, the vorticity tracking method can still continue to track the cyclone, improving the accuracy of the cyclone track data.
3.1 Climatic characteristics of the Jianghuai cyclone during the Meiyu period
A total of 202 Jianghuai cyclones exist during the Meiyu period from 1961 to 2020. The range of cyclone genesis locations defined by the Jiangsu Provincial Weather Bureau (2017) and the characteristics of the relative vorticity tracking method are used. We adjust the genesis location and remove the cyclones that are generated at sea and have no effect on land precipitation (28–35° N, 108–123° E). To explore the tracks and genesis location of the Jianghuai cyclone, we conduct a statistical analysis (Fig. 2). The brown dots represent the genesis locations, the first place meeting the criterion, of the Jianghuai cyclone. The yellow lines indicate the tracks. As shown in the figure, most of these cyclones develop in the Jianghan Plain and southern Anhui Province before moving eastward towards the Yellow Sea coast. Some cyclones move northward through Shandong Province and reach the Bohai Sea. These tracks are influenced by upper-level guide airflow at 500–700 hPa. They are also affected by the WPSH and its southwest warm and moist air on its edge (Wei et al., 2013).
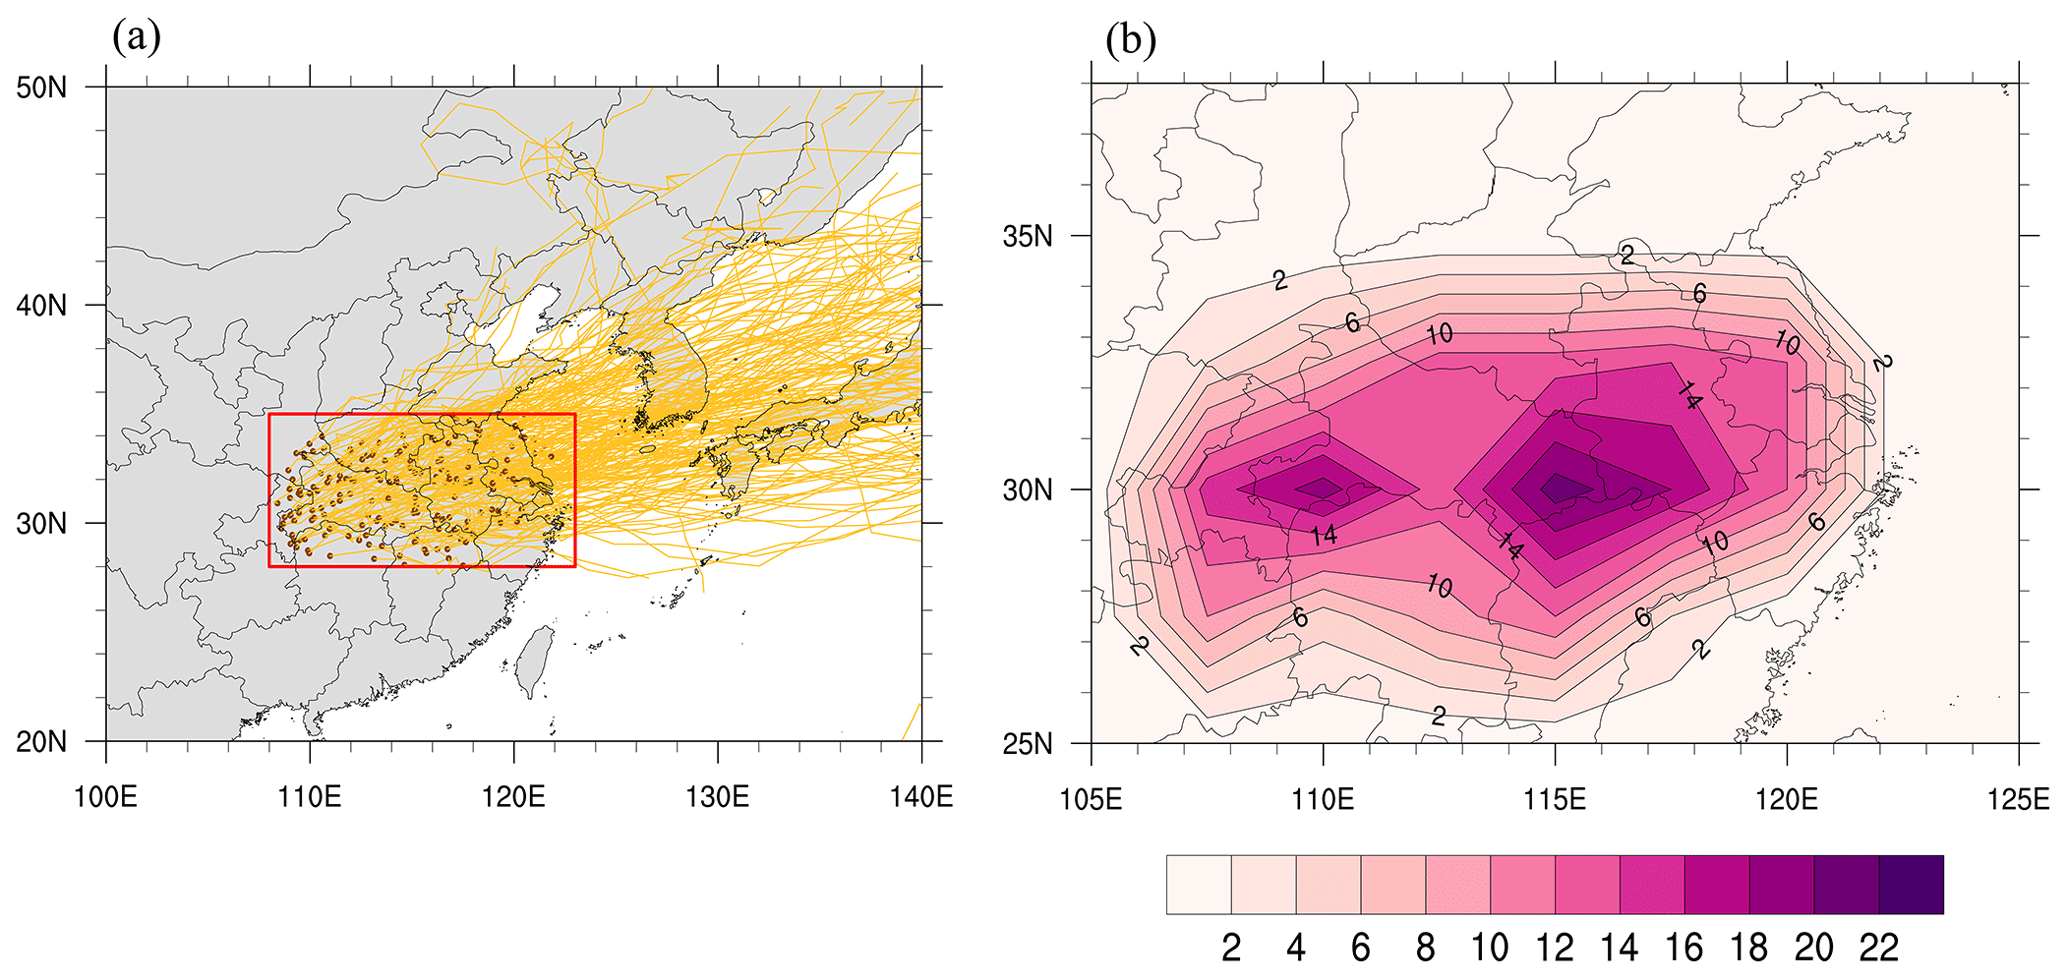
Figure 2Distribution of the cyclone genesis locations: the tracks (a) and the frequency of genesis locations refer to the total number of cyclones (b) during the Meiyu period from 1961 to 2020.
The frequency of cyclone occurrence, as shown in Fig. 2b, refers to the total number of cyclones during the Meiyu period from 1961 to 2020. The genesis locations of cyclones are mainly located in the middle and lower reaches of the Yangtze River and the Huaihe River basin, exhibiting an east–west band distribution (Wang et al., 2015; Wu et al., 2020a). In particular, the region encompassing western and eastern Hubei Province experiences a higher frequency of cyclone occurrence, which refers to the total number of cyclones during this period. Research has found a close relationship between the genesis locations of cyclones and topography (Xu, 2021; Zhang et al., 2012).
The climatological characteristics of Jianghuai cyclones over 60 years are examined, with a focus on the intensity, radius, and lifetime of cyclones on land. The intensity of the Jianghuai cyclone is defined as the relative vorticity intensity at the 850 hPa cyclone center. Lifetime is defined as the duration during which cyclones affect precipitation on land. Figure 3a illustrates that among the 202 selected cyclones, the intensity of their centers mainly ranges from to s−1. The number of cyclones in the range of to 4 s−1 has the largest proportion, accounting for 36 % of the total number of cyclones. The total number of cyclones with intensities ranging from to s−1 amounts to 180, constituting 89 % of the total. The relationship between the radius of cyclones and the number of cyclones is shown in Fig. 3b. The majority of cyclones have an average radius ranging from 300 to 800 km, constituting 96 % of the total count. Among these, the highest proportion lies within the range of 500 to 600 km, accounting for approximately 35 %. Figure 3c shows the correlation between the lifetime and the number of cyclones. Most cyclones affect precipitation on land for a period of 1–3 d. The number of cyclones' lifetimes that affect precipitation on land within 2 d is 186, accounting for 92 % of the total number.
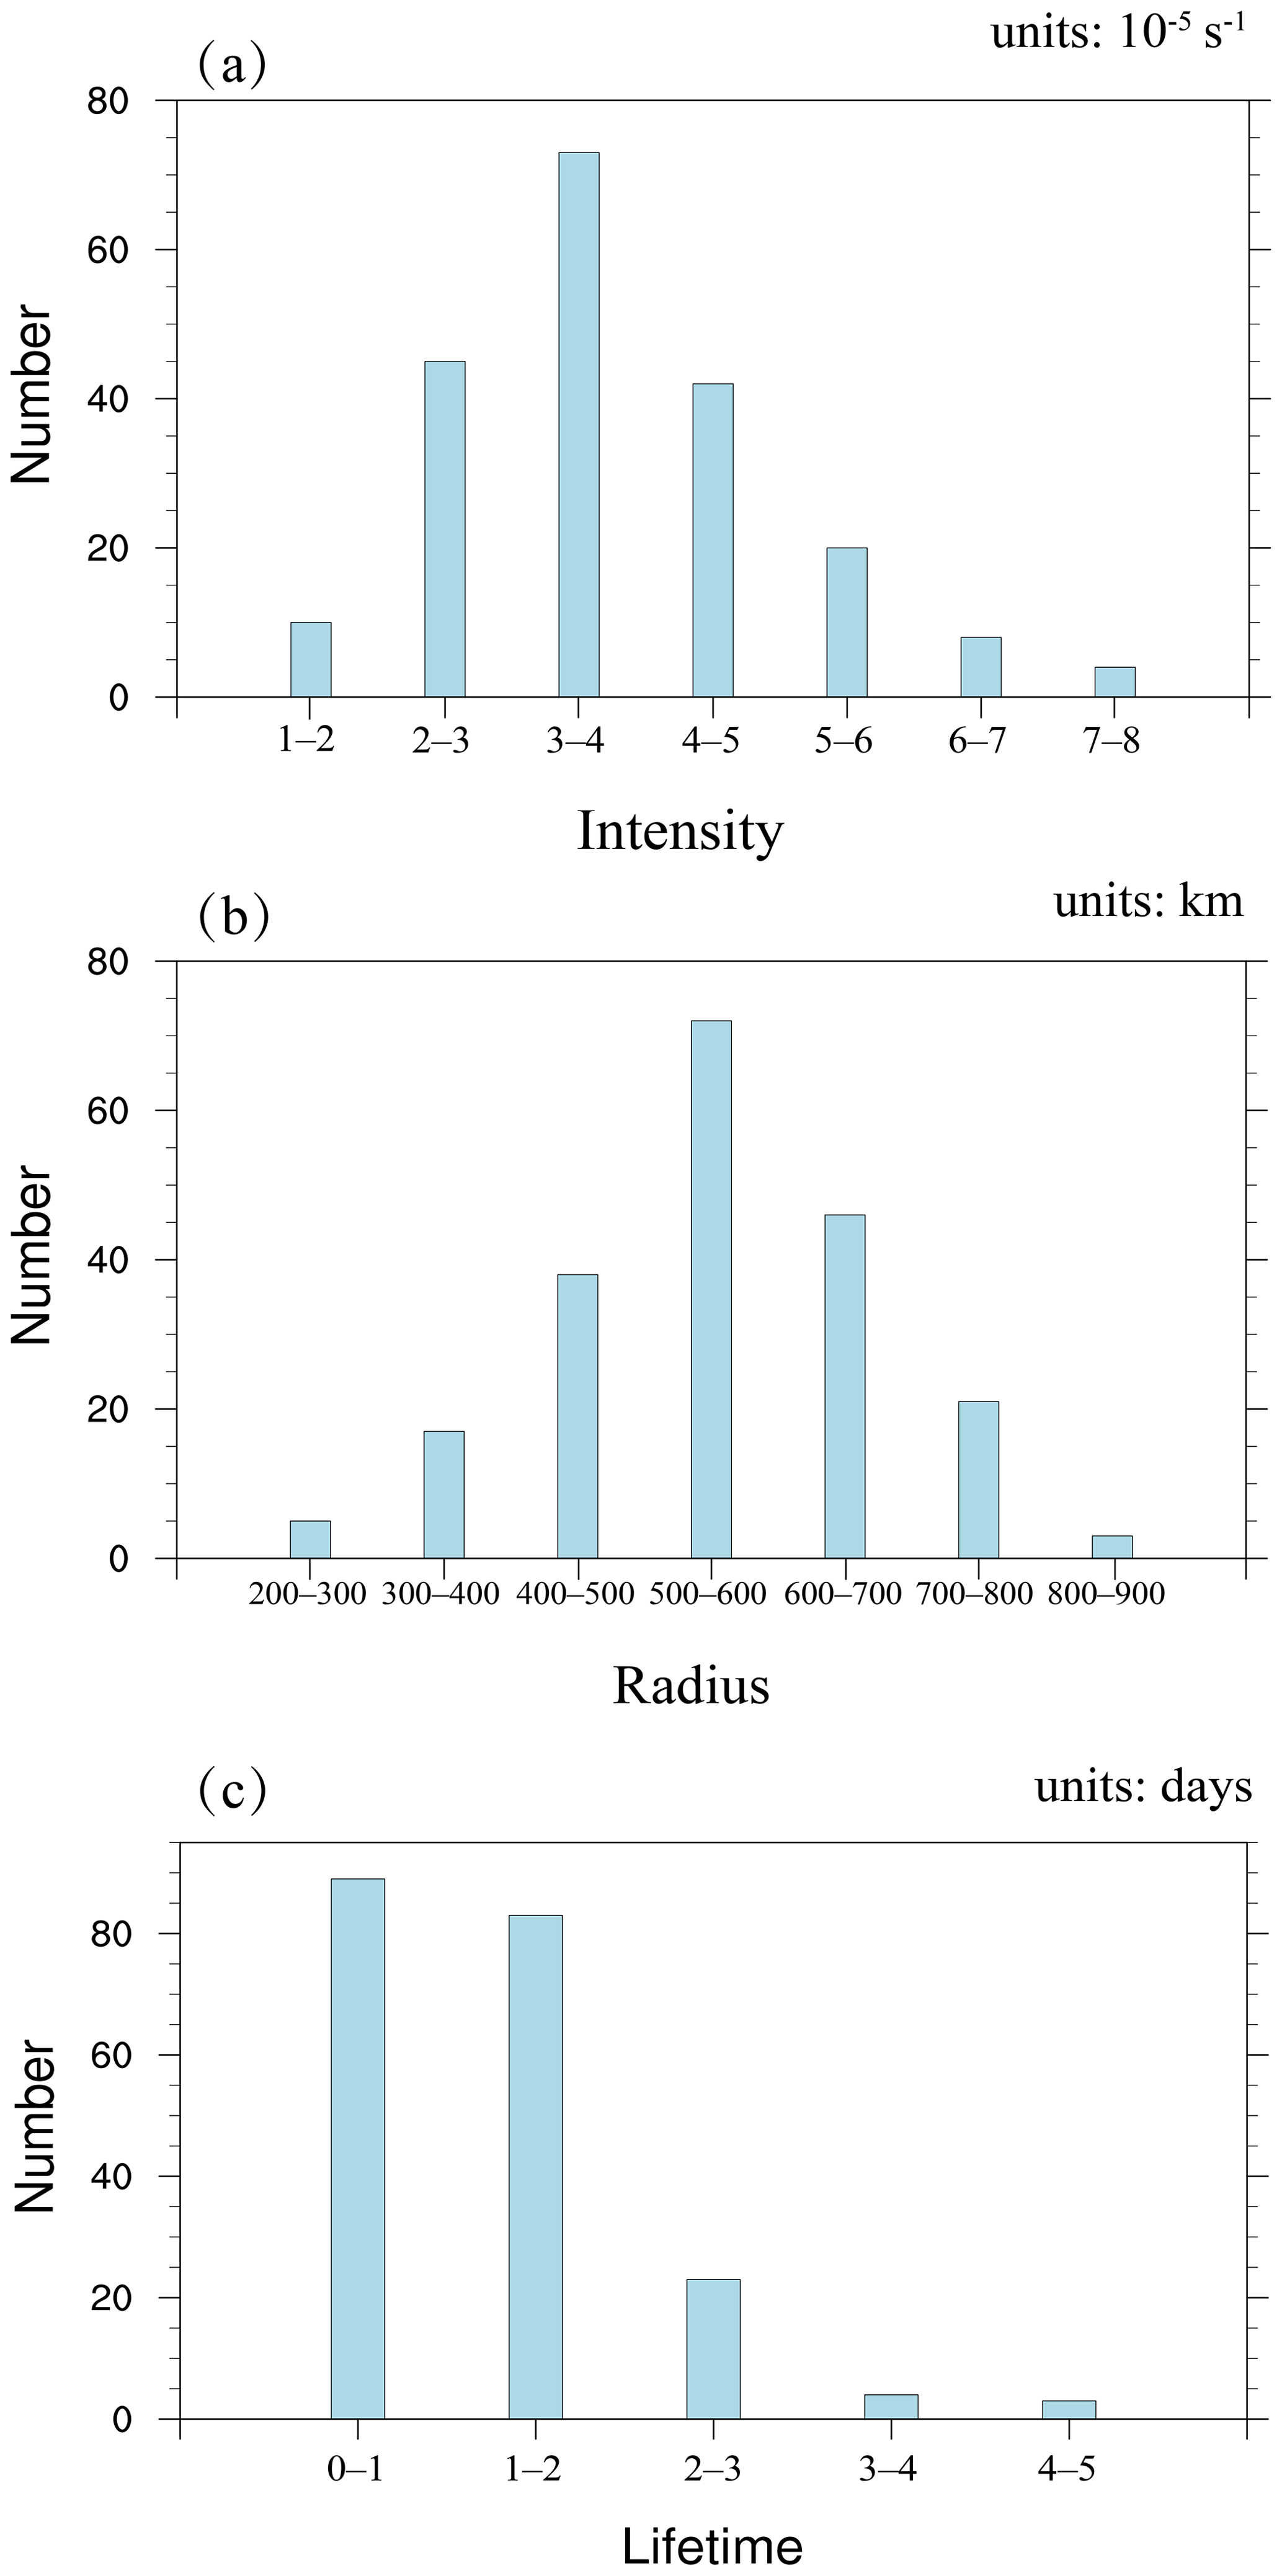
Figure 3Distributions of the number of selected cyclones versus their (a) intensities (units: 10−5 s−1), (b) radii (units: km) and (c) lifetimes (units: days).
The intensity of the cyclone is one of the factors affecting its precipitation and impact range during the Meiyu period (Zhao et al., 2010). Figure 4a shows a positive correlation between the maximum intensity and the maximum radius of cyclone development. Therefore, most strong cyclones have a larger horizontal scale than weak cyclones, resulting in greater precipitation and a larger precipitation range. From the distribution of difference values in track step between the maximum intensity and radius of the cyclone shown in Fig. 4b, it can be observed that 45 % of all cyclones reach both their maximum intensity and horizontal scale simultaneously. Among the remaining Jianghuai cyclones, more of them reach maximum intensity first and continue to develop to the maximum horizontal scale.
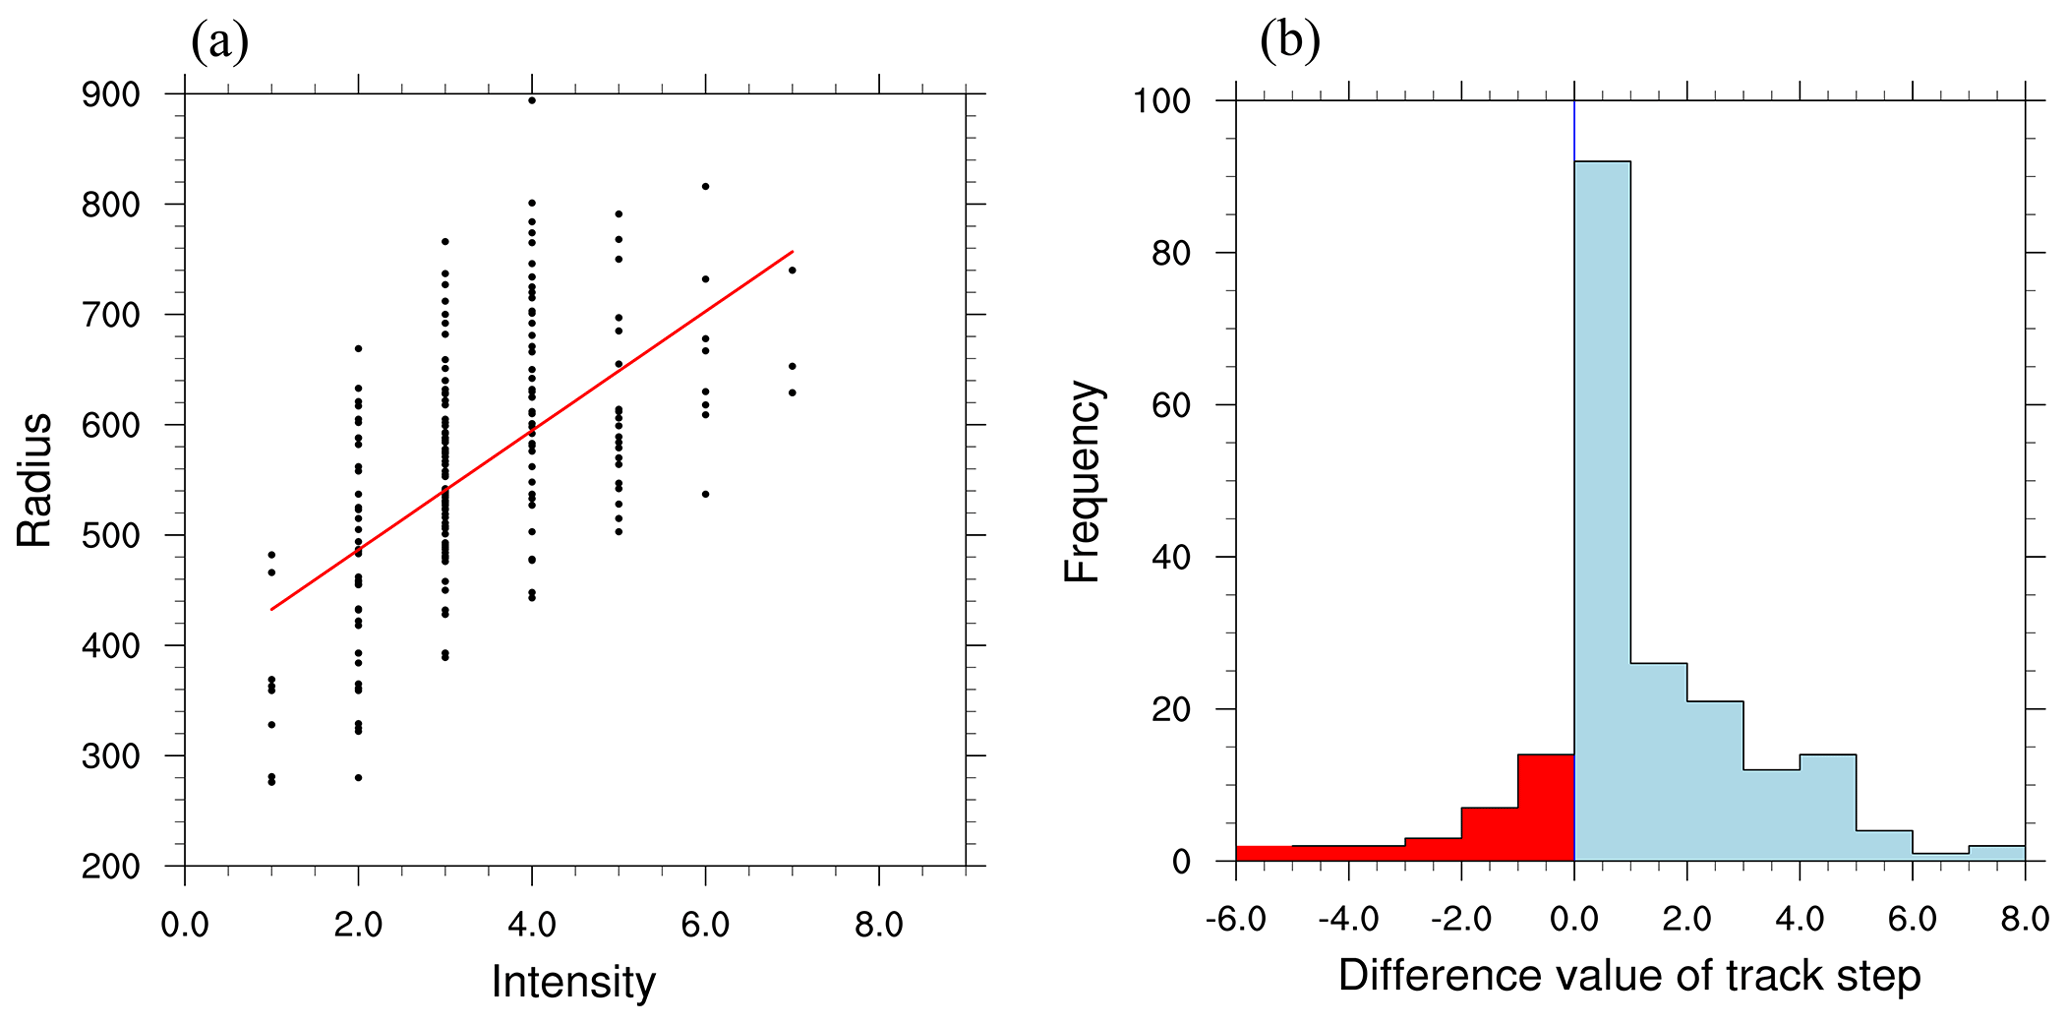
Figure 4Correlation between maximum intensity (units: 10−5 s−1) and maximum radius (units: km) (a) and their difference value of track step during the development of the Jianghuai cyclone in the Meiyu period (b).
The frequency of Jianghuai cyclone occurrence refers to the total number of cyclones characterized by quasi-periodic variation (Fig. 5). The shaded area in the figure indicates that the 95 % confidence interval, according to Student's t test, is passed. A strong quasi-periodic variation of 2–4 years is observed for 1980–1990 and 1990–2000. After 2000, there is an approximate change period of 4–5 years in cyclones. This change period corresponds to the period of abnormal change in Meiyu. Chen et al. (2019) pointed out that a quasi-periodic change of 3–4 years is the main component of abnormal changes in Meiyu. This component of the quasi-periodic variable is mainly influenced by the Indian Ocean dipole (IOD) (Liang et al., 2018). During the positive phase of the IOD, strong warming of the Indian Ocean triggers a strong Indian monsoon, leading to a strengthening WPSH and increased precipitation in southern China. The southwesterly low-level jet, which is enhanced by the positive IOD, also provides water vapor and warm advection to generate favorable conditions for the development of the Jianghuai cyclone.
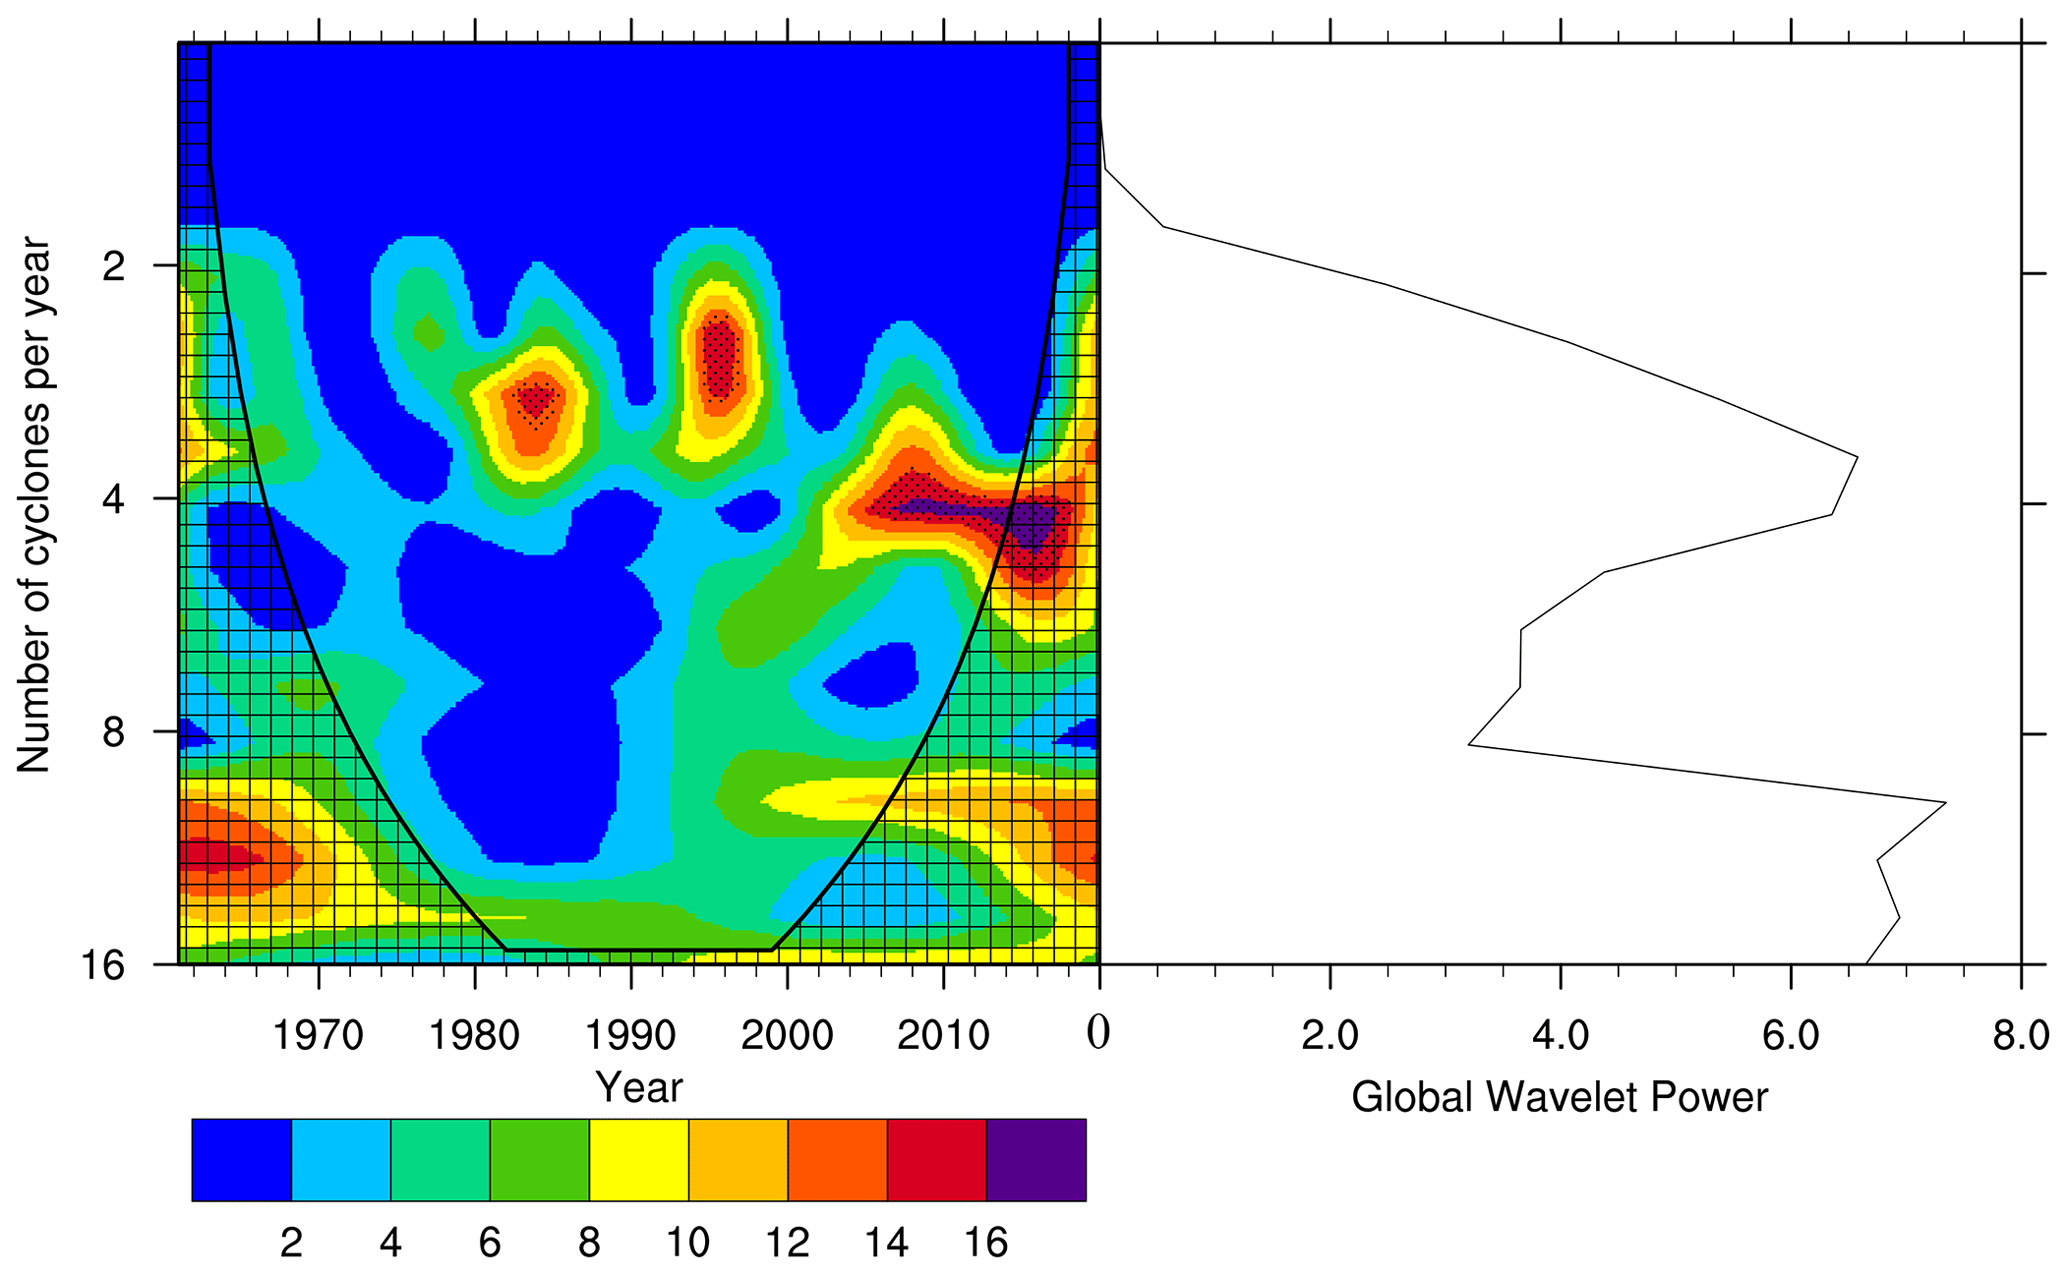
Figure 5Periodic wavelet analysis diagram of Jianghuai cyclones during the Meiyu period from 1961 to 2020 (units: year) (shadow indicates passing the 95 % confidence interval according to Student's t test).
Jianghuai cyclones are characterized not only by quasi-periodic variation but also by significant decadal variation. Figure 6 shows the anomaly in activity frequency and the 5-year sliding average of cyclones during the Meiyu period from 1961 to 2020. The frequency of cyclone activity is the highest in 1996 and the lowest in 1961 and 2009. In the long term, there are positive anomalies in cyclone activity frequency in the middle and lower reaches of the Yangtze River during 1965–1970, 1990–2000 and after 2000, while negative anomalies occurred during 1970–1990 and 2000–2010. The decadal variation evolution of Jianghuai cyclones is similar to the decadal variation of precipitation during the Meiyu period (Chen et al., 2019). The decadal variation of precipitation during the Meiyu period with a positive anomaly in 1965–1970, 1995–2000 and 2010–after, as well as a negative anomaly in 1970–1980, 1985–1995 and 2000–2010.
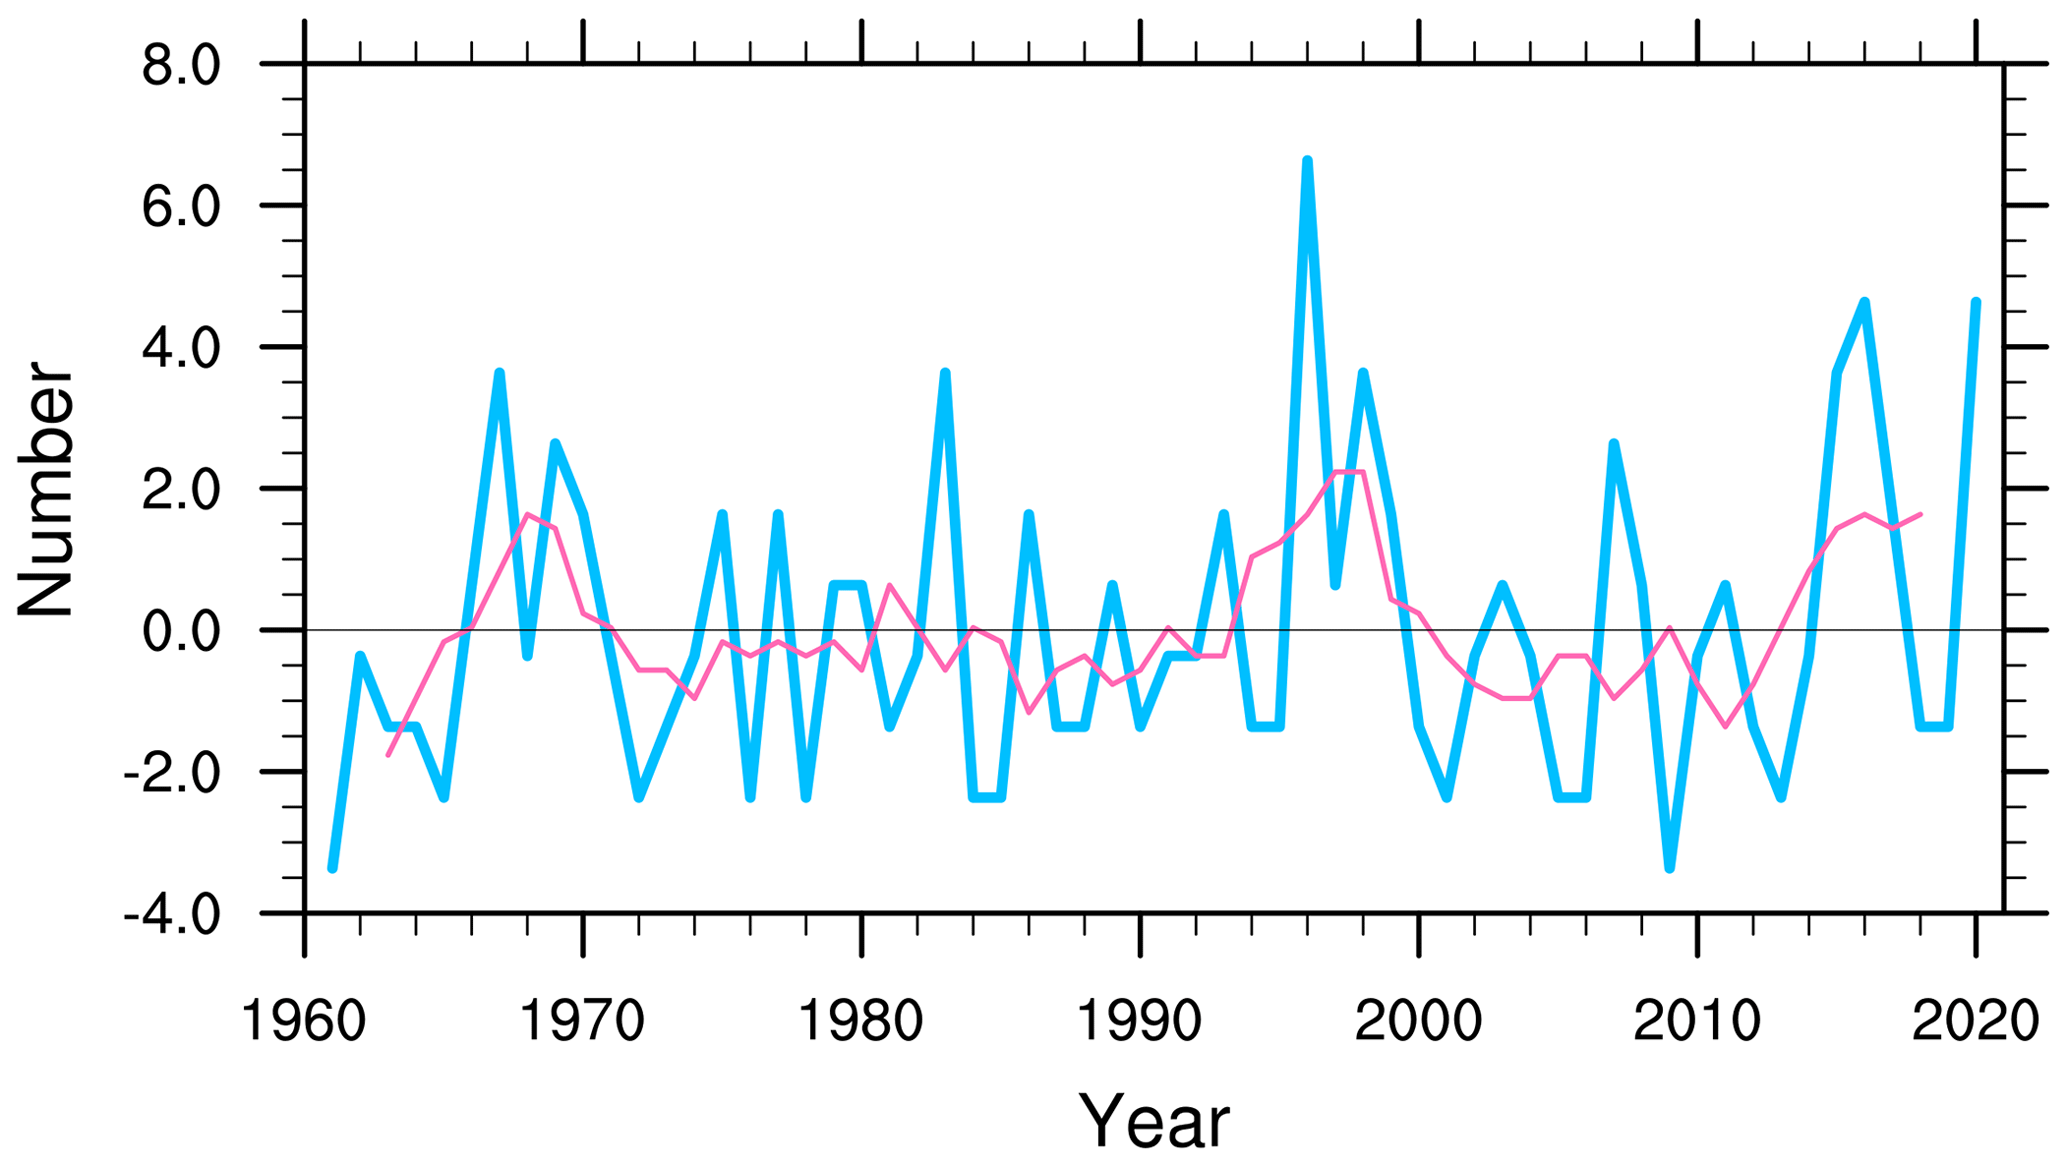
Figure 6Frequency anomaly and 5-year sliding average of cyclones. The blue line shows the anomalies in the number of cyclones, and the pink line shows the 5-year sliding average of the anomalies.
3.2 Linkage between cyclone activity and concurrent rainfall in the middle and lower reaches of the Yangtze River
The Jianghuai cyclones are mainly active in the middle and lower reaches of the Yangtze River (Huang et al., 2019; Li et al., 2002). Due to the strengthening westward extension of the WPSH during the Meiyu period, the Jianghuai cyclones are partially restricted from reaching the sea (Qin and Wei, 2015; Wu et al., 2020b). They generate rainstorms in both the middle and lower reaches of the Yangtze River and coastal areas. A significant portion of the precipitation during the Meiyu period comes from cyclone precipitation (Zhang et al., 2018). The intensity of Meiyu is typically measured by its intensity index, which is influenced not only by precipitation but also by the number of rainy days throughout this period. Both factors collectively determine that year's Meiyu intensity.
The time series plots of the number of cyclones related to precipitation and the intensity index during the Meiyu period from 1961 to 2020 are presented in Fig. 7a and b. We find that there is a positive correlation coefficient of 0.77 between the number of cyclones and precipitation in the Meiyu period, passing the Student's t test at a confidence interval of 99 %. Additionally, we observe a positive correlation between the number of cyclones and the Meiyu intensity index, with a correlation coefficient of 0.76 also passing the Student's t test at a confidence interval of 99 %.
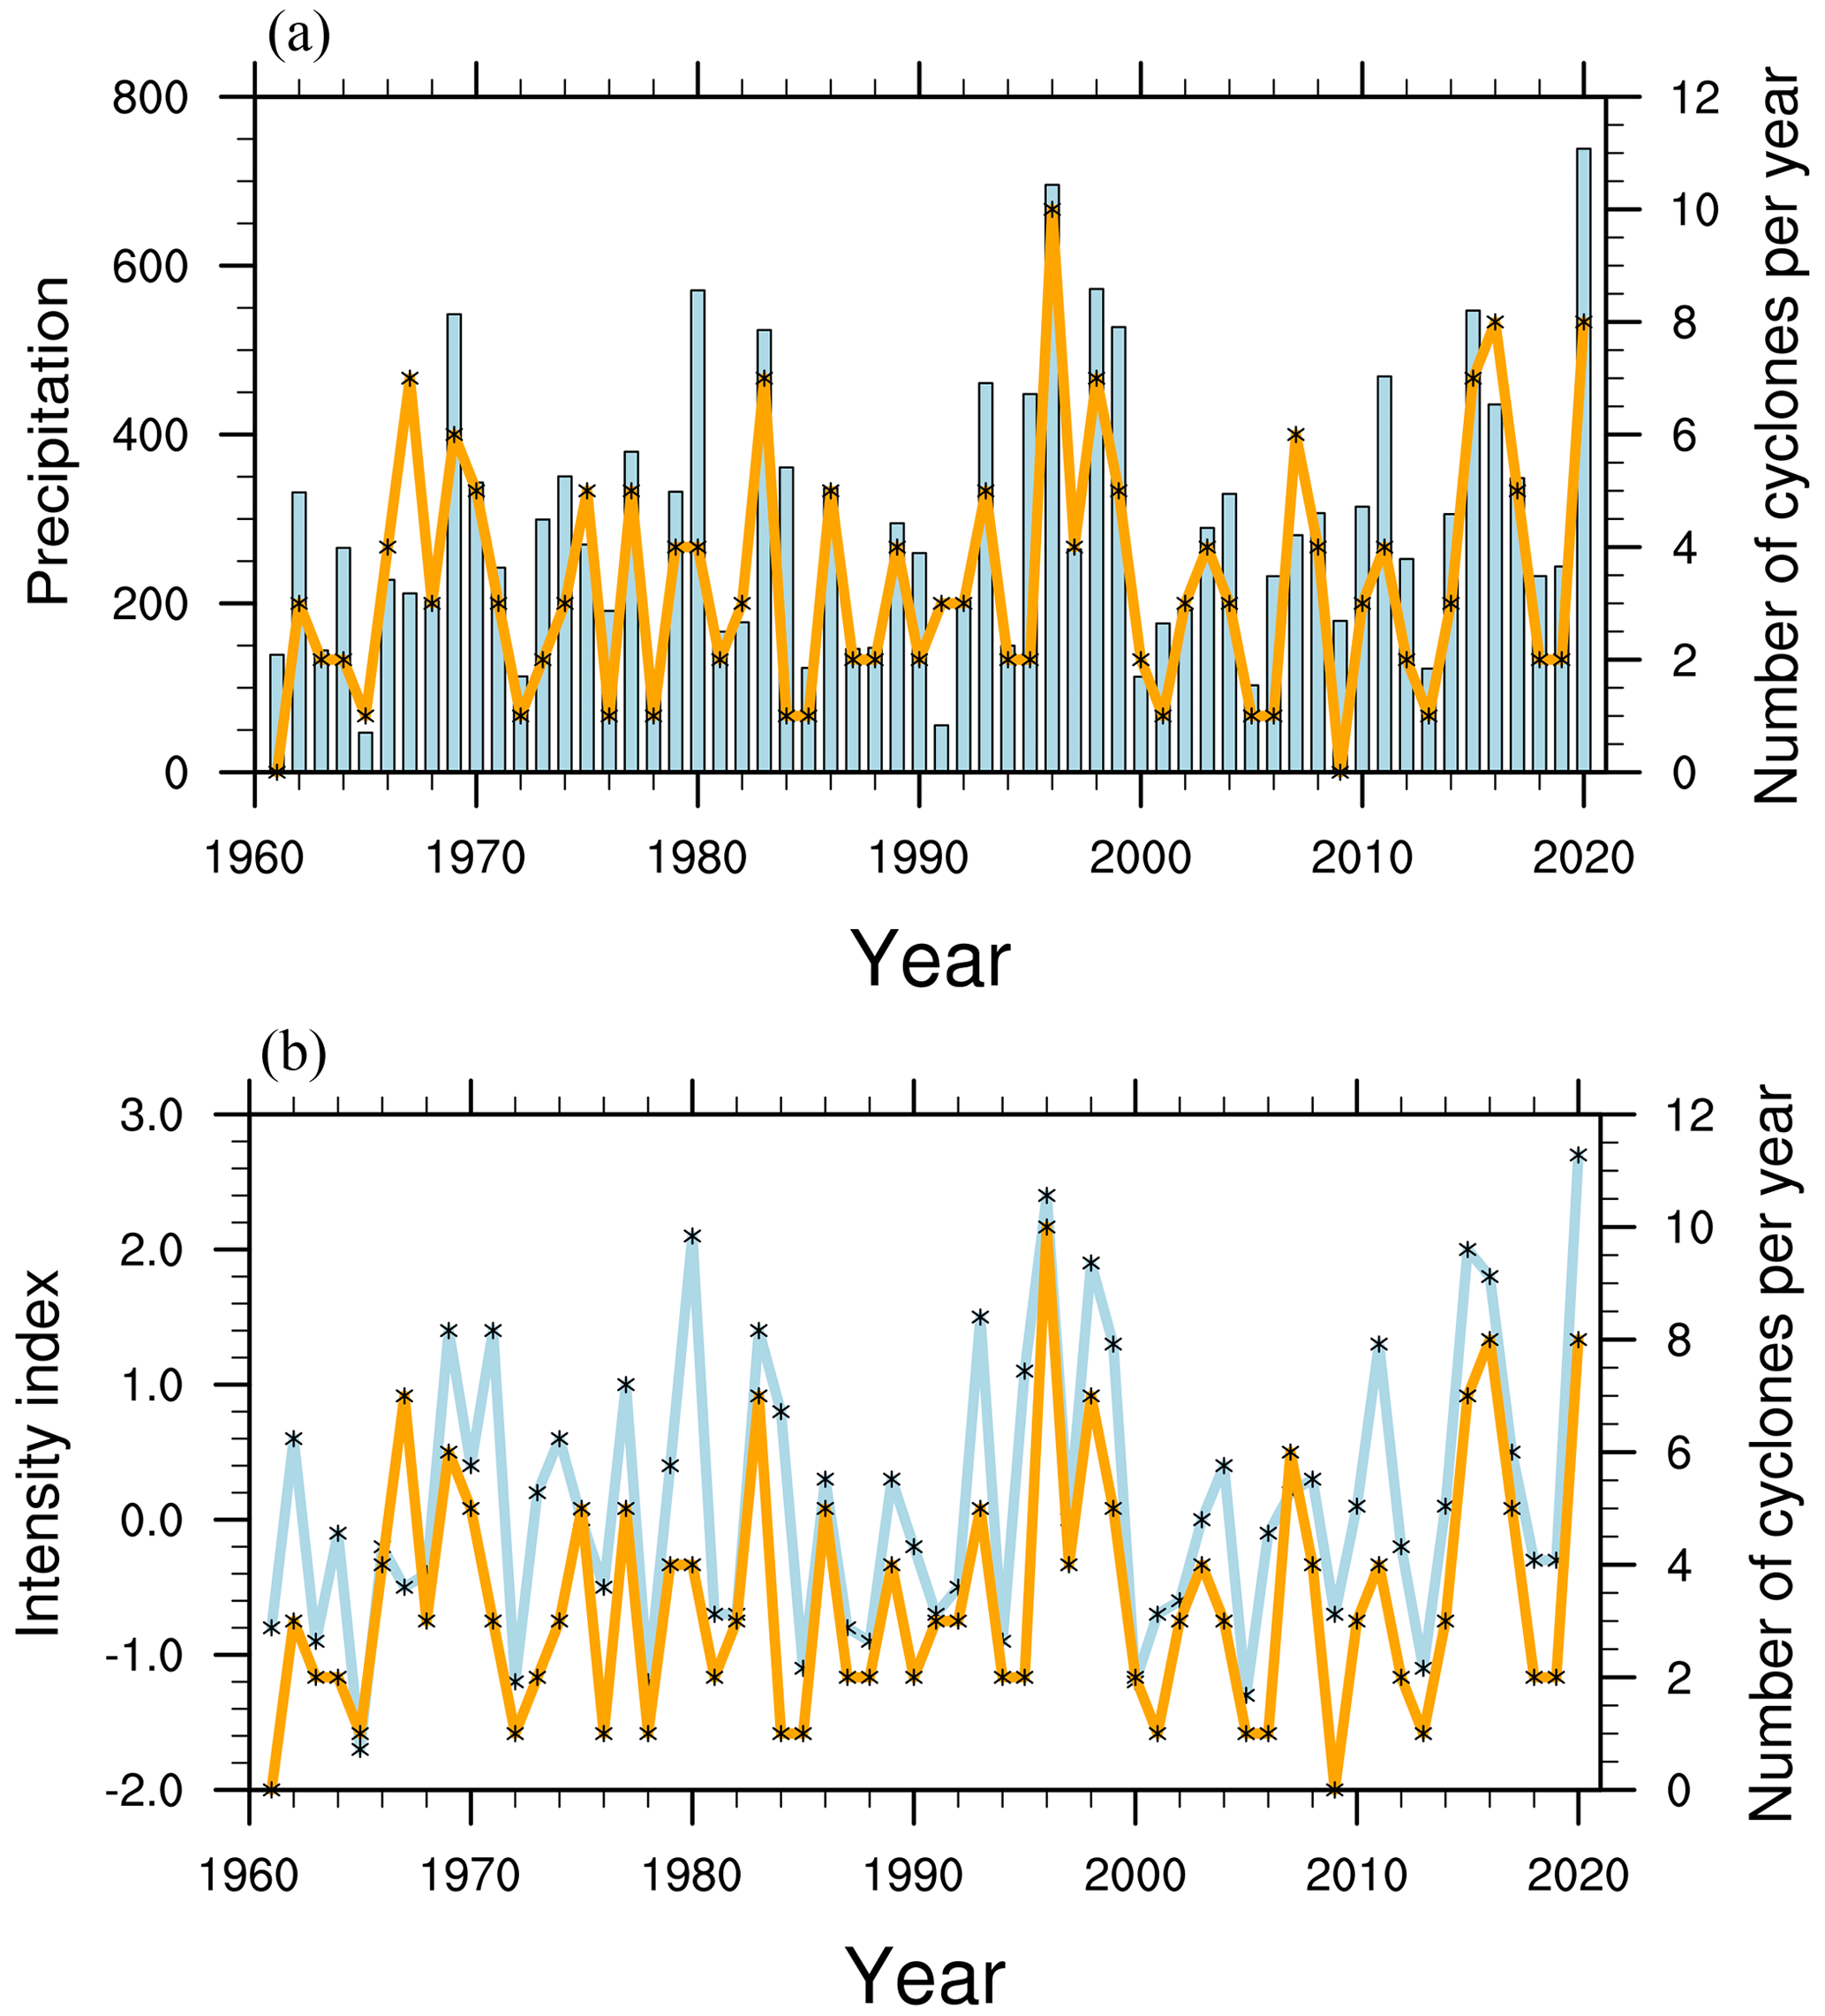
Figure 7(a) Changes in precipitation (blue bar chart) (unit: mm d−1) and the number of cyclones (orange line); (b) intensity index (blue line) and the number of cyclones (orange line) in the Meiyu period from 1961 to 2020.
Figure 8a shows the spatial distribution of mean annual total precipitation during the Meiyu period from 1961 to 2020. The areas with high precipitation values in the middle and lower reaches of the Yangtze River are mainly located in Dabie Mountains of Anhui Province, northern Jiangxi Province, eastern Hubei Province and western Hubei Province. In southern Anhui, the maximum average annual precipitation during the Meiyu period can even exceed 480 mm. The occurrence of high-precipitation areas during the Meiyu period is closely related to the region topography (Wu et al., 2023).
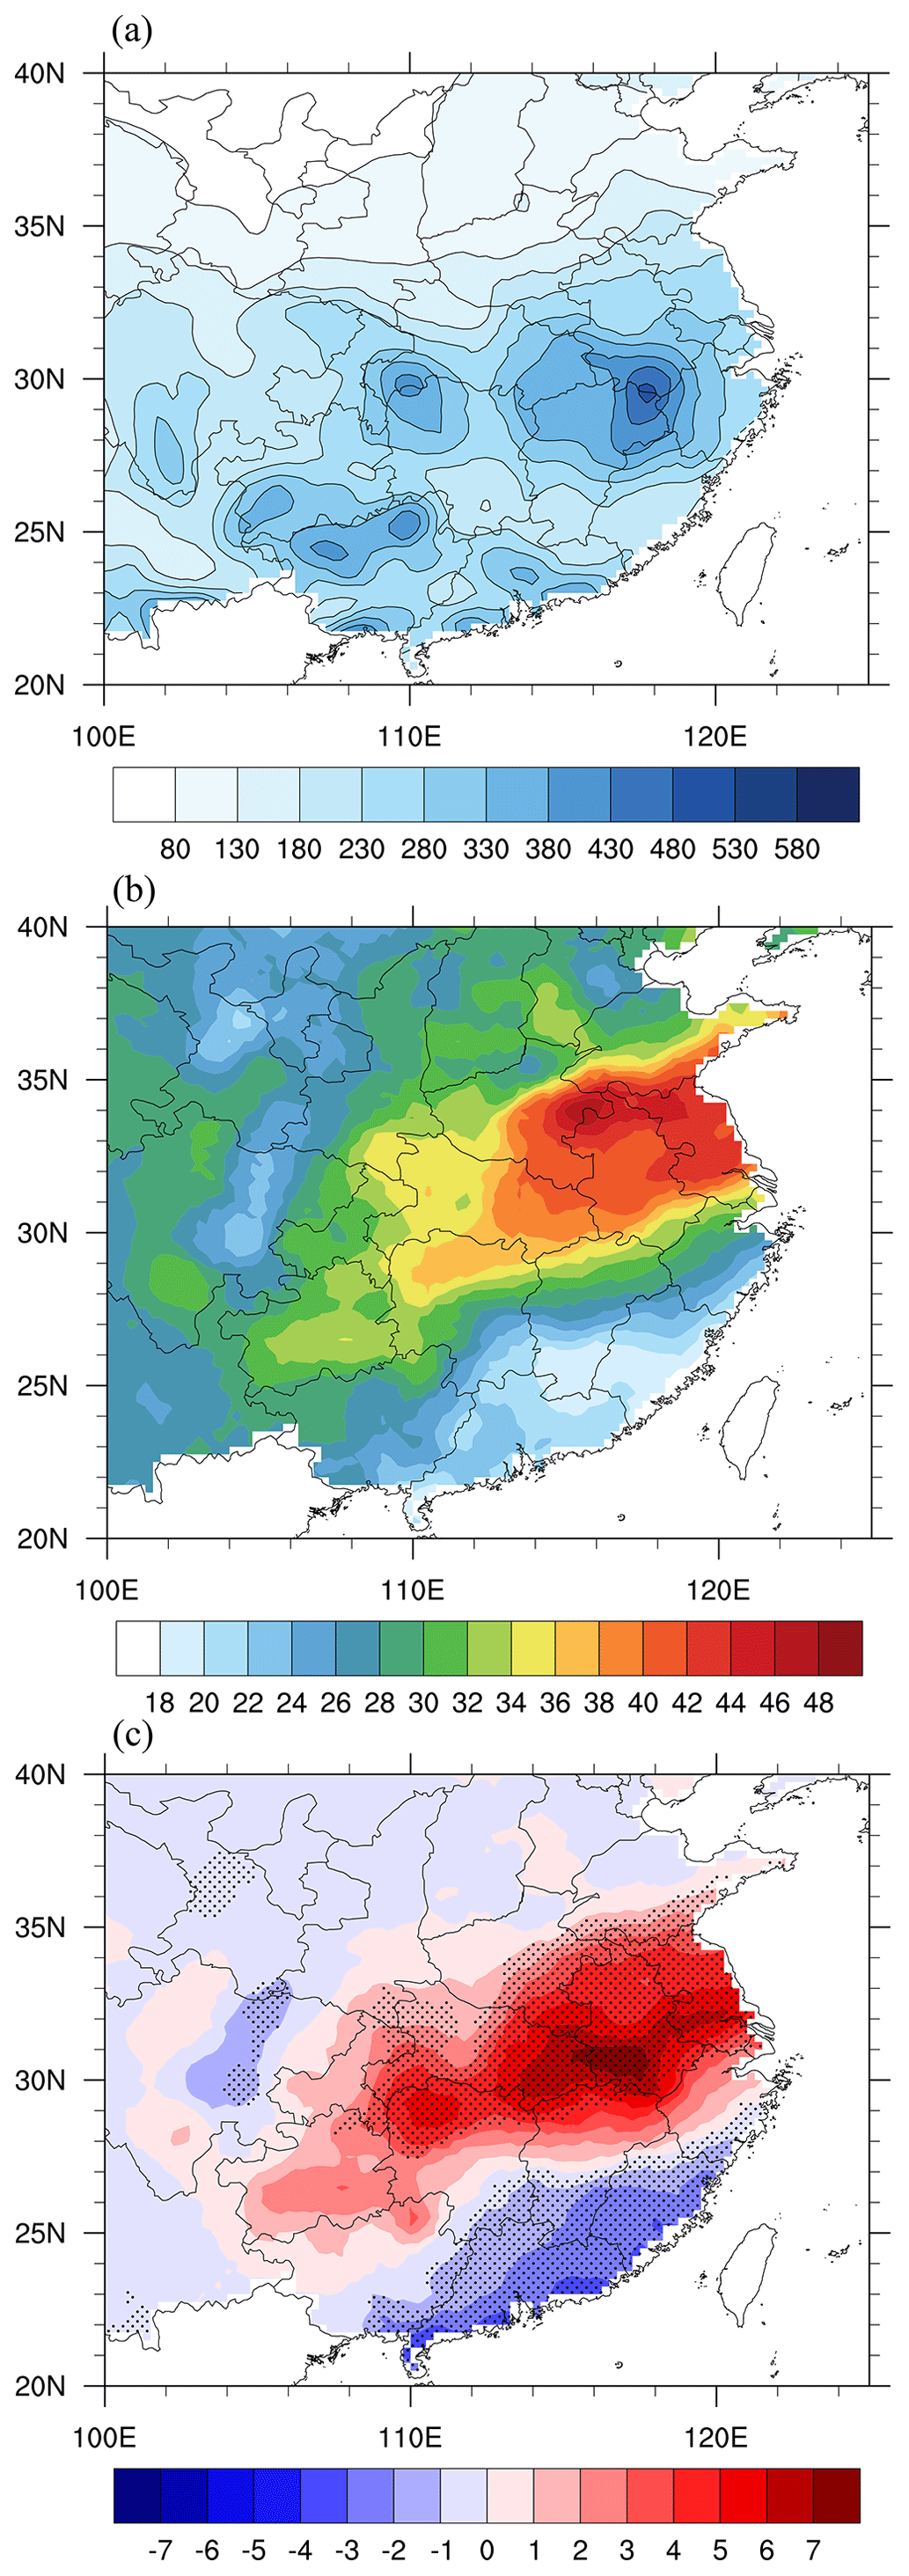
Figure 8(a) Mean annual total precipitation during the Meiyu period from 1961 to 2020 (units: mm yr−1); (b) proportion of Jianghuai cyclone precipitation relative to total precipitation during the Meiyu period (units: %); (c) daily mean precipitation anomaly of the Jianghuai cyclone during the Meiyu period (units: mm d−1) (shadow indicates passing the 95 % confidence interval according to Student's t test).
If precipitation and Jianghuai cyclone activity occur on the same day during the Meiyu period, we define that day as a Jianghuai cyclone precipitation day. Figure 8b shows the spatial distribution of the proportion of cyclone precipitation relative to total precipitation during the Meiyu period. As depicted in the figure, the middle and lower reaches of the Yangtze River are primarily affected by cyclone precipitation. The Huaihe River basin in northern Anhui Province is particularly impacted, with cyclone precipitation accounting for over 47 % of total precipitation during the Meiyu period. In other regions, cyclone precipitation accounts for more than 35 % of total rainfall. In general, the degree of cyclone-influenced precipitation in the middle and lower reaches of the Yangtze River shows an east–west band distribution and a gradual decrease from coastal to inland areas. This suggests that both the concentration of high-value areas and band distribution characteristics are associated with northeastward and eastward tracks followed by Jianghuai cyclones. The capacity for producing precipitation gradually increases as these cyclones develop.
Figure 8c shows the spatial distribution of the daily mean precipitation anomaly associated with the Jianghuai cyclone. The shaded region indicates that the 95 % confidence interval is passed according to Student's t test. The mentioned anomalies refer to the difference value between the daily mean values of meteorological elements during selected Jianghuai cyclones and their corresponding values over a 60-year period. During active periods of the Jianghuai cyclone, abnormal increases in precipitation are observed in the middle and lower reaches of the Yangtze River eastward of 108° E, while Fujian, Guangdong, and other regions experience abnormal decreases. Notably, the precipitation anomalies exceed 7 mm d−1 in southern Anhui, eastern Hubei and northern Jiangxi. The high-value regions for precipitation anomalies are consistent with the high-value areas of cyclone occurrence frequency. This suggests a connection between the spatial distribution of precipitation anomalies and cyclone genesis locations. Furthermore, this phenomenon of increasing and decreasing precipitation anomalies is bounded by approximately 27° N and distributed north–south in dipole form.
The evolution of composite geopotential height and horizontal wind anomalies for two different levels of Jianghuai cyclones from day −4 to +2 during the Meiyu period is shown in Fig. 9. Composite geopotential height anomalies are significant at the 95 % confidence level based on Student's t test. Vectors are plotted if wind anomalies are significant at the 95 % confidence level based on Student's t test in at least one direction.
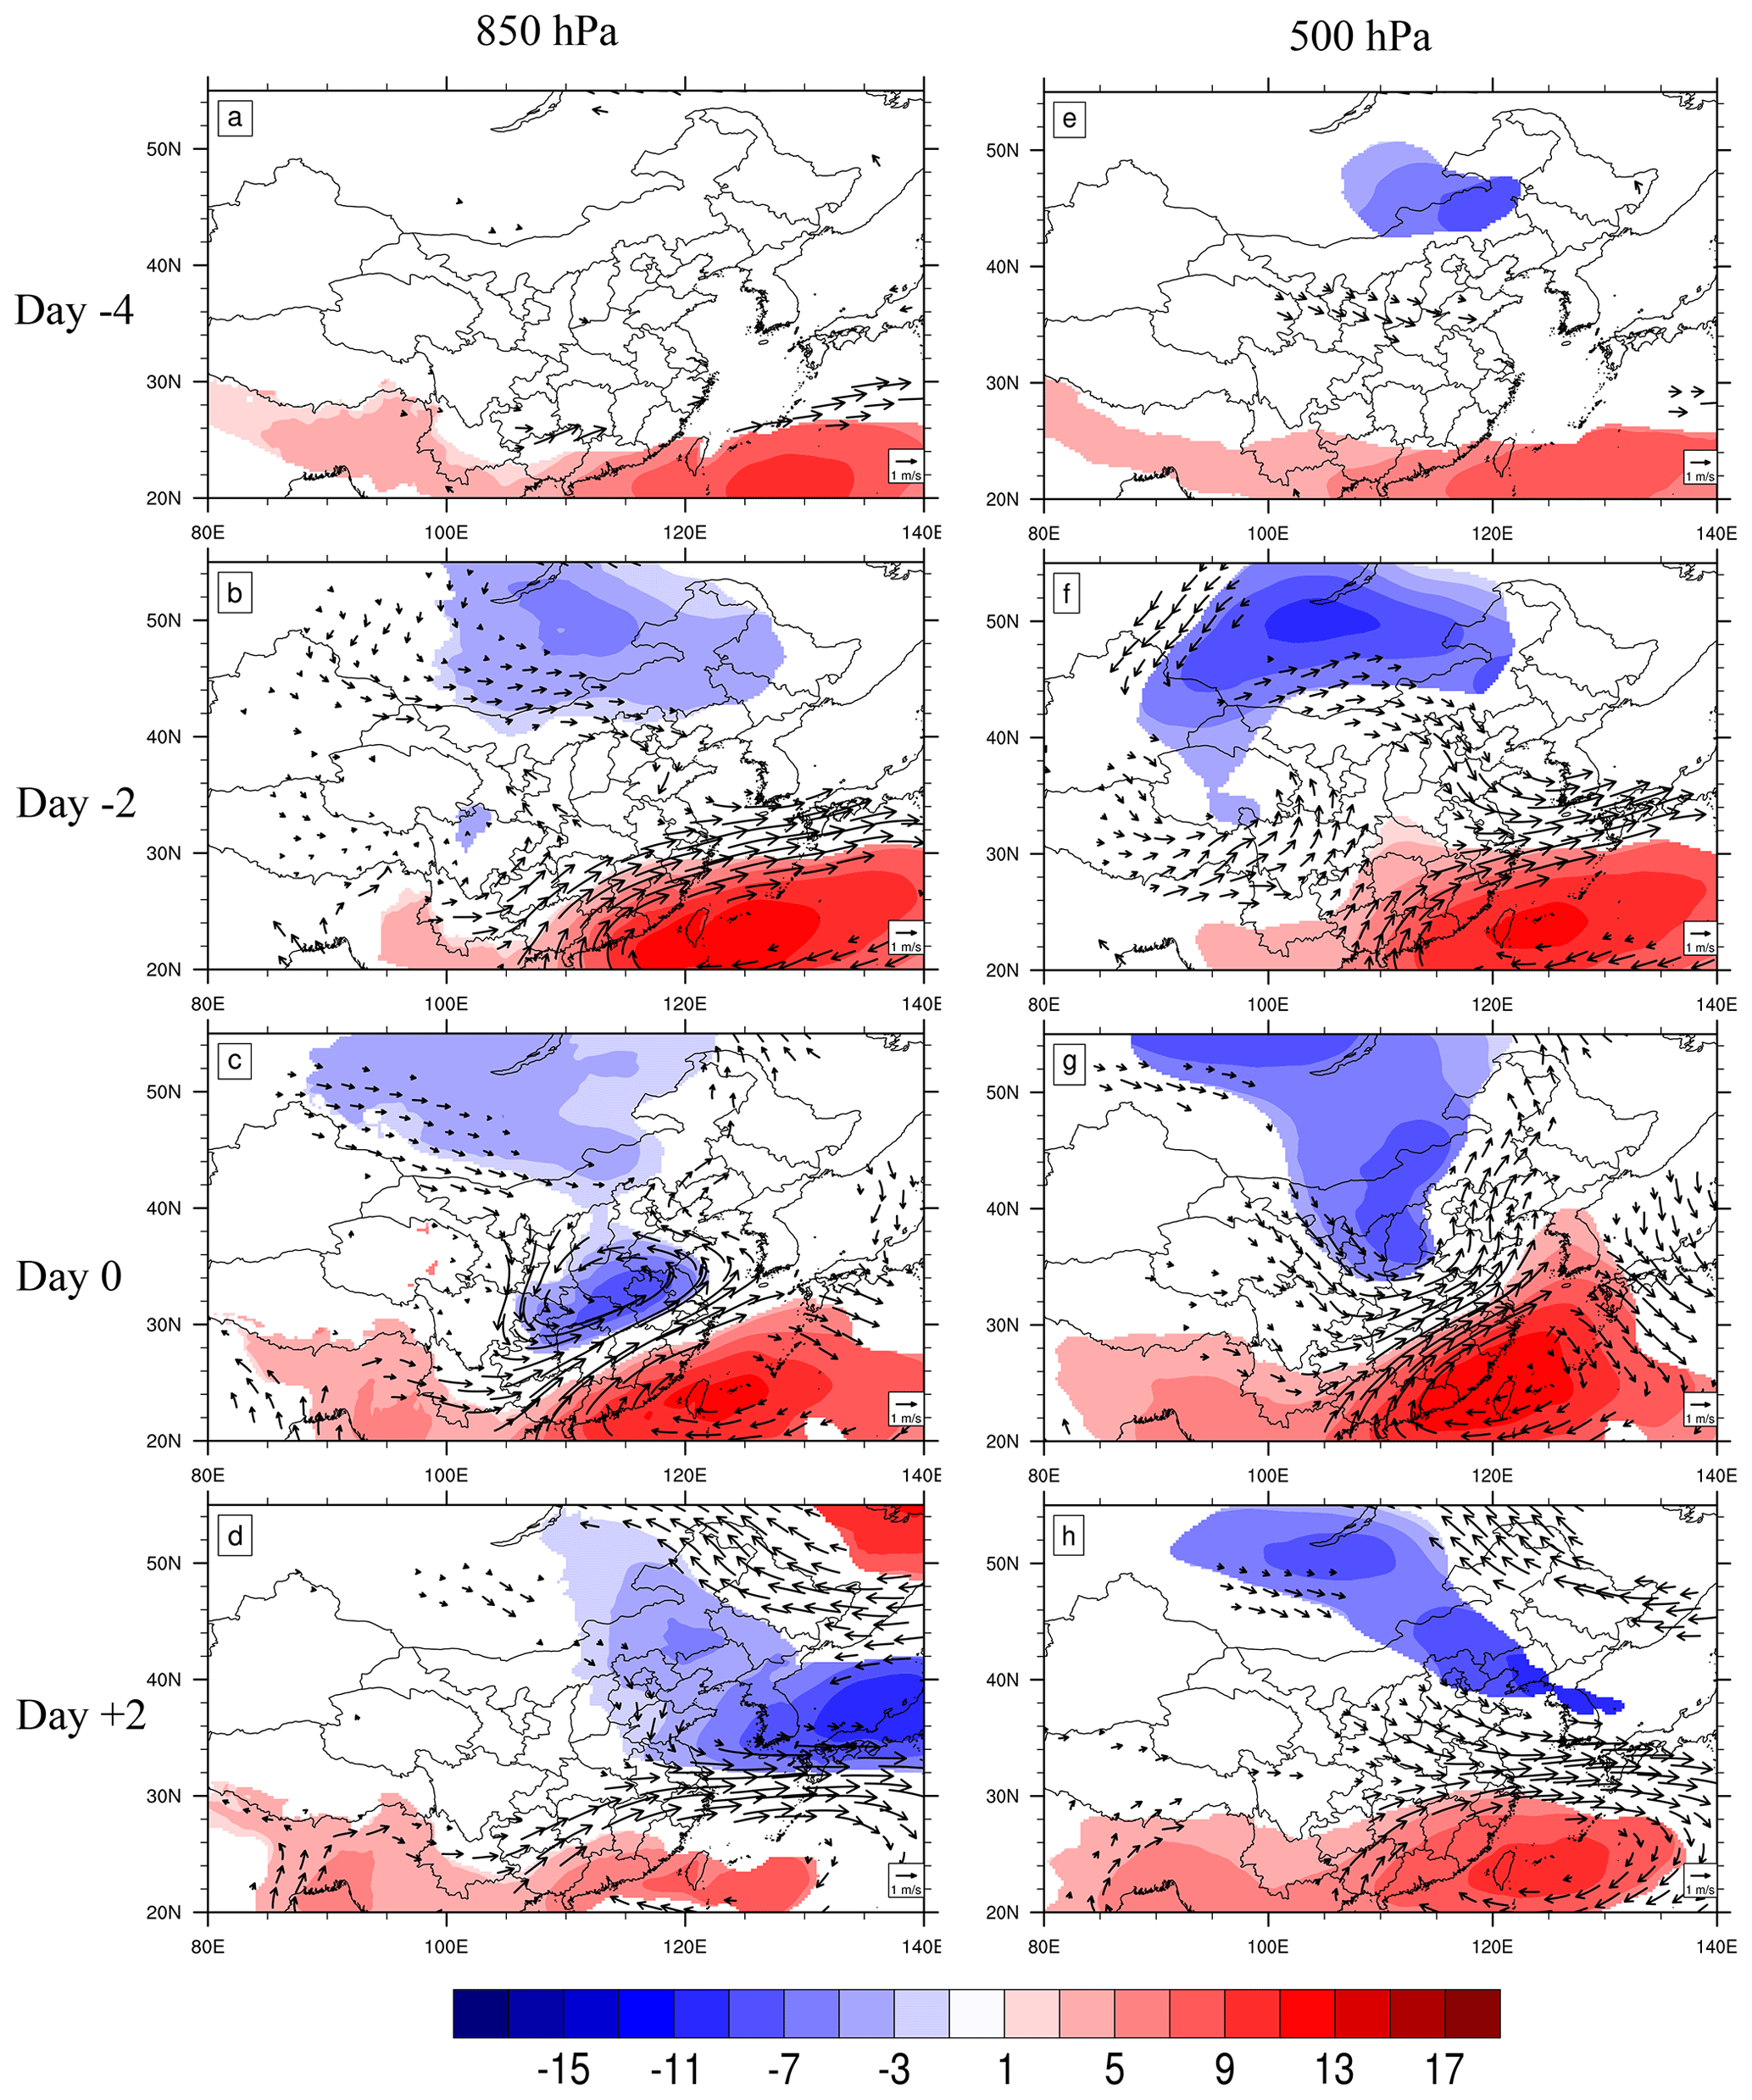
Figure 9Evolution of composite geopotential height anomalies (shading; units: gpm) and horizontal wind anomalies (units: m s−1) on the 850 and 500 hPa isobaric surfaces for day −4 (a, e), day −2 (b, f), day 0 (c, g) and day +2 (d, h) for the 202 selected Jianghuai cyclones. Shading indicates that composite geopotential height anomalies are significant at the 95 % confidence level based on Student's t test. Vectors are plotted if wind anomalies are significant at the 95 % confidence level based on Student's t test in at least one direction.
Day 0 is the day on which the cyclone first appears in the specified area. On day 0, most areas of the middle and lower Yangtze River in the lower and middle troposphere (850 hPa) are covered by significant negative geopotential height anomalies with peak magnitudes greater than −11 gpm. There is a significant positive geopotential height anomaly with a peak magnitude of over 13 gpm on the southeast side of the negative geopotential height anomaly. These anomalies form meridional dipole structures in the geopotential height field of the middle and lower troposphere. The southwest wind anomaly is significant in the middle and lower reaches of the Yangtze River. Southern Anhui Province and northern Jiangxi Province are between the positive geopotential height anomaly and negative geopotential height anomaly. The existence of these anomalies indicates enhanced southwest rapids and strengthening of WPSH. The negative geopotential height anomalies at 500 hPa on day 0 are mainly observed in Mongolia, Shanxi and other regions. Strong southwest wind anomalies exist between these positive and negative geopotential height anomalies. The negative geopotential height anomalies exceed −7 gpm in the Mongolian region.
The negative geopotential height anomalies on all the isobaric surfaces can be traced back to Mongolia, Inner Mongolia and parts of Northeast China on day −2. Negative geopotential height anomalies at 500 hPa can be traced back to day −4. On day −4, significant southwestern wind anomalies exist in southwestern Hunan at 850 hPa. Significant northwest wind anomalies exist in the Yellow River basin of China at 500 hPa. On day −2, the negative geopotential height anomalies in Mongolia, Inner Mongolia and some northeastern areas are enhanced. The positive geopotential height anomalies of the WPSH are enhanced and extend northward to the southern part of the middle and lower reaches of the Yangtze River. There are significant southwest wind anomalies in the south of the middle and lower reaches of the Yangtze River, while there are significant northwest wind anomalies at 500 hPa in northern Anhui Province and Jiangsu Province. The negative geopotential height anomalies move eastward with the formation and development of Jianghuai cyclones. On day +2, anomalous southwest winds combined with northwest winds mainly affect the lower reaches of Yangtze River region. The positive geopotential height anomaly of the WPSH is weakened.
Therefore, the abnormal precipitation caused by the Jianghuai cyclone mainly originates from abnormal southwest winds and the strengthening of the WPSH. The enhanced southwesterly low-level jet provides sufficient warm and moist air for the formation of cyclones and promotes the eastward migration of cyclones after formation. Liu and Ding (2020) and Zhao et al. (2021) studied the causes of the super strong Meiyu year in 2020 and mentioned that the WPSH is unusually strong and westward and accompanied by an abnormal increase in precipitation. Liu and Ding (2020) found that the enhanced southwesterly low-level jet stream is conducive to the development of vertical movement in the middle and low levels, providing necessary dynamic conditions for sustained precipitation during the Meiyu in 2020.
Cold air activity is one of the important factors for the formation of heavy precipitation, as it promotes the convergence and uplift of low level necessary for heavy precipitation (Liu and Ding, 2020). The enhanced negative geopotential anomaly over Mongolia brings cold and dry air through the westerly jet, contributing to cyclone development. The increased frequency of cyclones over the Yangtze River and Huaihe River results in an abnormal increase in precipitation in the middle and lower reaches of the Yangtze River during the Meiyu period. However, due to the strengthening of the WPSH, the southern part of China is controlled by the abnormal positive geopotential height, and the precipitation decreases. Zhao et al. (2021) also found that when the WPSH was enhanced, there was a decrease in precipitation in South China.
The climatic distribution of water vapor flux and water vapor flux divergence at 850 hPa during the Meiyu period of the Jianghuai cyclone is shown in Fig. 10. The precipitation process of the Jianghuai cyclone mainly involves water vapor brought by the southwesterly low-level jet of the summer monsoon in the low-latitude area. During the development of the Jianghuai cyclone, the middle and lower reaches of the Yangtze River are mostly located in the water vapor convergence area, which is conducive to precipitation generation (Chen et al., 2020).
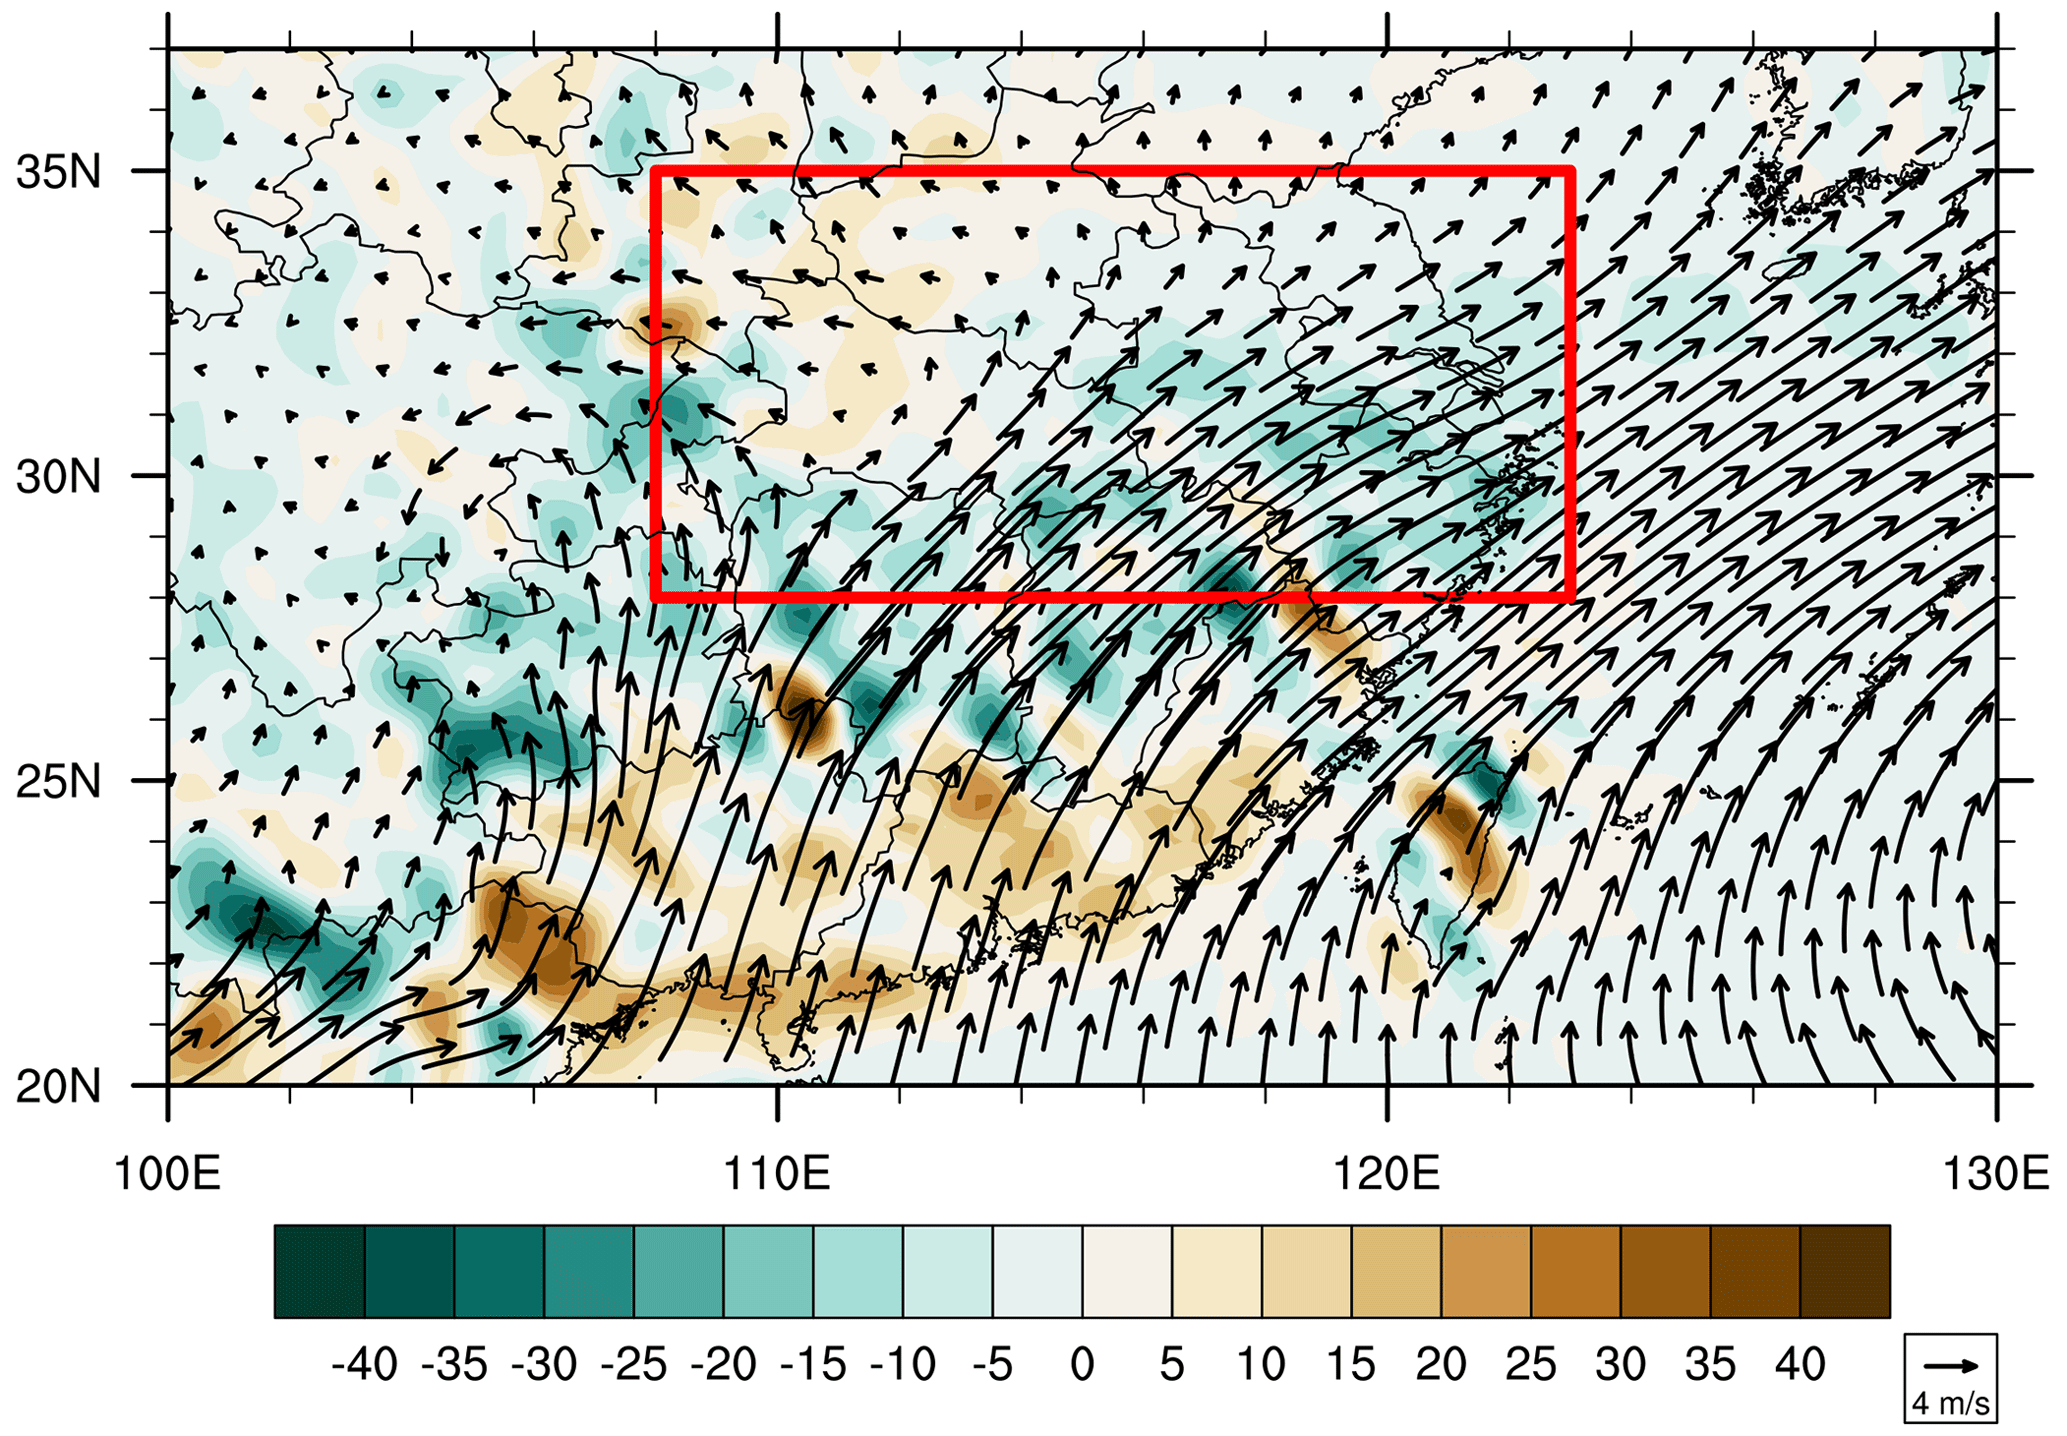
Figure 10Distribution of 850 hPa daily mean water vapor flux (unit: g cm−2 hPa−1) and water vapor flux divergence (unit: 10−8 g cm−2 hPa−1 s−1) of cyclones over the Yangtze and Huaihe rivers during 1961–2020 (color diagram shows water vapor flux divergence, and vector diagram shows water vapor flux).
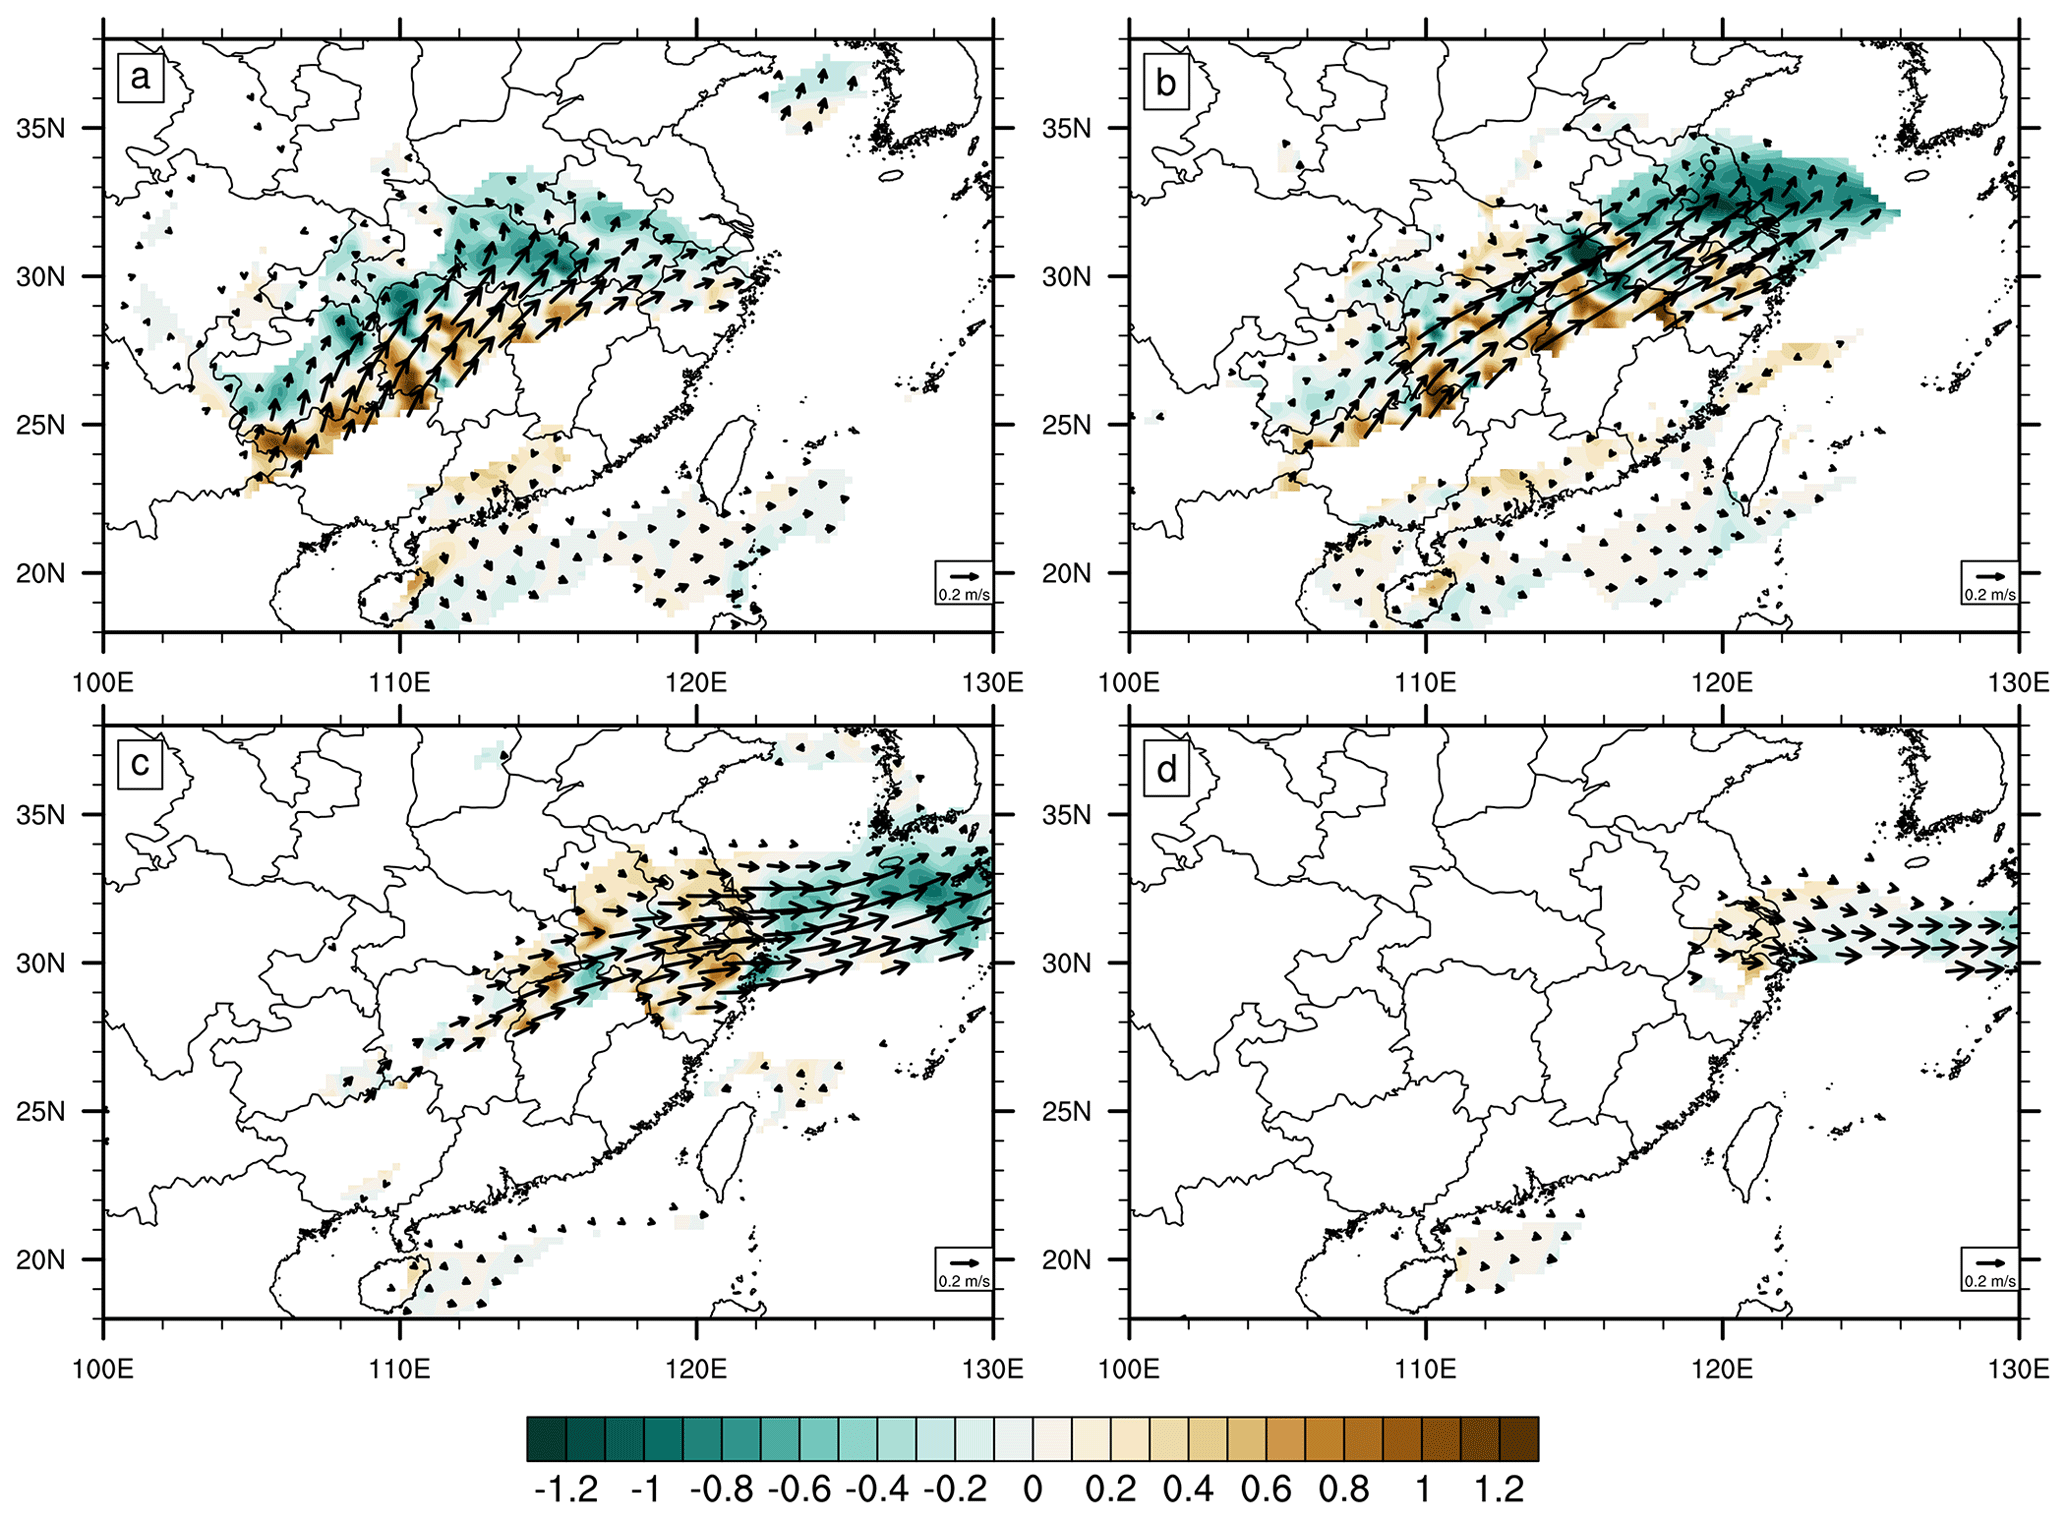
Figure 11Distribution of the 850 hPa daily mean water vapor flux anomaly (unit: g cm−2 hPa−1) and water vapor flux divergence anomaly (unit: 10−8 g cm−2 hPa−1 s−1) of cyclones over the Yangtze and Huaihe rivers during 1961–2020 (color diagram shows water vapor flux divergence, and vector diagram shows water vapor flux). The colored region passed the 95 % confidence interval according to Student's t test. If the vapor flux anomaly is significant at the 95 % confidence level for Student's t test in at least one direction (zonal or meridian), the vector is plotted.
Figure 11 shows the distribution of water vapor flux anomalies and water vapor flux divergence anomalies at the pressure level of 850 hPa during the Jianghuai cyclone from day −1 to day +2. Both the color field and wind vector arrows in the figure passed the 95 % significance according to Student's t test. On day −1, significant water vapor convergence anomaly and southwestward water vapor transport appear in eastern and western Hubei Province. In the middle reaches of the Yangtze River, there is a north–south distribution of water vapor convergence and divergence dipoles. The anomalies of water vapor flux and water vapor flux dispersion are mainly concentrated on day 0. There is significant anomalous water vapor convergence up to −1 g cm−2 hPa−1 in eastern Hubei Province, Anhui Province and Jiangsu Province on day 0. Anomalous water vapor dispersion exists in the middle and lower reaches of the Yangtze River. On day +1 of cyclone development, the spatial distribution of water vapor convergence and divergence shifted to an east–west direction. The anomalous transport of water vapor flux also changes to an east–west direction. On day +2, with the eastward movement development of the cyclone, only southern Jiangsu Province and northern Zhejiang Province have abnormal water vapor flux in the eastward direction. At this time, precipitation in that area begins to gradually weaken.
From day −1 to day 0, the abnormal water vapor flux and water vapor flux divergence configuration results in the transportation of warm and wet air from the low-latitude area to the middle and lower reaches of the Yangtze River. The negative water vapor flux indicates the occurrence of water vapor convergence, leading to an increase in local water vapor content and ultimately resulting in enhanced precipitation in the region. In a study by Liu and Ding (2020) on heavy rainfall in 2020, they found enhanced water vapor transport and repeated occurrences of convergence movement, both contributing to prolonged precipitation duration in the Jianghuai River basin.
In contrast, the anomaly of water vapor flux in southern Guangdong and other regions is divergent. This leads to a decrease in local water vapor volume and precipitation within these regions. These results indicate that the variations in water vapor flux and divergence associated with cyclones primarily originate from warm and moist air transported from low latitudes to the middle and lower reaches of the Yangtze River. Therefore, there exists a positive correlation between cyclone activity and precipitation in the middle and lower reaches of the Yangtze River.
Based on ERA5 reanalysis of sea level pressure data and using the relative vorticity method to identify and track cyclones, we examine the climatological characteristics of Jianghuai cyclones. Additionally, we analyze the linkages between cyclone activity and precipitation in the middle and lower reaches of the Yangtze River during the Meiyu period.
During the Meiyu period, Jianghuai cyclones are mainly generated at the western Hubei Province and eastern Hubei Province. These cyclones develop and move to the sea in the east or northeast direction. There is a positive correlation between the maximum intensity and maximum radius of Jianghuai cyclones. The cyclone occurrence frequency has a 2–4-year quasi-periodic variation for 1980–1990 and 1990–2000 and changes to 4–5 years after 2000. The frequency of cyclone activity shows a positive anomaly during 1965–1970 and 1990–2000, while it has a negative anomaly during 1970–1990 and 2000–2010. Both the quasi-periodic and interdecadal variations of cyclones correspond well with the precipitation during the Meiyu period.
There is a positive correlation between the frequency of cyclone activity and precipitation during the Meiyu period. The frequency of Jianghuai cyclone activity is high in the years with strong Meiyu rainfall and low in the years with weak Meiyu rainfall. The percentage of precipitation affected by Jianghuai cyclone activity in the middle and lower reaches of the Yangtze River can reach up to 47 %. The spatial distribution forms an east–west belt, with decreasing influence from the coast to inland. During active periods of Jianghuai cyclones, the precipitation increases abnormally in the middle and lower reaches of the Yangtze River east of 108° E. Precipitation decreases abnormally in Fujian Province and Guangdong Province. The spatial distribution of precipitation anomalies is related to the genesis location frequency of cyclone, forming positive and negative anomalies distributed north–south as dipoles along the approximately 27° N latitude line.
The geopotential height anomaly field and the horizontal wind vector anomaly field of the Jianghuai cyclones during the Meiyu period are synthesized and analyzed. There is an enhanced positive geopotential height anomaly of the WPSH during cyclone activity. The negative geopotential height anomaly of Mongolia and the abnormal southwesterly low-level jet are enhanced. All these factors lead to an increasing precipitation in the middle and lower reaches of the Yangtze River. The abnormal leading signal of negative geopotential height in Mongolia can be traced back to day −2 of the cyclone activity, and the signal can be traced back to day −4 at 500 hPa. From day −2 to day 0 of cyclone activity, the abnormal distribution of water vapor flux and water vapor flux divergence causes warm and wet air from low latitudes to be transported to the middle and lower reaches of the Yangtze River. These promote the generation and development of cyclones and increase precipitation in the middle and lower reaches of the Yangtze River.
We explore the cyclone characteristics and study the linkage between cyclone activity and precipitation in the Yangtze River region. Spatially, we identified abnormal precipitation patterns by tracing the evolution of geopotential height anomalies and water vapor flux. However, the specific mechanism by which the southwesterly low-level jet affects cyclones during the Meiyu period is not clear enough. Zhang et al. (2018) suggested that the strengthening of the southwesterly low-level jet would lead to the development of an α mesoscale low-pressure disturbance near the Meiyu front and result in extreme precipitation events. Liu and Ding (2020) found that the strengthening of the southwesterly low-level jet caused the southerly meridional strong gradient zone on the north side of the meridional wind maximum center to move northward in the low-level dynamic conditions of the rainstorm process during the Meiyu period. The influence of the southwesterly low-level stream on the development of physical factors promoting the formation of Jianghuai cyclones needs to be considered and analyzed. Zhao et al. (2010) found that Jianghuai cyclones with different intensities have different causes. Therefore, it is also necessary to consider how different intensities of Jianghuai cyclones affect precipitation. These issues require further analysis and research.
The code and data are not convenient to upload because of their large size. You can get the required code by contacting our email address: leichen@cug.com.
The geopotential height, wind field and specific humidity are daily values processed from ERA5 hourly data. They can be publicly obtained from the European Centre for Medium-Range Weather Forecasts (ECMWF) at https://doi.org/10.24381/cds.bd0915c6 (Hersbach et al., 2023).
The precipitation data are from the CN05.1 grid point observation dataset compiled by the National Meteorological Information Center of the China Meteorological Administration. Details of the data and how to request access are available at https://ccrc.iap.ac.cn/resource/detail?id=228 (CRC, 2024).
The data of the specific time, precipitation and intensity of Meiyu are obtained from the National Climate Center of China. Due to confidentiality agreements, supporting data can only be made available to bona fide researchers subject to a non-disclosure agreement. Details of the data and how to request access are available from National Meteorological Information Center at http://data.cma.cn/article/getLeft/id/251/type/3.html (CMA, 2024).
All authors contributed to data calculation and result analysis. The cyclone data were provided by LC; writing was performed by RZ.
The contact author has declared that neither of the authors has any competing interests.
Publisher's note: Copernicus Publications remains neutral with regard to jurisdictional claims made in the text, published maps, institutional affiliations, or any other geographical representation in this paper. While Copernicus Publications makes every effort to include appropriate place names, the final responsibility lies with the authors.
We thank Kevin Hodges for his invaluable help. This work is jointly supported by the National Key R&D Program of China (2023YFE0103900) and National Natural Science Foundation of China (41605054).
This research has been supported by the China National Key R&D Program (grant no. 2023YFF0807000).
This paper was edited by Maria-Carmen Llasat and reviewed by two anonymous referees.
Bao, Y. Y.: Similarities and Differences of Monsoon Circulations between 2016 and 1998 Meiyu Periods in Middle and Lower Reaches of the Yangtze River and Comparison of Their Physical Mechanisms, Chinese J. Atmos. Sci., 45, 994–1006, https://doi.org/10.3878/j.issn.1006-9895.2101.20174, 2021.
Cai, Y. X., He, H., Lu, H., Zhu, L. Y., and Lu, Q. Q.: Synoptic and Climatic Characteristics of Persistent Rainstorm in Guangxi in June 2020, J. Meteorol. Res. Appl., 4, 113–117, https://doi.org/10.19849/j.cnki.CN45-1356/P.2021.1.20, 2021.
Chen, L. J., Zhao, J. H., Gu, W., Liang, P., Zhi, R., Peng, J. B., Zhao, S. Y., Gao, H., Li, X., and Zhang, P. Q.: Advances of Research and Application on Major Rainy Seasons in China, J. Appl. Meteorol. Sci., 30, 385–400, https://doi.org/10.11898/1001-7313.20190401, 2019.
Chen, T., Zhang, F. H., Yu, C., Ma, J., Zhang, X. D., Shen, X. L., Zhang, F., and Luo, Q.: Synoptic Analysis of Extreme Meiyu Precipitation over Yangtze River Basin During June–July, Meteorol. Monogr., 46, 1415–1426, https://doi.org/10.7519/j.issn.1000-0526.2020.11.003, 2020.
CMA: China Meteorological Data Service Centre, http://data.cma.cn/article/getLeft/id/251/type/3.html (last access: 11 June 2024), 2024.
CRC – Climate Change Research Center: CN05, https://ccrc.iap.ac.cn/resource/detail?id=228 (last access: 11 June 2020), 2024.
Ding, Y. H.: Summer Monsoon Rainfalls in China, J. Meteorol. Soc. Jpn.,70, 373–396, https://doi.org/10.2151/jmsj1965.70.1B_373, 1992.
Ding, Y. H.: Seasonal March of the East-Asian Summer Monsoon, East Asian Monsoon, World Scientific Publishing, https://doi.org/10.1142/9789812701411_0001, 2004.
Ding, Y. H., Liu, J. J., Sun, Y., Liu, Y. J., He, J. H., and Song, Y. F.: A Study of the Synoptic-Climatology of the Meiyu System in East Asia, China J. Atmos. Sci., 31, 1082-1101, 2007.
General Administration of Quality Supervision: Inspection and Quarantine of the People's Republic of China, Standardization Administration of the People's Republic of China, GB/T 33671-2017, Meiyu Monitoring Indices, http://fj.cma.gov.cn/zfxxgk/zwgk/flfgbz/dfbz/202209/t20220921_5098384.html (last access: 6 June 2024), 2017.
He, L. F., Chen, T., Zhou, Q. L., and Li, Z. C.: The Meso-β Scale Convective System of a Heavy Rain Event on July 10, 2004 in Beijing, J. Appl. Meteorol. Sci., 18, 655–665, https://doi.org/10.3969/j.issn.1001-7313.2007.05.010, 2007.
Hersbach, H., Bell, B., Berrisford, P., Biavati, G., Horányi, A., Muñoz Sabater, J., Nicolas, J., Peubey, C., Radu, R., Rozum, I., Schepers, D., Simmons, A., Soci, C., Dee, D., and Thépaut, J.-N.: ERA5 Hourly Data on Pressure Levels From 1940 to Present, Copernicus Climate Change Service (C3S) Climate Data Store (CDS) [data set], https://doi.org/10.24381/cds.bd0915c6, 2023.
Hodges, K. I.: A General Method for Tracking Analysis and Its Application to Meteorological Data, Mon. Weather Rev., 122, 2573–2586, https://doi.org/10.1175/1520-0493(1994)122<2573:AGMFTA>2.0.CO;2., 1994.
Hodges, K. I.: Feature Tracking on the Unit Sphere, Mon. Weather Rev., 123, 3458–3465, https://doi.org/10.1175/1520-0493(1995)123<3458:FTOTUS>2.0.CO;2, 1995.
Huang, W. Y., Sun, Y., Lu, C. H., Yao, L. N., and Dong, Q.: Statical Analysis of Jianghuai Cyclone Causing Jiangsu Regional Heavy Rain in Summer Nearly 40 years, Meteorol. Monogr., 45, 843–853, https://doi.org/10.7519/j.issn.1000-0526.2019.06.010, 2019.
Jiang, L. Z., Fu, S. M., and Sun, J. H.: New Method for Detecting Extratropical Cyclones: The Eight-Section Slope Detecting Method, Atmos. Ocean. Sci Lett., 13, 436–442, https://doi.org/10.1080/16742834.2020.1754124 , 2020.
Jiangsu Provincial Weather Bureau: Jiangsu Provience Weather Forecast Techniacal Manual, China Meteorological Press, Beijing, 22–33, ISBN 9787502962258, 2017.
Li, B., Yu, W. P., Lu, Y., and Lu, D. C.: The Numerical Simulating Study of the Mesoscale Characteristics on Development of Jianghuai Cyclones, J. Meteorol. Sci., 22, 72–80, https://doi.org/10.3969/j.issn.1009-0827.2002.01.009, 2002.
Liang, P., Chen, L. J., Ding, Y. H., He, J. H., and Zhou, B.: Relationship between Long-Term Variability of Meiyu over the Yangtze River and Ocean and Meiyu's Predictability Study, Acta Meteorol. Sin., 76, 379–393, https://doi.org/10.11676/qxxb2018.009, 2018.
Liu, Y. Y. and Ding, Y. H.: Characteristics and Possible Causes for Extreme Meiyu in 2020, Meteorol. Monogr., 46, 1393–1404, https://doi.org/10.7519/j.issn.1000-0526.2020.11.001, 2020.
Lu, C. H.: A Modified Algorithm for Identifying and Tracking Extratropical Cyclones, Adv. Atmos. Sci., 34, 909–924, https://doi.org/10.1007/s00376-017-6231-2, 2017.
Mailier, P. J., Stephenson, D. B., Ferro, C. A. T., and Hoges, K. I.: Serial Clustering of Extratropical Cyclones, Mon. Weather Rev., 134, 2224–2240, 2006.
Ninomiya, K. and Murakami, T.: The early summer rainy season (Baiu) over Japan, Mon Meteorol, edited by: Chang, C.-P. and Krishnamurti, T. N., Oxford University Press, 93–121, https://cir.nii.ac.jp/crid/1571980074832584448?lang=en#citations_container (last access: 11 June 2024), 1987.
Oh, T. H., Kwon, W. T., and Ryoo, S. B.: Review of the Researches on Changma and Future Observational Study, Adv. Atmos. Sci., 14, 207–222, 1997.
Pang, Y., Wang, L. J., and Yu, B.: The Relationship between 10–30d Low Frequency Oscillation and the Rainfall over Changjiang-Huaihe River Valley During Meiyu Period, Trans. Atmos. Sci., 36, 742–750, https://doi.org/10.3969/j.issn.1674-7097.2013.06.011, 2013.
Qian, W. H. and Lee, D. K.: Seasonal March of Asian Summer Monsoon, Int. J. Climatol., 20, 1371-1386, https://doi.org/10.1002/1097-0088(200009)20:11<1371::AID-JOC538>3.0.CO;2-V, 2000.
Qin, T. and Wei, L. X.: The Statistic and Variance of Cyclones Entering Coastal Waters of China in 1979–2012, Acta Ocean Sin., 37, 43–52, https://doi.org/10.3969/j.issn.0253-4193.2015.01.005, 2015.
Saito, N.: Quasi-stationary Waves in Mid-latitudes and Baiu in Japan, J. Meteorol. Soc. Jpn., 63, 983–995, 1995.
Shen, Y., Sun, Y., Cai, N. H., Su, X., and Shi, D. W.: Analysis on the Generation and Evolution of a Jianghuai Cyclone Responsible for Extreme Precipitation Event, Meteorol. Monogr., 45, 166–179, https://doi.org/10.7519/j.issn.1000-0526.2019.02.003, 2019.
Simmonds, I. and Keay, K.: Mean Southern Hemisphere Extratropical Cyclone Behavior in the 40-year NCEP-NCAR Reanalysis, J. Climate, 13, 873–885, https://doi.org/10.1175/1520-0442(2000)013<0873:MSHECB>2.0.CO;2, 2000.
Simmonds, I. and Murray, R. J.: Southern Extratropical Cyclone Behavior in ECMWF Analyses During the FROST Special Observing Periods, Weather Forecast., 14, 878–891, https://doi.org/10.1175/1520-0434(1999)014<0878:SECBIE>2.0.CO;2, 1999.
Su, X., Kang, Z. M., Zhuang, X. R., and Chen, S. J.: Uncertainty Analysis of Heavy Rain Belt Forecast During the 2020 Meiyu Period, Meteorol. Monogr., 47, 1336–1346, https://doi.org/10.7519/j.issn.1000-0526.2021.11.003, 2021.
Wang, J. H., Niu, D., Ren, S. Y., Miao, C. S., and Song, P.: Comparative Study On Development Of Different Deep Jianghuai Rivers Cyclones Entering the Sea and the Influence of Environmental Factors, J. Trop. Meteorol., 31, 744–756, https://doi.org/10.16032/j.issn.1004-4965.2015.06.003., 2016.
Wang, L. J., Huang, Q. L., Li, Y., and Han, S. R.: Relationship between Spatial Inhomogeneous Distribution of Meiyu Rainfall over the Yangtze-Huaihe River Valley and Previous SST, Trans. Atmos. Sci., 37, 313–322, https://doi.org/10.3969/j.issn.1674-7097.2014.03.008, 2014.
Wang, Y. L. and Wang, L. J.: Characteristics of Southern Cyclone Activity and Its Influence on Precipitation in Yangtze River Basin, Yangtze River, 43, 34–36, https://doi.org/10.3969/j.issn.1001-4179.2012.09.009, 2012.
Wang, Y. L., Guan, Z. Y., Jin, D. C., and Ke, D.: Climatic Characteristics and Interannual Variations of Cyclones over Changjiang-Huaihe River Basin During Late Spring and Early Summer from 1980 to 2012, Trans. Atmos. Sci., 38, 354–361, https://doi.org/10.13878/j.cnki.dqkxxb.20130413010, 2015.
Wei, J. S., Liu, J. Y., Sun, Y., and Xu, Y. C.: Climate Characteristics of Jiang-Huai Cyclone, J. Meteorol. Sci., 33, 196–201, https://doi.org/10.3969/2012jms.0112, 2013.
Wernli, H. and Schwierz, C.: Surface Cyclone in the ERA-40 Dataset (1958–2001), J. Atmos. Sci., 63, 2486–2507, 2006.
Wu, J. and Gao, X. J.: A Gridded Daily Observation Dataset over China Region and Comparison with the other Datasets, Chinese J. Geo., 56, 1102–1111, https://doi.org/10.6038/cjg20130406, 2013.
Wu, J. F., Xu, X. F., Zhao, W. R., Qing, Q., and Zou, L.: Characteristics of Persistent Heavy Rainfall and Water Vapor Transport in Western Sichuan Plateau, Meteorol. Sci. Technol., 48, 704–716, https://doi.org/10.19517/j.1671-6345.20190301, 2020.
Wu, Q., Feng, J. W., Wang, Y., Chen, Y., and Zhang, L. T.: Spatial and Temporal Distribution of Cyclones over the Jianghuai River During 1979–2018, J. Shanxi Meteorol., 6, 15–22, https://doi.org/10.3969/j.issn.1006-4354.2020.06.003, 2020a.
Wu, Q., Liu, T., Zhang, B., Zhang, Y., and Wang, Y.: A Comparative Analysis of the Heavy Rainstorm Processes of Two Jianghuai Cyclones, Anhui Agr. Sci. Bull., 26, 161–171, https://doi.org/10.3969/j.issn.1007-7731.2020.09.058, 2020b.
Wu, Q., Chen, S. J., Bai, Y., Xia, L., and Wang, C. J.: Diagnostic Analysis and Numerical Simulation of a Heavy Rainstorm Associated with the Jianghuai Cyclone, J. Meteorol. Sci., 41, 86–98, https://doi.org/10.12306/2020jms.0029, 2021.
Wu, T., Xu, G. Y., Li, S. J., and Wei, F.: Characteristics and Causes of a Mixed-Type Convective Weather During the Formation and Development of a Jianghuai Cyclone in Spring, Adv. Meteorol. Sci. Technol., 48, 704–716, https://doi.org/10.19517/j.1671-6345.20190301, 2023.
Xu, J., Zhou, C. Y., and Gao, T. C.: Analysis about Development Mechanism of Jianghuai Cyclone in Meiyu Front and Its Relationship with Rainstorm, Bull. Sci. Technol., 29, 24–29, https://doi.org/10.3969/j.issn.1001-7119.2013.05.006, 2013.
Xu, J. M.: Satellite Imagery Characteristics for Extratropical Cyclones and Meiyu Font, Adv. Meteorol. Sci. Technol., 11, 14–26, https://doi.org/10.3969/j.issn.2095-1973.2021.03.003, 2021.
Xu, Y., Gao, X. J., Shen, Y., Xu, C. H., Shi, Y., and Giorgi, F.: A Daily Temperature Dataset over China and Its Application in Validating an RCM Simulation, Adv. Atmos. Sci., 26, 763–772, https://doi.org/10.1007/s00376-009-9029-z, 2009.
Xu, Y. C., Wei, J. S., and Zhu, W. J.: A Numerical Simulation and Marine Sensitive Experiments of Jiang-Huai Cyclone, J. Meteorol. Sci., 31, 726–731, https://doi.org/10.3969/j.issn.1009-0827.2011.06.008, 2011.
Yan, J. R., Wang, W. J., Zhang, H., and Shi, D. W.: Analysis of Two Rainstorm and Gale Processes of Jianghuai Cyclone in Jiangsu Province in 2019, J. Meteorol. Res. Appl., 42, 83–88, https://doi.org/10.19849/j.cnki.CN45-1356/P.2021.2.16, 2021.
Yang, Y. M., Gu, W. L., Zhao, R. L., and Liu, J.: The Statical Analysis of Vortex During Meiyu Season in the Lower Reaches of the Yangtze, J. Appl. Meteorol., 21, 11–18, https://doi.org/10.3969/j.issn.1001-7313.2010.01.002, 2010.
Zhao, B. K., Wu, G. X., and Yao, X. P.: A Diagnostic Analysis of Potential Vorticity Associated with Development of a Strong Cyclone During the Meiyu Period of 2003, Chinese J. Atmos. Sci., 32, 1241–1255, https://doi.org/10.3878/j.issn.1006-9895.2008.06.02, 2008.
Zhao, B, K., Wan, R. J., and Lu, X. Q.: A Contrastive Analysis on the Causes of Strong and Weak Cyclones over Yangtze-Huaihe River Valleys During the Meiyu Period in Summer of 2003, Plateau Meteorol., 29, 309–320, 2010.
Zhao, J. H., Chen, L. J., and Wang, D. Q.: Characteristics and Causes Analysis of Abnormal Meiyu in China in 2016, Chinese J. Atmos. Sci., 42, 1055–1066, https://doi.org/10.3878/j.issn.1006-9895.1708.17170, 2018.
Zhao, J. H., Zhang, H., Zuo, J. Q., Xiong, K. G., and Chen, L. J.: What Drives the Super Strong Precipitation over the Yangtze–Huaihe River Basin in the Meiyu Period of 2020, Chinese J. Atmos. Sci., 45, 1433–1450, https://doi.org/10.3878/j.issn.1006-9895.2104.21011, 2021.
Zhang, J. G., Wang, J., Wu, T., Zhou, J. L., Zhong, M., Wang, S. S., Huang, X. Y., Li, S. J., Han, F. R., and Wang, X. C.: Weather System Types of Extreme Precipitation in the Middle Reaches of the Yangtze River, Torrent. Rain Disast., 37, 14–23, https://doi.org/10.3969/j.issn.1004-9045.2018.01.003, 2018.
Zhang, X. H., Luo, J., Chen, X., Jin, L. L., and Qiu, X. M.: Formation and Development Mechanism of One Cyclone over Changjiang-Huaihe River Basin and Diagnostic Analysis of Rainstorm, Meteorol Monogr., 42, 716–723, https://doi.org/10.7519/j.issn.1000-0526.2016.06.007, 2016.
Zhang, X. L., Tao, S. Y., and Zhang, Q. Y.: An Analysis on Development of MESO-β Convective System along Meiyu Front Associated with Flood in Wuhan in 20–21 July 1998, J. Appl. Meteorol. Sci., 13, 385–397, https://doi.org/10.3969/j.issn.1001-7313.2002.04.001, 2002.
Zhang, X. L., Tao, S. Y., and Zhang, S. L.: Three Types of Heavy Rainstorms Associated with the Meiyu Front, Chinese J. Atmos. Sci., 28, 187–205, https://doi.org/10.3878/j.issn.1006-9895.2004.02.03, 2004.
Zhang, Y. X., Ding, Y. H., and Li, Q. P.: Cyclogenesis Frequency Changes of Extratropical Cyclones in the Northern Hemisphere and East Asia Revealed by ERA40 Reanalysis Data, Meteorol. Monogr., 38, 646–656, 2012.
Zhong, Q. M., Ma, J., and Wang, L.: Biweekly Oscillation of the Meiyu-Season Precipitation in 2016 and 2020 over the Yangtze Huaihe River Basin – A comparative analysis, Acta Meteorol. Sin., 8, 235–257, https://doi.org/10.11676/qxxb2023.20220075, 2023.
Zhou, J. L., Zhang, J. G., Wu, T., Xu, G. Y., Liu, X. W., Wang, J., and Han, F. R.: Characteristics of the Mesoscale Weather System Producing Extreme Rainstorm in Boundary Layer During the Meiyu Front over the Middle Reaches of Yangtze River, Meteorol. Monogr., 48, 1007–1019, https://doi.org/10.7519/j.issn.1000-0526.2022.052801, 2022.
Zhou, X. M. and Zheng, Y, G.: Analysis of Environmental Conditions and Tornado Storm Features of Two Tornadoes in Jiangsu During the Meiyu Period in 2020, Adv. Meteorol. Sci. Technol., 10, 34–42, https://doi.org/10.3969/j.issn.2095-1973.2020.06.008, 2020.
Zhou, Y. and Xia, L.: Statistical Research on Climatic Characteristics of Jianghuai Cyclones, Meteorol. Environ. Sci., 40, 79–85, https://doi.org/10.16765/j.cnki.1673-7148.2017.03.013, 2017.
Zhu, M., Lu, H. C., and Yu, Z. H.: Study of Positive Feedback Mechanism for Meso-α Scale Cyclone Growing on Meiyu Front, Chinese J. Atmos. Sci., 22, 763–770, https://doi.org/10.3878/j.issn.1006-9895.1998.05.11, 1998.