the Creative Commons Attribution 4.0 License.
the Creative Commons Attribution 4.0 License.
 | 15 May 2024
Analysis of three-dimensional slope stability combined with rainfall and earthquake
Jiao Wang
Zhangxing Wang
Guanhua Sun
Hongming Luo
In the current context of global climate change, geohazards such as earthquakes and extreme rainfall pose a serious threat to regional stability. We investigate a three-dimensional (3D) slope dynamic model under earthquake action, derive the calculation of seepage force and the normal stress expression of slip surface under seepage and earthquake, and propose a rigorous overall analysis method to solve the safety factor of slopes subjected to combined with rainfall and earthquake. The accuracy and reliability of the method is verified by two classical examples. Finally, the effects of soil permeability coefficient, porosity, and saturation on slope stability under rainfall in a project located in the Three Gorges Reservoir area are analyzed. The safety evolution of the slope combined with both rainfall and earthquake is also studied. The results indicate that porosity has a greater impact on the safety factor under rainfall conditions, while the influence of permeability coefficient and saturation is relatively small. With the increase of horizontal seismic coefficient, the safety factor of the slope decreases significantly. The influence of earthquake on slope stability is significantly greater than that of rainfall. The corresponding safety factor when the vertical seismic action is vertically downward is smaller than that when it is vertically upward. When considering both horizontal and vertical seismic effects, slope stability is lower.
- Article
(8440 KB) - Full-text XML
- BibTeX
- EndNote


Rainfall-induced landslides are caused by the infiltration of precipitation into the ground surface, leading to an increase in pore water pressure, hence reducing the effective stress and shear strength of the soil. Sustained rainfall or heavy rainfall events can significantly increase the risk of slope instability, especially in those areas with loose, poorly drained soils. Several landslides in the Three Gorges Reservoir area have been triggered by rainfall (Yin et al., 2012; Sun et al., 2016b). Earthquakes, as another key factor, impose additional dynamic loads on slopes through ground shaking, which may lead to instability of otherwise stable slopes. In addition, earthquake-induced landslides tend to be more destructive because they often occur without warning. Due to completely different destabilization mechanisms, studies of landslides induced by these two factors are often carried out separately. In some cases, rainfall and earthquakes may act together on slopes. And earthquake-induced landslides may occur more frequently during the rainy season, when the soil is saturated with water and its resistance to earthquakes is reduced. Further research is necessary to investigate the stability of slopes under the combined influence of rainfall and earthquake (David, 2000; Iverson, 2000; Sassa et al., 2010).
At present, the main research methods for slope stability include the limit equilibrium method (Bishop, 1955; Morgenstern and Price, 1965; Spencer, 1967), limit analysis (Farzaneh et al., 2008; Michalowski, 1995; Qin and Chian, 2018; Zhou et al., 2017), finite element method (Griffiths and Lane, 1999; Ishii et al., 2012), among others. There have been numerous studies and findings regarding the stability assessment of 3D slopes. However, most of these methods are based on extended 3D equilibrium analysis techniques (Hungr, 1987; Zhang, 1988; Chen et al., 2001; Cheng and Yip, 2007), which rarely strictly adhere to the six equilibrium conditions. Additionally, these approaches often introduce a significant number of assumptions that limit their practical engineering applications. The strict 3D limit equilibrium method proposed by Zheng (2007) is an overall analysis approach based on the natural form of slip surface stress distribution and approximation through shard interpolation. Sun et al. (2016a, 2017) combined Morgenstern–Price and Bell global analysis method to analyze the stability of reservoir bank slope, applying this method to the Three Gorges Reservoir area. Rahardjo et al. (2010) studied the effect of groundwater table position, rainfall intensities, and soil properties in affecting slope stability using the numerical analyses. Some of the defects inherent in the two-dimensional (2D) limit equilibrium method remain unresolved, and some of them are even amplified in the complex 3D analysis, which has a certain impact on the accuracy of the 3D slope stability evaluation. For the limit analysis method, it is still difficult to establish the velocity field of the motion permit in 3D space. And numerical methods often suffer from two problems: the determination criteria of the critical state of the slope and the determination of the location of the critical sliding surface. Compared with a single traditional analysis method, the mutual integration of several method theories has also been gradually developed, so as to give full play to the advantages of their respective methods and better used in slope stability analysis, such as the finite element limit analysis method (Ali et al., 2017; Lim et al., 2017; Zhou and Qin, 2022).
As a common geological hazard in seismic zones, earthquake-triggered landslides have been extensively investigated by numerous scholars (Sepúlveda et al., 2005; Chang et al., 2012; Jibson and Harp, 2016; Marc et al., 2017; Salinas-Jasso et al., 2019). At present, the stability analysis method of 3D slope is not mature, and the research on the dynamic stability of 3D slope is even more scarce. The quasi-static method (Liu et al., 2001) introduces coefficients (kv and kh) that reflect dynamic action, thereby transforming a dynamic problem into a static one for easier resolution. This approach avoids the complexities associated with dynamic analysis and has become widely used in engineering. Horizontal seismic effects are often a significant consideration in slope stability analysis; however, some research (Chopra, 1966; Lew, 1991; Ling et al., 1999; Shukha and Baker, 2008) confirms that the vertical component of seismic forces should also be given great attention. Wang and Xu (2005) employed the dynamic finite element method to investigate the seismic response characteristics of various components in a 3D high slope yet failed to determine the safety factor. Guo et al. (2011) obtained the time history curve of a slope safety factor during an earthquake using the vector sum method in 2D situations. Cao et al. (2019) studied the seismic response and dynamic failure mode of the slope subjected to earthquake and rainfall by two model tests. In summary, although previous research has provided significant insights into landslides triggered by earthquakes, there remain inadequacies in fully considering the vertical effects of seismic activity, extending analysis from 2D to 3D, and comprehensively integrating the effects of both earthquakes and rainfall.
Most studies only consider the role of a single factor in seepage or earthquake, neglecting the slope stability analysis under combined working conditions. Therefore, analyzing the change law of safety factors for slopes during seepage and seismic action is of great practical value in guiding slope support design and evaluating slope stability. In this paper, a 3D rigorous slice-free method considering seepage and seismic forces to solve the safety factor of bank slopes is proposed. The proposed method strictly satisfies the force balance and moment balance in three directions, without introducing other redundant assumptions.
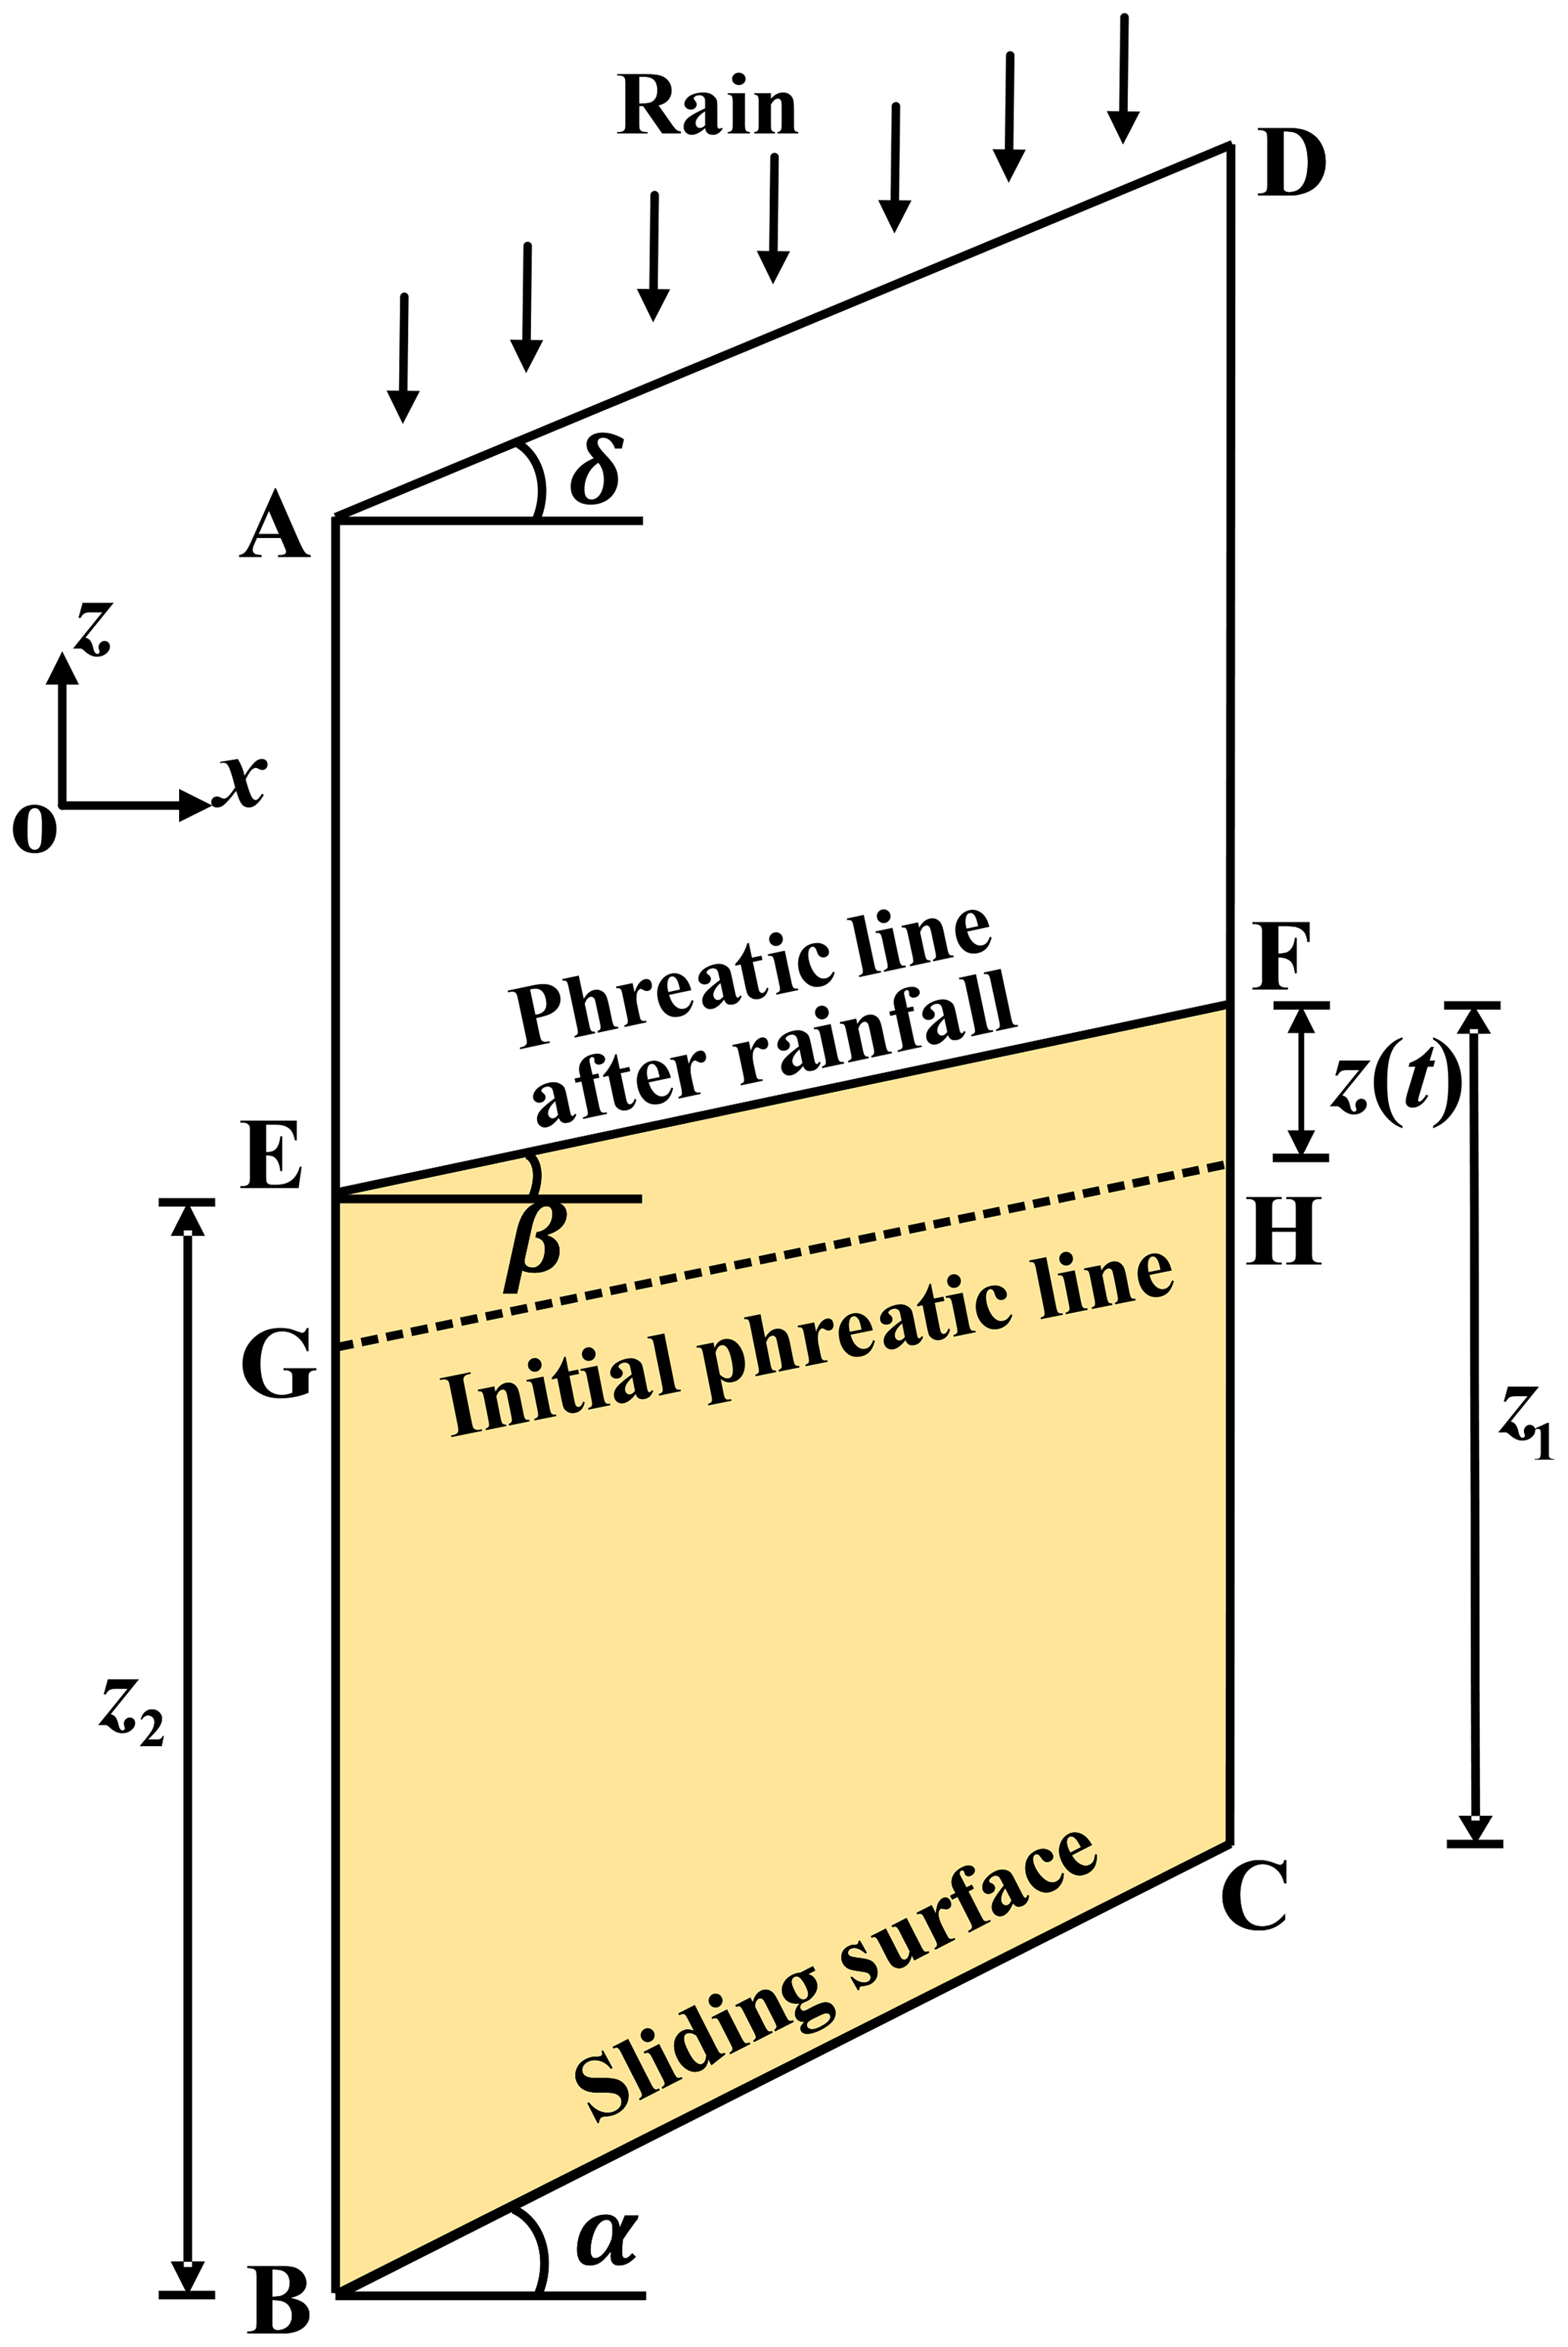
The phreatic surface is the interface between the saturated and unsaturated zones within the slope. Physical and mechanical parameters of the sliding below the phreatic surface adopt saturated, while above the phreatic surface they adopt naturally. A differential soil slice is taken from the slip surface to the slope surface in the landslide body, shown in Fig. 1. z(t) is the rise of phreatic surface after rainfall infiltration, which refers to Conte et al. (2017). The heights of the soil slice below the phreatic line on BE and CF side are, respectively, z1 and z2. It is assumed that rainfall is consistent with groundwater movement and that the slope surface is well drained and free of standing water. Regardless of rainfall intensity, runoff will form if it is greater than the infiltration capacity. The height of rise of the phreatic surface within the slope after the rainfall is
where zr is the volume of water (per unit area) that infiltrates the slope due to a rainfall event with a specified duration, n is porosity, k is permeability coefficient, Sr is saturation, i is the hydraulic gradient (i=sinβ), δ is the angle between the slope surface and the horizontal plane, α is the angle between the sliding surface BC of the differential soil slice and the horizontal plane, β is the angle between the phreatic line and the horizontal plane, ds is the length of the sliding surface BC of the differential soil slice, t is time, and t0 is the initial moment. As a further simplification, it is assumed that both n and Sr are constant.
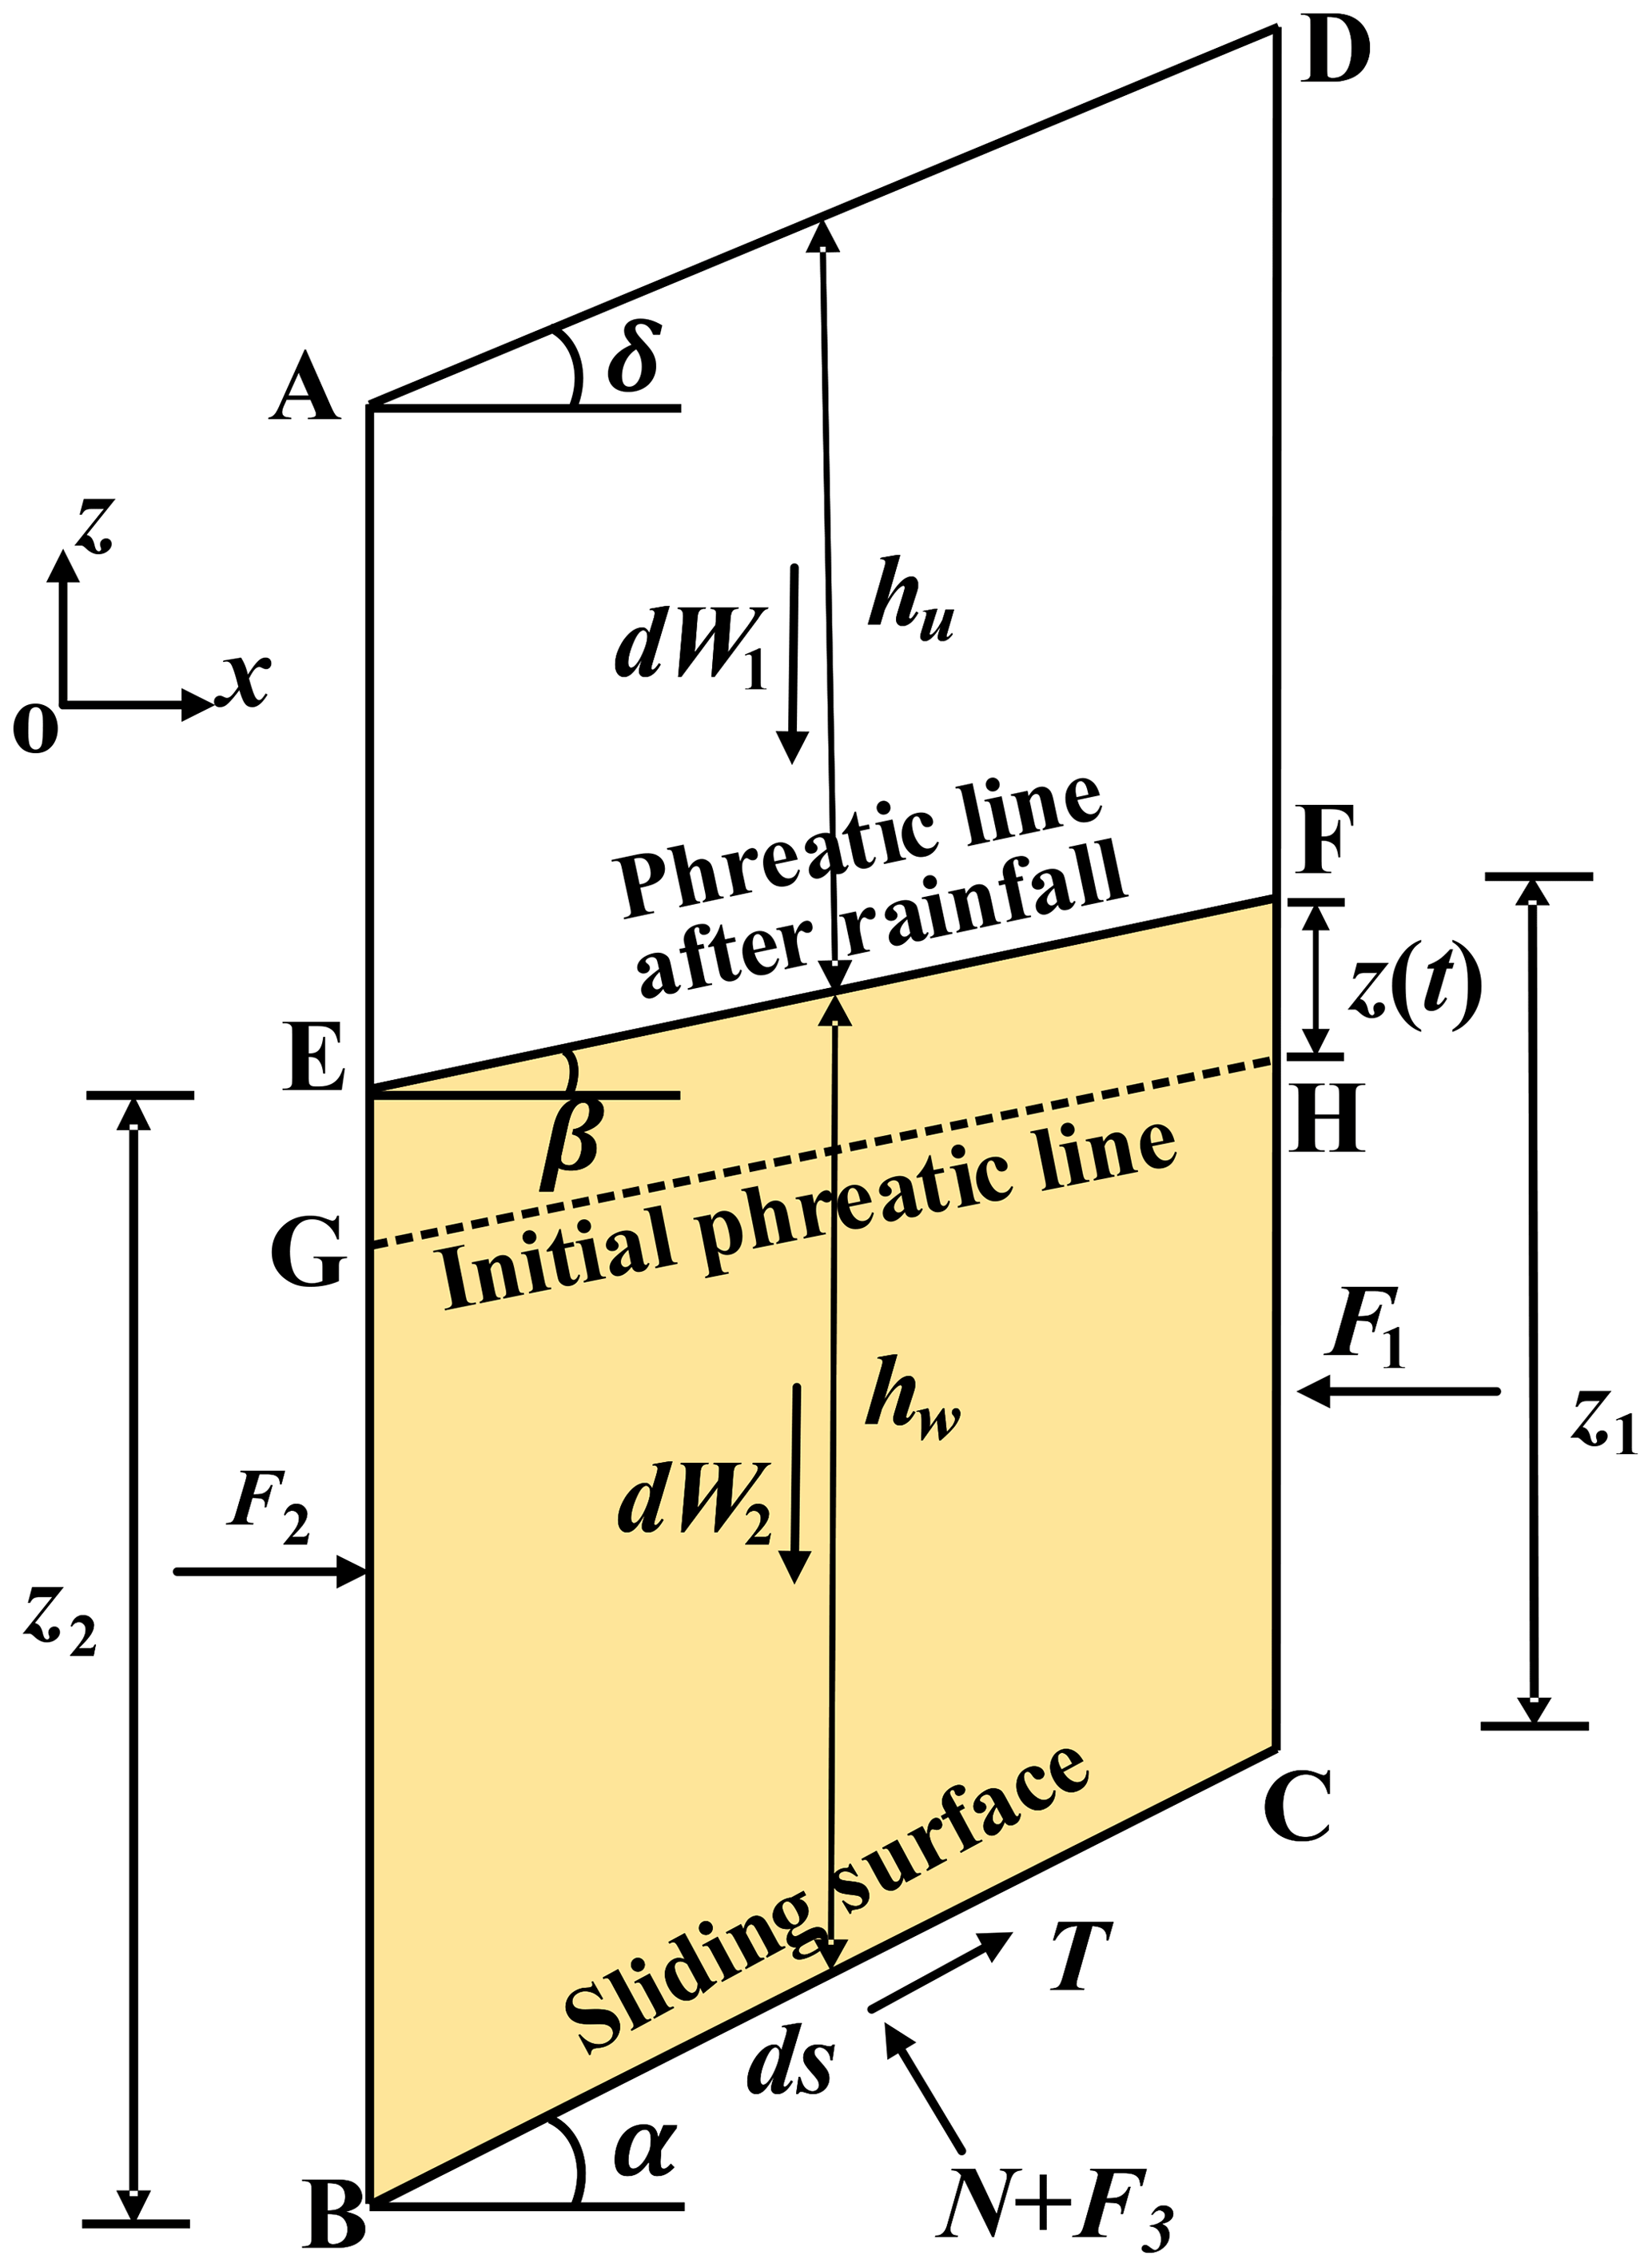
The load on the soil slice is shown in Fig. 2. dW1 and dW2 are the gravity of the differential soil slice above and below the phreatic line. The resultant hydrostatic force of the boundary AB, CD, and BC are F1, F2, and F3, respectively. N is the contact pressure (effective pressure) between the soil particles, and T is the sliding resistance force. hu and hw are the height of the soil slice above and below the phreatic line, respectively.
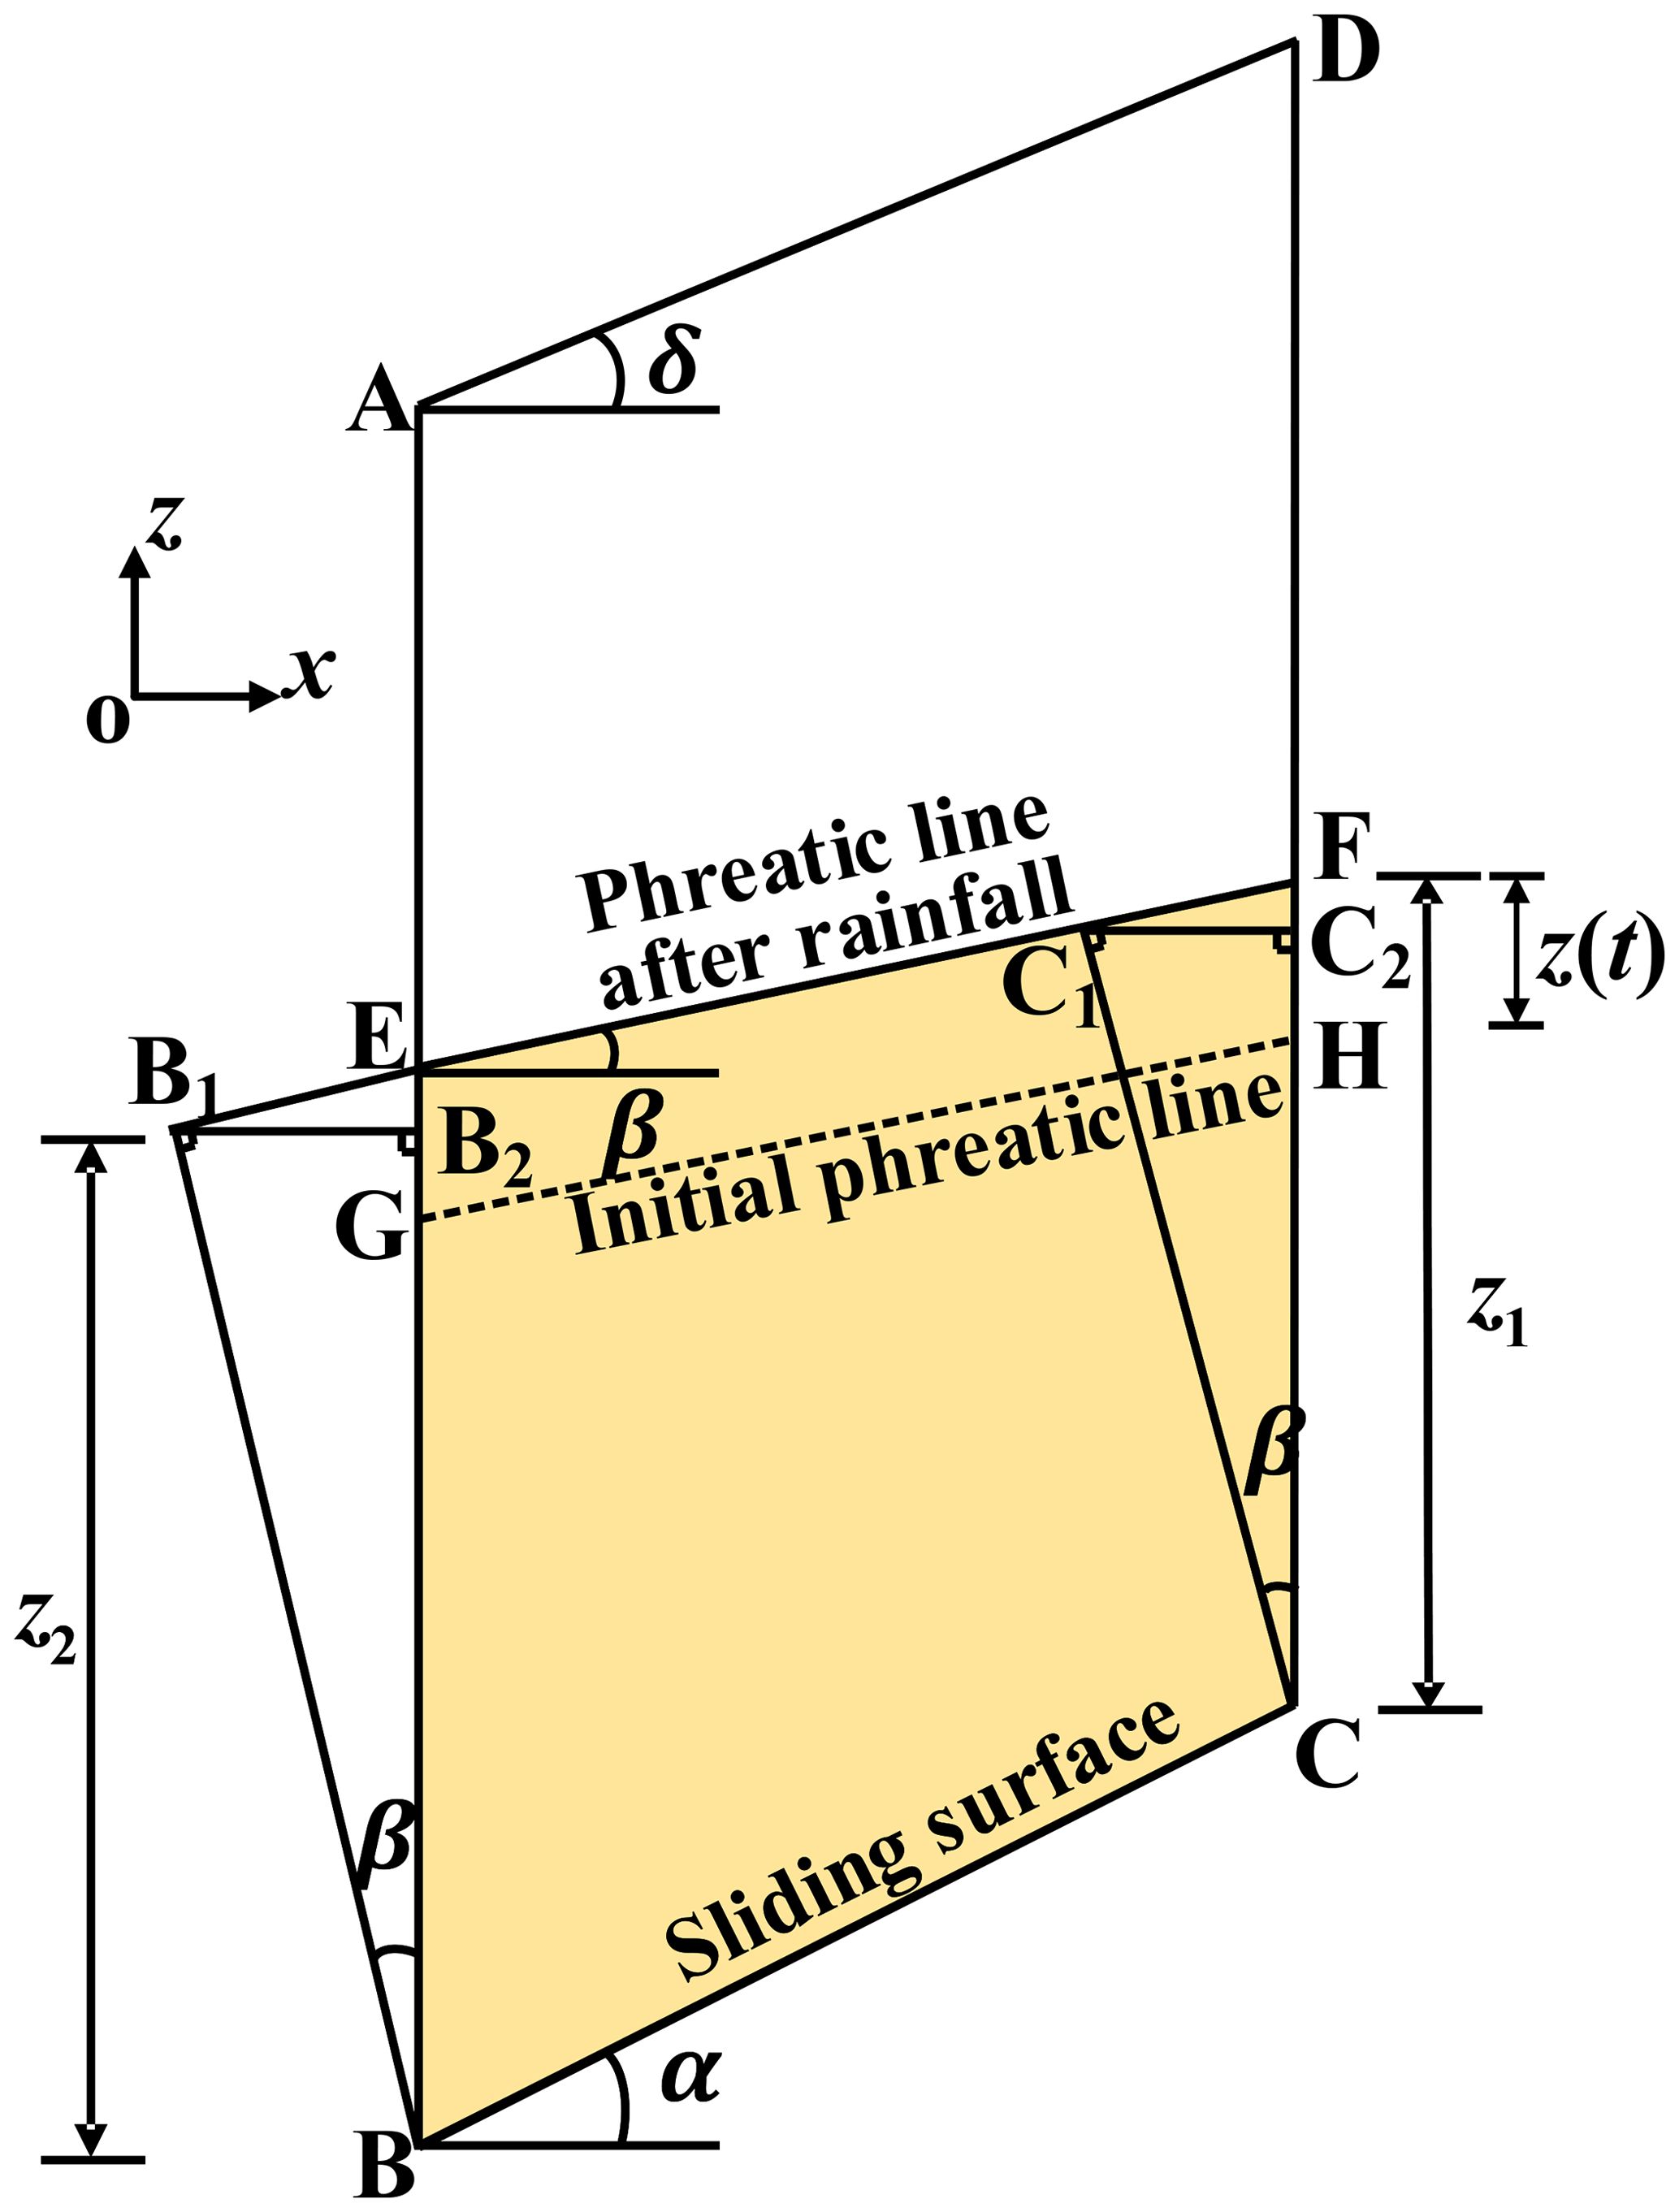
According to the flow properties of the phreatic line perpendicular to the equipotential line, the surrounding hydrostatic pressures F1, F2, and F3 on the boundary CF, BE, and BC can be determined. As shown in Fig. 3, BB1 and CC1 are perpendicular to the phreatic line and then make B1B2 perpendicular to AB and C1C2 perpendicular to CD. According to the geometric relationship, the hydrostatic pressure resultant forces at the boundary CF and BE are
γw is the unit weight of the water. Let ; the hydrostatic pressure resultant force on the slip surface BC is
The components of F3 in the horizontal and vertical directions are
The gravity of water in differential soil slice is
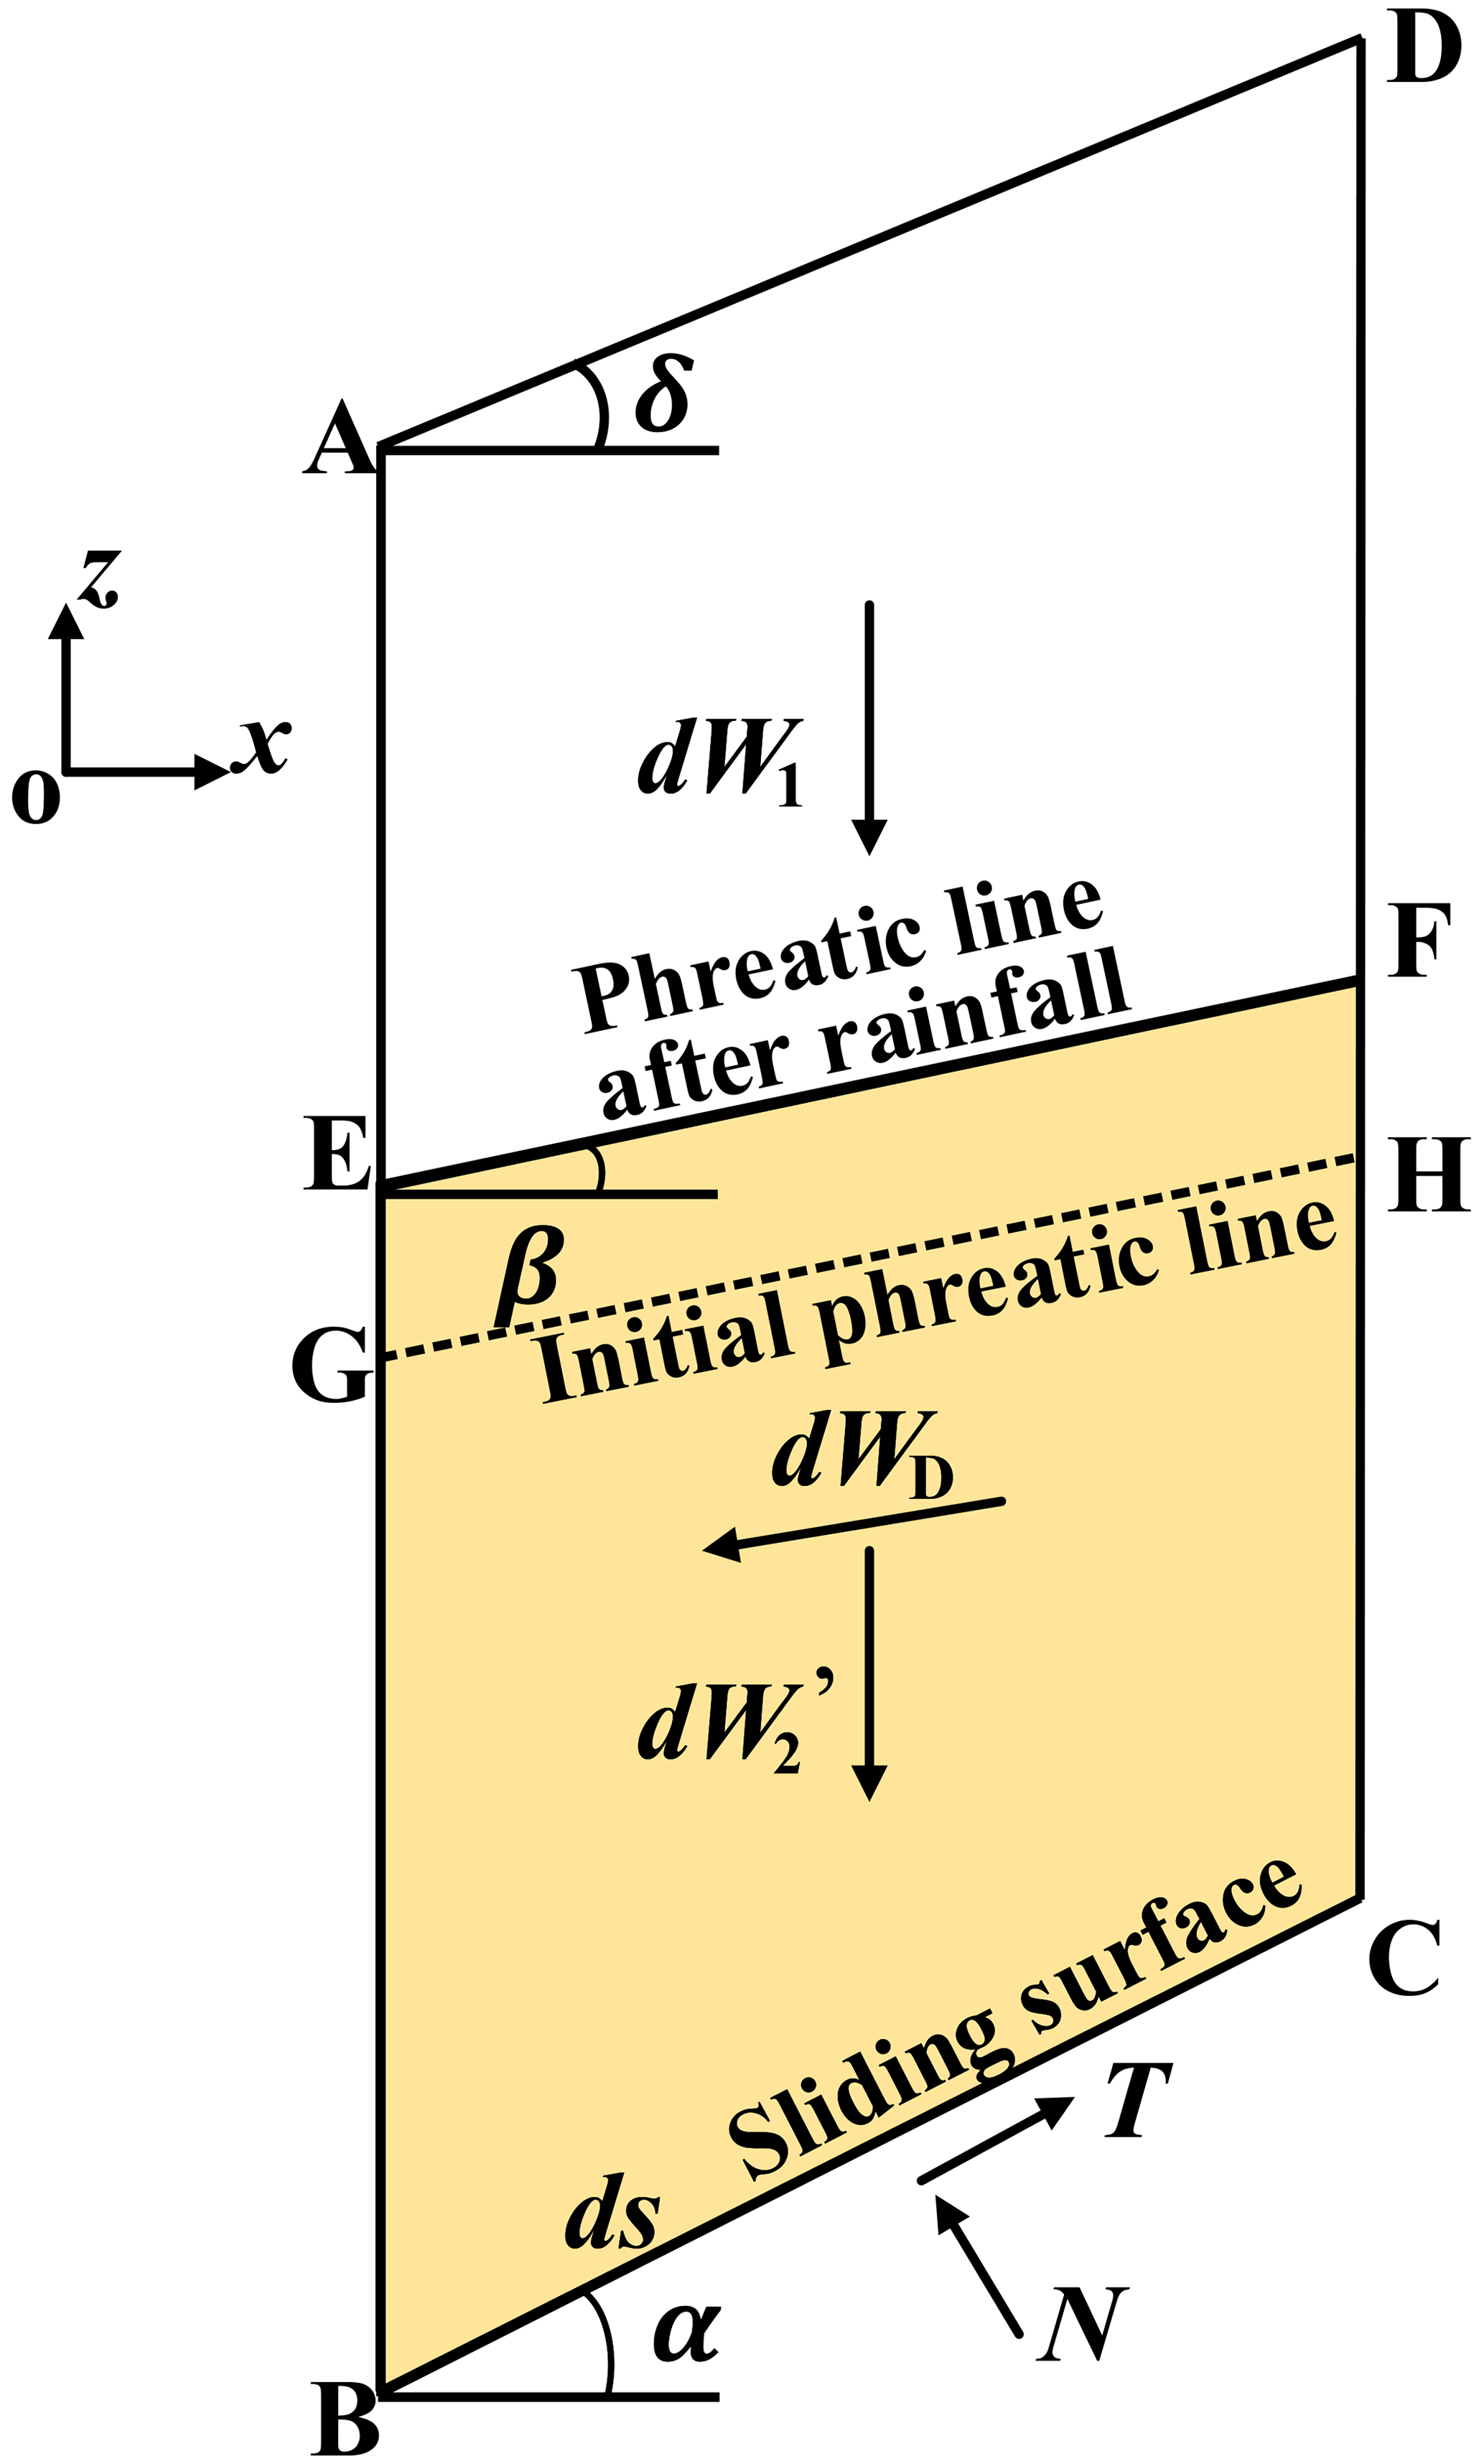
The permeability pressure is a pair of balancing forces with the water weight in a differential soil slice and the hydrostatic pressure around it (Zheng et al., 2004). Therefore, the weight of water in the differential soil slice and the surrounding hydrostatic pressure can be replaced by a seepage force. The force diagram in Fig. 2 can be replaced by Fig. 4. represents the effective unit weight of the soil below the phreatic line, and dWD is the seepage force.
The horizontal and vertical components of the seepage force dW3 are
According to the geometric relation,
Therefore, the seepage force is
The direction of seepage force is consistent with groundwater flow. The direction of groundwater flow within the sliding soil mass is determined by the inclination of the phreatic surface in each differential soil slice. As shown in Fig. 4, the flow direction of groundwater is oriented at an angle β relative to the horizontal plane.
3.1 Overall system of equilibrium equations
As shown in Fig. 5, taking the whole sliding body Ω as the research object, S is a potential slip surface.
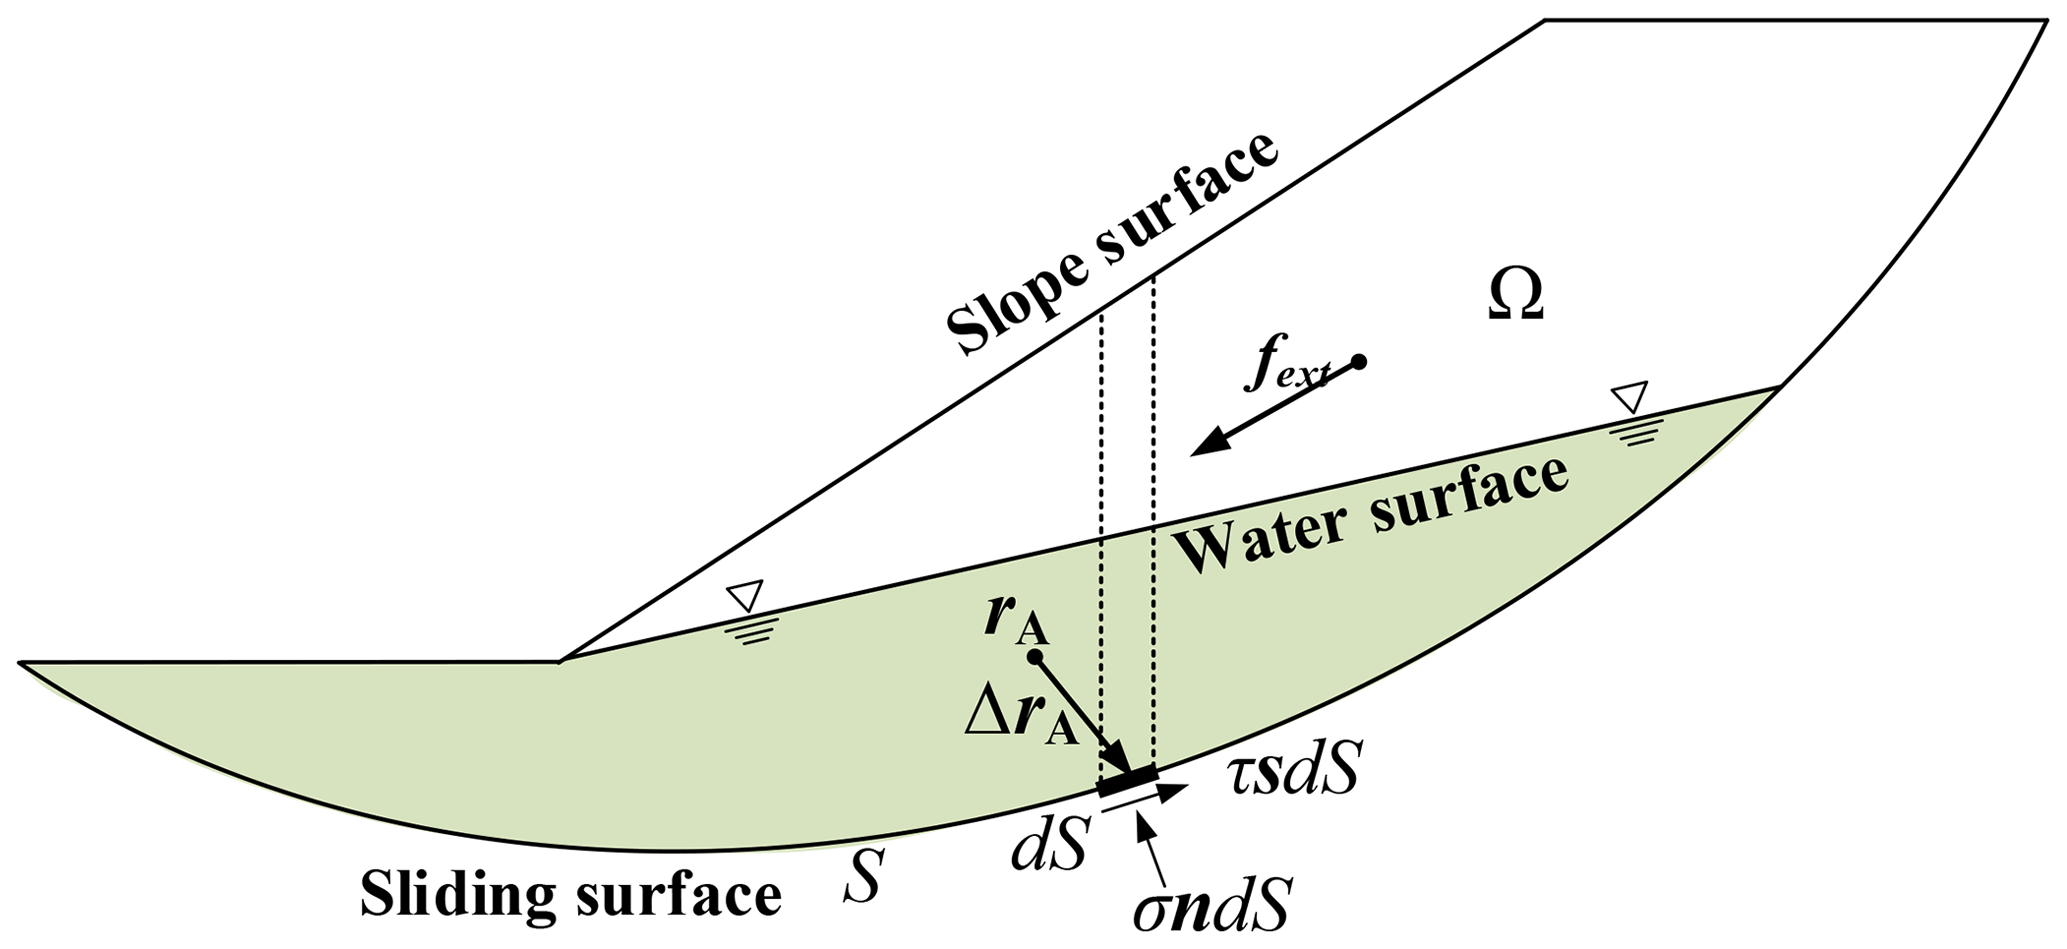
dS is a differential element on the sliding surface S. The normal force on a differential element dS at point r is σndS. The resultant shear force is τsdS. n is the unit normal vector at position vector r on S and pointing to the inside of the sliding body Ω; s is the unit tangent vector at position vector r on S and opposed to the sliding direction of the sliding body Ω, so the reaction on dS is
Here, . r is the position vector of dS. rA is the position vector for any given reference point A, and “×” represents vector multiplication.
fext is the resultant external force vector, including external loads such as gravity, seepage force, and seismic force; mext denotes the moment fext concerning rA. To integrate over the entire sliding surface dS,
According to the Mohr–Coulomb criterion,
Here, Fs is the safety factor, c′ and f′ are the effective stress shear strength parameters, c′ is cohesion, f′ corresponds to the tangent of the friction angle, and u is the pore pressure. cw is defined as
The order is
Substituting Eqs. (10), (11), and (14) into Eqs. (12) and (13), and merging into a more compact form,
3.2 Normal stress expression of slip surface under seepage force and seismic force
As shown with the dashed line in Fig. 5, a vertical differential cylinder is now taken from the homogeneous sliding body from the slip surface to the slope surface. The load on the differential cylinder is shown in Fig. 6. −kdw1 is the weight of the soil above phreatic surface, and refers to the floating weight of the soil below the phreatic surface. pdw3 and edw4 denote the seepage force and seismic force. dh refers to the action force of the soil around the differential cylinder.
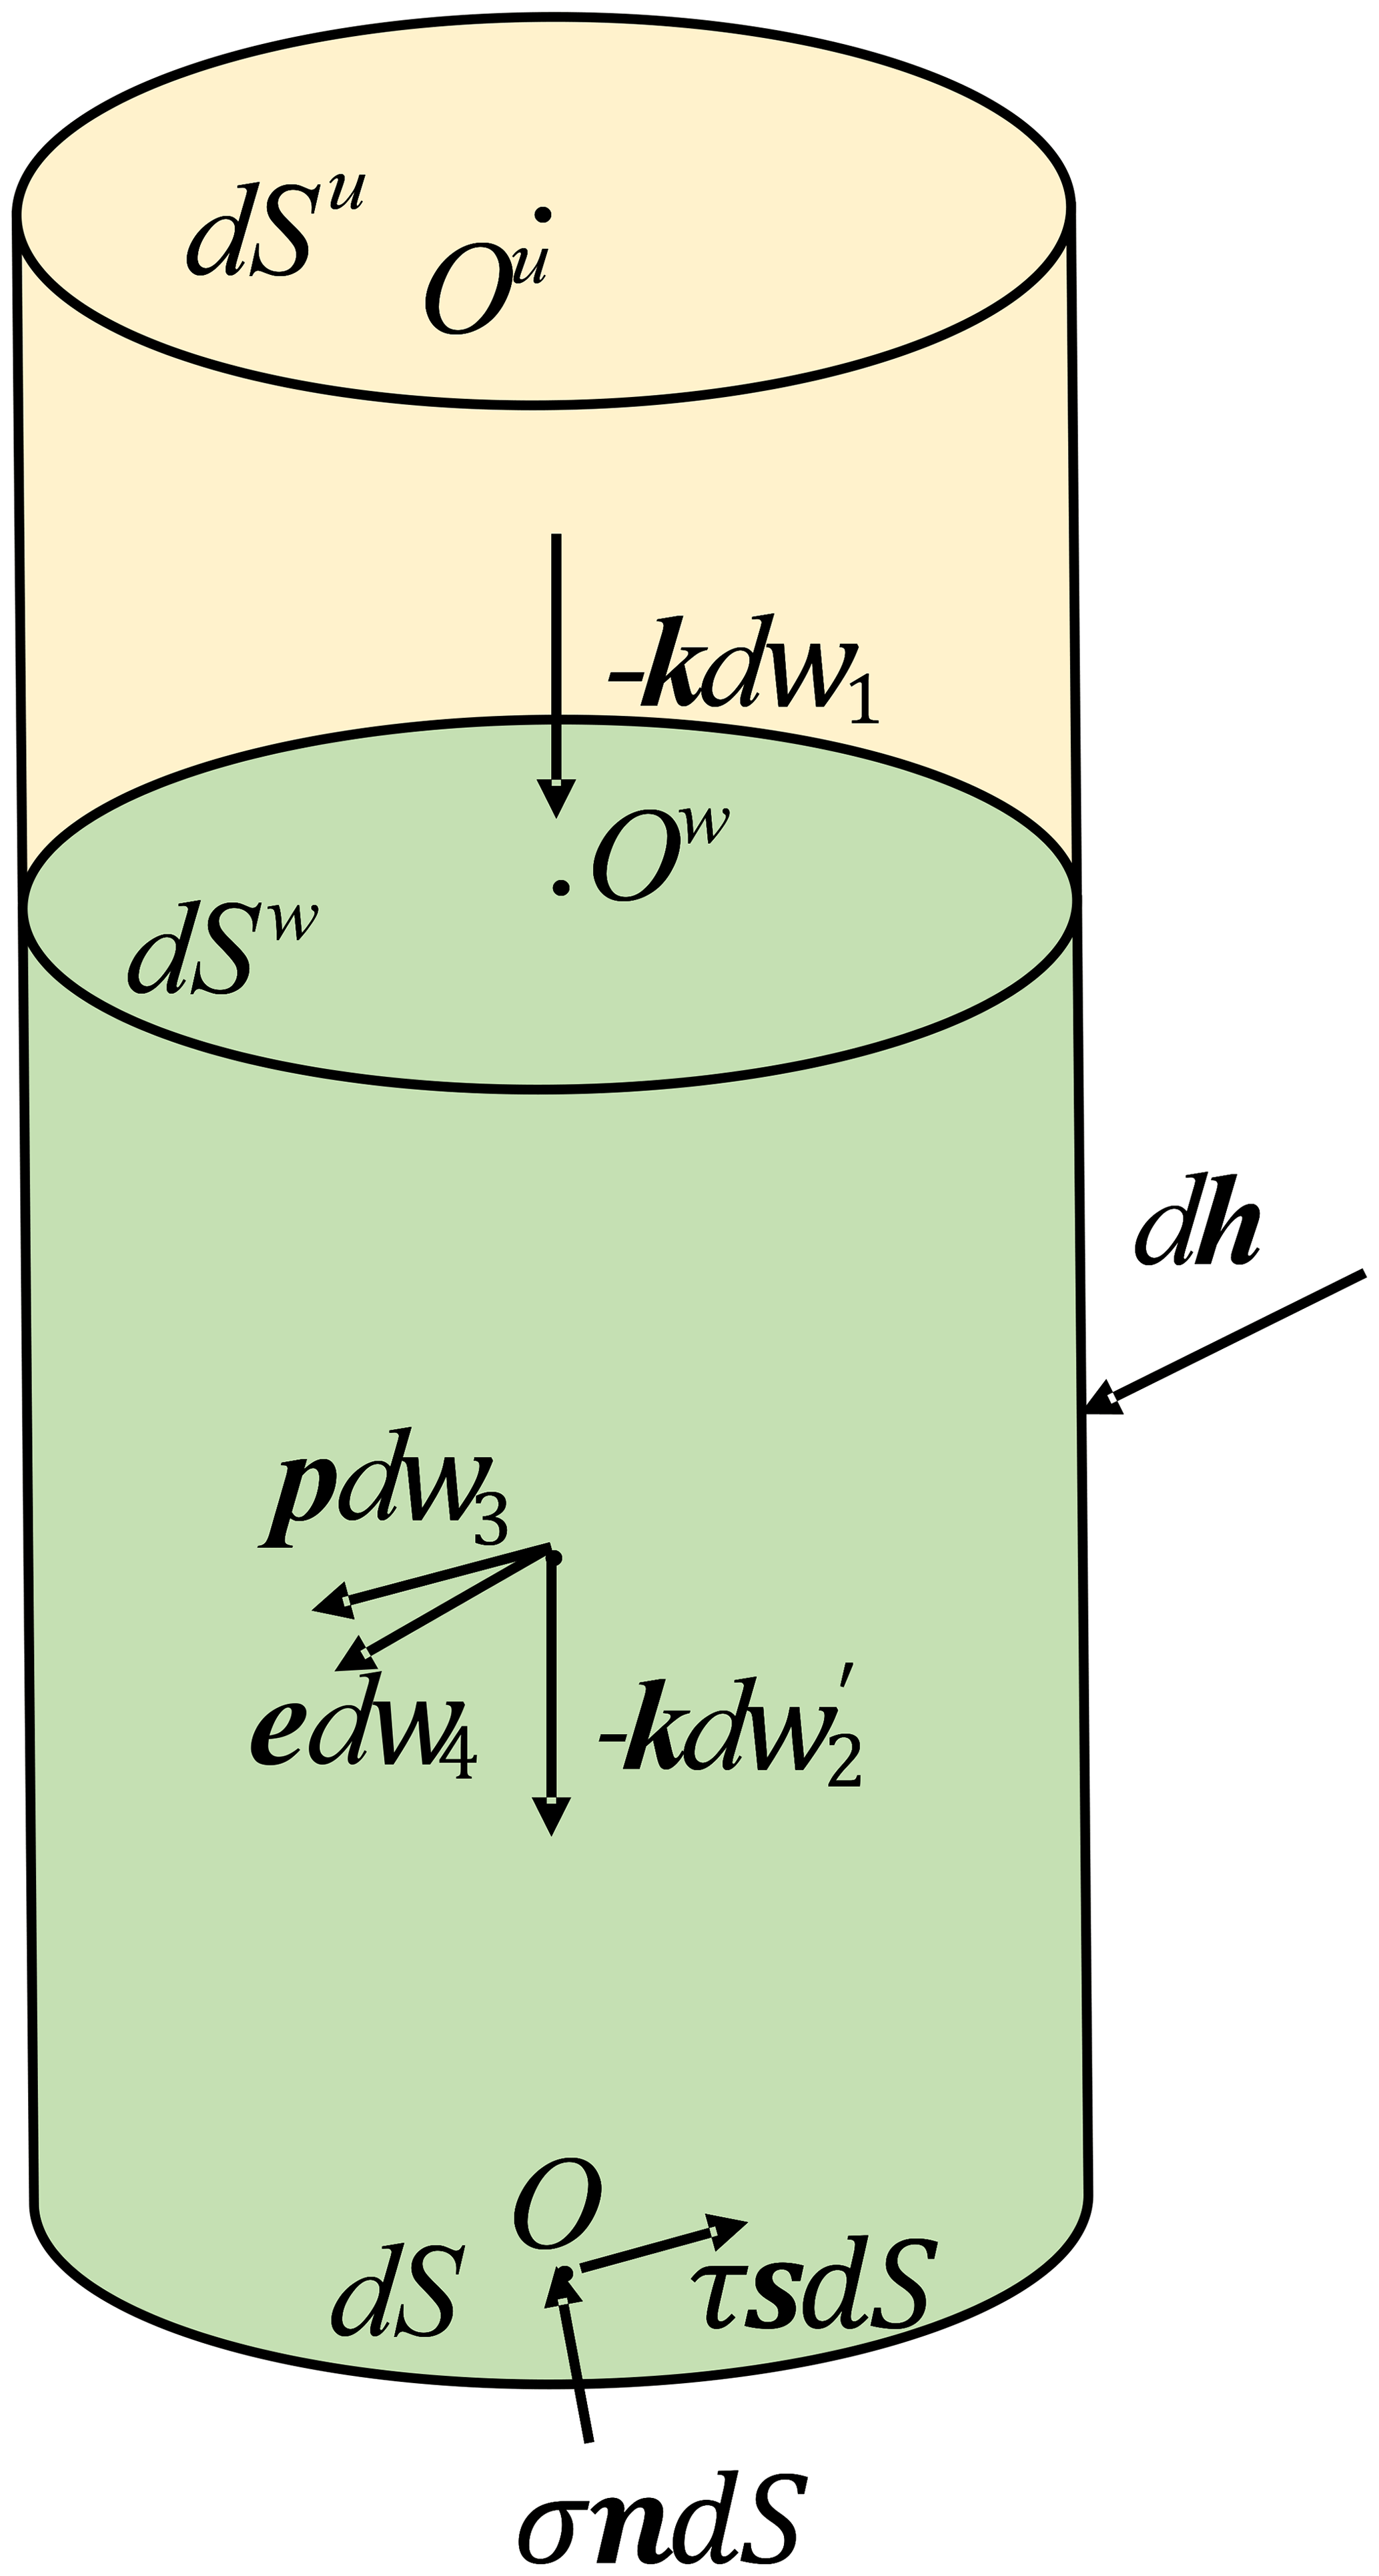
Here, k is the unit vector of z axis; p is the unit vector pointing to the direction of the seepage force; e is the unit vector pointing to the direction of the seismic force; θ is the angle between dS and the horizontal plane; ξ is the angle between the phreatic surface dSw and the horizontal plane in the differential cylinder.
The force equilibrium condition for a differential cylinder is
Both sides of the Eq. (18) are simultaneously multiplied by n to obtain
Here, n3 is the component of n in the positive direction of the z axis. np is the projection of p in n direction. ne is the projection of e in n direction.
The following is known:
where is the average value of the unit weight of the soil above the phreatic surface; γ′ is the average value for the unit floating weight of the soil below the phreatic surface; is the average value of the unit saturated weight of below the phreatic surface; γw is the unit weight of water; Hu is the height of soil above the phreatic surface; Hw is the height of the soil below the phreatic surface; kc is the seismic force coefficient.
Substituting Eq. (20) into Eq. (19) and sorting it out,
The order is
Therefore,
Here, σ0 is the contribution of volume force to the normal stress. hn is the contribution of the force of surrounding soil to the normal stress of sliding surface.
The normal stress distribution of the slip surface can be approximated in the following (Zheng, 2009):
where is the function in the horizontal coordinates (x,y) with a parametric vector a consisting of five unknowns. ) is constructed by piecewise triangular linear interpolation:
where l is the interpolation function, , and it satisfies .
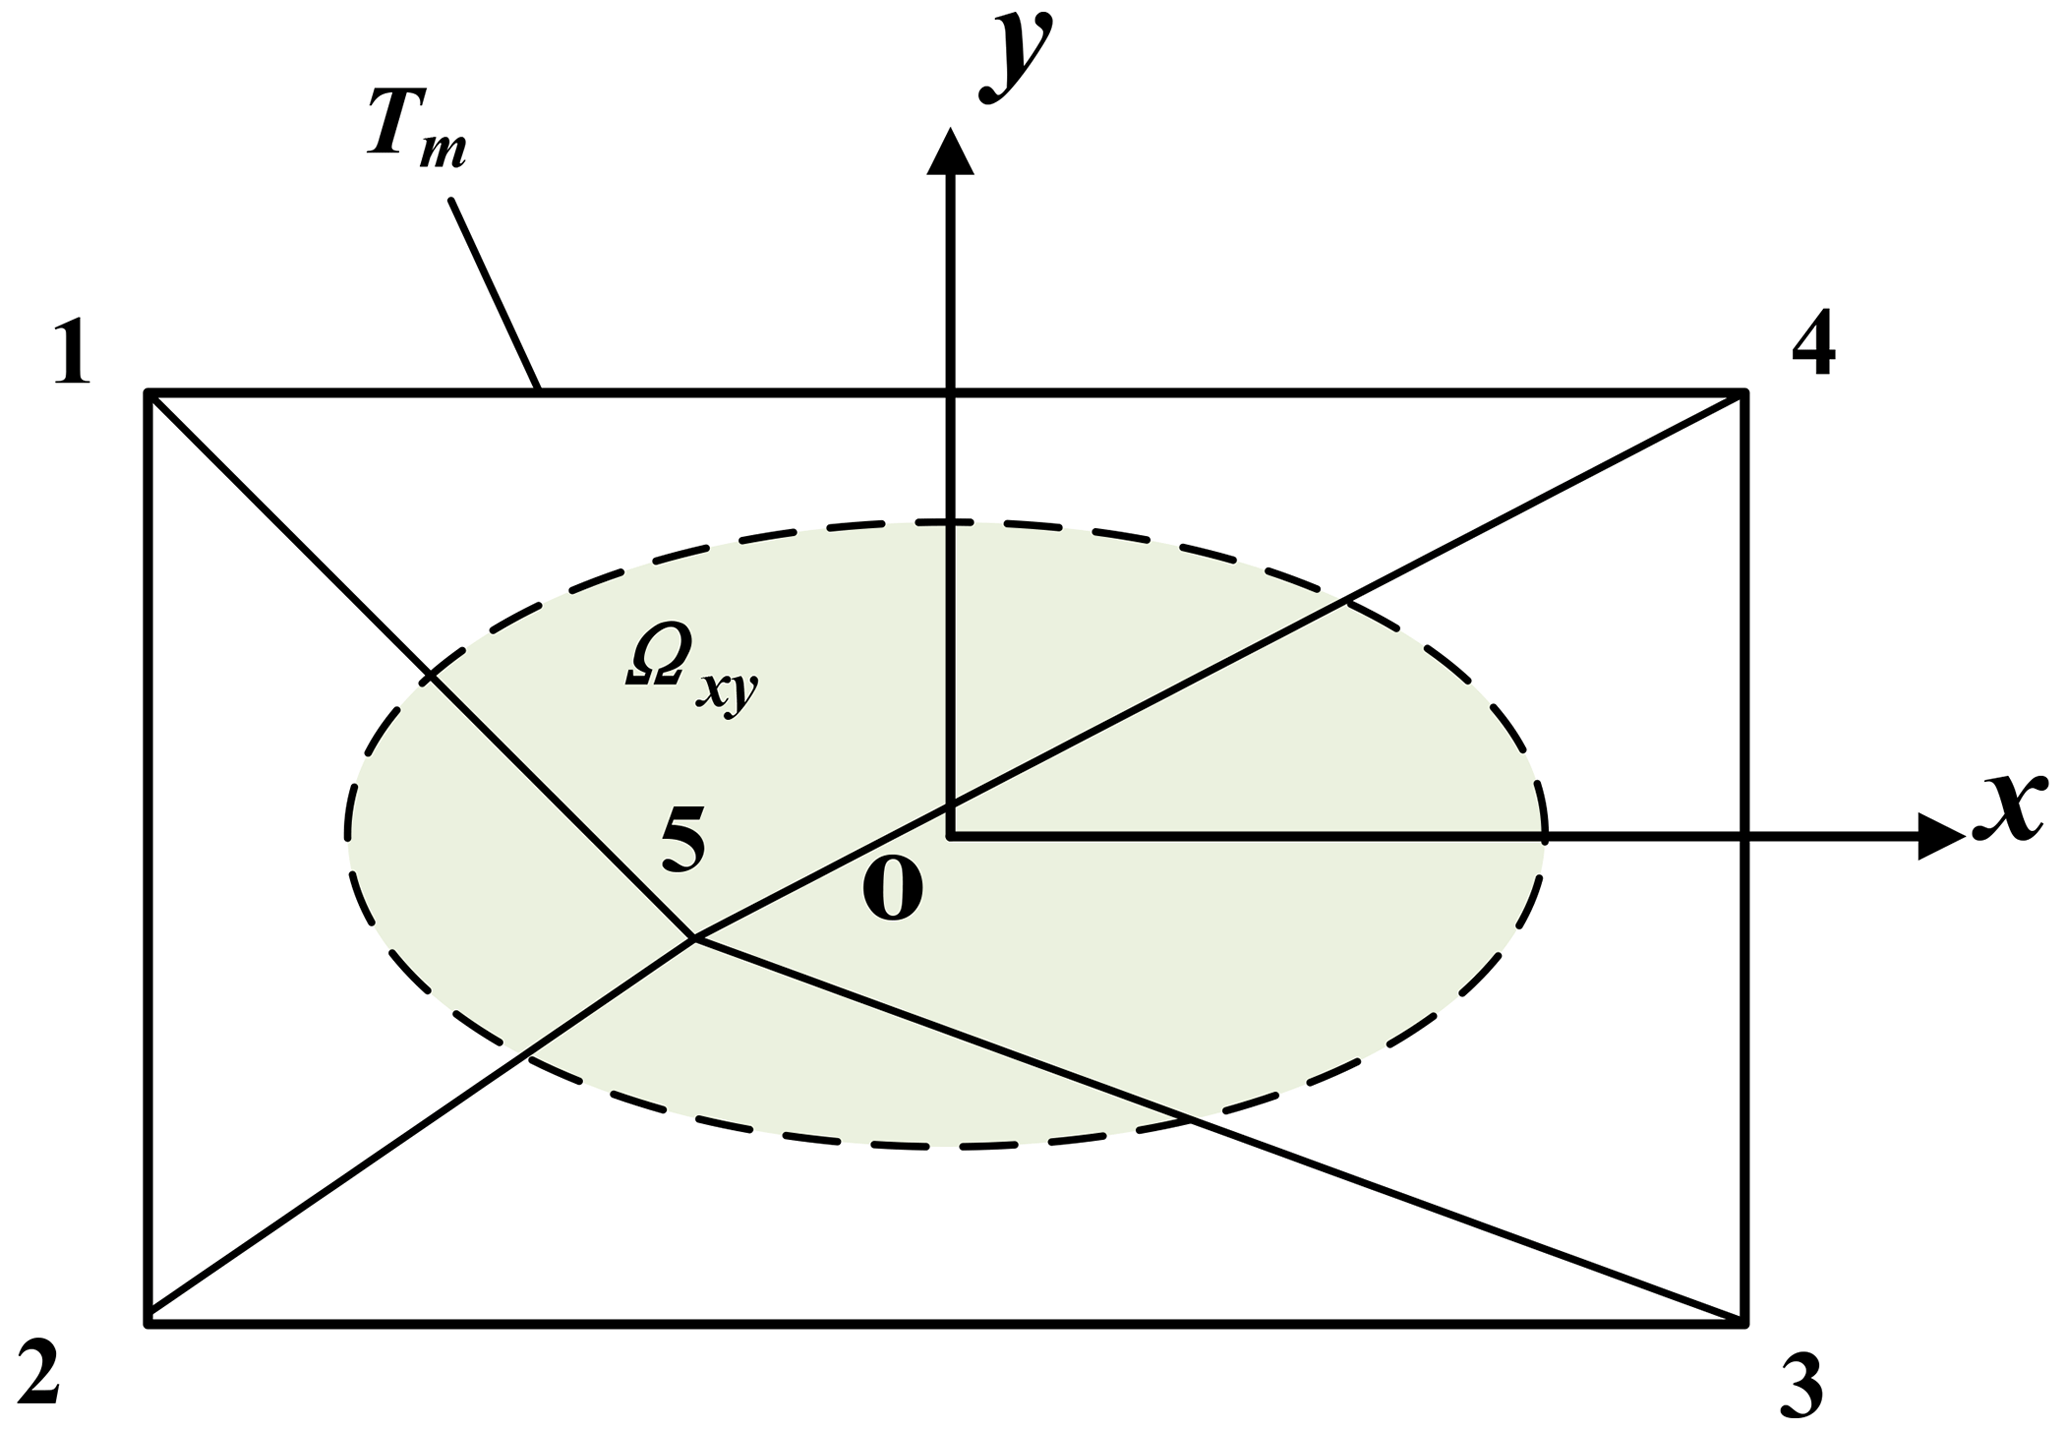
As shown in Fig. 7, Ωxy is the projection of the sliding body on the xoy plane, the area characterized by the dashed line. Tm is a triangular network containing five nodes. is the interpolation function for these five nodes, which can be formed as in finite elements with the help of the area coordinates of the four triangles on Tm.
Substituting Eq. (24) into Eq. (17), a system of nonlinear equations with Fs and a as unknowns is obtained:
where B and D are both matrices of the order of 6 × 5, and b and d are both vectors of the order of 6, whose expressions are respectively
We can solve Eq. (26) by either Newton's method or the eigenvalue method.
In Eq. (26), all terms except the resultant external force (moment) fm are area integrals. The volume integrals on the sliding body involved in the problem are transformed into boundary integrals that can skip the column partitions. Hence, it is not required to divide the sliding body into columns anymore; only the surface of the sliding body needs to be partitioned, as detailed in Zheng (2007).
In order to verify the accuracy of the proposed method, two examples are analyzed in this section. Different working conditions were set up for Example 2, and the results are compared with those calculated by the software.
4.1 Example 1: translational sliding
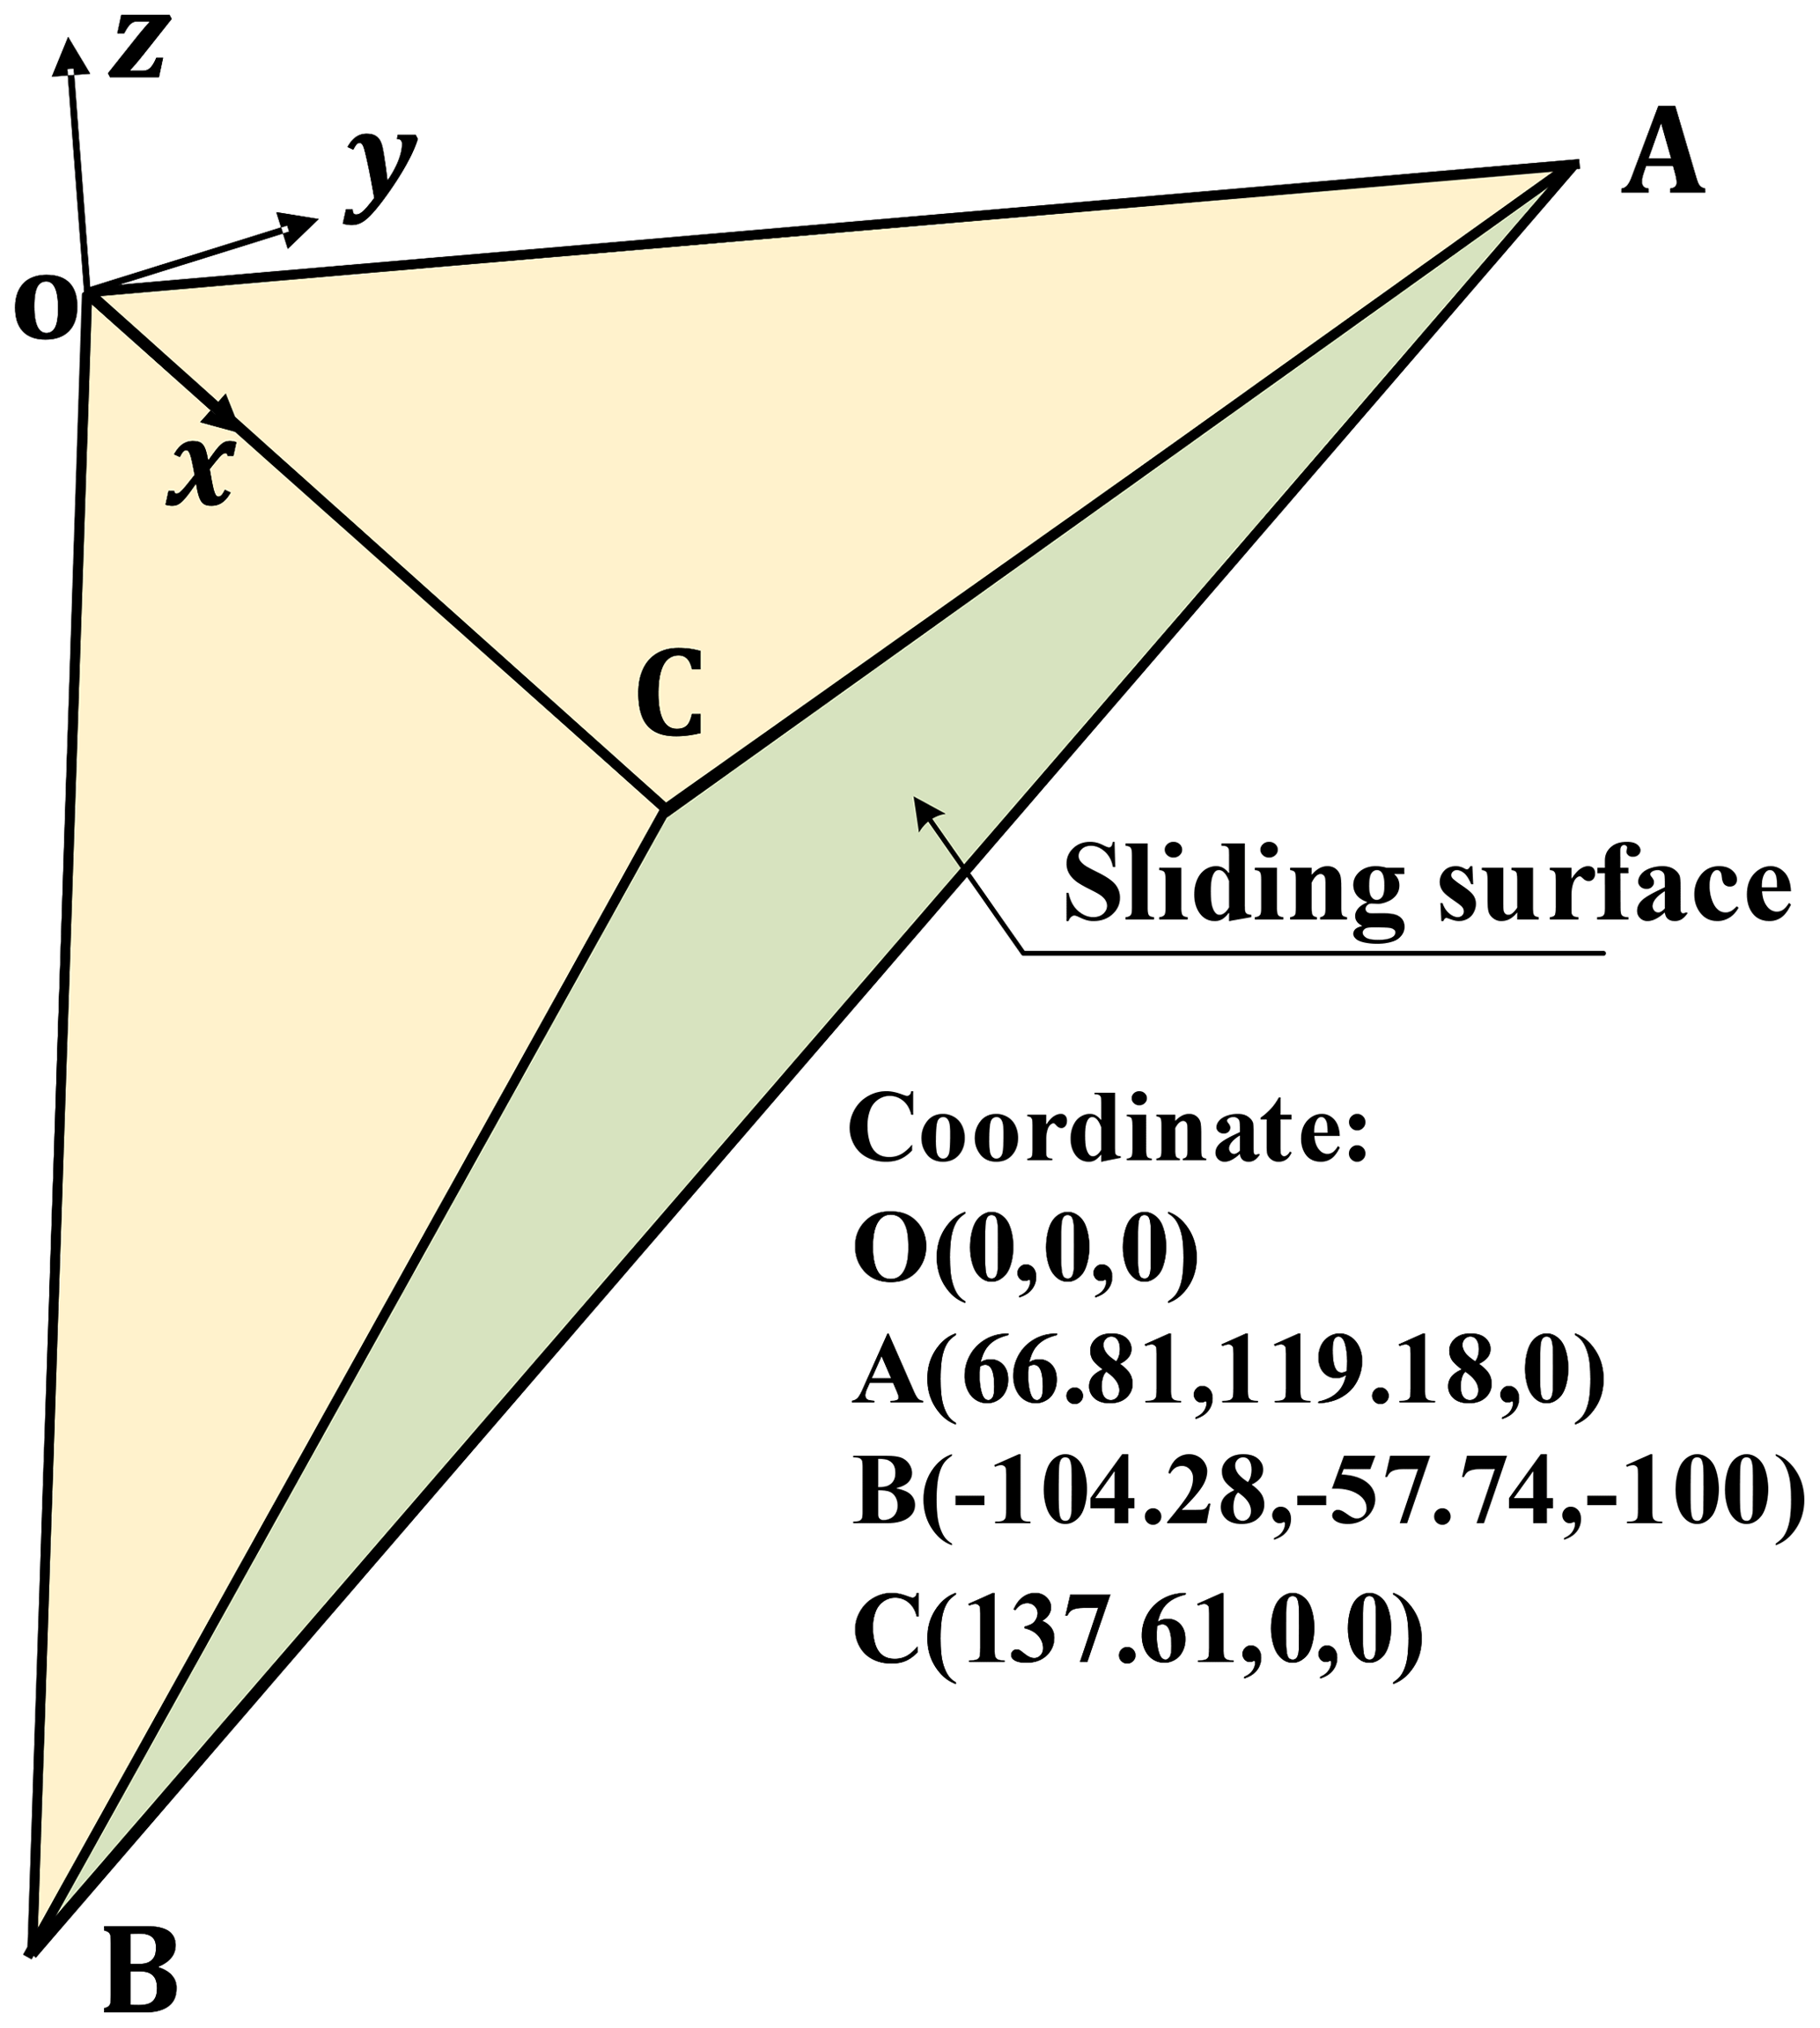
Wedge stability in rock mechanics is a typical 3D limit equilibrium analysis problem. Examples of wedge include two cases of geometric symmetry and asymmetry. Example 1 is an asymmetric wedge. Figure 8 shows the three-dimensional model and geometric parameters of the wedge plane sliding. The sliding surface is composed of two structural planes, ABC and OAB, and the coordinates of the vertices are listed in Fig. 8. The sliding direction of the wedge sliding body is assumed to be parallel to the intersection line AB. The sliding surface of the wedge adopts the same shear strength: c′ = 50 kPa and φ′ = 30°. The unit weight of the wedge is 26 kN m−3. For simple wedges, the 3D limit equilibrium method has analytical solutions, but these methods all include an assumption that the shear force on the bottom slip plane is parallel to the intersecting prism. If the sliding direction of the wedge sliding body is assumed to be parallel to the intersection line AB of the two structural planes, the wedge sliding body is statically determinate, and the safety factor has an exact value of 1.640 (Hoek and Bray, 1977) for this example. The safety factor calculated based on the method in this paper is 1.652. This discrepancy may stem from the triangulation of the sliding surface. In our method, the sliding surface is approximated using a series of small triangular elements, which might introduce a slight inaccuracy, leading to a minor deviation in the calculated safety factor. However, we observed a slight difference between exact value and the result obtained by the method proposed in our study: it demonstrates that the proposed method can reasonably evaluate the stability of rocky slopes containing different structural surfaces.
4.2 Example 2: ellipsoidal sliding
In order to verify the feasibility of the proposed method for calculating the slope stability under seepage and earthquakes, a classical ellipsoid example is selected for the stability analysis, as shown in Fig. 9, which is derived from the study of Zhang (1988). Zhang's (1988) paper in 1988 provides a three-dimensional slope ellipsoid slip surface example, and the simplified three-dimensional limit equilibrium method (only three force equilibriums and one moment equilibrium are satisfied) is used for the stability analysis. Zhang's (1988) solution for the 3D limit equilibrium of a symmetric ellipsoid can be regarded as a rigorous solution since the ellipsoid has a symmetric sliding surface, and the other two moment equilibrium conditions are automatically satisfied by the symmetric bar-column method. Zhang's (1988) solution has also been used by many scholars to check the correctness of their own procedures (Hungr, 1987; Huang and Tsai, 2000; Zheng, 2009). The example is a homogeneous slope, the potential sliding surface is a part of a simple ellipsoid, the sliding surface is symmetric about the xoz plane, and the equation of the sliding surface is
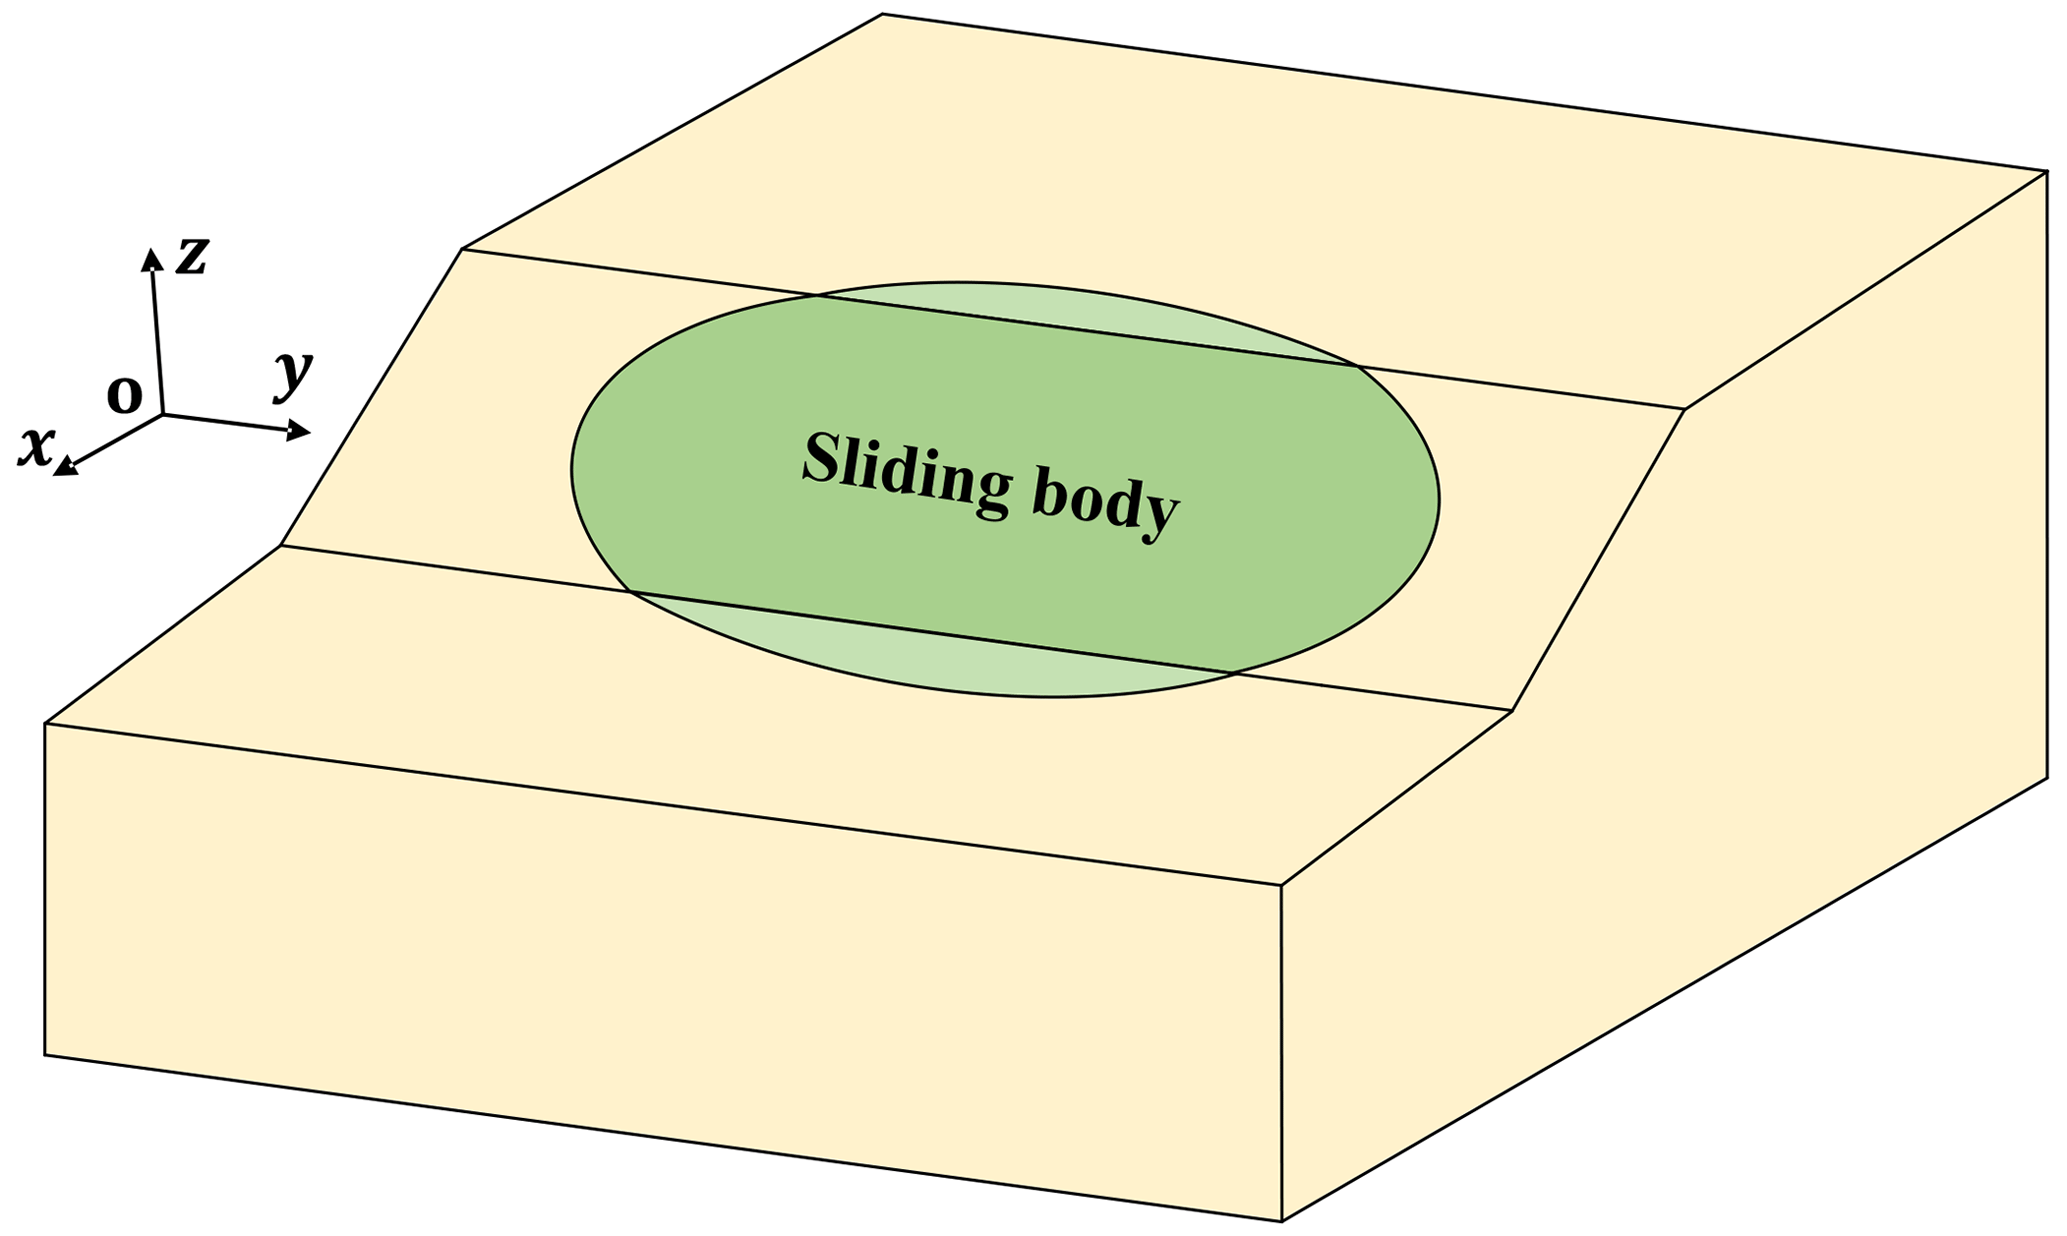
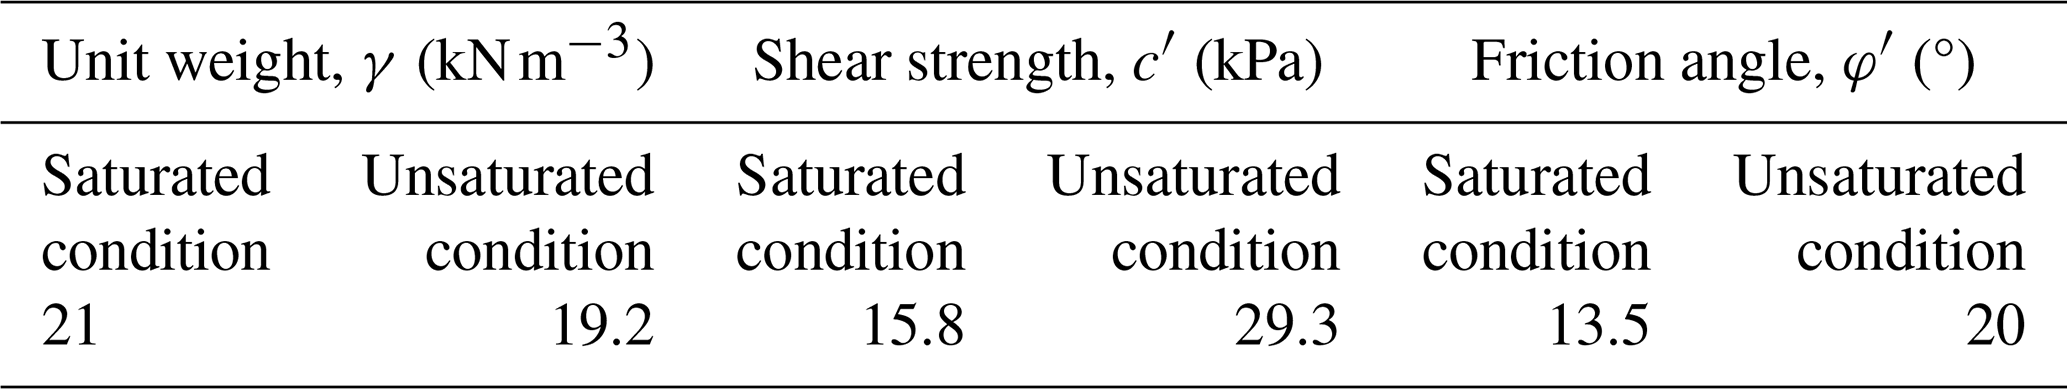
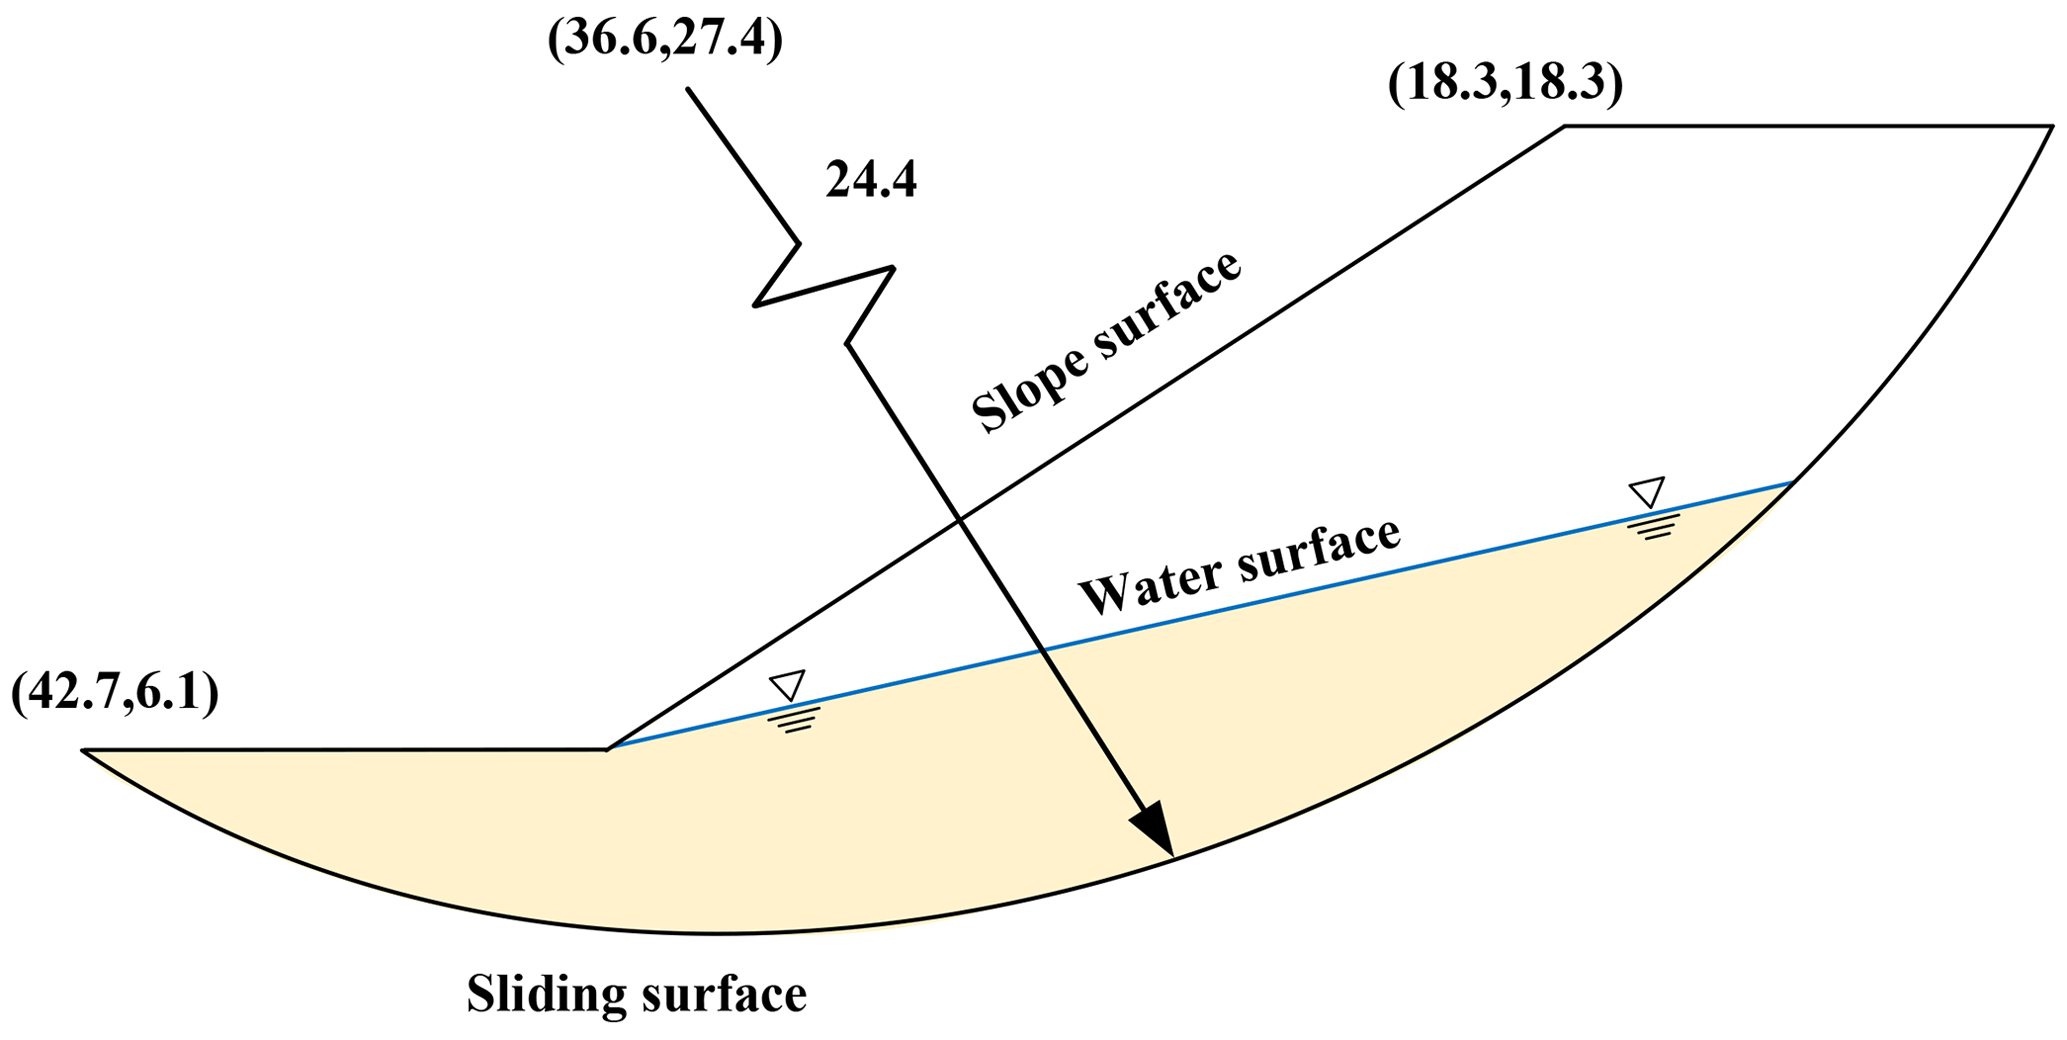
The ellipsoid model is shown in Fig. 9. The external load of the slope is only considered the effect of gravity, the unit gravity is 19.2 kN m−3, and the effective shear strength parameter: c′ = 29.3 kPa and φ′ = 20°. We extended the analysis to include complex conditions such as groundwater presence and seismic activity. Four working conditions are considered in this section: case 1, in which no groundwater is considered as in the computational model of Zhang (1988); case 2, in which groundwater is set up as shown in Fig. 10 (the mechanical parameters are listed in Table 1); case 3, in which earthquake action in the horizontal direction is considered; and case 4, in which both groundwater and horizontal earthquake action are considered. Reference to the peak ground acceleration at the location of the real slope in the Three Gorges Reservoir area is in Sect. 5. The earthquake acceleration is taken 0.05 g and the horizontal earthquake direction along the x-axis positive direction. The results from other methods and our proposed method are listed in Table 2.
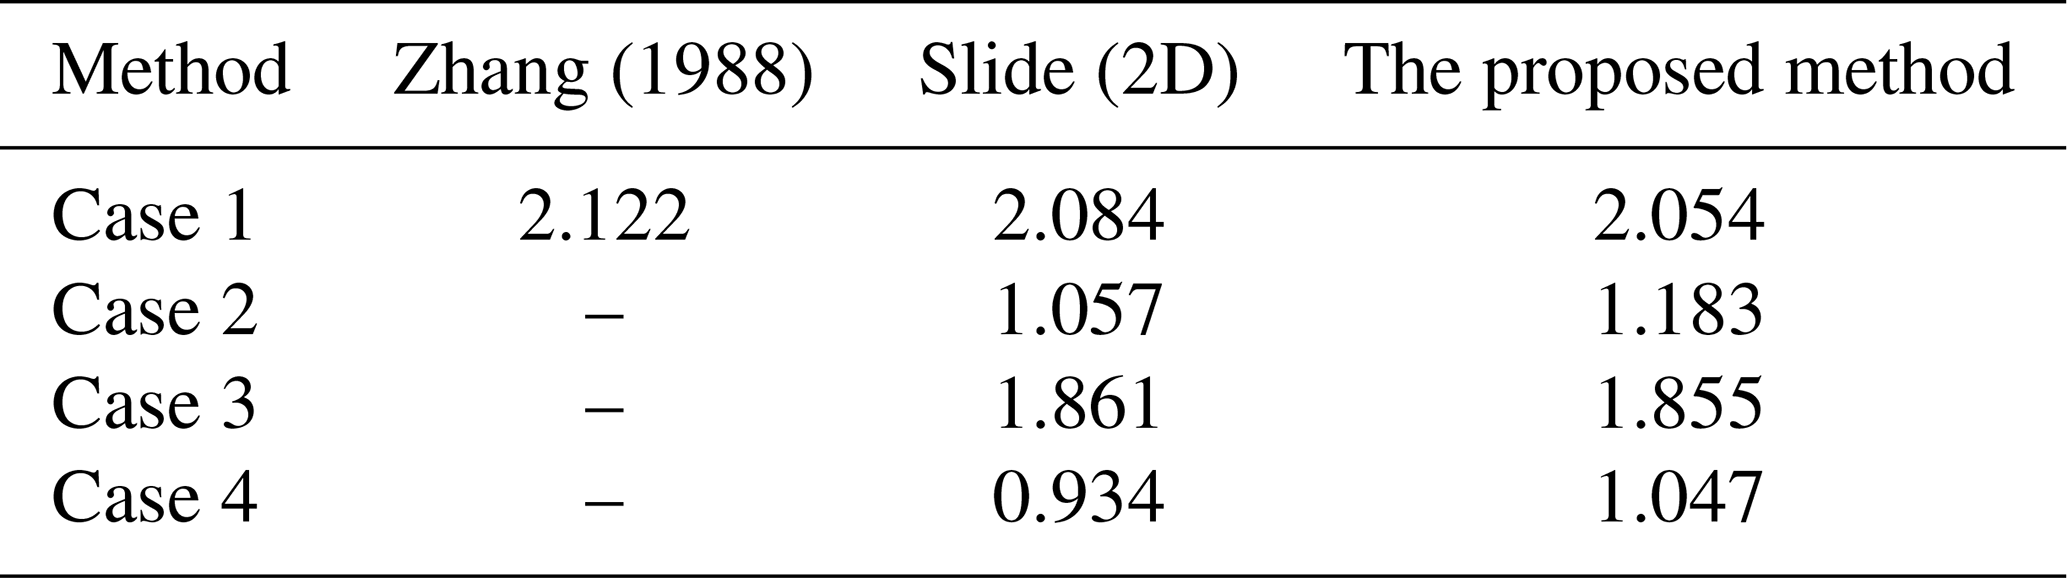
Case 1. The safety factor calculated using our proposed method is 2.054, whereas Zhang (1988) obtained a result of 2.122 using the limit equilibrium method. Additionally, we perform a 2D stability analysis of the intermediate cross-section of the model using Rocscience's Slide software and obtain a safety factor of 2.084. Comparing the results mentioned above, it becomes evident that our proposed method for slope stability analysis is feasible, and its calculation results are consistent with the results obtained by using the traditional limit equilibrium method and two-dimensional stability analysis.
Case 2. Only the effect of groundwater seepage is considered. Mechanical parameters of the slope below the water surface adopt saturated, while above the water surface they adopt unsaturated. The groundwater not only induces hydrodynamic effects, but also increases the saturation of geotechnical materials, leading to a reduction in soil shear strength. In this working condition, the calculated safety factor is 1.183, which is close to 1.057 calculated by Rocscience's Slide.
Case 3. We only consider the effect of horizontal earthquake on slope stability. In order to compare the results with the 2D stability calculations, we choose the horizontal seismic action direction to be in the xoz plane. The results calculated by the 3D procedure and the 2D software are 1.855 and 1.861, respectively. Compared with case 2, the effect of seepage on the slope stability is greater than that of seismic action.
Case 4. We considered both seepage and horizontal seismic effects. In this case, the results calculated by 3D program and 2D software are 1.047 and 0.934, respectively.
Based on the above calculation results, the comparison revealed minimal differences across all four conditions (natural, with groundwater, with seismic loading, and combined), indicating that the proposed method is also effective in assessing slope stability under seepage and seismic actions.
This section investigates slope stability evolution under the influence of rainfall and earthquake by taking an actual slope in the Three Gorges Reservoir as a case study.
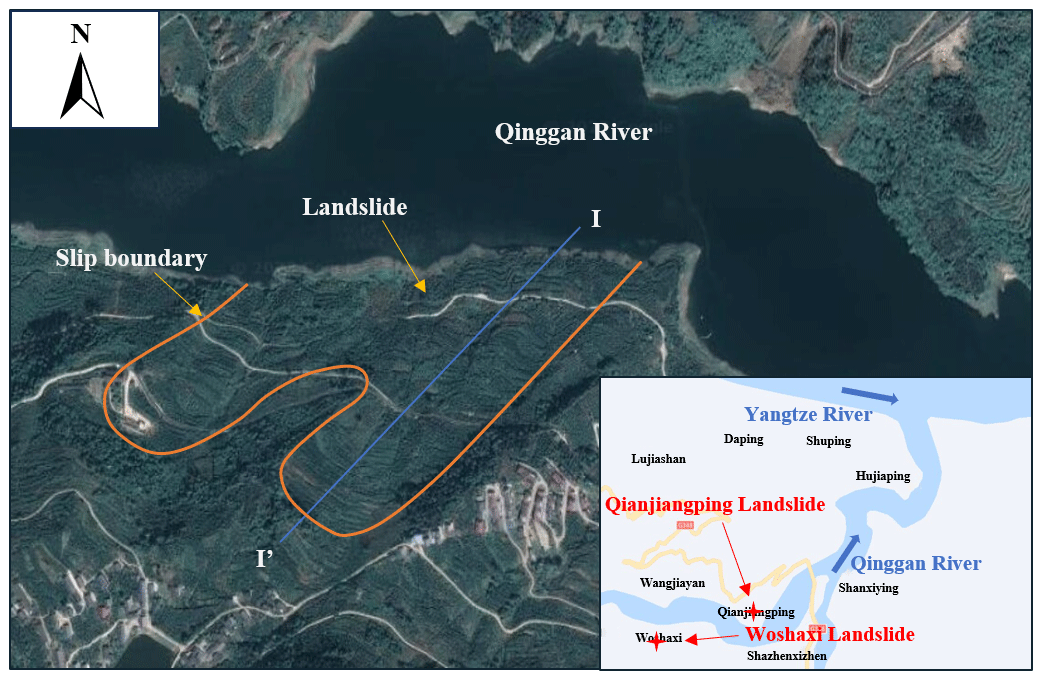
Figure 11Geographical location map of Woshaxi slope (©Google Maps).
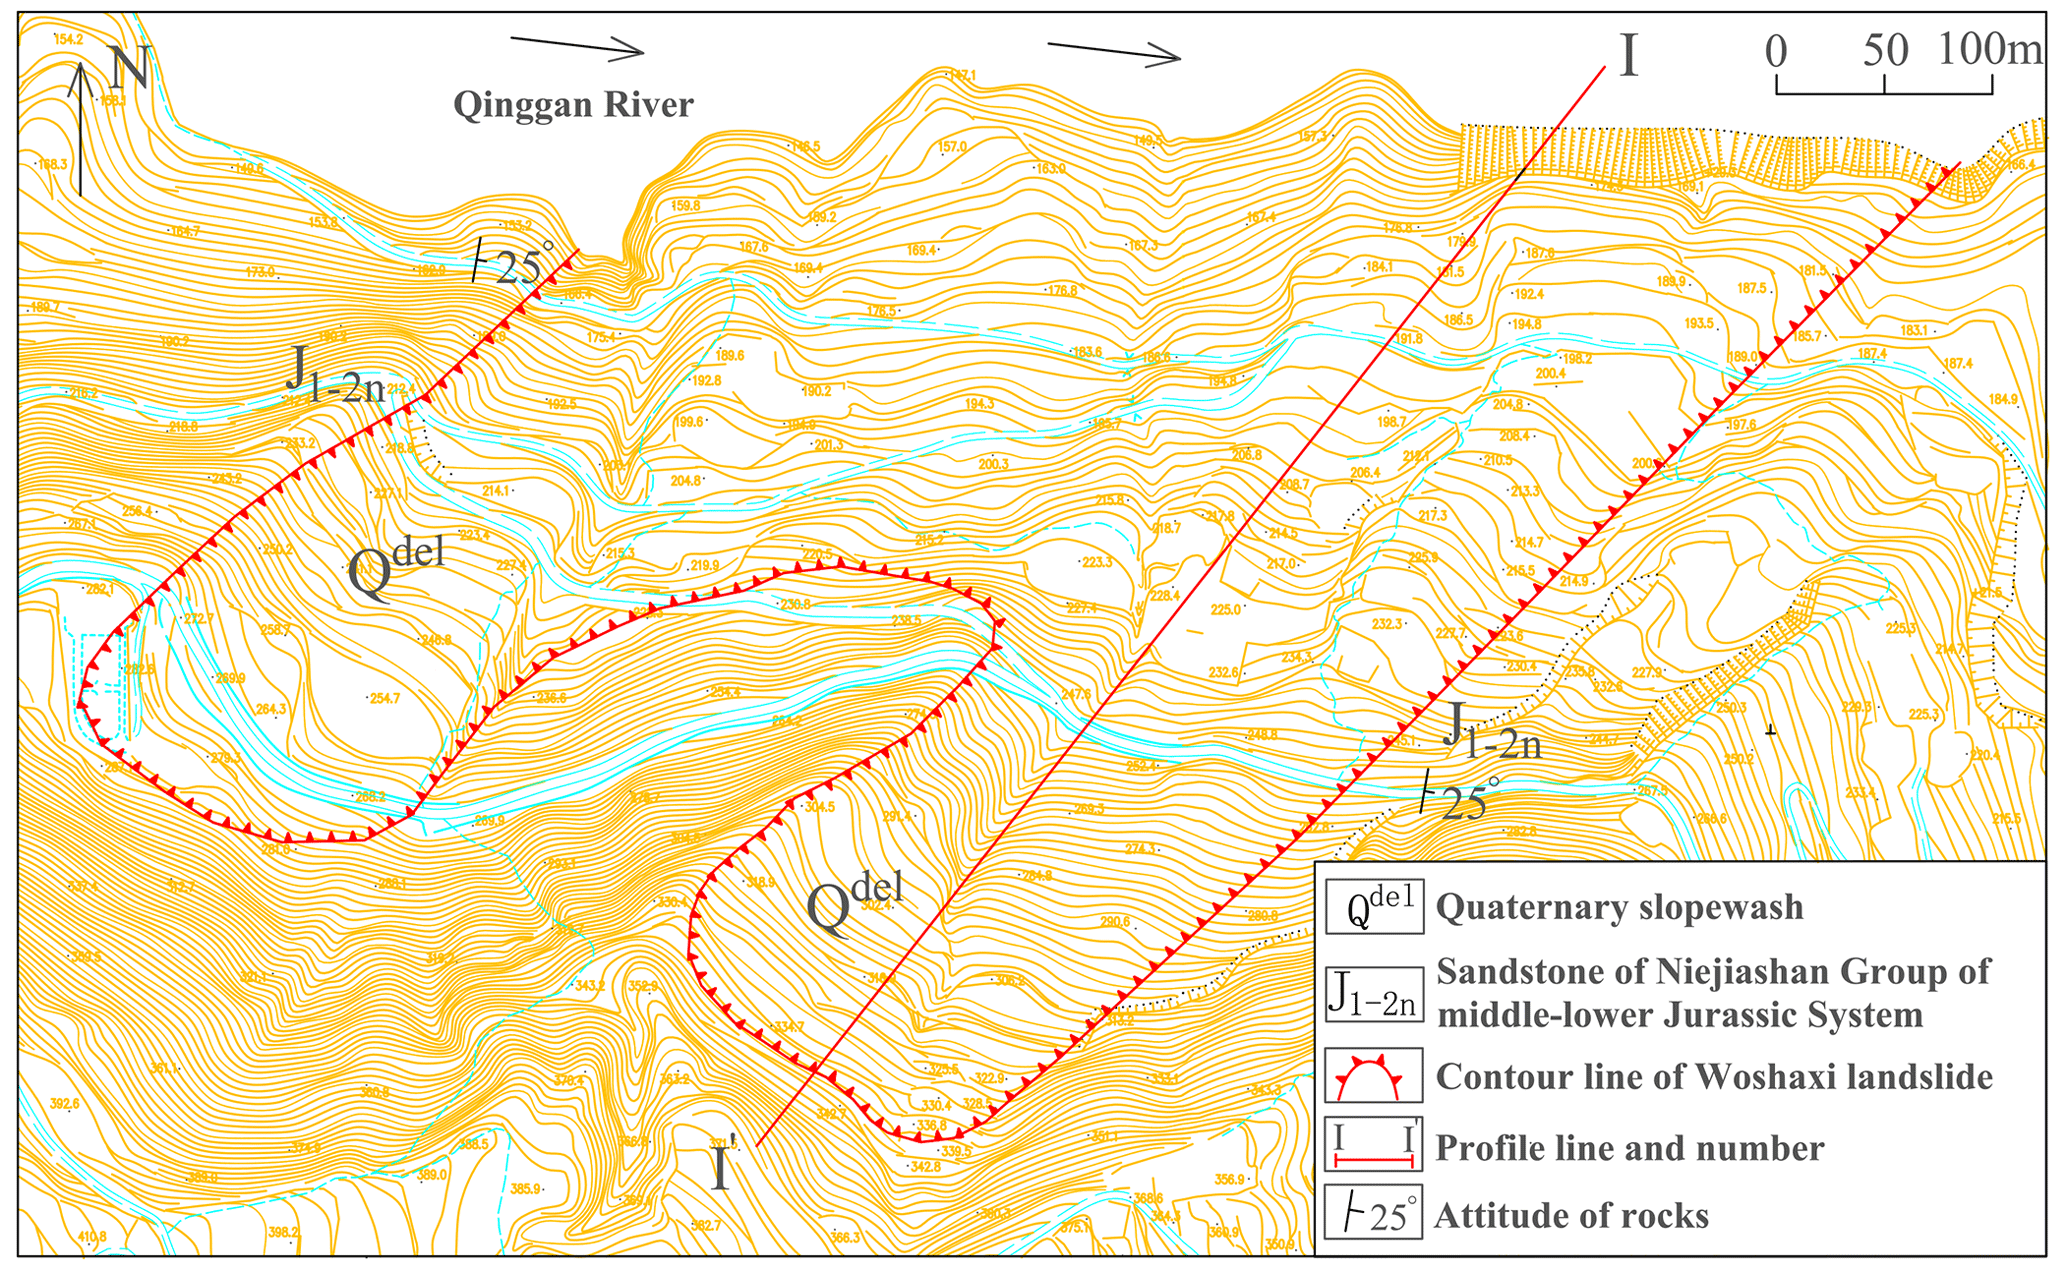
Figure 12Contour map of Woshaxi slope.
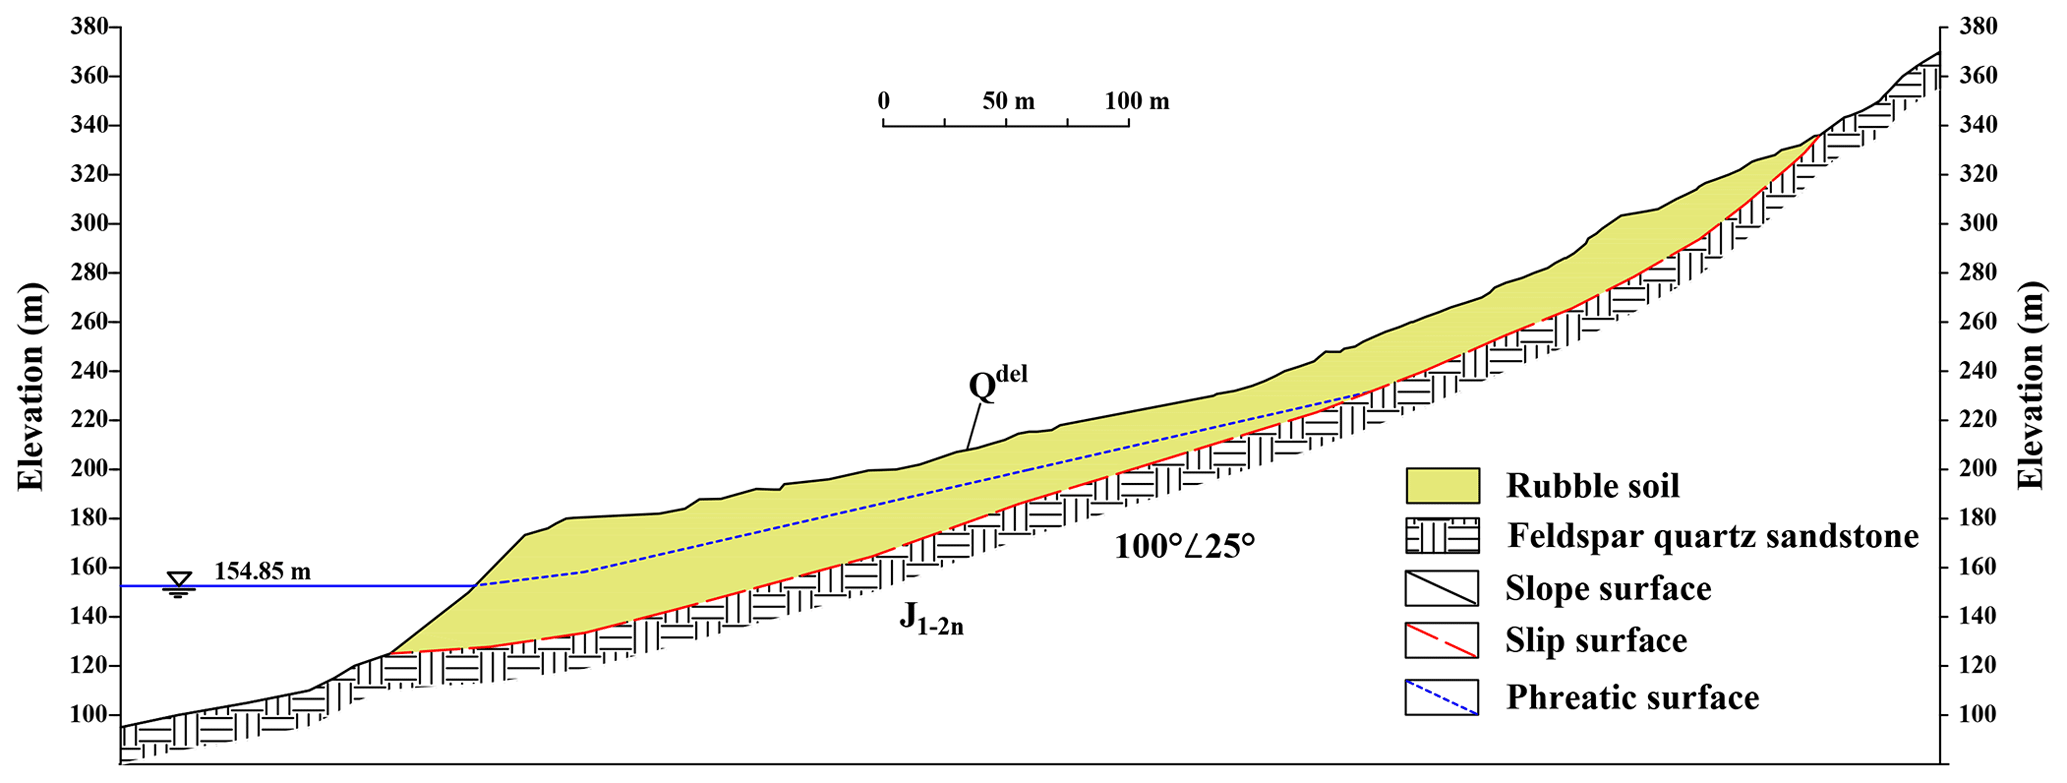
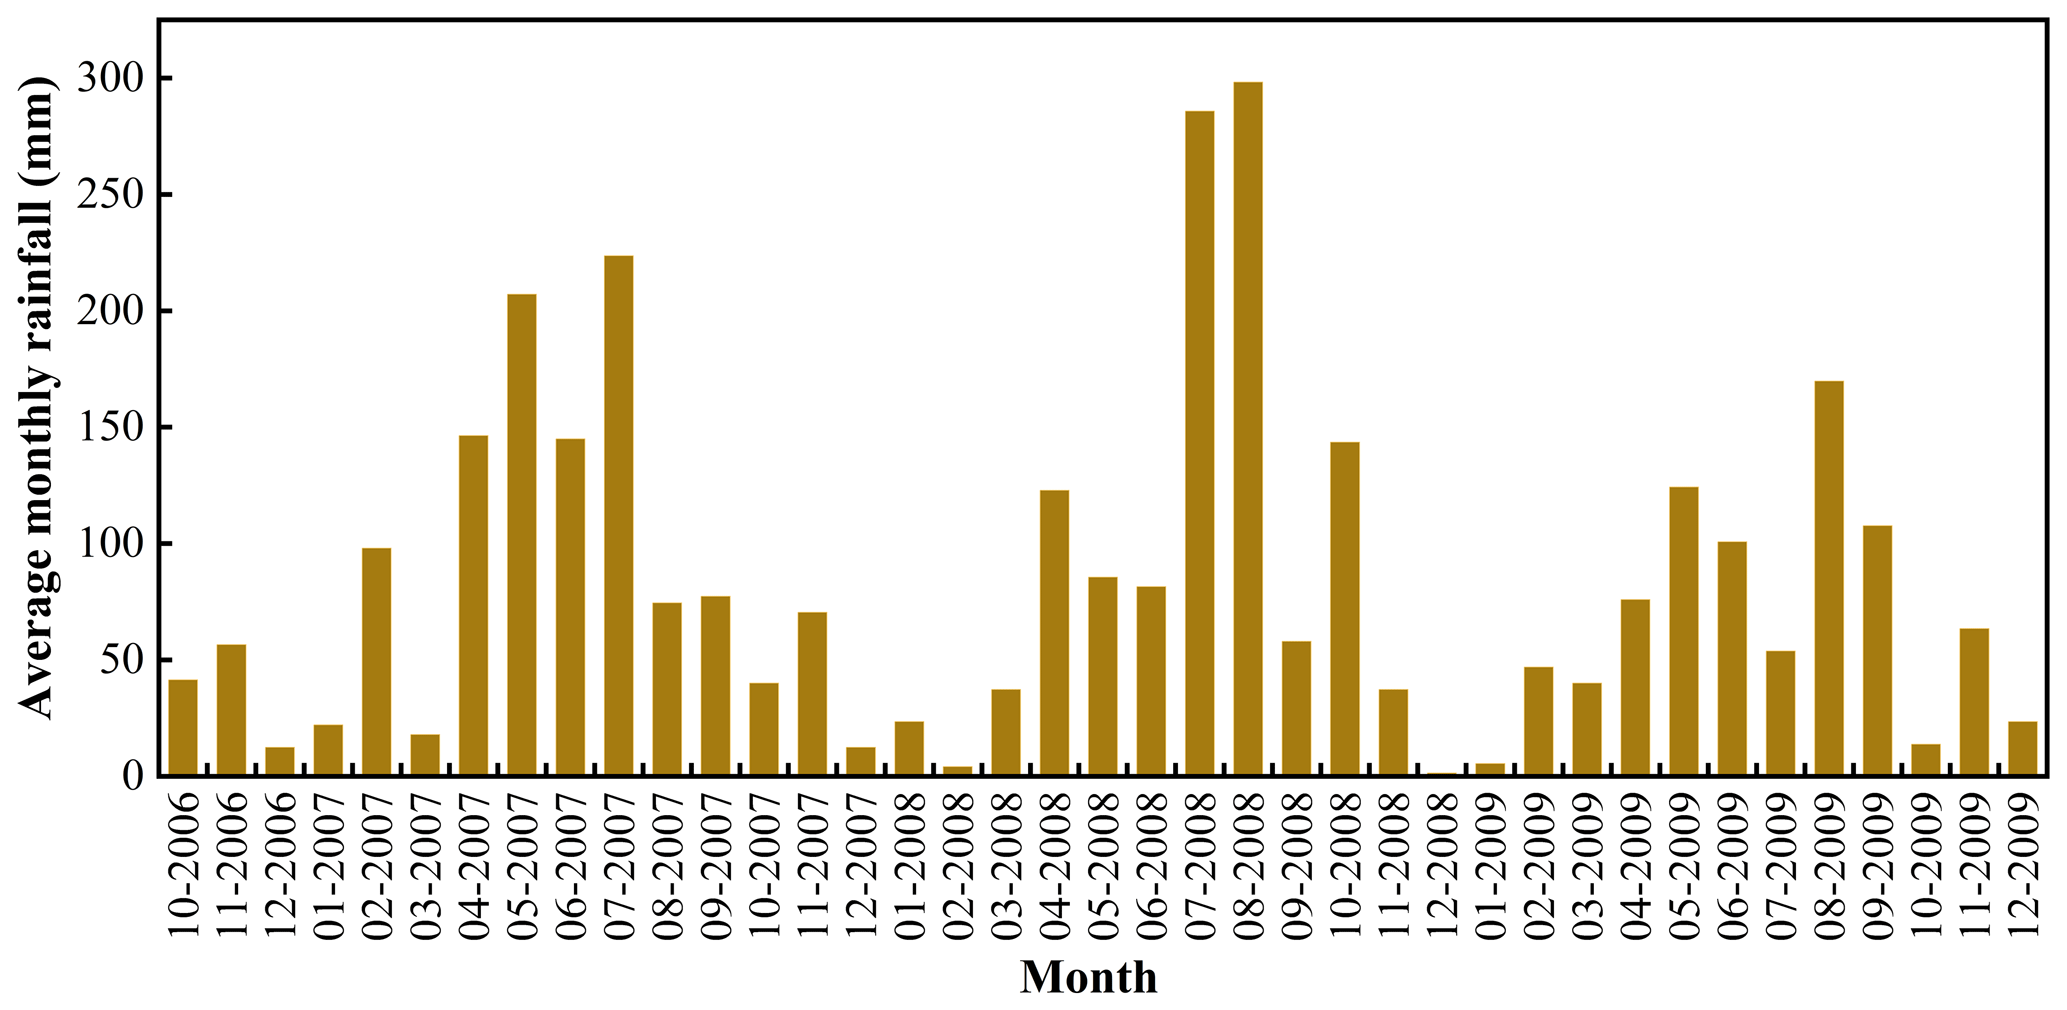
Figure 11 provides a depiction of the Woshaxi landslide's geographical setting. Figure 12 shows a topographic map of Woshaxi slope with contour lines, and the cross-section (I-I′) of the landslide is illustrated in Fig. 13. This landslide is located on the right bank of the Qinggan River, a Yangtze River tributary, and lies about 1.5 km away from the Qianjiangping landslide situated on the river's opposite bank. The composition of the Woshaxi landslide primarily consists of rubble and soil, underlain by Jurassic-era sandstone and mudstone layers that are interstratified. The orientation of these rock layers is 100° ∠ 25°. The landslide has experienced significant impact due to water level fluctuations in the range of 145–175 m, resulting in submersion of its frontal part by about 20–50 m. This geological structure displays a descending gradient from the southwest to the northeast, with a general gradient of 20°. The highest point at the rear reaches an elevation of 405 m, and the front edge descends below 140 m. The landslide encompasses an average thickness of around 15 m and a total volume estimated at 4.2 × 10⁶ m3. Its main sliding direction of the landslide body is toward 40° northeast.
According to the Seismic Ground Motion Parameter Zonation Map of China, the peak ground motion acceleration in this region is 0.05 g. To investigate slope stability evolution under seismic conditions, peak accelerations are calculated and analyzed at various levels. The most dangerous case is considered in the following calculations, where the direction of the horizontal seismic action coincides with the primary sliding direction. The precipitation pattern in this region is characterized by relatively concentrated temporal and spatial distribution. Most of the rainfall occurs between April and October. To investigate the stability of three-dimensional slopes under the combined influence of rainfall and earthquake, this study considers the effects of three geotechnical parameters: permeability coefficient, porosity, and saturation. The proposed method is applied to calculate changes in slope stability resulting from average monthly rainfall and earthquake occurring between 2007–2009.
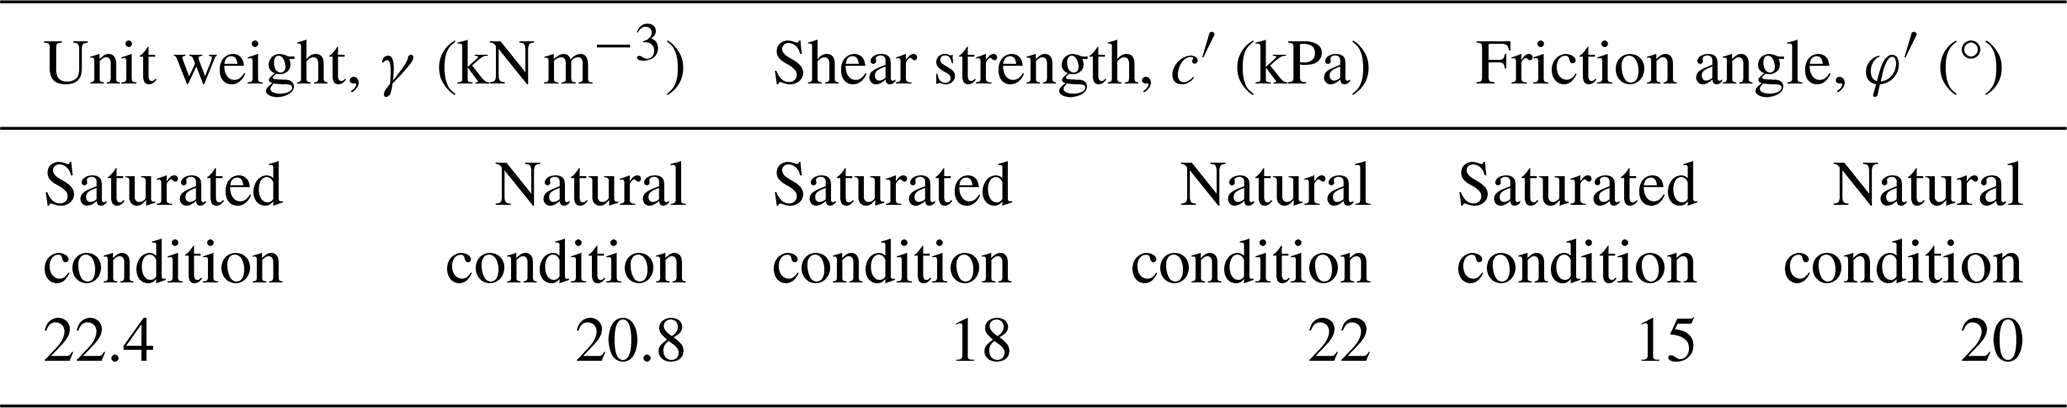
Figure 14 shows the average monthly rainfall from 2007 to 2009. Table 3 lists the physical and mechanical parameters of the landslide body. It is assumed that the reservoir water level remains unchanged. To assess the effects of different geotechnical parameters and seismic action on the safety factor, four cases are considered: (i) rainfall only, (ii) rainfall and horizontal earthquake, (iii) rainfall and vertical earthquake, and (iv) rainfall and earthquake in both horizontal and vertical directions.
(i) Rainfall only
The three parameters, infiltration coefficient, porosity, and saturation, have different effects on the safety factor of slopes. The safety factor varies with the monthly rainfall. The analysis indicates that an increase in rainfall does not invariably lead to a decrease in the safety factor of the slope. This phenomenon can be attributed to the fact that increased rainfall raises the phreatic surface within the slope, affecting two key aspects: firstly, it enhances the hydrodynamic forces, and secondly, it increases the pressure at the base of the slope. When the increase in pressure at the slope's base has a more pronounced impact on stability than the hydrodynamic forces, the safety factor of the slope will subsequently increase. Conversely, if the hydrodynamic forces dominate, the stability of the slope will diminish. As shown in Fig. 15a, the permeability coefficient k is 0.01, 0.1, and 1 m d−1, respectively. With other parameters unchanged, the trend of safety factor variation for Woshaxi landslide is consistent. The higher the permeability coefficient, the greater the soil's ability to allow water to pass through above the phreatic surface and the smaller the rise of the phreatic surface within the slope. This results in a smaller increase in pressure at the foot of the slope and a lower safety factor.
As shown in Fig. 15b, the porosity n is 0.1, 0.3, and 0.5, respectively, and the safety coefficient of the Woshaxi landslide is consistent under the condition that other parameters remain unchanged. The higher the porosity, the greater the soil permeability above the phreatic surface and the smaller the rise of the phreatic surface within the slope, resulting in a smaller increase of pressure at the slope's foot and thus a lower safety factor.
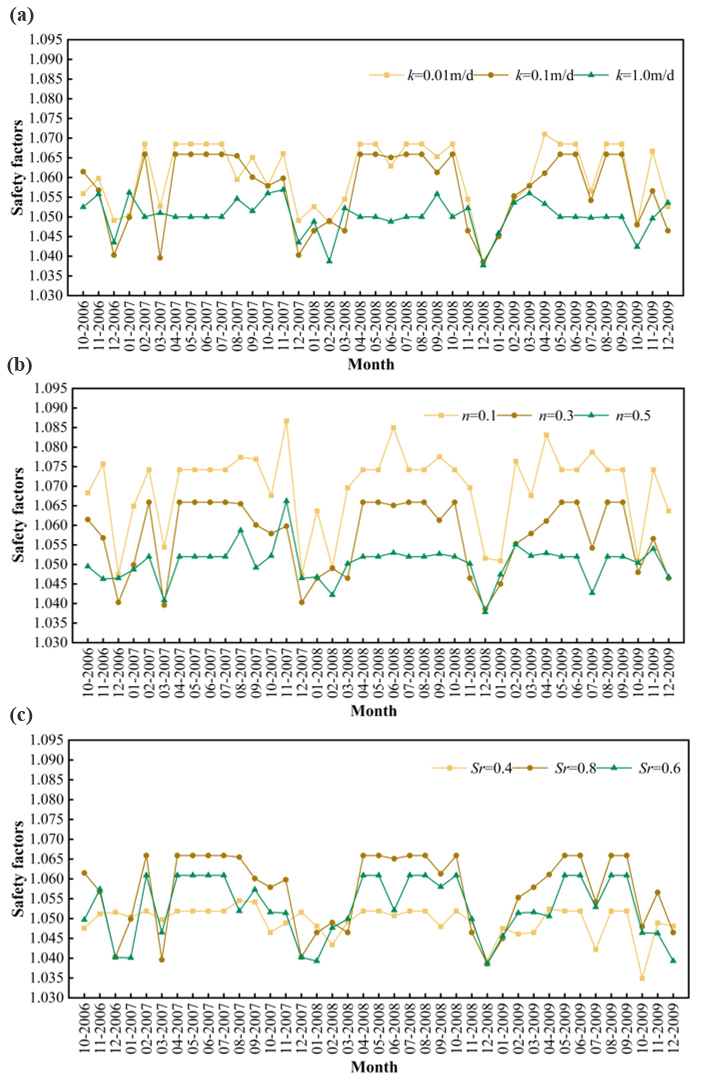
Figure 15Safety factors of the Woshaxi landslide under rainfall. (a) Permeability coefficient. (b) Porosity. (c) Saturation.
As shown in Fig. 15c, the saturation Sr of the soil above the phreatic surface of the landslide is 0.4, 0.6, and 0.8, respectively, and the safety factor of the Woshaxi landslide is consistent under other parameters, which remained unchanged. The higher the saturation, the lower the permeability of soil above the phreatic surface, resulting in a greater rise of phreatic surface within the slope and an increased pressure at its foot, thereby leading to a higher safety factor. Overall, under rainfall conditions, soil porosity on the phreatic surface has a greater impact on safety factor than permeability coefficient and saturation.
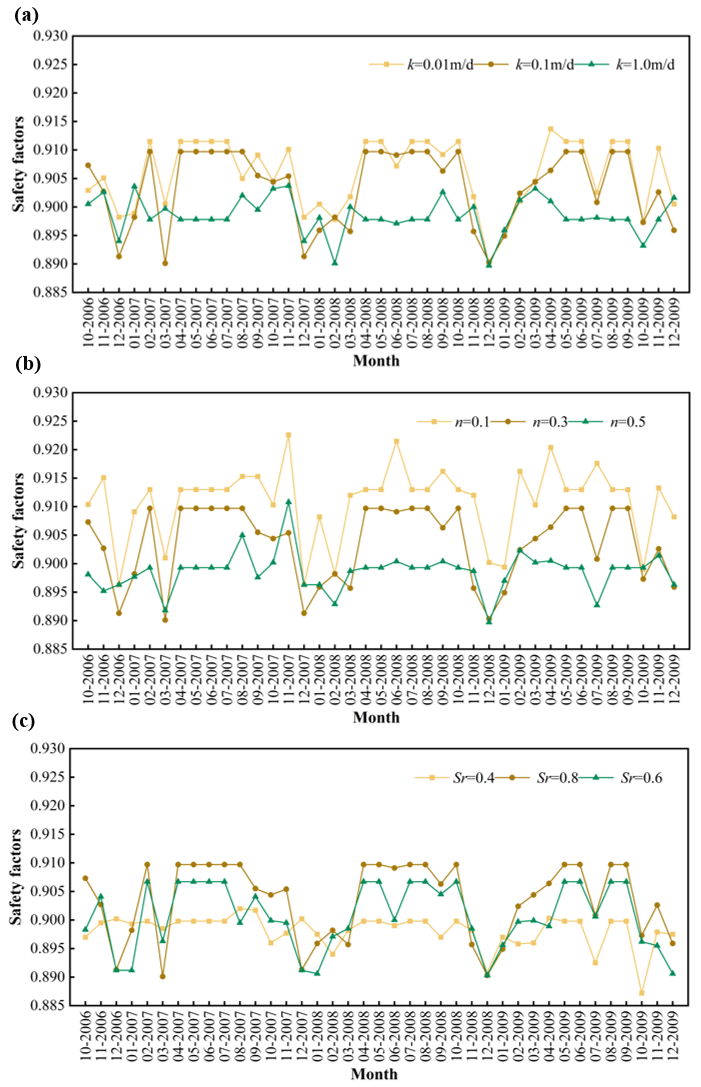
Figure 16Safety factors of the Woshaxi landslide under rainfall and horizontal earthquake (kh=0.05). (a) Permeability coefficient. (b) Porosity. (c) Saturation.
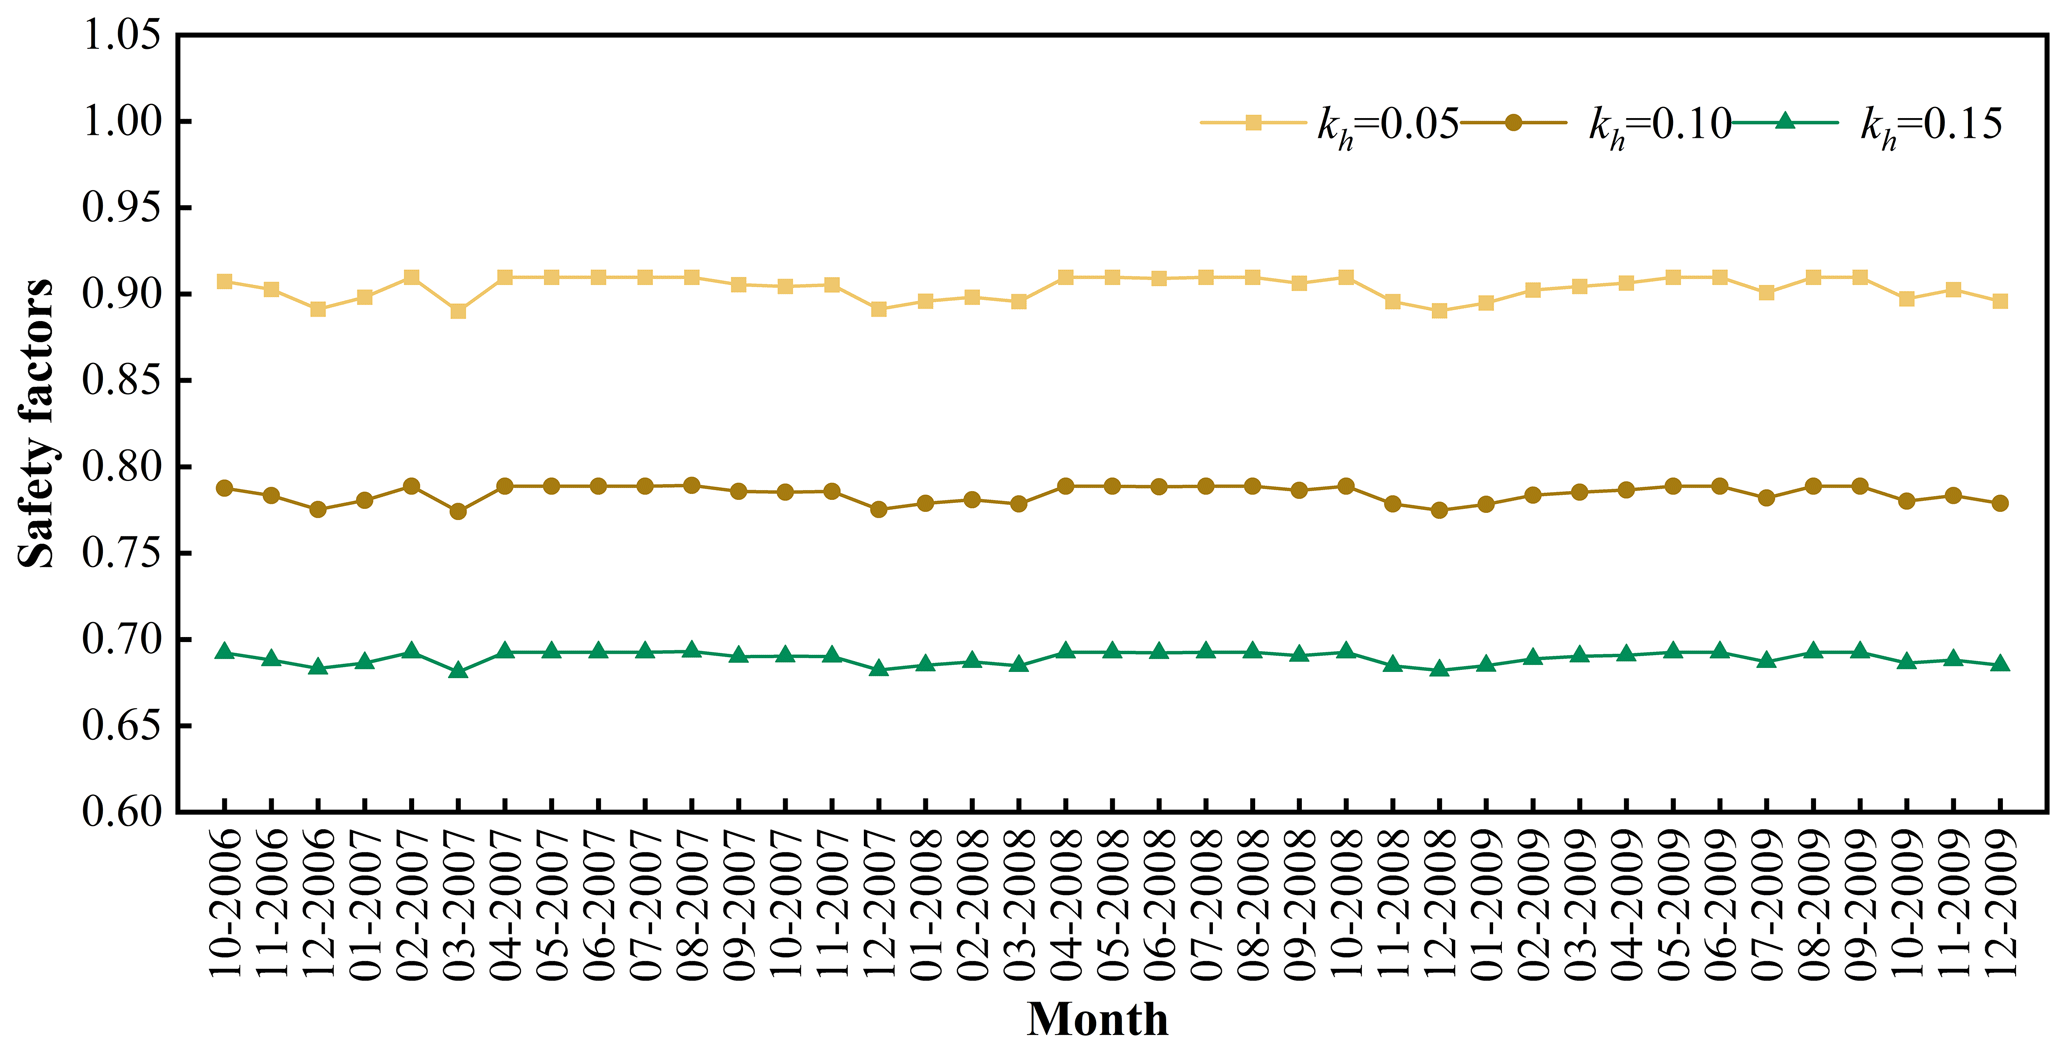
Figure 17Safety factors of the Woshaxi landslide under rainfall and horizontal earthquake (different horizontal seismic coefficient).
(ii) Rainfall and horizontal earthquake
Figure 16 shows the evolution of the stability of the Woshaxi landslide under the combined effect of rainfall and horizontal earthquake with different geotechnical parameters, and the horizontal earthquake coefficient kh is taken as 0.05. Comparing with Fig. 15, it can be observed that after considering the effect of horizontal earthquake, the variation trend of the safety factor of the Woshaxi landslide calculated with different geotechnical parameters is consistent with that under the rainfall condition only, but the stability of the landslide is obviously decreased. Figure 17 shows the evolution of the stability of the Woshaxi landslide with rainfall and different horizontal earthquake coefficients. With other parameters unchanged, the values of the horizontal earthquake coefficients are 0.05, 0.1, and 0.15, respectively. In this research, we employed three different horizontal earthquake coefficients: 0.05, 0.1, and 0.15. The coefficient of 0.05 is based on the seismic zoning map of China, corresponding to the seismic characteristics and expected level of seismic activity in the study area. As for the other two coefficients, 0.1 and 0.15, they are not directly associated with any specific earthquake magnitude or return period. These values were set based on engineering requirements and safety considerations, aiming to assess the variation in slope stability under stronger seismic actions. This approach allows us to understand the response of the slope under different seismic intensities and provides a safety margin for seismic activities that may exceed expectations. Our study has revealed that within the specific context of the examined landslide, as the horizontal earthquake coefficient increases, there is a notable decrease in the safety factor. It is also observed that in this particular case, the impact of seismic activity on slope stability appears to be considerably more pronounced than that of rainfall. However, these findings are derived from a singular case study, focusing on a specific landslide morphology and set of soil properties. Consequently, they may not necessarily be universally applicable across different landslide types and varying geological conditions.
(iii) Rainfall and vertical earthquake
Figure 18 shows the evolution of the stability of the Woshaxi landslide with rainfall and different vertical earthquake coefficients. With other parameters unchanged, the vertical earthquake coefficient kv takes on values of 0.025, 0, and −0.025, respectively, and the negative sign indicates that the direction of vertical earthquake is vertically downward. It is obvious from Fig. 18 that the corresponding safety factor when the earthquake acts vertically downward is smaller than the corresponding safety factor when it is vertically upward.
Figure 19Safety factors of the Woshaxi landslide under rainfall and earthquake (in both horizontal and vertical directions).
(iv) Rainfall and earthquake in both horizontal and vertical directions
Figure 19 shows the evolution of the stability of the Woshaxi landslide with rainfall and different earthquake coefficients. Horizontal earthquake coefficient kh is taken as 0.05, and the values of vertical earthquake coefficient are 0.025, 0, and −0.025, respectively, and the negative sign indicates that the direction of vertical earthquake action is vertically downward. Under the condition that other parameters remain unchanged, the slope stability is lower when considering both horizontal and vertical upward earthquake compared to considering only horizontal earthquake. Therefore, it is essential to properly account for the effect of vertical earthquake in order to ensure maximum safety.
In this paper, the calculation of the seepage force is studied; the normal stress expression on the sliding surface of a slope under seepage force and seismic force are also derived. Furthermore, a global analysis method that considers both seepage and seismic forces is proposed to determine the safety factor of slopes subjected to the combined effect of rainfall and earthquake. The reliability of the proposed method is also verified with two examples combining software calculations and previous results.
Taking a slope in the Three Gorges Reservoir area as an example, this study investigates the influence of soil permeability coefficient, porosity, and saturation on slope stability and analyzes the safety evolution of this slope under combined effects of rainfall and earthquakes. The results indicate that, under rainfall conditions, the porosity of the soil above the phreatic surface exerts a greater influence on safety factor than permeability coefficient and saturation. With an increase in the horizontal earthquake coefficient, the safety factor of the landslide is significantly reduced, and the impact of earthquake on slope stability surpasses that of rainfall. The safety factor corresponding to vertical downward earthquake action is smaller than that of vertical upward, and the stability of slope is lower when considering horizontal and vertical upward earthquake actions. Therefore, in order to ensure maximum safety, proper consideration should be given to vertical earthquake actions.
When considering rainfall alone, the slope safety factor is 1.04–1.09, positioning the slope in a state that between unstable and basically stable. However, upon accounting for horizontal seismic activity, the slope safety factor decreases to about 0.9 and is transformed into an unstable state. When the vertical earthquake is considered, the slope safety factor is 1.035–1.075. This represents a slight reduction but still in the unstable and basically stable state. This suggests that horizontal seismic influences exert a more pronounced impact on slope stability compared to vertical. When rainfall and earthquake act simultaneously, the safety factor calculated using the proposed method falls below 1.0, indicating an unstable condition where landslide disasters are likely to occur on the slope. The research results provide a scientific basis for slope stability analysis and prevention. Further, the proposed method can identify potential risk areas for landslide hazards, and planners in the Three Gorges Reservoir area can better consider these risks and take measures to increase the seismic and flood resilience of reservoir infrastructure.
The data used in this study are available from the first author upon request.
JW analyzed the data, conceived the paper, and wrote the paper; ZW conceived and co-wrote the paper; HL reviewed and improved the analysis and paper; and GS provided the data of the actual slope in the Three Gorges Reservoir.
The contact author has declared that none of the authors has any competing interests.
Publisher's note: Copernicus Publications remains neutral with regard to jurisdictional claims made in the text, published maps, institutional affiliations, or any other geographical representation in this paper. While Copernicus Publications makes every effort to include appropriate place names, the final responsibility lies with the authors.
This research has been supported by the National Natural Science Foundation of China (grant no. 11972043).
This paper was edited by Rachid Omira and reviewed by three anonymous referees.
Ali, A., Lyamin, A. V., Huang, J., Li, J. H., Cassidy, M. J., and Sloan, S. W.: Probabilistic stability assessment using adaptive limit analysis and random fields, Acta Geotech., 12, 937–948, https://doi.org/10.1007/s11440-016-0505-1, 2017.
Bishop, A. W.: The use of the Slip Circle in the Stability Analysis of Slopes, Géotechnique, 5, 7–17, https://doi.org/10.1680/geot.1955.5.1.7, 1955.
Cao, L., Zhang, J., Wang, Z., Liu, F., Liu, Y., and Zhou, Y.: Dynamic response and dynamic failure mode of the slope subjected to earthquake and rainfall, Landslides, 16, 1467–1482, https://doi.org/10.1007/s10346-019-01179-7, 2019.
Chang, K.-T., Lin, M.-L., Dong, J.-J., and Chien, C.-H.: The Hungtsaiping landslides: from ancient to recent, Landslides, 9, 205–214, https://doi.org/10.1007/s10346-011-0293-5, 2012.
Chen, Z., Hongliang, M. I., and Xiaogang, W.: A three-dimensional limit equilibrium method for slope stability analysis, Chin. J. Geotech. Eng., 23, 525–529, 2001.
Cheng, Y. M. and Yip, C. J.: Three-Dimensional Asymmetrical Slope Stability Analysis Extension of Bishop's, Janbu's, and Morgenstern–Price's Techniques, J. Geotech. Geoenviron., 133, 1544–1555, https://doi.org/10.1061/(ASCE)1090-0241(2007)133:12(1544), 2007.
Chopra, A. K.: The importance of the vertical component of earthquake motions, B. Seismol. Soc. Am., 56, 1163–1175, 1966.
Conte, E., Donato, A., and Troncone, A.: A simplified method for predicting rainfall-induced mobility of active landslides, Landslides, 14, 35–45, https://doi.org/10.1007/s10346-016-0692-8, 2017.
David, K. K.: Statistical analysis of an earthquake-induced landslide distribution—the 1989 Loma Prieta, California event, Eng. Geol., 58, 231–249, 2000.
Farzaneh, O., Askari, F., and Ganjian, N.: Three-Dimensional Stability Analysis of Convex Slopes in Plan View, J. Geotech. Geoenviron., 134, 1192–1200, https://doi.org/10.1061/(ASCE)1090-0241(2008)134:8(1192), 2008.
Griffiths, D. V. and Lane, P. A.: Slope stability analysis by finite elements, Géotechnique, 49, 387–403, https://doi.org/10.1680/geot.1999.49.3.387, 1999.
Guo, M., Ge, X., Wang, S., and Wang, H.: Dynamic stability analysis of slope based on vector sum analysis method, Chinese Journal of Rock Mechanics and Engineering, 30, 572–579, 2011.
Hoek, E. and Bray, J. D.: Rock Slope Engineering, The Institute of Mining and Metallurgy, London, 1977.
Huang, C.-C. and Tsai, C.-C.: New Method for 3D and Asymmetrical Slope Stability Analysis, J. Geotech. Geoenviron., 126, 917–927, https://doi.org/10.1061/(ASCE)1090-0241(2000)126:10(917), 2000.
Hungr, O.: An extension of Bishop's simplified method of slope stability analysis to three dimensions, Géotechnique, 37, 113–117, https://doi.org/10.1680/geot.1987.37.1.113, 1987.
Ishii, Y., Ota, K., Kuraoka, S., and Tsunaki, R.: Evaluation of slope stability by finite element method using observed displacement of landslide, Landslides, 9, 335–348, https://doi.org/10.1007/s10346-011-0303-7, 2012.
Iverson, R. M.: Landslide triggering by rain infiltration, Water Resour. Res., 36, 1897–1910, https://doi.org/10.1029/2000WR900090, 2000.
Jibson, R. W. and Harp, E. L.: Ground motions at the outermost limits of seismically triggered landslides, B. Seismol. Soc. Am., 106, 708–719, 2016.
Lew, M.: Characteristics of Vertical Ground Motions Recorded During the Lorna Prieta Earthquake, in: International Conferences on Recent Advances in Geotechnical Earthquake Engineering and Soil Dynamics, 10 March 1991, St. Louis, Missouri, https://scholarsmine.mst.edu/icrageesd/02icrageesd/session13/2 (last access: 14 May 2024), 1991.
Lim, K., Li, A. J., Schmid, A., and Lyamin, A. V.: Slope-Stability Assessments Using Finite-Element Limit-Analysis Methods, Int. J. Geomech., 17, 06016017, https://doi.org/10.1061/(ASCE)GM.1943-5622.0000715, 2017.
Ling, H. I., Mohri, Y., and Kawabata, T.: Seismic analysis of sliding wedge: extended Francais–Culmann's analysis, Soil Dyn. Earthq. Eng., 18, 387–393, 1999.
Liu, L. P., Lei, Z. Y., and Zhou, F. C.: The evaluation of seismic slope stability analysis methods, Journal of Chongqing Jiaotong University, 20, 83–88, 2001.
Marc, O., Meunier, P., and Hovius, N.: Prediction of the area affected by earthquake-induced landsliding based on seismological parameters, Nat. Hazards Earth Syst. Sci., 17, 1159–1175, https://doi.org/10.5194/nhess-17-1159-2017, 2017.
Michalowski, R. L.: Slope stability analysis: a kinematical approach, Géotechnique, 45, 283–293, https://doi.org/10.1680/geot.1995.45.2.283, 1995.
Morgenstern, N. R. and Price, V. E.: The Analysis of the Stability of General Slip Surfaces, Géotechnique, 15, 79–93, https://doi.org/10.1680/geot.1965.15.1.79, 1965.
Qin, C.-B. and Chian, S. C.: Kinematic analysis of seismic slope stability with a discretisation technique and pseudo-dynamic approach: a new perspective, Géotechnique, 68, 492–503, https://doi.org/10.1680/jgeot.16.P.200, 2018.
Rahardjo, H., Nio, A. S., Leong, E. C., and Song, N. Y.: Effects of Groundwater Table Position and Soil Properties on Stability of Slope during Rainfall, J. Geotech. Geoenviron., 136, 1555–1564, https://doi.org/10.1061/(ASCE)GT.1943-5606.0000385, 2010.
Salinas-Jasso, J. A., Ramos-Zuñiga, L. G., and Montalvo-Arrieta, J. C.: Regional landslide hazard assessment from seismically induced displacements in Monterrey Metropolitan area, Northeastern Mexico, B. Eng. Geol. Environ., 78, 1127–1141, https://doi.org/10.1007/s10064-017-1087-3, 2019.
Sassa, K., Nagai, O., Solidum, R., Yamazaki, Y., and Ohta, H.: An integrated model simulating the initiation and motion of earthquake and rain induced rapid landslides and its application to the 2006 Leyte landslide, Landslides, 7, 219–236, https://doi.org/10.1007/s10346-010-0230-z, 2010.
Sepúlveda, S. A., Murphy, W., Jibson, R. W., and Petley, D. N.: Seismically induced rock slope failures resulting from topographic amplification of strong ground motions: The case of Pacoima Canyon, California, Eng. Geol., 80, 336–348, 2005.
Shukha, R. and Baker, R.: Design implications of the vertical pseudo-static coefficient in slope analysis, Comput. Geotech., 35, 86–96, 2008.
Spencer, E.: A Method of analysis of the Stability of Embankments Assuming Parallel Inter-Slice Forces, Géotechnique, 17, 11–26, https://doi.org/10.1680/geot.1967.17.1.11, 1967.
Sun, G., Cheng, S., Jiang, W., and Zheng, H.: A global procedure for stability analysis of slopes based on the Morgenstern–Price assumption and its applications, Comput. Geotech., 80, 97–106, 2016a.
Sun, G., Zheng, H., Huang, Y., and Li, C.: Parameter inversion and deformation mechanism of Sanmendong landslide in the Three Gorges Reservoir region under the combined effect of reservoir water level fluctuation and rainfall, Eng. Geol., 205, 133–145, 2016b.
Sun, G., Yang, Y., Jiang, W., and Zheng, H.: Effects of an increase in reservoir drawdown rate on bank slope stability: a case study at the Three Gorges Reservoir, China, Eng. Geol., 221, 61–69, 2017.
Wang, H.-L. and Xu, W.-Y.: 3D dynamical response analysis of high rock slope related to hydropower project in high intensive seismic region, Yanshilixue Yu Gongcheng Xuebao/Chinese Journal of Rock Mechanics and Engineering, 24, 5890–5895, 2005.
Yin, K.-L., Liu, Y.-L., Wang, Y., and Jiang, Z.-B.: Physical model experiments of landslide-induced surge in Three Gorges Reservoir, Earth Sci.-J. China Univers. Geosci., 37, 1067–1074, 2012.
Zhang, X.: Three-Dimensional Stability Analysis of Concave Slopes in Plan View, J. Geotech. Eng.-ASCE, 114, 658–671, https://doi.org/10.1061/(ASCE)0733-9410(1988)114:6(658), 1988.
Zheng, H.: A rigorous three-dimensional limit equilibrium method, Chinese Journal of Rock Mechanics and Engineering, 26, 1529–1537, 2007.
Zheng, H.: Eigenvalue Problem from the Stability Analysis of Slopes, J. Geotech. Geoenviron., 135, 647–656, https://doi.org/10.1061/(ASCE)GT.1943-5606.0000071, 2009.
Zheng, Y., Shi, W. M., and Kong, W. X.: Calculation of seepage forces and phreatic surface under drawdown conditions, Chinese Journal of Rock Mechanics and Engineering, 23, 3203–3210, 2004.
Zhou, J. and Qin, C.: Stability analysis of unsaturated soil slopes under reservoir drawdown and rainfall conditions: Steady and transient state analysis, Comput. Geotech., 142, 104541, https://doi.org/10.1016/j.compgeo.2021.104541, 2022.
Zhou, J., Chen, Q., and Wang, J.: Rigid block based lower bound limit analysis method for stability analysis of fractured rock mass considering rock bridge effects, Comput. Geotech., 86, 173–180, https://doi.org/10.1016/j.compgeo.2017.01.016, 2017.
- Abstract
- Introduction
- Rise of phreatic surface and calculation of seepage force with rainfall infiltration in the soil column
- A global analysis method for slope stability under seepage and earthquakes
- Verification examples
- A true 3D slope
- Conclusions
- Data availability
- Author contributions
- Competing interests
- Disclaimer
- Financial support
- Review statement
- References