the Creative Commons Attribution 4.0 License.
the Creative Commons Attribution 4.0 License.
 | 30 Apr 2024
A satellite view of the exceptionally warm summer of 2022 over Europe
João P. A. Martins
Sara Caetano
Carlos Pereira
Emanuel Dutra
Rita M. Cardoso
Summer heatwaves are becoming increasingly dangerous over Europe, and their close monitoring is essential for human activities. Typically, they are monitored using the 2 m temperature from meteorological weather stations or reanalysis datasets. In this study, the 2022 extremely warm summer over Europe is analysed using satellite land surface temperature (LST), specifically the LSA SAF (Land Surface Analysis Satellite Application Facility) all-sky LST product (available from 2004 onwards). Since climate applications of LST are still poorly explored, heatwave diagnostics derived from satellite observations are compared with those derived using ERA5/ERA5-Land reanalysis data. Results highlight the exceptionality of 2022 in different metrics such as the mean LST anomaly, area under extreme heat conditions, number of hot days and heatwave magnitude index. In all metrics, 2022 ranked first when compared with the remaining years. Compared to 2018 (next in all rankings), 2022 exceeded its LST anomaly by 0.7 °C and each pixel had on average 7 more hot days. Satellite LST complements reanalysis diagnostics, as higher LST anomalies occur over areas under severe drought, indicating a higher control and amplification of the heatwave by surface processes and vegetation stress. These cross-cutting diagnostics increase the confidence across satellite data records and reanalyses, fostering their usage in climate applications.
- Article
(22030 KB) - Full-text XML
- BibTeX
- EndNote


In the last couple of decades, long and extremely hot summers have become more frequent over Europe (Hoy et al., 2020), with increased heatwaves risk (Morlot et al., 2023). Recently, Rousi et al. (2022) reported that their frequency is increasing 3 to 4 times faster than in other midlatitude regions. Future climate projections have consistently indicated the increase in both mean and extreme temperatures, with extreme heat conditions becoming more likely when more severe greenhouse gas emission scenarios are considered (Christidis et al., 2015; Lhotka et al., 2018; Amengual et al., 2014; Zhang et al., 2020; Seneviratne et al., 2021; Hundhausen et al., 2023). Although the increased radiative forcing due to increasing greenhouse gas concentrations in the atmosphere is the root cause of the general shift in global temperature distributions, its spatial patterns are not homogeneous. Over Europe, warm extremes have been linked to the presence of stationary anticyclonic systems and to atmospheric blocking events (Schaller et al., 2018; Bieli et al., 2015; Brunner et al., 2018; Garcia-Herrera et al., 2010; Chan et al., 2022). The increasing frequency of this blocking pattern has been linked to the increasing persistence of double jet stream structures, particularly because the region between the sub-tropical and polar-front jets (i.e. latitudes between 45 and 65° N) is characterized by negative wind anomalies and positive surface temperature anomalies (Rousi et al., 2022; Kornhuber et al., 2017). Furthermore, the atmospheric circulation induced by these synoptic configurations favours the advection of warm Saharan air masses into Europe, which often compromise air quality over the affected regions due to their high dust aerosol loads (Sousa et al., 2019; Miralles et al., 2014; Díaz et al., 2017).
On top of these dynamic aspects, heatwave intensities over Europe are strongly modulated by thermodynamic effects involved in land surface–atmosphere interactions (Sousa et al., 2020; Suarez-Gutierrez et al., 2020; Miralles et al., 2019, 2014). The abovementioned typical synoptic situations favour subsidence heating, reduced cloudiness and therefore increased net surface radiation. The excess surface energy is released as surface (longwave) radiative and turbulent fluxes, both over land and over ocean, particularly over the Mediterranean (Suarez-Gutierrez et al., 2020; Juza et al., 2022). Soil moisture availability controls the partitioning of surface turbulent fluxes, since in the case of water scarcity, all the excess energy at the surface is re-emitted mostly as longwave radiative flux and sensible heat flux, both acting to increase near-surface temperatures. Compound events of drought and extreme heat conditions are among the riskiest climate-related events for Europe, especially considering their effects on mortality, crop and forest productivity, and wildfire risk (Zscheischler et al., 2018, 2020; Manning et al., 2018). The mechanisms involved in feedbacks between these processes are still under debate, not only due to the remaining uncertainties within the theoretical framework but also due to the lack of suitable observations to support it (Miralles et al., 2014, 2019; Seneviratne et al., 2021; Barriopedro et al., 2023). This means that there is a significant spread in the heatwave metrics that are provided by different global and regional models, even at higher spatial resolutions (Petrovic et al., 2024; Lin et al., 2022; Furusho-Percot et al., 2022; Molina et al., 2020; Hundhausen et al., 2023).
According to the Copernicus Climate Change Service (C3S), the summer of 2022 over Europe was by far the warmest on record to date, with an excess of 0.4 °C with respect to 2021, the previous warmest year (https://climate.copernicus.eu/2022-saw-record-temperatures-europe-and-across-world, last access: 31 August 2023). The World Health Organization (WHO) revealed at least 15 000 deaths were due to the extreme heat conditions, particularly over Spain, Portugal, the United Kingdom and Germany (https://www.who.int/europe/news/item/07-11-2022-statement—climate-change-is-already-killing-us–but-strong-action-now-can-prevent-more-deaths, last access: 31 August 2023). The combined effects of drought and extreme heat also led to a wide range of economic impacts, namely an overall crop loss (particularly cereal) of 9 % with respect to the previous years' 5-year average production (FAO, 2022), causing a generalized increase in food and grocery prices.
Near-real-time (NRT) monitoring of these extreme heat events as well as of the wide range of their associated variables is therefore key to timely actions from stakeholders, namely those involved in civil protection and agricultural management. Furthermore, when mega drought and heatwave events happen, there is a sense of urgency by the public and the media, particularly concerning their connection and attribution to climate change (Schiermeier, 2018). While such diagnostics may take weeks to perform, remote sensing provides the means for a real-time overview of the magnitude of a given event, from minutes to just a few hours after the relevant measurements were acquired. Satellite agencies, particularly the European Organisation for the Exploitation of Meteorological Satellites (EUMETSAT), European Space Agency (ESA), Copernicus and the National Aeronautics and Space Administration (NASA), are making efforts to maintain stable, accurate and long-term data records of essential climate variables (ECVs; Bojinski et al., 2014), as well as access to digested information from those datasets. The EUMETSAT Land Surface Analysis Satellite Application Facility (LSA SAF; Trigo et al., 2011) provides a collection of data records related to the monitoring of land surface energy balance (including land surface temperature, LST) and vegetation indicators from 2004 onwards. Most products are based on measurements made by the Spinning Enhanced Visible and Infrared Imager (SEVIRI) on board the Meteosat Second Generation (MSG) series, and their production will be ensured in the next generation of geostationary meteorological satellites. Despite the relatively good temporal and spatial coverage of LST products over areas with significant heatwaves in the past decades (such as south-central Europe), Reiners et al. (2023) showed that these products have not been much used to study these phenomena. According to these authors, this is due to (1) the lack of long time series (i.e. longer than 30 years), (2) the absence of reliable all-sky LST datasets, (3) the lack of intercomparison between different LST time series and intercomparison among different climate indicators, and finally (4) the lack of validation over heterogeneous sites. However, the potential of the standard LSA SAF clear-sky LST dataset for monitoring heatwaves has already been highlighted by Gouveia et al. (2022), who derived heatwave diagnostics similar to those obtained using well-established products such as MODIS LST (Wan, 2014) or ERA5/ERA5-Land (Hersbach et al., 2020; Muñoz-Sabater et al., 2021), which have been more frequently used to study these phenomena (Zaitchik et al., 2006; Galanaki et al., 2022; Sutanto et al., 2020; Hundhausen et al., 2023; Morlot et al., 2023; Agathangelidis et al., 2022). Good et al. (2022) also demonstrated the usefulness of LST for climate monitoring and found good agreement between LST anomalies derived from the ESA Climate Change Initiative LST (Pérez-Planells et al., 2023) datasets and in situ 2 m temperature anomalies derived from ECA&D E-OBS (European Climate Assessment & Dataset observational dataset over Europe) (Cornes et al., 2018). Nevertheless, the association between LST and 2 m temperature anomalies under heatwave conditions is not always straightforward (Agathangelidis et al., 2022; Mildrexler et al., 2011), as they can differ substantially both in spatial and temporal extents, especially towards higher temperatures. An additional limitation on the analysis of LST daily time series based on polar-orbiting satellites (Agathangelidis et al., 2022; Good et al., 2022) is that measurements over a particular area are obtained at slightly different times of day and with different viewing and illumination geometries.
The goal of this article is to illustrate the exceptionality of summer 2022 in Europe, mainly using the datasets provided by the LSA SAF. Clouds have been identified as a caveat to the use of this kind of dataset for monitoring heat extremes, as they introduce spatial and temporal discontinuities (Reiners et al., 2023; Gouveia et al., 2022). In particular, these discontinuities hamper a correct count of the number of hot days (especially the number of consecutive hot days, which is relevant for the determination of heatwave conditions) or a correct assessment of the spatial extent of extreme heat conditions. In this work, the new all-sky LST product (Martins et al., 2019) is used instead. This product is based on thermal geostationary observations by SEVIRI, is available since 2004 and complements the information provided by the clear-sky LST product (Trigo et al., 2021), even over areas with significant cloud coverage. LSTs under cloudy conditions are estimated using a surface energy balance scheme (Barrios et al., 2024), which is used at the LSA SAF to estimate evapotranspiration and surface turbulent fluxes along with the cloudy-sky LST. The scheme uses radiation flux and vegetation products from the LSA SAF, H SAF (Support to Operational Hydrology and Water Management Satellite Application Facility) soil moisture and a few screen-level variables from ECMWF as the main inputs. Thus, it overcomes the main limitations of the standard LST products, especially of those that have been recently used for climate monitoring (Agathangelidis et al., 2022; Mildrexler et al., 2011; Gouveia et al., 2022). By using a product that fills in those gaps using a physically based algorithm (i.e. estimates a land surface temperature value taking into account the changes in radiative fluxes under clouds, as well as the vegetation state and soil moisture conditions), interpolations that are unphysical many times are avoided. Although clear-sky conditions are typically the norm for heatwave conditions, clouds are nonetheless frequent and ubiquitous. Comparisons of the derived information with corresponding information derived using ERA5 data are performed, not only to provide confidence to the obtained diagnostics but also to explore the physical differences between the 2 m temperature (which is the standard variable used in extreme heat monitoring studies) and skin surface temperature (which is what is observable by satellite). Furthermore, a cross-cutting analysis of temperature, vegetation and soil moisture anomaly patterns, all obtained using different measurement principles, is also useful for a robust assessment of their physical consistency, which, if demonstrated, improves users' trust in those datasets and further fosters their usage for climate applications.
The following section presents the data and methods followed by the results and the main conclusions of this study.
2.1 LSA SAF LST
LST corresponds to the radiative temperature of the surface “skin”, i.e. the ground or the surface of the canopy over vegetated areas (Hulley and Ghent, 2019; Li et al., 2013). The LSA SAF (Trigo et al., 2011) has been providing near-real-time (NRT) LST estimates over Europe, Africa and part of South America since 2004, based on infrared observations from the Spinning Enhanced Visible and Infrared Imager (SEVIRI) on board the four Meteosat Second Generation (MSG) satellites. This dataset has been extensively validated, using a set of ground stations covering a wide range of land surface conditions (Göttsche et al., 2016; Trigo et al., 2021), ensuring compliance of the product with its requirements in terms of accuracy, uncertainty and temporal stability. However, a major limitation of the product is the fact that it is not available in cloudy situations. With this in mind, a new all-sky LST product was developed and is now distributed in NRT (Martins et al., 2019), the MLST-ASv2 (MSG LST, all-sky product; available at https://datalsasaf.lsasvcs.ipma.pt/PRODUCTS/MSG/MLST-ASv2/, last access: 16 September 2023). The new product fills in the blanks in the clear-sky retrievals due to clouds by solving a surface energy balance model (Barrios et al., 2024) whose main inputs are satellite retrievals of longwave and shortwave downwelling radiative fluxes, as well as albedo and the leaf area index (LAI), all produced at the LSA SAF. Other inputs include soil moisture from the EUMETSAT H SAF and screen-level meteorological variables (including 2 m temperature, 2 m dew point temperature, 10 m wind and surface pressure) from the European Centre for Medium-Range Weather Forecasts (ECMWF). The model uses an iterative method to determine four unknowns: sensible heat flux, latent heat flux, skin temperature and friction velocity. This skin temperature is used to fill in the gaps in the clear-sky LST product, while the latent heat flux is distributed as a product per se. The results in the product validation report (Martins and Dutra, 2022) showed an overall accuracy (bias) of 0.0 K and a root mean squared difference of 2.9 K, when product time series are compared to measurements from 33 in situ stations over a range of land cover types and climate zones. The product is available every 30 min in NRT, with a 3 km spatial resolution at nadir (and about 4–5 km over Europe), and is then reprojected onto a 0.05° regular grid. It was reprocessed from 2004 onwards using the satellite data records available at the LSA SAF, meteorological variables from ERA5 reanalysis and a combination of soil moisture products from the H SAF.
In this study, the daily maximum LST (LSTMax) is derived from the 30 min data by taking the maximum over all time slots from 06:00 to 15:00 UTC, when at least half the data over that period are available. This way, chances of getting an unphysical maximum are reduced. The all-sky LST, despite being much more spatially complete than the corresponding clear-sky product, still has missing data. The product's ATBD (Algorithm Theoretical Basis Document) (Martins et al., 2018) mentions that the surface energy balance model used for cloudy scenes is not able to provide reliable data over inland waters, which are excluded from the analysis. There are a few situations where the model does not reach convergence after the upper limit of iterations, in which case the model also returns a missing value.
2.2 H SAF soil moisture
The H SAF produces, among other variables, several soil moisture datasets. However, a soil moisture data record that is fully compliant with the existing NRT products does not exist yet. Therefore, to reprocess the surface energy balance model back to 2004 and to analyse soil moisture anomalies in Sect. 2.4, a combination of two products was used.
- a.
The H141 data record (Fairbairn and de Rosnay, 2020) was used from 2004–2018 and complemented with the data record extension H142 for 2019–2020. The product is based on a land data assimilation system which assimilates scatterometer data (including ERS SCAT – European Remote Sensing satellite scatterometer – and Metop ASCAT-A/B – Meteorological Operational satellite Advanced Scatterometer) and screen-level variables (2 m temperature and relative humidity). The HTESSEL (revised land surface Hydrology Tiled ECMWF Scheme for Surface Exchanges over Land) land surface model is used to propagate soil moisture information through the soil down to the root zone.
- b.
Since H141/H142 was not available from 2021 onwards, the H26 product (Fairbairn and de Rosnay, 2021) was used. This product only assimilates scatterometer data from ASCAT (A/B/C) and uses a stand-alone surface analysis derived from the 9 km operational analysis. Although H141/H142 and H26 are not identical, a comparison during an overlap period (in 2020) showed that the differences over Europe were reduced (not shown).
Soil moisture products from the H SAF are available through their web portal (https://hsaf.meteoam.it/Products/ProductsList?type=soil_moisture, last access: 16 September 2023). In the case of the selected dataset, soil moisture is linearly rescaled between the wilting point (0) and field capacity (1), defining the soil wetness index (SWI). In this work, an SWI average of the first three layers (i.e. down to 1 m below the surface) from the daily data is used to compute monthly means, from which the 2004–2021 climatology and anomalies are derived.
2.3 LSA SAF vegetation products
Vegetation plays an important role in the exchange of energy between the soil and the atmosphere (Katul et al., 2012; Hoek van Dijke et al., 2020), by efficiently promoting the water exchange between the surface and the atmosphere. The LSA SAF provides several satellite-derived vegetation parameters. Here, the fraction of vegetation cover (FVC; García-Haro et al., 2019) obtained from MSG observations is used to study the vegetation state as a response to the high temperatures experienced in the summer of 2022. FVC is the horizontal fraction of soil covered by green vegetation, ranging from 0 to 1. It is available since 2004 as a daily product (in https://datalsasaf.lsasvcs.ipma.pt/PRODUCTS/MSG/MTFVC/, last access: 16 September 2023) and is also an indicator of drought conditions, exhibiting pronounced negative anomalies over areas under significant drought.
2.4 ERA5/ERA5-Land reanalyses
To provide a synoptic context for the summer 2022 conditions (see Sect. 3.1) the ECMWF ERA5 climate reanalysis (Hersbach et al., 2020) was analysed. ERA5 provides hourly data on several atmospheric, land surface and ocean parameters together with their respective uncertainties, on a 0.25° × 0.25° grid, and can be downloaded from the Copernicus Climate Change Climate Data Store (https://cds.climate.copernicus.eu/, last access: 16 September 2023). Variables used here include the 850 hPa temperature (T850), the 500 hPa geopotential height (Z500), wind speed (v) and precipitation (precip), for the period 1980–2022 (43 years).
ERA5-Land is a reanalysis that provides a more detailed description of the variables characterizing the continental surfaces, with a higher spatial resolution (0.1°), and is produced with atmospheric forcing from ERA5 (Muñoz-Sabater et al., 2021), relying on the ECMWF land surface model. It is therefore more accurate since surface fields such as orography or land cover are more detailed. The ERA5-Land variables used here are the 2 m temperature (T2m) and the skin temperature (SKT), which is comparable in terms of physical meaning to satellite LST. Although ERA5 is by far the most widely used dataset in heatwave studies, in this study T2m estimates from ERA5-Land are used, as this choice allows for focusing on the physical differences between T2m and SKT, without having to consider differences introduced by comparing different modelling systems and spatial resolutions. Both SKT and T2m are used to derive “reference” heatwave indicators, to which the ones derived by satellite are compared.
2.5 Heatwave definition and metrics
To derive monthly and seasonal anomalies, the reference “climate” is calculated by first estimating Tx monthly means for all months in the reference period of 2004–2021 and then taking the median of that monthly mean across the whole reference period. For JJA anomalies, the June, July and August means are averaged for each year and then the median over all years is calculated to obtain the reference climate for that case. When computing monthly means, it was ensured that at least 85 % of the days in each month were available. This prevents spurious values in the disc edge contaminating the monthly value.
Heatwaves are commonly characterized as a consecutive number of days when the temperature is excessively higher than normal (Sutanto et al., 2020; Xu et al., 2016; Meehl and Tebaldi, 2004). However, several authors use different definitions, which has a significant influence on the assessment of the impact of climate change on this phenomenon. In this study, heatwaves are defined as a period of 3 or more consecutive days with a daily maximum temperature (Tx) above the 90th percentile (P90) of the reference period of 2004–2021. These days where P90 is exceeded are hereafter referred to as hot days. The percentile is calculated for each day of the Julian calendar considering a 31 d window around the Julian day, for all years in the reference period, based on Russo et al. (2015). P90 and the multi-year medians used in this study were calculated relying on a bootstrapping technique as defined by Zhang et al. (2005). This technique consists of replacing the year for which the percentile is calculated with the next year in the time series, except for the last year, where a mean of the previous years' estimates is used. This kind of procedure avoids the possible effects of heterogeneity between the distributions of values in the reference period and the year where the percentile is evaluated.
To facilitate comparison across different periods and regions, the magnitude of a heatwave is estimated through a standardization of the daily maximum temperature Tx. The daily magnitude Md proposed by Russo et al. (2015) is used:
Here, Tx may be obtained using the LSA SAF LST or either SKT or T2m from ERA5. As in Cardoso et al. (2019), a slight difference from the standard index relies on the fact that the 25th and 75th percentiles (P25 and P75) are calculated considering all Tx values in the reference period, whereas in Russo et al. (2015) these were obtained from annual maxima time series. This means that there is one percentile value per pixel, which implies that the same temperature anomaly causes a larger daily magnitude Md over areas with less temperature variability within the reference period. In the case of P50 and P90, the annual variability is still represented to ensure that anomalies/exceedances are evaluated against their expected values for a given time of year.
Finally, also following Russo et al. (2015), an adapted version of the heatwave magnitude index (HWMI) is used, which is simply the sum of the daily magnitudes Md over a given period (e.g. a single heatwave, a month or a full year), for all the heatwave days in that period:
where d1 and d2 are the Julian days between which the sum is computed. By considering the duration and intensity of heatwaves, HWMI allows for the quantification of the magnitude of heatwaves in different periods and regions of the world (Russo et al., 2015). In this work, HWMI is always computed for the whole JJA period.
3.1 Synoptic context
Before the analysis of the satellite data characterizing the exceptional summer 2022 over Europe, the synoptic context is provided in this section for completeness. ERA5 data were used for this purpose. Figure 1 shows this synoptic context for the March–April–May period (meteorological spring, MAM, left panels) and for June–July–August (meteorological summer, JJA, right panels). The different panels illustrate the anomalies of temperature at 850 hPa (T850) and 500 hPa geopotential height (Z500), as well as normalized anomalies of accumulated precipitation (i.e. where the 1981–2022 seasonal mean was subtracted from the 2022 precipitation and then divided by the seasonal standard deviation of the whole period). As may be seen in Fig. 1a and c, there was an extended area of positive Z500 anomalies over the North Sea region, covering the British Isles, the Scandinavian Peninsula and central Europe. The Z500 anomalies in the centre of this system were above the 95th percentile of the distribution of the seasonal anomalies for this period (not shown). This blocking pattern, characterized by strong subsidence warming and relatively lower humidity, inhibited cloud formation and, consequently, induced large areas of negative anomalies of precipitation. Moreover, this pattern was associated with an anomalous easterly/northeasterly wind regime, bringing drier continental air into central Europe. Transient lows from the North Atlantic were deflected from these regions by anticyclonic blocking. Therefore, above-normal T850 values (Fig. 1a) and below-normal precipitation (Fig. 1c) were observed in northern and central Europe, with areas in southeastern France showing some of the warmest and driest anomalies in the whole reference period (highlighted as dotted areas). The JJA synoptic configuration (Fig. 1b) shows that the atmospheric blocking pattern over central Europe persisted and even aggravated across the summer, with the centroid of the anomaly located more towards central Europe (when compared to the MAM configuration). Once again, it is characterized by exceptionally high positive Z500 anomalies and associated with a prominent anomalous easterly wind towards central/western European countries, such as France, Germany and Italy. Persistent warm and dry advection of continental air masses from eastern Europe contributed to the exceptionally high T850 anomalies over France, Italy, and parts of Spain and Germany. A lack of precipitation was also observed over the Iberian Peninsula, Germany and the British Isles (Fig. 1d), with many areas where it was below the 10th percentile (shown as dotted areas). This configuration of higher-than-normal temperatures in spring and summer and overall lack of rainfall, especially during springtime, led to the intensification of the widespread drought event that started in early spring and lasted throughout the entire summer.
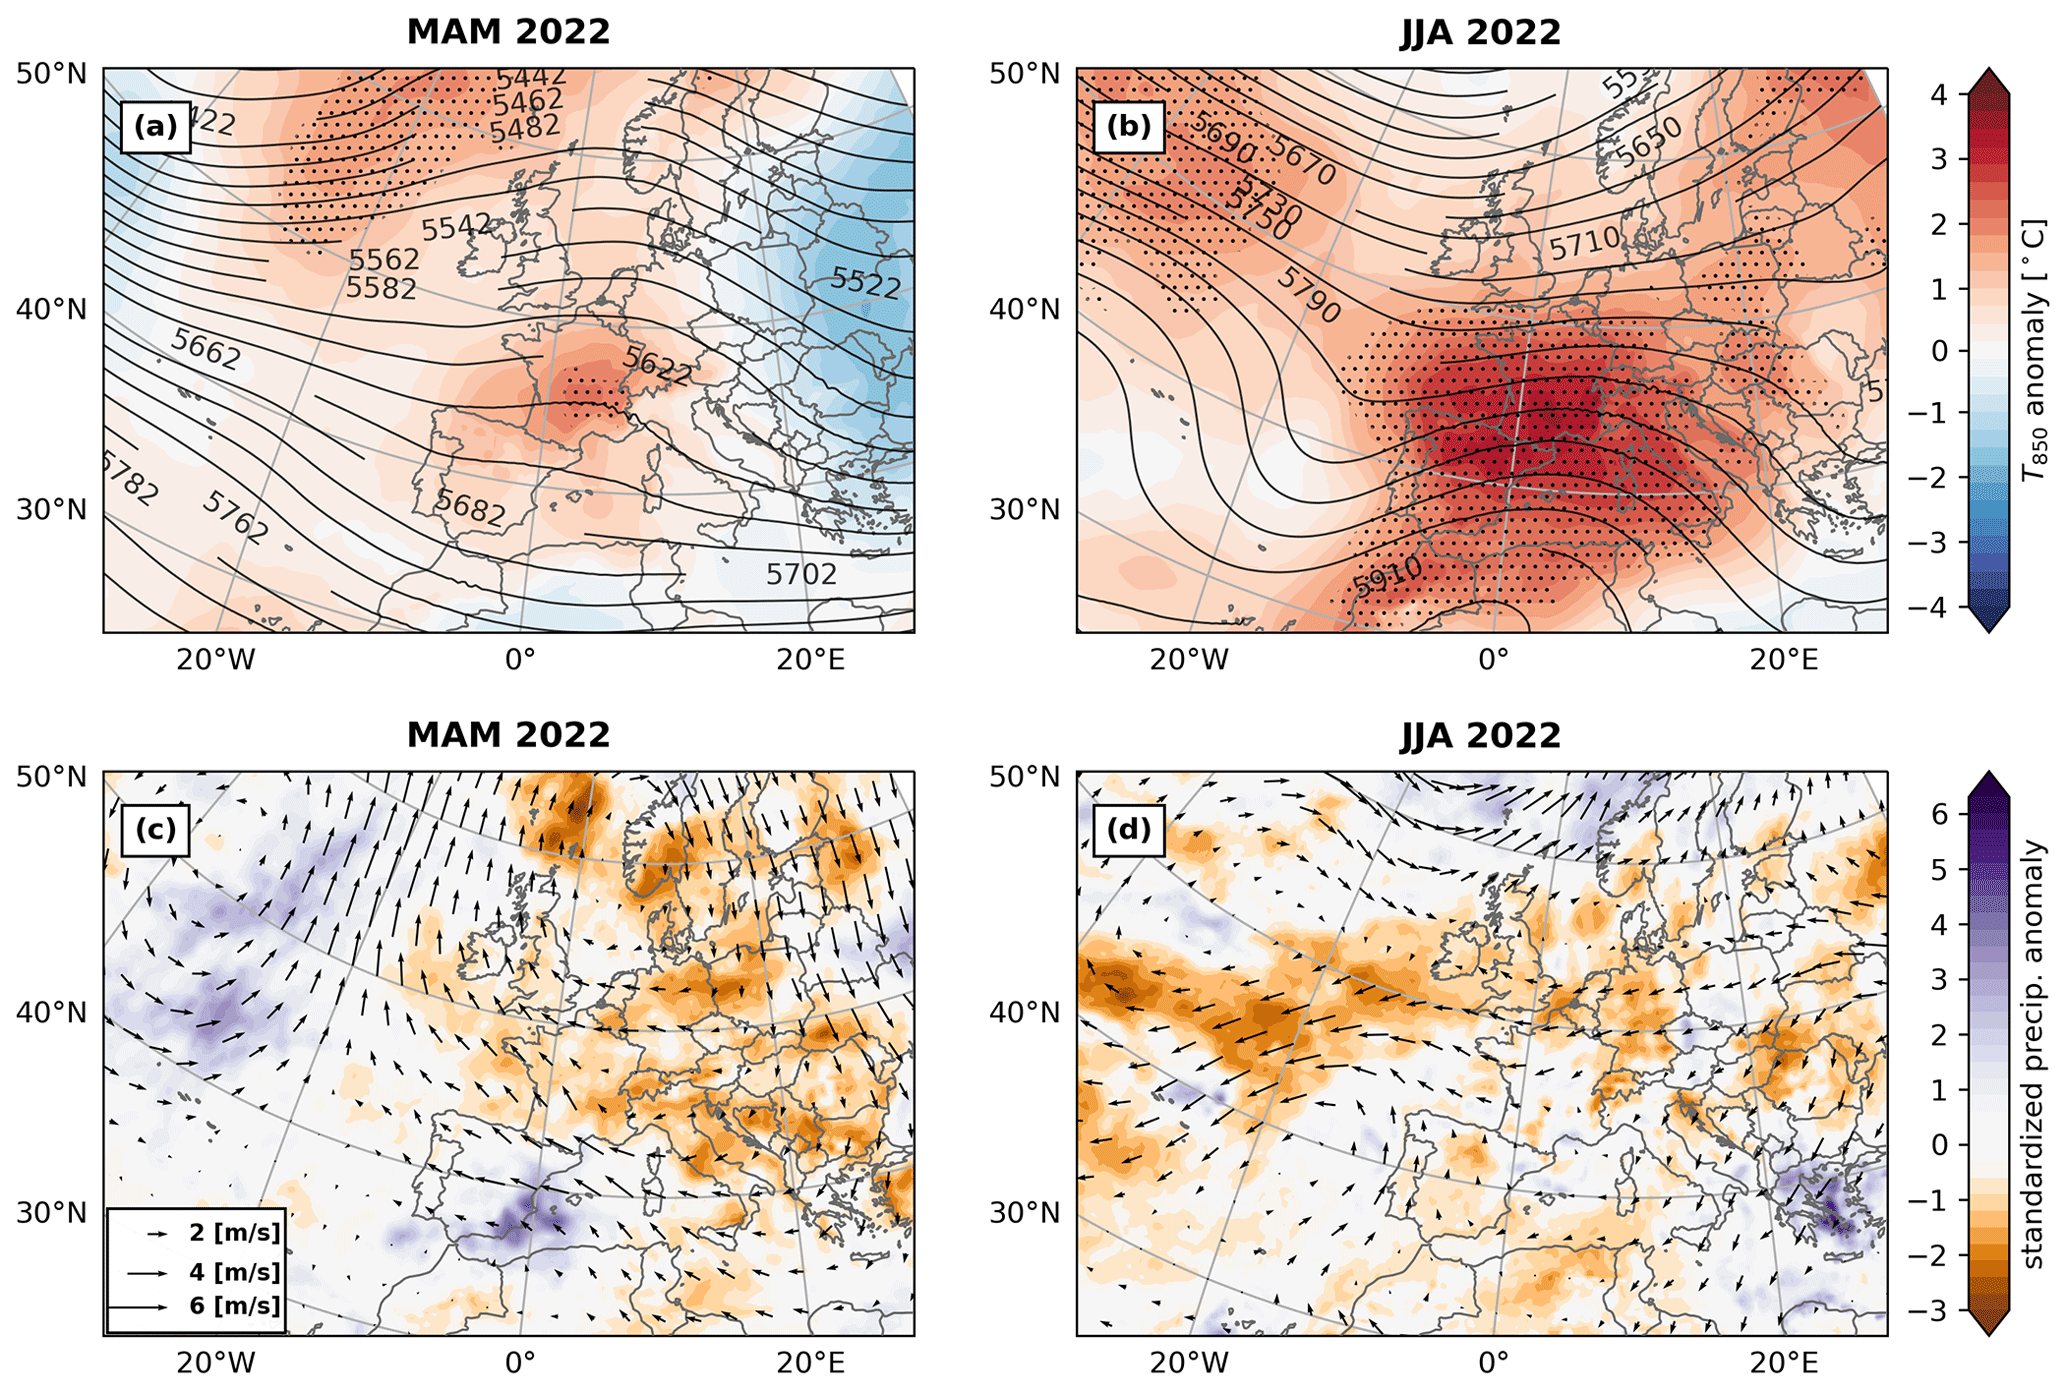
Figure 1Anomalies of the synoptic atmospheric configuration over Europe for two seasons in 2022, as given by ERA5: (a, c) MAM and (b, d) JJA. (a, c) T850 anomalies (in colour) and Z500 (black contours). Dotted areas denote areas where T850 was above its 95th percentile. (b, d) Normalized anomaly of accumulated precipitation (in colour) and v anomalies (black arrows). Dotted areas denote areas where the precipitation anomaly was below the 10th percentile. All anomalies were computed with respect to the 1981–2022 reference period. Arrows are spaced 2° × 2° for the sake of readability.
3.2 LST anomalies and comparison with ERA5
We start the analysis by focusing on the summer LST climatology and anomalies for the years 2018, 2019, 2021 and 2022 (Fig. 2). These were among the recent years with the largest JJA anomalies over Europe. The 2004–2021 climatology is represented in Fig. 2a and shows that higher LSTMax values are observed around the Mediterranean, except for coastal areas that are more prone to the occurrence of low clouds (such as western Iberia). Figure 2b, c, d and e show the JJA anomalies for 2018, 2019, 2021 and 2022, respectively. The 2022 LSTMax JJA anomaly was much stronger when compared to other years, both in terms of the anomaly magnitude and its spatial extent. Seasonal anomalies of 3–5 °C were observed over most of central Europe, in an area extending from northern Spain to the British Isles and to eastern Germany. Large areas of France exhibited seasonal anomalies of up to 7–8 °C. The area with the largest anomalies was over Hungary, where LSTs were 9.5 °C above normal. Over the considered domain, 2022 showed an area-averaged JJA anomaly of 2.2 °C (where the anomaly was weighted by the area of each pixel), while the remaining years with the highest area-averaged JJA anomalies in the data record show values of 1.1 °C (2018 and 2019) and 0.8 °C (2012).
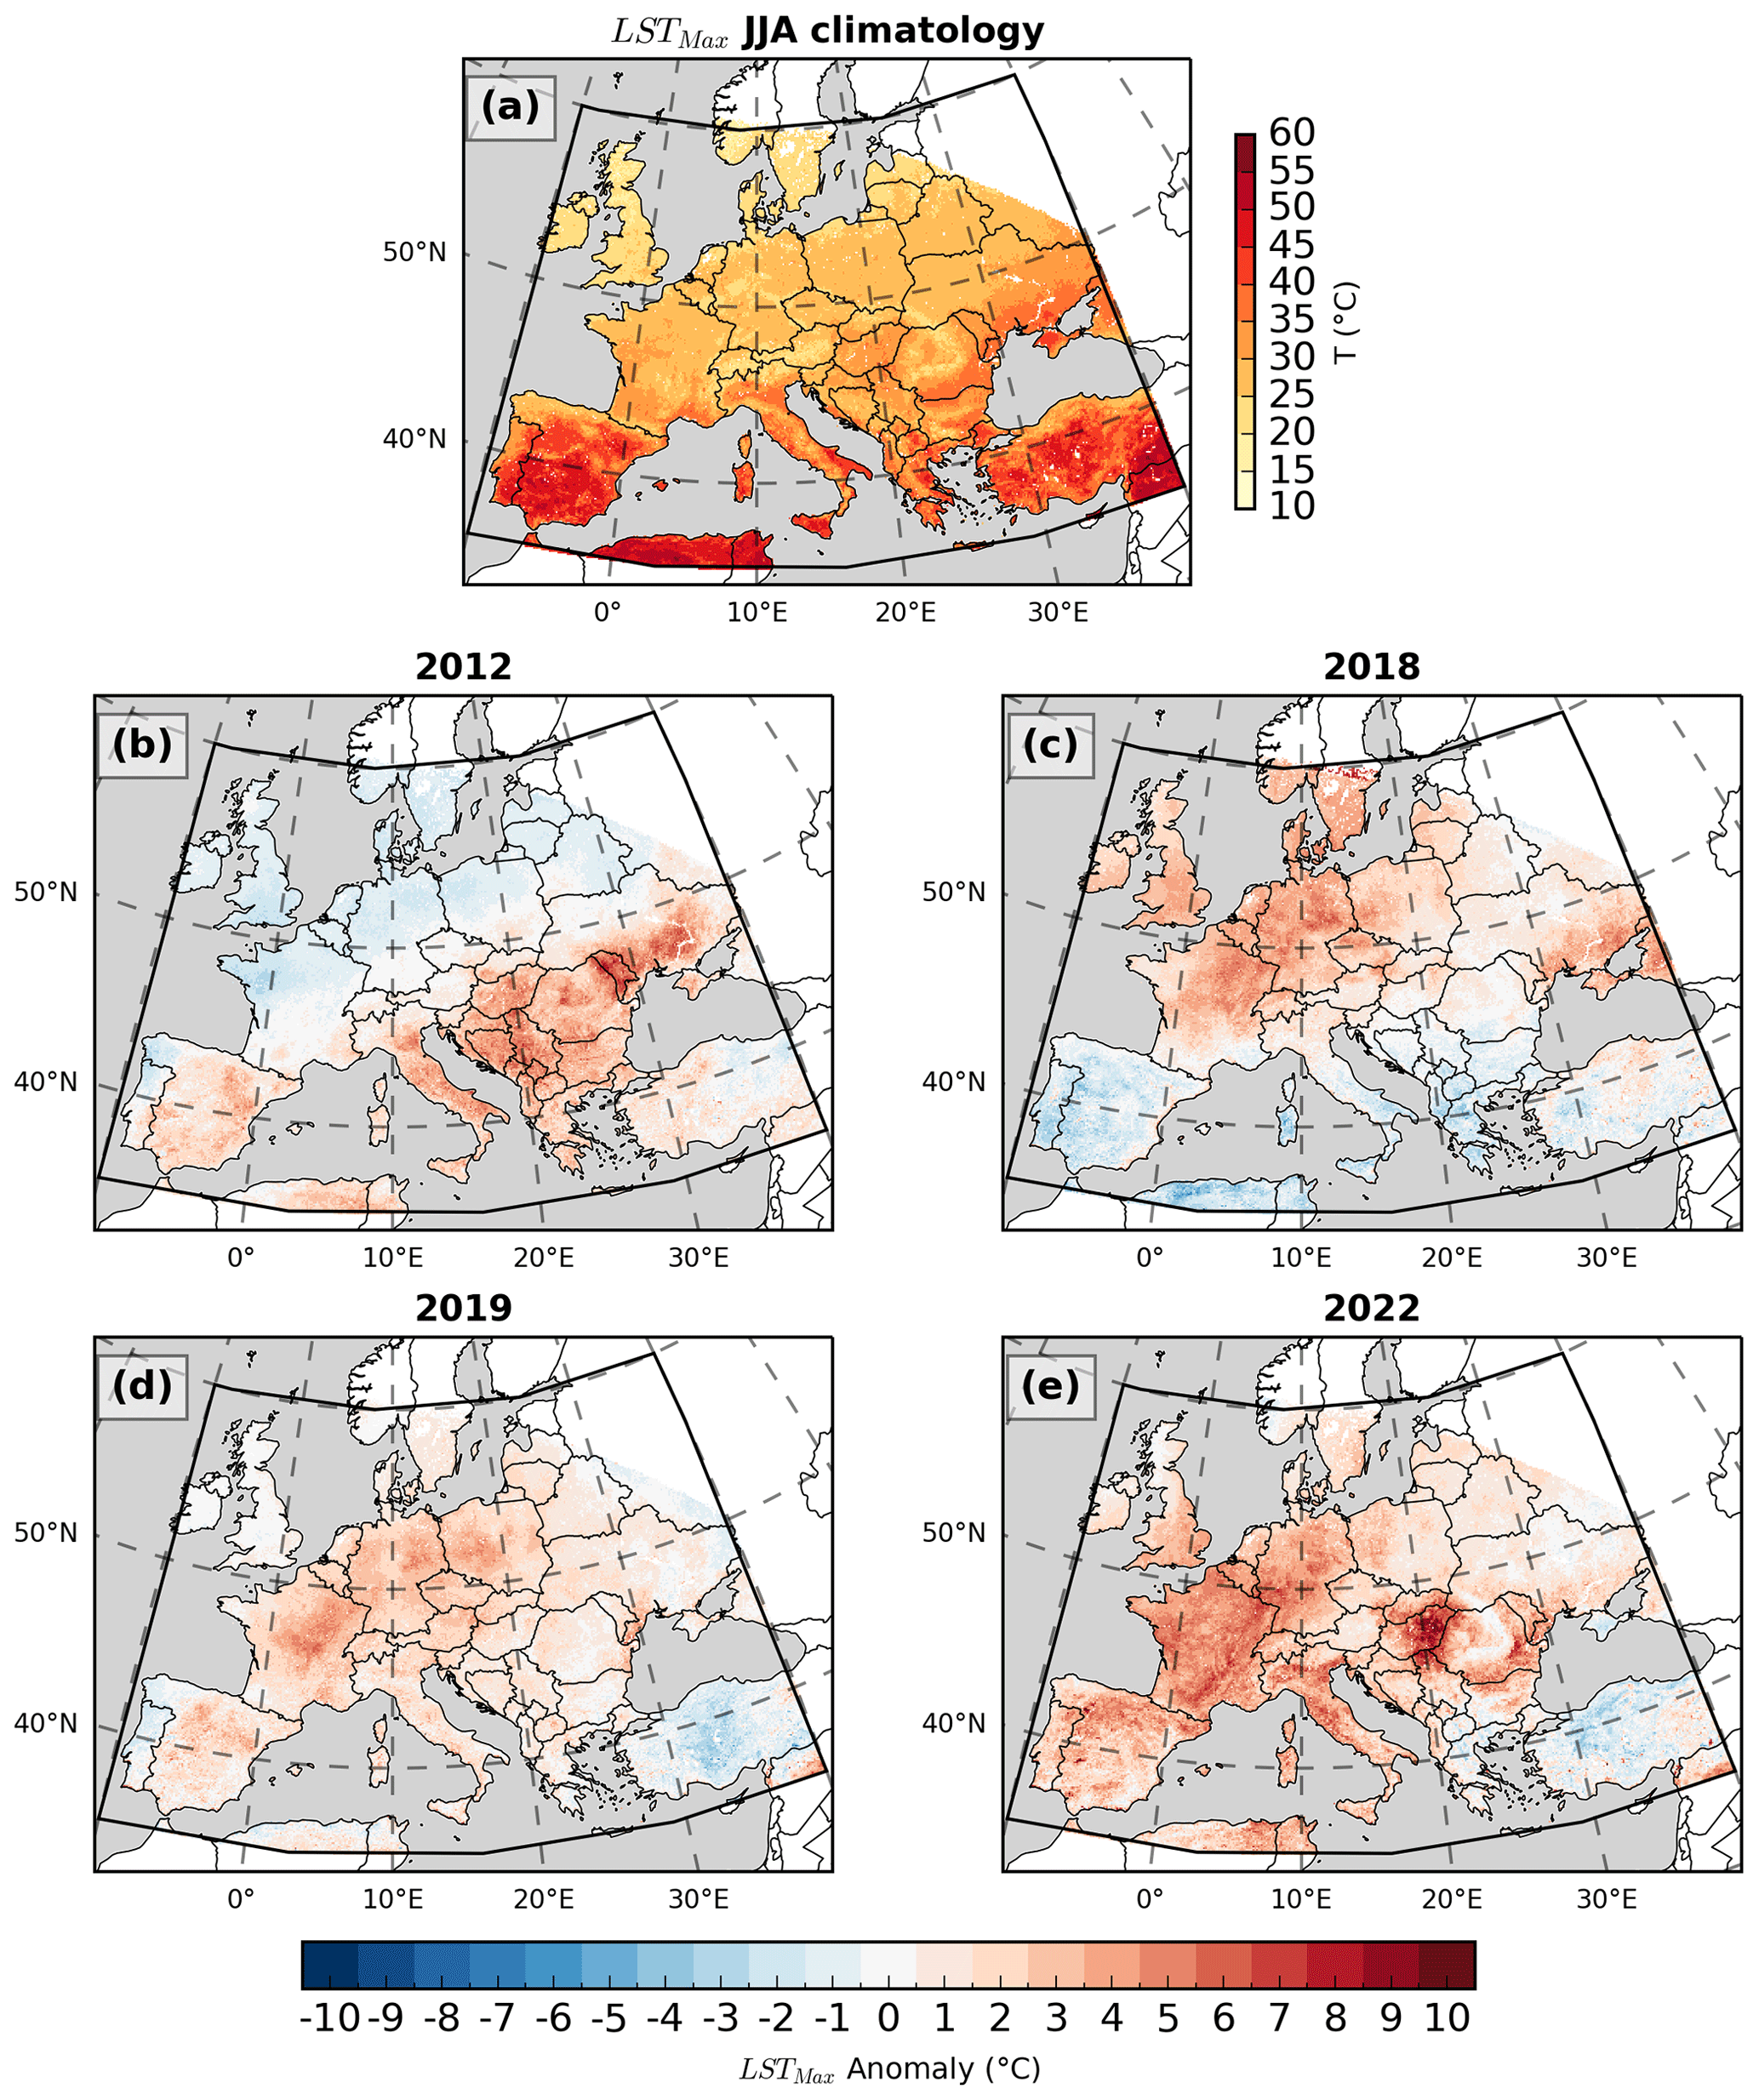
Figure 2(a) JJA median of LSTMax for the period 2004–2021. (b, c, d, e) Seasonal LSTMax anomalies for 2012, 2018, 2019 and 2022.
Figure 3 shows the evolution of monthly anomalies of the 3 summer months (JJA). In June, a general pattern of positive temperature anomalies is evident throughout Europe, with values ranging around 3–4 °C, and in Hungary, northern Spain and Italy there were anomalies of up to 8 °C. Northwestern Iberia, the British Isles and countries bordering the Aegean Sea exhibited slightly colder-than-normal temperatures. In July, the anomalies over Hungary and Romania suffered a very strong increase, with values around 7–10 °C, while in central/western Europe there were anomalies ranging between 3–6 °C. In northeastern Europe and Türkiye, the anomalies were negative, with temperatures about 1–3 °C lower than normal. In August, the anomaly was the most intense of the 3 summer months, with an average value of around 3 °C above the climatological reference. The areas most affected by anomalously warm conditions were central Europe and Hungary, with the monthly anomaly for these areas ranging from 8–10 °C. The pattern of positive anomalies extended into eastern Europe, where the monthly anomaly ranged around 2–5 °C. Southern Balkan countries and Ukraine were left out of the general pattern of very high-temperature anomalies in August.
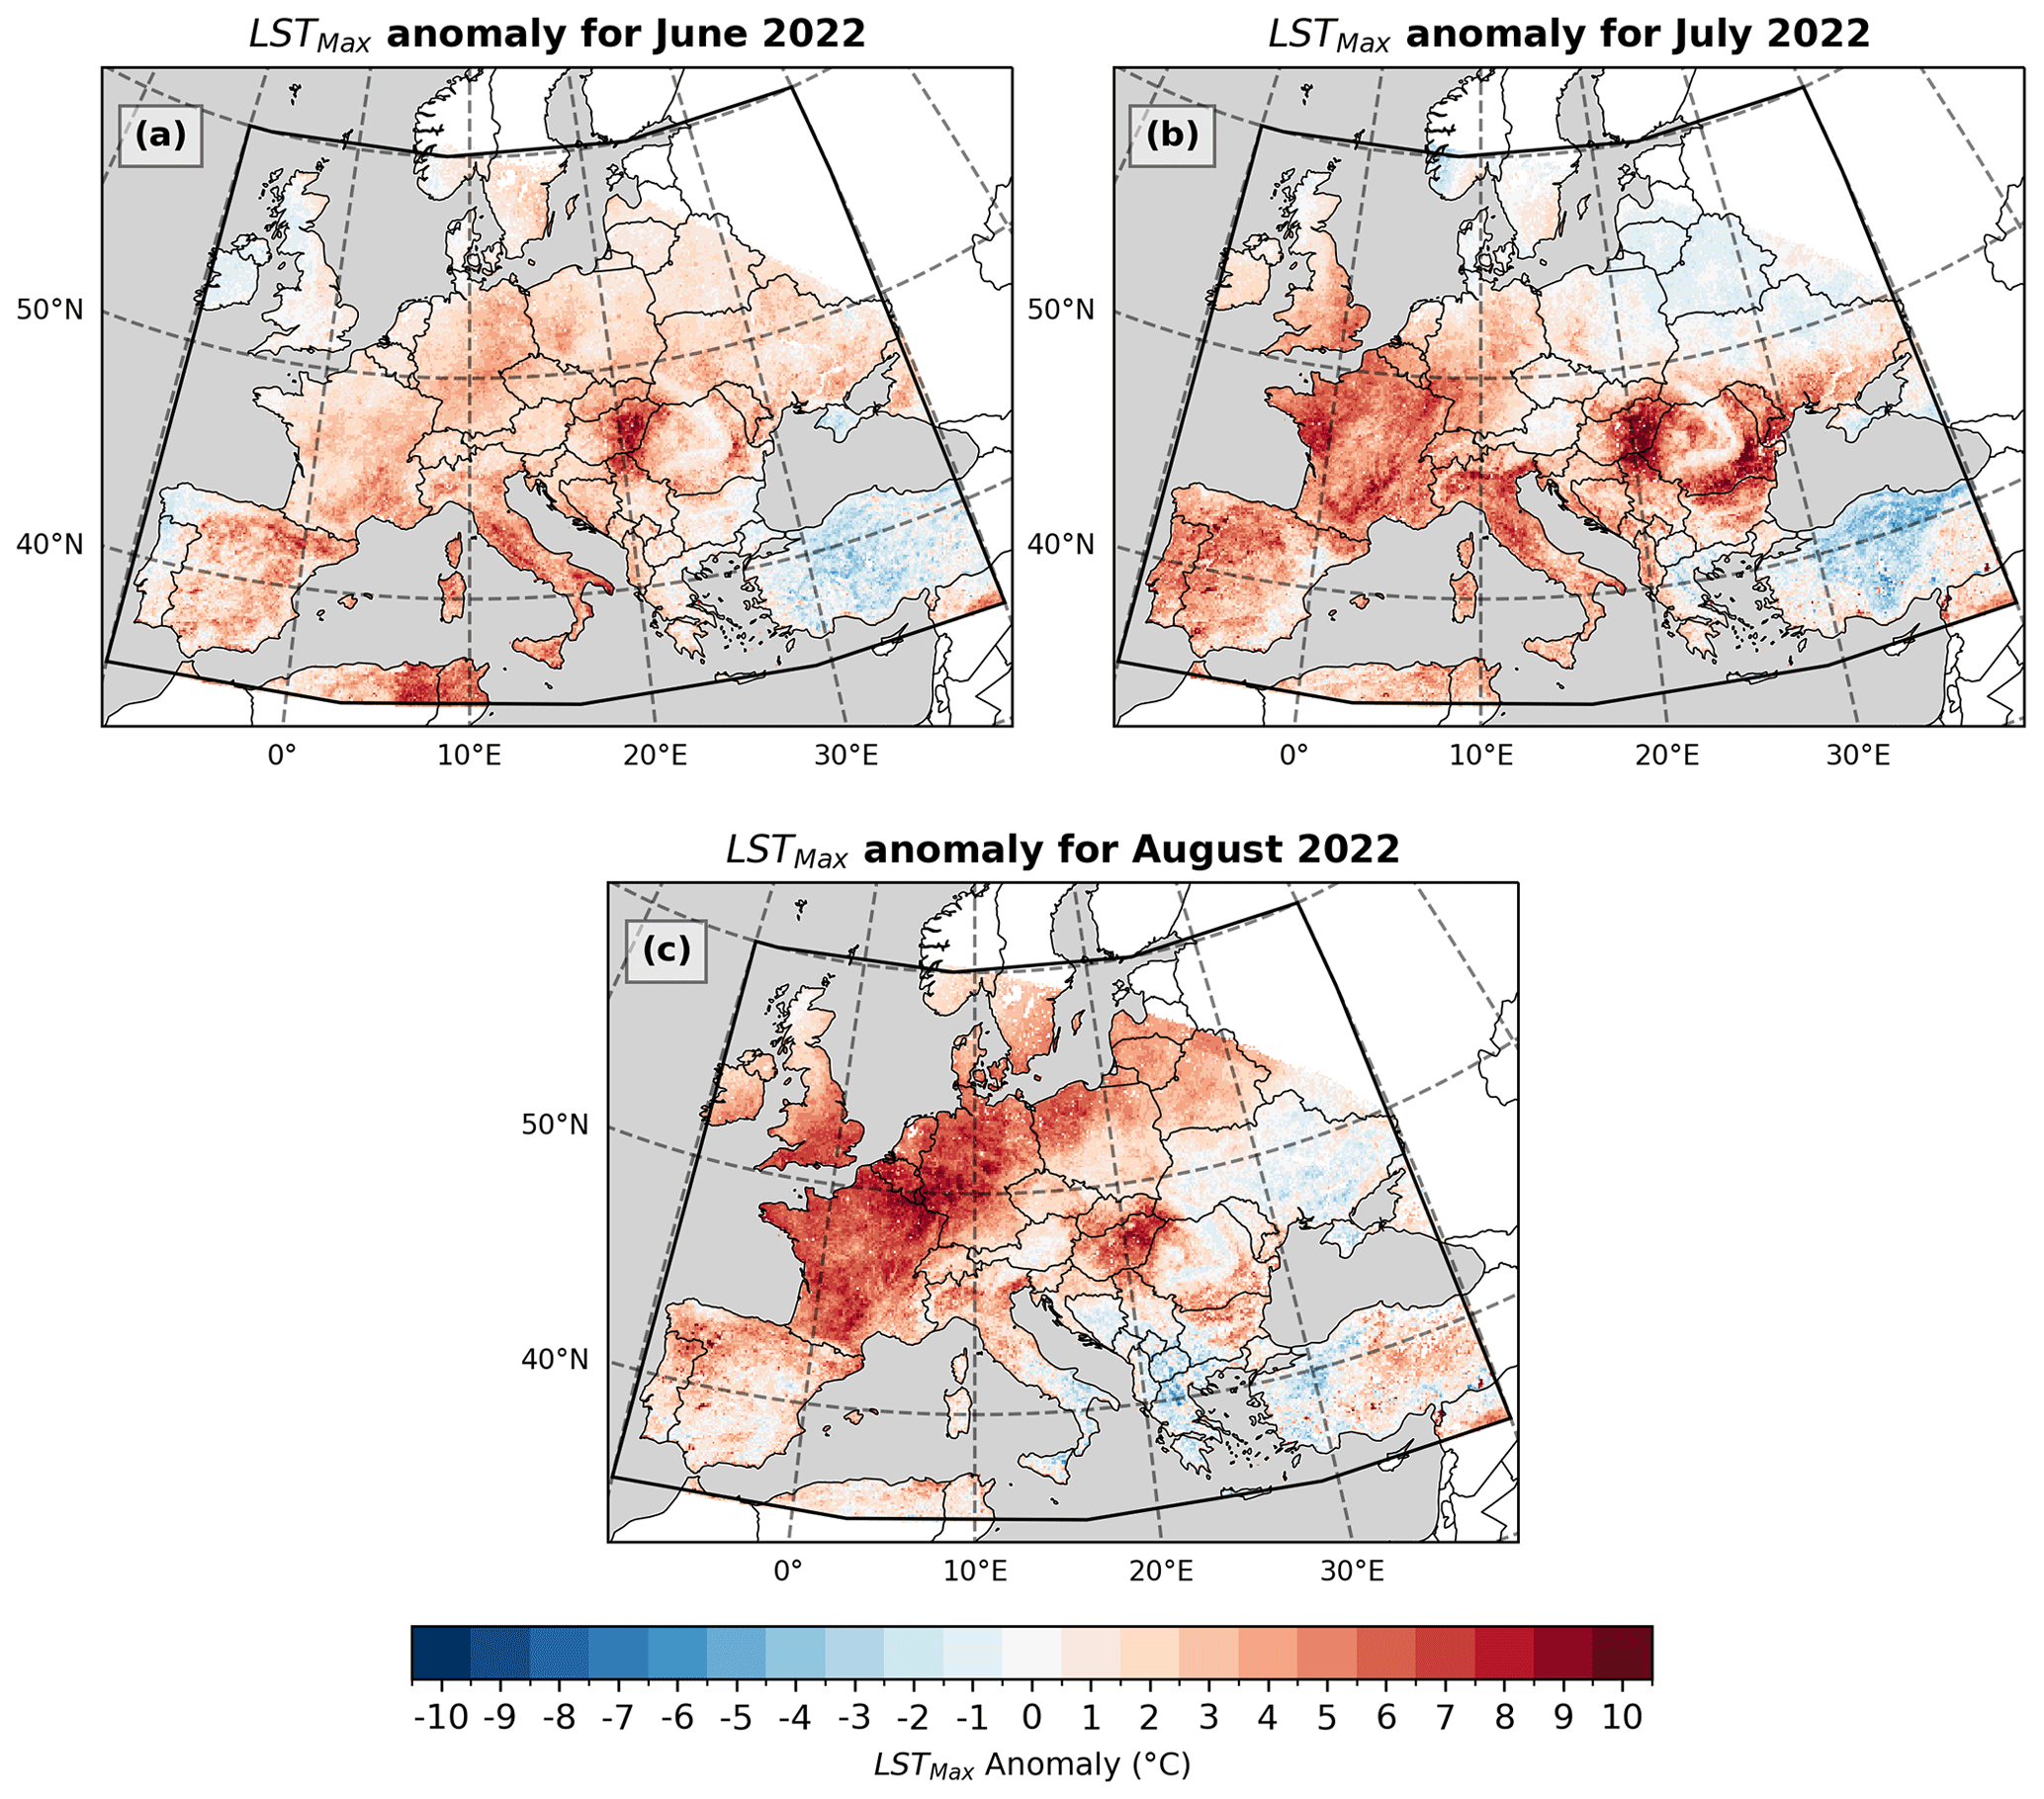
Figure 3LSTMax monthly anomalies for (a) June, (b) July and (c) August 2022 over Europe.
Although there are a few recent climate assessments made using remotely sensed LST (Wang et al., 2022; Good et al., 2022; Gouveia et al., 2022), this data type is not typically used to derive this kind of climate monitoring information, and therefore a comparison with more standard datasets is relevant in the context of this work. In Fig. 4, a comparison between the anomalies shown in Fig. 3 and the corresponding anomalies using ERA5-Land SKT and T2m is shown. All anomalies used the same reference period and calculation methodology. While LST and SKT are highly comparable in terms of their physical meaning, T2m results mostly from assimilated surface meteorological observations, while SKT has a stronger model weight. LST for clear-sky situations (which typically prevail in heatwave conditions) is derived from thermal infrared brightness temperatures. For cloudy skies, a surface energy balance model is employed, which mostly is based on optical and infrared satellite information but also relies on screen-level data from ERA5 for the estimations of surface fluxes. Similarly, ERA5-Land SKT is also derived from a surface energy balance driven by ERA5 fluxes and screen-level data, modulated by the land surface characteristics (e.g. vegetation cover) and conditions (available soil moisture). Therefore, it is influenced by ERA5 errors, such as errors in the cloud fraction, or errors in the representation of the physiographic fields such as vegetation cover/LAI (which are static) or sub-surface conditions (soil moisture).
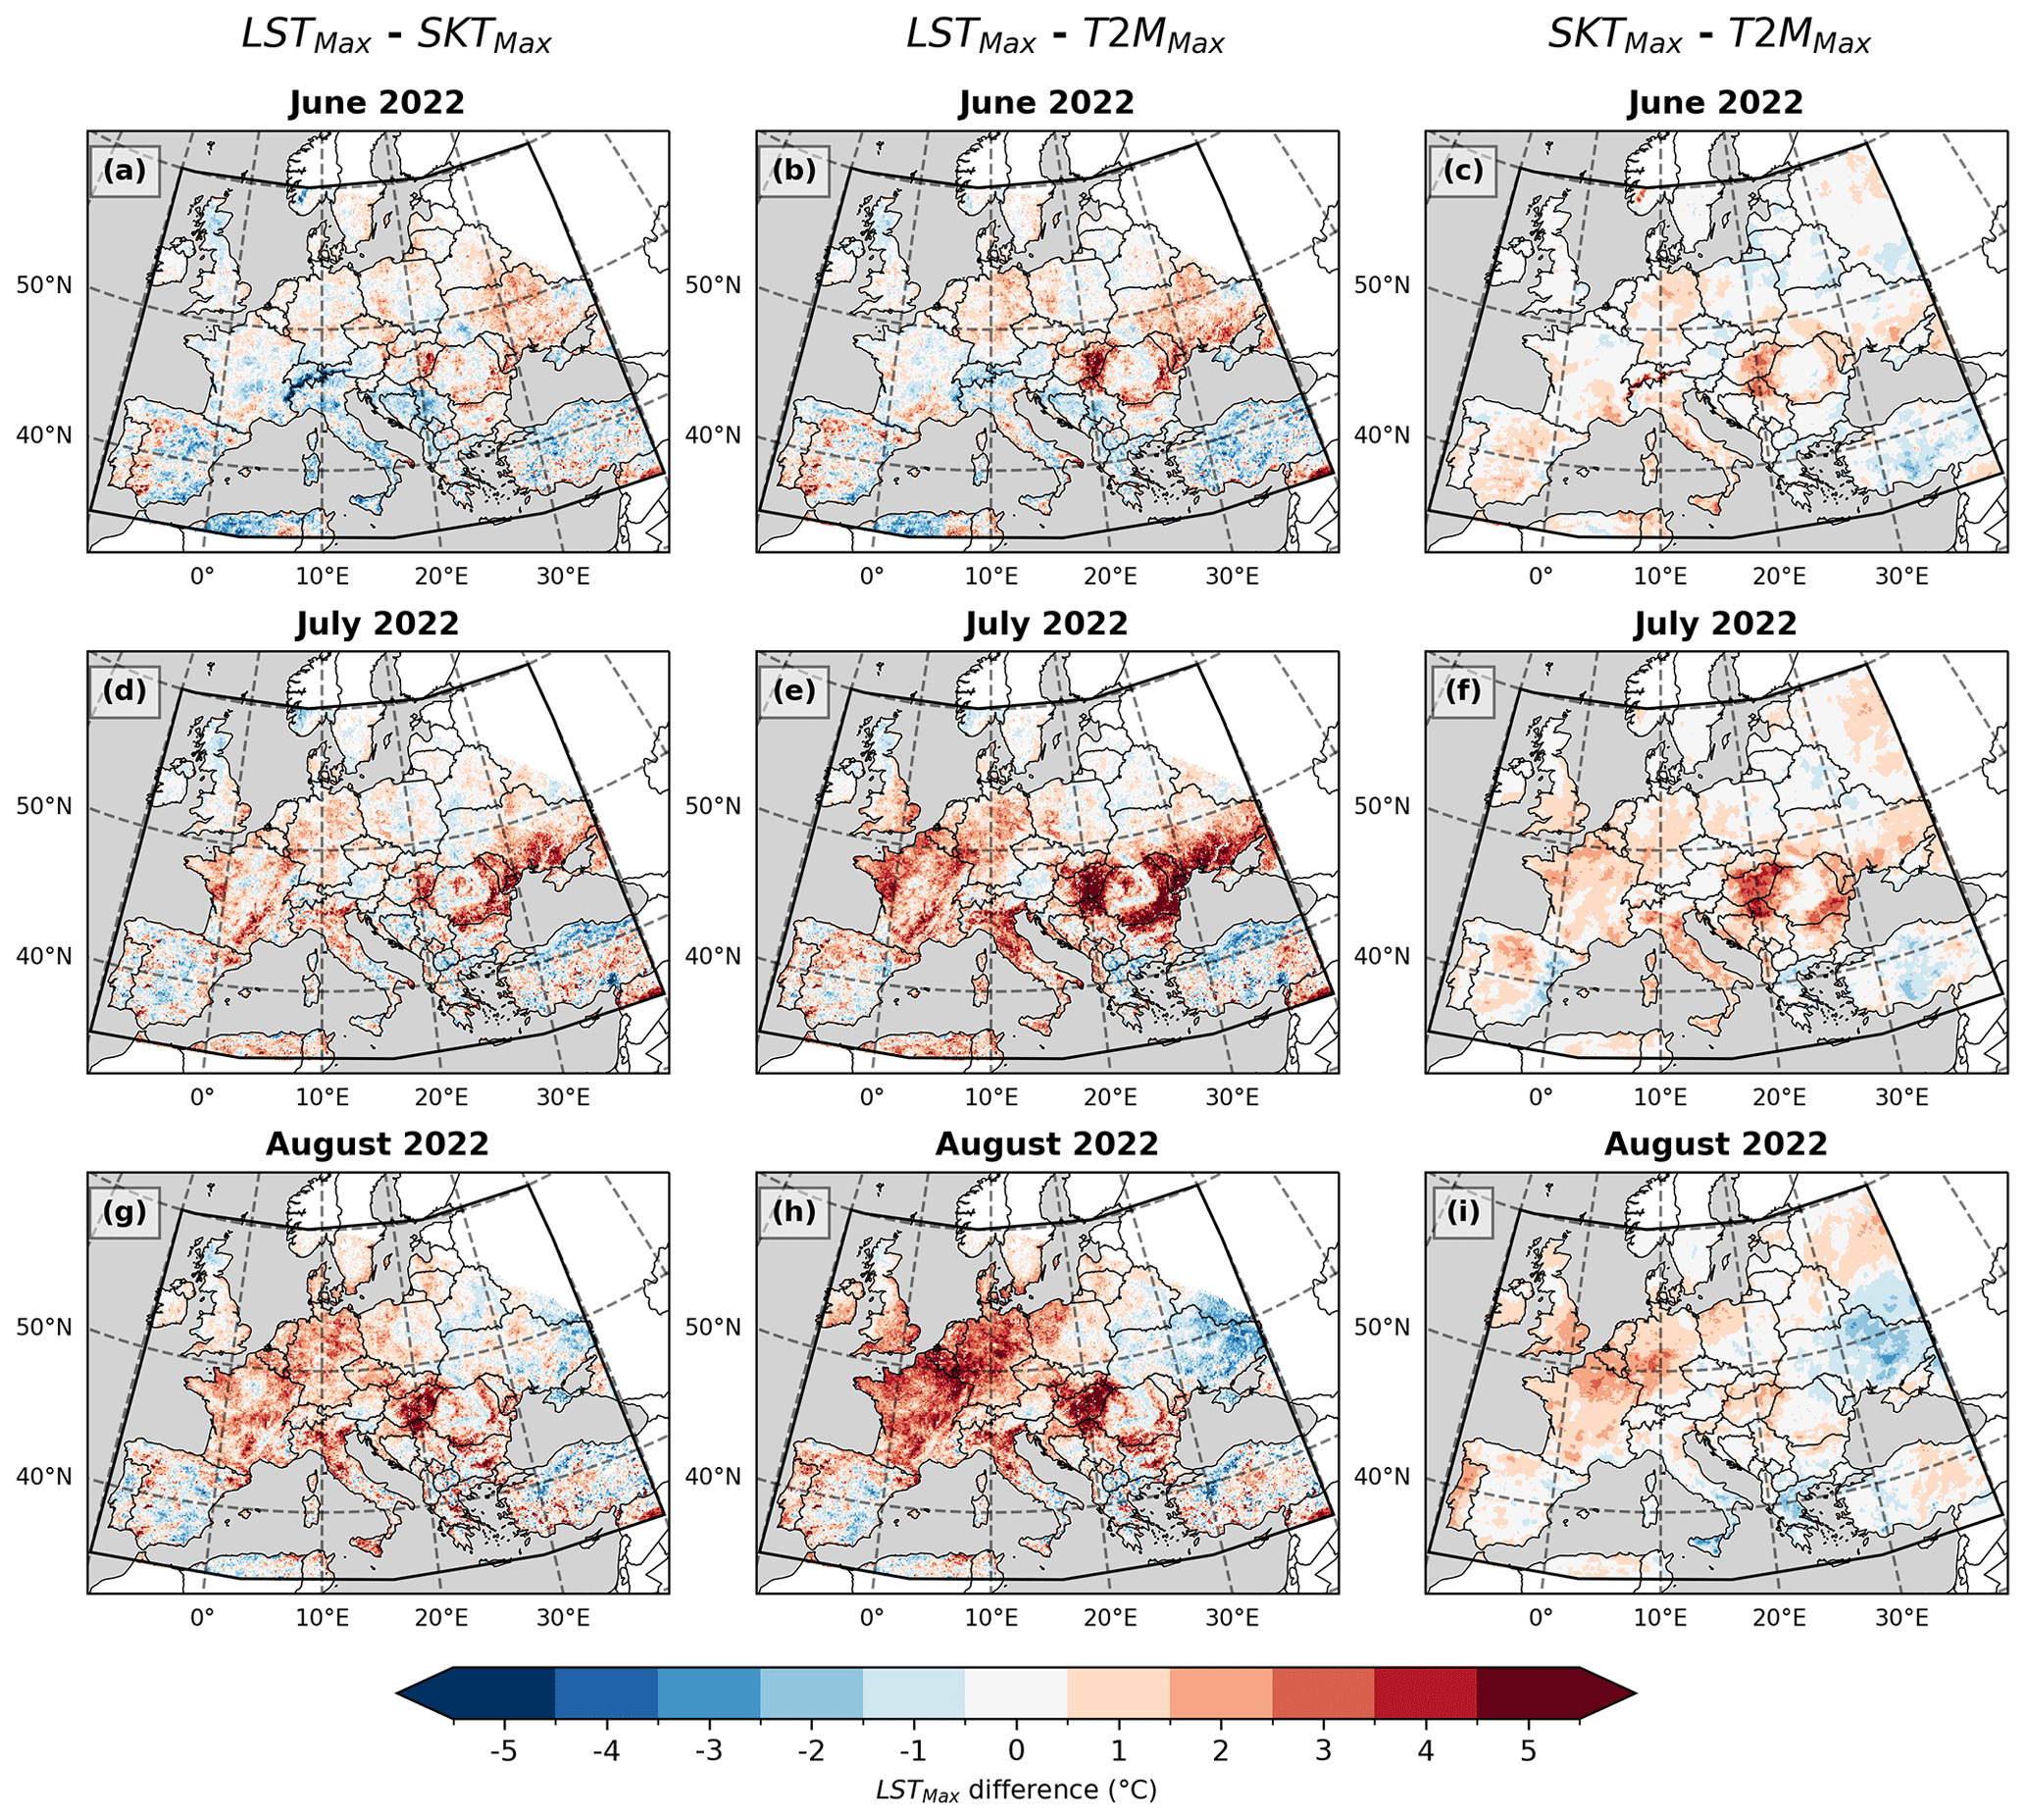
Figure 4Comparison between LSTMax monthly anomalies and the corresponding anomalies using reanalysis SKT (left) and T2m data (right). Comparisons are made for (a, b) June, (c, d) July and (e, f) August.
For instance, temperature anomalies over burned areas are generally higher when they are determined based on LST observations than when they are based in SKT, since the relevant information in the physiographic fields is not included in ERA5-Land (e.g. surface emissivity, albedo, vegetation cover). Some of these fire scars are visible in Fig. 3 (e.g. over the Iberian Peninsula). Close inspection of pixels roughly corresponding to burned areas associated with fires that occurred in July 2022, namely in northwestern (Castilla and Leon) and southern (Andalusia) Spain, reveals LST − SKT mean differences of up to 14 °C in the August maps. LST-based anomalies are generally comparable to SKT-based anomalies in June. A more pronounced negative difference is observable over the Alps, and more pronounced (3–5 °C or more) positive differences were observed over western inland Iberia, Hungary, Romania and Ukraine. Throughout the summer, these positive difference patterns intensified, and positive differences rose all over central and Mediterranean Europe, with August being the month where the overall differences were higher, reaching 3 to 5 °C or more.
Regarding the differences between the LST-based and the T2m-based anomalies in June, the spatial patterns are similar to those of the LST difference with SKT (Fig. 4a, b). However, there some differences worth noting: (i) the absence of a pronounced negative difference over the Alps, (ii) a more consistent positive difference over central Europe and (iii) larger differences over the regions where the pronounced positive differences were identified in the SKT map. For July and August, the differences became much greater, exceeding 5 °C over Hungary, central Europe, northern Italy and areas around the northern Black Sea. However, in August, a pattern of negative differences of up to −3 °C became apparent in the easternmost parts of the domain (Fig. 4f).
Regarding SKTMax−T2mMax, one should note that these are entirely produced by reanalysis alone. The comparison reveals that thermal contrasts between SKTMax and T2mMax are much smoother than those between LSTMax and T2mMax. Since the surface sensible heat flux is proportional to this difference, this suggests that sensible heat fluxes are weaker in ERA5-Land under extreme heat conditions compared to observations (i.e. LSTMax−T2mMax differences), although other model parameters might play a role in the sensible flux modulation (e.g. surface roughness).
In Fig. 5, the temperature differences are further analysed as a function of the absolute LSTMax. Their behaviour is consistent across the absolute LSTMax range. For instance, for lower LSTMax values, both differences are small and negative. A large part of this can be explained by persistent clouds, which, if undetected, could introduce a negative bias in LST (Martins and Dutra, 2022; Trigo et al., 2021; Martins et al., 2019). These situations are however relatively infrequent. For mid-range LSTMax values, differences are generally positive, with larger LSTMax−T2mMax values, especially in July when they reach around 2 °C. For LSTMax around 45–55 °C, temperature differences are relatively lower, but they increase again for very high LSTMax values.
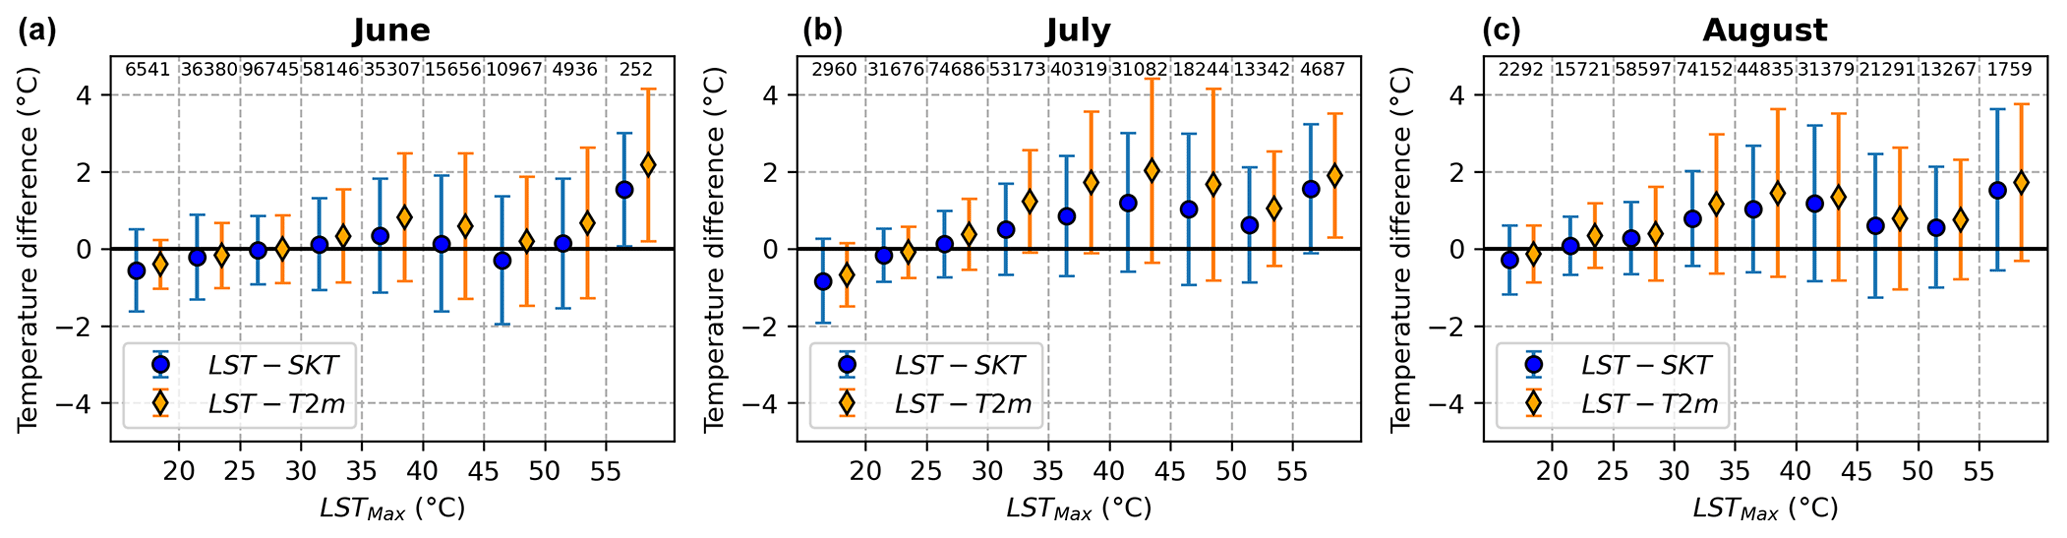
Figure 5Mean differences between LSTMax and SKTMax (orange, diamonds) anomalies and between LSTMax and T2mMax (blue, circles) anomalies as a function of mean LSTMax, for (a) June, (b) July and (c) August. On top, the number of pixels used in the calculation. Whiskers represent the standard deviation over each interval.
Therefore, despite the good correlations between LST and T2m found by Good et al. (2022), these results show that there is a wide range of situations where these temperatures may be very different.
3.3 Number of hot days and HWMI
Following the previous results focusing on the seasonal and monthly anomalies, we now assess several aspects of heatwave-related metrics. Figure 6a presents the number of hot days in JJA, using LSTMax. The most striking result is that only a few regions have less than 10 hot days, which include eastern Iberia and the southern Balkans. In contrast, large areas over the whole west-central Europe area had more than 40 hot days (and even more than 50). The heatwave magnitude index (HWMI) for JJA shown in Fig. 6b provides a cumulative view of the extreme heat conditions for each pixel. The differences between Fig. 6a and b stem from the requirement of at least 3 consecutive hot days for HWMI to be positive. Heatwave conditions were particularly severe (i.e. with HWMI values of up to 120) in northeastern Portugal and Spain, southeastern France, Hungary and Slovakia, parts of Romania, and to a lesser extent (i.e. with HWMI values between 60 and 100) northwestern France and Luxembourg. Regions such as southeastern Spain, Scotland, Austria, Czech Republic and the southern Balkans were not severely affected by damaging heat conditions in summer 2022.
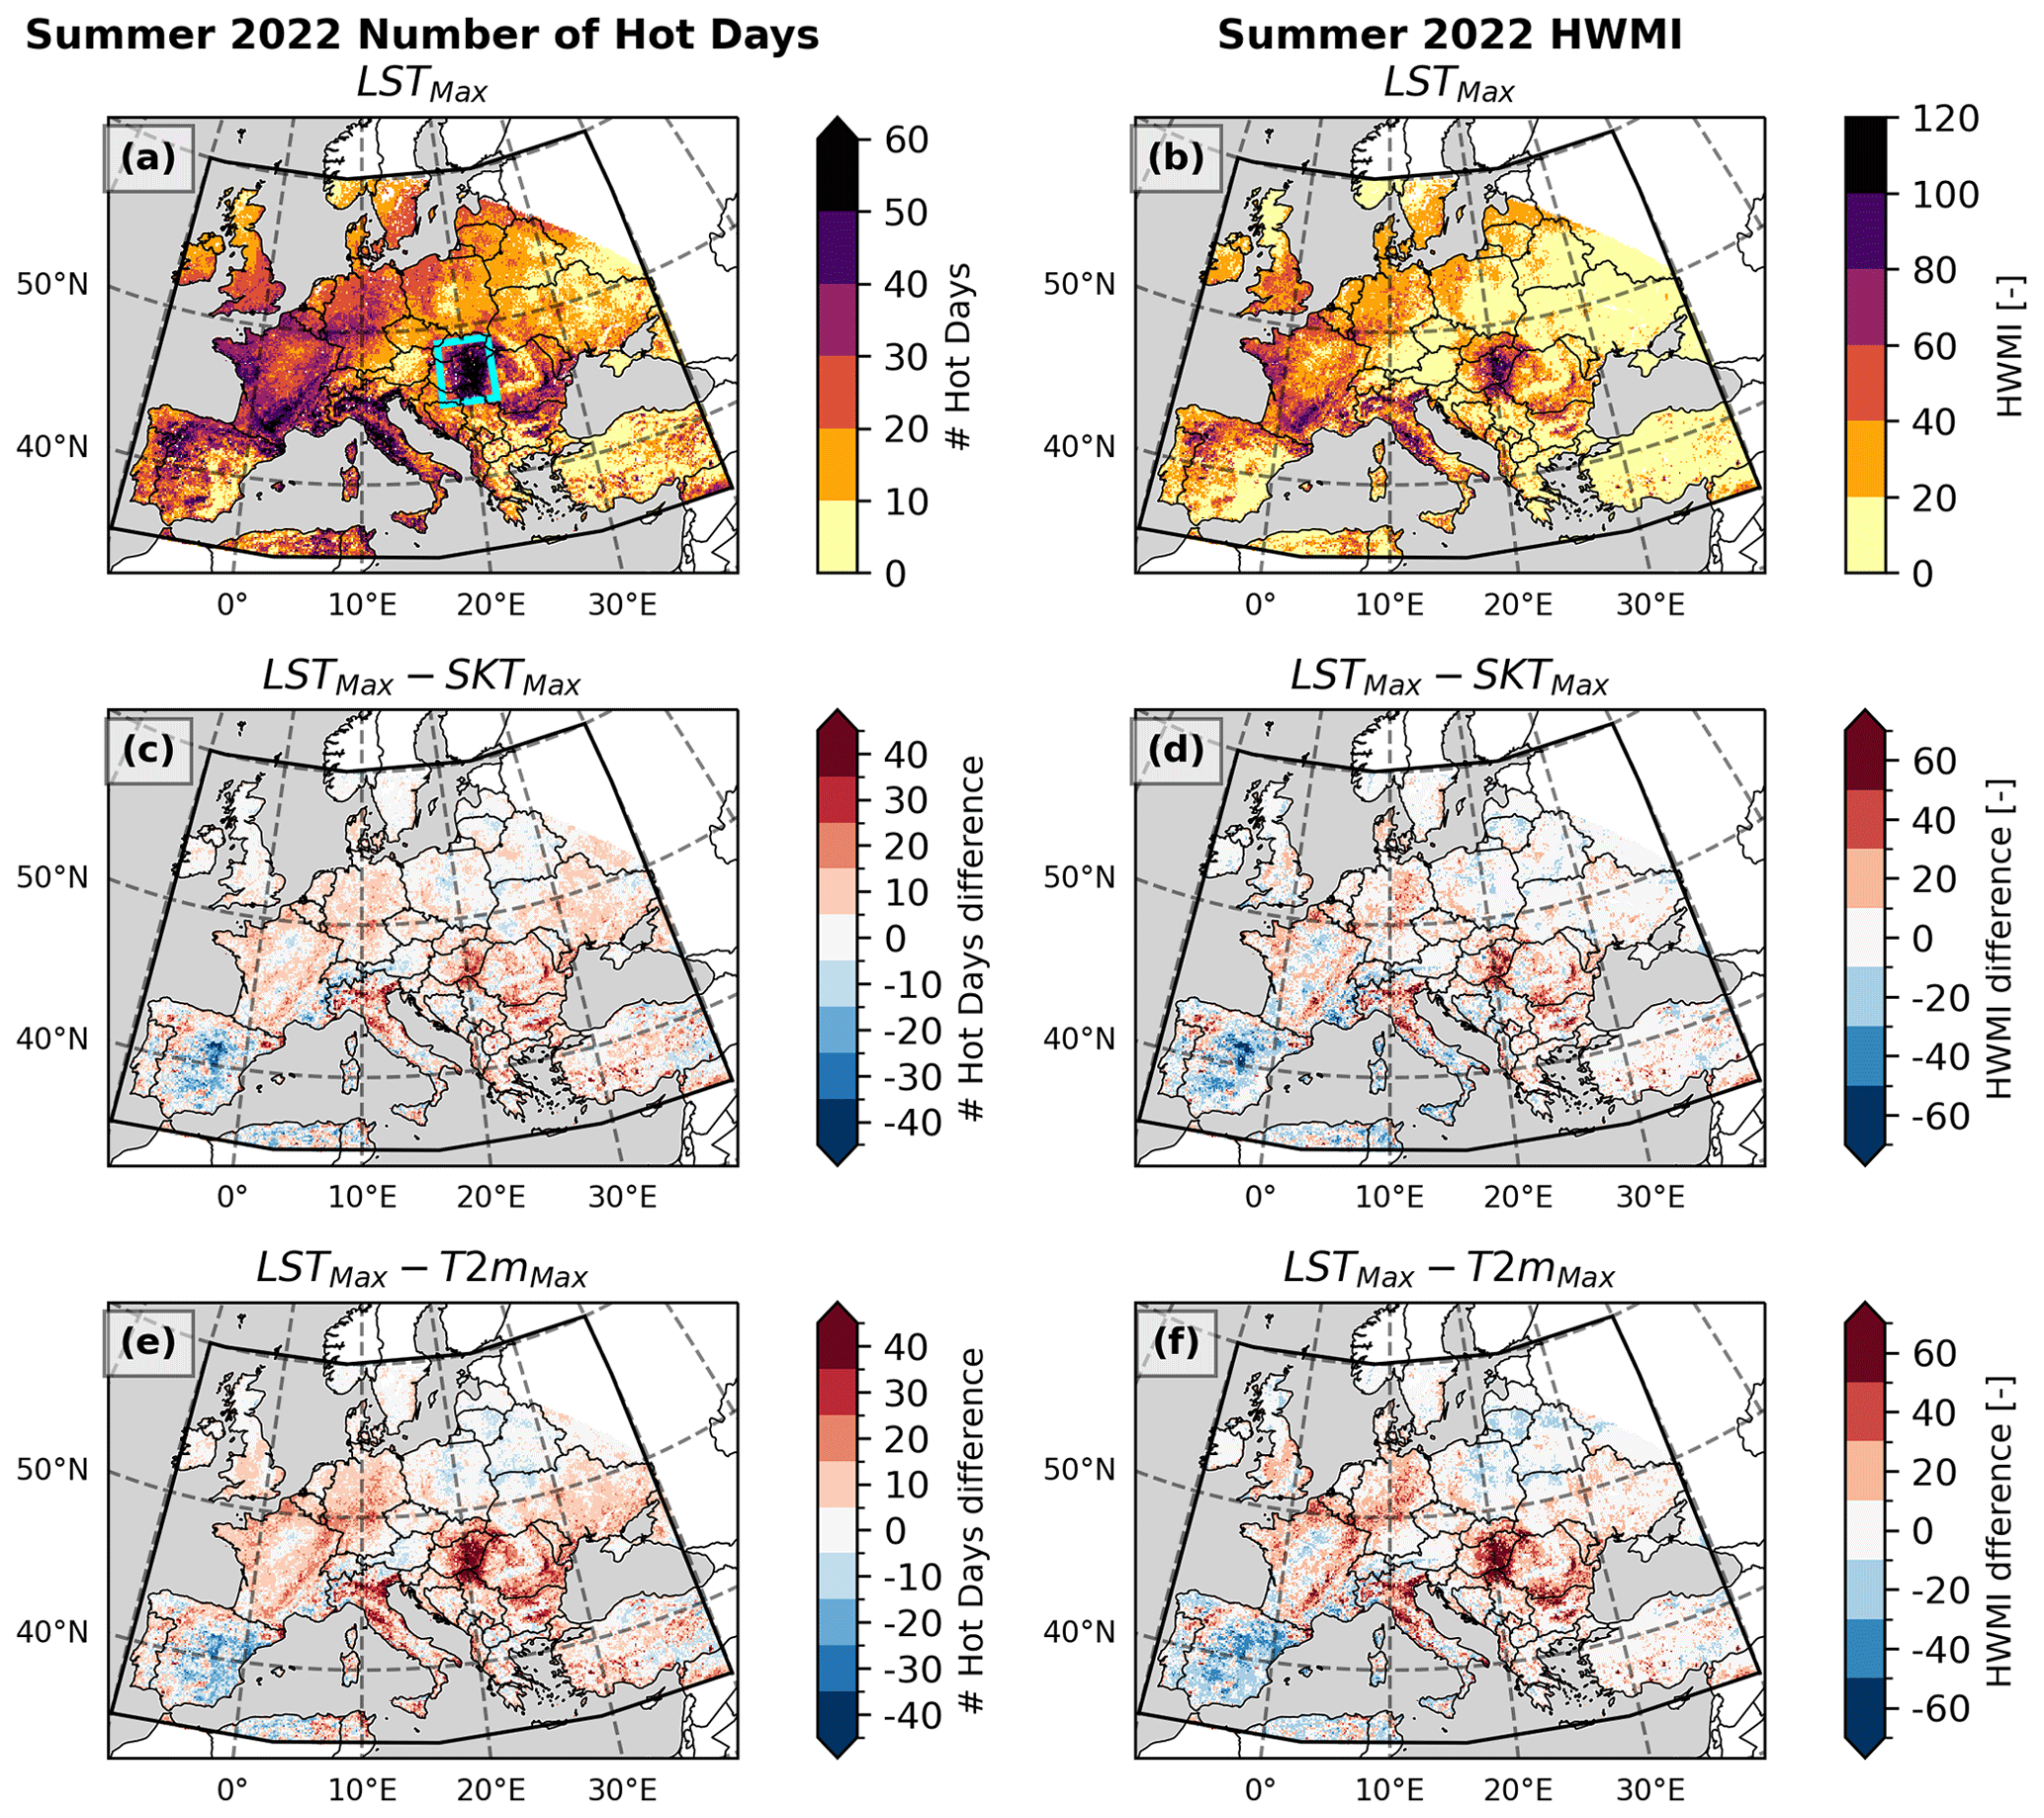
Figure 6(a) Number of JJA hot days detected using LSTMax (i.e. days when LSTMax>P90). (b) Total JJA HWMI derived with LSTMax. (c, e) Differences between the number of hot days obtained with LSTMax and with SKT and T2m, respectively. (d, f) Difference between the SKT-based HWMI and T2m-based HWMI, respectively. The blue square in (a) denotes the area used for the extraction of time series data which are analysed below.
The impact of using SKT or T2m instead of LSTMax to derive the heatwave diagnostics is assessed in Fig. 6c–f, showing the differences in the indices. In general, the patterns are similar to those observed in Fig. 4, translating the fact that the physical differences between these three variables necessarily impact these heatwave diagnostics. In central Iberia, LSTMax reveals a pattern with up to 40 fewer hot days when compared to SKT and T2m, consistent with negative differences in thermal anomalies with respect to the ERA5 variables (see Fig. 4). In central Europe, using LSTMax, up to 20 more hot days were detected and increases around 20–40 in HWMI were observed. The largest differences are over northern Italy, Hungary and eastern Romania, where there are up to 40 more hot days and differences of up to 60 in HWMI, with respect to both the ERA5-Land variables.
In Fig. 7, a time series view of the mean behaviour of the heatwave diagnostics within the box in Fig. 6a is shown to illustrate some methodological aspects. Large day-to-day LSTMax variability is observed over this region, with temperature drops of more than 10 °C over a couple of days (e.g. from 29 to 31 July), mostly caused by cloudy conditions and advection of colder air masses into the region. Even so, 40 hot days were observed, 33 of which belonged to heatwave periods (red circles). These counts are of course very sensitive to P90, shown as a dashed line in Fig. 7a. Both the number of days in the rolling window and the number of years used to determine the percentile influence the heatwave diagnostics because on one hand a larger moving window tends to lower the summer P90 and on the other hand including more earlier years (which are colder due to climate change) would also lead to a decrease in these P90 values. Therefore, if any of these options would have been considered, the observable heatwaves at the end of June and the beginning and middle of August could last for slightly longer and the last 2 hot days observed in August could have been part of a heatwave; the overall HWMI also would be slightly higher for the region.
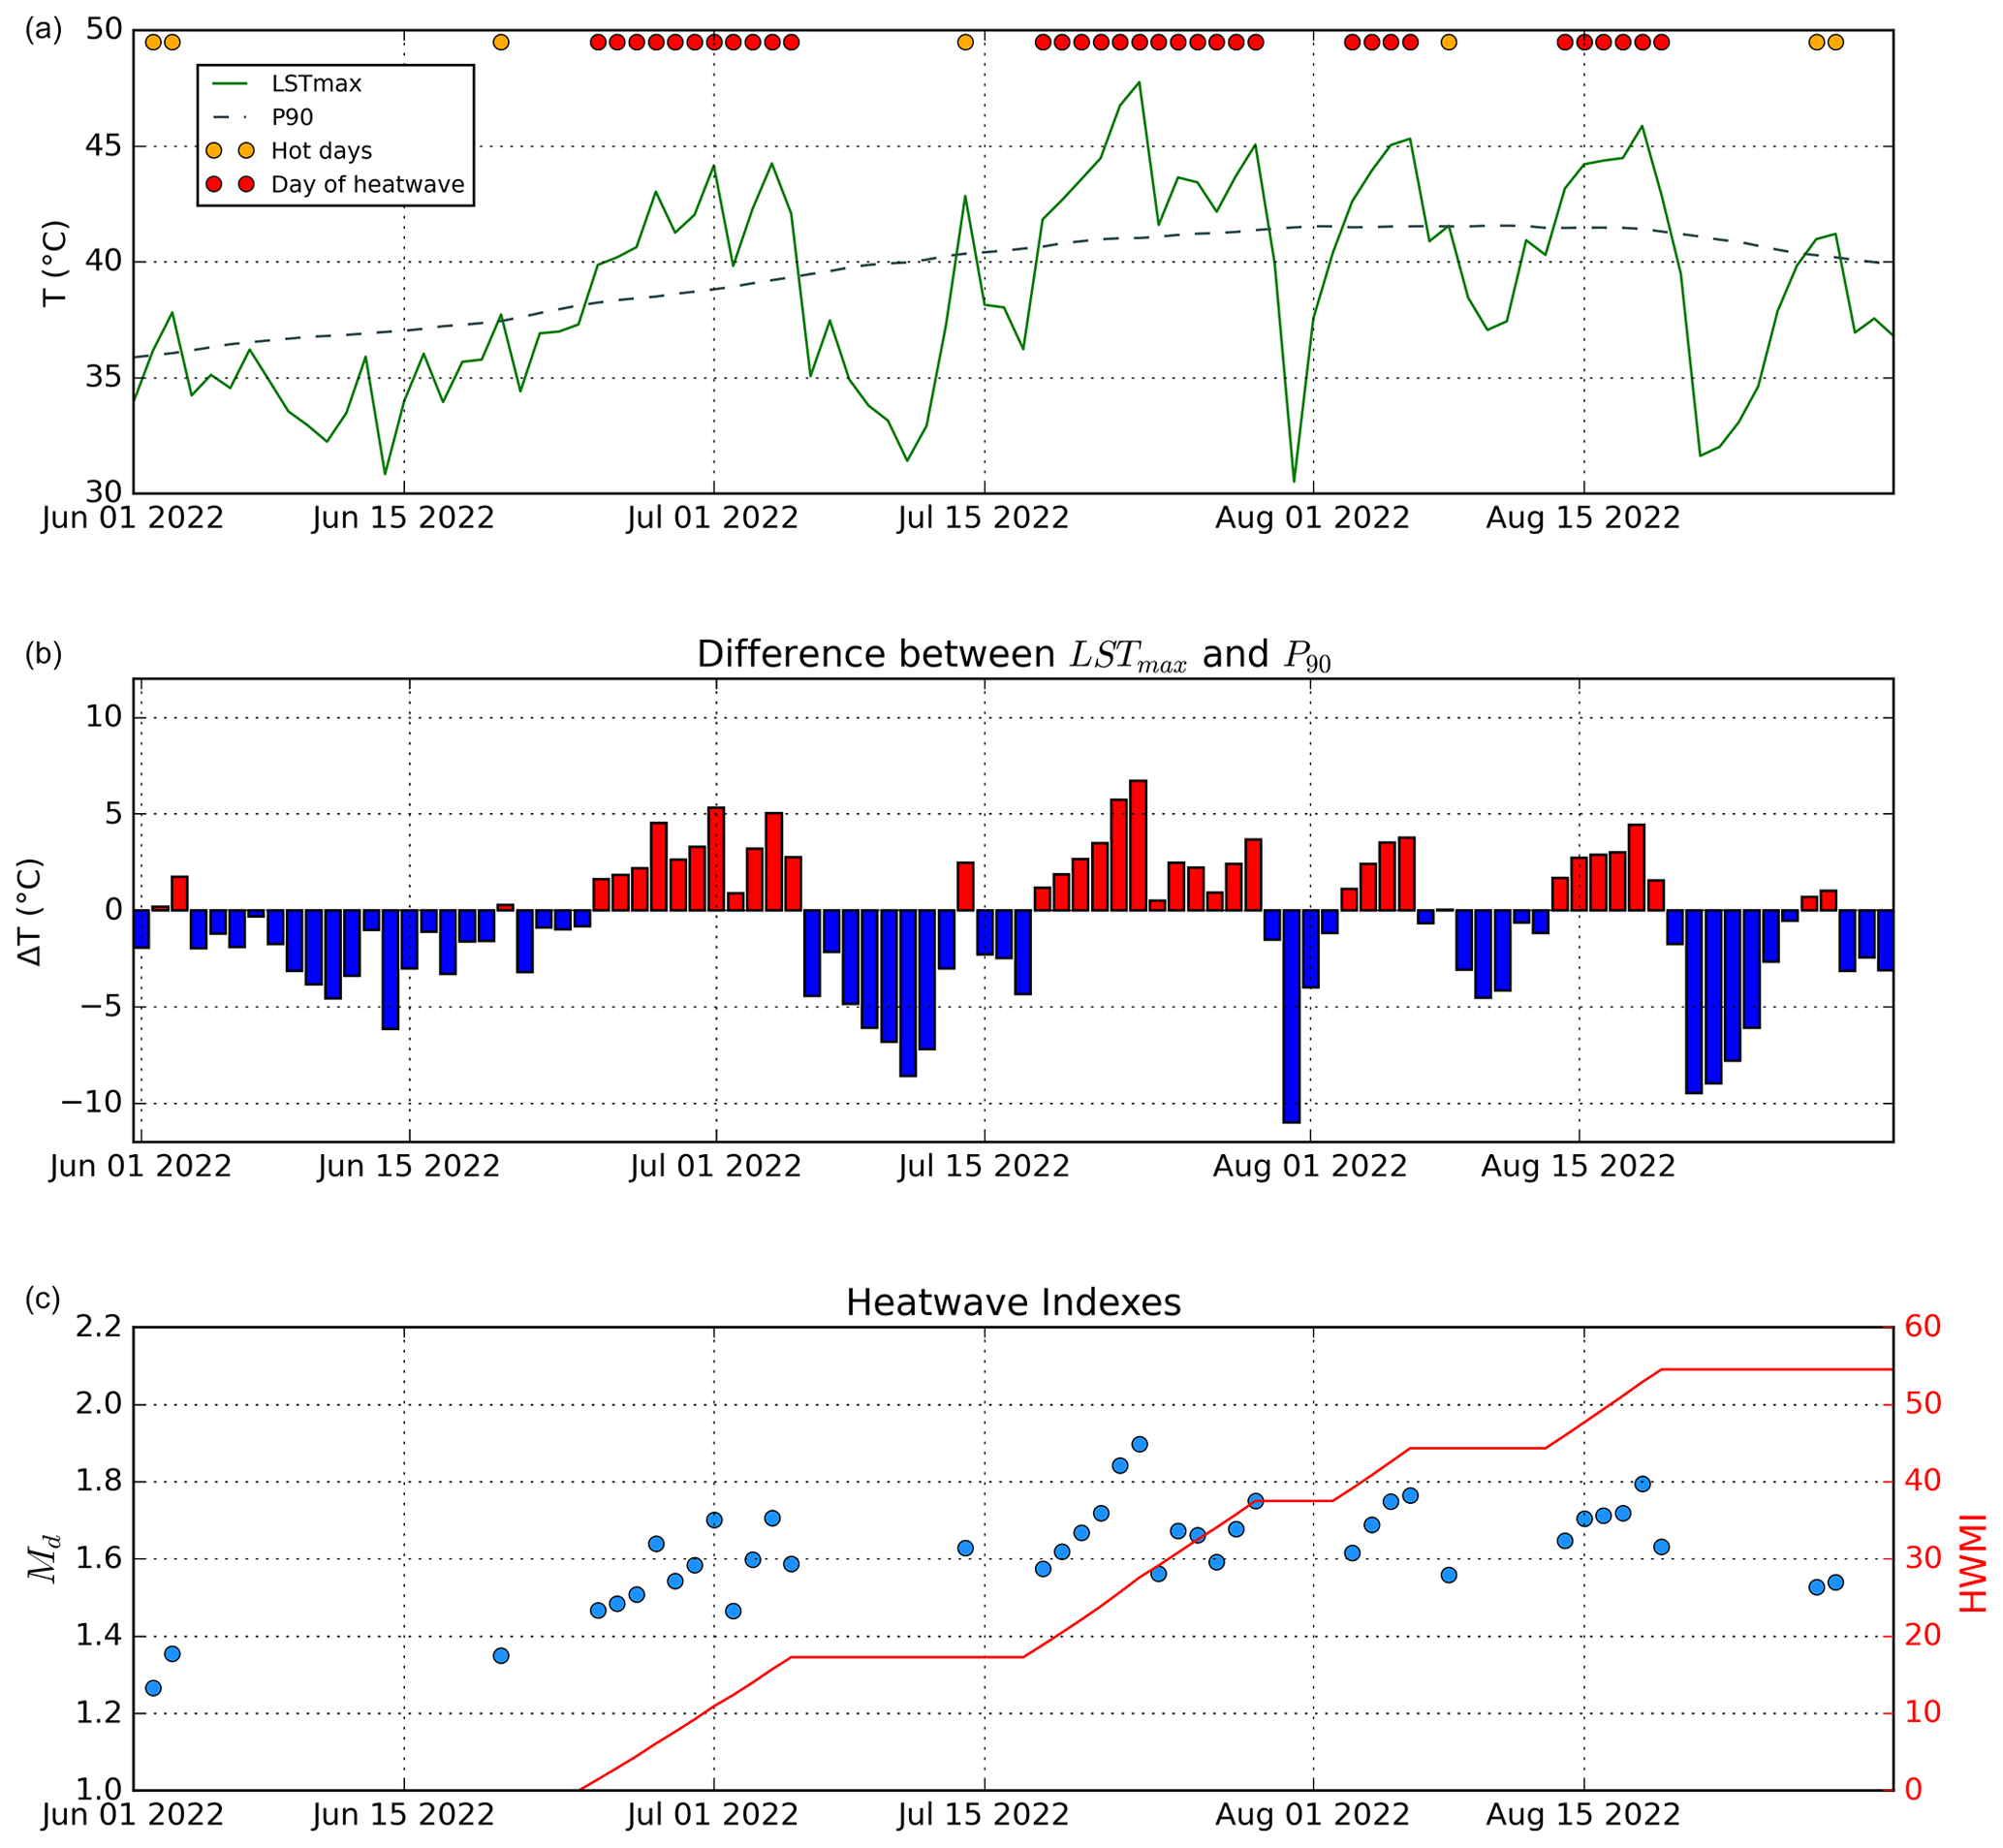
Figure 7(a) Evolution of LSTMax (green curve) and the respective P90 (dashed curve). Hot days are marked as a yellow circle at the top; if they belong to a heatwave (set of 3 or more consecutive days), they are marked as a red circle. (b) Explicit differences between LSTMax and P90. (c) Daily heatwave magnitude Md is in blue and the accumulated HWMI is in red, with values on the right axis. All data are area averages from the blue box in Fig. 6.
3.4 Vegetation anomalies and soil moisture anomalies
In this section, independent remote sensing datasets are explored for the study period with a twofold motivation: (i) to assess the extreme heat conditions in the context of the drought conditions (see Fig. 1) and (ii) to identify potential causes for the differences between LSTMax and ERA5-Land diagnostics observed in the previous sections. FVC measurements are obtained through optical imagery, made by SEVIRI on MSG. This is the same instrument used to produce the clear-sky LSTs (also providing the main inputs for its cloudy scenes), although LST relies on infrared information rather than visible and near-infrared data like in the case of FVC. FVC quantifies the fraction of each pixel that is occupied by green vegetation and responds to soil moisture and surface net radiation anomalies with a delay related to plant physiology. SWI is obtained through scatterometry data (i.e. radar) obtained by polar-orbiting instruments (such as ASCAT on Metop) and consists of an index quantifying how close the root-zone soil moisture is to the soil field capacity (SWI =1) or to the plant wilting point (SWI =0). SWI is used as input to the surface energy balance model that is used to derive cloudy-sky LST. However, it can be inferred that most of the retrievals under heatwave periods are made for clear skies. Therefore, it can be assumed that LST, FVC and SWI are mostly independent from each other.
In Fig. 8 the monthly FVC anomalies and the monthly anomalies of the SWI index for June, July and August 2022 are shown. In June, most of central Europe shows small positive anomalies of FVC. Major exceptions with strong negative anomalies are France and northwestern Iberia, eastern Hungary, and Italy (with smaller values). The SWI anomaly patterns are not necessarily similar but broadly correspond to the anomalies in accumulated precipitation (cf. Fig. 1), with some exceptions. Over Switzerland, the MAM precipitation anomaly was among the highest over the reference period, while the SWI anomaly is negligible. Over Germany and Poland, negative SWI anomalies are observed, which are associated with the very low precipitation over the region, but their expression in FVC only becomes evident from July onwards. Eastern countries exhibit strong positive FVC anomalies and positive SWI anomalies.
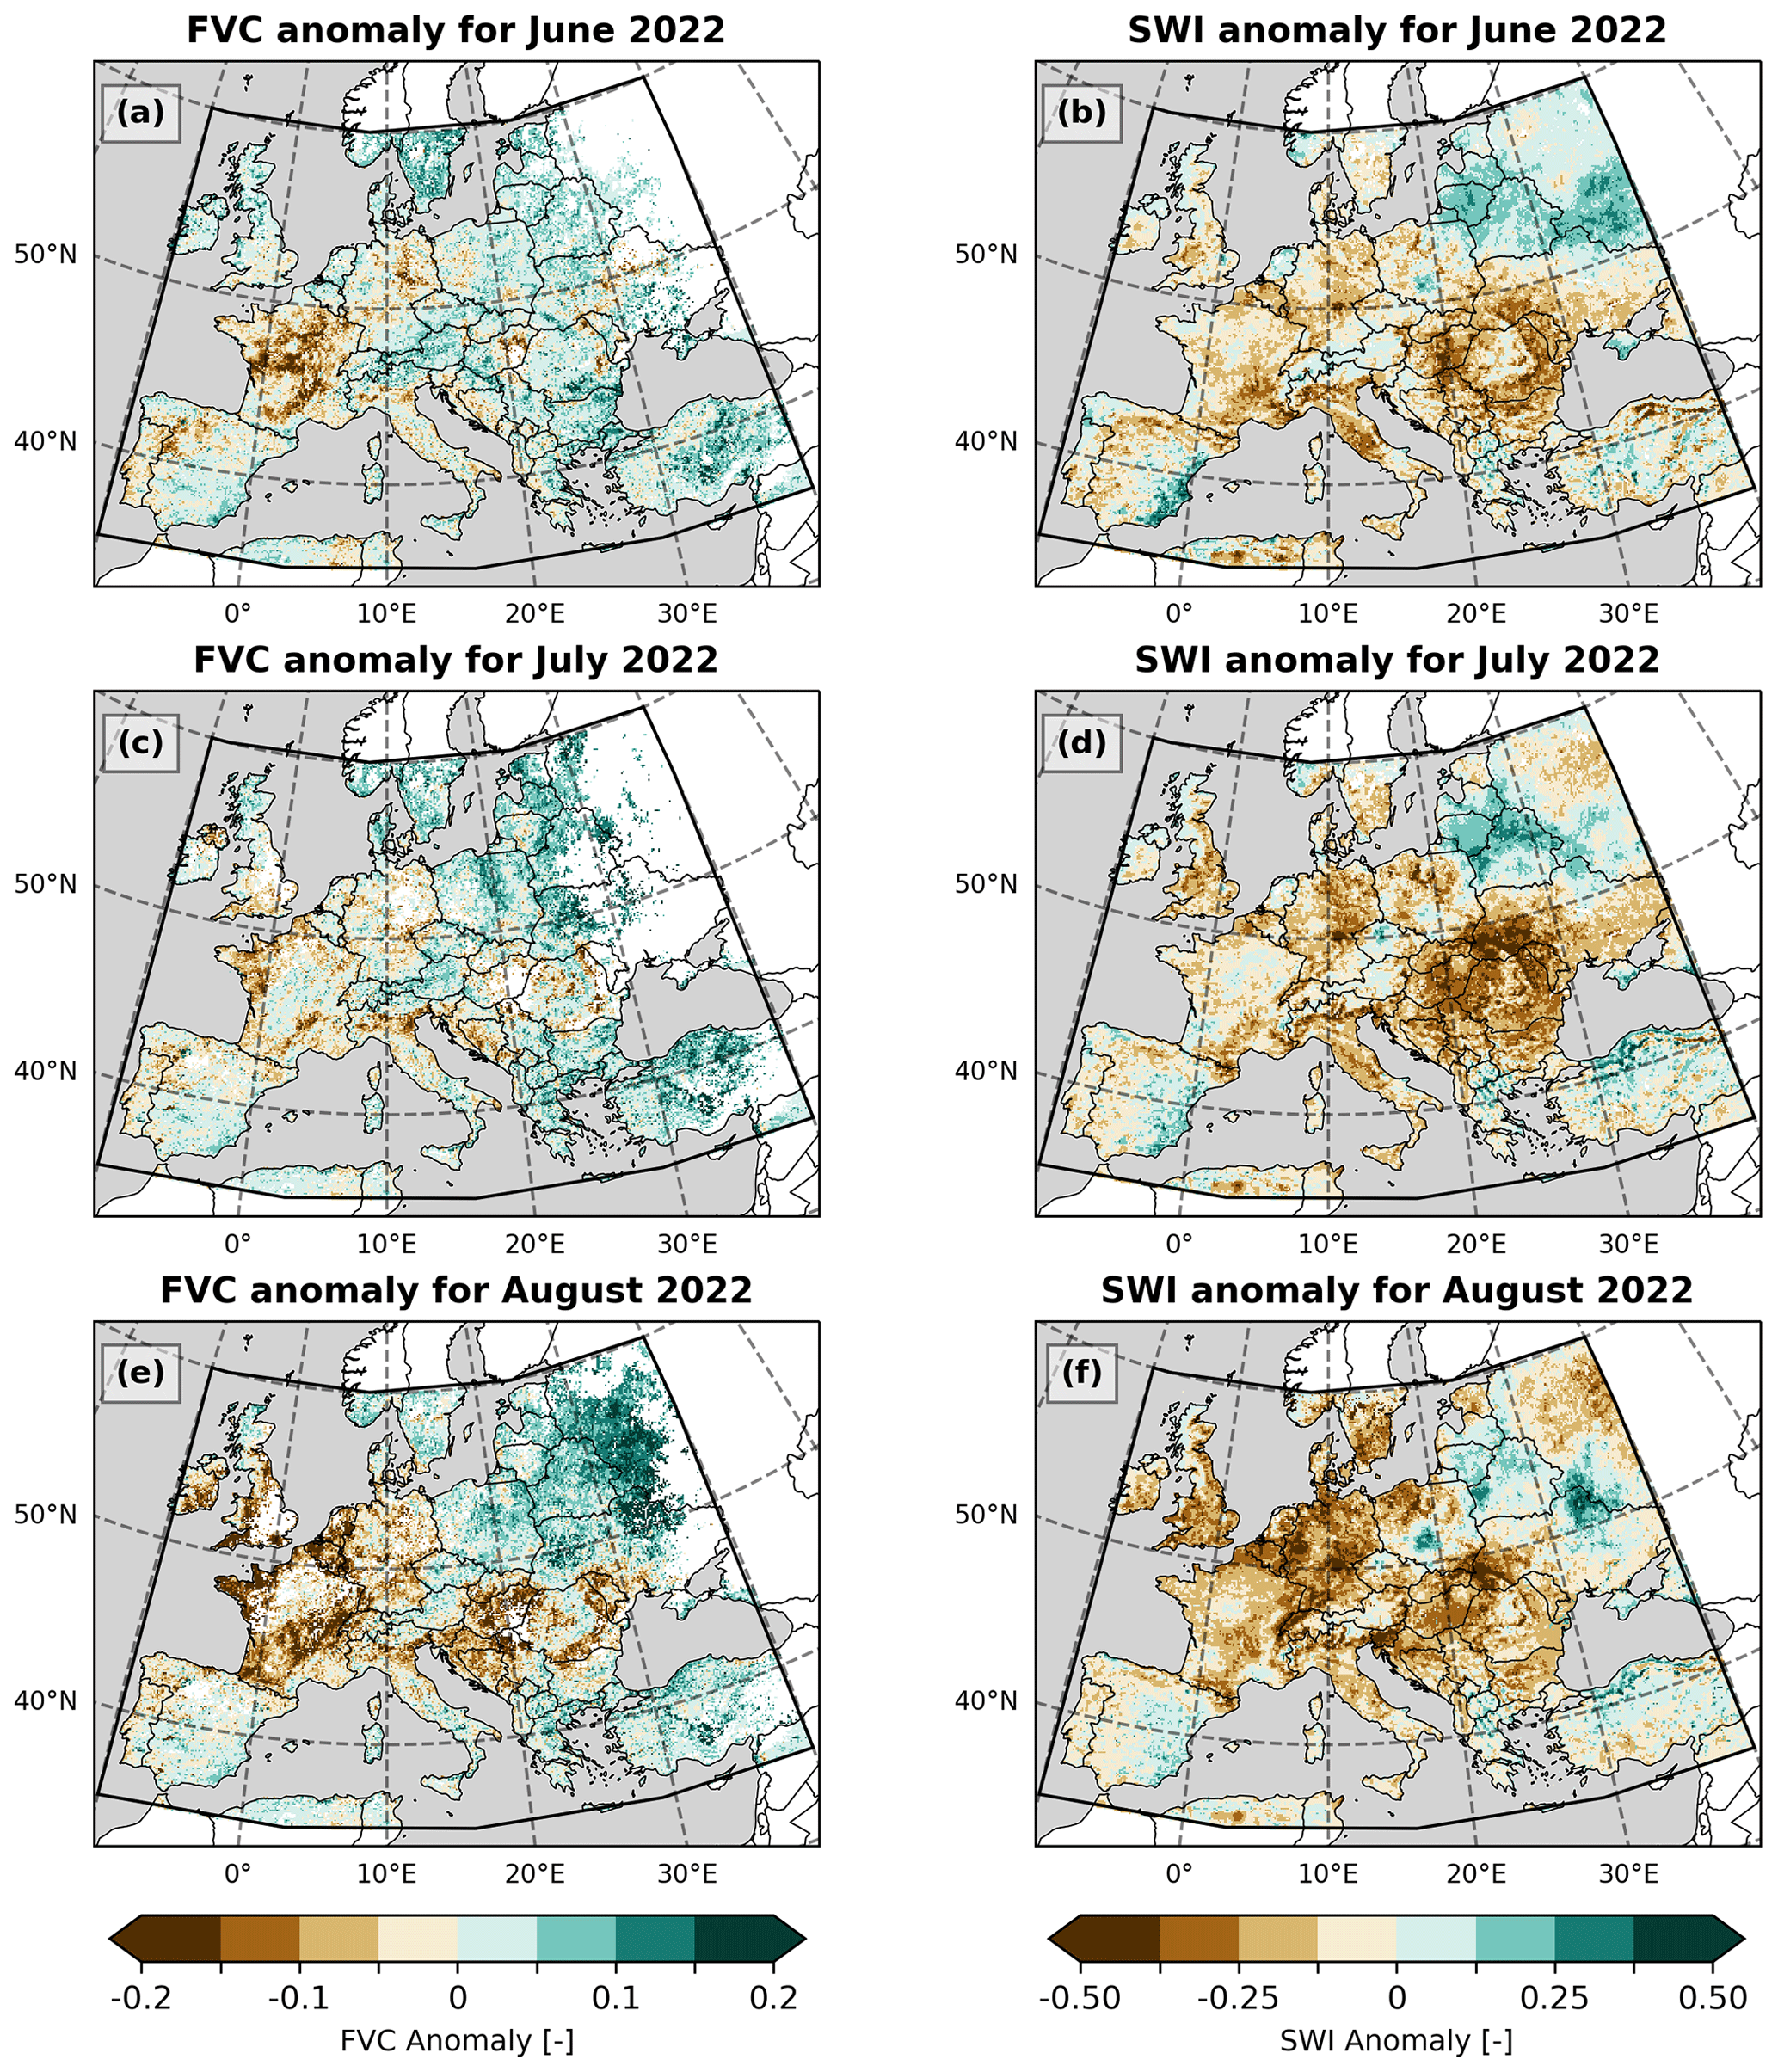
Figure 8(a, c, e) FVC monthly anomalies and (b, d, f) SWI, for June (a, b), July (c, d) and August (e, f). Reference period is 2004–2021.
The arc-like feature covering Hungary, Serbia, Romania and Moldova is consistent among precipitation, LSTMax, SWI and FVC. This is also the region where differences between LSTMax-based heatwave diagnostics and those derived from SKTMax (and in a lesser extent, T2mMax) are larger. The positive vegetation anomaly in the eastern parts of the domain is also consistent with the negative LSTMax−T2mMax differences over that area.
This consistency among different remote sensing (and reanalysed) products, obtained via different instruments and measurement principles, suggests problems in the representation of these variables in ERA5-Land. In fact, since vegetation dynamics is prescribed as static information in ERA5-Land, the reliability of some surface variables (such as surface temperature) can be questioned when these strong vegetation anomalies are in place (Johannsen et al., 2019; Nogueira et al., 2020, 2021; Duveiller et al., 2022). If dynamic vegetation was prescribed in ERA5-Land, a negative anomaly in FVC would imply (a) a decrease in latent heat release, since the surface cannot evaporate water so efficiently, and (b) a reduced sensible heat flux, since roughness is reduced when vegetation cover decreases. Both of these effects would act to increase SKT (especially the surface roughness increase), considering that in that situation soil moisture is assimilated (thus already implying reduced evapotranspiration). Under these circumstances, the only effective way to compensate the excess surface net radiation is to increase thermal longwave emission (i.e. increasing skin temperature).
Thermal anomalies observed from satellites and those obtained from ERA5-Land SKT would then be more similar (i.e. differences in Figs. 4 and 5 would be much lower). These results not only highlight the added value of using LST for heatwave monitoring instead of more standard datasets such as ERA5 but also may contribute to identifying ways of improving ERA5, especially its surface scheme.
3.5 Exceptionality of the 2022 heatwave
To conclude the results, we show evidence of the exceptionality of the 2022 heatwave magnitude and spatial extent. Figure 9 shows a time series of the proportion of European land area affected by daily magnitudes greater than 2, from 1 June to 1 September, together with the corresponding data from the individual years from 2004 to 2023. For 22 % of the summer days in 2022, the proportion of land area occupied by Md>2 was the largest among all years. These days occurred mainly in the middle of July and for 7 d in a row in mid-August. Other years like 2018, 2019 and 2015 also had large periods where a significant percentage of European land area was under extreme heat stress.
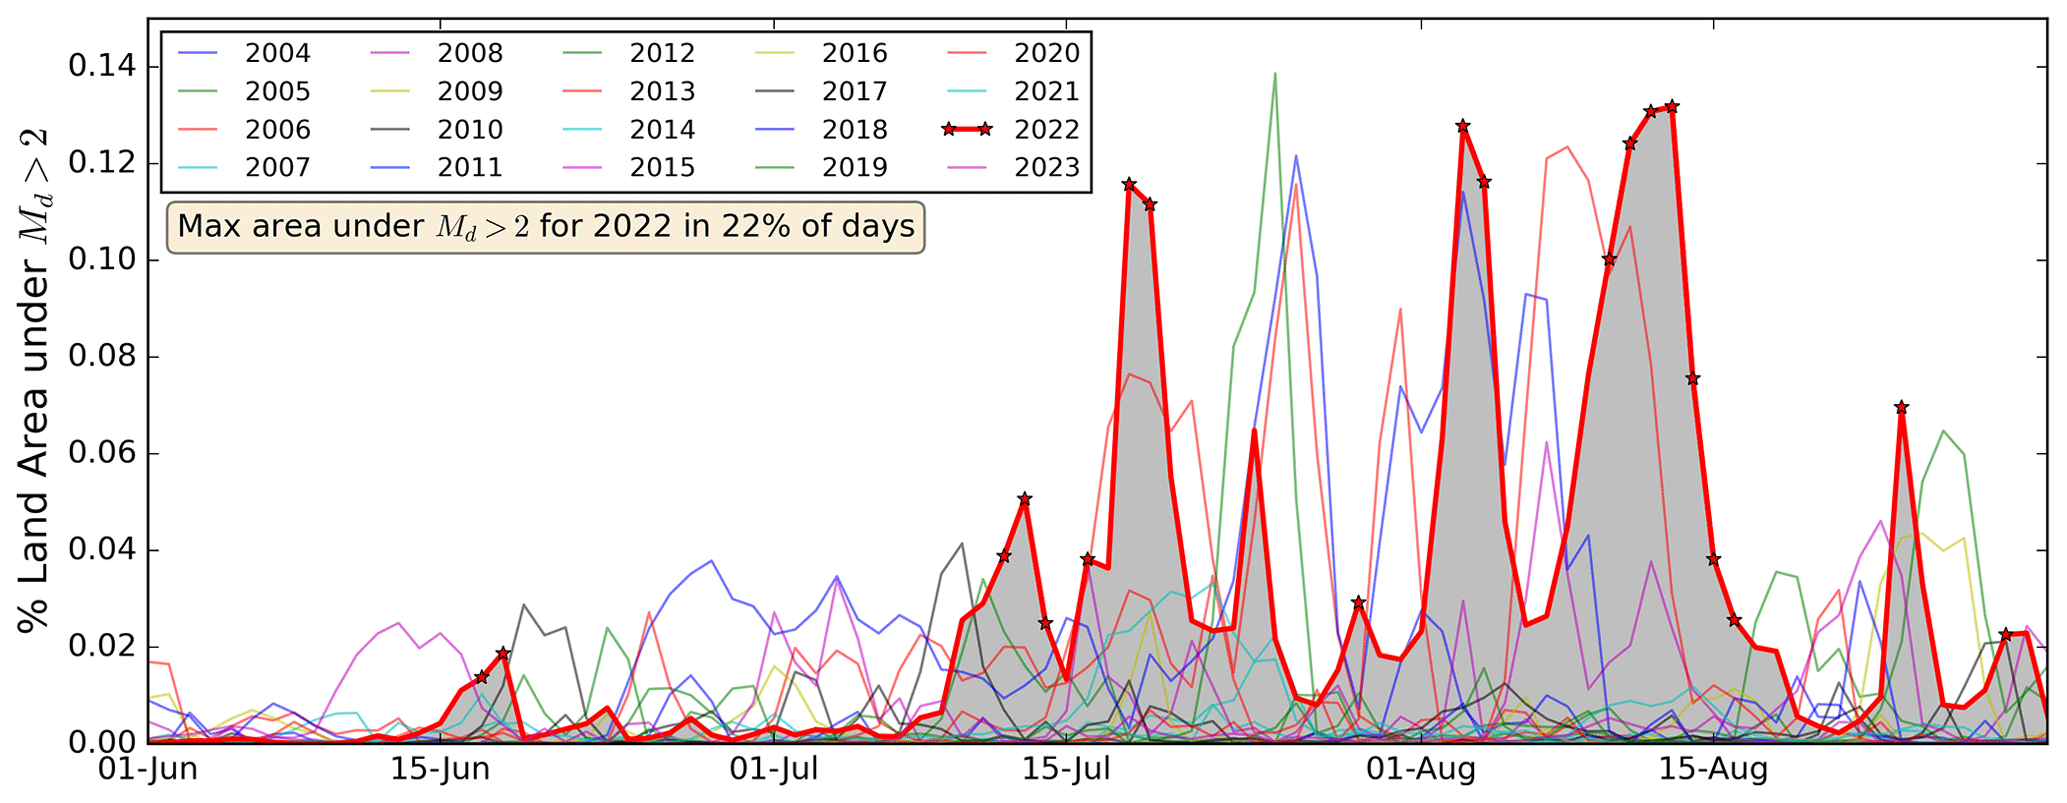
Figure 9Time series of the percentage of land area affected by Md>2, from 1 June to 31 August. The bold red curve represents 2022 data, while other colours represent the same variable for the other years in the data record. Stars mark the days in the area where Md>2 in 2022 was the greatest over all years.
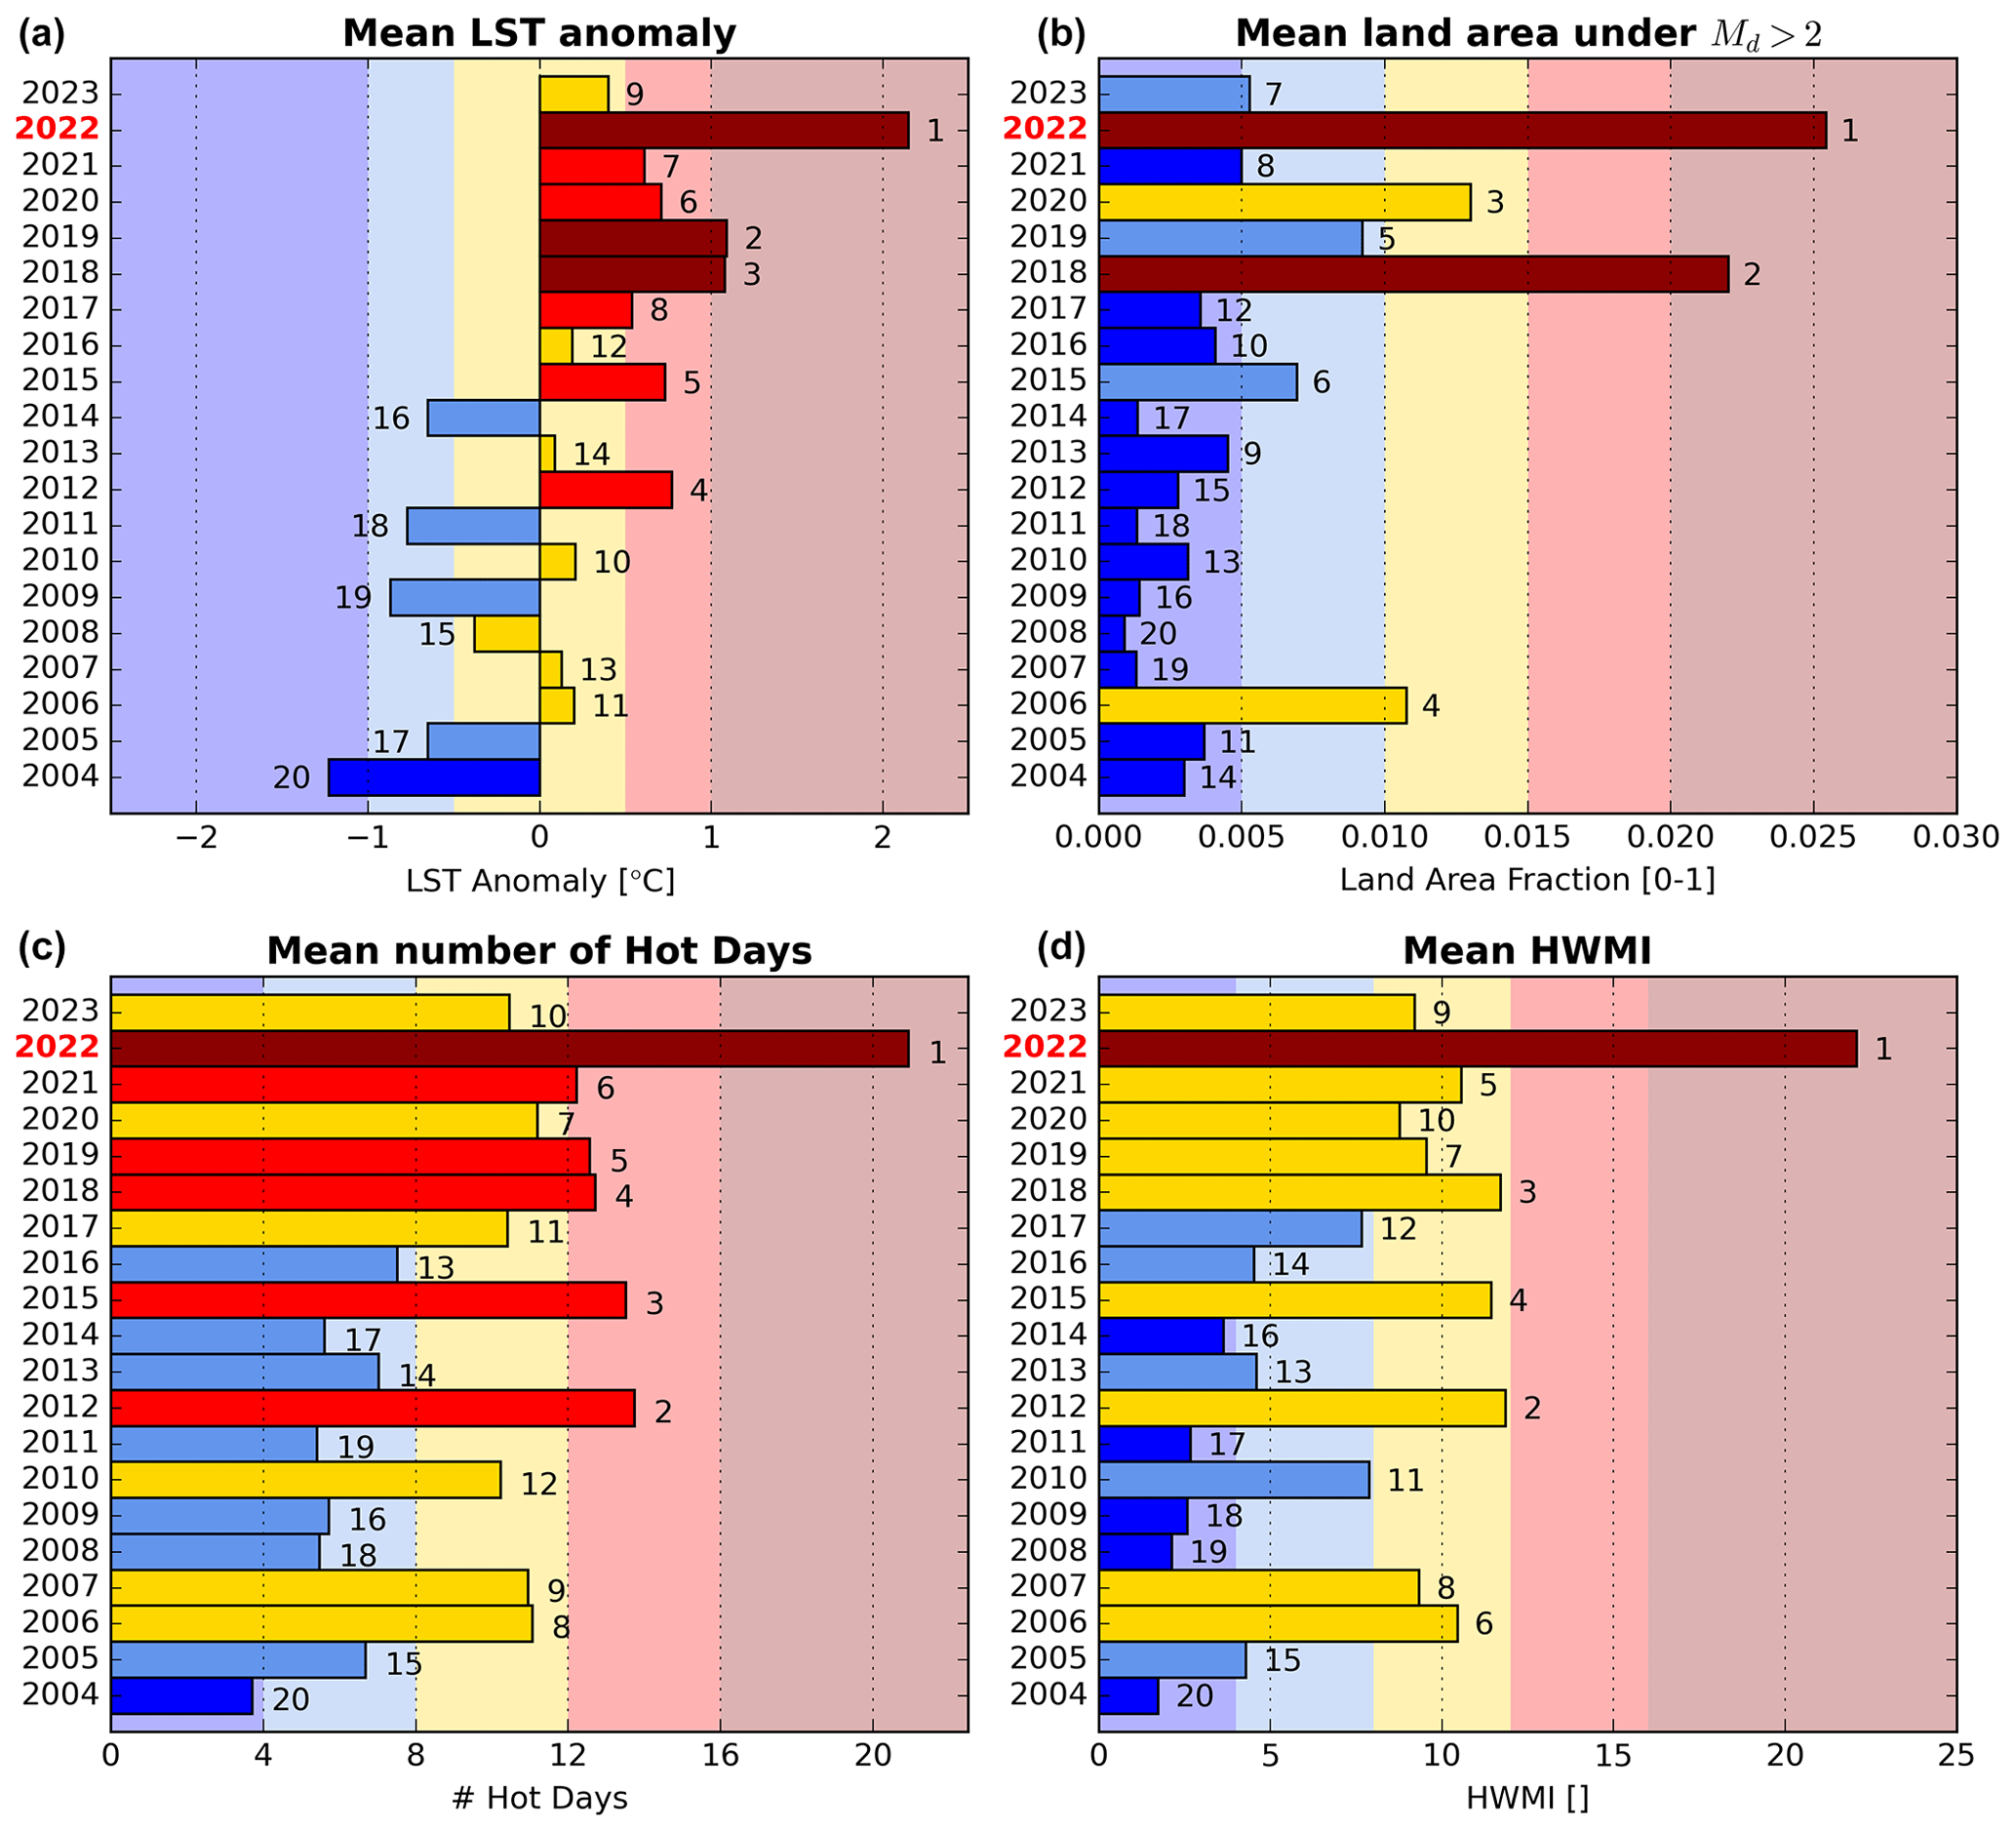
Figure 10Ranking of summers over the study period according to (a) their mean LSTMax anomaly, (b) the average fraction of area covered by extreme heat conditions (Md>2), (c) the average number of hot days and (d) the area-averaged HWMI. Colours are mainly for illustrative purposes, where each year was classified according to the severity associated with each parameter (from less severe in blue to extremely severe in dark red).
In Fig. 10, all the summers in the LST data record (2004–2023) are ranked in terms of four different heatwave metrics: (1) the spatial average of the seasonal LST anomaly, (2) the average area under extreme heat conditions (i.e. Md>2), (3) the mean number of hot days and (4) the spatial average of the summer HWMI. There are considerable disparities between the four rankings, reflecting the way different characteristics under analysis impacted Europe in each year. Nevertheless, our results show that 2022 was remarkably exceptional, independently of the ranking criterion, followed by 2018. As already discussed in Sect. 2.2, in terms of mean LSTMax anomalies, 2022 ranks in first with a mean anomaly of 2.2 °C, followed by 2019 and 2018 with a mean anomaly of 1.1 °C. The coldest year was 2004, with a mean anomaly of −1.2 °C. Even in the context of a general increase in these mean anomalies over Europe, 2022 stands out as truly exceptional. Regarding the mean area occupied by extreme heat conditions (i.e. the time average of the curves in Fig. 9), a very strong increase has been observed since 2018, with the top 3 years being 2022, 2018 and 2020. In 2022, more than 2 % of Europe was under extreme heat conditions, on average, and a similar picture was seen in 2018. In 2020 that value was just over 1 %, although with an overall lower mean temperature anomaly (ranking in sixth in the left panel). The year with the smaller average area covered by extreme heat conditions was 2008, with only 0.09 %. As for the mean number of hot days, again 2022 stands out in first place with nearly 21 hot days, for the JJA average for every land pixel over Europe. This is a very large difference towards the second in the ranking, since in 2012 around 14 hot days on average were observed. An average of 3.7 hot days were observed in 2004, the last in the ranking. Finally in terms of area-averaged HWMI, a mix between the information in the previous rankings is observed but with an evident similarity to the ranking of the number of hot days. This reinforces the idea of HWMI being an index combining all the relevant information on heatwaves, namely their magnitude and their temporal and spatial extent.
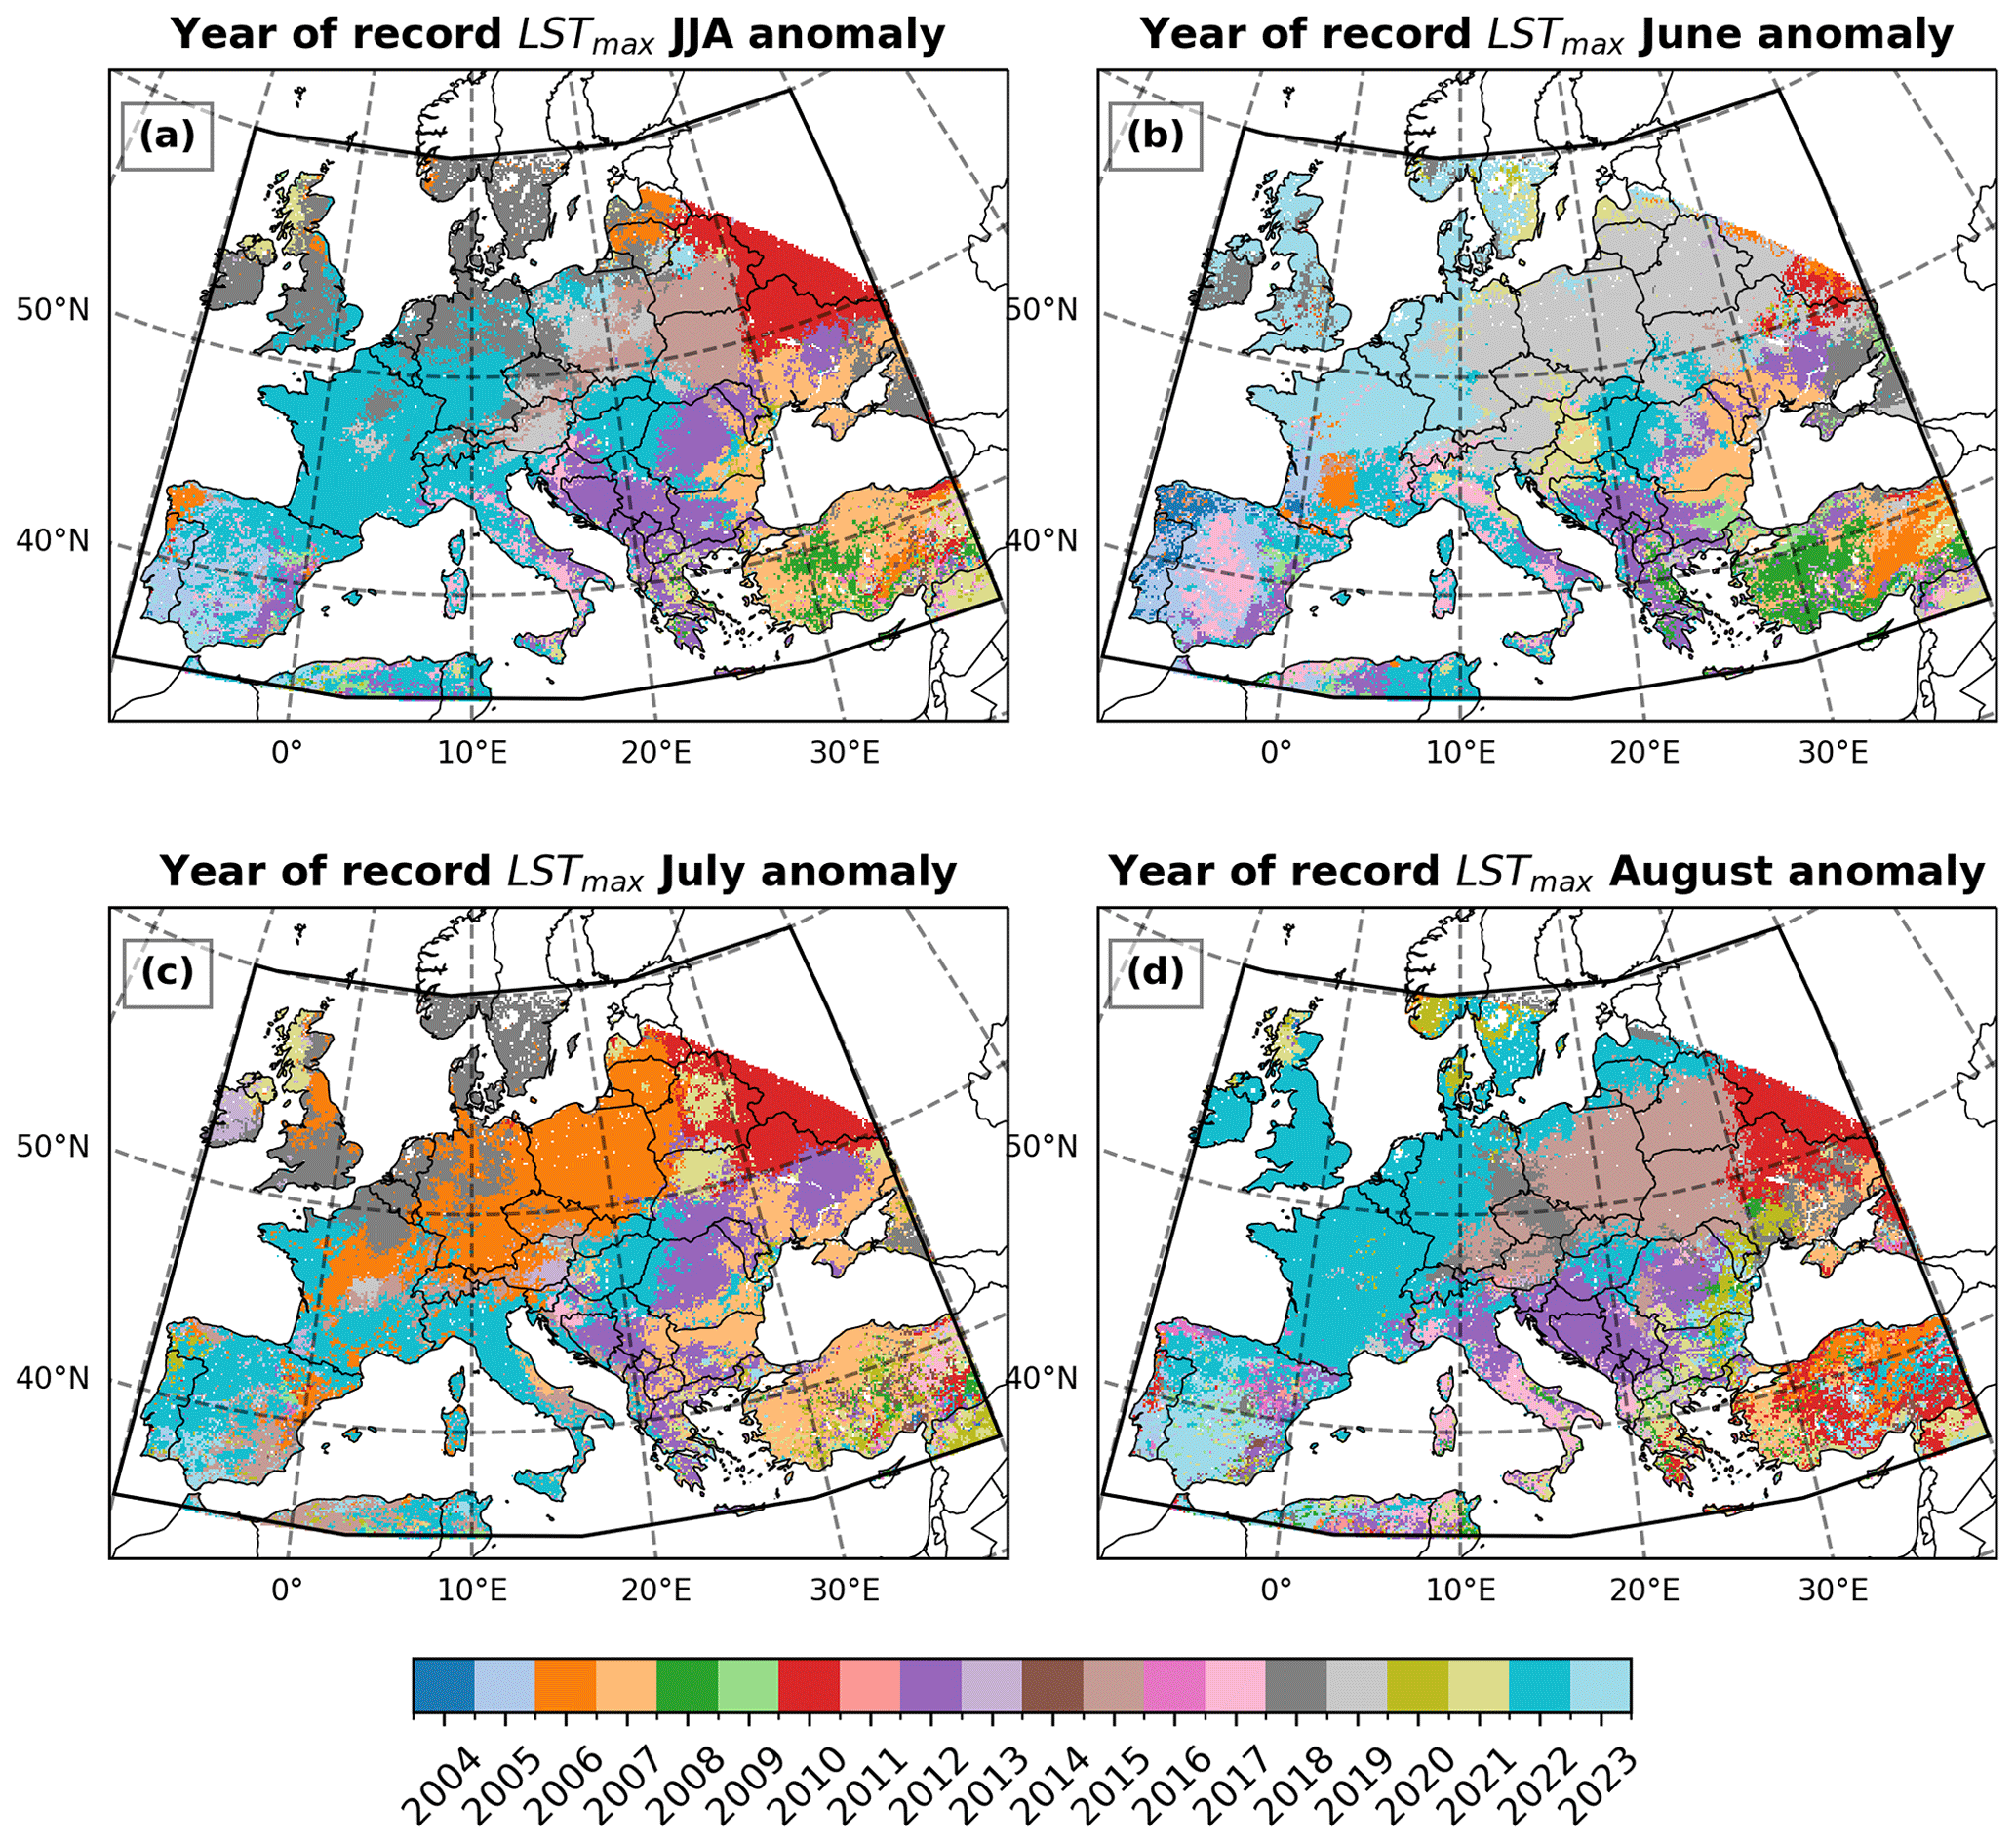
Figure 11Year where the record maximum average LSTMax occurred for the periods (a) JJA, (b) June, (c) July and (d) August.
Another way of inspecting the exceptionality of the 2022 extreme heat conditions is to look for areas where new temperature records were set, which is illustrated in Fig. 11. In the JJA anomaly, new maxima were set for large areas of northern Iberia, France, southern Germany, Italy and Hungary (in bright cyan). These areas have strong signals over the individual monthly maps as well. The 2018 (dark grey) heatwave still holds the record for large parts of north-central Europe (Hoy et al., 2020), while the 2010 (red) heatwave set the overall record over Russia (Barriopedro et al., 2011). In the June map, the 2019 (light grey) heatwave introduced records for this month over a large part of north-central Europe, while 2023 (light blue) set new records for northern France and the Benelux area. In July, 2022 (bright cyan) set new monthly records over south-central Europe and 2006 (orange) set the record for large areas from France to the Baltic countries, while in north-central Europe the record was set by the 2018 (dark grey) heatwave. In August, the year 2022 set new records for large areas from northwestern Portugal to France and the British Isles and up to the Baltic countries. The 2015 (light brown) heatwave still holds the record for August over areas such as Poland, Belarus and western Ukraine. It is worth noting that 2003 set JJA temperature records over large areas of western Europe (Sousa et al., 2020; Lhotka et al., 2018), but since that year is not within the period covered by the LSA SAF LST dataset, it does not show up in Fig. 11. This can be regarded as a caveat to this dataset, since due to its relatively short length, it does not allow for a full picture of the most relevant extreme heat events over Europe for the past couple of decades.
The year 2022 was exceptional for Europe in terms of spatial and temporal extent and in terms of the magnitude of the heat extremes that affected the continent. The dominant synoptic configuration caused unprecedented blocking, subsidence heating and warm advection into the continent, as well as a prolonged record drought from spring onwards. Although some uncertainties persist, a theoretical framework is already able to broadly explain the broad mechanisms involved in the role of the surface–atmosphere coupling in the modulation of these events. The combination of these ingredients has been key in setting the magnitude of the 2022 heatwave as well as that of other recent mega heatwaves.
The analysis presented in this study showed that the summer extreme heat conditions was unprecedented, considering the relatively short reference period. In particular, the analysis showed that this year exhibited the largest summer temperature anomaly (about 2.2 °C above the reference period median), the largest average area under extreme heat conditions (just above 2.5 % of Europe was on average under extreme heat conditions, Md>2) and the largest mean number of hot days (average of 21 d). The combined effect of these factors is accounted for by HWMI, which also translates the exceptionality of summer 2022 over Europe, with an average value of 22, which was followed in the ranking by 2012 and 2018 with a summer HWMI of 11.9 and 11.7, respectively. This study also showed that despite some areas in June and August having their highest monthly anomalies in 2023, summer 2022 as a whole remains exceptionally warm, ranking first in all considered metrics.
This study also highlights the importance of looking into LST as a complement to the information provided by T2m. The main source of T2m is surface meteorological stations (point data) which may then be interpolated into gridded datasets (such as E-OBS) or assimilated into and earth system models or reanalyses (such as ERA5). These methods introduce interpolation and model errors into the spatially continuous T2m fields. For satellite observations, spatial coverage is much higher, and therefore spatial interpolation errors are mostly absent (although there are relatively small uncertainties associated with geolocation and regridding from the original satellite observations to regular grids such as those used in this study). Furthermore, LST is more directly linked to the surface energy balance and provides extra information when compared to T2m. In this work, it was shown that when there are strong drought conditions linked with vegetation anomalies (i.e. low SWI and low FVC), differences between LSTMax and T2m anomalies are amplified, and therefore these results highlight that these observed differences may be used as proxies for surface–atmosphere coupling metrics. It should be noted however that SWI is used as input to the cloudy-sky LST retrieval. However, most of the retrievals under heatwave conditions are made under clear skies, so most of the LST signal comes from the infrared retrieval and not from the surface energy balance scheme used for cloudy-sky retrievals.
Given the physical similarities between them, the comparisons of LSTMax- and SKTMax-based metrics further reinforced the confidence of the former, not only because they compare relatively well in general but also because when they do not, there are plausible reasons for it. ERA5-Land does not rely on dynamic vegetation information, and therefore strong negative anomalies such as those reported here over central Europe and over the Hungary–Romania region are not well represented by the model. This means that surface roughness and evapotranspiration efficiency are too high in the model, leading to colder SKTs when compared to the observed LSTs. On the other hand, the cross-cutting analysis comparing LST, FVC and SWI anomalies shows a remarkable physical consistency between the observed patterns, thus reinforcing confidence in these datasets. This kind of analysis is key to fostering their usage for all sorts of climate applications, thus increasing user uptake of these datasets.
New perspectives on climate monitoring are supported by the increasing availability of high-quality satellite data records. Although the MSG-based LST data record is not still at the stage of being used to derive fully compliant climate normals (which typically use 30 years of data), it already provides useful perspectives to complement the study and monitoring of decadal surface temperature variability. These include the study of surface–atmosphere coupling within extreme heat events based on observations and diagnosing caveats in more standard datasets used for the monitoring those events.
All the datasets used in this study are openly available. The MLST-ASv2 and FVC products can be downloaded from the EUMETSAT LSA SAF Data Service (2024a, b; https://datalsasaf.lsasvcs.ipma.pt/PRODUCTS/MSG/MLST-ASv2 and https://datalsasaf.lsasvcs.ipma.pt/PRODUCTS/MSG/MTFVC/, respectively). Soil moisture data is a combination of two datasets: The H141 (https://doi.org/10.15770/EUM_SAF_H_0008, H SAF, 2000) and the H26 (https://hsaf.meteoam.it/Products/Detail?prod=H26, EUMETSAT, 2024c). The ERA5 data were retrieved from the Copernicus Climate Change Climate Data Store (https://doi.org/10.24381/cds.bd0915c6, Hersbach et al., 2023). The ERA5-Land data were retrieved from the Copernicus Climate Change Climate Data Store (https://doi.org/10.24381/cds.e2161bac, Muñoz-Sabater et al., 2019). All datasets require a simple registration before they can be downloaded.
Conceptualization and methodology: JPAM, RMC and SC. Data curation: ED and JPAM. Formal analysis: JPAM, SC, CP, RMC and ED. Original draft preparation: JPAM, RMC and SC. Review and editing: all authors.
The contact author has declared that none of the authors has any competing interests.
Publisher's note: Copernicus Publications remains neutral with regard to jurisdictional claims made in the text, published maps, institutional affiliations, or any other geographical representation in this paper. While Copernicus Publications makes every effort to include appropriate place names, the final responsibility lies with the authors.
This article is part of the special issue “Methodological innovations for the analysis and management of compound risk and multi-risk, including climate-related and geophysical hazards (NHESS/ESD/ESSD/GC/HESS inter-journal SI)”. It is not associated with a conference.
This work was performed within the framework of the LSA SAF (https://lsa-saf.eumetsat.int, last access: 26 April 2024) project, funded by EUMETSAT. Data from ERA5 and ERA5-Land were generated using Copernicus Climate Change Service information (2022). Carlos Pereira acknowledges the support from the project FRESAN (grant no. FED/2017/389-710), financed by the European Union and managed by Camões I.P. Rita M. Cardoso would like to acknowledge the financial support from the Fundação para a Ciência e a Tecnologia, I.P./MCTES, through national funds (PIDDAC) to the Instituto Dom Luiz (grant no. UIDB/50019/2020) and the project LEADING (grant no. PTDC/CTA-MET/28914/2017).
This research has been supported by the European Organisation for the Exploitation of Meteorological Satellites (LSA SAF grant); the European Commission Directorate-General for Development and Cooperation – EuropeAid (FRESAN, grant no. FED/2017/389-710); and the Fundação para a Ciência e a Tecnologia (Instituto Dom Luiz, grant no. UIDB/50019/2020; LEADING, grant no. PTDC/CTA-MET/28914/2017).
This paper was edited by Silvia De Angeli and reviewed by Gregory Duveiller and one anonymous referee.
Agathangelidis, I., Cartalis, C., Polydoros, A., Mavrakou, T., and Philippopoulos, K.: Can Satellite-Based Thermal Anomalies Be Indicative of Heatwaves? An Investigation for MODIS Land Surface Temperatures in the Mediterranean Region, Remote Sens., 14, 3139, https://doi.org/10.3390/RS14133139, 2022.
Amengual, A., Homar, V., Romero, R., Brooks, H. E., Ramis, C., Gordaliza, M., and Alonso, S.: Projections of heat waves with high impact on human health in Europe, Global Planet. Change, 119, 71–84, https://doi.org/10.1016/J.GLOPLACHA.2014.05.006, 2014.
Barriopedro, D., Fischer, E. M., Luterbacher, J., Trigo, R. M., and García-Herrera, R.: The hot summer of 2010: Redrawing the temperature record map of Europe, Science, 332, 220–224, https://doi.org/10.1126/science.1201224, 2011.
Barriopedro, D., García-Herrera, R., Ordóñez, C., Miralles, D. G., and Salcedo-Sanz, S.: Heat Waves: Physical Understanding and Scientific Challenges, Rev. Geophys., 61, e2022RG000780, https://doi.org/10.1029/2022rg000780, 2023.
Barrios, J. M., Arboleda, A., Dutra, E., Trigo, I., and Gellens-Meulenberghs, F.: Evapotranspiration and surface energy fluxes across Europe, Africa and Eastern South America throughout the operational life of the Meteosat second generation satellite, Geosci. Data J., 1–19, https://doi.org/10.1002/gdj3.235, online first, 2024.
Bieli, M., Pfahl, S., and Wernli, H.: A Lagrangian investigation of hot and cold temperature extremes in Europe, Q. J. Roy. Meteor. Soc., 141, 98–108, https://doi.org/10.1002/QJ.2339, 2015.
Bojinski, S., Verstraete, M., Peterson, T. C., Richter, C., Simmons, A., and Zemp, M.: The concept of essential climate variables in support of climate research, applications, and policy, B. Am. Meteorol. Soc., 95, 1431–1443, https://doi.org/10.1175/BAMS-D-13-00047.1, 2014.
Brunner, L., Schaller, N., Anstey, J., Sillmann, J., and Steiner, A. K.: Dependence of Present and Future European Temperature Extremes on the Location of Atmospheric Blocking, Geophys. Res. Lett., 45, 6311–6320, https://doi.org/10.1029/2018GL077837, 2018.
Cardoso, R. M., Soares, P. M. M., Lima, D. C. A., and Miranda, P. M. A.: Mean and extreme temperatures in a warming climate: EURO CORDEX and WRF regional climate high-resolution projections for Portugal, Clim. Dynam., 52, 129–157, https://doi.org/10.1007/s00382-018-4124-4, 2019.
Chan, P. W., Catto, J. L., and Collins, M.: Heatwave–blocking relation change likely dominates over decrease in blocking frequency under global warming, NPJ Clim. Atmos. Sci., 5, 1–8, https://doi.org/10.1038/s41612-022-00290-2, 2022.
Christidis, N., Jones, G. S., and Stott, P. A.: Dramatically increasing chance of extremely hot summers since the 2003 European heatwave, Nat. Clim. Change, 5, 46–50, https://doi.org/10.1038/NCLIMATE2468, 2015.
Cornes, R. C., van der Schrier, G., van den Besselaar, E. J. M., and Jones, P. D.: An Ensemble Version of the E-OBS Temperature and Precipitation Data Sets, J. Geophys. Res.-Atmos., 123, 9391–9409, https://doi.org/10.1029/2017JD028200, 2018.
Díaz, J., Linares, C., Carmona, R., Russo, A., Ortiz, C., Salvador, P., and Trigo, R. M.: Saharan dust intrusions in Spain: Health impacts and associated synoptic conditions, Environ. Res., 156, 455–467, https://doi.org/10.1016/J.ENVRES.2017.03.047, 2017.
Duveiller, G., Pickering, M., Muñoz-Sabater, J., Caporaso, L., Boussetta, S., Balsamo, G., and Cescatti, A.: Getting the leaves right matters for estimating temperature extremes, Geosci. Model Dev., 16, 7357–7373, https://doi.org/10.5194/gmd-16-7357-2023, 2023.
EUMETSAT: LSA SAF Data Service, MLST-ASv2, https://datalsasaf.lsasvcs.ipma.pt/PRODUCTS/MSG/MLST-ASv2, last access: 26 April 2024a.
EUMETSAT: LSA SAF Data Service, MTFVC, https://datalsasaf.lsasvcs.ipma.pt/PRODUCTS/MSG/MTFVC/, last access: 26 April 2024b.
EUMETSAT: H Saf, RZSM-ASCAT-NRT-10 (H26), https://hsaf.meteoam.it/Products/Detail?prod=H26, last access: 26 April 2024c.
Fairbairn, D. and de Rosnay, P.: Algorithm Theoretical Baseline Document (ATBD) H141 and H142 – Soil Wetness Index in the roots region Data Record and Offline extension, H SAF, 31 pp., https://hsaf.meteoam.it/CaseStudy/GetDocumentUserDocument?fileName=H141_H142_ATBD.pdf&tipo=ATBD (last access: 26 April 2024), 2020.
Fairbairn, D. and de Rosnay, P.: Algorithm Theoretical Baseline Document (ATBD) H26– Soil Wetness Index in the roots region by ASCAT soil moisture assimilation, H SAF, 27 pp., https://hsaf.meteoam.it/CaseStudy/GetDocumentUserDocument?fileName=h26_atbd_v2.pdf&tipo=ATBD (last access: 26 April 2024), 2021.
FAO: Crop Prospects and Food Situation Quarterly Global Report no. 4, FAO, Rome, https://doi.org/10.4060/cc3233en, 2022.
Furusho-Percot, C., Goergen, K., Hartick, C., Poshyvailo-Strube, L., and Kollet, S.: Groundwater Model Impacts Multiannual Simulations of Heat Waves, Geophys. Res. Lett., 49, e2021GL096781, https://doi.org/10.1029/2021GL096781, 2022.
Galanaki, E., Giannaros, C., Kotroni, V., Lagouvardos, K., and Papavasileiou, G.: Spatio-Temporal Analysis of Heatwaves Characteristics in Greece from 1950 to 2020, Climate, 11, 5, https://doi.org/10.3390/CLI11010005, 2022.
García-Haro, F. J., Camacho, F., Martínez, B., Campos-Taberner, M., Fuster, B., Sánchez-Zapero, J., and Gilabert, M. A.: Climate data records of vegetation variables from geostationary SEVIRI/MSG data: Products, algorithms and applications, Remote Sens.-Basel, 11, 2103, https://doi.org/10.3390/rs11182103, 2019.
Garcia-Herrera, R., Díaz, J., Trigo, R. M., Luterbacher, J., and Fischer, E. M.: A Review of the European Summer Heat Wave of 2003, Crit. Rev. Env. Sci. Te., 40, 267–306, https://doi.org/10.1080/10643380802238137, 2010.
Good, E. J., Aldred, F. M., Ghent, D. J., Veal, K. L., and Jimenez, C.: An Analysis of the Stability and Trends in the LST_cci Land Surface Temperature Datasets Over Europe, Earth Space Sci., 9, e2022EA002317, https://doi.org/10.1029/2022EA002317, 2022.
Göttsche, F. M., Olesen, F. S., Trigo, I. F., Bork-Unkelbach, A., and Martin, M. A.: Long term validation of land surface temperature retrieved from MSG/SEVIRI with continuous in-situ measurements in Africa, Remote Sens.-Basel, 8, 410, https://doi.org/10.3390/rs8050410, 2016.
Gouveia, C. M., Martins, J. P. A., Russo, A., Durão, R., and Trigo, I. F.: Monitoring Heat Extremes across Central Europe Using Land Surface Temperature Data Records from SEVIRI/MSG, Remote Sens.-Basel, 14, 3470, https://doi.org/10.3390/RS14143470/S1, 2022.
Hersbach, H., Bell, B., Berrisford, P., Hirahara, S., Horányi, A., Muñoz-Sabater, J., Nicolas, J., Peubey, C., Radu, R., Schepers, D., Simmons, A., Soci, C., Abdalla, S., Abellan, X., Balsamo, G., Bechtold, P., Biavati, G., Bidlot, J., Bonavita, M., De Chiara, G., Dahlgren, P., Dee, D., Diamantakis, M., Dragani, R., Flemming, J., Forbes, R., Fuentes, M., Geer, A., Haimberger, L., Healy, S., Hogan, R. J., Hólm, E., Janisková, M., Keeley, S., Laloyaux, P., Lopez, P., Lupu, C., Radnoti, G., de Rosnay, P., Rozum, I., Vamborg, F., Villaume, S., and Thépaut, J.-N.: The ERA5 global reanalysis, Q. J. Roy. Meteor. Soc., 146, 1999–2049, https://doi.org/10.1002/qj.3803, 2020.
Hersbach, H., Bell, B., Berrisford, P., Biavati, G., Horányi, A., Muñoz Sabater, J., Nicolas, J., Peubey, C., Radu, R., Rozum, I., Schepers, D., Simmons, A., Soci, C., Dee, D., and Thépaut, J.-N.: ERA5 hourly data on pressure levels from 1940 to present, Copernicus Climate Change Service (C3S) Climate Data Store (CDS) [data set], https://doi.org/10.24381/cds.bd0915c6, 2023.
Hoek van Dijke, A. J., Mallick, K., Schlerf, M., Machwitz, M., Herold, M., and Teuling, A. J.: Examining the link between vegetation leaf area and land–atmosphere exchange of water, energy, and carbon fluxes using FLUXNET data, Biogeosciences, 17, 4443–4457, https://doi.org/10.5194/bg-17-4443-2020, 2020.
Hoy, A., Hänsel, S., Maugeri, M., and Bergakademie Freiberg, T.: An endless summer: 2018 heat episodes in Europe in the context of secular temperature variability and change, Int. J. Climatol., 40, 15, https://doi.org/10.1002/joc.6582, 2020.
Hulley, G. C. and Ghent, D.: Taking the temperature of the Earth: steps towards integrated understanding of variability and change, edited by: Hulley, G. and Ghent, D., Elsevier Inc., https://doi.org/10.1016/C2017-0-01600-2, 2019.
H SAF: Scatterometer Root Zone Soil Moisture (RZSM) Data Record 10km resolution – Multimission, EUMETSAT SAF on Support to Operational Hydrology and Water Management, https://doi.org/10.15770/EUM_SAF_H_0008, 2020.
Hundhausen, M., Feldmann, H., Laube, N., and Pinto, J. G.: Future heat extremes and impacts in a convection-permitting climate ensemble over Germany, Nat. Hazards Earth Syst. Sci., 23, 2873–2893, https://doi.org/10.5194/nhess-23-2873-2023, 2023.
Johannsen, F., Ermida, S., Martins, J. P. A., Trigo, I. F., Nogueira, M., and Dutra, E.: Cold Bias of ERA5 Summertime Daily Maximum Land Surface Temperature over Iberian Peninsula, Remote Sens., 11, 2570, https://doi.org/10.3390/rs11212570, 2019.
Juza, M., Fernández-Mora, A., and Tintoré, J.: Sub-Regional Marine Heat Waves in the Mediterranean Sea From Observations: Long-Term Surface Changes, Sub-Surface and Coastal Responses, Front. Mar. Sci., 9, 785771, https://doi.org/10.3389/FMARS.2022.785771, 2022.
Katul, G. G., Oren, R., Manzoni, S., Higgins, C., and Parlange, M. B.: Evapotranspiration: A process driving mass transport and energy exchange in the soil-plant-atmosphere-climate system, Rev. Geophys., 50, RG3002, https://doi.org/10.1029/2011RG000366, 2012.
Kornhuber, K., Petoukhov, V., Petri, S., Rahmstorf, S., and Coumou, D.: Evidence for wave resonance as a key mechanism for generating high-amplitude quasi-stationary waves in boreal summer, Clim. Dynam., 49, 1961–1979, https://doi.org/10.1007/S00382-016-3399-6/FIGURES/11, 2017.
Lhotka, O., Kyselý, J., and Farda, A.: Climate change scenarios of heat waves in Central Europe and their uncertainties, Theor. Appl. Climatol., 131, 1043–1054, https://doi.org/10.1007/S00704-016-2031-3/FIGURES/9, 2018.
Li, Z.-L., Tang, B.-H., Wu, H., Ren, H., Yan, G., Wan, Z., Trigo, I. F., and Sobrino, J. A.: Satellite-derived land surface temperature: Current status and perspectives, Remote Sens. Environ., 131, 14–37, https://doi.org/10.1016/j.rse.2012.12.008, 2013.
Lin, C., Kjellström, E., Wilcke, R. A. I., and Chen, D.: Present and future European heat wave magnitudes: climatologies, trends, and their associated uncertainties in GCM-RCM model chains, Earth Syst. Dynam., 13, 1197–1214, https://doi.org/10.5194/esd-13-1197-2022, 2022.
Manning, C., Widmann, M., Bevacqua, E., Van Loon, A. F., Maraun, D., and Vrac, M.: Soil Moisture Drought in Europe: A Compound Event of Precipitation and Potential Evapotranspiration on Multiple Time Scales, J. Hydrometeorol., 19, 1255–1271, https://doi.org/10.1175/JHM-D-18-0017.1, 2018.
Martins, J. P. A. and Dutra, E.: Validation Report for All Sky Land Surface Temperature (MLST-AS, LSA-005), LSA SAF, https://nextcloud.lsasvcs.ipma.pt/s/dYjdyiMXZTt8sP4?path=%2FVR-Validation_Report (last access: 26 April 2024), 2022.
Martins, J. P. A., Trigo, I. I. F., Freitas, S. C., and Simões, N.: Algorithm Theoretical Basis Document for MSG All-Sky Land Surface Temperature (MLST-AS), LSA SAF, 29 pp., https://nextcloud.lsasvcs.ipma.pt/s/dYjdyiMXZTt8sP4?path=%2FATBD-Algorithm_Theoretial_Basis_Document (last access: 26 April 2024), 2018.
Martins, J. P. A., Trigo, I. F., Ghilain, N., Jimenez, C., Göttsche, F.-M., Ermida, S. L., Olesen, F.-S., Gellens-Meulenberghs, F., and Arboleda, A.: An All-Weather Land Surface Temperature Product Based on MSG/SEVIRI Observations, Remote Sens.-Basel, 11, 3044, https://doi.org/10.3390/rs11243044, 2019.
Meehl, G. A. and Tebaldi, C.: More intense, more frequent, and longer lasting heat waves in the 21st century, Science, 305, 994–997, https://doi.org/10.1126/science.1098704, 2004.
Mildrexler, D. J., Zhao, M., and Running, S. W.: A global comparison between station air temperatures and MODIS land surface temperatures reveals the cooling role of forests, J. Geophys. Res.-Biogeo., 116, G03025, https://doi.org/10.1029/2010JG001486, 2011.
Miralles, D. G., Teuling, A. J., Van Heerwaarden, C. C., and De Arellano, J. V. G.: Mega-heatwave temperatures due to combined soil desiccation and atmospheric heat accumulation, Nat. Geosci., 7, 345–349, https://doi.org/10.1038/ngeo2141, 2014.
Miralles, D. G., Gentine, P., Seneviratne, S. I., and Teuling, A. J.: Land–atmospheric feedbacks during droughts and heatwaves: state of the science and current challenges, Ann. NY. Acad. Sci., 1436, 19–35, https://doi.org/10.1111/NYAS.13912, 2019.
Molina, M. O., Sánchez, E., and Gutiérrez, C.: Future heat waves over the Mediterranean from an Euro-CORDEX regional climate model ensemble, Sci. Rep., 10, 8801, https://doi.org/10.1038/s41598-020-65663-0, 2020.
Morlot, M., Russo, S., Feyen, L., and Formetta, G.: Trends in heat and cold wave risks for the Italian Trentino-Alto Adige region from 1980 to 2018, Nat. Hazards Earth Syst. Sci., 23, 2593–2606, https://doi.org/10.5194/nhess-23-2593-2023, 2023.
Muñoz Sabater, J.: ERA5-Land hourly data from 1950 to present, Copernicus Climate Change Service (C3S) Climate Data Store (CDS) [data set], https://doi.org/10.24381/cds.e2161bac, 2019.
Muñoz-Sabater, J., Dutra, E., Agustí-Panareda, A., Albergel, C., Arduini, G., Balsamo, G., Boussetta, S., Choulga, M., Harrigan, S., Hersbach, H., Martens, B., Miralles, D. G., Piles, M., Rodríguez-Fernández, N. J., Zsoter, E., Buontempo, C., and Thépaut, J.-N.: ERA5-Land: a state-of-the-art global reanalysis dataset for land applications, Earth Syst. Sci. Data, 13, 4349–4383, https://doi.org/10.5194/essd-13-4349-2021, 2021.
Nogueira, M., Albergel, C., Boussetta, S., Johannsen, F., Trigo, I. F., Ermida, S. L., Martins, J. P. A., and Dutra, E.: Role of vegetation in representing land surface temperature in the CHTESSEL (CY45R1) and SURFEX-ISBA (v8.1) land surface models: a case study over Iberia, Geosci. Model Dev., 13, 3975–3993, https://doi.org/10.5194/gmd-13-3975-2020, 2020.
Nogueira, M., Boussetta, S., Balsamo, G., Albergel, C., Trigo, I. F., Johannsen, F., Miralles, D. G., and Dutra, E.: Upgrading Land-Cover and Vegetation Seasonality in the ECMWF Coupled System: Verification With FLUXNET Sites, METEOSAT Satellite Land Surface Temperatures, and ERA5 Atmospheric Reanalysis, J. Geophys. Res.-Atmos., 126, e2020JD034163, https://doi.org/10.1029/2020JD034163, 2021.
Pérez-Planells, L., Ghent, D., Ermida, S., Martin, M., and Göttsche, F. M.: Retrieval Consistency between LST CCI Satellite Data Products over Europe and Africa, Remote Sens.-Basel, 15, 3281, https://doi.org/10.3390/rs15133281, 2023.
Petrovic, D., Fersch, B., and Kunstmann, H.: Heat wave characteristics: evaluation of regional climate model performances for Germany, Nat. Hazards Earth Syst. Sci., 24, 265–289, https://doi.org/10.5194/nhess-24-265-2024, 2024.
Reiners, P., Sobrino, J., and Kuenzer, C.: Satellite-Derived Land Surface Temperature Dynamics in the Context of Global Change – A Review, Remote Sens., 15, 1857, https://doi.org/10.3390/rs15071857, 2023.
Rousi, E., Kornhuber, K., Beobide-Arsuaga, G., Luo, F., and Coumou, D.: Accelerated western European heatwave trends linked to more-persistent double jets over Eurasia, Nat. Commun., 13 1–11, https://doi.org/10.1038/s41467-022-31432-y, 2022.
Russo, S., Sillmann, J., and Fischer, E. M.: Top ten European heatwaves since 1950 and their occurrence in the coming decades, Environ. Res. Lett., 10, 124003, https://doi.org/10.1088/1748-9326/10/12/124003, 2015.
Schaller, N., Sillmann, J., Anstey, J., Fischer, E. M., Grams, C. M., and Russo, S.: Influence of blocking on Northern European and Western Russian heatwaves in large climate model ensembles, Environ. Res. Lett., 13, 054015, https://doi.org/10.1088/1748-9326/AABA55, 2018.
Schiermeier, Q.: Droughts, heatwaves and floods: How to tell when climate change is to blame, Nature, 560, 20–23, 2018.
Seneviratne, S. I., Zhang, X., Adnan, M., Badi, W., Dereczynski, C., Di Luca, A., Vicente-Serrano, S. M., Wehner, M., and Zhou, B.: Weather and climate extreme events in a changing climate, in: Climate Change 2021: The Physical Science Basis: Working Group I contribution to the Sixth Assessment Report of the Intergovernmental Panel on Climate Change, 1513–1766, https://doi.org/10.1017/9781009157896.013, 2021.
Sousa, P. M., Barriopedro, D., Ramos, A. M., García-Herrera, R., Espírito-Santo, F., and Trigo, R. M.: Saharan air intrusions as a relevant mechanism for Iberian heatwaves: The record breaking events of August 2018 and June 2019, Weather Clim. Extrem., 26, 100224, https://doi.org/10.1016/J.WACE.2019.100224, 2019.
Sousa, P. M., Barriopedro, D., García-Herrera, R., Ordóñez, C., Soares, P. M. M., and Trigo, R. M.: Distinct influences of large-scale circulation and regional feedbacks in two exceptional 2019 European heatwaves, Commun. Earth Environ., 1, 1–13, https://doi.org/10.1038/s43247-020-00048-9, 2020.
Suarez-Gutierrez, L., Müller, W. A., Li, C., and Marotzke, J.: Dynamical and thermodynamical drivers of variability in European summer heat extremes, Clim. Dynam., 54, 4351–4366, https://doi.org/10.1007/S00382-020-05233-2/FIGURES/5, 2020.
Sutanto, S. J., Vitolo, C., Di Napoli, C., D'Andrea, M., and Van Lanen, H. A. J.: Heatwaves, droughts, and fires: Exploring compound and cascading dry hazards at the pan-European scale, Environ. Int., 134, 105276, https://doi.org/10.1016/j.envint.2019.105276, 2020.
Trigo, I. F., Dacamara, C. C., Viterbo, P., Roujean, J.-L., Olesen, F., Barroso, C., Camacho-de-Coca, F., Carrer, D., Freitas, S. C., García-Haro, J., Geiger, B., Gellens-Meulenberghs, F., Ghilain, N., Meliá, J., Pessanha, L., Siljamo, N., and Arboleda, A.: The Satellite Application Facility for Land Surface Analysis, Int. J. Remote Sens., 32, 2725–2744, https://doi.org/10.1080/01431161003743199, 2011.
Trigo, I. F., Ermida, S. L., Martins, J. P. A., Gouveia, C. M., Göttsche, F. M., and Freitas, S. C.: Validation and consistency assessment of land surface temperature from geostationary and polar orbit platforms: SEVIRI/MSG and AVHRR/Metop, ISPRS J. Photogramm., 175, 282–297, https://doi.org/10.1016/J.ISPRSJPRS.2021.03.013, 2021.
Wan, Z.: New refinements and validation of the collection-6 MODIS land-surface temperature/emissivity product, Remote Sens. Environ., 140, 36–45, https://doi.org/10.1016/j.rse.2013.08.027, 2014.
Wang, Y. R., Hessen, D. O., Samset, B. H., and Stordal, F.: Evaluating global and regional land warming trends in the past decades with both MODIS and ERA5-Land land surface temperature data, Remote Sens. Environ., 280, 113181, https://doi.org/10.1016/J.RSE.2022.113181, 2022.
Xu, Z., FitzGerald, G., Guo, Y., Jalaludin, B., and Tong, S.: Impact of heatwave on mortality under different heatwave definitions: A systematic review and meta-analysis, Environ. Int., 89, 193–203, https://doi.org/10.1016/j.envint.2016.02.007, 2016.
Zaitchik, B. F., Macalady, A. K., Bonneau, L. R., and Smith, R. B.: Europe's 2003 heat wave: a satellite view of impacts and land–atmosphere feedbacks, Int. J. Climatol., 26, 743–769, https://doi.org/10.1002/JOC.1280, 2006.
Zhang, R., Sun, C., Zhu, J., Zhang, R., and Li, W.: Increased European heat waves in recent decades in response to shrinking Arctic sea ice and Eurasian snow cover, NPJ Clim. Atmos. Sci., 3, 1–9, https://doi.org/10.1038/s41612-020-0110-8, 2020.
Zhang, X., Hegerl, G., Zwiers, F. W., and Kenyon, J.: Avoiding inhomogeneity in percentile-based indices of temperature extremes, J. Climate, 18, 1641–1651, https://doi.org/10.1175/JCLI3366.1, 2005.
Zscheischler, J., Westra, S., Van Den Hurk, B. J. J. M., Seneviratne, S. I., Ward, P. J., Pitman, A., Aghakouchak, A., Bresch, D. N., Leonard, M., Wahl, T., and Zhang, X.: Future climate risk from compound events, Nat. Clim. Change, 8, 469–477, https://doi.org/10.1038/s41558-018-0156-3, 2018.
Zscheischler, J., Martius, O., Westra, S., Bevacqua, E., Raymond, C., Horton, R. M., van den Hurk, B., AghaKouchak, A., Jézéquel, A., Mahecha, M. D., Maraun, D., Ramos, A. M., Ridder, N. N., Thiery, W., and Vignotto, E.: A typology of compound weather and climate events, Nat. Rev. Earth Environ., 1, 333–347, https://doi.org/10.1038/s43017-020-0060-z, 2020.