the Creative Commons Attribution 4.0 License.
the Creative Commons Attribution 4.0 License.
 | 30 Apr 2024
Analysis of the effects of urban micro-scale vulnerabilities on tsunami evacuation using an agent-based model – case study in the city of Iquique, Chile
Rodrigo Cienfuegos
Gonzalo Álvarez
Jorge León
Alejandro Urrutia
Sebastián Castro
The occurrence of mega-tsunamis over the last couple of decades has greatly increased the efforts of the research community and practitioners to work hand in hand to reduce risks from these highly destructive threats. Protecting the population through evacuation is the best alternative for avoiding loss of life in the wake of the occurrence of a tsunamigenic earthquake. Therefore, guaranteeing the proper state of evacuation routes is very important to ensuring appropriate movement to the safe zones. This study carries out a detailed analysis of possible evacuation scenarios, considering the actual state of the escape routes of Iquique, a Chilean city prone to tsunamis, with a substantial number of urban micro-scale vulnerabilities, i.e., elements that obstruct or complicate pedestrian flow. The quantification of the delay in evacuation processes resulting from the presence of urban micro-vulnerabilities is carried out through micro-scale agent-based model (ABM) simulations. In addition, these results are integrated with high-resolution tsunami inundation simulations, allowing for an estimation of the potential number of people that the tsunami may reach under different scenarios by emulating the dynamics and behavior of the population and the decision-making regarding the starting time of the evacuation.
- Article
(8809 KB) - Full-text XML
- Companion paper
- BibTeX
- EndNote


Tsunamis are infrequent natural phenomena capable of triggering large human and material losses in coastal areas, as shown during the last 20 years by disasters like the Indian Ocean tsunami in 2004 (with over 200 000 deaths); the 2011 event in Tōhoku, Japan (roughly 20 000 victims); and tsunami catastrophes with fewer casualties including Chile (2010, 2014, and 2015), Indonesia (2010 and 2018), and Tonga (2022). Significant progress has been achieved in tsunami risk forecasting over the last few decades, with faster and more robust methodologies to estimate earthquake parameters and tsunamigenic potential (e.g., Gusman and Tanioka, 2014; Melgar and Bock, 2015; Crowell et al., 2016). Moreover, early warning systems have benefited from expanded networks for direct sea surface observations, both in deep water and on the coast (e.g., Wächter et al., 2012; Mulia and Satake, 2020; Catalan et al., 2020), and from new tsunami forecasting models, constrained with near-real-time data assimilation methods to provide fast and accurate assessment of tsunami wave propagation (e.g., Maeda et al., 2015; Wang et al., 2017; Navarrete et al., 2020).
The advances in tsunami science have led to more robust strategies and actions for risk reduction (Suppasri et al., 2013; Tsimopoulou et al., 2013; Koshimura and Shuto, 2015; Khew et al., 2015). These include “hard” countermeasures aimed at avoiding or mitigating tsunami inundation in urbanized areas (e.g., seawalls, breakwaters, floodgates, and control forests) and “soft” strategies focused on education and policy. Examples of this latter approach comprise, for instance, land-use and built-environment planning and early warning and emergency management systems. Among hard and soft strategies, evacuation has been underlined as the most important and effective method for saving human lives during a tsunami (Shuto, 2005; Suppasri et al., 2013). In recent years, researchers have made significant progresses in tsunami evacuation studies developing computer-based models for dynamic simulations (Aguilar and Wijerathne, 2016; Kitamura et al., 2020; León et al., 2020; Makinoshima et al., 2016, 2018; Mas et al., 2015; Mostafizi et al., 2017; Taubenböck et al., 2009; Wang et al., 2016; Wang and Jia, 2021), analyses of the evacuees' behaviors during past emergencies (Makinoshima et al., 2020; Charnkol and Tanaboriboon, 2006; Kubisch et al., 2020), and analyses of how geographical and built-environment attributes can contribute to the success (or failure) of evacuation processes (Allan et al., 2013; León et al., 2022; Tumini et al., 2017; Villagra et al., 2014; Villagra and Quintana, 2017). Along these lines, authors including León et al. (2020) and Álvarez et al. (2018) have underlined the need for carrying out spatially detailed surveys of the actual physical conditions that evacuees might find while they are undertaking evacuation and for analyzing how these features can influence this process. In particular, Álvarez et al. (2018) conducted one such analysis in the tsunami-prone city of Iquique, Chile, where they found that some of the designated evacuation routes could be obstructed for up to 20 % of their available evacuation space. This was the outcome of existing “micro-vulnerabilities”, i.e., human-scale obstacles capable of impeding pedestrian displacements, like parked cars, street vendors, and restaurant tables located on sidewalks.
In this article we draw upon the work of Álvarez et al. (2018) to develop a dynamic analysis of how the existing micro-vulnerabilities in Iquique, Chile, could impact the expected evacuation times and success rates during two tsunami scenarios. To do this, we use an agent-based computer model originally developed and validated by Poulos et al. (2018) (capable of examining the spatial interactions between the evacuees considering the urban environment), coupled with high-resolution tsunami flooding simulations generated by two different earthquakes: Mw 8.4 and Mw 9.0. Our findings and methods (which can be applied in other tsunami-prone contexts around the globe) can support tsunami risk mitigation in two complementary ways. First, they deliver spatially detailed outcomes about the actual conditions of evacuation routes; this scale of analysis is not typically addressed by evacuation analyses, and our findings could guide specific risk-reduction policies for improving the evacuation qualities of the urban built environment. Secondly, emergency management stakeholders could use our findings for improved evacuation planning and training, as they show routes’ further characteristics beyond their length, origin, and destination, therefore helping to recommend one of them. For instance, two or more designed routes that are in the same urban area and have similar lengths can have dissimilar expected evacuation times and safety conditions due to the existing micro-vulnerabilities along them.
The article is organized as follows: we first summarize the evidence of high seismic hazard in the study area, suggesting the possible existence of a high risk of tsunami evacuation; secondly, we present the models and computational tools that we use to study tsunami evacuation processes; and then the main results and a discussion of their implications are presented, followed by concluding remarks and recommendations.
The Peru–Chile Trench is known for being a zone of convergence between the Nazca and South American plates that has high seismic activity. The most notable seismic events registered in the region in recent centuries include the 1868 Arica and 1877 Iquique earthquakes, both of magnitudes estimated at around Mw 8.8 and followed by destructive tsunamis (Lomnitz, 2004). The so-called “Norte Grande” of Chile, located between the Chile–Peru border and the peninsula of Mejillones near the city of Antofagasta (Fig. 1), has received special attention owing to the existence of a seismic gap with high accumulation of elastic deformation (Comte and Pardo, 1991; Chlieh et al., 2011; Métois et al., 2013). Even though destructive earthquakes have been nucleated in the area over the last 60 years (Mw 7.4 1967 and Mw 7.7 2007 near Tocopilla and the Mw 8.2 Iquique earthquake in 2014), they represent only a small fraction of the accumulated deformation (Catalán et al., 2015; Yáñez-Cuadra et al., 2022), which means that there is enough potential seismic energy to produce a major tsunamigenic subduction earthquake (Hayes et al., 2014; González et al., 2020).
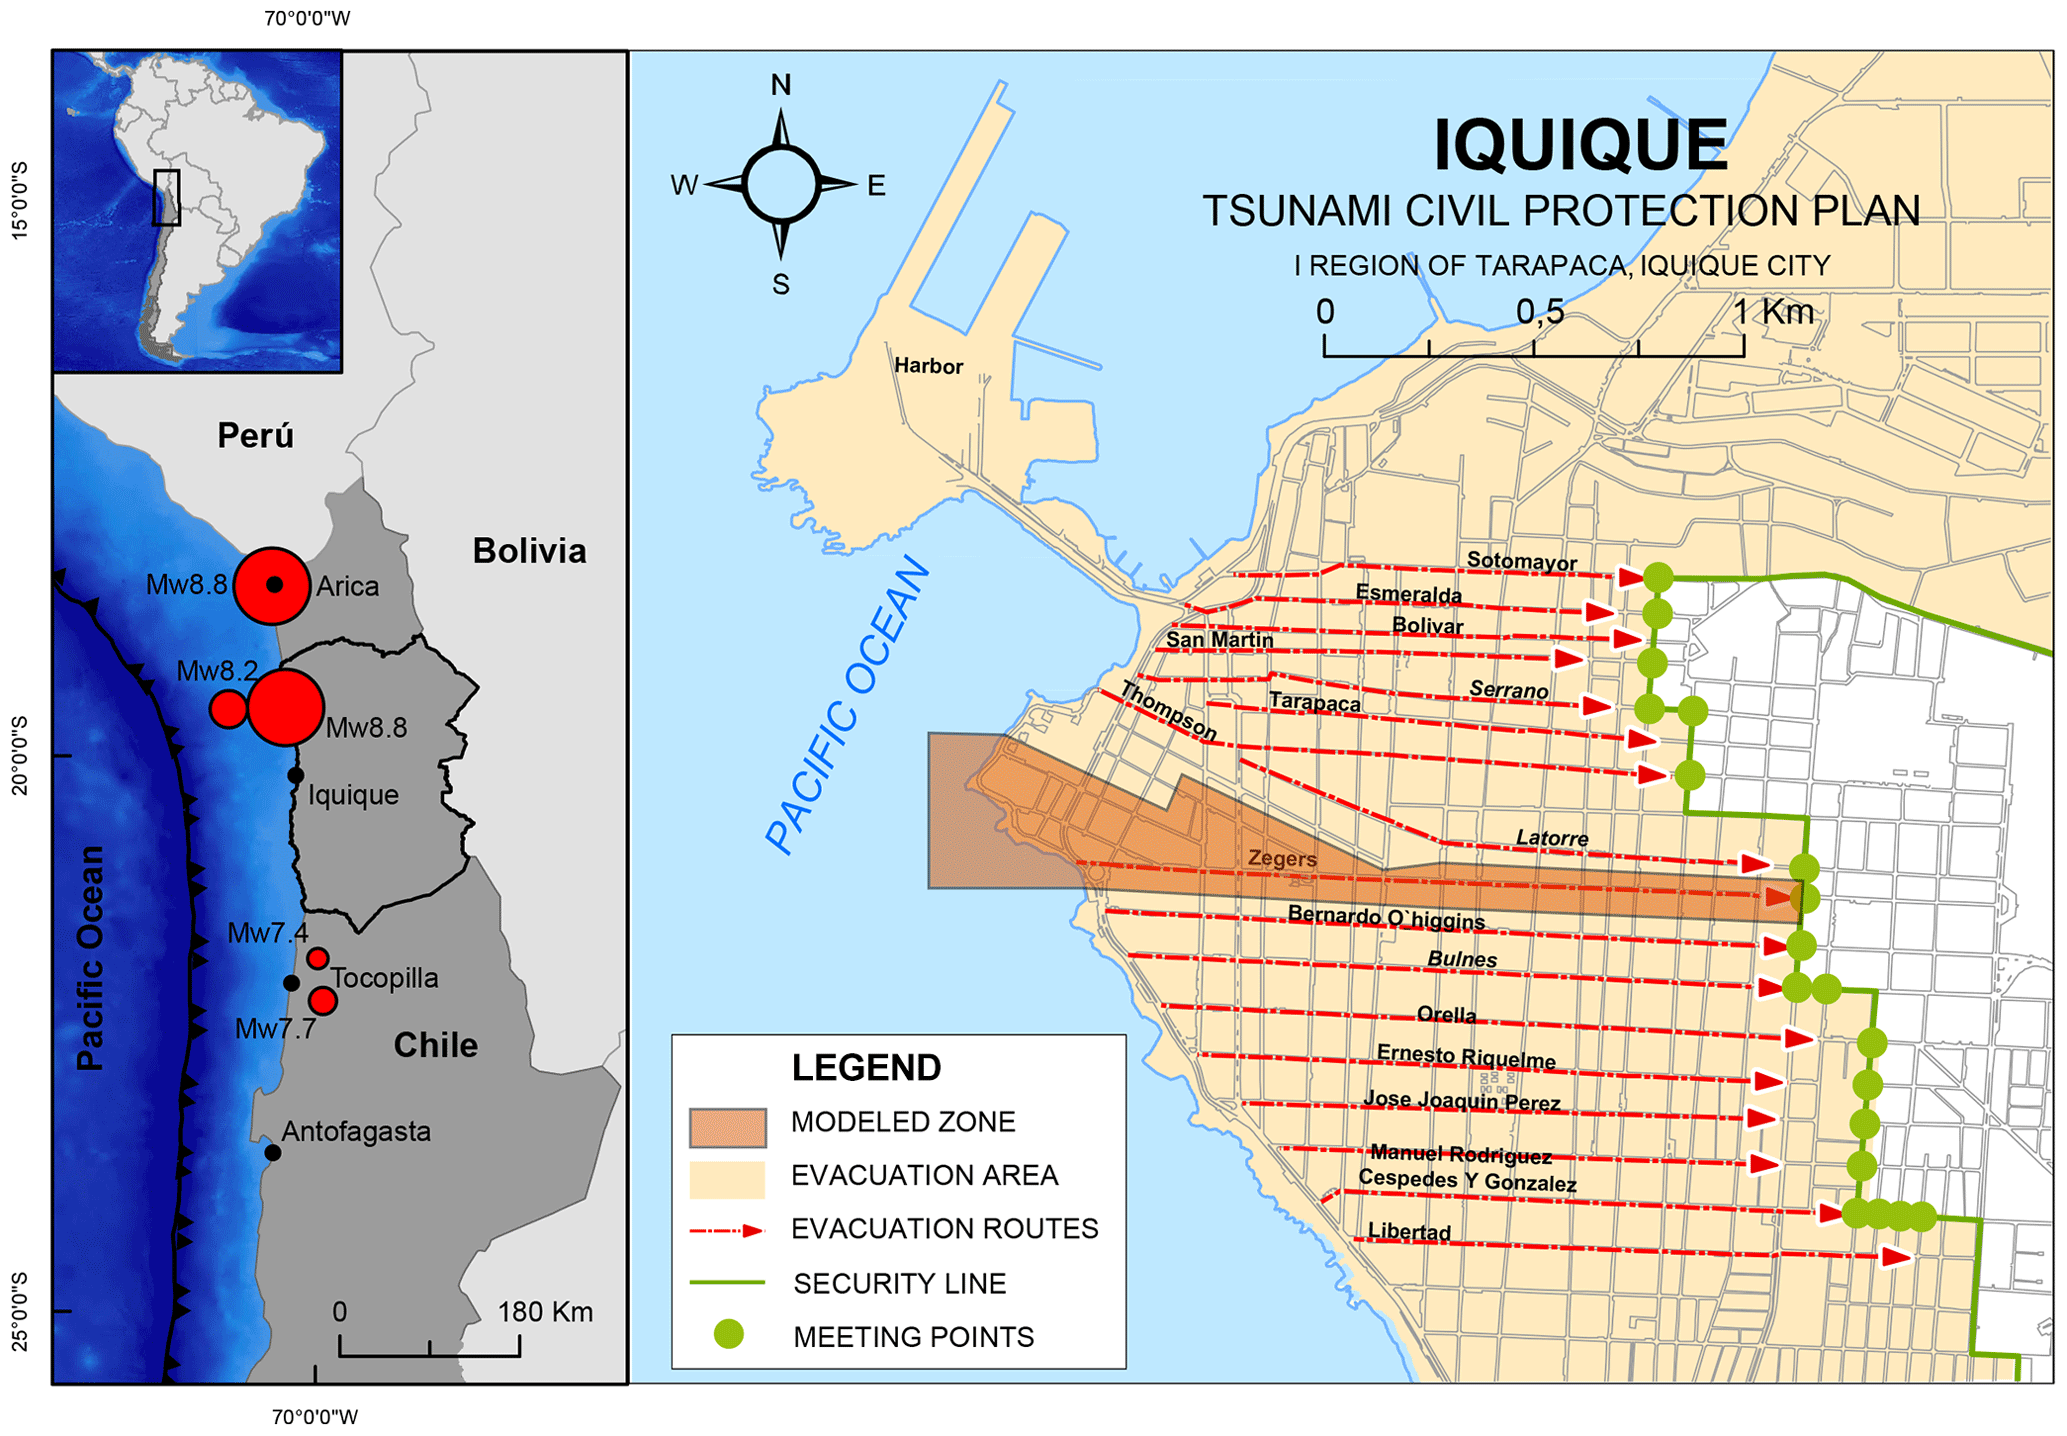
Figure 1Left panel: geographical location of the study area and major earthquakes (red circles) reported in Chile since 1868 (epicenters based on the records of the National Seismological Center of the University of Chile and the United States Geological Survey). Right panel: downtown Iquique and the tsunami evacuation routes where Zegers Street is highlighted (the map has been modified from ONEMI and IMI, 2013).
The seismic context described above motivates us to place our study in the city of Iquique, a port city located in the north of Chile (20.53° S, 70.18° W). We focus on the downtown zone, which consists of a narrow strip no wider than 3 km from east to west with an upward slope that ends in the coastal mountain range. Iquique hosts intense industrial and commercial activity due to the presence of one of the most important ports in the country, which is used for the transport of goods and mining resources. Among its attractions are one of the largest duty-free zones in South America, historical buildings, the natural beauty of its beaches, and a year-round temperate climate. The city has undergone major growth, with a rate of around 70 % between 1993 and 2003. According to the results of the last census, a total of 184 953 people reside in the city (INE, 2012). The rapid growth of coastal cities such as Iquique has led to increased exposure of their inhabitants and property to hazards such as tsunamis and a consequent increase in vulnerability and flood risk (Neumann et al., 2015; Kron, 2013; Jongman et al., 2012).
3.1 Urban micro-vulnerabilities along evacuation routes
During an evacuation, escape routes to higher ground are determining factors for the proper execution of the process. An appropriate evacuation route layout ensures that the path of travel to safe areas is the shortest; in Iquique the orthogonal street layout is a positive element that guarantees redundant and practically straight evacuation routes (see Fig. 1). Nonetheless, the high population growth; vehicle ownership rates; and large commercial, tourism, industrial, and educational activities in the study area increase the tsunami risk. High occupancy rates give rise to a series of problems in terms of space availability along evacuation routes, which ideally should remain clear and free of obstacles to avoid a decrease in their design capacity (Scheer et al., 2012).
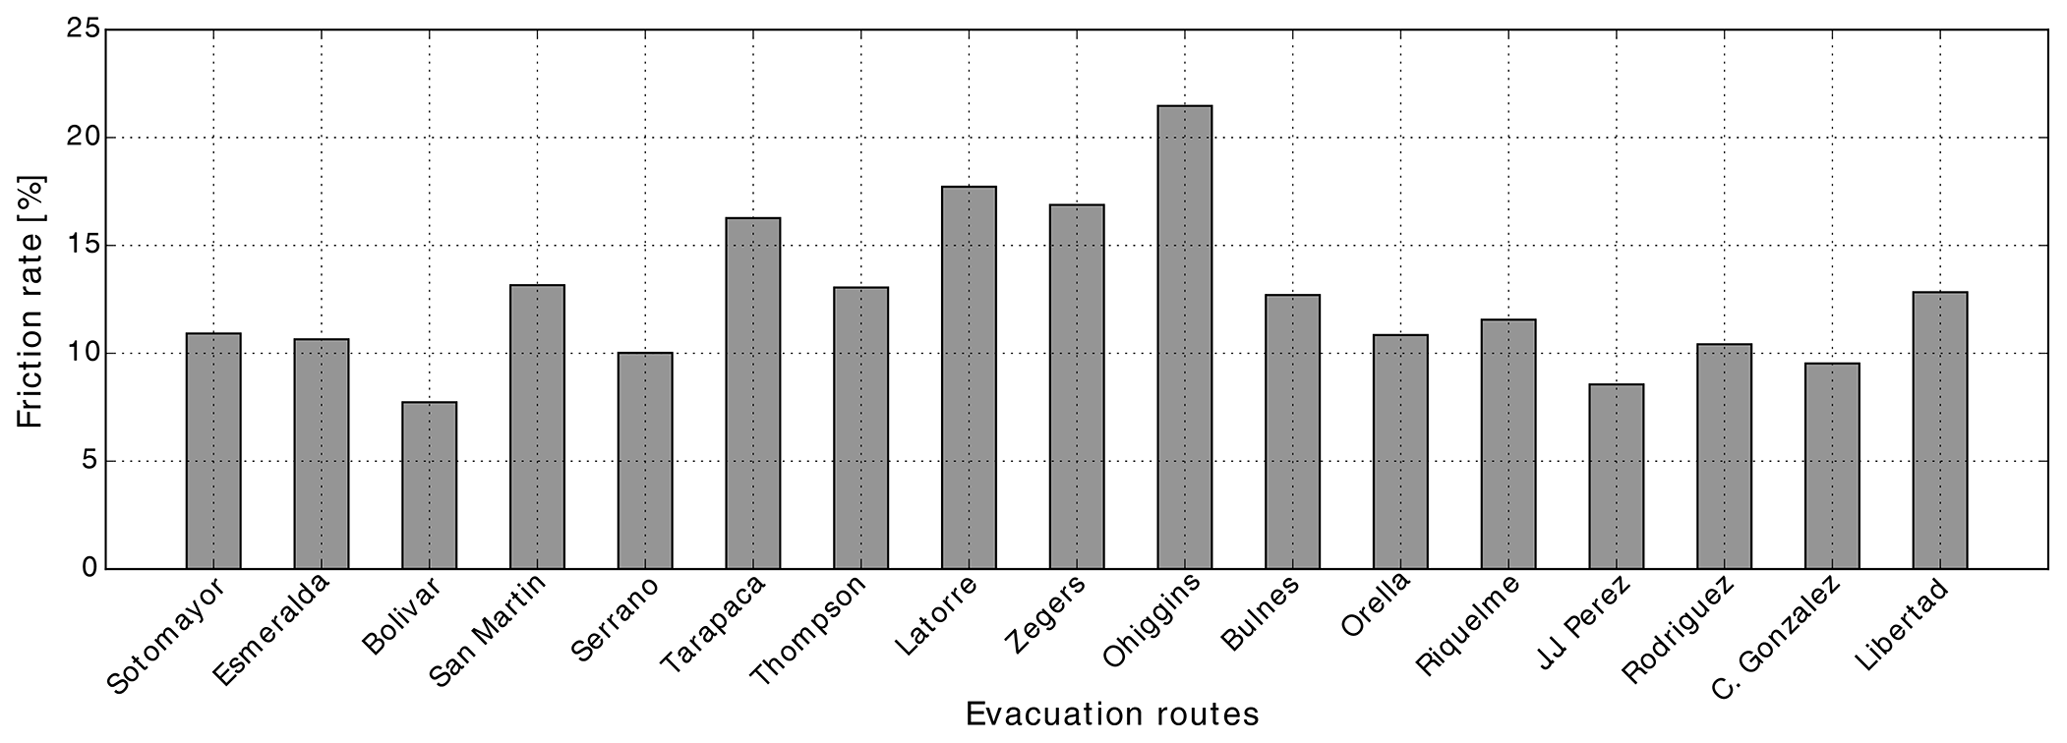
Figure 2Friction rates of the main evacuation routes of downtown Iquique, based on the results of Álvarez et al. (2018).
Downtown Iquique shows many of these complications that can negatively affect the displacement of evacuees at the pedestrian-experience scale (León and March, 2016; Walker, 2013; Álvarez et al., 2018). More specifically, the work of Álvarez et al. (2018) documents the presence of “urban micro-scale vulnerabilities” along evacuation routes that stem from their poor use, poor maintenance, or design problems, and it proposes a methodology to quantify the effect of urban micro-vulnerabilities on the displacement of evacuees through an urban friction rate, which “represents the proportion of the area of an evacuation route that is occupied by the micro-vulnerabilities existing on it” (Álvarez et al., 2018, p. 2033). Another important issue is the use of public spaces for parking, which considerably reduces the route capacity; the latter is due to the great number of vehicles in circulation in Iquique, with 3.62 vehicles per 10 inhabitants, much higher than the national average of 2.64 (INE, 2015). While other factors such as the use of sidewalks to extend the service areas of restaurants and the use of public spaces for informal commerce have a smaller presence, they similarly slow evacuations. The analysis of tsunami evacuation scenarios developed in Álvarez et al. (2018) allows the quantification of the presence of urban micro-vulnerabilities along the evacuation routes of Iquique to realistically represent evacuation processes in light of the city's current conditions. Figure 2 shows the results of the assessment of the evacuation routes of Iquique (their locations are depicted in Fig. 1) as a function of their friction rates; the routes with urban environments that are the worst prepared for a possible evacuation are O'Higgins, Latorre, and Zegers streets. In what follows we focus on Zegers Street to carry out a detailed analysis of evacuation owing to the rapid tsunami arrival and flooding along this street.
3.2 Tsunami modeling
In this study, numerical simulations of hypothetical tsunami scenarios are developed using the open-source GeoClaw model (Berger et al., 2011). The GeoClaw code solves the nonlinear shallow-water equations using a mesh-adaptive high-resolution finite-volume method to compute spatio-temporal evolution of water depths and depth-averaged flow velocities in horizontal dimensions, and . It has been widely applied to tsunami hazard assessment in different topo-bathymetric contexts (e.g., Melgar and Bock, 2015; Cienfuegos et al., 2018; Williamson et al., 2020).
The tsunami scenarios are modeled using four nested grids in planar coordinates to achieve a high-resolution description of the tsunami propagation and inundation from its generation zone into the city (see Fig. 3). Grid 1 corresponds to the bathymetry of the Pacific Ocean, generated from the GEBCO 2014 digital global bathymetric model (Weatherall et al., 2015), which covers the tsunami generation zone with a coarse resolution of 900 m. Grids 2 and 3, with resolutions of 180 and 30 m, respectively, are obtained from the nautical charts of the national Hydrographic and Oceanographic Service of the Chilean Navy (SHOA) to propagate the tsunami to the Chilean coast. The inundation modeling is performed with Grid 4 using lidar topographic information of the city of Iquique with a resolution of 2 m (provided by the JICA–JST tsunami project; see Tomita et al., 2016) to achieve a high level of detail at the street level.
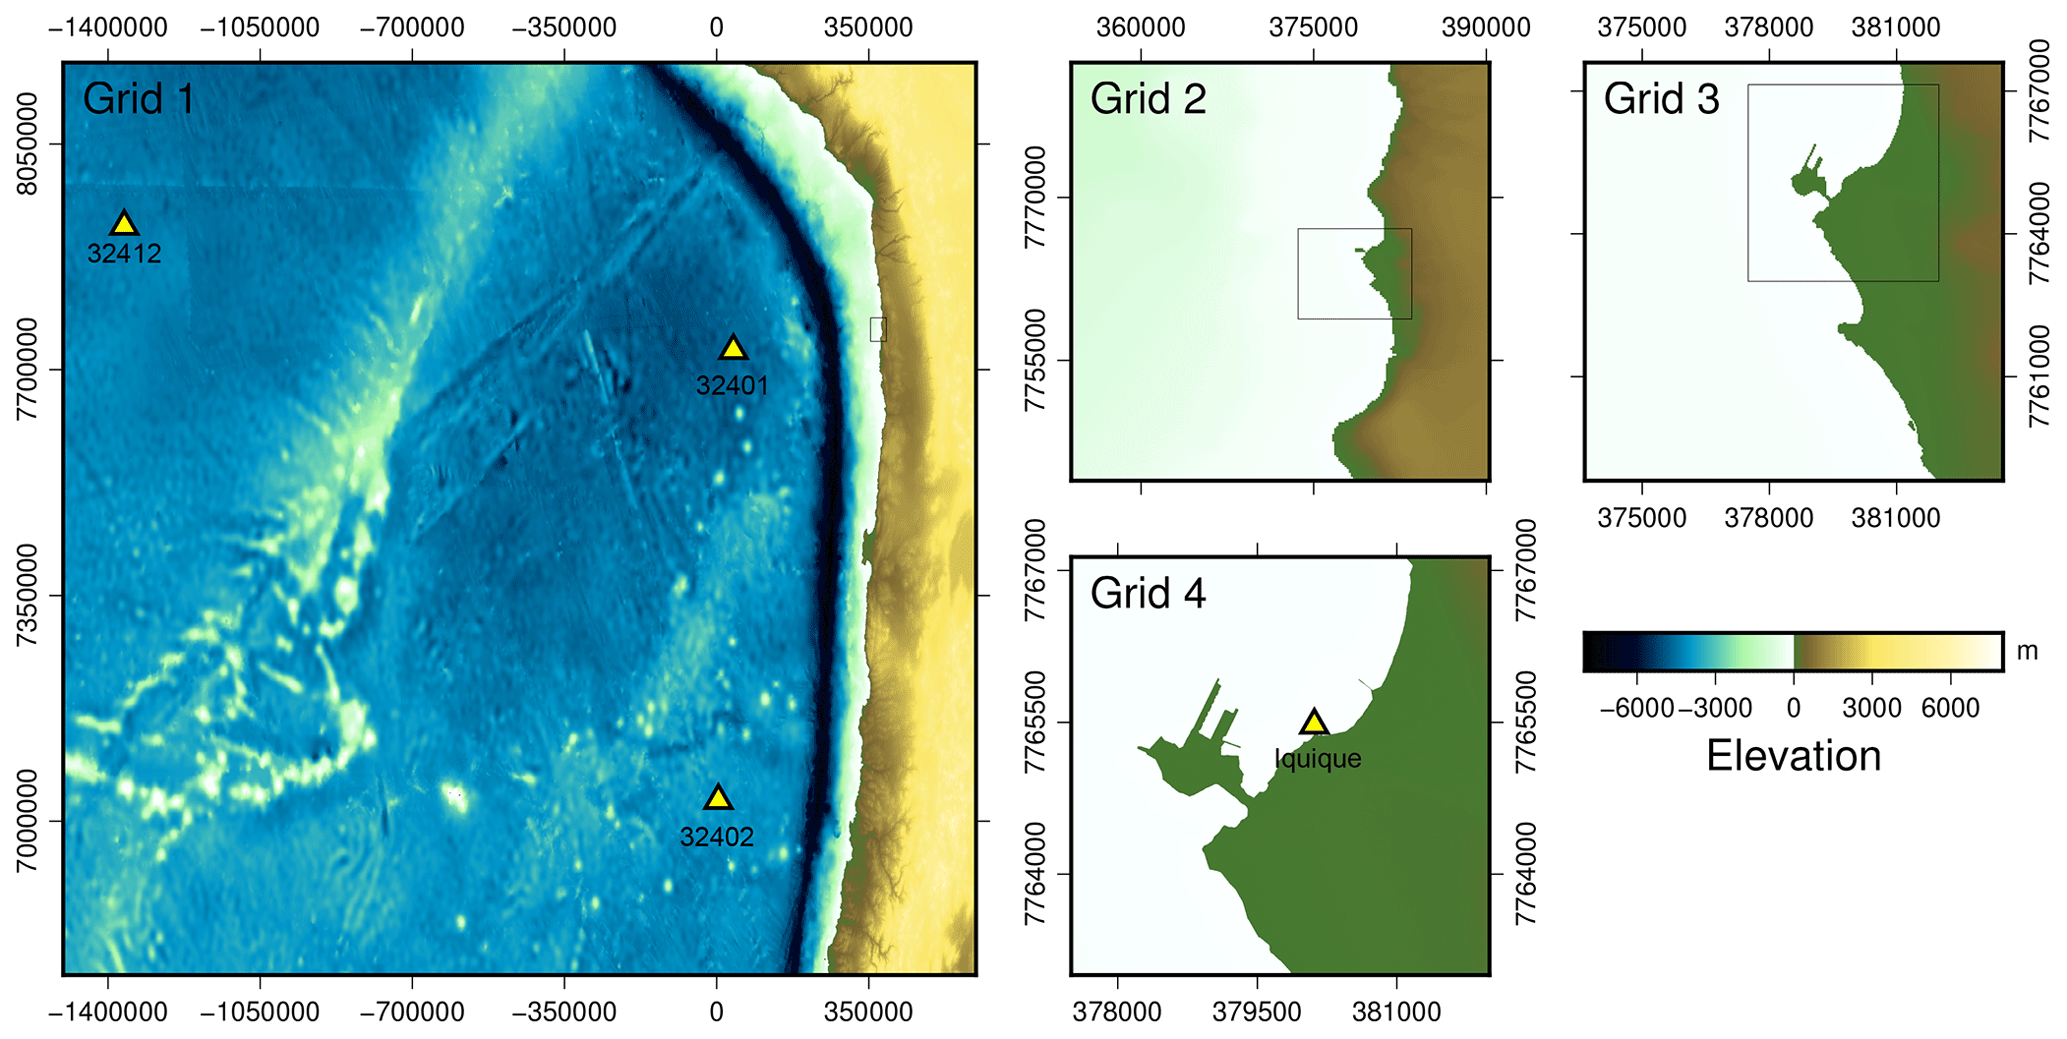
Figure 3Nested grids used in the numerical simulations. The yellow triangles indicate the locations of the DART buoys used for the tsunami model validation and the tidal gauge near the port of Iquique.
The validation of the model configuration is performed using tsunami observations of the 2014 Iquique earthquake. We compare computed tsunami signals with tidal gauge records at the Iquique port and with DART buoys (UNESCO/IOC, 2014; Heidarzadeh et al., 2015) using two source models. The first one is obtained from the inversion of tsunami records (An et al., 2014), while the second one incorporates GPS measurements in addition to perform the source inversion (Gusman et al., 2015). The initial conditions for the tsunami simulations are estimated based on the displacement distribution of the earthquake source using the elastic dislocation theory of Okada (1985).
In general the deep-water DART tsunami time series generated from the fault models of An et al. (2014) and Gusman et al. (2015) are in good agreement with the tsunami records (Fig. 4). Nevertheless, an earlier tsunami wave arrival is observed in the simulations at the Iquique tide gauge, as was also the case in simulations reported in Catalán et al. (2015) and Gusman et al. (2015). Some differences in phases and amplitudes are also observed at this tidal gauge, consistent with results reported previously by the same authors. These differences might be due to the inherent epistemic uncertainty associated with the modeling of rupture inversion and its consequent variability in finite fault models (Cienfuegos et al., 2018), and/or an insufficient bathymetric resolution and insufficient information to properly represent the port layout, which may result in a poor description of the later stages of the tsunami evolution. Nonetheless, model results are in agreement with previously published works dealing with the same event and are thus considered adequate to be applied in the present study.
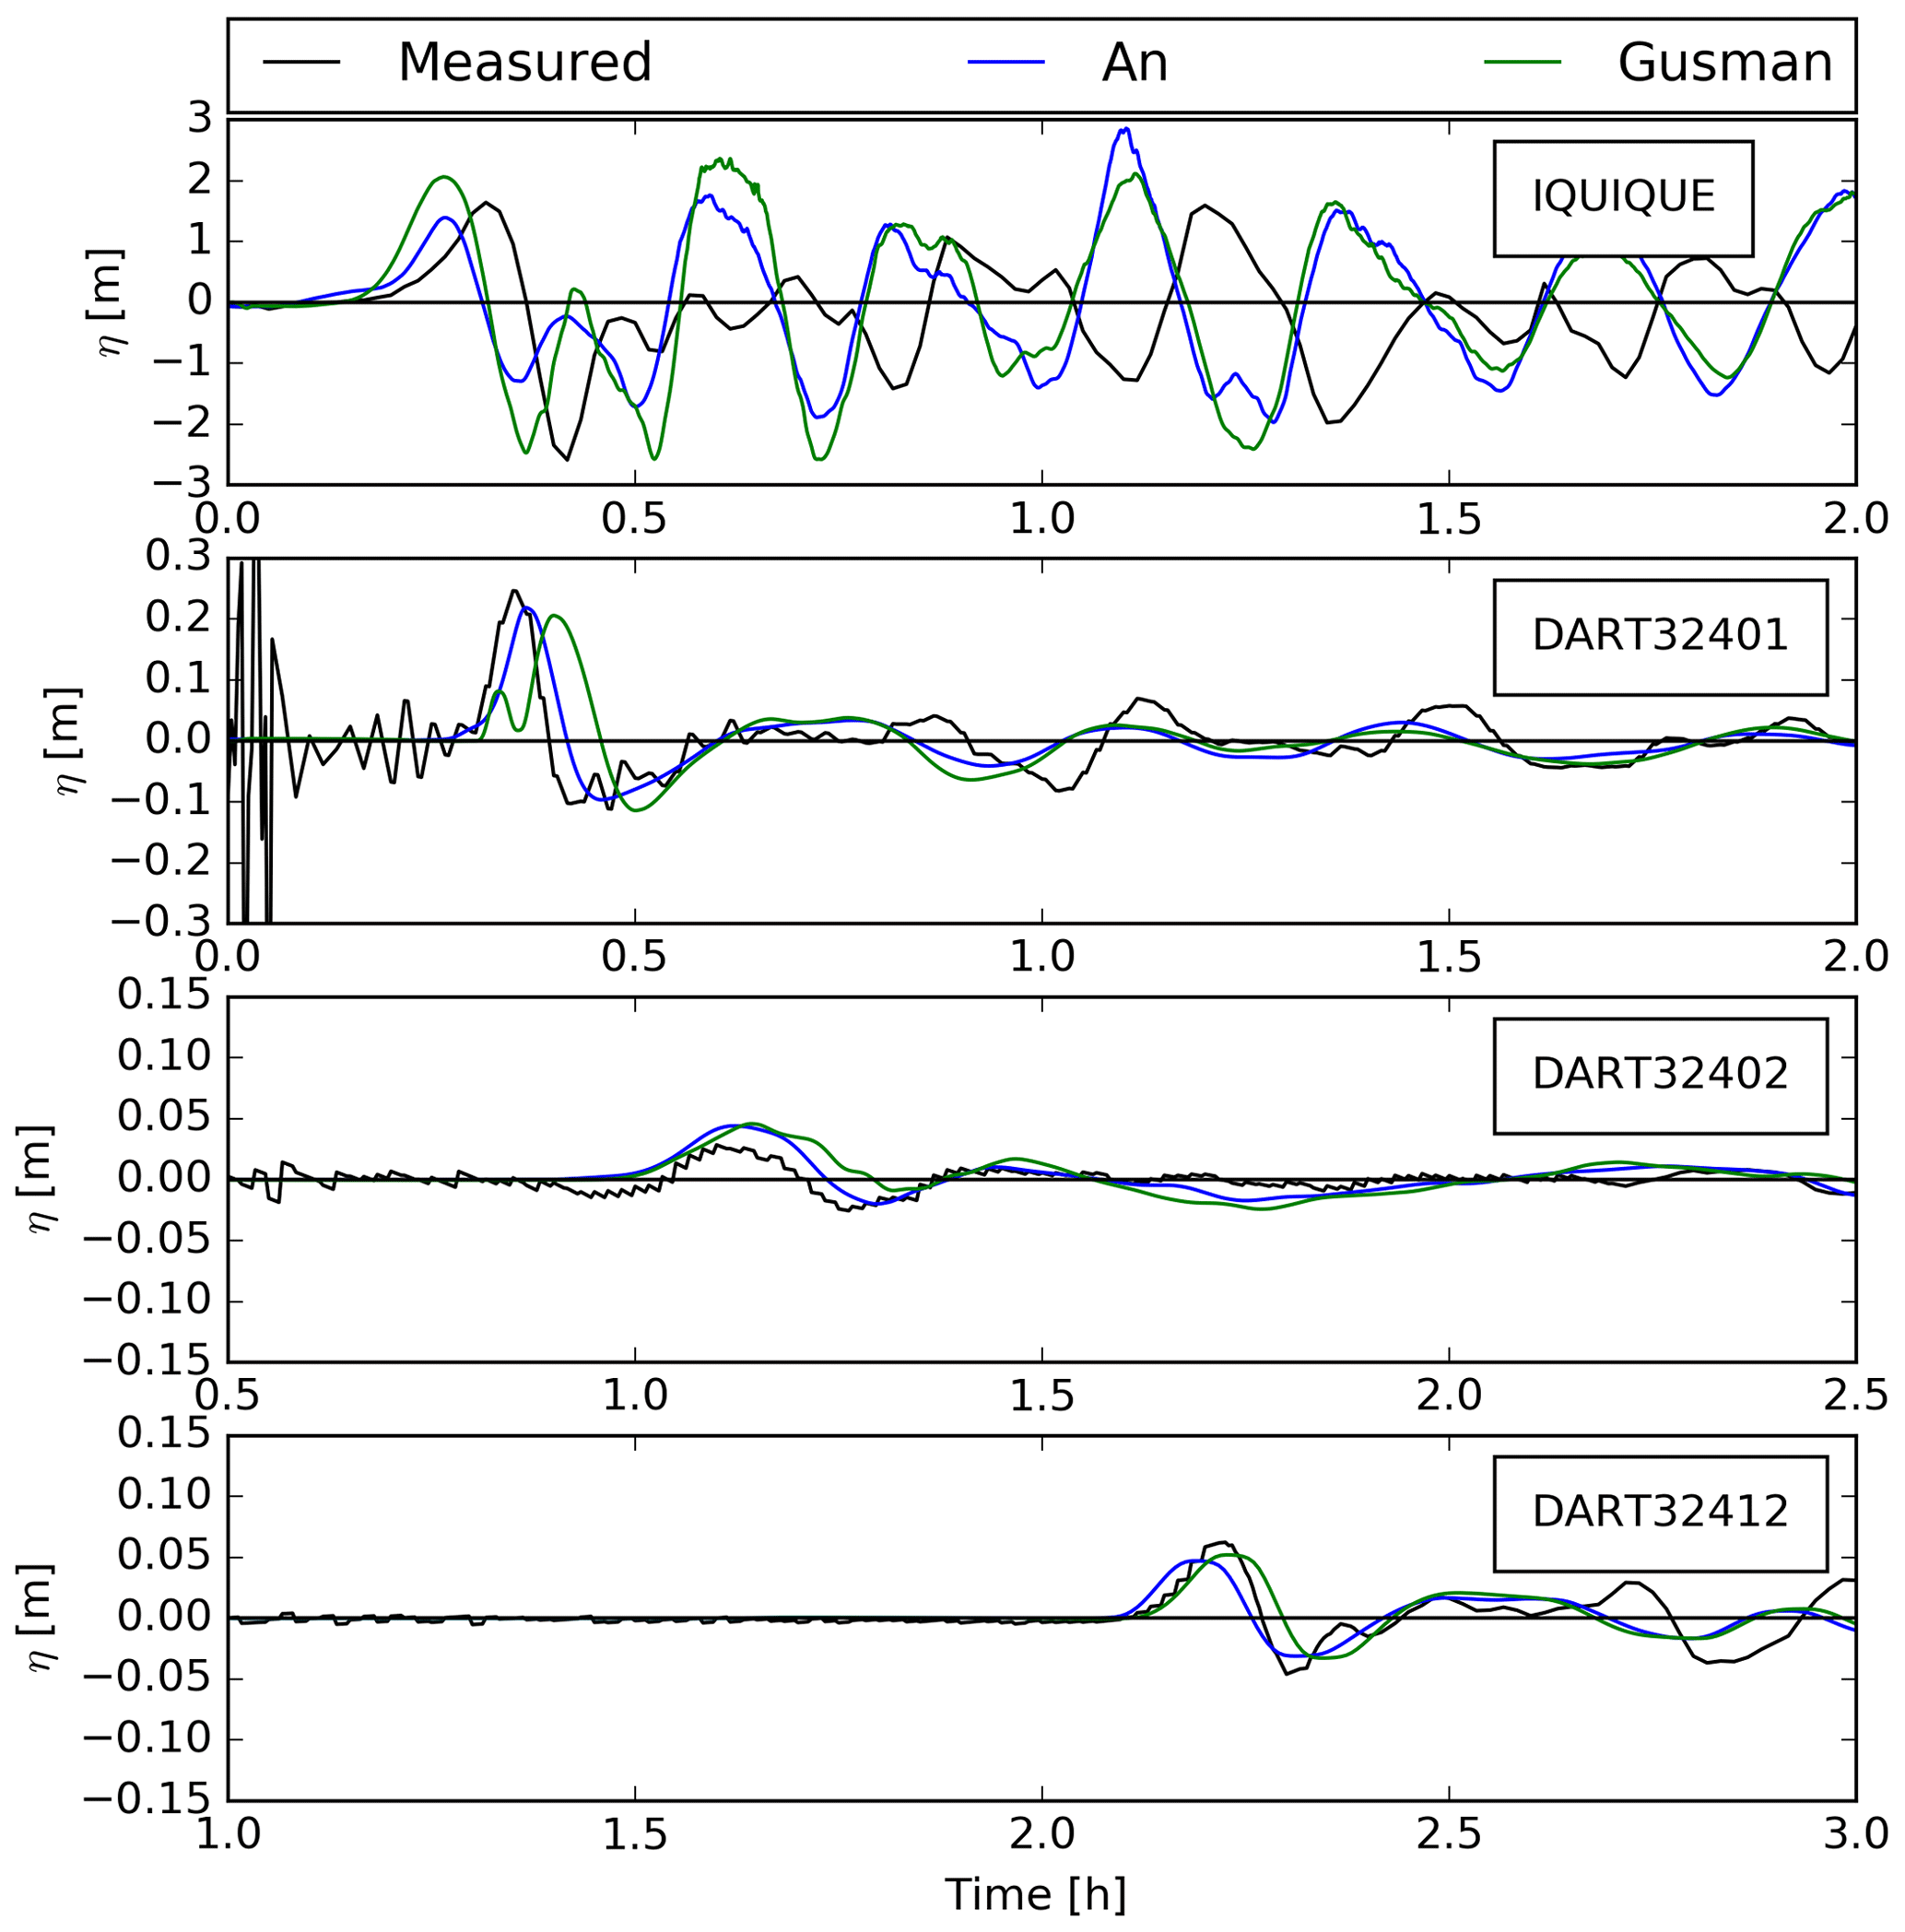
Figure 4The 2014 tsunami signals recorded by the Iquique tide gauge and DART buoys (black), compared with time series generated by the numerical simulation using An et al. (2014) (blue) and Gusman et al. (2015) (green) earthquake sources.
3.3 Tsunami scenarios
We adopt the interseismic coupling (ISC) model approach (Li et al., 2015) to define potential future earthquake slip sources in the Norte Grande seismic gap. For the tsunami evacuation analysis, we define two cases: a Mw 9.0 earthquake based on the ISC estimations of Chlieh et al. (2011) and a Mw 8.4 earthquake from the large sample of stochastic scenarios developed by Métois et al. (2013), selected for its high flood level and early arrival time. Both scenarios were proposed as possible earthquakes before the 2014 Iquique earthquake, thus giving a conservative assessment of potential ruptures. The tsunami simulations are performed assuming a mean tide level and a high tide level (+0.76 m) at the time of the nucleation of the earthquake. The initial sea surface deformations and the resulting tsunami time series at the tidal gauge located near the port of Iquique are shown in Fig. 5.
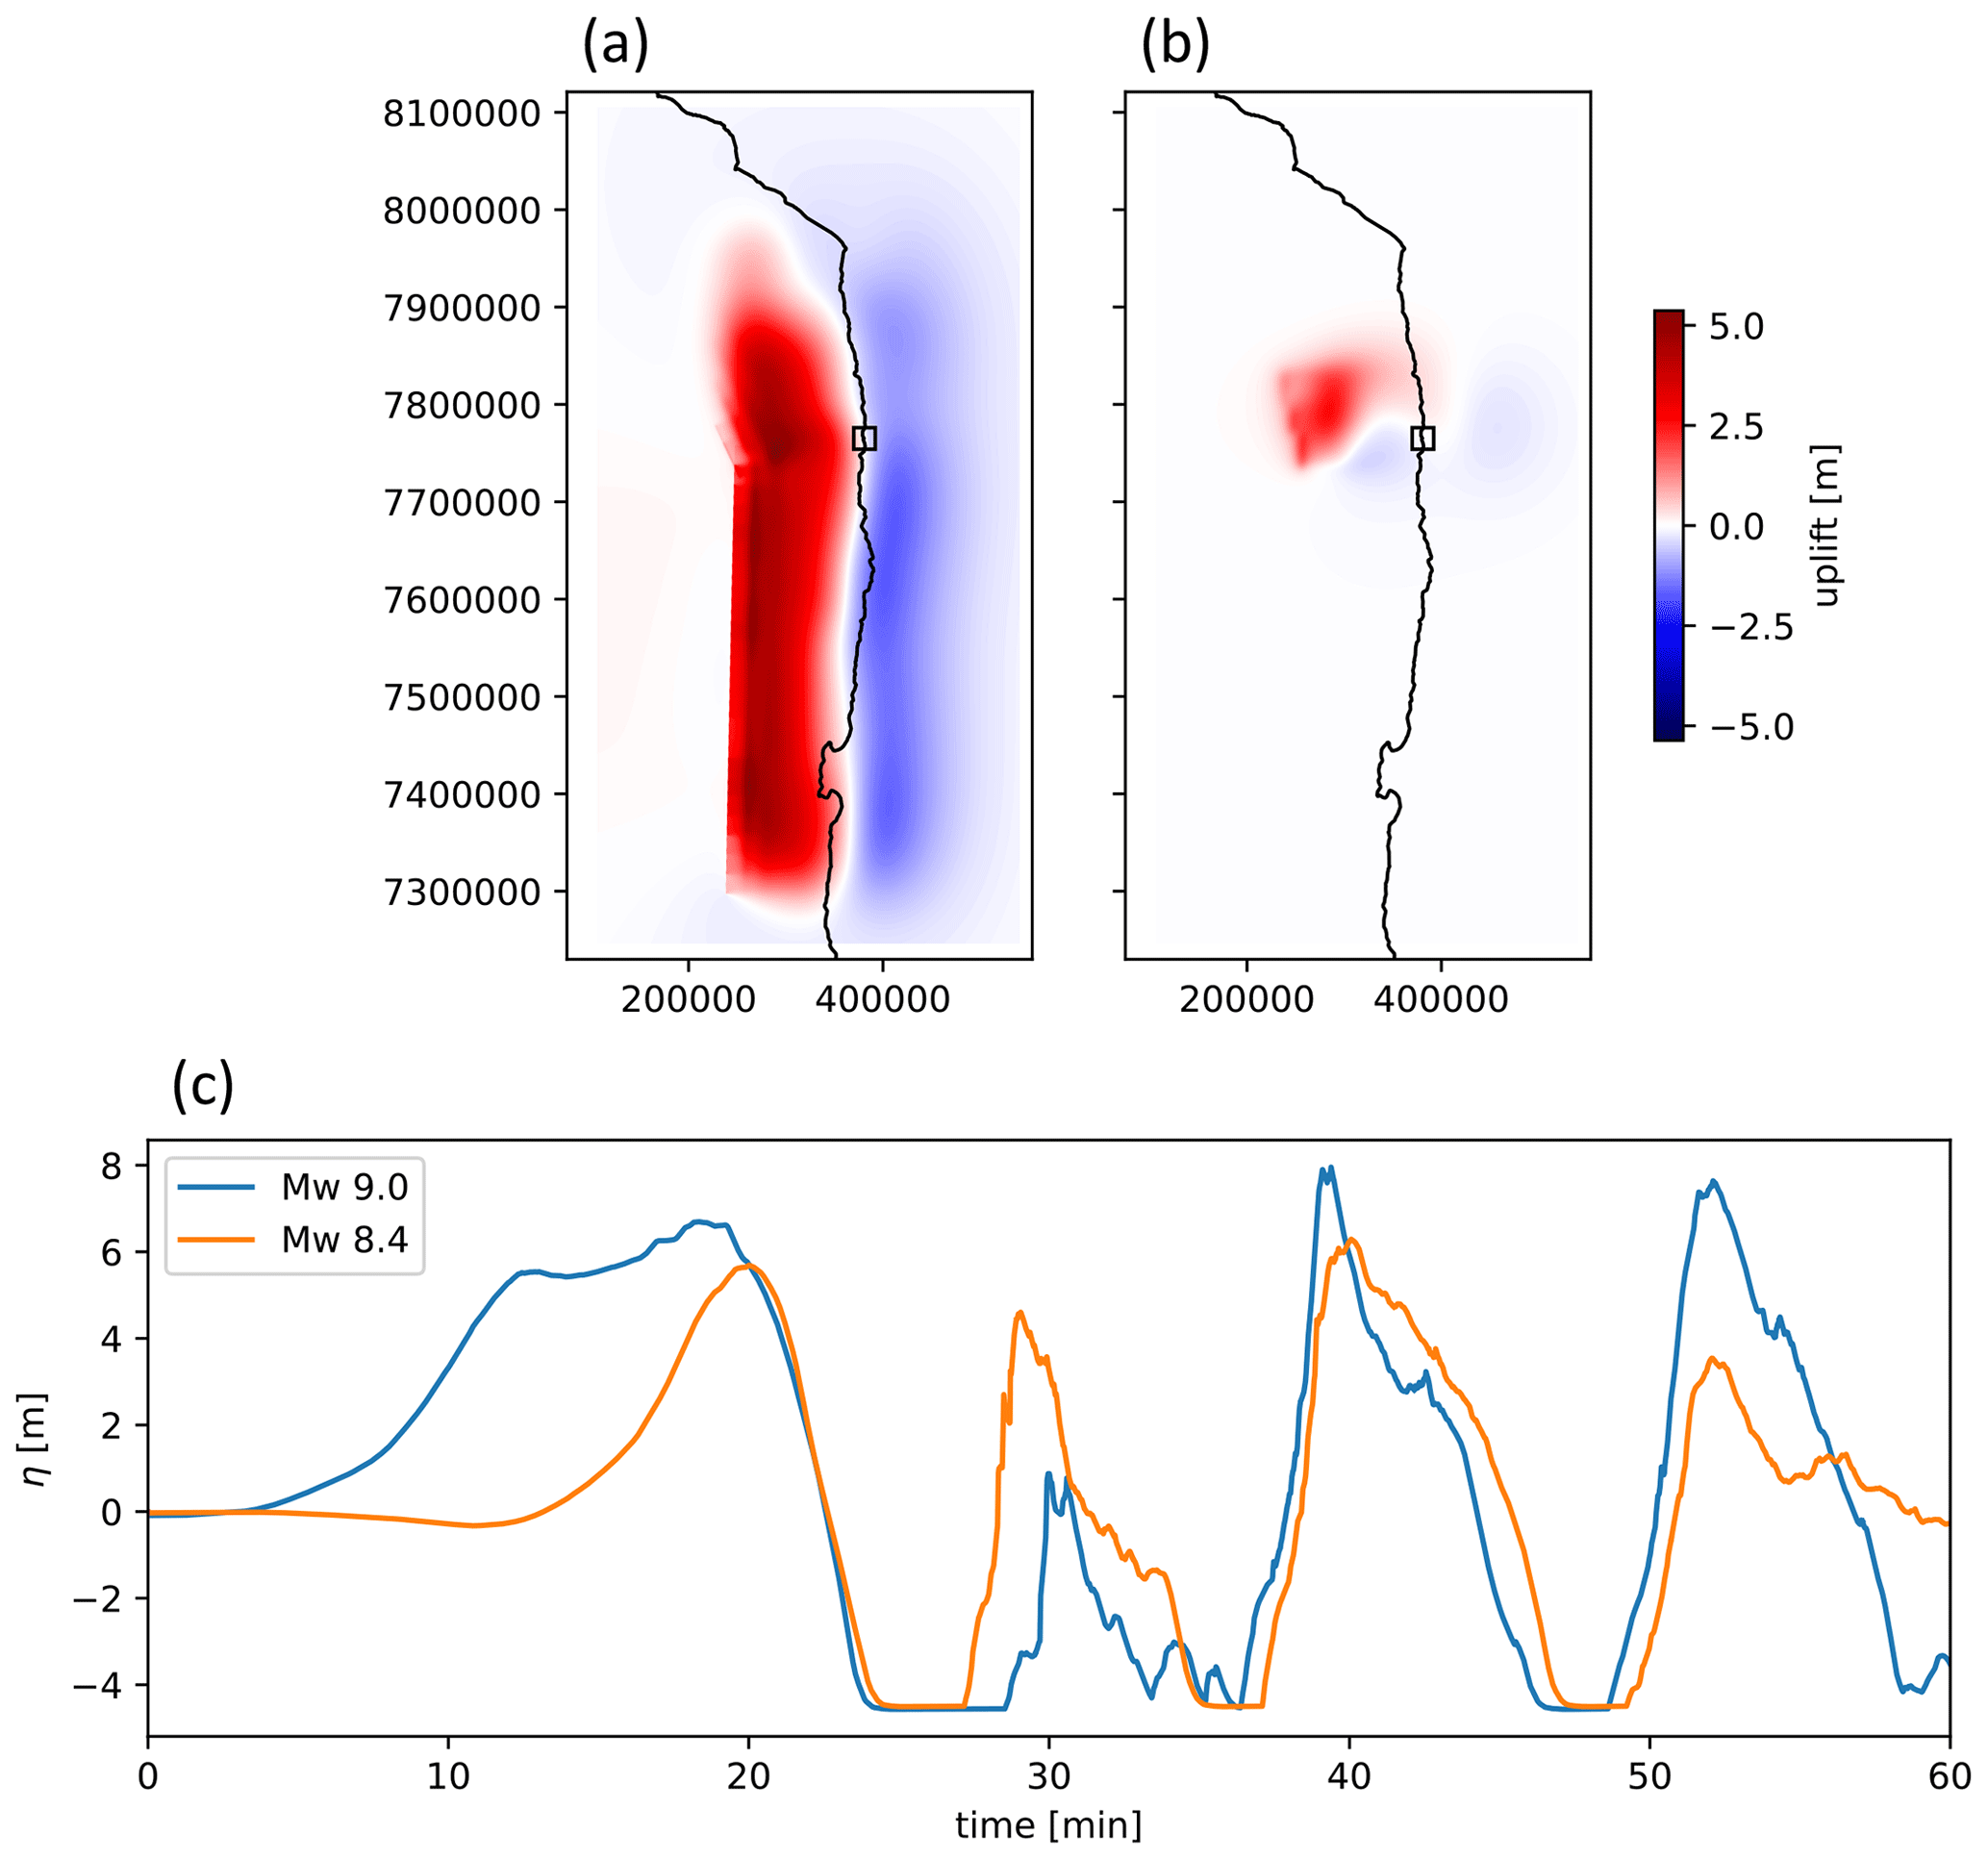
Figure 5Initial sea surface deformations for the Mw 9.0 (a) and for the Mw 8.4 (b) tsunami scenarios. (c) Modeled tsunami heights at the tidal gauge located near the port of Iquique (see Fig. 3).
3.4 Evacuation modeling
The evacuation model used herein was developed and validated by Poulos et al. (2018); it consists of an agent-based model (ABM) to statistically aggregate the evacuation displacements from the individual level. The model uses a collision avoidance algorithm (van den Berg et al., 2011) which naturally captures congestion problems that may occur during an evacuation. We define a 45 cm agent space where no agent overlapping is allowed. The Dijkstra shortest-path algorithm (Dijkstra, 1959) is set as the evacuation route selection. The displacement velocity of each agent is sampled from a Weibull distribution with a mean of 1.34 m s−1 (shape parameter 10.14 and scale parameter 1.41), calibrated by Rinne et al. (2010) and consistent with the literature review conducted by Daamen and Hoogendoorn (2007). The change in pedestrian velocity as a function of the slope of the terrain is calculated using Tobler's hiking function (Tobler, 1993), which has been employed in similar studies (Wood and Schmidtlein, 2012; Fraser et al., 2014; Solís and Gazmuri, 2017).
A realistic representation of the urban environment is obtained by including the urban micro-vulnerabilities present along the studied evacuation route following the methodology and field data of Álvarez et al. (2018) (see Fig. 10 for a graphic representation of these). The effect that these features have on the agent movement is taken into account using the speed conservation value (SCV) (Schmidtlein and Wood, 2015; Fujiyama and Tyler, 2004), which is the fraction of the maximum speed that a pedestrian can reach on a given surface (Wood and Schmidtlein, 2012). The SCV associated with urban micro-vulnerabilities are either blockages where the agents cannot go through (SCV = 0), partial speed reductions when they encounter street level changes (SCV = 0.5501), or minor speed reductions (SCV = 0.9091) when the movement takes place over rough surfaces (see Álvarez et al., 2018, for details).
Because the spatial distribution of the population depends on the time of the day, we consider two scenarios: nighttime and daytime. The nighttime case is modeled using data of the demographic census disaggregated at the block level (INE, 2012). The population distribution in the daytime scenario is mainly based on an origin–destination survey for the city of Iquique (SECTRA, 2010) but is complemented with information from the census, information related to the permitted load of non-housing infrastructures (MINVU, 2016), and information related to the occupancy of educational establishments from the Ministry of Education. In Fig. 6 the population distribution is presented around the studied street for nighttime and daytime scenarios. Based on the data, the total number of agents is set to 3171 in the nighttime scenario and 4597 in the daytime scenario.
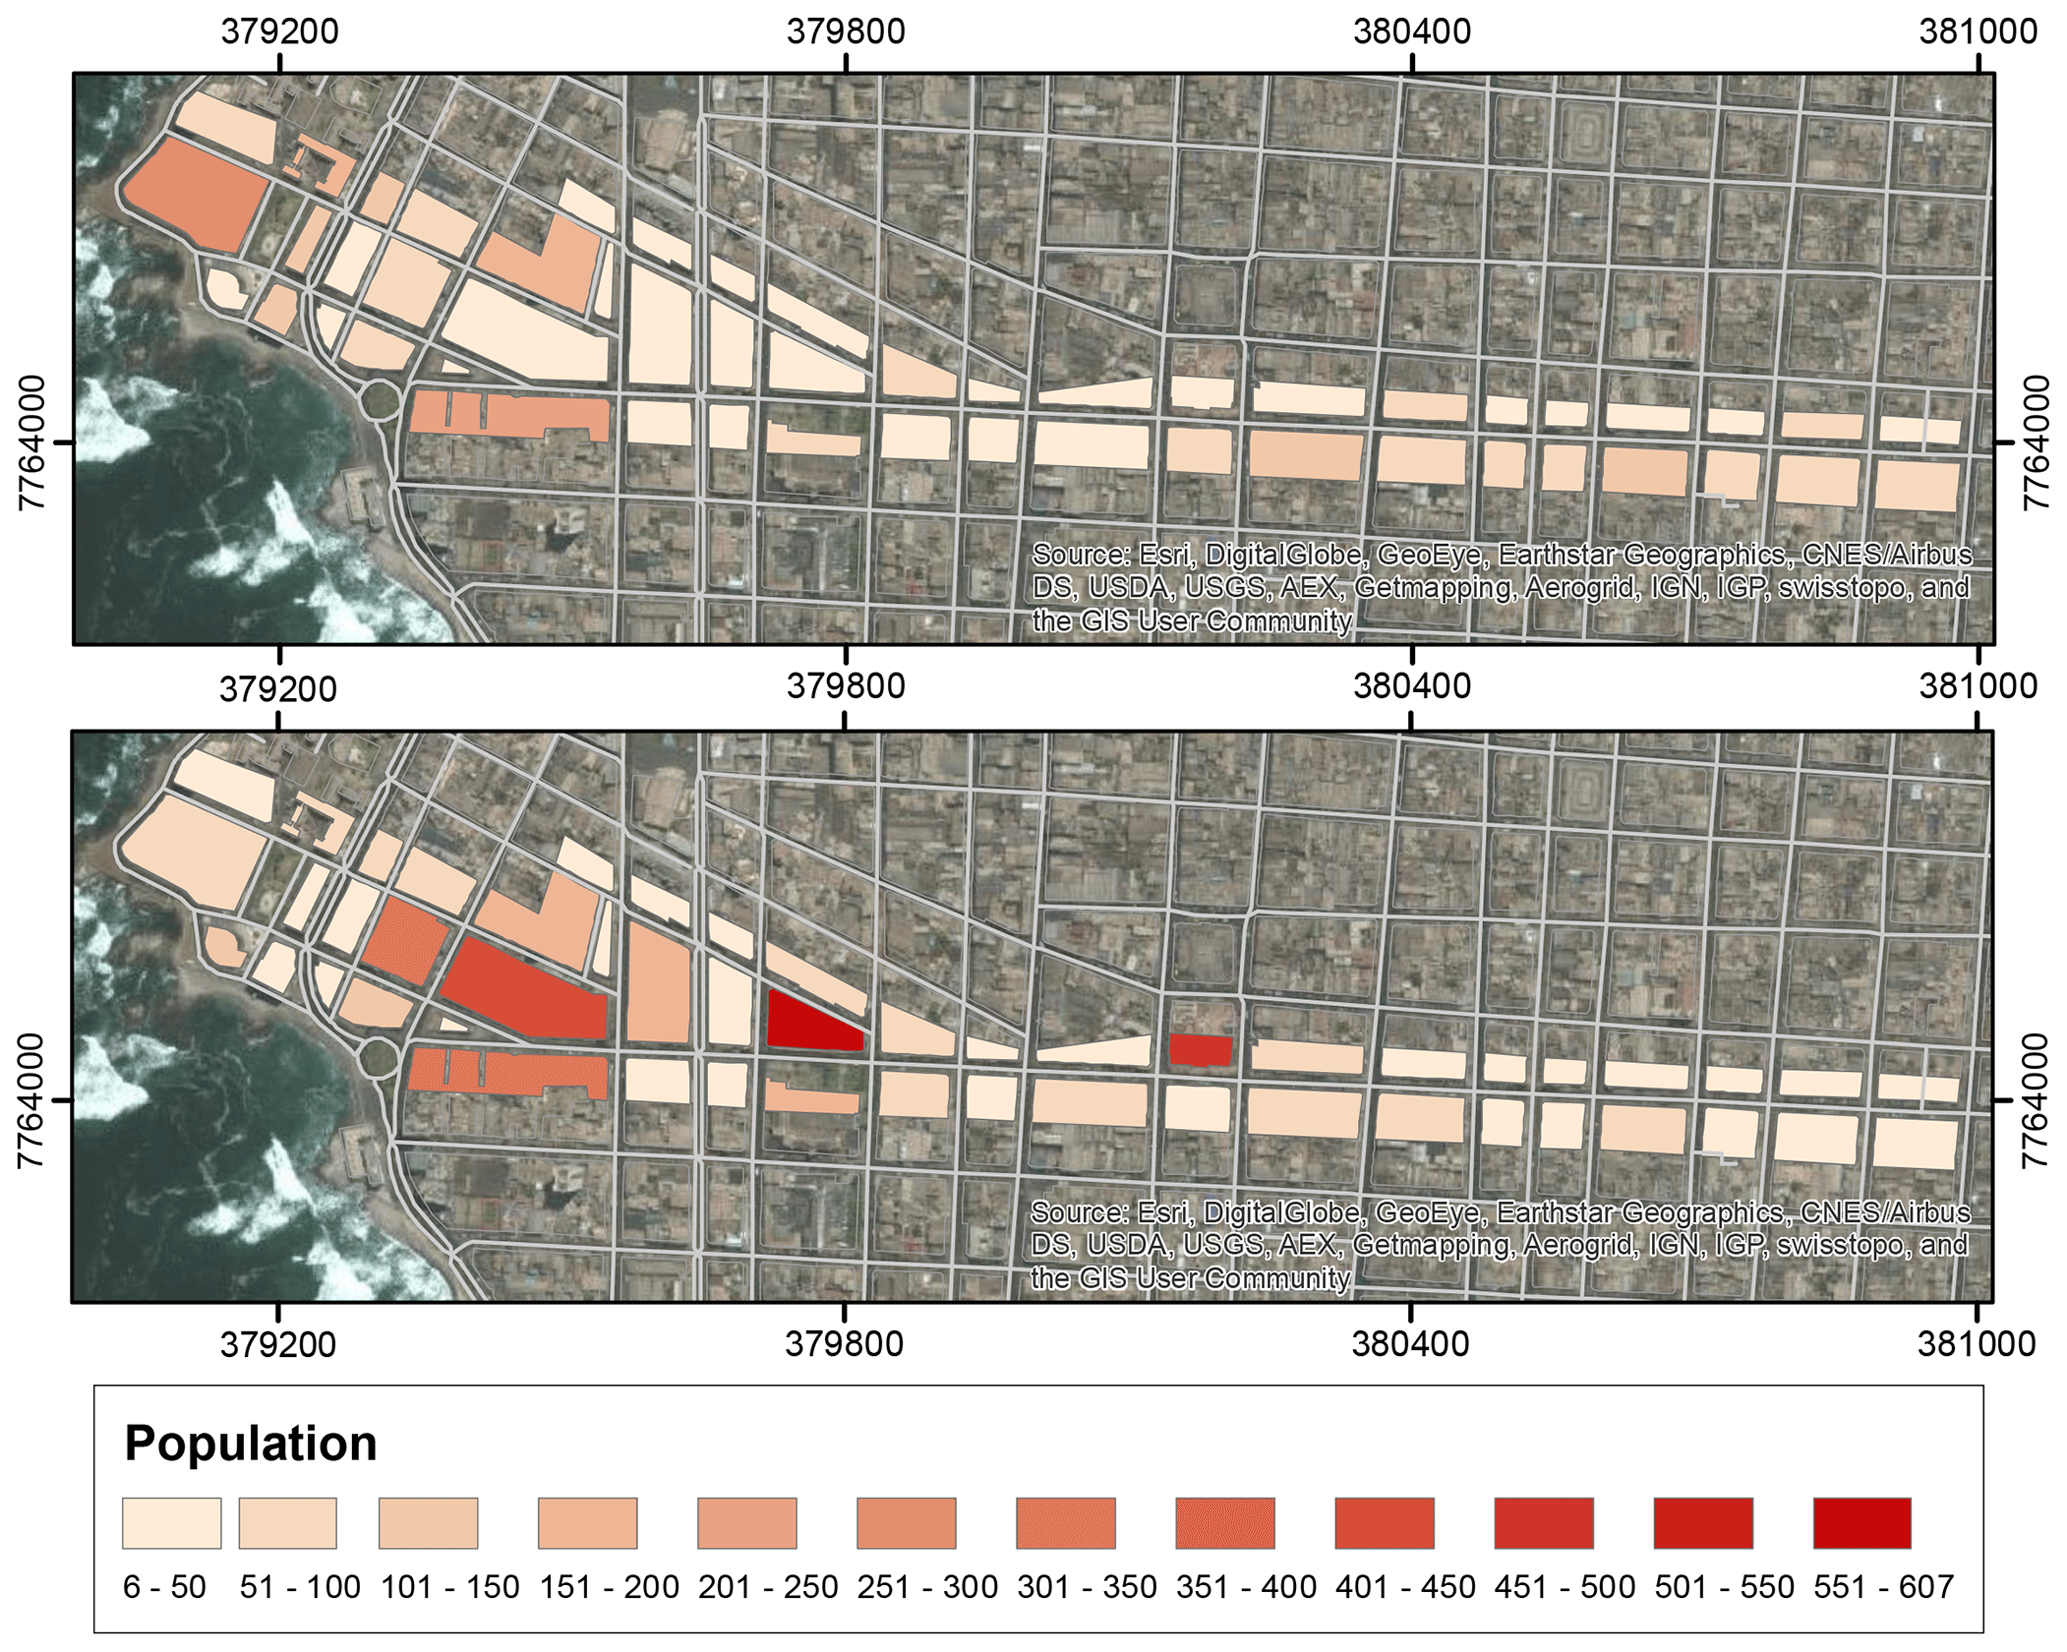
Figure 6Population distribution in the studied area. Upper panel: nighttime scenario. Lower panel: daytime scenario.
In order to take into account the variability in decision-making regarding the evacuation starting times of agents, we employ the Rayleigh cumulative probability distribution, which has been widely used in tsunami evacuation modeling (Mas et al., 2012; León and March, 2014, 2016; Solís and Gazmuri, 2017):
where t is the time variable and σ is the scale parameter of the distribution; the latter is expressed in terms of the average starting time of evacuation as .
4.1 Tsunami arrival times
In Fig. 7 the tsunami arrival times for the two modeled scenarios are presented. The high topographic resolution (2 m) allows the representation of the effect of the inundation through the streets of the city. It can be seen that in the Mw 9.0 scenario, the first blocks of the city are flooded in less than 15 min, while in the Mw 8.4 scenario, this area is flooded in 20 min. The most exposed areas are the port of Iquique and the duty-free zone (ZOFRI), home of the commercial hub of the city and located north of the port. The evacuation analysis herein is focused around Zegers Street, where tsunami inundation appears to take between 15 and 25 min to penetrate six blocks. This street is also one of the routes of greatest concern due to the presence of urban micro-vulnerabilities (Álvarez et al., 2018). Therefore, different evacuation scenarios are modeled in detail, considering all the streets that feed the Zegers evacuation route as the modeling zone (see Fig. 1).
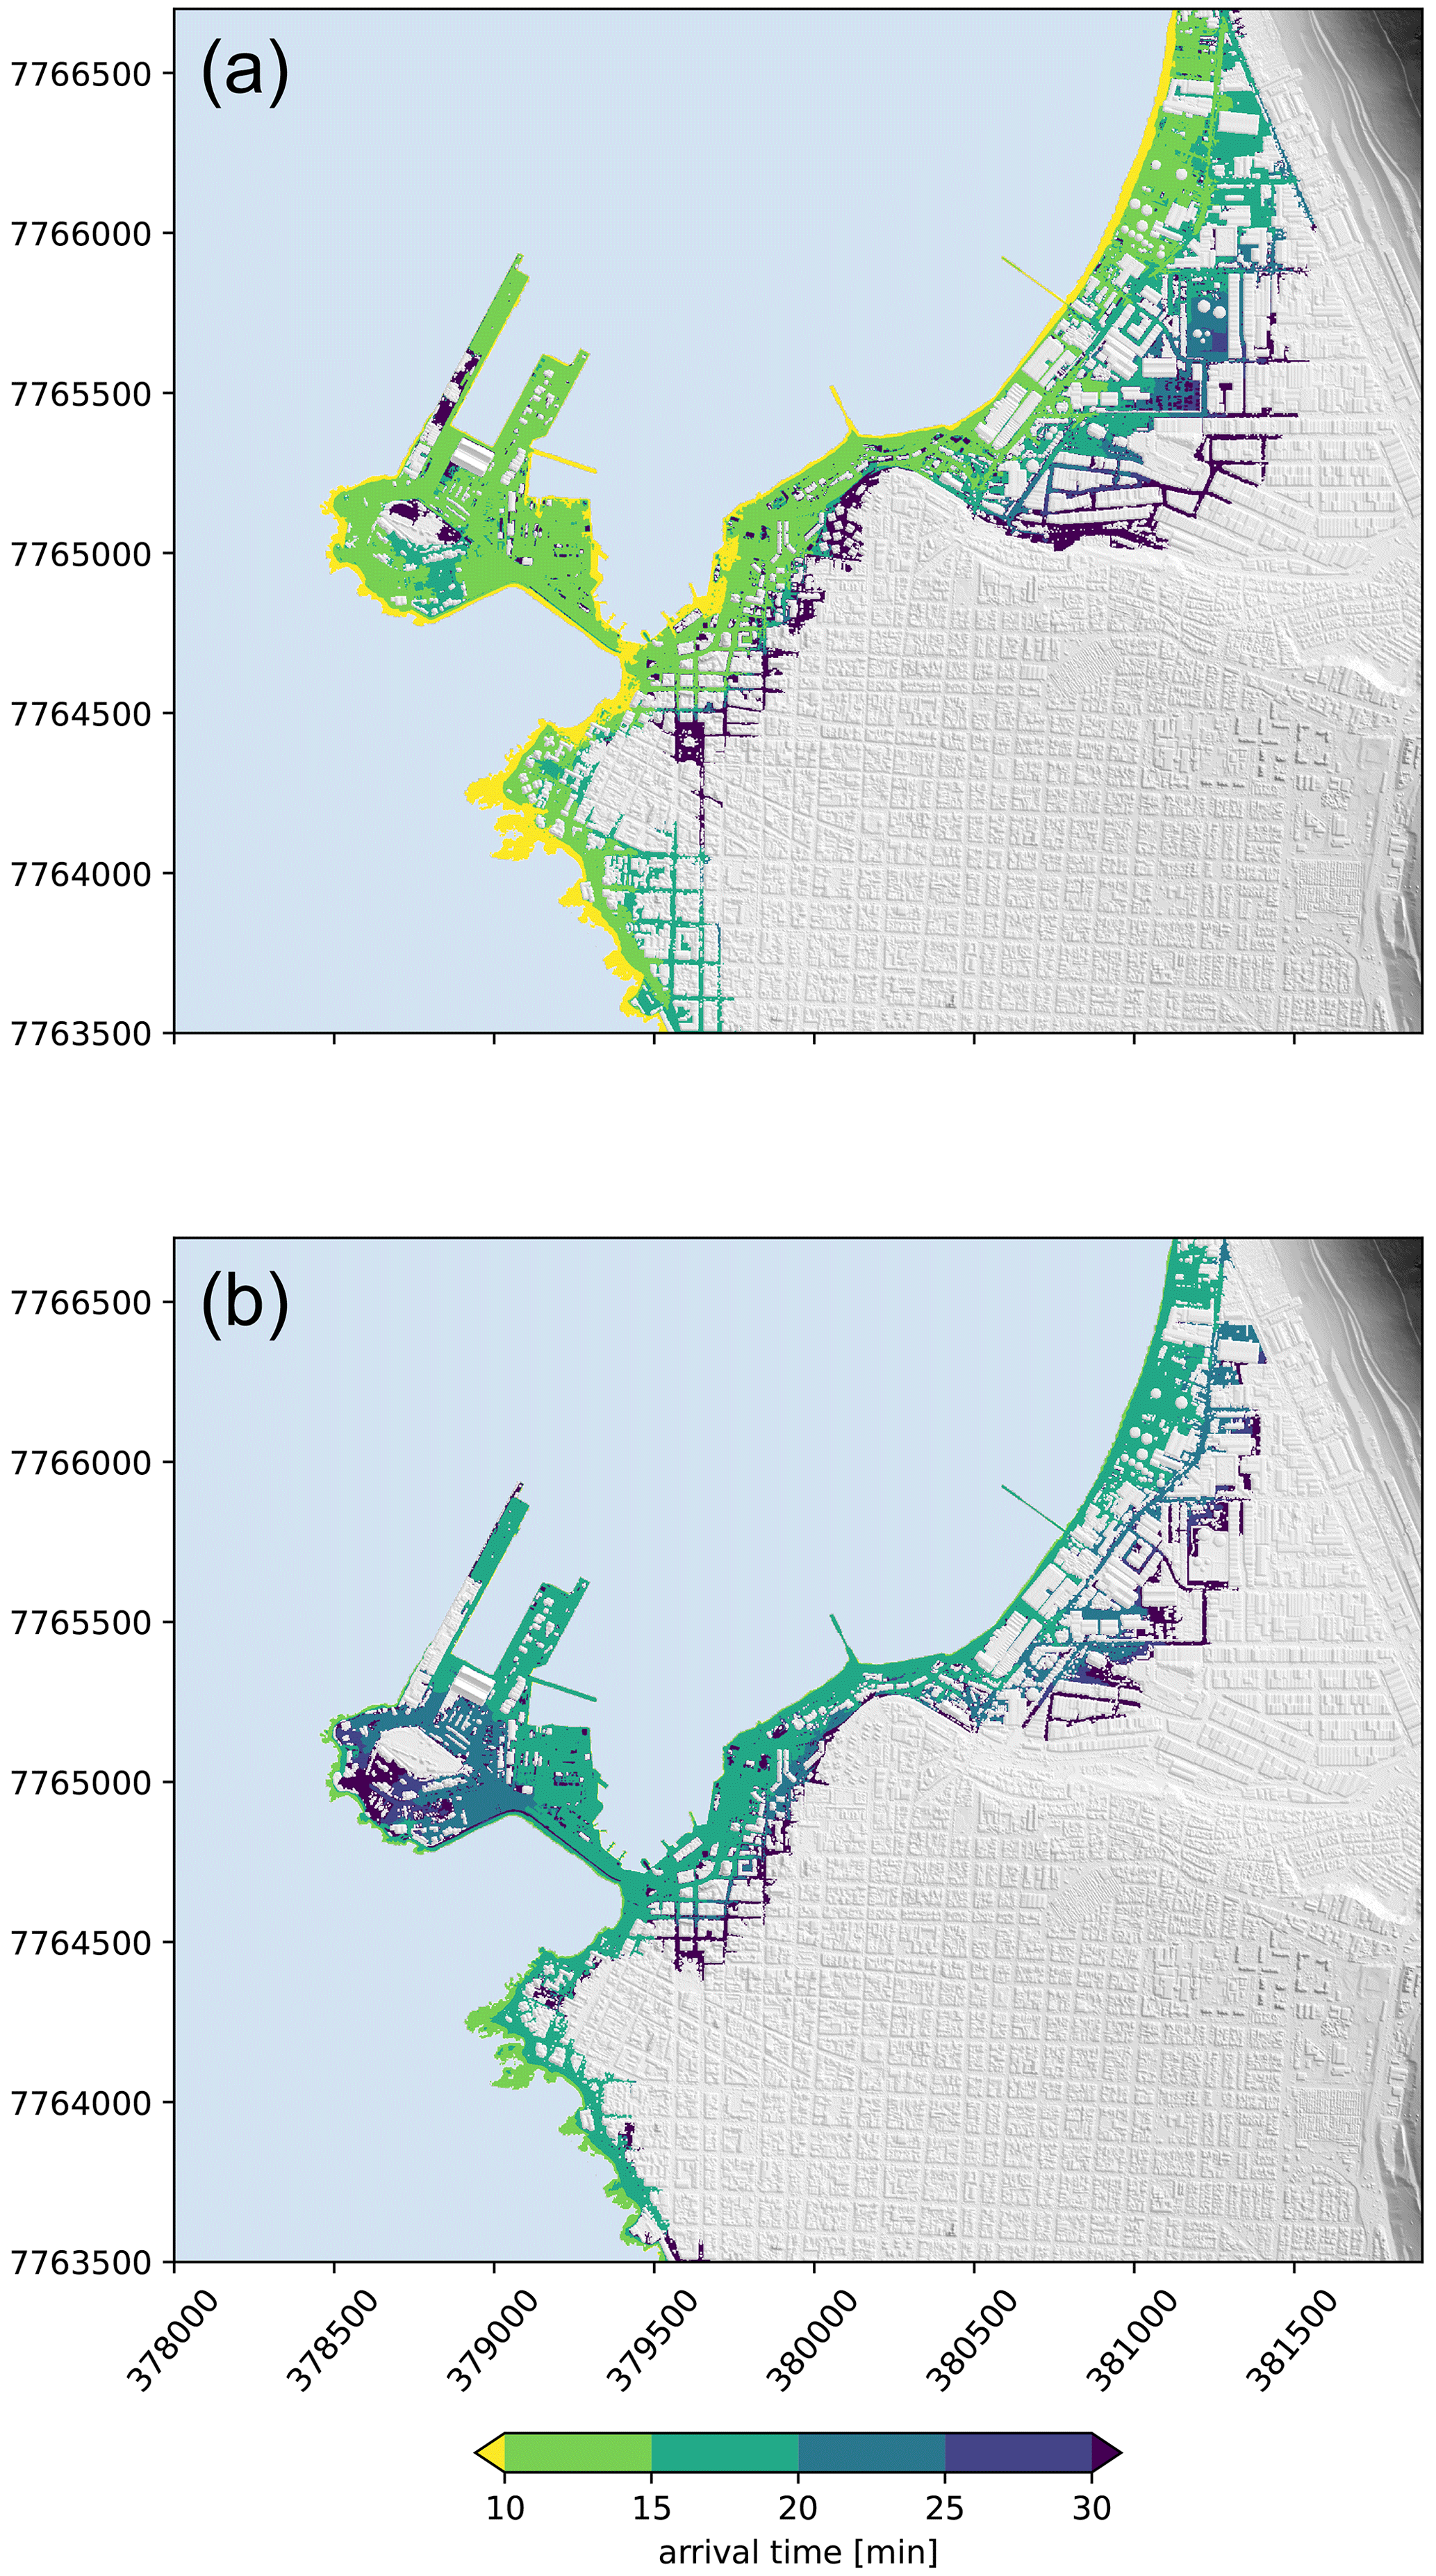
Figure 7Tsunami arrival time maps for the modeled scenarios. (a) Mw 9.0 earthquake. (b) Mw 8.4 earthquake.
4.2 Assessment of the modeled evacuation curves
On 8 August 2013, the National Office of Emergency (ONEMI) carried out a tsunami drill in the north of Chile as part of the national preparedness plans. In Tarapacá Region (Iquique is the regional capital), 76 000 people participated in the drill (Walker, 2013). During the drill, a research team of the Research Center of Integrated Disaster Risk Management (CIGIDEN) recorded the progress of the drill through a count of arrivals at meeting points on designated evacuation routes every 30 s. The counting of evacuees was used to build evacuation curves (Solís and Gazmuri, 2017). Here we use the evacuation curves built for O'Higgins Street, since data on the evacuation of Zegers Street could not be properly completed. Two independent measurements for evacuees are available for this street (see Fig. 8).
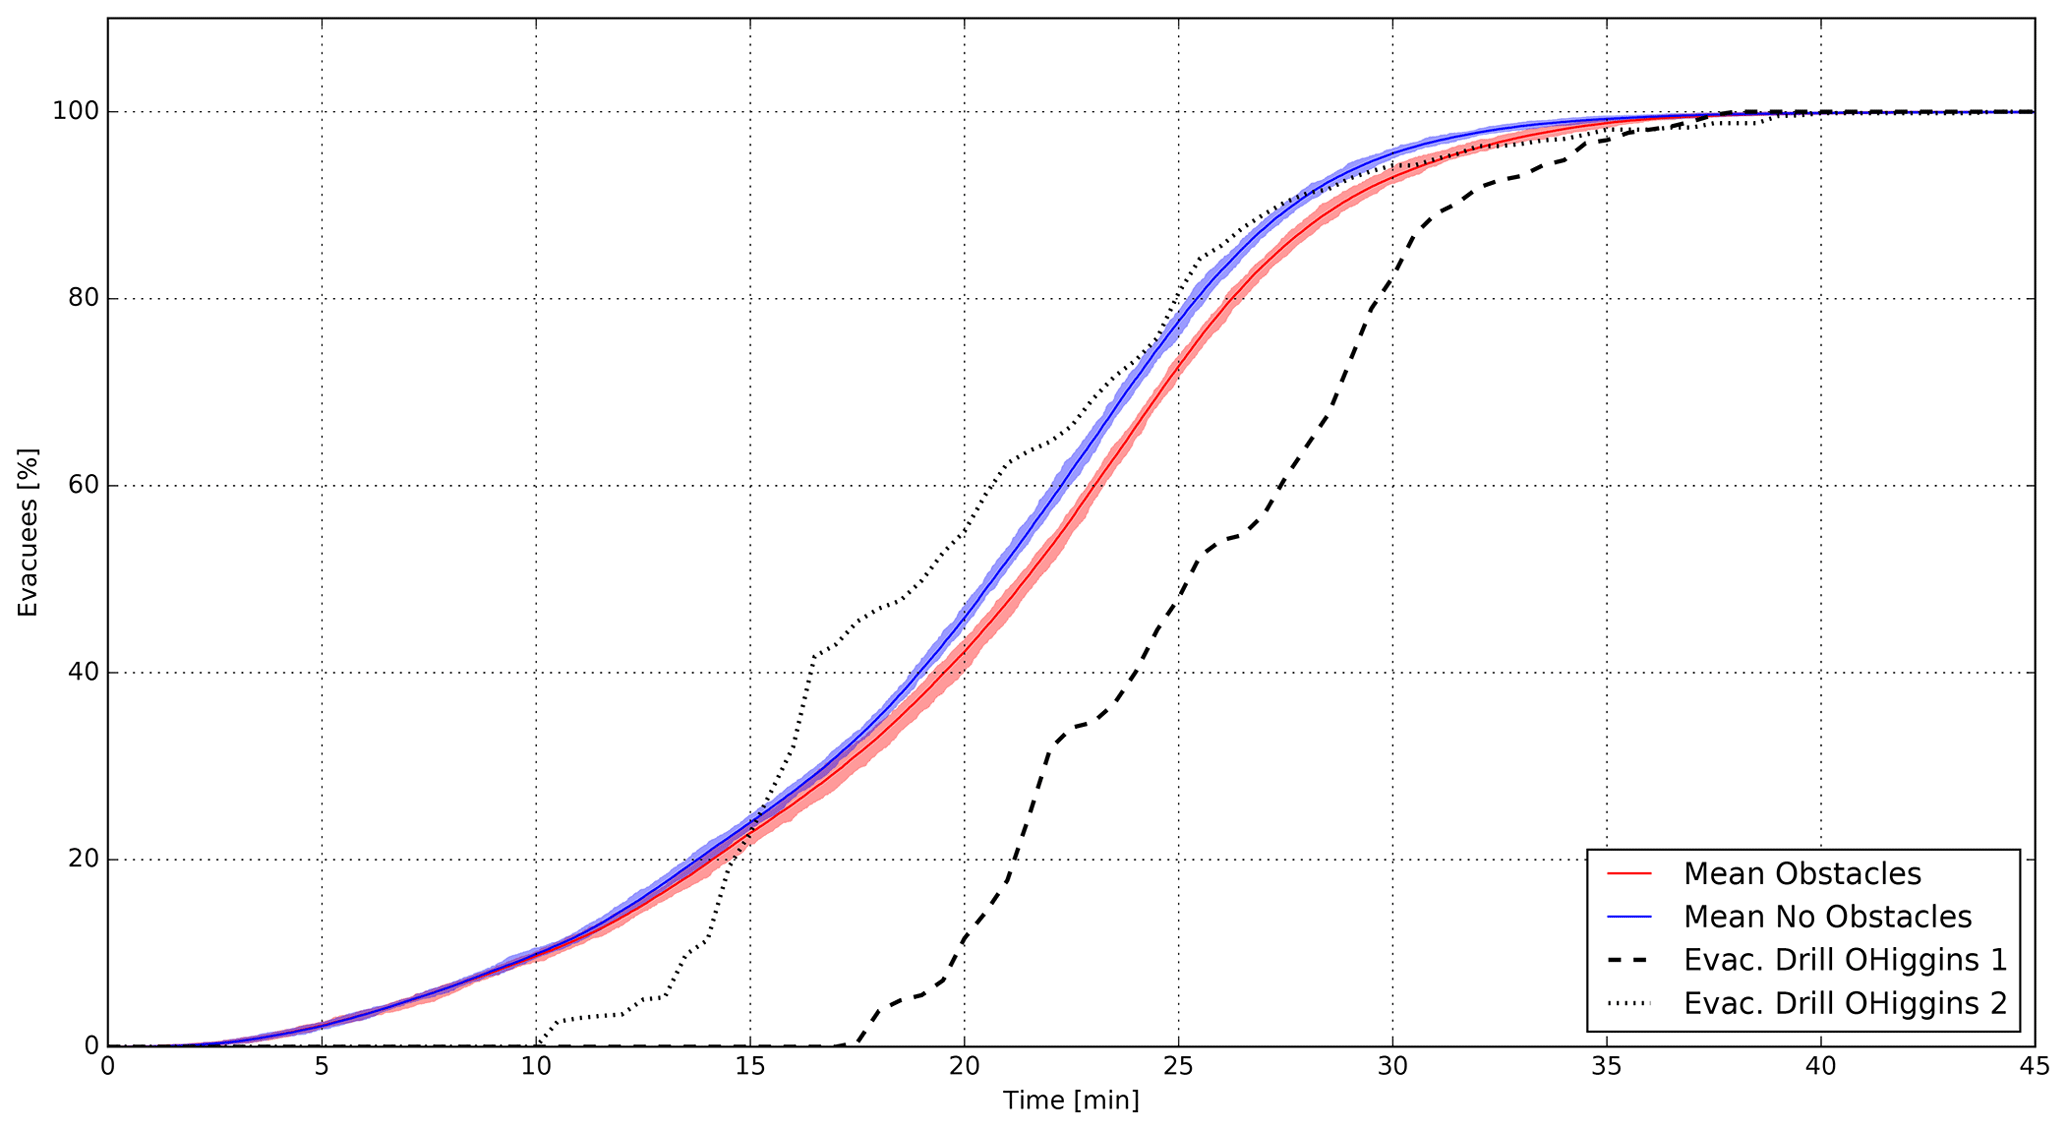
Figure 8Validation of evacuation curves for the daytime scenario using a mean departure time of 3 min compared with two measurements from the 8 August 2013 drill. The ABM is run with (red) and without (blue) urban micro-scale vulnerabilities – the maximum and minimum limits of the simulation settings are shown, and the center line corresponds to the average curve.
It is observed that the final evacuation times are close to 35 min, with no major differences between the simulations and the drill measurements. However, the shapes of the evacuation curves differ, especially for the initial times, which could be explained by a low turnout of people located in areas closer to the safe zone, whose times of arrivals are shorter. Moreover, as participation in the exercise was not mandatory, it is likely that the recorded participants’ departure locations were unevenly distributed across the city, with a more significant participation rate in areas close to the sea (therefore with longer evacuation times). On the other hand, the evacuation drills in Chile require the population to wait for 2–3 min before starting the evacuation after the warning is released; in the case of the modeled evacuation with the shorter departure time of 3 min, the Rayleigh distribution allows a few agents to begin to move as soon as the modeled earthquake begins.
Despite these differences, the model is capable of reflecting, with significant accuracy, the required times for total evacuation, as measured during the drill (roughly 35 min), and shows similar evacuation rates to those collected during the exercise for the evacuation period after 17 min of evacuation.
4.3 Evacuation process under the modeled tsunami scenarios
We present the results of the ABM evacuation simulations for Zegers Street considering (i) nighttime and daytime scenarios, (ii) scenarios with and without the effect of urban micro-scale vulnerabilities, and (iii) three times for the initiation of the agents' evacuation. We assume a mean departure time of min for an optimistic scenario where the agents start the evacuation immediately after the seismic shaking, a mean departure time of min assuming that most of the agents start evacuating once the tsunami alarm is activated, and a pessimistic scenario where the agents start evacuating at min when the first tsunami waves are visible.
Thus, a total of 12 combinations are simulated to assess the evacuation process. For each scenario, 30 ABM simulations are run to capture the variability in the initial spatial distribution of the agents within the blocks adjacent to Zegers Street, the speed functions, and the departure times; by doing so we expect to achieve an error of less than 1 % in the number of evacuees at each time, using a confidence interval of 95 % (Byrne, 2013; Ritter et al., 2011).
In Fig. 9 we present the average evacuation curves for each modeled scenario, in which the upper curves correspond to the results of the daytime scenarios (with more agents to be evacuated) and the lower curves to the nighttime scenarios. The total time needed to completely evacuate the agents to safe zones does not undergo significant variations in response to changes in the population distribution, since the differences in the distances that the agents have to travel along the evacuation route and the agent speed functions show a moderate variability within the simulations. On the other hand, the differences between scenarios where agents encounter urban micro-scale vulnerabilities are also mild but may not be negligible. The maximum instantaneous difference in the number of evacuees (with and without urban micro-scale vulnerabilities) for the case of min is nearly 250 agents in the daytime scenario and 180 agents in the nighttime scenario (see Fig. 11). When the mean departure time increases, the maximum instantaneous difference in evacuees tends to decrease, since the route appears to be less congested; as expected, urban micro-scale vulnerabilities have more influence on the evacuation process as the route becomes more crowded.
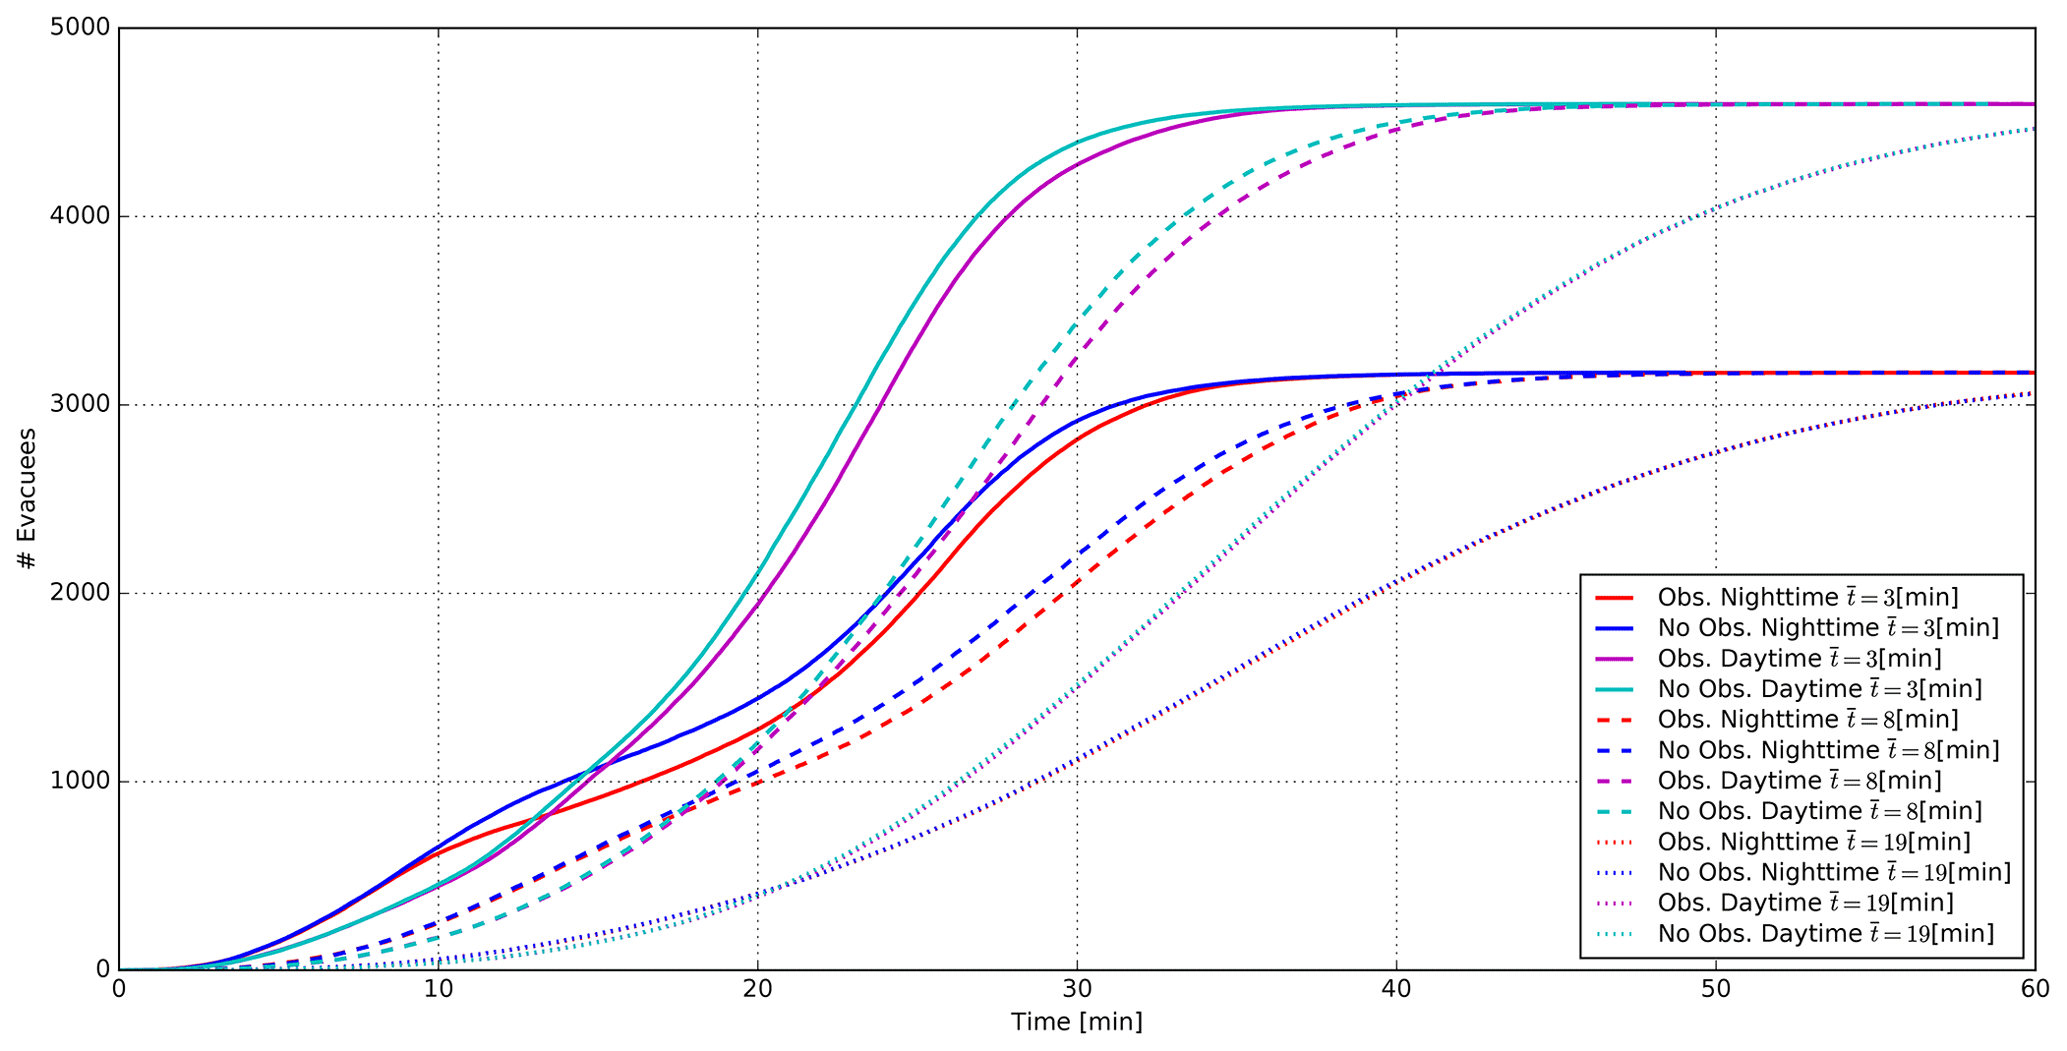
Figure 9Average evacuation curves for the 12 modeled scenarios considering the presence and absence of urban micro-scale vulnerabilities, different departure times, and the nighttime and daytime spatial distribution of agents.
The effects of the modification of the mean departure time on the evacuation curves can also be observed in Fig. 9. When the agents start evacuating with a mean departure time of min, the evacuation of the total population is reached after 40 min. On the other hand, when the agents' starting evacuation time is set to min, the time needed for a complete evacuation is around 50 min. In the pessimistic scenario when min, more than 1 h is needed to complete the process.
We now perform the analysis of the evacuation process considering the tsunami inundation scenarios. Since the ABM simulation gives the position of each agent over time with a 1 s resolution and the tsunami inundation is also modeled at high spatial and temporal resolution, it is possible to estimate the number of agents that are reached by the tsunami at each time. We show a snapshot of the ABM and tsunami simulations in Fig. 10. The two tsunami scenarios (Mw 9.0 and Mw 8.4) are run for a mean tide level and a high tide level. In Tables 1 and 2 we summarize the percentage of agents (of the total) that are reached by the tsunami under the different studied cases. For the two tsunamigenic scenarios, when the agents' mean departure time is set to min, the percentage of agents reached by the tsunami is zero or very low (less than 0.2 %), thus demonstrating that a prompt evacuation starting immediately after the earthquake is paramount to saving lives.
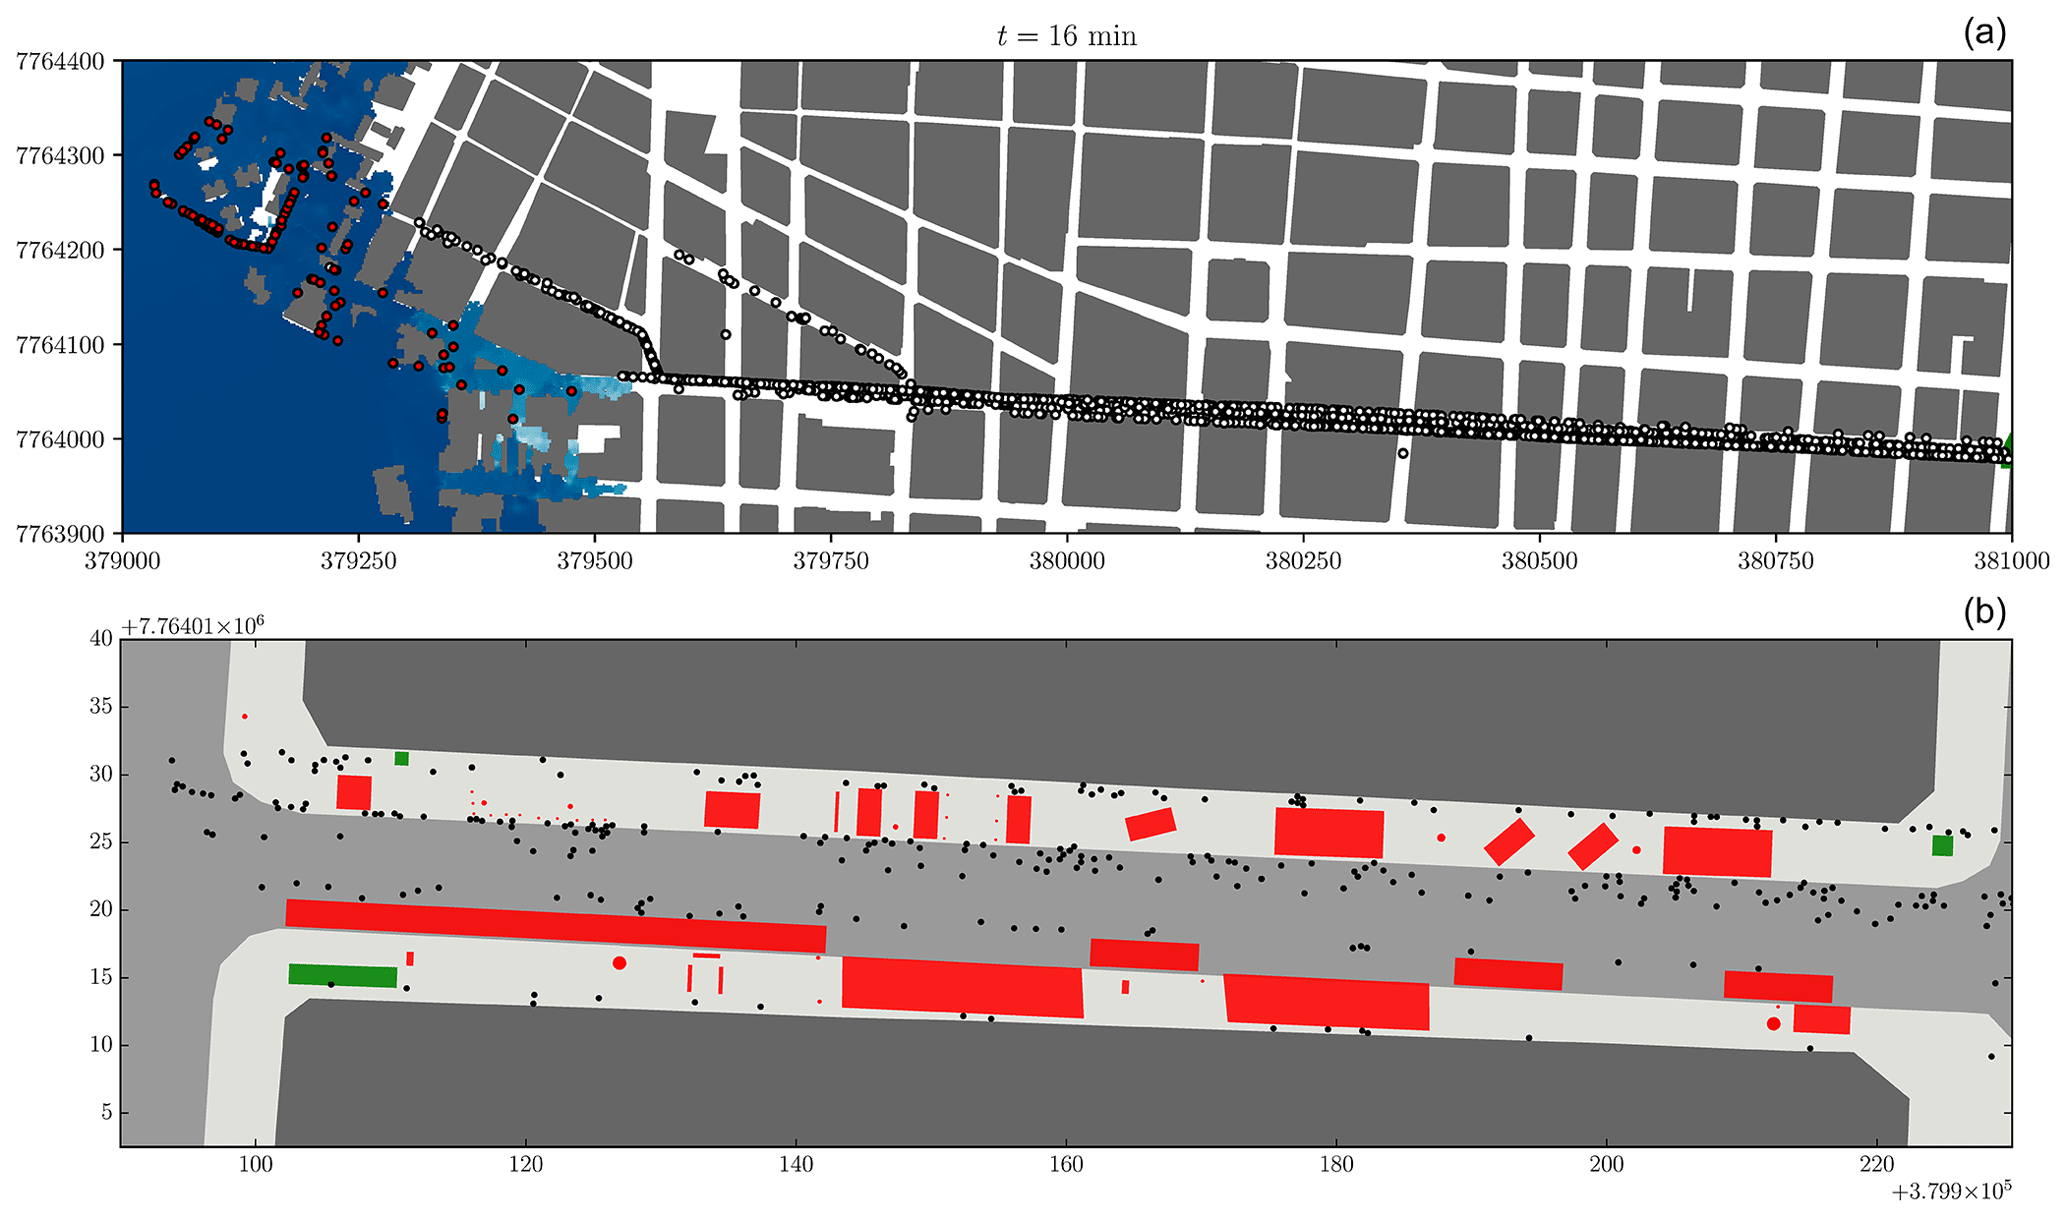
Figure 10Snapshots of the ABM simulation for the Zegers evacuation route. (a) The first tsunami arrivals are shown for the Mw 9.0 scenario at time t=16 min; agents colored in white are in the process of evacuating, while those colored in red have been reached by the tsunami. (b) Example of a street segment and the representation of urban micro-vulnerabilities: obstacles that impose a speed reduction are depicted in green, while the ones that block the agents' passage are colored in red.
Table 1Percentage of agents reached by the tsunami under the Mw 8.4 scenario assuming mean tide and high tide (in parentheses).

Table 2Percentage of agents reached by the tsunami under the Mw 9.0 scenario assuming mean tide and high tide (in parentheses).
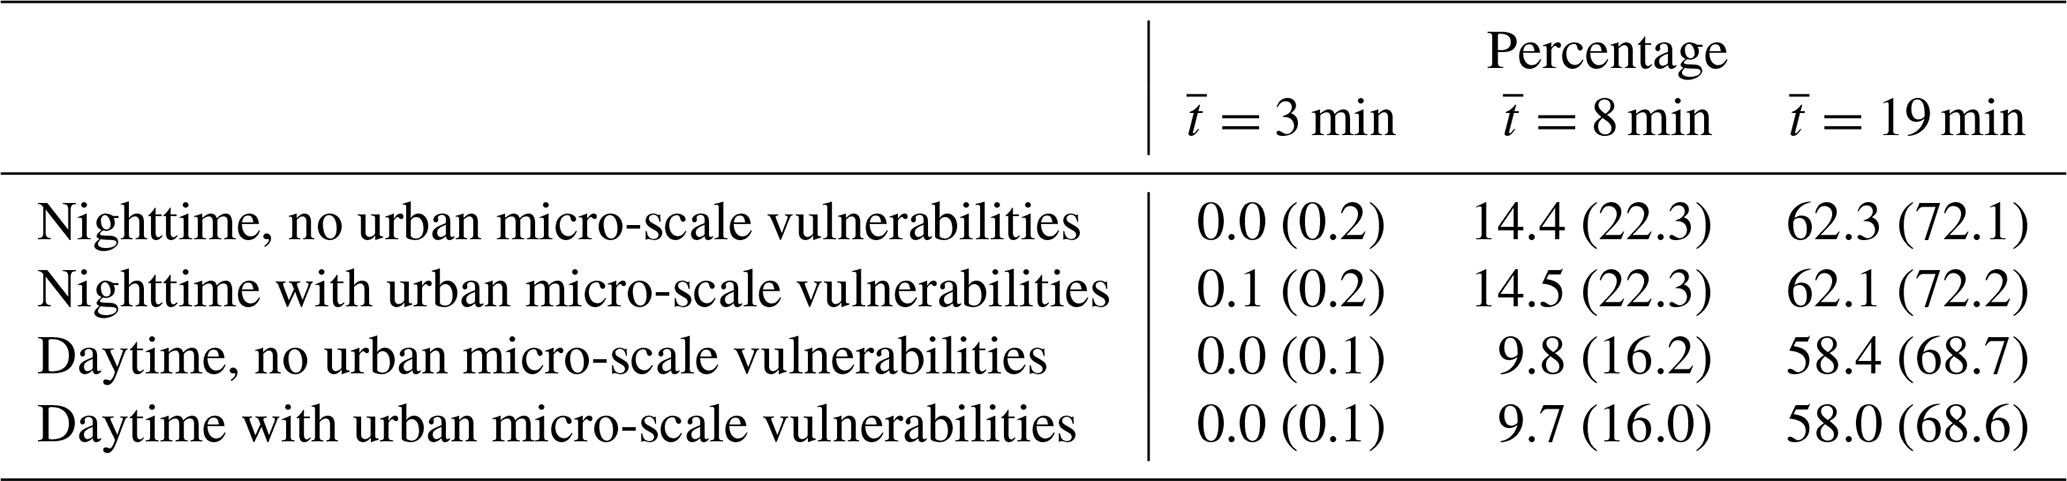
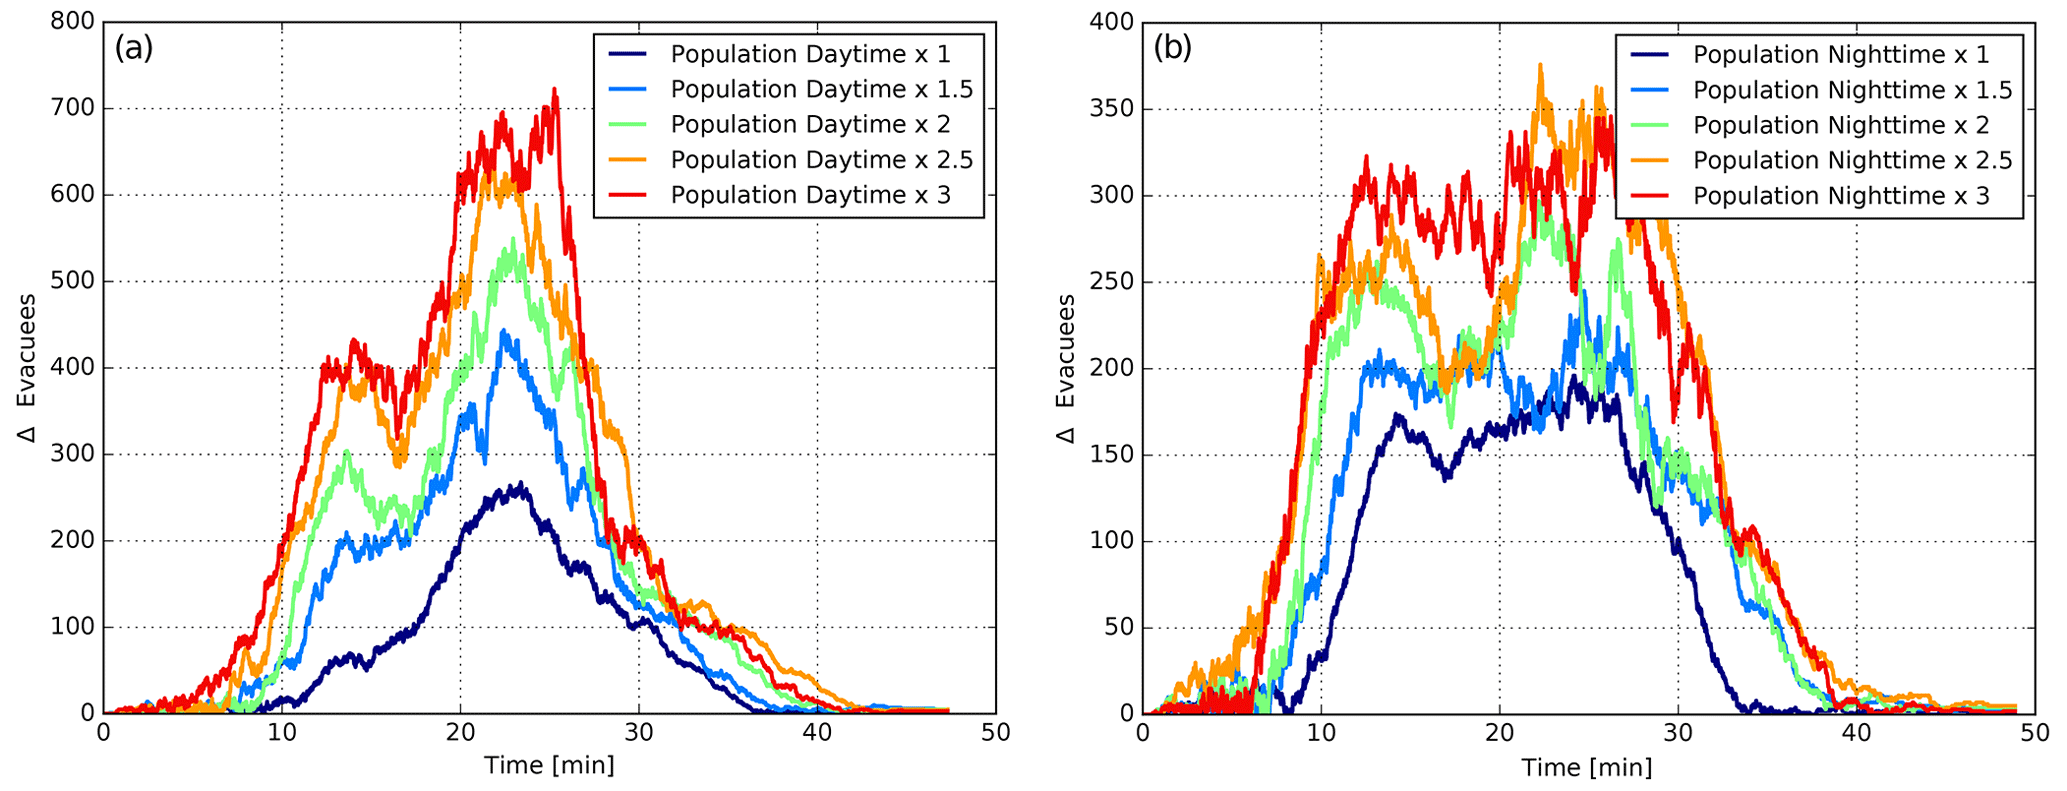
Figure 11Quantification of the impact of urban micro-vulnerabilities in the evacuation process. “Δ Evacuees” is the difference between scenarios without and with urban micro-vulnerabilities when the total number of agents is increased by factors of 1.5, 2, 2.5, and 3. (a) Daytime scenario. (b) Nighttime scenario.
When the mean departure time is min, the percentage of agents caught by the tsunami increases significantly, with values between 1.5 % and 4.0 % for the Mw 8.4 earthquake and between 9.7 % and 22.3 % for the Mw 9.0 scenario. It is important to note that in the nighttime case, more agents are reached by the tsunami, especially in the Mw 9.0 earthquake. The latter is due to the residential nature of the housing that is located very close to the coastline, implying that a higher number of agents are exposed to the tsunami within the first blocks during nighttime (see Fig. 6). No significant differences between the cases with and without urban micro-scale vulnerabilities are observed, while the percentage of agents caught by the tsunami is much higher for the simulations under high tide.
In the pessimistic case with a mean evacuation departure time of min, the percentage of agents reached by the tsunami shows a radical increase. For the Mw 8.4 scenario, nearly 30 % of the agents are caught by the tsunami for the mean tide case, while around 50 % are reached when the tsunami simulation is performed under high-tide conditions. For the Mw 9.0 earthquake, the percentage of agents that are reached by the inundation is around 60 % and 70 % for the mean and high tide case, respectively. It is worth noting for the Mw 9.0 earthquake that more agents are caught by the tsunami under the nighttime scenario (though only 3 %–4 % more), consistent with the previous results, but the situation is the opposite for the Mw 8.4 earthquake under high tide, where more agents are reached during the daytime. The latter may be due to the arrival of the first waves within 20–25 min over the blocks having a high rate of occupancy in the daytime (see Fig. 6). On the other hand, again, the influence of the urban micro-scale vulnerabilities is not decisive for the evacuation process.
The analysis we conducted did not show overall significant influences of the urban micro-scale vulnerabilities on the evacuation processes. However, it was shown that the latter would depend on the level of congestion, so we now attempt to measure the influence of micro-scale vulnerabilities by computing the differences in the number of evacuees at each time for simulations with and without their presence. To quantitatively assess this, we perform ABM simulations with min, increasing the total number of agents in the daytime and nighttime scenarios by factors of 1.5, 2, 2.5, and 3. In Fig. 11 we show the resulting differences in the number of evacuees reaching the safe zone. In the daytime scenario the maximum difference in evacuees increases from 250 to 550 (2.2 times higher) when the number of agents is doubled and to 720 (+2.9 times) when it is tripled. For the nighttime scenario, the maximum difference of 180 evacuees increases to 290 (+1.6 times) and 370 (+2.06 times) when the total number of agents is doubled and tripled, respectively. It is thus shown that as the evacuation route becomes more crowded, the delays that the presence of urban micro-scale vulnerabilities induces in the evacuation processes increase.
The relatively small influence of the urban micro-scale vulnerabilities on the outcomes of an evacuation process in the study area could rapidly change if other real-world conditions (consistent with observations during tsunami emergencies in Chile) are included in the model. For instance, while our analysis considered that agents could use both the sidewalks and the road as a movement area, tsunami evacuations in other cities have shown that this can be unfeasible due to full road occupancy provoked by automobile traffic congestion (León et al., 2022). In such a case, where evacuees might be confined to the sidewalks, urban micro-scale vulnerabilities' impact on evacuee speeds could be much higher.
The expected impact of the urban micro-scale vulnerabilities on pedestrian evacuation time could also change depending on the chosen modeling technique and how it assesses the effect of the agents' agglomeration density. For instance, queuing models focused on evacuation (e.g., Lämmel et al., 2010) typically simulate the urban realm as a network of links and nodes throughout which agents move. Each link has a definite capacity that limits the number of evacuees that can simultaneously be within it, and, therefore, incoming agents must wait to enter the link if there is not enough available space. Other network-based models (Goto et al., 2012; Wang and Jia, 2021) use the spatial properties of each street link (width, length) to estimate its area and then apply a continuous function to assess the impact of the agents' density on their pedestrian speed within it. León et al. (2021) proposed a raster-based agent-based model where each agent assesses the density of agents located in its next destination cell along its escape path. If this density surpasses 1.3 agents m−2, the agent changes direction to avoid it (therefore its evacuation path length and time increase). In future work, different agent-based models could be used to assess the same evacuation scenario and micro-scale parameters in Iquique, and subsequently a sensitivity analysis could be performed to examine how the results change among them.
The approach accounting for urban micro-scale vulnerabilities could also be used to assess how post-earthquake urban scenarios could dynamically affect evacuation. In this respect, existing models (Aguirre et al., 2018) use the material characteristics of the building stock to estimate the amount of seismic-related damage that a given tsunamigenic earthquake can provoke in a city. In turn, this analysis could lead to an assessment of the likely amount of debris to be deposited along the streets. In the agent-based model, this debris could be included as new micro-scale vulnerabilities that further delay the evacuation (e.g., Castro et al., 2019).
A limitation of our modeling approach is that the spatial distribution of micro-vulnerabilities considered only a daytime scenario, when impeding obstacles such as restaurant tables and chairs, advertisement objects, and areas of informal street vending are placed directly on sidewalks. As this distribution is time-dependent, it is prone to change during other periods such as nighttime and holidays. Despite this limitation, it allowed us to assess a worst-case scenario for which risk-reduction approaches could be developed. Further field surveys could be conducted during different time scenarios for delivering time-specific risk assessments.
Another modeling variable that could be scenario-dependent is the average departure time. The three studied mean starting times (3, 8, and 19 min) might change significantly, for instance, during a nighttime evacuation. In such a case, people could be woken up by the strong shaking or by the subsequent sirens, power shortages would not allow warnings to be broadcast through the emergency system, or the lack of natural light could impede visual analysis of the sea conditions. All these cases could lead to delayed departures beyond our assumptions. Future research could tackle this problem by conducting post-disaster surveys aimed at grasping real-world evacuation behaviors, including actual departure times. An example of this type of research is shown by Kubisch et al. (2020), who examined this problem in the aftermath of the 2010 Talcahuano tsunami in Chile.
Recent progress in tsunami sciences and disaster risk management has provided better early warning systems, protocols, and plans to improve the evacuation response of the population and ultimately save lives. However, the analysis of the impact that the so-called urban micro-scale vulnerabilities (which result from poor maintenance or practices along evacuation routes) may have on evacuation processes has received only little attention in the specialized literature. We have thus conducted here a series of agent-based model (ABM) simulations to assess the effects that the urban micro-scale vulnerabilities identified in the city of Iquique in Chile could have on the number of evacuees that might escape from the tsunami along one of the main evacuation routes in the city. Two demanding tsunamigenic scenarios with arrival times of between 15–20 min were considered to assess the evacuation process along Zegers Street located in the downtown of the city. Daytime and nighttime scenarios were considered, and three different average evacuation starting times were assumed in the evacuation simulations.
The most important variable controlling the number of agents caught by the tsunami was shown to be the average departure time for the evacuation. A self-evacuation immediately after the earthquake (3 min) would allow almost all agents in the studied area to be saved under all the considered scenarios. On the contrary, a delayed evacuation with an average time of 19 min would result in a large increase (between 30 % and 70 %) in the number of agents reached by the tsunami.
The differences in evacuation times with and without the presence of urban micro-scale vulnerabilities in Zegers Street were mild but not negligible and are more important as the average departure evacuation time is reduced (and the evacuation route is more crowded). Nevertheless, their effect on the number of agents caught by the tsunami was not decisive in the studied case. Through additional simulations that considered doubling and tripling the total number of agents, it was shown that as the evacuation route becomes more crowded, the delays that the presence of urban micro-vulnerabilities induces in the evacuation processes may increase significantly. Thus, the relatively small effect of the micro-scale vulnerabilities on the outcomes of an evacuation process in the study area could rapidly change if other real-world conditions, such as a full road occupancy provoked by automobile traffic congestion, are considered. In cases where evacuees are confined to the sidewalks, urban micro-scale vulnerabilities' impact on their speeds could be much higher.
The codes used in this work can be made available upon request to the authors.
The data used in this work can be made available upon request to the authors, but we must comply with third-party restrictions (i.e., topo-bathymetric data).
RC and JL conceived, conceptualized, and supervised the research work. RC organized and edited the manuscript. GÁ and SC compiled the required data, implemented the ABM evacuation model, and produced the outputs and graphics. AU and GÁ prepared the required data, implemented the tsunami model, ran the tsunami simulations, and prepared the outputs and graphics. All co-authors participated in the analysis of the results and discussions and contributed to the edition of the final paper.
The contact author has declared that none of the authors has any competing interests.
Publisher's note: Copernicus Publications remains neutral with regard to jurisdictional claims made in the text, published maps, institutional affiliations, or any other geographical representation in this paper. While Copernicus Publications makes every effort to include appropriate place names, the final responsibility lies with the authors.
This article is part of the special issue “Multi-risk assessment in the Andes region”. It is not associated with a conference.
This research work was undertaken thanks to the support of the Centro de Investigación para la Gestión Integrada del Riesgo de Desastres (CIGIDEN). We acknowledge the support of the national Hydrographic and Oceanographic Service of the Chilean Navy (SHOA) and the JICA–JST Satreps program for providing the high-resolution topo-bathymetric data required for the tsunami simulations. We also thank the National Service for Disaster Prevention and Response (SENAPRED) for the support they provided during the tsunami evacuation drills undertaken in the city of Iquique.
This research has been supported by the Agencia Nacional de Investigación y Desarrollo (grant no. ANID/Fondap/1523A0009).
This paper was edited by Torsten Riedlinger and reviewed by two anonymous referees.
Aguilar, L. and Wijerathne, M.: On a Mass Evacuation Simulator with Complex Autonomous Agents and Applications, J. Earthq. Tsunami, 10, 1640021, https://doi.org/10.1142/S1793431116400212, 2016. a
Aguirre, P., Vásquez, J., de la Llera, J. C., González, J., and González, G.: Earthquake damage assessment for deterministic scenarios in Iquique, Chile, Na. Hazards, 92, 1433–1461, 2018. a
Allan, P., Bryant, M., Wirsching, C., Garcia, D., and Teresa Rodriguez, M.: The influence of urban morphology on the resilience of cities following an earthquake, J. Urb. Design, 18, 242–262, 2013. a
Álvarez, G., Quiroz, M., León, J., and Cienfuegos, R.: Identification and classification of urban micro-vulnerabilities in tsunami evacuation routes for the city of Iquique, Chile, Nat. Hazards Earth Syst. Sci., 18, 2027–2039, https://doi.org/10.5194/nhess-18-2027-2018, 2018. a, b, c, d, e, f, g, h, i, j, k
An, C., Sepúlveda, I., and Liu, P. L.-F.: Tsunami source and its validation of the 2014 Iquique, Chile, earthquake, Geophys. Res. Lett., 41, 3988–3994, 2014. a, b, c
Berger, M. J., George, D. L., LeVeque, R. J., and Mandli, K. T.: The GeoClaw software for depth-averaged flows with adaptive refinement, Adv. Water Resour., 34, 1195–1206, 2011. a
Byrne, M. D.: How many times should a stochastic model be run? An approach based on confidence intervals, in: Proceedings of the 12th International conference on cognitive modeling, July 2013, Ottawa, 2013. a
Castro, S., Poulos, A., Herrera, J. C., and de la Llera, J. C.: Modeling the impact of earthquake-induced debris on tsunami evacuation times of coastal cities, Earthq. Spectra, 35, 137–158, 2019. a
Catalán, P., Aránguiz, R., González, G., Tomita, T., Cienfuegos, R., González, J., Shrivastava, M. N., Kumagai, K., Mokrani, C., Cortés, P., and Gubler, A.: The 1 April 2014 Pisagua tsunami: observations and modeling, Geophys. Res. Lett., 42, 2918–2925, 2015. a, b
Catalan, P. A., Gubler, A., Cañas, J., Zuñiga, C., Zelaya, C., Pizarro, L., Valdes, C., Mena, R., Toledo, E., and Cienfuegos, R.: Design and operational implementation of the integrated tsunami forecast and warning system in Chile (SIPAT), Coast. Eng. J., 62, 373–388, 2020. a
Charnkol, T. and Tanaboriboon, Y.: Tsunami evacuation behavior analysis: One step of transportation disaster response, IATSS Res., 30, 83–96, 2006. a
Chlieh, M., Perfettini, H., Tavera, H., Avouac, J.-P., Remy, D., Nocquet, J.-M., Rolandone, F., Bondoux, F., Gabalda, G., and Bonvalot, S.: Interseismic coupling and seismic potential along the Central Andes subduction zone, J. Geophys. Res.-Solid, 116, B12405, https://doi.org/10.1029/2010JB008166, 2011. a, b
Cienfuegos, R., Catalán, P. A., Urrutia, A., Benavente, R., Aránguiz, R., and González, G.: What can we do to forecast tsunami hazards in the near field given large epistemic uncertainty in rapid seismic source inversions?, Geophys. Res. Lett., 45, 4944–4955, 2018. a, b
Comte, D. and Pardo, M.: Reappraisal of great historical earthquakes in the northern Chile and southern Peru seismic gaps, Nat. Hazards, 4, 23–44, 1991. a
Crowell, B. W., Schmidt, D. A., Bodin, P., Vidale, J. E., Gomberg, J., Renate Hartog, J., Kress, V. C., Melbourne, T. I., Santillan, M., Minson, S. E., and Jamison, D. G.: Demonstration of the Cascadia G-FAST geodetic earthquake early warning system for the Nisqually, Washington, earthquake, Seismolog. Res. Lett., 87, 930–943, https://doi.org/10.1785/0220150255, 2016. a
Daamen, W. and Hoogendoorn, S. P.: Free speed distributions-Based on empirical data in different traffic conditions, in: Pedestrian and evacuation dynamics 2005, Springer, 13–25, ISBN 978-3-540-47062-5, 2007. a
Dijkstra, E. W.: A note on two problems in connexion with graphs, Numer. Math., 1, 269–271, https://doi.org/10.1007/BF01386390, 1959. a
Fraser, S. A., Wood, N. J., Johnston, D. M., Leonard, G. S., Greening, P. D., and Rossetto, T.: Variable population exposure and distributed travel speeds in least-cost tsunami evacuation modelling, Nat. Hazards Earth Syst. Sci., 14, 2975–2991, https://doi.org/10.5194/nhess-14-2975-2014, 2014. a
Fujiyama, T. and Tyler, N.: Pedestrian speeds on stairs: an initial step for a simulation model, in: Proceedings of 36th Universities Transport Studies Group Conference, January 2004, Life Science Centre, Newcastle upon Tyne, https://discovery.ucl.ac.uk/id/eprint/1241/ (last access: 25 April 2024), 2004. a
González, J., González, G., Aránguiz, R., Melgar, D., Zamora, N., Shrivastava, M. N., Das, R., Catalan, P. A., and Cienfuegos, R.: A hybrid deterministic and stochastic approach for tsunami hazard assessment in Iquique, Chile, Nat. Hazards, 100, 231–254, 2020. a
Goto, Y., Affan, M., Nurdin, Y., Yuliana, D. K., and Ardiansyah: Tsunami evacuation simulation for disaster education and city planning, J. Disast. Res., 7, 92–101, 2012. a
Gusman, A. R. and Tanioka, Y.: W phase inversion and tsunami inundation modeling for tsunami early warning: Case study for the 2011 Tohoku event, Pure Appl. Geophys., 171, 1409–1422, 2014. a
Gusman, A. R., Murotani, S., Satake, K., Heidarzadeh, M., Gunawan, E., Watada, S., and Schurr, B.: Fault slip distribution of the 2014 Iquique, Chile, earthquake estimated from ocean-wide tsunami waveforms and GPS data, Geophys. Res. Lett., 42, 1053–1060, 2015. a, b, c, d
Hayes, G. P., Herman, M. W., Barnhart, W. D., Furlong, K. P., Riquelme, S., Benz, H. M., Bergman, E., Barrientos, S., Earle, P. S., and Samsonov, S.: Continuing megathrust earthquake potential in Chile after the 2014 Iquique earthquake, Nature, 512, 295–298, 2014. a
Heidarzadeh, M., Satake, K., Murotani, S., Gusman, A. R., and Watada, S.: Deep-water characteristics of the trans-Pacific tsunami from the 1 April 2014 Mw 8.2 Iquique, Chile earthquake, Pure Appl. Geophys., 172, 719–730, 2015. a
INE: Resultados XVII Censo de Población, Tech. rep., Instituto Nacional de Estadísticas, https://www.ine.gob.cl/estadisticas/sociales/censos-de-poblacion-y-vivienda/censo-de-poblacion-y-vivienda (last access: 25 April 2024), 2012. a, b
INE: Encuesta Anual de Vehículos en Circulación, Tech. rep., Instituto Nacional de Estadísticas, https://datos.gob.cl/organization/instituto_nacional_de_estadisticas, (last access: 25 April 2024), 2015. a
Jongman, B., Ward, P. J., and Aerts, J. C.: Global exposure to river and coastal flooding: Long term trends and changes, Global Environ. Change, 22, 823–835, 2012. a
Khew, Y. T. J., Jarzebski, M. P., Dyah, F., San Carlos, R., Gu, J., Esteban, M., Aránguiz, R., and Akiyama, T.: Assessment of social perception on the contribution of hard-infrastructure for tsunami mitigation to coastal community resilience after the 2010 tsunami: Greater Concepcion area, Chile, Int. J. Disast. Risk Reduct., 13, 324–333, 2015. a
Kitamura, F., Inazu, D., Ikeya, T., and Okayasu, A.: An allocating method of tsunami evacuation routes and refuges for minimizing expected casualties, Int. J. Disast. Risk Reduct., 45, 101519, https://doi.org/10.1016/j.ijdrr.2020.101519, 2020. a
Koshimura, S. and Shuto, N.: Response to the 2011 great East Japan earthquake and tsunami disaster, Philos. T. Roy. Soc. A, 373, 20140373, https://doi.org/10.1098/rsta.2014.0373, 2015. a
Kron, W.: Coasts: the high-risk areas of the world, Nat. Hazards, 66, 1363–1382, 2013. a
Kubisch, S., Guth, J., Keller, S., Bull, M. T., Keller, L., and Braun, A. C.: The contribution of tsunami evacuation analysis to evacuation planning in Chile: Applying a multi-perspective research design, Int. J. Disast. Risk Reduct., 45, 101462, https://doi.org/10.1016/j.ijdrr.2019.101462, 2020. a, b
Lämmel, G., Grether, D., and Nagel, K.: The representation and implementation of time-dependent inundation in large-scale microscopic evacuation simulations, Transport. Res. Pt. C, 18, 84–98, 2010. a
León, J. and March, A.: Urban morphology as a tool for supporting tsunami rapid resilience: A case study of Talcahuano, Chile, Habit. Int., 43, 250–262, 2014. a
León, J. and March, A.: An urban form response to disaster vulnerability: Improving tsunami evacuation in Iquique, Chile, Environ. Plan. B, 43, 826–847, 2016. a, b
León, J., Castro, S., Mokrani, C., and Gubler, A.: Tsunami evacuation analysis in the urban built environment: a multi-scale perspective through two modeling approaches in Viña del Mar, Chile, Coast. Eng. J., 62, 389–404, 2020. a, b
León, J., Vicuna, M., Ogueda, A., Guzman, S., Gubler, A., and Mokrani, C.: From urban form analysis to metrics for enhancing tsunami evacuation: Lessons from twelve Chilean cities, Int. J. Disast. Risk Reduct., 58, 102215, https://doi.org//10.1016/j.ijdrr.2021.102215, 2021. a
León, J., Gubler, A., and Ogueda, A.: Modelling geographical and built-environment attributes as predictors of human vulnerability during tsunami evacuations: a multi-case-study and paths to improvement, Nat. Hazards Earth Syst. Sci., 22, 2857–2878, https://doi.org/10.5194/nhess-22-2857-2022, 2022. a, b
Li, S., Moreno, M., Bedford, J., Rosenau, M., and Oncken, O.: Revisiting viscoelastic effects on interseismic deformation and locking degree: A case study of the Peru-North Chile subduction zone, J. Geophys. Res.-Solid, 120, 4522–4538, 2015. a
Lomnitz, C.: Major Earthquakes of Chile: A Historical Survey, 1535–1960, Seismolog. Res. Lett., 75, 368–375, 2004. a
Maeda, T., Obara, K., Shinohara, M., Kanazawa, T., and Uehira, K.: Successive estimation of a tsunami wavefield without earthquake source data: A data assimilation approach toward real-time tsunami forecasting, Geophys. Res. Lett., 42, 7923–7932, 2015. a
Makinoshima, F., Imamura, F., and Abe, Y.: Behavior from tsunami recorded in the multimedia sources at Kesennuma City in the 2011 Tohoku tsunami and its simulation by using the evacuation model with pedestrian – Car interaction, Coast. Engi. J,, 58, 1640023-1–1640023-28, https://doi.org/10.1142/S0578563416400234, 2016. a
Makinoshima, F., Imamura, F., and Abe, Y.: Enhancing a tsunami evacuation simulation for a multi-scenario analysis using parallel computing, Simul. Model. Pract. Theory, 83, 36–50, 2018. a
Makinoshima, F., Imamura, F., and Oishi, Y.: Tsunami evacuation processes based on human behaviour in past earthquakes and tsunamis: A literature review, Prog. Disast. Sci., 7, 100113, https://doi.org/10.1016/j.pdisas.2020.100113, 2020. a
Mas, E., Imamura, F., and Koshimura, S.: An agent based model for the tsunami evacuation simulation. A case study of the 2011 great east Japan tsunami in Arahama town, in: Joint Conference Proceeding. 9th International Conference on Urban Earthquake Engineering and 4th Asia Conference on Earthquake Engineering, Tokyo Institute of Technology, Tokyo, Japan, Citeseer, https://www.jsnds.org/jnds/34_1_3.pdf (last access: 25 April 2024), 2012. a
Mas, E., Koshimura, S., Imamura, F., Suppasri, A., Muhari, A., and Adriano, B.: Recent advances in agent-based tsunami evacuation simulations: case studies in Indonesia, Thailand, Japan and Peru, Pure Appl. Geophys., 172, 3409–3424, 2015. a
Melgar, D. and Bock, Y.: Kinematic earthquake source inversion and tsunami runup prediction with regional geophysical data, J. Geophys. Res.-Solid, 120, 3324–3349, 2015. a, b
Métois, M., Socquet, A., Vigny, C., Carrizo, D., Peyrat, S., Delorme, A., Maureira, E., Valderas-Bermejo, M.-C., and Ortega, I.: Revisiting the North Chile seismic gap segmentation using GPS-derived interseismic coupling, Geophys. J. Int., 194, 1283–1294, 2013. a, b
MINVU: Ordenanza general de urbanismo y construcciones, Ministerio de vivienda y urbanismo, Gobierno de Chile, https://www.minvu.gob.cl/wp-content/uploads/2019/05/OGUC-Sept-2023-D.S.-7-D.O.-28-09-2023-2.pdf (last access: 25 April 2024), 2016. a
Mostafizi, A., Wang, H., Cox, D., Cramer, L. A., and Dong, S.: Agent-based tsunami evacuation modeling of unplanned network disruptions for evidence-driven resource allocation and retrofitting strategies, Nat. Hazards, 88, 1347–1372, 2017. a
Mulia, I. E. and Satake, K.: Developments of tsunami observing systems in Japan, Front. Earth Sci., 8, 145, https://doi.org/10.3389/feart.2020.00145, 2020. a
Navarrete, P., Cienfuegos, R., Satake, K., Wang, Y., Urrutia, A., Benavente, R., Catalán, P., Crempien, J., and Mulia, I.: Sea surface network optimization for tsunami forecasting in the near field: application to the 2015 Illapel earthquake, Geophys. J. Int., 221, 1640–1650, 2020. a
Neumann, B., Vafeidis, A. T., Zimmermann, J., and Nicholls, R. J.: Future coastal population growth and exposure to sea-level rise and coastal flooding-a global assessment, PloSOne, 10, 1–34, 2015. a
Okada, Y.: Surface deformation due to shear and tensile faults in a half-space, Bull. Seismol. Soc. Am., 75, 1135–1154, 1985. a
ONEMI and IMI: Plan de Protección Civil ante Tsunami, Tech. rep., Oficina Nacional de Emergencia and Ilustre Municipalidad de Iquique, https://www.municipioiquique.cl/descargas/seguridad/mapas/Mapa_Tsunami_Iquique.pdf (last access: 25 April 2024), 2013. a
Poulos, A., Tocornal, F., de la Llera, J. C., and Mitrani-Reiser, J.: Validation of an agent-based building evacuation model with a school drill, Transport. Res. Pt. C, 97, 82–95, 2018. a, b
Rinne, T., Tillander, K., and Grönberg, P.: Data collection and analysis of evacuation situations, vol. 46, VTT Espoo, ISBN 978-951-38-7673-9, 2010. a
Ritter, F. E., Schoelles, M. J., Quigley, K. S., and Klein, L. C.: Determining the Number of Simulation Runs: Treating Simulations as Theories by Not Sampling Their Behavior, in: Human-in-the-Loop Simulations, edited by: Rothrock, L. and Narayanan, S., Springer, London, https://doi.org/10.1007/978-0-85729-883-6_5, 2011. a
Scheer, S. J., Varela, V., and Eftychidis, G.: A generic framework for tsunami evacuation planning, Phys. Chem. Earth Pt. A/B/C, 49, 79–91, 2012. a
Schmidtlein, M. C. and Wood, N. J.: Sensitivity of tsunami evacuation modeling to direction and land cover assumptions, Appl. Geogr., 56, 154–163, 2015. a
SECTRA: Encuesta de movilidad de centros urbanos, Secretaría de planificación de transportes, https://www.sectra.gob.cl/encuestas_movilidad/encuestas_movilidad.htm (last access: 25 April 2024), 2010. a
Shuto, N.: Tsunamis: Their Coastal Effects and Defense Works, in: Scientific Forum on the Tsunami, its Impact and Recovery, World Scientific, 1–12, https://doi.org/10.1142/9789814449434_0003, 2005. a
Solís, I. and Gazmuri, P.: Evaluation of the risk and the evacuation policy in the case of a tsunami in the city of Iquique, Chile, Nat. Hazards, 88, 503–532, 2017. a, b, c
Suppasri, A., Shuto, N., Imamura, F., Koshimura, S., Mas, E., and Yalciner, A. C.: Lessons learned from the 2011 Great East Japan tsunami: performance of tsunami countermeasures, coastal buildings, and tsunami evacuation in Japan, Pure Appl. Geophys., 170, 993–1018, 2013. a, b
Taubenböck, H., Goseberg, N., Setiadi, N., Lämmel, G., Moder, F., Oczipka, M., Klüpfel, H., Wahl, R., Schlurmann, T., Strunz, G., Birkmann, J., Nagel, K., Siegert, F., Lehmann, F., Dech, S., Gress, A., and Klein, R.: “Last-Mile” preparation for a potential disaster – Interdisciplinary approach towards tsunami early warning and an evacuation information system for the coastal city of Padang, Indonesia, Nat. Hazards Earth Syst. Sci., 9, 1509–1528, https://doi.org/10.5194/nhess-9-1509-2009, 2009. a
Tobler, W.: Three presentations on geographical analysis and modeling, vol. 93, https://geodyssey.neocities.org/papers/tobler93 (last access: 25 April 2024), 1993. a
Tomita, T., Kumagai, K., Mokrani, C., Cienfuegos, R., and Matsui, H.: Tsunami and Seismic Damage Caused by the Earthquake Off Iquique, Chile, in April, 2014, J. Earthq. Tsunami, 10, 1640003, https://doi.org/10.1142/S1793431116400030, 2016. a
Tsimopoulou, V., Jonkman, S., Kolen, B., Maaskant, B., Mori, N., and Yasuda, T.: A multi-layered safety perspective on the tsunami disaster in Tohoku, Japan, in: Proceedings of the Flood Risk 2012 conference, 19–23 November 2012, Rotterdam, the Netherlands, 981–990, 2013. a
Tumini, I., Villagra-Islas, P., and Herrmann-Lunecke, G.: Evaluating reconstruction effects on urban resilience: a comparison between two Chilean tsunami-prone cities, Nat. Hazards, 85, 1363–1392, 2017. a
UNESCO/IOC: Sea Level Station Monitoring Facility, http://ioc-sealevelmonitoring.org (last access: 1 March 2017), 2014. a
van den Berg, J., Guy, S. J., Lin, M., and Manocha, D.: Reciprocal n-Body Collision Avoidance, in: Robotics Research. Springer Tracts in Advanced Robotics, vol. 70, edited by: Pradalier, C., Siegwart, R., and Hirzinger, G., Springer, Berlin, Heidelberg, https://doi.org/10.1007/978-3-642-19457-3_1, 2011. a
Villagra, P. and Quintana, C.: Disaster governance for community resilience in coastal towns: Chilean case studies, Int. J. Environm. Res. Publ. Health, 14, 1063m, https://doi.org/10.3390/ijerph14091063, 2017. a
Villagra, P., Rojas, C., Ohno, R., Xue, M., and Gómez, K.: A GIS-base exploration of the relationships between open space systems and urban form for the adaptive capacity of cities after an earthquake: The cases of two Chilean cities, Appl. Geogr., 48, 64–78, 2014. a
Wächter, J., Babeyko, A., Fleischer, J., Häner, R., Hammitzsch, M., Kloth, A., and Lendholt, M.: Development of tsunami early warning systems and future challenges, Nat. Hazards Earth Syst. Sci., 12, 1923–1935, https://doi.org/10.5194/nhess-12-1923-2012, 2012. a
Walker, J.-M.: Informe Técnico de Evaluación Simulacro Macrozona de Terremoto y Tsunami, Evacuación del Borde Costero, Tech. rep., Oficina Nacional de Emergencia, 2013. a, b
Wang, H., Mostafizi, A., Cramer, L. A., Cox, D., and Park, H.: An agent-based model of a multimodal near-field tsunami evacuation: Decision-making and life safety, Transport. Res. Pt. C, 64, 86–100, 2016. a
Wang, Y., Satake, K., Maeda, T., and Gusman, A. R.: Green's function-based tsunami data assimilation: A fast data assimilation approach toward tsunami early warning, Geophys. Res. Lett., 44, 10–282, 2017. a
Wang, Z. and Jia, G.: A novel agent-based model for tsunami evacuation simulation and risk assessment, Nat. Hazards, 105, 2045–2071, 2021. a, b
Weatherall, P., Marks, K. M., Jakobsson, M., Schmitt, T., Tani, S., Arndt, J. E., Rovere, M., Chayes, D., Ferrini, V., and Wigley, R.: A new digital bathymetric model of the world's oceans, Earth Space Sci., 2, 331–345, 2015. a
Williamson, A. L., Rim, D., Adams, L. M., LeVeque, R. J., Melgar, D., and González, F. I.: A source clustering approach for efficient inundation modeling and regional scale probabilistic tsunami hazard assessment, Front. Earth Sci., 8, 591663, https://doi.org/10.3389/feart.2020.591663, 2020. a
Wood, N. J. and Schmidtlein, M. C.: Anisotropic path modeling to assess pedestrian-evacuation potential from Cascadia-related tsunamis in the US Pacific Northwest, Nat. Hazards, 62, 275–300, 2012. a, b
Yáñez-Cuadra, V., Ortega-Culaciati, F., Moreno, M., Tassara, A., Krumm-Nualart, N., Ruiz, J., Maksymowicz, A., Manea, M., Manea, V., Geng, J., and Benavente, R.: Interplate coupling and seismic potential in the Atacama Seismic Gap (Chile): Dismissing a rigid Andean sliver, Geophys. Res. Lett., 49, e2022GL098257, https://doi.org/10.1029/2022GL098257, 2022. a