the Creative Commons Attribution 4.0 License.
the Creative Commons Attribution 4.0 License.
 | 26 Apr 2024
Demographic yearbooks as a source of weather-related fatalities: the Czech Republic, 1919–2022
Rudolf Brázdil
Kateřina Chromá
Pavel Zahradníček
Demographic yearbooks of the Czech Republic, prepared by the Czech Statistical Office for the 1919–2022 period, contain official figures on the number of fatalities attributed to excessive natural cold, excessive natural heat, lightning, natural hazards, air pressure changes, and falls on ice or snow, as well as details about the sex and age of the deceased, covering a 104-year period or parts of it. These yearbooks, influenced by evolving international classifications of diseases, tend to underestimate the fatality numbers for excessive natural heat, natural hazards, and air pressure changes in particular. Out of a total of 9259 weather-related fatalities (with a mean annual rate of 89.0 fatalities), 74.9 % were caused by excessive natural cold and 19.3 % by lightning. No trend was identified in natural hazards, whilst statistically significant decreasing trends were found for lightning fatalities and increasing trends for excessive natural cold, excessive natural heat, and falls on ice or snow. Males and seniors aged ≥65 years were the most common sex and age categories affected. The number of fatalities attributed to excessive natural cold has partly increased as a result of the gradually ageing population and the rise in the number of homeless people since the 1990s. A statistically significant relationship between cold-related fatalities and mean January–February and winter (December–February) temperatures was established, evidenced by high negative correlation coefficients. Lightning deaths have notably decreased since the 1970s, primarily due to a significant reduction in the number of people employed in agriculture, an increase in urban population, better weather forecasting, lifestyle changes, and improved medical care. Although there is a significant positive correlation between these fatalities and the number of days with thunderstorms, the relationship is relatively weak. The results obtained for the Czech Republic align well with similar studies in Europe and elsewhere. While the demographic yearbooks cover only a part of weather-related fatalities, their circumstances, and characteristics, combining them with other similar databases is crucial to gain the necessary knowledge usable in risk management for the preservation of human lives.
- Article
(3969 KB) - Full-text XML
- BibTeX
- EndNote


Weather and climatic extremes have always been accompanied by a loss of human lives. Globally, the highest numbers of weather-, climate-, and water-related fatalities, particularly from 1970 to 2019, were attributed to tropical cyclones (38 %), and, on a continental scale, Asia saw the majority of these deaths, with 47 % of the total fatalities occurring there (WMO, 2021). Recent global warming has significantly altered the nature of these weather extremes and expanded their impact to other continents. According to the Emergency Events Database (EM-DAT) of the Centre for Research on the Epidemiology of Disasters (CRED, 2024), Europe experienced a total of 1672 disastrous events between 1970 and 2019, with economic damages amounting to USD 476.5 billion. The number of fatalities increased dramatically from 9953 in the 3 decades from 1970 to 1999 to 82 919 and 66 566 in the 2 subsequent decades, respectively; in total, 148 109 fatalities (i.e. 92.9 % of all 159 438 fatalities from 1970 to 2019) were attributed to heat waves (WMO, 2021). This is related to the increasing frequency and severity of heat waves (e.g. Vicedo-Cabrera et al., 2021; Lhotka and Kyselý, 2022). Forzieri et al. (2017) warned that the annual exposure to weather-related disasters in Europe, which affected 25 million people during 1981–2010, could rise to 351 million by 2100, mainly due to an increase in heat wave frequency. The rising number of disastrous events, the increase in economic damage, and the rise in fatalities have led to the adoption of the Sendai Framework for Disaster Risk Reduction 2015–2030 (SFDRR) at the Third UN World Conference on Disaster Risk Reduction in Sendai, Japan, on 18 March 2015. With the goal of “preventing new and reducing existing disaster risks”, the framework proposed corresponding targets and priorities (UNODRR, 2020; Wright et al., 2020).
Weather-related fatality data are collected by various entities at the national level, such as ministries, statistical offices, and health offices, and by different agencies at international, continental, or worldwide scales, including the European Environment Agency (2023) and re-insurance agencies like Munich Re. Specific databases dedicated to this data collection have been established (e.g. Guha-Sapir et al., 2016; Paprotny et al., 2018a; Petrucci et al., 2019b; Papagiannaki et al., 2022). These databases, which include various types of data and characteristics of fatalities, enable a range of analyses (e.g. Paprotny et al., 2018b; Petrucci et al., 2019a; Vinet et al., 2019).
The data entered into weather-related databases often originate from diverse documentary sources, both official and otherwise. Newspapers are a significant source, widely used in creating national databases that subsequently support detailed analyses of different aspects of deadly events at the national level, as seen in Switzerland (Hilker et al., 2009), Portugal (Zêzere et al., 2014), southern France (Vinet et al., 2016), Calabria in southern Italy (Aceto et al., 2017; Petrucci et al., 2018), and Mallorca (Grimalt-Gelabert et al., 2020). However, as is typical with documentary data (e.g. Brázdil et al., 2019), these sources may exhibit spatial and temporal inconsistencies and potentially undervalue the actual number of fatalities. In this context, demographic yearbooks, which contain official mortality data, represent a particularly valuable resource.
In the Czech Republic, analyses of weather-related fatalities have utilized official medical statistics to study fatalities related to heat waves (e.g. Kyselý and Kříž, 2008; Kyselý and Plavcová, 2012; Urban et al., 2017) and cold waves (e.g. Kyselý et al., 2009; Plavcová and Urban, 2020). While heat wave fatalities are often poorly covered in newspapers, detailed information on many other weather extremes is available, as documented in several related studies (e.g. Brázdil et al., 2022a, 2023a). Brázdil et al. (2021) compared their documentary-based fatality database with the data from the Czech Statistical Office for the 2000–2019 period, discussing the differences that emerged.
Following the establishment of the former Czechoslovakia before the end of the First World War in 1918, demographic yearbooks began to be published annually from 1919 as an official source summarizing various aspects of population development. These yearbooks provide a means to analyse corresponding weather-related fatalities within recent Czech Republic territory over the 1919–2022 period. This analysis is facilitated by the fact that each yearbook includes not only the number of deceased, but also details regarding the causes of death. The aim of our paper is to present results and discuss the potential of such data in the study of weather-related fatalities over a 104-year period, focusing on individual weather extremes, long-term trends, and the sex and age of the deceased.
2.1 The Czech Republic
The Czech Republic (CR), a central European country with an area of 78 887 km2 and a population of 10 827 529 as of 31 December 2022, emerged from the division of former Czechoslovakia into the Czech and Slovak Republics on 1 January 1993. Czechoslovakia was initially formed on 28 October 1918 before the end of the First World War (11 November 1918), comprising the historical Czech lands of Bohemia, Moravia, and southern Silesia, along with Slovakia. After the Munich Agreement on 30 September 1938, the Czech lands lost the Sudetenland, and following Nazi occupation on 15 March 1939, they became the Protectorate of Bohemia and Moravia (with Slovakia separating), existing until the end of the Second World War in 1945, when Czechoslovakia was re-established. The communist coup in 1948 and the Velvet Revolution in 1989, which marked the beginning of democratic development, were other significant events in the history of former Czechoslovakia. In 2004, the CR joined the European Union.
Table 1Categories of external death causes attributed to weather and natural extremes and the periods in which they were available in annual demographic yearbooks for the Czech Republic during the 1919–2022 period.
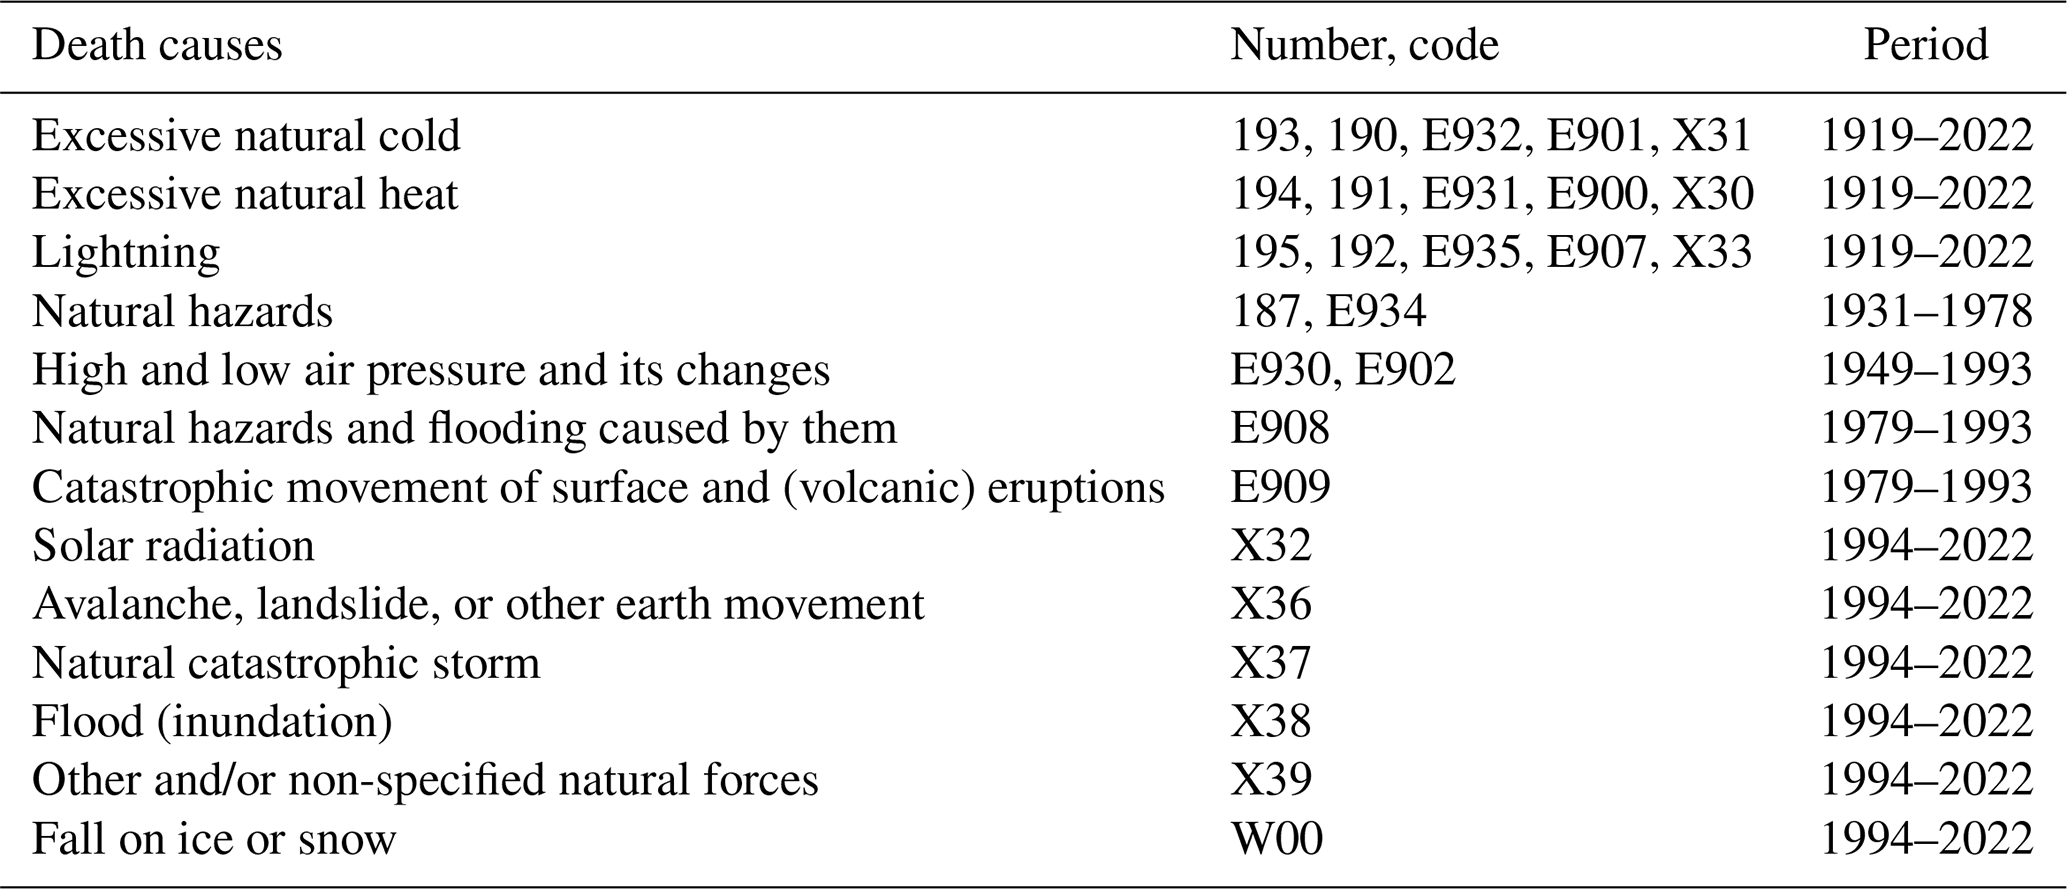
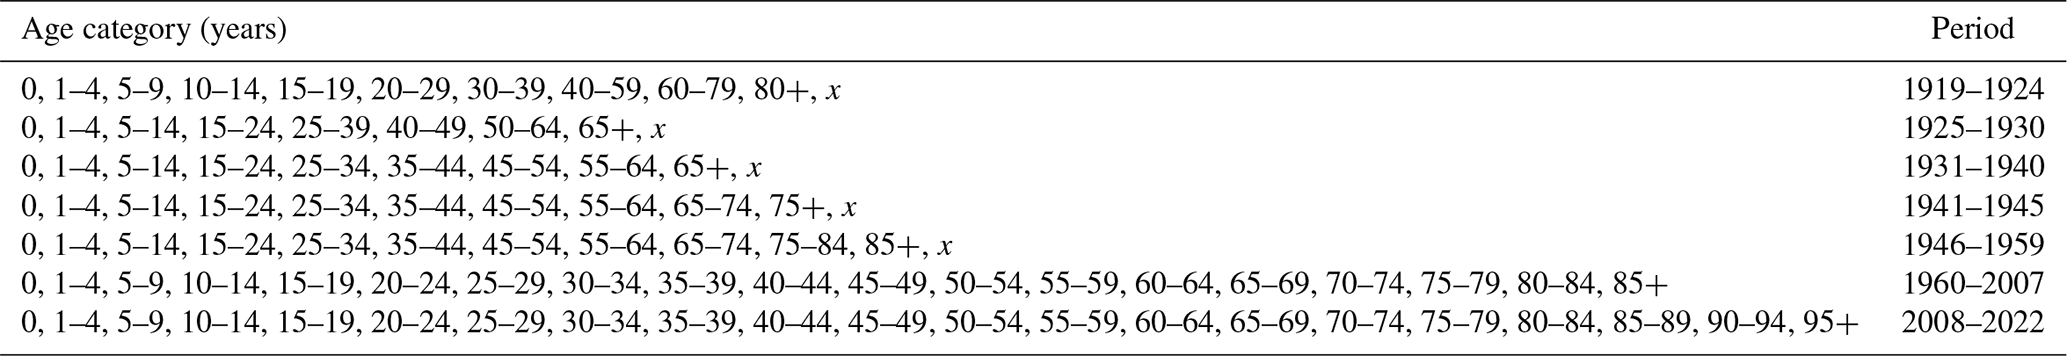
Table 2Age categories of fatalities attributed to weather and natural extremes and the periods in which they were available in demographic yearbooks during the 1919–2022 period (the 1–4 age category was divided into 1, 2, 3, and 4 years from 1949 to 2007; x – unknown age).
2.2 Fatality data
The Czech Statistical Office (CSO) has provided annual demographic data, specifically for the current CR territory, extracted from Czechoslovak yearbooks for the 1919–1992 period and published in subsequent yearbooks for the CR from 1993 to 2022 (Český statistický úřad, 2023a). Among other things, these mortality data enable the collection of information about the number of fatalities attributed to various causes of death, including weather and natural phenomena listed under external causes of death (Table 1), as well as the sex and age of the deceased. The causes of death are based on the International List of Causes of Death and later on the International Classification of Diseases, revised under the auspices of the World Health Organization (2023). Due to changes in the accepted list of death causes over various periods (which occurred in yearbooks from 1931, 1949, 1968, and 1994), specific weather-related fatalities could only be collected for different intervals during the entire 1919–2022 period (Table 1). Exceptions include fatalities attributed to exposure to excessive natural heat, excessive natural cold, and lightning, which have been reported throughout the entire period analysed. Similar issues arose with changes in the delimitation of age categories for which corresponding numbers of male and female fatalities were presented in the yearbooks (Table 2).
The data from demographic yearbooks can be supplemented for the 1986–2022 period with more detailed information from the internal CSO database. This database provides specifics about each fatality, including the date, age, sex, level of education, place of permanent residence, and cause of death, with additional information on the place of death included from 2010 onwards.
2.3 Meteorological data
For the comparison of fatality data with weather/meteorological patterns, two meteorological series covering the entire territory of the CR were used.
(i) Temperature series
The mean monthly areal temperature series for the CR was calculated from long-term observations at meteorological stations of the Czech Hydrometeorological Institute (CHMI) for the 1800–2010 period (Brázdil et al., 2012). This series was later extended to include data up to 2022.
(ii) Thunderstorm series
The mean annual number of days with thunderstorms was calculated as the median from series at eight CHMI meteorological stations (Brno, České Budějovice, Klatovy, Liberec, Milešovka, Olomouc, Prague-Karlov, and Teplice – see Fig. A1) that have recorded thunderstorm observations throughout the entire 1919–2022 period.
Based on the fatality data attributed to various causes of death listed in Table 1, the following series of fatalities according to different weather categories were created from the demographic yearbooks:
- i.
excessive natural cold, 1919–2022 (numbers/codes of death causes: 193, 190, E932, E901, and X31);
- ii.
excessive natural heat, 1919–2022 (numbers/codes of death causes: 194, 191, E931, E900, X30, and X32);
- iii.
lightning, 1919–2022 (numbers/codes of death causes: 195, 192, E935, E907, and X33);
- iv.
natural hazards, 1931–2022 (numbers/codes of death causes: 197, E908, E909, E934, X36, X37, X38, and X39);
- v.
high and low air pressure and its changes, 1949–1993 (codes of death causes: E930 and E902);
- vi.
fall on ice or snow, 1994–2022 (code of death cause: W00).
The above six series in points (i)–(vi) consist of annual numbers of related fatalities, the sex of the deceased, and age categories (see Table 2). Temporal fluctuations in these series (except point v) were visualized in the figures, and their linear trends in the corresponding periods were calculated using the non-parametric Theil–Sen method, which is more robust against outliers in time series (Sen, 1968; Theil, 1992). The non-parametric Mann–Kendall test was further employed to evaluate the statistical significance of linear trends (Mann, 1945; Kendall, 1975). For annual numbers of all weather-related fatalities, their proportions of the total numbers of all deaths in the given year were calculated. Pearson correlation coefficients were used to determine relationships between fatalities related to excessive natural cold and mean temperatures on one hand and between lightning fatalities and the number of days with a thunderstorm on the other. The significance of the correlation coefficients was assessed using a t test. To mitigate the effects of non-meteorological factors in fatality series, corresponding pairs of series were first detrended using a high-pass filter and then correlated.
Based on individual fatality data from the CSO database, a similar analysis as reported above was conducted for the 1986 (1994)–2022 period. Additionally, this allowed for an analysis of the annual variation in fatalities according to individual months and an investigation of the relationship between fatalities attributed to excessive natural cold and mean winter temperatures in the CR using the Pearson correlation coefficient.
4.1 Long-term fatality trends in 1919–2022
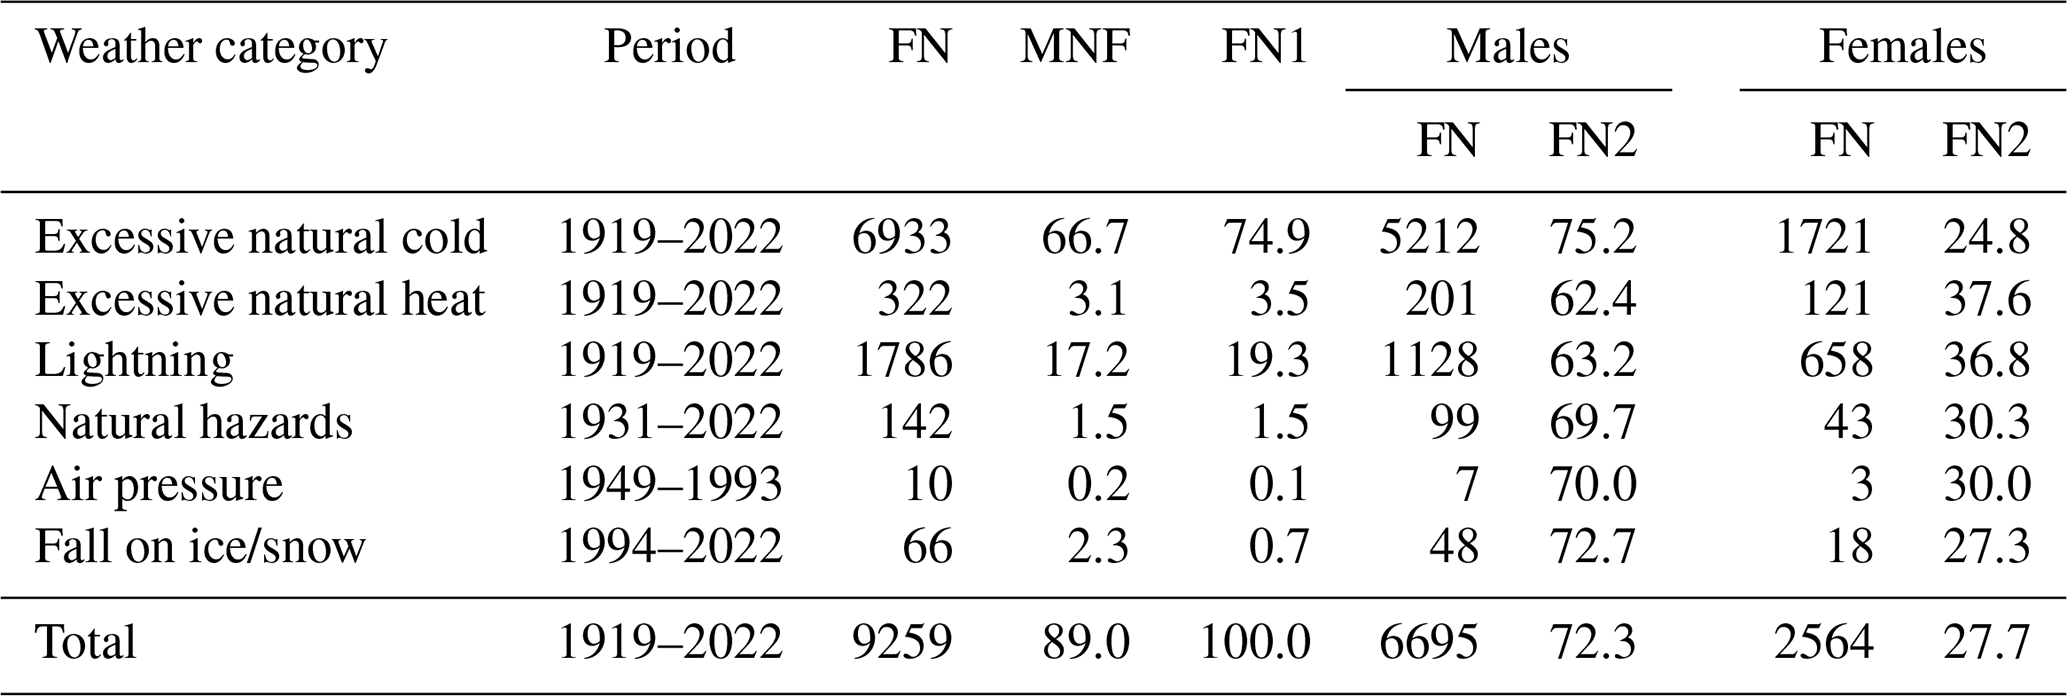
According to data from demographic yearbooks (Table 1), a total of 9259 weather-related fatalities were recorded in the CR during the 1919–2022 period, averaging 89.0 fatalities per year (Table 3). The majority (74.9 %) of these were due to excessive natural cold (66.7 fatalities per year), followed by lightning (19.3 %, 17.2 fatalities per year). For the same period, fatalities attributed to excessive natural heat accounted for only 3.5 % (3.1 fatalities per year), while the other three groups of fatalities, reported for much shorter periods, comprised 1.5 % for natural hazards, 0.7 % for falls on ice or snow, and only 0.1 % for air pressure changes. Fatalities predominantly involved males, who accounted for 72.3 % of deaths, compared to females, who comprised 27.7 %. Among the six weather categories, the highest proportion of male fatalities and the lowest of female fatalities were observed in the category of excessive natural cold (75.2 % male vs. 24.8 % female), while the opposite extreme proportions were recorded for excessive natural heat (62.4 % male vs. 37.6 % female), slightly higher than for lightning (63.2 % male vs. 36.8 % female).
Table 3Numbers of all weather-related fatalities divided between males and females in the Czech Republic during the 1919–2022 period, based on data from demographic yearbooks: FN – absolute number of fatalities, MNF – mean number of fatalities per year, FN1 – relative proportion (%) of all weather-related fatalities, FN2 – relative proportion (%) within the related weather category.
Long-term fluctuations in weather-related fatalities in the CR during the 1919–2022 period exhibit different patterns (Fig. 1), which can be characterized as follows.
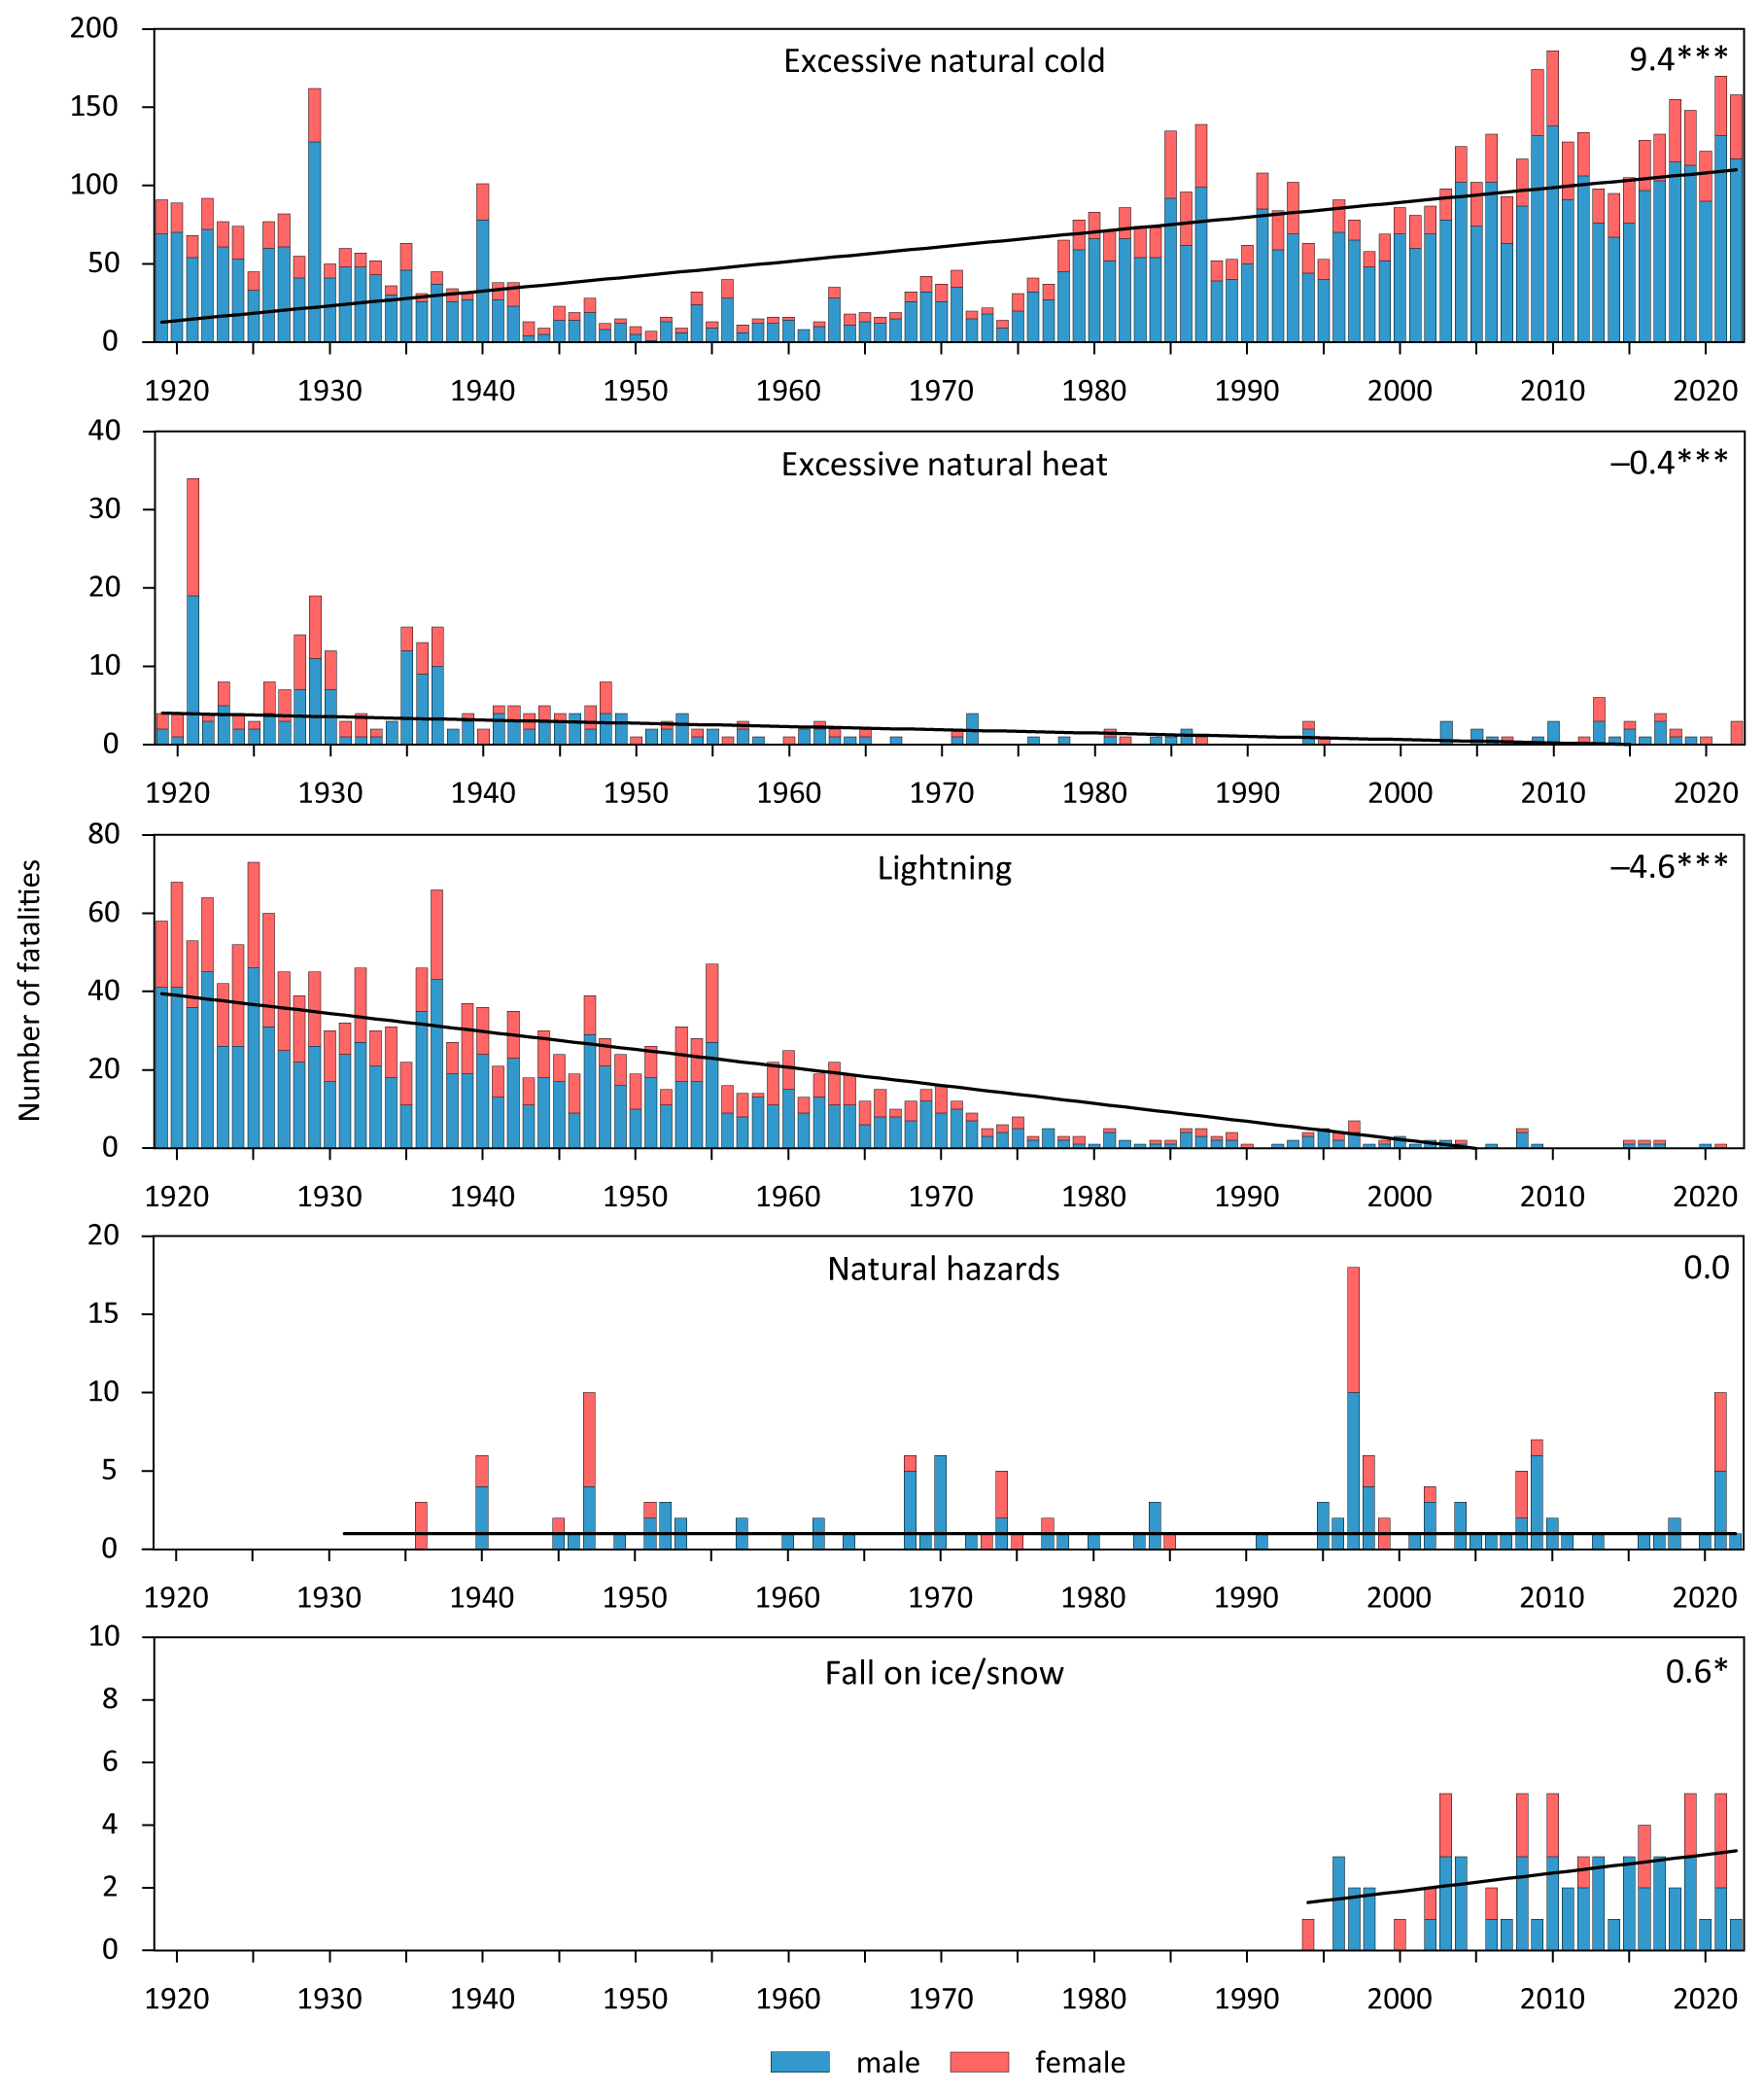
Figure 1Long-term fluctuations and linear trends in the annual numbers of weather-related fatalities divided by males and females in the Czech Republic during the 1919–2022 period, based on data from demographic yearbooks. The slopes of linear trends (indicated in the top-right corner) are expressed as the number of fatalities per 10 years with the following statistical significance: * p<0.10, p<0.01.
(i) Excessive natural cold
The number of fatalities related to excessive natural cold displays three distinct periods: initially high values from 1919, with a decreasing trend until the early 1940s, followed by lower numbers until the late 1970s, after which a significant increase began, continuing until 2022. The highest annual tolls were 186 deaths in 2010, 174 in 2009, 170 in 2021, and 162 in 1929. While the winter of 1928/1929, with a mean temperature of −7.6 °C, was the coldest of the past century in the CR (Křivancová, 1999; Krška, 2009; Brázdil et al., 2019), the other three winters were milder, ranging between −2.3 °C (2009/2010) and 0.2 °C (2020/2021). The series as a whole exhibits a statistically significant increasing linear trend, with a slope of 9.4 fatalities per 10 years (p<0.01).
(ii) Excessive natural heat
Data on fatalities associated with excessive natural heat are less abundant. While 34 deaths were recorded in 1921 (during a warmer and dry summer in Europe – see van der Schrier et al., 2021), more than 10 fatalities per year were only reported in 1928–1930 (45 in total) and in 1935–1937 (43 in total). In other years, the numbers were mostly below five fatalities, and in 28 years, there were no fatalities of this kind. This pattern is reflected in a statistically significant decreasing trend of −0.4 fatalities per 10 years (p<0.01).
(iii) Lightning
Fatalities related to lightning also exhibit a statistically significant decreasing linear trend, with a slope of −4.6 fatalities per 10 years (p<0.01). A more pronounced decreasing trend is evident from 1919 until the 1970s. From 1976, the annual number of lightning fatalities did not exceed five (except for seven deaths in 1997), with no fatalities recorded in 11 years and only one fatality in 10 years.
(iv) Natural hazards
Natural hazards, not specified in more detail and recorded from 1931, saw the highest number of fatalities in 1997, with a total of 18 deaths recorded, followed by 10 deaths in both 1947 and 2021. There were 43 years since 1931 with no fatalities in this category. Conversely, only 6 years from 1995 to 2022 had no deaths due to natural hazards. A zero linear trend was observed in this series.
(v) Fall on ice or snow
Fatalities due to falls on ice or snow, recorded since 1994, did not exceed five deaths in any year (recorded in 5 years in total), while there were 4 years with no such fatalities reported. This category exhibits a statistically significant increasing linear trend with a slope of 0.6 fatalities per 10 years (p<0.1).
(vi) Air pressure
The category of high and low air pressure and its changes (not depicted in Fig. 1) accounted for only 10 fatalities between 1949 and 1993, recorded in the years 1953, 1954, 1961, 1962, 1965, 1976, and 1990, with each year having 1 or 2 fatalities.
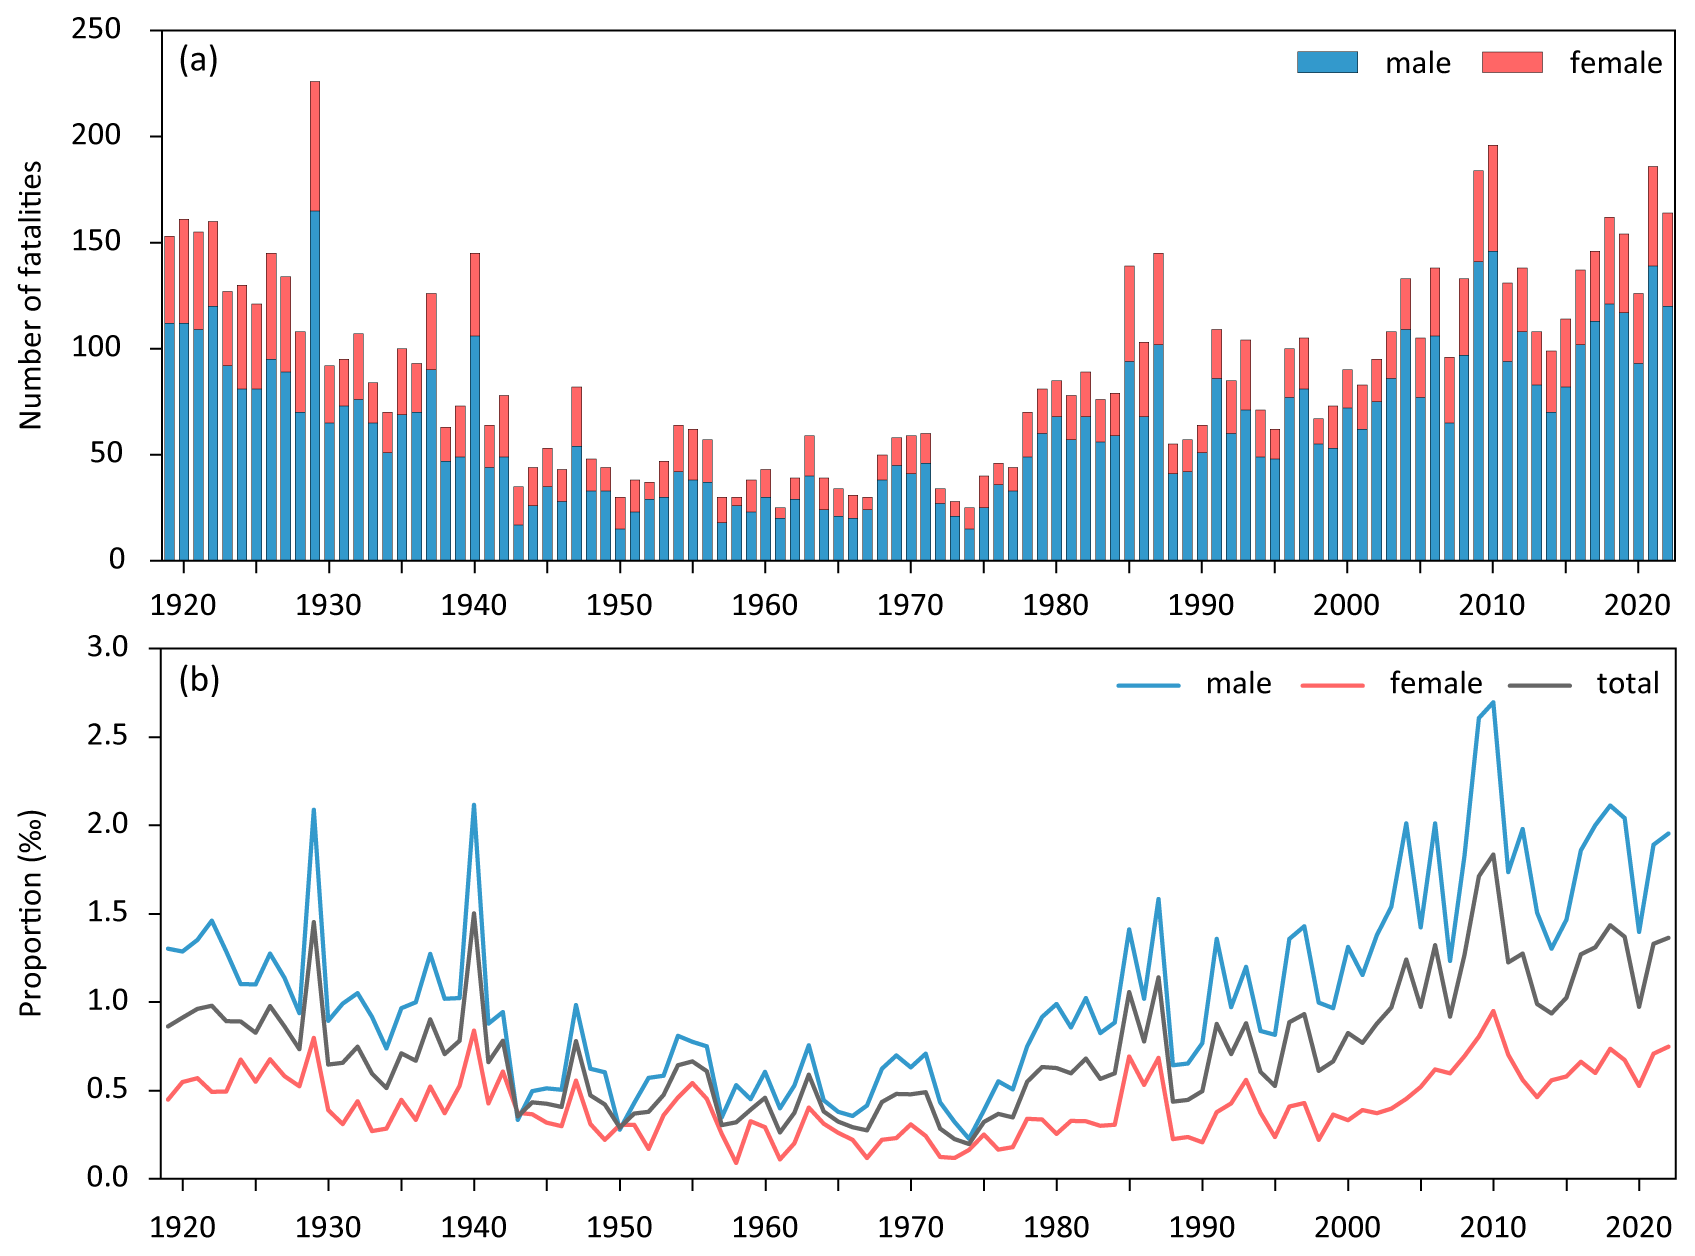
Figure 2(a) Annual numbers of weather-related fatalities divided by males and females and (b) their relative proportions (‰) in the numbers of total, male, and female deaths in the Czech Republic during the 1919–2022 period, based on data from demographic yearbooks.
When considering all weather-related fatalities together (Fig. 2a), the two dominant categories of deaths attributed to excessive natural cold and lightning shape the long-term fluctuations. The series is characterized by a clear declining trend from its beginning until the early 1940s, followed by relatively stable fluctuations at much lower levels and then a significant increase from the mid-1970s until the end of the series. The year 1929 experienced 226 fatalities (particularly due to an extremely cold winter and lightning, as well as a deadly windstorm on 4 July 1929 – Brázdil et al., 2018), followed by the years 2010 (196 fatalities), 2021 (186), and 2009 (184). The lowest numbers were reported in 1961 and 1974, with only 25 weather-related fatalities each, and 28 fatalities in 1973. Annually, the numbers of weather-related fatalities constituted only a very small relative proportion of all deaths in the CR during those years (Fig. 2b) and largely reflected the fluctuations described in Fig. 2a. The mean annual proportion of weather-related fatalities in all deaths for the CR was only 0.74 ‰ (males 1.05 ‰, females 0.42 ‰). Proportions greater than 2 ‰ appeared only in the male category for 9 years (with a maximum of 2.70 ‰ in 2010).
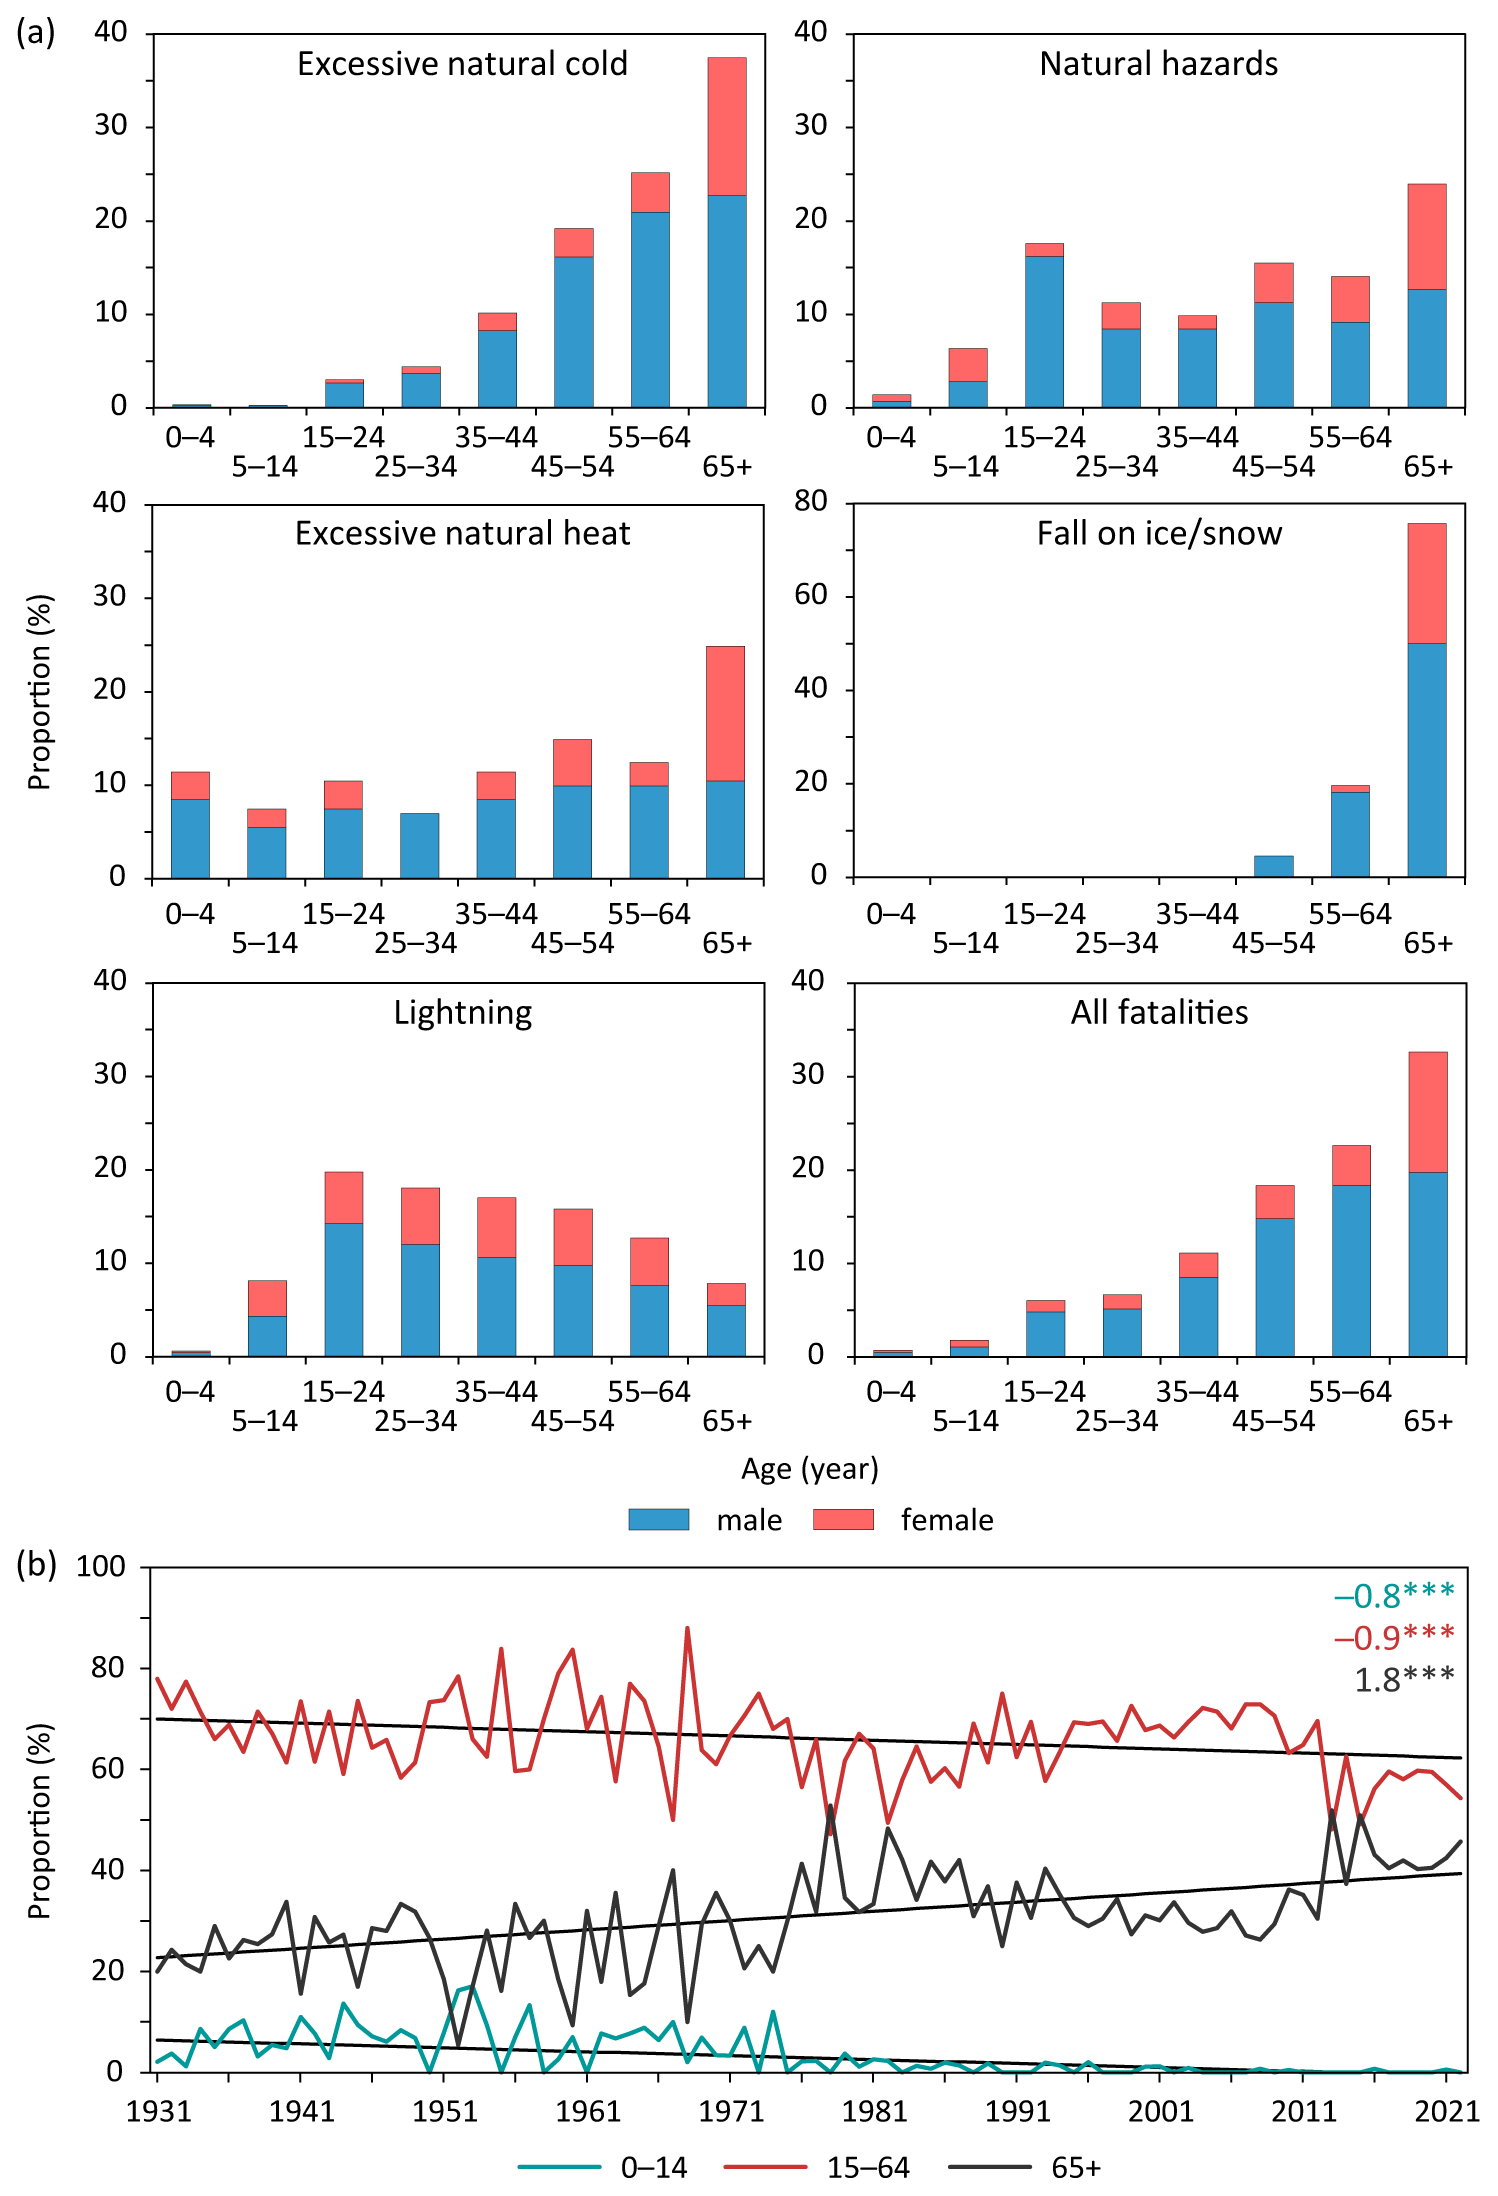
Figure 3Age and sex structure of weather-related fatalities in the Czech Republic during the 1931–2022 period, based on data from demographic yearbooks: (a) relative proportions (%) in individual and all weather-related fatalities; (b) fluctuations and linear trends in the relative proportions (%) of three age categories in all weather-related fatalities (the slopes of the linear trends indicated in the top-right corner are expressed in percentage per 10 years with a statistical significance of p<0.01).
Regarding the age structure of weather-related fatalities (Fig. 3a), seniors aged 65 years and older were the most affected group in all categories except lightning. They represented 75.8 % of fatalities in the falls on ice or snow category, with the remaining fatalities being in the two age intervals between 45 and 64 years. In the case of excessive natural cold, seniors aged ≥65 years accounted for 37.5 % of related fatalities. The preceding age intervals showed a continuous increase in proportion from the age of 15–24 years to senior age. Nearly the same proportions (approximately 25 %) of the highest age group (≥65 years) characterized both excessive natural heat and natural hazards. Similar proportions were also observed in the age group of 45–54 years (approximately 15 %), but in natural hazards, the age interval of 15–24 years reached 17.6 %. The age group of 15–24 years was the most frequent for lightning fatalities (19.8 %), followed by a gradual decline in the following age groups to seniors aged ≥65 years (7.8 %), comparable to the children's age interval of 5–14 years (8.1 %). In each of the age categories, the proportions of male fatalities were higher than those of females, except in the age group of ≥65 years for excessive natural heat, where the situation was reversed. Considering all categories together, there was a continuous rise in their relative proportions from the youngest (0.7 %) to the oldest (32.6 %) age group. Moreover, the proportion of 6.0 % in the age interval of 15–24 years was comparable to 6.7 % in the following interval of 25–34 years. Figure 3b shows general decreases in the relative proportions of the age categories of 0–14 and 15–64 years in all weather-related fatalities during the 1931–2022 period, while proportions for the category of ≥65 years were increasing. Linear trends in the proportions of all three age categories were statistically significant (p<0.01): −0.8 % per 10 years for 0–14 years, −0.9 % per 10 years for 15–64 years, and 1.8 % per 10 years for ≥65 years. However, both the youngest and the oldest age categories showed clear breakpoints around the mid-1970s.
4.2 Structure of fatalities in 1986–2022
The CSO database enabled a more detailed analysis of fatalities attributed to five different weather categories during the 1986 (1994)–2022 period, significant in the context of recent global warming (e.g. Zahradníček et al., 2021; Brázdil et al., 2022b). Figure 4 presents annual fluctuations in related fatalities with linear trends and their statistical significance, variations in fatalities according to individual months, and their sex and age structure for each weather category and all combined, as detailed below.
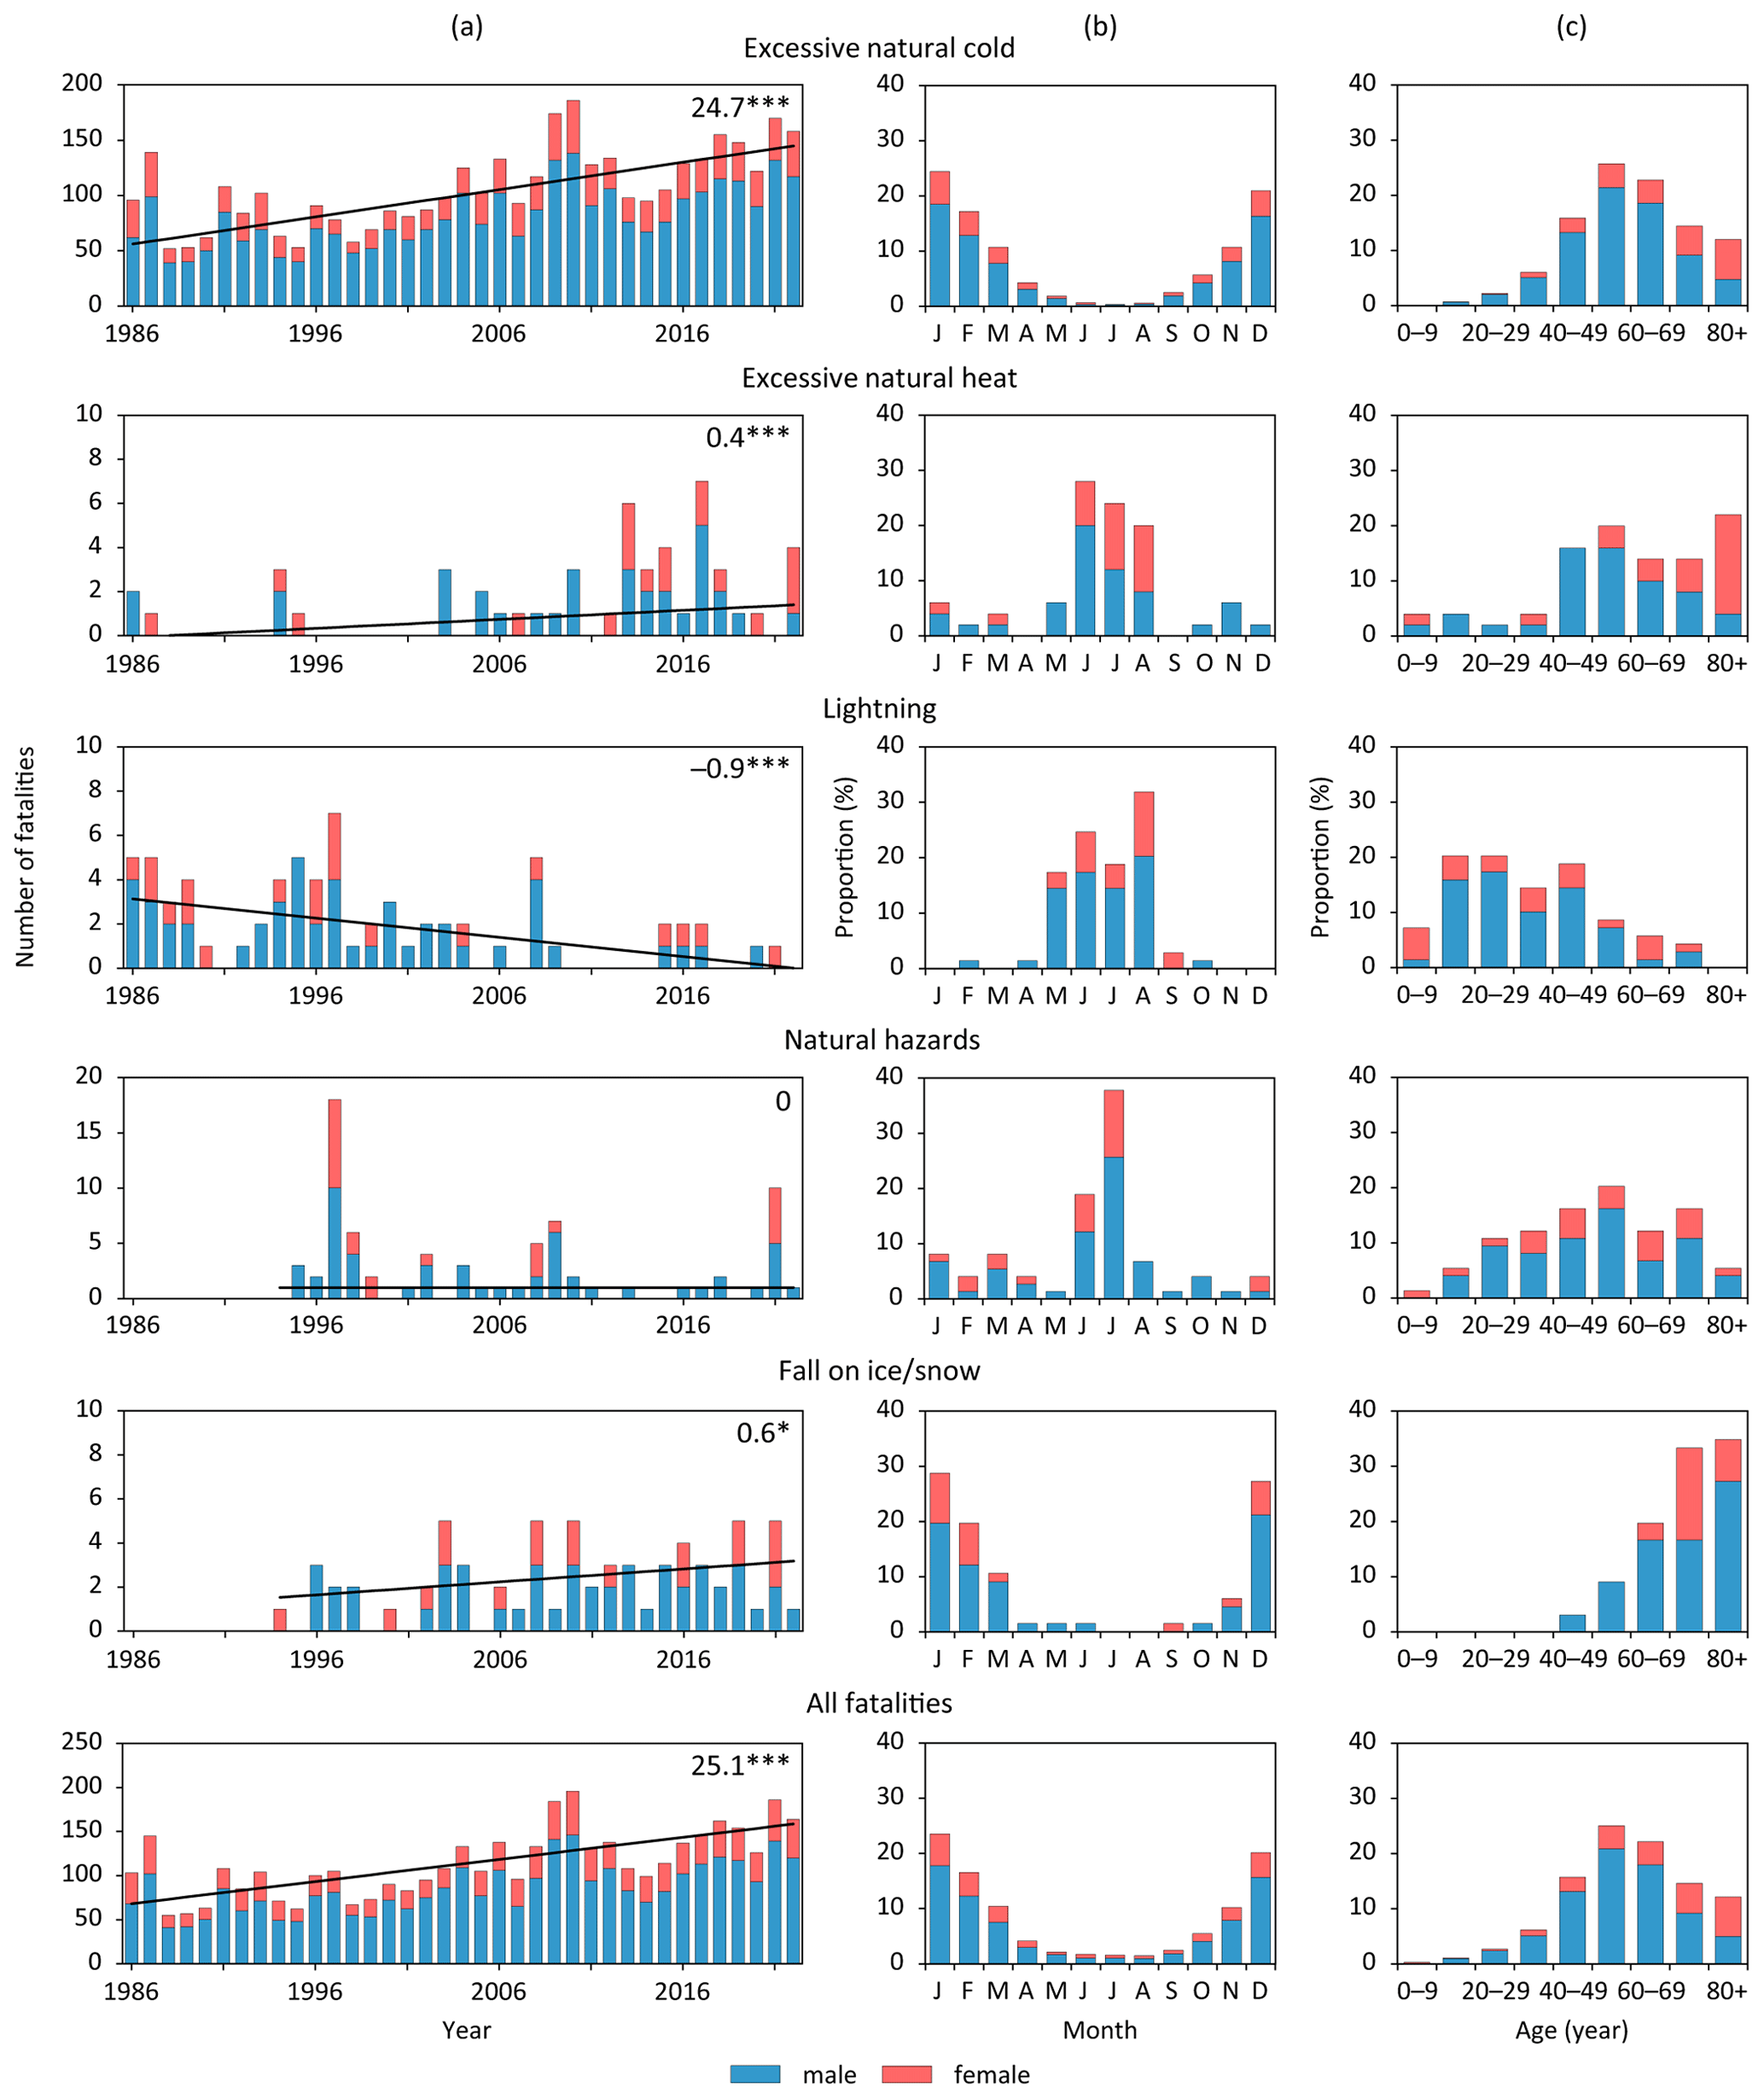
Figure 4Weather-related fatalities divided by males and females in the Czech Republic during the 1986–2022 period for categories of excessive natural cold, excessive natural heat, lightning, natural hazards, and falls on ice or snow, as well as for all of them combined: (a) fluctuations with linear trends (top-right corner; statistical significance: * p<0.10, p<0.01); (b) annual variation according to monthly values (%); (c) age structure (%) (data: CSO database).
(i) Excessive natural cold (E901 + X31)
A total of 3965 fatalities were attributed to excessive natural cold from 1986 to 2022, averaging 107.2 fatalities per year (with 57.2 % of all such fatalities occurring during 1919–2022). The highest number of fatalities was 186 in 2010, followed by 174 in 2009 and 170 in 2021. The lowest numbers were 52 fatalities in 1988, followed by 53 in 1989 and 1995. A statistically significant rising trend was observed at 24.7 fatalities per 10 years (p<0.01). During the winter half year (October–March), 89.7 % of the deaths occurred, with the highest number in January (24.4 %) followed by December (21.0 %). Males accounted for the majority of fatalities (75.1 %). Nearly half of all fatalities was in the age groups of 50–59 years (25.8 %) and 60–69 years (22.8 %). In fatalities of the ≥80-year age group, the proportion of females was higher than that of males.
(ii) Excessive natural heat (E900 + X30 + X32)
From 1986 to 2022, excessive natural heat was attributed to being the cause of death for 50 victims, averaging 1.4 fatalities per year. The maximum of seven fatalities occurred in 2017, followed by six in 2013, but there were 16 years with no deaths from this cause. The series showed a statistically significant increasing trend (0.4 fatalities per 10 years, p<0.01). The 3 summer months dominated the annual variation (72.0 %), with the highest number in June (28.0 %). Males accounted for 64 % of these fatalities, while in the age structure, those aged 80 and older (22.0 %, with a clear female prevalence) and between 50 and 59 years (20.0 %) were predominant.
(iii) Lightning (E907 + X33)
Between 1986 and 2022, lightning was responsible for 69 deaths, averaging 1.9 fatalities per year. The highest number, seven fatalities, occurred in 1997, followed by five fatalities in 4 different years. A total of 11 years had no lightning-related deaths. This series experienced a statistically significant decreasing trend (−0.9 fatalities per 10 years, p<0.01). Most fatalities (75.4 %) occurred in the summer months (with an additional 17.4 % in May), peaking in August (31.9 %). The majority of fatalities were males (71.0 %), predominantly in the age ranges of 10–19 and 20–29 years (20.3 % each).
(iv) Natural hazards (X36 + X37 + X38 + X39)
A total of 74 fatalities in this category from 1994 to 2022, averaging 2.6 fatalities per year, included victims in four subcategories: 33 fatalities (44.6 %) from floods (inundations); 17 (23.0 %) from catastrophic natural storms; 14 (18.9 %) from avalanches, landslides, or other earth movements; and 10 (13.5 %) from other and unspecified natural forces. Annual maxima were 18 fatalities in 1997 and 10 in 2021. Of these, 17 deaths in the first case were related particularly to the disastrous July 1997 flood in Moravia and Silesia (Matějíček and Hladný, 1999) and seven deaths in the second case to the deadliest Czech tornado on 24 June 2021 in southern Moravia (Münster, 2022). There were 7 years with no fatalities attributed to this category. The series experienced a zero linear trend. Fatalities occurred in all months of the year, with maxima in July (37.8 %) and June (18.9 %). Males suffered 70.3 % of the fatalities. The age group of 50–59 years accounted for 20.3 % of all fatalities, followed by the age groups of 40–49 and 70–79 years (16.2 % each).
(v) Falls on ice or snow (W00)
From 1994 to 2022, a total of 66 people died due to falls on ice or snow, averaging 2.3 fatalities per year. Maxima of five deaths were recorded in 2003, 2008, 2010, 2019, and 2021, while there were 4 years with no fatalities. The rising linear trend was statistically significant (0.6 fatalities per 10 years, p<0.01). Most fatalities (75.8 %) occurred in the 3 winter months, with the highest number in January (28.8 %) and in March (10.7 %). In terms of sex and age, 72.7 % of fatalities were males, and 87.9 % were aged 60 years and older (33.3 % in the age group of 70–79 years, 34.9 % in the age group of 80 years and older).
(vi) All groups (i)–(v) together
When combining all five fatality categories for the 1986–2022 period, out of a total of 4224 fatalities (114.2 fatalities per year), those related to excessive natural cold accounted for 93.9 %. This means that the characteristics presented for all fatalities largely mirror, with only minor deviations, the features already described for the excessive natural cold category in point (i).
With the inclusion of places of death in the CSO database from 2010 onwards, it is possible to analyse their spatial distribution across the CR for the 2010–2022 period. Of the 1761 fatalities attributed to excessive natural cold, 61.1 % occurred at the place of permanent residence and 38.9 % at other locations. For the remaining 100 weather-related fatalities (excessive natural heat, lightning, natural hazards, falls on ice/snow), the distribution was the opposite: 40 % occurred at the place of residence and 60 % elsewhere. Given the dominant number of fatalities caused by excessive natural cold, a specific map was created for them (Fig. 5a), while another map was prepared for the other four categories of weather-related fatalities (Fig. 5b). Cold-related fatalities were recorded in 716 municipalities, representing 11.4 % of the total number in the CR. The highest numbers were in larger cities (see Fig. A1 for their locations): Prague (129 fatalities), Ostrava (77), Brno (69), Plzeň (40), Liberec (29), and Hradec Králové (27), collectively accounting for 21.1 % of all cold-related fatalities. A single fatality occurred in 509 municipalities and two in 94. Municipalities with cold-related fatalities formed some larger clusters, such as in a belt parallel to the Czech border in northwestern Bohemia, the area of northern and eastern Bohemia, and the northeastern corner of the CR (Fig. 5a). For the other four categories of fatalities, they were recorded in 55 municipalities (2.1 %), with the highest death numbers in Prague (15 fatalities), Ostrava (7), Brno (6), Ústí nad Labem (4), Liberec (3), and Plzeň (3), collectively forming 38.0 % of all fatalities in these four categories. One fatality occurred in 36 municipalities and two in 13. Besides the reported towns, a higher concentration of such municipalities was again located around the northwestern border of the CR (Fig. 5b).
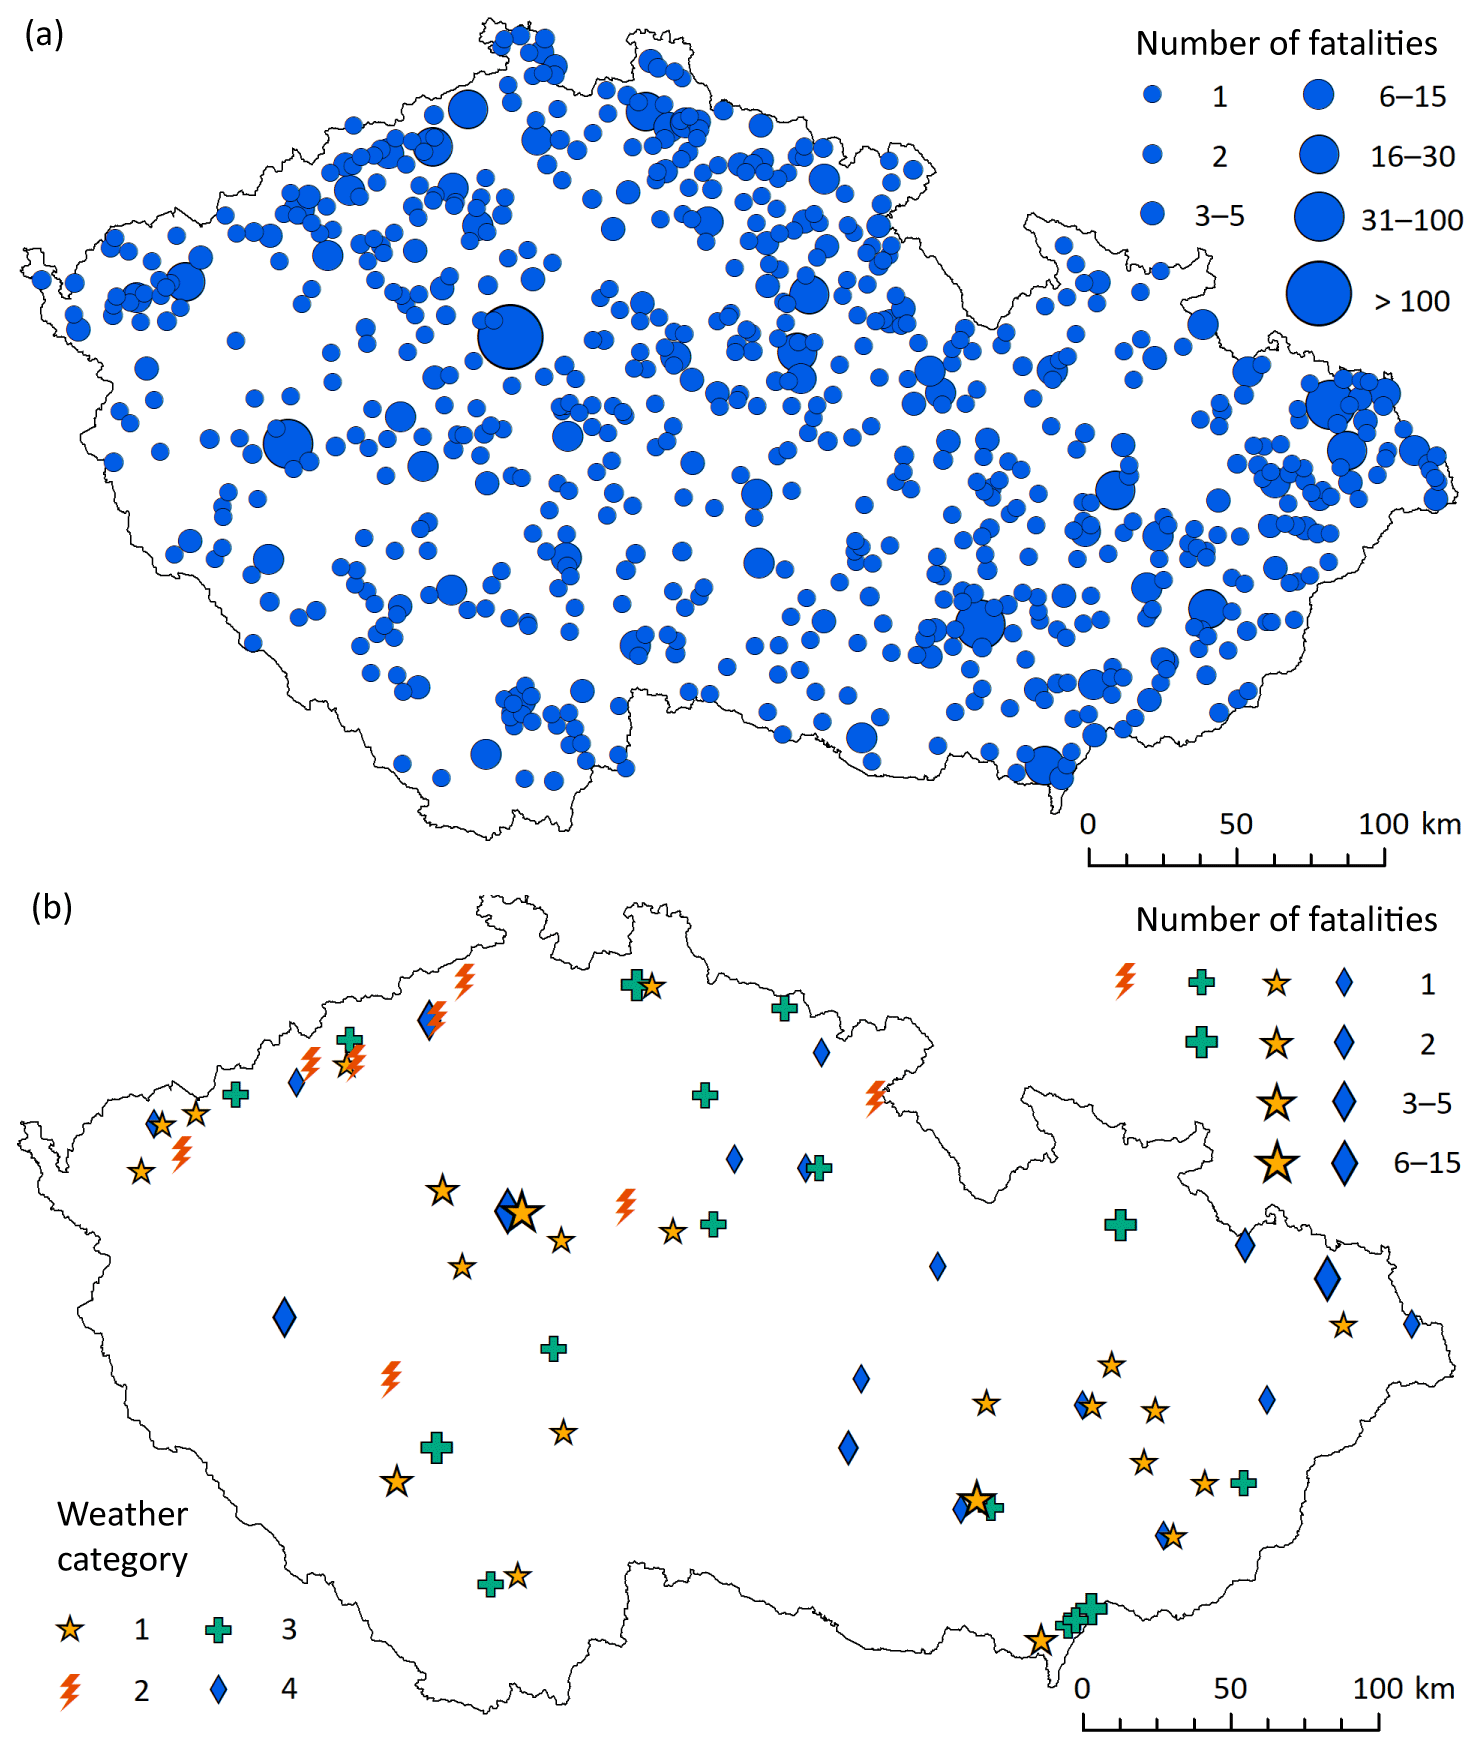
Figure 5The spatial distribution of weather-related fatalities from the CSO database over the territory of the Czech Republic in 2010–2022: (a) excessive natural cold; (b) weather category: 1 – excessive natural heat, 2 – lightning, 3 – natural hazards, 4 – falls on ice or snow.
4.3 Relationship of fatalities to meteorological variables
In examining the relationship of weather-related fatalities in the CR to meteorological variables, only two fatality categories – those associated with excessive natural cold and lightning – were deemed suitable for analysis. Other fatalities related to excessive natural heat and natural hazards were considered too randomly detected and significantly underestimated for meaningful analysis. Similarly, the shorter series and smaller numbers of fatalities attributed to air pressure changes or falls on ice or snow did not lend themselves to this type of analysis.
4.3.1 Cold-related fatalities and air temperature
For the 1919–2022 period, fatalities attributed to excessive natural cold in the CR were collected annually. To study their relationship with temperature, different combinations of monthly areal temperatures (Sect. 2.3) for the same year were used to identify the series that best correlated with the fatality numbers (not shown). The highest Pearson correlation coefficients were found for the mean temperature series of January–February, which is presented alongside annual fatalities in Fig. 6. Although both series showed statistically significant increasing linear trends (Fig. 6a), the correlations between them varied over time. Dividing the entire fatality series by three historical milestones for the CR (see Sect. 2.1), the significant correlation coefficient from 1919–1945 was −0.47 (p<0.05), indicating that lower temperatures led to higher numbers of deaths. This correlation then decreased to −0.36 (p<0.05) for 1946–1989 and further to a non-significant value of −0.26 for 1990–2022 (Fig. 6a). The temporal fluctuations in the correlation, expressed by 11- and 21-year running correlations, showed a particular decline in the 1960s–1970s and from the 1990s (Fig. 6b). To describe the relationship of fatalities to January–February temperatures while removing non-meteorological effects, both series in the three time intervals above were first detrended and then correlated. The obtained correlation coefficients were substantially higher (−0.81, −0.74, and −0.58, respectively) and all statistically significant at p<0.01 (Fig. 6c).
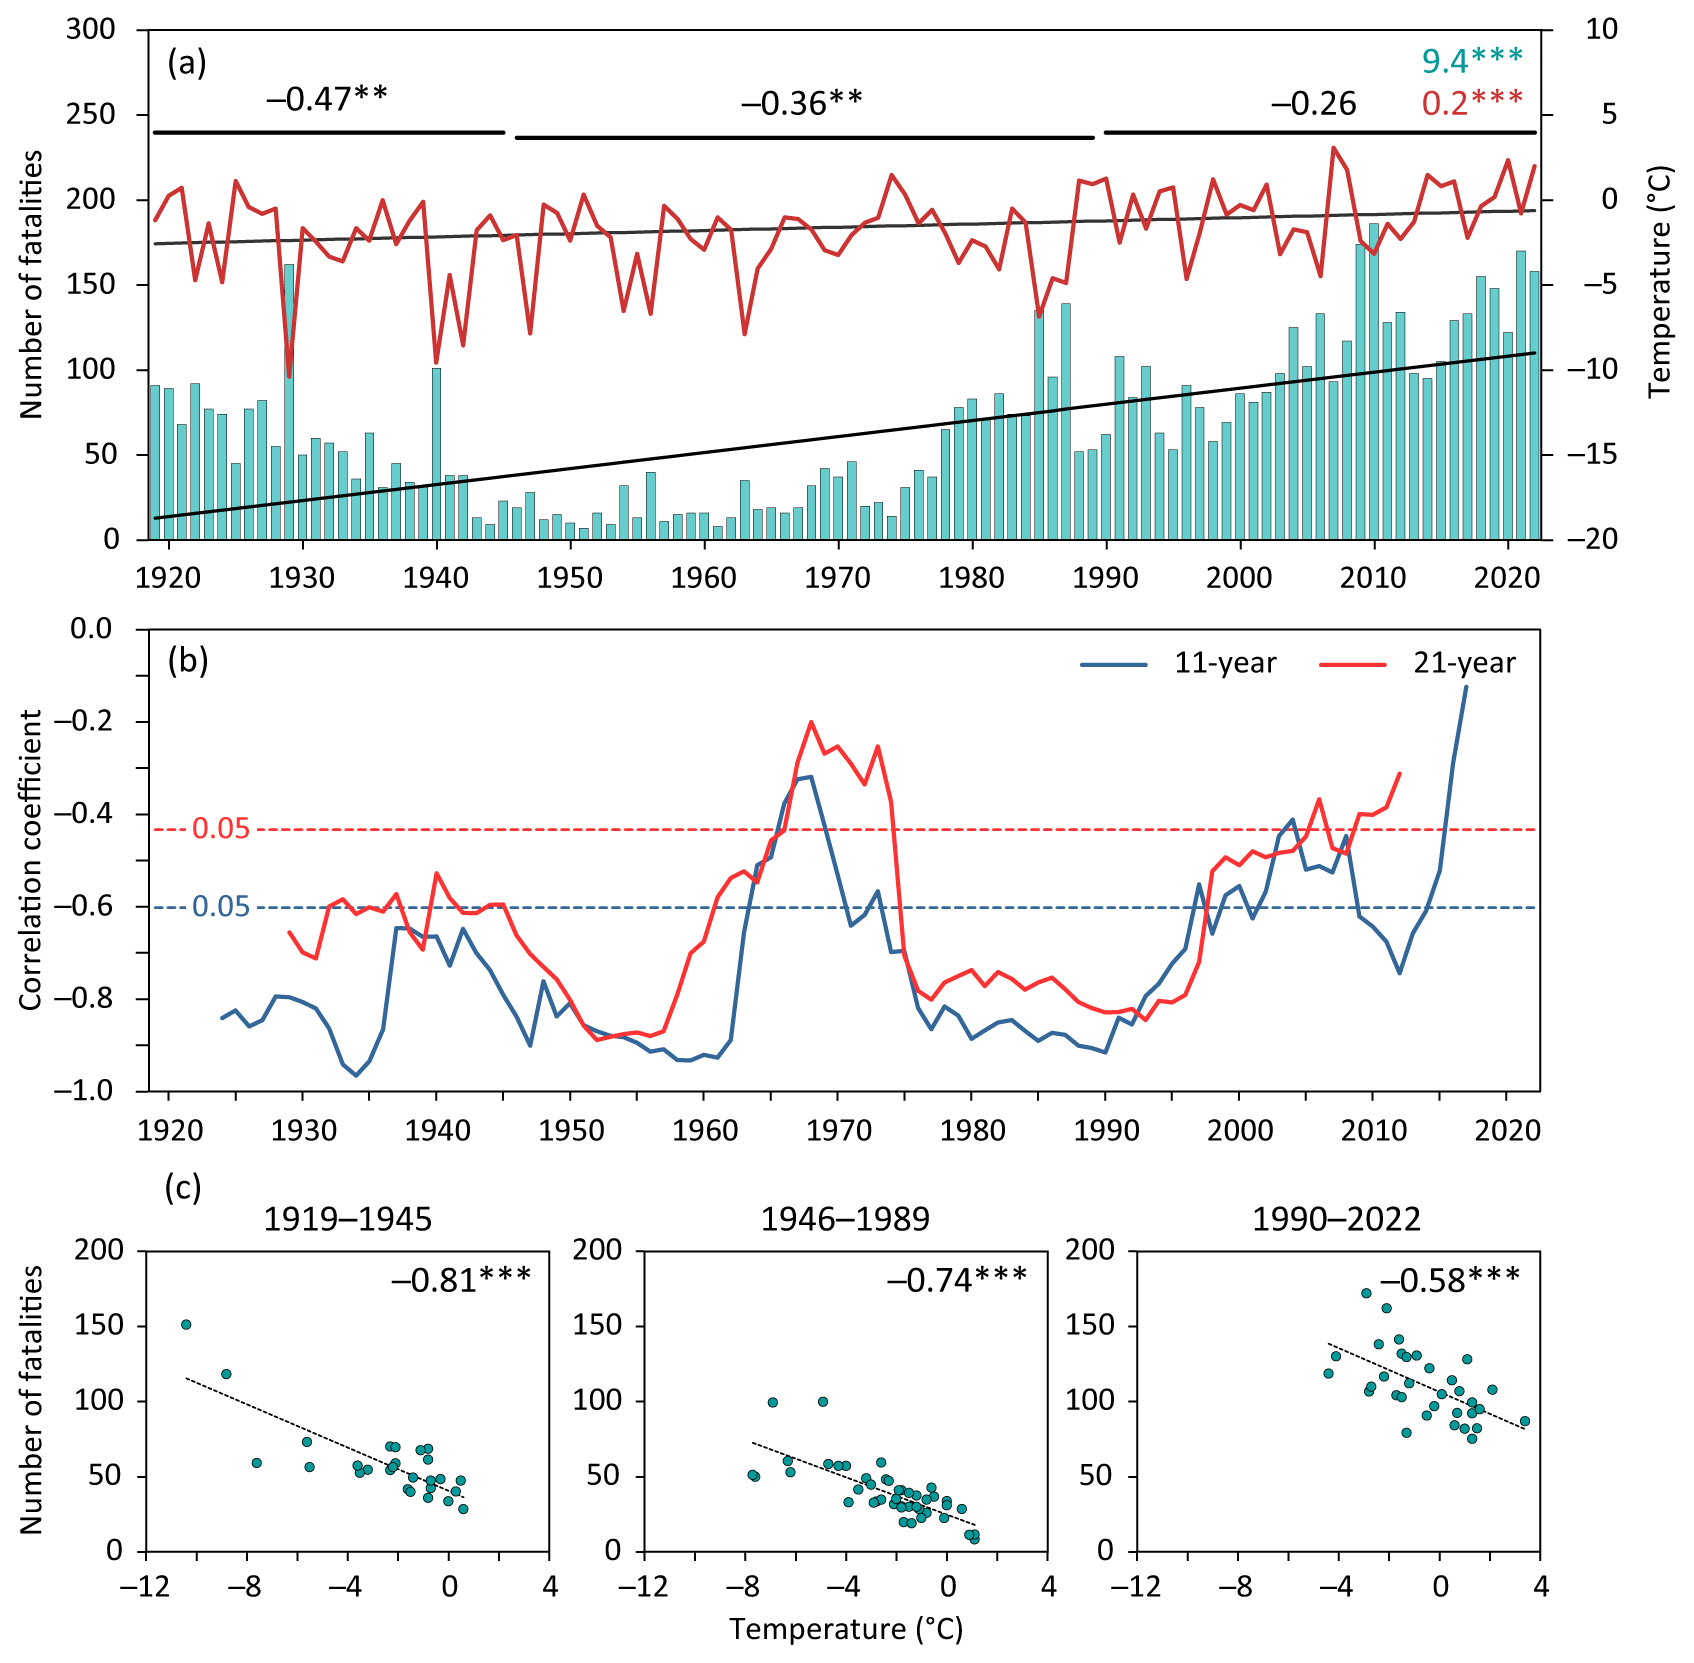
Figure 6Numbers of fatalities related to excessive natural cold and mean January–February temperatures in the Czech Republic during the 1919–2022 period: (a) fluctuations, linear trends (top right: slopes in fatalities per 10 years and in degrees Celsius per 10 years) and Pearson correlation coefficients ( p<0.05, p<0.01); (b) 11- and 21-year running correlations between fatalities and temperatures (horizontal lines indicate significance levels at 0.05); (c) scatterplots between detrended series of fatalities and temperatures for three selected periods (top right: correlation coefficients, p<0.01).
The database of the CSO includes the exact dates of deaths related to excessive natural cold from 1986, enabling an analysis of the relationship between the number of related fatalities and winter (December–February) temperatures from the 1986/1987 to 2021/2022 season. The three highest numbers of fatalities corresponded to the second coldest (1986/1987) and the sixth to seventh coldest winters (2009/2010, 2010/2011) in this 36-year period. The linear trends showed a statistically significant increasing tendency in fatalities (13.3 fatalities per 10 years, p<0.01) and a non-significant increase of 0.4 °C per 10 years in winter temperatures (Fig. 7a). The statistically significant Pearson correlation coefficient between both series is −0.46 (p<0.01), which rises to −0.74 (p<0.01) after detrending both series (for the related scatterplot, see Fig. 7b).
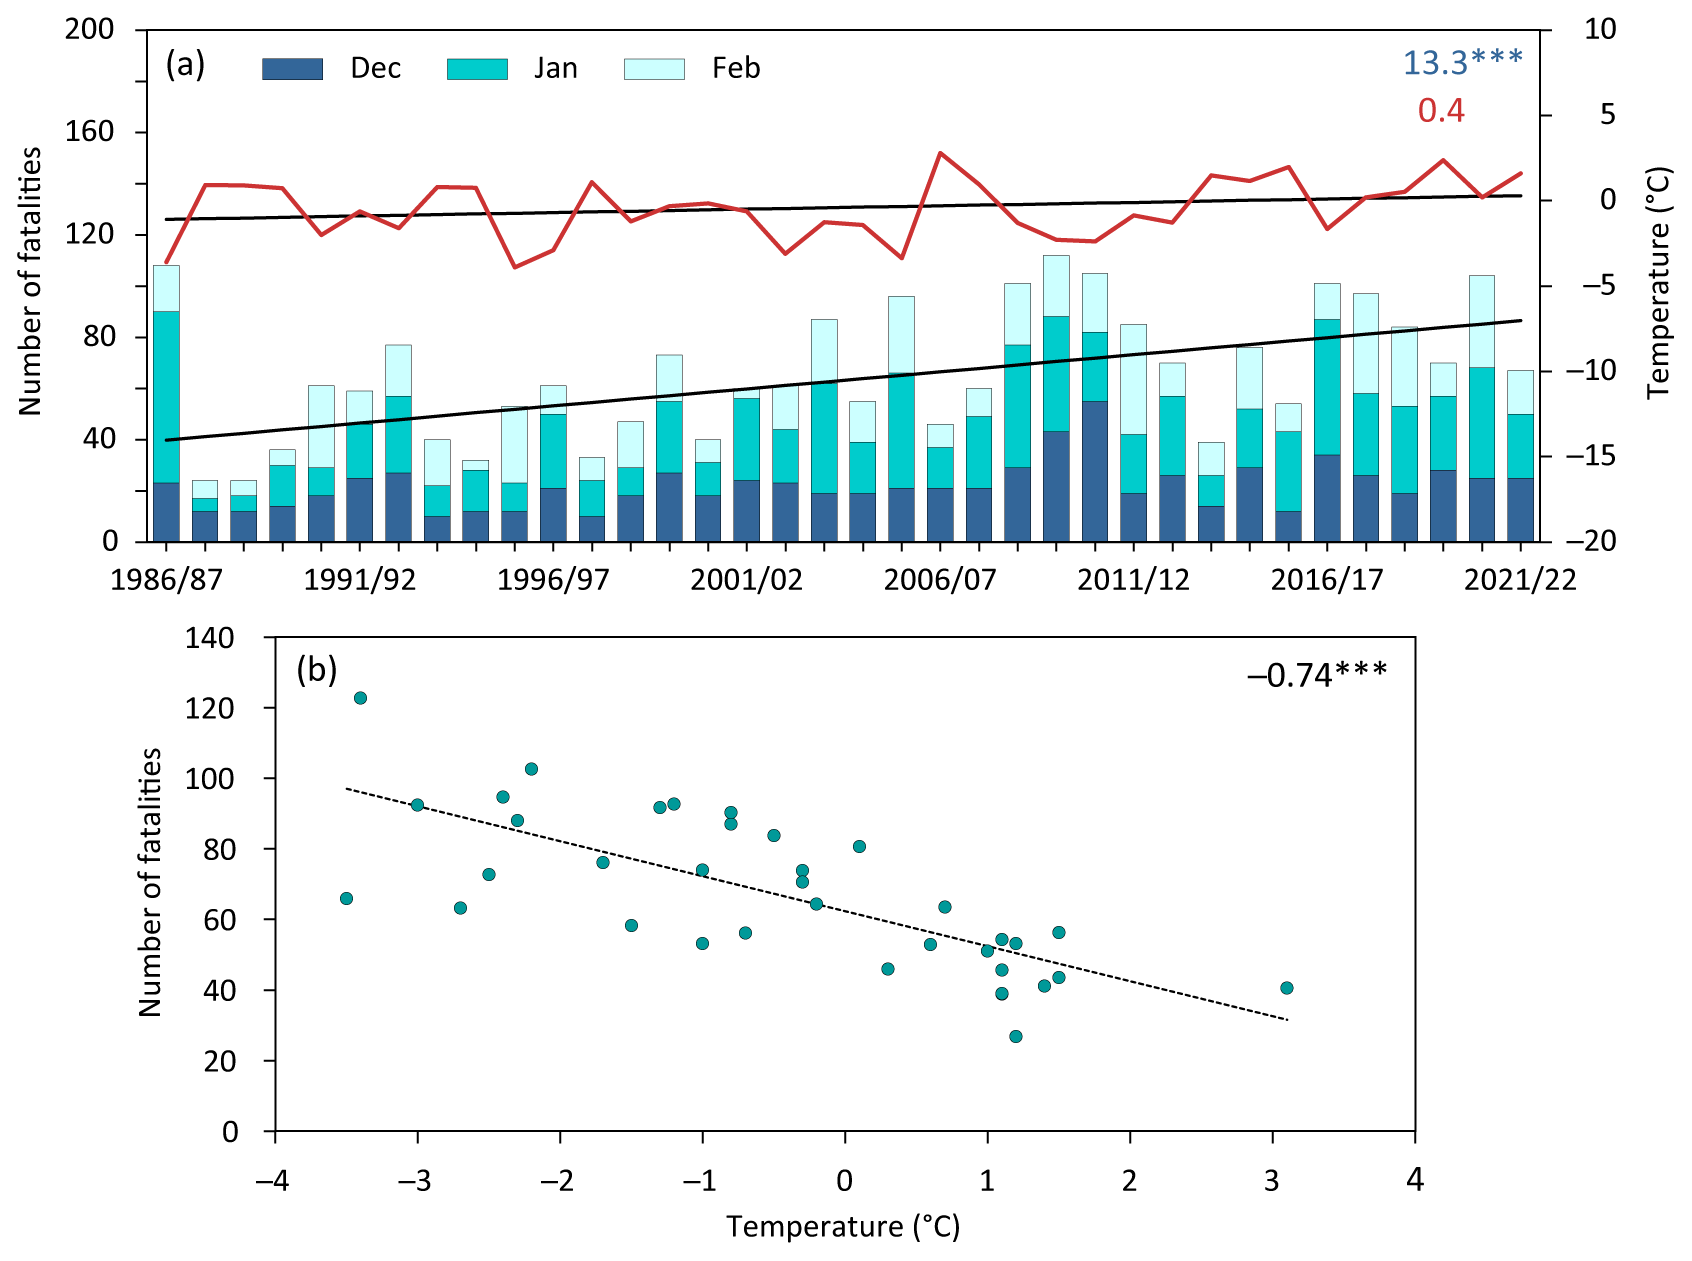
Figure 7Numbers of winter fatalities related to excessive natural cold, divided according to individual months (December, January, February) compared with winter (December–February) temperatures in the Czech Republic during the 1986–2022 period: (a) fluctuations and linear trends (top right: slopes in fatalities per 10 years and in degrees Celsius per 10 years; p<0.01); (b) scatterplot between detrended fatalities and winter temperatures (top right: correlation coefficient, p<0.01).
4.3.2 Lightning-related fatalities and thunderstorms
The fluctuations in annual numbers of lightning-related fatalities were compared with fluctuations in the annual numbers of days with thunderstorms (expressed by median) across the CR for the 1919–2022 period (Sect. 2.3). As seen in Fig. 8, both series behave differently. The number of thunderstorm days shows, besides large inter-annual variability, a statistically significant decreasing linear trend of −0.4 d per 10 years (p<0.01), similar to the overall trend in the number of lightning fatalities (−4.6 fatalities per 10 years, p<0.01) (Fig. 8a). However, the fatalities exhibit two distinct phases: a steep decline from 1919 to 1972 (−8.2 fatalities per 10 years, p<0.01) and a slightly decreasing trend afterwards (−0.8 fatalities per 10 years, p<0.01). The statistically significant Pearson correlation coefficient between the fatality and thunderstorm series from 1919–2022 was 0.30 (p<0.01), but it was non-significant for the two considered parts of the entire series (only 0.05 and 0.21, respectively). Non-significant 11- and 21-year running correlation coefficients between lightning fatalities and the number of thunderstorm days prevailed throughout the 104-year period, with a few short time spans showing significant correlations (Fig. 8b). After detrending both series in the two aforementioned time intervals, the correlation coefficient increased to 0.34 (p<0.05) for 1919–1972, but for the second interval, 1973–2022, it remained non-significant (0.16), slightly lower than the correlation from the original values (0.21) (see scatterplots in Fig. 8c).
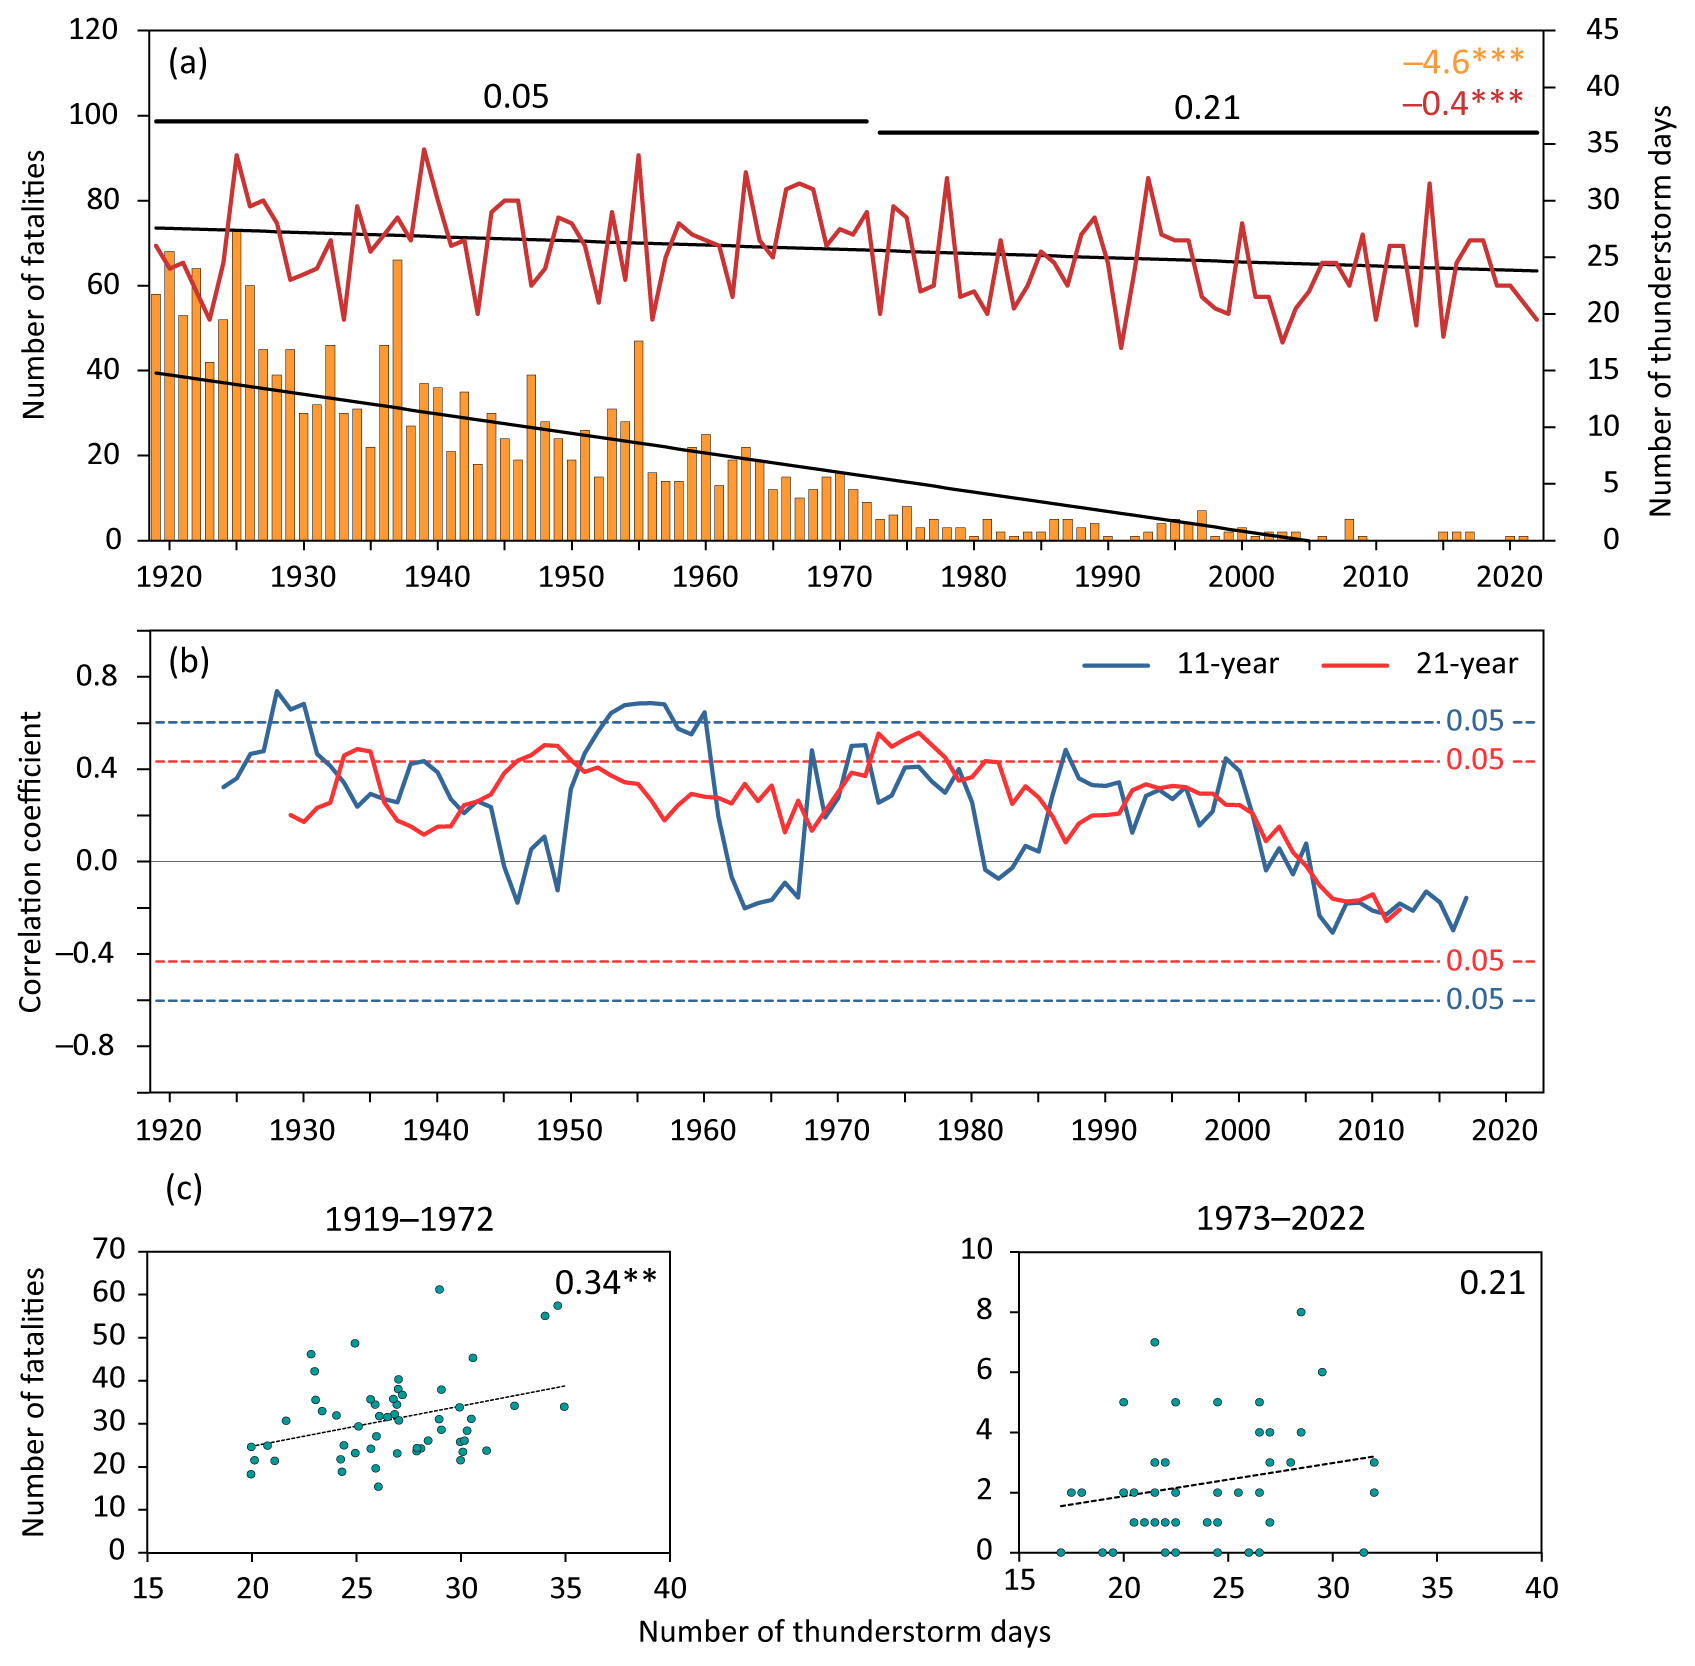
Figure 8Annual numbers of fatalities related to lightning and days with thunderstorms (expressed by median) in the Czech Republic during the 1919–2022 period: (a) fluctuations, linear trends (top right: slopes in fatalities per 10 years and days per 10 years) and Pearson correlation coefficients ( p<0.01); (b) 11- and 21-year running correlations between fatalities and thunderstorm days (horizontal lines indicate significance level at 0.05); (c) scatterplots between fatalities and thunderstorm days for two selected periods (1919–1972 – detrended values, 1973–2022 – original values; top right: correlation coefficients, p<0.05).
5.1 Data uncertainty
While demographic yearbooks are considered to be official and the most comprehensive source of fatality data in the CR, certain potential uncertainties relevant to this study must be acknowledged. The determination of the specific cause of death is based on a death certificate completed by a doctor according to the international list of diseases and causes of death (see Sect. 2.2) and their subjective judgement or evaluation. Even experienced healthcare professionals must choose from a wide range of possible causes of death, in which some categories (e.g. excessive natural heat, excessive solar radiation, non-specified natural forces) might be interpreted differently by individual doctors. Moreover, demographic yearbooks only include data concerning Czech citizens, thereby excluding deaths of non-Czechs within the CR (e.g. tourists, foreign workers), while including deaths of Czech citizens occurring abroad (e.g. nine fatalities in the X34 category earthquakes during the 1994–2022 period). The number of weather-related fatalities may also have been affected by changes in the total population of the CR, which grew continuously from 9.922 million in 1919 to 11.160 million in 1940. A significant drop in population began in particular after the transfer of Germans following World War II, with the total number decreasing to 10.693 million in 1945, 9.523 million in 1946, and reaching its lowest at 8.765 million in 1947. Subsequently, the population exceeded 9 million in 1951, 9.5 million in 1957, 10 million in 1975, and finally 10.5 million in 2010 (Český statistický úřad, 2023c).
5.2 A broader context of Czech weather-related fatalities
Fatalities attributed to excessive natural cold, particularly deaths due to freezing or hypothermia, were among the most frequent severe-weather-related deaths in the CR during the 1919–2022 period (see Fig. 1). They exhibited a statistically significant increasing linear trend, despite the detected decreasing trend in the severity of winter temperatures and snow patterns in the CR from 1961 (Brázdil et al., 2023b). After a notable local maximum of fatalities in 1978–1987 (13.0 % of all these fatalities, mean rate of 90.0 fatalities per year), their numbers dramatically increased in the last 20 years (2003–2022) to 37.5 % of such fatalities with a mean rate of 130.2 fatalities per year. The dominant part of cold-related fatalities was represented by males and those aged 65 years and older (for similar results see also Smith and Sheridan, 2019, for the US in 1975–2010). The reported dramatic fatality increase in recent decades in the CR could be partly explained by the increasing number of seniors ≥65 years, i.e. the age group most vulnerable to excessive natural cold (see Fig. 3), which may contribute to the related excess death as shown, for example, in the association between cold spells and daily mortality for 272 main cities in mainland China (He et al., 2023). The ageing of the CR population is evidenced by the number of people aged ≥65 years during the study period. Their number increased from 0.621 million in 1920 to 0.846 million in 1939. After World War II, their number grew from 0.633 million in 1945 to 1.398 million in 1975, followed by a decline to 1.222 million in 1985 and some stagnation afterwards. From 2000, with 1.422 million seniors, there was a substantial increase to 2.160 million in 2022 (Český statistický úřad, 2023b). The potential relationship to cold-related fatalities was confirmed by high and statistically significant correlation coefficients between the numbers of fatalities and people aged ≥65 years (e.g. 0.64, p<0.01, for 1920–2021 or 0.82, p<0.01, for 1946–2021).
Another factor that could at least partly explain the increase in cold-related fatalities in the CR is the rise in the homeless population, which became more prominent particularly after the Velvet Revolution in 1989, while previously such individuals were rather rare. Although data on the homeless were not collected systematically, a 2011 survey reported 11 496 homeless individuals (Český statistický úřad, 2023d), and in 2019, the total reached 23 830 (Nešporová et al., 2019), nearly half of whom were living outdoors. While homeless individuals have the option to spend cold days and nights in special facilities, many prefer staying outdoors to avoid restrictions, such as alcohol prohibition. This exposure to low winter temperatures often leads to deaths from freezing or hypothermia. For instance, Romaszko et al. (2017) found that most deaths among the homeless in Olsztyn, Poland (2010–2016), occurred under conditions of cold stress, with hypothermia being 13 times more common as a cause of death compared to the general population. Similarly, Lane et al. (2018) reported a significant proportion of unsheltered homeless individuals affected by cold-related illness and death in New York City (the US) during 2005–2014. Stickley et al. (2023) also highlighted the role of socioeconomically disadvantaged groups, including individuals with risky alcohol consumption behaviour and those experiencing homelessness, in contributing to hypothermia mortality among individuals aged 30–74 years in the Baltic countries (Estonia, Latvia, Lithuania) and Finland during 2000–2015.
To account for these and other potential non-meteorological effects on cold-related mortality (see also Ekamper et al., 2010, for the Netherlands), the detrended Czech fatality series attributed to excessive natural cold demonstrated a close connection between the number of fatalities and low mean winter temperatures, expressed by statistically significant and very high negative correlation coefficients (see Sect. 4.3.1).
The increasing trend in cold-related fatalities in the CR aligns with the conclusion of Ryti et al. (2016), who stated that cold spells are associated with increased mortality rates globally, along with other adverse health effects. Conversely, Wang et al. (2016) projected a decrease in mortality related to cold waves for 209 US cities from 1960 to 2050. Many other studies focusing on mortality due to cold spells, often covering shorter periods than our Czech study, provide less direct comparability. For example, Analitis et al. (2008) found that a 1 °C drop in minimum apparent temperature led to an increase in daily deaths due to natural causes (1.35 %), cardiovascular issues (1.72 %), respiratory problems (3.30 %), and cerebrovascular incidents (1.25 %), especially among older age groups, in 15 European cities from 1990–2000. Kyselý et al. (2009) observed a positive excess in cardiovascular mortality during cold spells in the CR from 1986–2006, with males aged 25–59 years being particularly at risk due to occupational exposure outdoors in winter. Orru and Åström (2017) reported higher mortality due to external causes on hot and cold days in Estonia from 1997–2013. Pascal et al. (2018) attributed 3.9 % of total mortality to cold temperatures in 18 French cities between 2000 and 2010. Plavcová and Urban (2020) noted an impact on excess mortality associated with sudden rises in minimum temperature and pressure drops during winter (3.7 % and 1.4 %, respectively) in the CR from 1982–2017. Petkova et al. (2021) found that cold temperatures had a greater impact than hot temperatures on the elderly (≥65 years) in Sofia, Bulgaria, from 2000–2017, particularly under moderate and extreme cold conditions, with females being more vulnerable than males. Fonseca-Rodríguez et al. (2021) observed a smaller effect of cold winter weather on hospitalizations in Sweden from 1991–2014: cold and moist weather was linked to a delayed increase in cardiovascular hospitalizations and together with cold and dry weather heightened the risk of respiratory disease hospitalizations. Fan et al. (2023) identified cold exposure as a critical risk factor for cardiovascular diseases, increasing mortality by 1.6 % for every 1 °C decrease, based on a review of 159 different studies. Interestingly, fatalities related to cold spells, unlike those attributed to heat waves, were not highlighted among weather-, climate-, and water-related fatalities in the World Meteorological Organization report (WMO, 2021). Masselot et al. (2023) found an annual excess of 203 620 deaths attributed to cold (compared to 20 173 attributed to heat) in 854 urban areas in Europe from 2000–2019, highlighting differing results across Europe and among age groups.
The significant decrease in lightning-related fatalities in the CR from 1919 to 2022, with a total of 1786 deaths, highlights substantial changes in factors influencing these numbers. The decline is evident when comparing the fatality rate at the beginning and end of this 104-year period: 55.4 fatalities per year in 1919–1928 versus 0.8 fatalities per year in 2013–2022. This decreasing trend aligns with trends observed in the contiguous US (López and Holle, 1998), where after a peak in the late 1910s–1930s, a steady decline in lightning deaths began from 1944 and continued until 1991. In the CR, male fatalities due to lightning clearly outnumber those of females, and the proportion of victims declines with age, peaking in the 15- to 24-year age group (cf. Fig. 3), a pattern similar to that observed in other countries (e.g. Raga et al., 2014, for Mexico, Singh and Singh, 2015, for India, Antonescu and Cărbunaru, 2018, for Romania). The annual number of lightning fatalities in the CR was significantly correlated with the annual number of thunderstorm days, but the correlation was relatively weak (see Sect. 4.3.2 and Fig. 8). While López and Holle (1998) noted parallel fluctuations in lightning deaths and nationwide changes in thunder-day frequencies in the US from 1900–1991, they emphasized that thunder-day frequencies might not directly indicate lightning activity for a given year and questioned the spatial representativeness of lightning activity over a large area based on point station observations.
Observing the statistically significant decreasing linear trend in lightning-related fatalities in the CR from 1919 to 2022 (cf. Fig. 1), it is necessary to consider some non-meteorological factors. This primarily includes changes in the proportion of people working in agriculture, a sector where exposure to thunderstorms outdoors or in open landscapes was more frequent (Elsom, 2001). In 1930, 2.316 million people were employed in this sector in the CR, and this number continuously decreased in subsequent decades: 1.588 million in 1946, 0.832 million in 1961, 0.578 million in 1981, 156 000 in 2001, and 133 000 in 2021 (Sálusová et al., 2003, updated). Additionally, the percentage of women in these totals decreased from approximately 59 % to 35 % between 1930 and 2021. In comparison, in the United Kingdom, deaths in the agricultural workforce due to lightning dropped from 38 % of all lightning fatalities around 1850 to 9 % by 2000 (Elsom, 2018). Other factors contributing to the decreasing trend in lightning-related fatalities include an increase in urban populations with predominantly indoor jobs, wider use of lightning conductors, improved weather forecasting, significant advancements in medical services, greater availability of immediate emergency assistance with rapid hospital transport, and increased public awareness of safety measures during thunderstorms (e.g. Curran et al., 2000; Elsom and Webb, 2014; Elsom, 2018; Brázdil et al., 2019).
In agreement with our study, Holle (2016) reported a significant reduction in lightning fatality rates for western European countries and others transitioning from predominantly rural agricultural societies to primarily urban ones. In Switzerland, lightning fatalities dropped markedly between 1946–1980 and 1981–2015, with the annual mean lightning mortality rate declining from 0.7 to 0.14 fatalities per million people. Additionally, the first period had 2 years without lightning fatalities, which increased to 19 such years in the second period (Badoux et al., 2016). Elsom (2018) noted a dramatic decrease in the mean decadal lightning fatality rates for the United Kingdom, from 1.09 deaths per million inhabitants per year in the 1850s to 0.02 in the 2010s. The annual number of lightning fatalities in Romania decreased from 65 fatalities per year in 1999–2003 to 23.2 fatalities per year in 2011–2015 (Antonescu and Cărbunaru, 2018). A declining trend in lightning fatalities over recent decades has been confirmed in other countries as well (e.g. Mills, 2020, for Canada). Conversely, the number of lightning fatalities in China increased between 1997 and 2007, then started to decrease since 2008 (Zhang et al., 2011). Singh and Singh (2015) reported an increase in lightning fatalities in India from 1979 to 2006 and a subsequent decrease from 2007 to 2011. Other papers presenting detailed analyses of lightning fatalities did not report any trends, mainly due to incomplete datasets or short time series (e.g. Tilev-Tanriover et al., 2015, for Türkiye, and Holle et al., 2019, for Bangladesh). Pilorz et al. (2023) mentioned 151 lightning-related fatalities in central Europe from 2010–2020, averaging 13.7 fatalities per year, but it is unclear if all 7 fatalities reported in the Czech CSO database for 2010–2020 were included.
Regarding fatalities attributed to excessive natural heat, their numbers in demographic yearbooks were significantly underestimated (see Table 3, Figs. 1 and 4). In the CR during 1919–1948, with a mean summer temperature of 15.9 °C, a total of 224 fatalities were recorded. However, in the period from 1993–2022, when summers were warmer by 2 °C, only 47 fatalities were documented. Although the number of fatalities for 1986–2022 (cf. Fig. 4) showed a slightly increasing linear trend, these numbers are considerably lower than those reported in other studies analysing heat wave event fatalities in the CR in individual years (e.g. Kyselý and Kříž, 2008; Knobová et al., 2014; Urban et al., 2017; Arsenović et al., 2019) or over longer periods (e.g. Kyselý and Plavcová, 2012; Hanzlíková et al., 2015; Urban et al., 2020, 2022). This indicates that fatalities related to excessive natural heat in demographic yearbooks were likely classified under other disease/cause categories according to the international list and do not reflect the actual numbers. A similar situation is observed with fatalities caused by natural hazards, as is evident from a comparison with data in Brázdil et al. (2023a). For instance, the 126 fatalities reported in Czech demographic yearbooks (1931–2020) constitute only 21.0 % of the 600 fatalities reported in the cited study.
The numbers of weather-related fatalities from demographic yearbooks can be partially compared with those in a specific fatality database of the Institute of Geography, Masaryk University, Brno (IGMU), primarily compiled from documentary evidence (mainly newspapers) and used by Brázdil et al. (2023a) for their study of weather-related fatalities in the CR during the 1921–2020 period. As expected, the IGMU database only covers a smaller percentage of the fatalities reported in CSO data: 22.4 % for lightning fatalities, 13.3 % for falls on ice or snow (1994–2020), 11.8 % for excessive natural cold, and 8.6 % for excessive natural heat. However, the situation is reversed for natural hazard fatalities (as mentioned earlier). Additionally, the IGMU database facilitates spatiotemporal analysis of individual fatal events, including specific characteristics of the fatalities, which are either entirely missing or only partly covered in demographic yearbooks or the CSO database. These include the exact day (or part of the day) and location of the death, the type of death (direct or indirect), the cause and place of death, or the victim's behaviour (hazardous or non-hazardous). Furthermore, fatalities in the IGMU database can be attributed to specific weather/hydrometeorological events like floods, windstorms, convective storms, fog, etc. Such additional data are crucial for a comprehensive understanding of the circumstances leading to the loss of human lives during severe weather situations, with significant implications for risk management.
From the analysis of weather-related fatality data published by the CSO in the demographic yearbooks for the CR covering the 1919–2022 period, the following conclusions can be summarized:
- i.
Czech demographic yearbooks provide official figures, including sex and age, for weather-related fatalities attributed to excessive natural cold, excessive natural heat, lightning, natural hazards, air pressure changes, and falls on ice or snow for the CR during the 1919–2022 period or parts thereof. Based on death certificates and international lists of death causes, these yearbooks undervalue fatalities attributed to extreme natural heat, natural hazards, and air pressure changes but are representative of the three remaining categories. The proportion of weather-related fatalities to the total number of deaths in the CR annually fluctuated only between 0.2 ‰ (in 1974) and 1.7 ‰ (in 2009).
- ii.
The average annual rate of 89 weather-related fatalities during 1919–2022 comprised 74.9 % from excessive natural cold and 19.3 % from lightning. Despite significant temporal fluctuations, statistically significant increasing linear trends were observed in the numbers of deaths due to excessive natural cold, excessive natural heat, and falls on ice or snow, while a decreasing trend was noted in lightning fatalities. Males and seniors aged ≥65 years were the most affected sex and age groups, respectively. Only in lightning fatalities did the age group of 15–24 years outnumber the seniors.
- iii.
Fatalities due to excessive natural cold showed a negative correlation with mean winter month temperatures (i.e. lower temperatures mean higher fatality numbers). This statistically significant correlation has been declining since 1919, with alternating periods of lower and higher correlations. The dramatic increase in related fatalities in the past 20 years, accounting for 37.5 % of the total number in this category, indicates the increasing vulnerability of the ageing and homeless populations to cold episodes. The detrended series showed a statistically significant and very close relationship between fatalities and winter temperatures.
- iv.
The number of lightning fatalities was statistically significantly and positively correlated with the mean annual number of days with a thunderstorm (i.e. more thunderstorms contribute to higher fatality numbers), but the correlation is relatively weak. A dominant proportion of fatalities, with a strong decreasing trend from 1919 to 1975 (94.6 % of all lightning fatalities), clearly demonstrated the effects of a significant reduction in the number of people employed in agriculture, changes in lifestyle, and improved medical care.
- v.
The demographic yearbooks provide the most comprehensive information on the number of fatalities, as well as the sex and age of the deceased, attributed to excessive natural cold, lightning, and falls on ice or snow in the CR. However, they are insufficient for studying other circumstances and characteristics of such weather-related fatal events, as well as for distinguishing fatalities caused by other severe weather events. This underscores the importance of other existing or specially created databases for in-depth investigation of such fatal events and the use of related knowledge in risk management to save lives endangered by weather extremes.
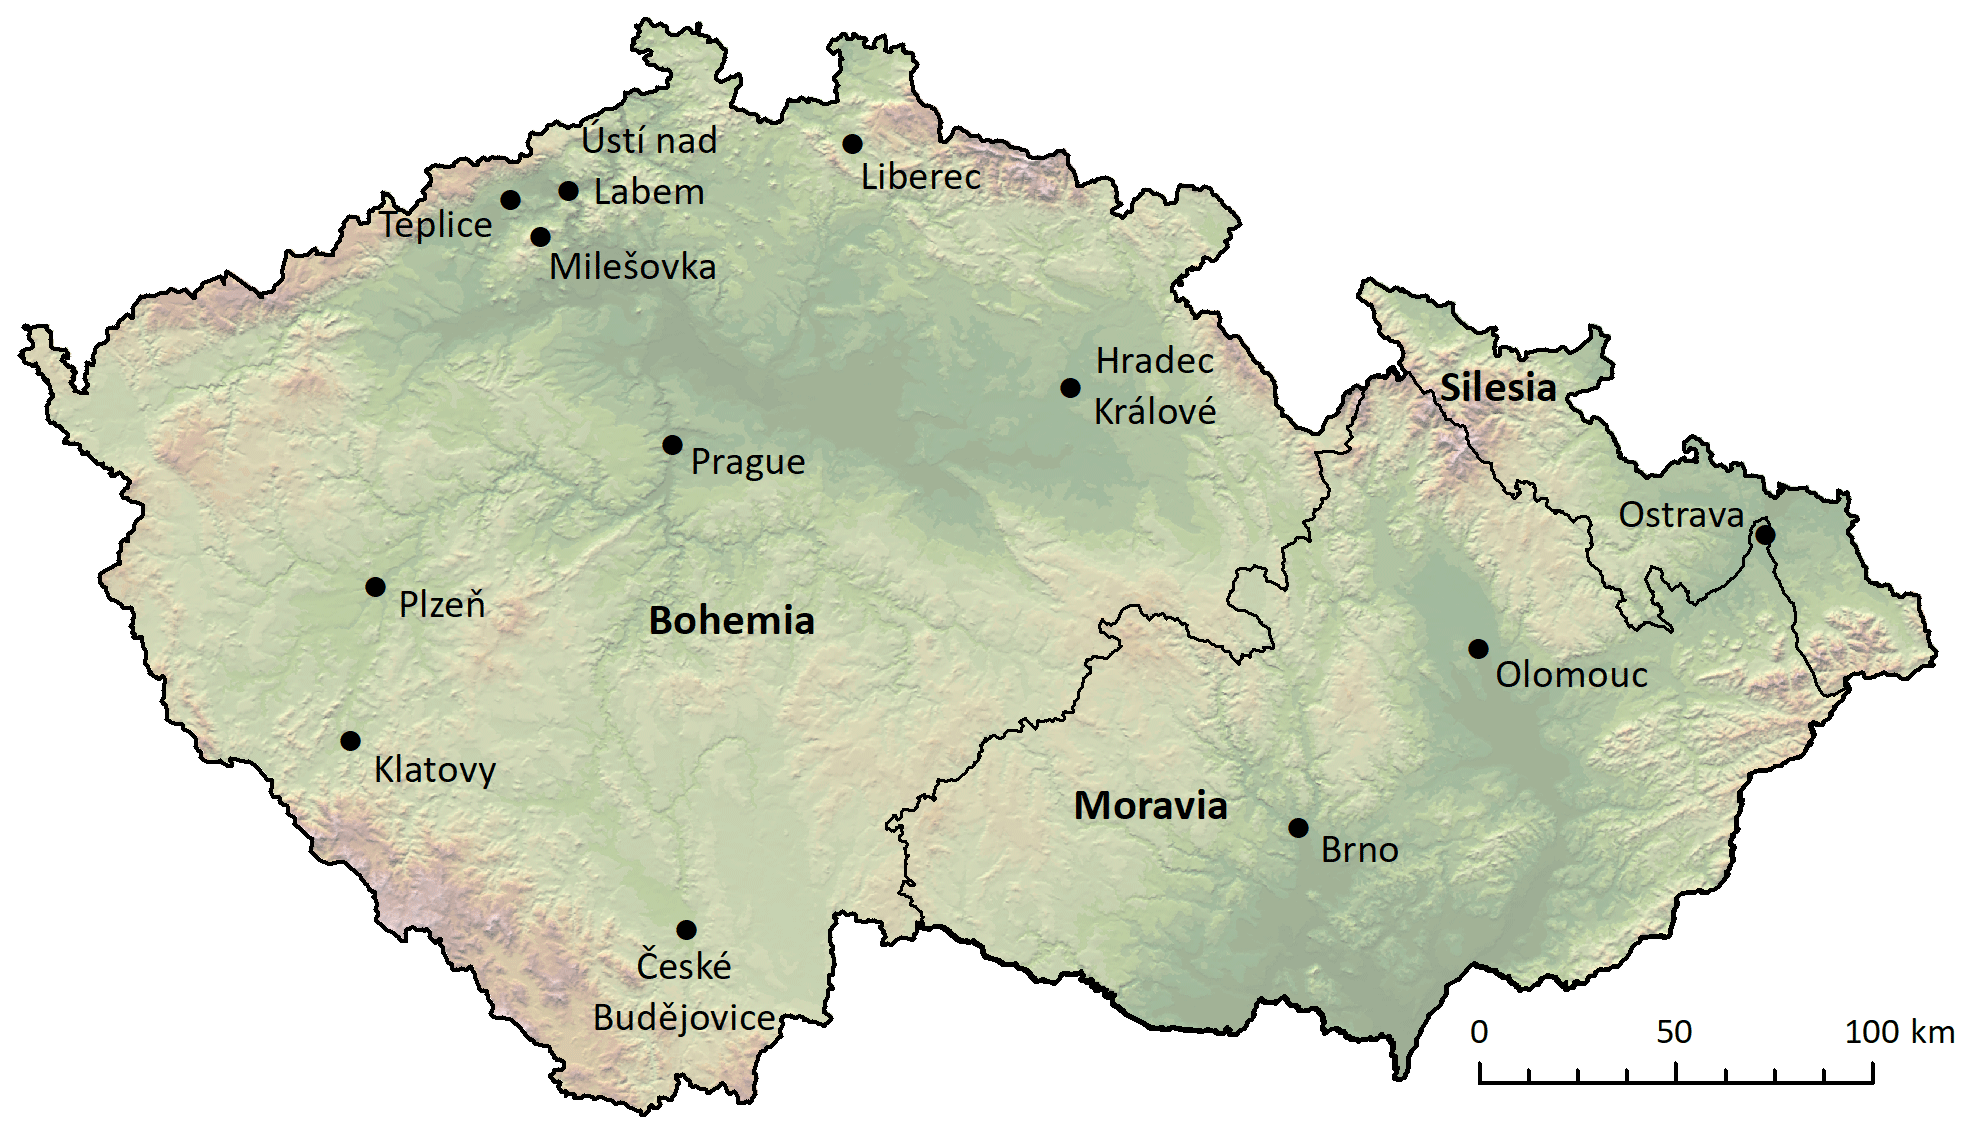
Figure A1Locations in the Czech Republic mentioned in this paper (data source: ArcCR 500 v2.0).
Meteorological data (temperatures and thunderstorm days) can be made available by the authors upon request. Fatality and other demographic data of the Czech Statistical Office can be found in the related published yearbooks:
-
https://www.czso.cz/csu/czso/casova_rada_demografie (Český statistický úřad, 2023a)
-
https://www.czso.cz/csu/czso/czech-demographic-handbook-2021 (Český statistický úřad, 2023b)
-
https://vdb.czso.cz/vdbvo2/faces/en/index.jsf?page=statistiky&katalog=33157 (Český statistický úřad, 2023c)
-
https://www.czso.cz/csu/sldb/vysledky_scitani_bezdomovcu (Český statistický úřad, 2023d)
-
or by the Czech Statistical Office upon request.
RB extracted data from yearbooks, proposed statistical analyses, designed the study, and wrote the paper with contributions from the two co-authors. KC extracted data from yearbooks, created the fatality database, and made basic analyses (including finalizing of figures). PZ prepared meteorological data and contributed with statistical analyses of relationships between fatalities and meteorological factors.
The contact author has declared that none of the authors has any competing interests.
Publisher's note: Copernicus Publications remains neutral with regard to jurisdictional claims made in the text, published maps, institutional affiliations, or any other geographical representation in this paper. While Copernicus Publications makes every effort to include appropriate place names, the final responsibility lies with the authors.
This paper was supported by the AdAgriF – Advanced methods of greenhouse gases emission reduction and sequestration in agriculture and forest landscape for climate change mitigation project (CZ.02.01.01/00/22_008/0004635). We extend our gratitude to Jana Audy, Robert Šanda, and Terezie Štyglerová from the Czech Statistical Office, Prague, for providing us with detailed data (the database) of selected weather-related fatalities since 1986 and corrected data from demographic yearbooks. We also acknowledge Laughton Chandler (Charleston, SC) for his assistance with English style corrections and Gaston R. Demarée (Brussels) and Neil Macdonald (Liverpool) for their critical reviewing of the paper.
This research has been supported by the AdAgriF – Advanced methods of greenhouse gases emission reduction and sequestration in agriculture and forest landscape for climate change mitigation project (CZ.02.01.01/00/22_008/0004635).
This paper was edited by Maria-Carmen Llasat and reviewed by Gaston R. Demarée and Neil Macdonald.
Aceto, L., Pasqua, A. A., and Petrucci, O.: Effects of damaging hydrogeological events on people throughout 15 years in a Mediterranean region, Adv. Geosci., 44, 67–77, https://doi.org/10.5194/adgeo-44-67-2017, 2017.
Analitis, A., Katsouyanni, K., Biggeri, A., Baccini, M., Forsberg, B., Bisanti, L., Kirchmayer, U., Ballester, F., Cadum, E., Goodman, P. G., Hojs, A., Sunyer, J., Tiittanen, P., and Michelozzi, P.: Effects of cold weather on mortality: results from 15 European cities within the PHEWE Project, Am. J. Epidemiol., 168, 1397–1408, https://doi.org/10.1093/aje/kwn266, 2008.
Antonescu, B. and Cărbunaru, F.: Lightning-related fatalities in Romania from 1999 to 2015, Weather Clim. Soc., 10, 241–252, https://doi.org/10.1175/WCAS-D-17-0091.1, 2018.
Arsenović, D., Lehnert, M., Fiedor, D., Šimáček, P., Středová, H., Středa, T., and Savić, S.: Heat-waves and mortality in Czech cities: A case study for the summers of 2015 and 2016, Geogr. Pannonica, 23, 162–172, https://doi.org/10.5937/gp23-22853, 2019.
Badoux, A., Andres, N., Techel, F., and Hegg, C.: Natural hazard fatalities in Switzerland from 1946 to 2015, Nat. Hazards Earth Syst. Sci., 16, 2747–2768, https://doi.org/10.5194/nhess-16-2747-2016, 2016.
Brázdil, R., Bělínová, M., Dobrovolný, P., Mikšovský, J., Pišoft, P., Řezníčková, L., Štěpánek, P., Valášek, H., and Zahradníček, P.: Temperature and Precipitation Fluctuations in the Czech Lands During the Instrumental Period, Masaryk University, Brno, Czech Republic, 235 pp., ISBN 978-80-210-6052-4, 2012.
Brázdil, R., Stucki, P., Szabó, M., Řezníčková, L., Dolák, L., Dobrovolný, P., Tolasz, R., Kotyza, O., Chromá, K., and Suchánková, S.: Windstorms and forest disturbances in the Czech Lands: 1801–2015, Agr. Forest Meteorol., 250–251, 47–63, https://doi.org/10.1016/j.agrformet.2017.11.036, 2018.
Brázdil, R., Chromá, K., Řehoř, J., Zahradníček, P., Dolák, L., Řezníčková, L., and Dobrovolný, P.: Potential of documentary evidence to study fatalities of hydrological and meteorological events in the Czech Republic, Water, 11, 2014, https://doi.org/10.3390/w11102014, 2019.
Brázdil, R., Chromá, K., Dolák, L., Řehoř, J., Řezníčková, L., Zahradníček, P., and Dobrovolný, P.: Fatalities associated with the severe weather conditions in the Czech Republic, 2000–2019, Nat. Hazards Earth Syst. Sci., 21, 1355–1382, https://doi.org/10.5194/nhess-21-1355-2021, 2021.
Brázdil, R., Chromá, K., Zahradníček, P., Dobrovolný, P., Dolák, L., Řehoř, J., and Řezníčková, L.: Changes in weather-related fatalities in the Czech Republic during the 1961–2020 period, Atmosphere, 13, 688, https://doi.org/10.3390/atmos13050688, 2022a.
Brázdil, R., Zahradníček, P., Dobrovolný, P., Řehoř, J., Trnka, M., Lhotka, O., and Štěpánek, P.: Circulation and climate variability in the Czech Republic between 1961 and 2020: A comparison of changes for two “normal” periods, Atmosphere, 13, 137, https://doi.org/10.3390/atmos13010137, 2022b.
Brázdil, R., Chromá, K., Dolák, L., Zahradníček, P., Řehoř, J., Dobrovolný, P., and Řezníčková, L.: The 100-year series of weather-related fatalities in the Czech Republic: interactions of climate, environment and society, Water, 15, 1965, https://doi.org/10.3390/w15101965, 2023a.
Brázdil, R., Zahradníček, P., Chromá, K., Dobrovolný, P., Dolák, L., Řehoř, J., and Zahradník, P.: Severity of winters in the Czech Republic during the 1961–2021 period and related environmental impacts and responses, Int. J. Climatol., 43, 2820–2842, https://doi.org/10.1002/joc.8003, 2023b.
Český statistický úřad: Demografické ročenky (pramenná díla) (Demographic yearbooks – source works), https://www.czso.cz/csu/czso/casova_rada_demografie (last access: 12 August 2023), 2023a.
Český statistický úřad: Czech Demographic Handbook – 2021 (Table 1-10 Mid-year population by five-year age group and sex: 1920–2021), https://www.czso.cz/csu/czso/czech-demographic-handbook-2021 (last access: 14 November 2023), 2023b.
Český statistický úřad: Veřejná databáze. Dlouhé časové řady (Public database. Long-term time series), https://vdb.czso.cz/vdbvo2/faces/en/index.jsf?page=statistiky&katalog=33157 (last access: 2 November 2023), 2023c.
Český statistický úřad: Výsledky sčítání bezdomovců (Results of homeless census), https://www.czso.cz/csu/sldb/vysledky_scitani_bezdomovcu (last access: 9 November 2023), 2023d.
CRED: Centre for Research on the Epidemiology of Disasters, https://www.cred.be (last access: 6 January 2024), 2024.
Curran, E. B., Holle, R. L., and López, R. E.: Lightning casualties and damages in the United States from 1959 to 1994, J. Climate, 13, 3448–3464, 2000.
Ekamper, P., van Poppel, F., van Duin, C., and Mandemakers, K.: Heat waves and cold spells and their effect on mortality: an analysis of micro-data for the Netherlands in the nineteenth and twentieth centuries, Ann. Demogr. Hist., 48, 55–104, https://doi.org/10.3917/adh.120.0055, 2010.
Elsom, D. M.: Deaths and injuries caused by lightning in the United Kingdom: analyses of two databases, Atmos. Res., 56, 325–334, https://doi.org/10.1016/S0169-8095(00)00083-1, 2001.
Elsom, D. M.: Factors contributing to a long-term decrease in national lightning fatality rates: case study of the United Kingdom with wider implications, Int. J. Disast. Risk Reduct., 31, 341–353, https://doi.org/10.1016/j.ijdrr.2018.06.001, 2018.
Elsom, D. M. and Webb, J. D. C.: Deaths and injuries from lightning in the UK, 1988–2012, Weather, 69, 221–226, https://doi.org/10.1002/wea.2254, 2014.
European Environment Agency: Analysis and data, https://www.eea.europa.eu/ (last access: 20 October 2023), 2023.
Fan, J.-F., Xiao, Y.-C., Feng, Y.-F., Niu, L.-Y., Tan, X., Sun, J.-C., Leng, Y.-Q., Li, W.-Y., Wang, W.-Z., and Wang Y.-K.: A systematic review and meta-analysis of cold exposure and cardiovascular disease outcomes, Front. Cardiovasc. Med., 10, 1084611, https://doi.org/10.3389/fcvm.2023.1084611, 2023.
Fonseca-Rodríguez, O., Sheridan, S. C., Lundevaller, E. H., and Schumann, B.: Effect of extreme hot and cold weather on cause-specific hospitalizations in Sweden: A time series analysis, Environ. Res., 193, 110535, https://doi.org/10.1016/j.envres.2020.110535, 2021.
Forzieri, G., Cescatti, A., e Silva, F. B., and Feyen, L.: Increasing risk over time of weather-related hazards to the European population: A data-driven prognostic study, Lancet Planet. Health, 1, e200–e208, https://doi.org/10.1016/S2542-5196(17)30082-7, 2017.
Grimalt-Gelabert, M., Rosselló-Geli, J., and Bauzà-Llinàs, J.: Flood related mortality in a touristic island: Mallorca (Balearic Islands) 1960–2018, J. Flood Risk Manage., 13, e12644, https://doi.org/10.1111/jfr3.12644, 2020.
Guha-Sapir, D., Below, R., and Hoyois, P.: EM-DAT: The CRED/OFDA International Disaster Database, http://www.emdat.be (last access: 20 October 2023), 2016.
Hanzlíková, H., Plavcová, E., Kynčl, J., Kříž, B., and Kyselý, J.: Contrasting patterns of hot spell effects on morbidity and mortality for cardiovascular diseases in the Czech Republic, 1994–2009, Int. J. Biometeorol., 59, 1673–1684, https://doi.org/10.1007/s00484-015-0974-1, 2015.
He, C., Yin, P., Liu, Z., Huang, J., Chen, Y., Gao, X., Xu, Y., Wang, C., Cai, W., Gong, P., Luo, Y., Ji, J. S., Kan, H., Chen, R., and Zhou, M.: Projections of excess deaths related to cold spells under climate and population change scenarios: A nationwide time series modeling study, Environ. Int., 178, 108034, https://doi.org/10.1016/j.envint.2023.108034, 2023.
Hilker, N., Badoux, A., and Hegg, C.: The Swiss flood and landslide damage database 1972–2007, Nat. Hazards Earth Syst. Sci., 9, 913–925, https://doi.org/10.5194/nhess-9-913-2009, 2009.
Holle, R. L.: A summary of recent national-scale lightning fatality studies, Weather Clim. Soc., 8, 35–42, https://doi.org/10.1175/WCAS-D-15-0032.1, 2016.
Holle, R. L., Dewan, A., Said, R., Brooks, W. A., Hossain, M. F., and Rafiuddin, M.: Fatalities related to lightning occurrence and agriculture in Bangladesh, Int. J. Disast. Risk Reduct., 41, 101264, https://doi.org/10.1016/j.ijdrr.2019.101264, 2019.
Kendall, M. G.: Rank Correlation Methods, in: 4th Edn., Charles Griffin, London, UK, 202 pp., ISBN 978-0852641996, 1975.
Knobová, V., Hůnová, I., Malý, M., and Braniš, M.: Vliv vln vedra v létě 2003 a 2006 na úmrtnost obyvatel Prahy (Heat wave effect on mortality in Prague in summer 2003 and 2006), Meteorol. Zpr., 67, 33–40, 2014.
Křivancová, S.: Rekordně nízké teploty vzduchu v mimořádně tuhé zimě 1928/29 (Record low air temperatures during an extremely severe winter 1928/29), Meteorol. Zpr., 52, 50–54, 1999.
Krška, K.: Zima 1928/29 v Česku se zřetelem k povaze extrémů a dobové literatuře (Winter 1928/29 in Czechia with respect to the nature of extremes and the period literature), Meteorol. Zpr., 62, 5–9, 2009.
Kyselý, J. and Kříž, B.: Decreased impacts of the 2003 heat waves on mortality in the Czech Republic: An improved response?, Int. J. Biometeorol., 52, 733–745, https://doi.org/10.1007/s00484-008-0166-3, 2008.
Kyselý, J. and Plavcová, E.: Declining impacts of hot spells on mortality in the Czech Republic, 1986–2009: Adaptation to climate change?, Climatic Change, 113, 437–453, https://doi.org/10.1007/s10584-011-0358-4, 2012.
Kyselý, J., Pokorná, L., Kyncl, J., and Kříž, B.: Excess cardiovascular mortality associated with cold spells in the Czech Republic, BMC Publ. Health, 9, 1–11, https://doi.org/10.1186/1471-2458-9-19, 2009.
Lane, K., Ito, K., Johnson, S., Gibson, E. A., Tang, A., and Matte, T.: Burden and risk factors for cold-related illness and death in New York City, Int. J. Environ. Res. Pub. Health, 15, 632, https://doi.org/10.3390/ijerph15040632, 2018.
Lhotka, O. and Kyselý, J.: The 2021 European heat wave in the context of past major heat waves, Earth Space Sci., 9, e2022EA002567, https://doi.org/10.1029/2022EA002567, 2022.
López, L. E. and Holle, L. R.: Changes in the number of lightning deaths in the United States during the twentieth century, J. Climate, 11, 2070–2077, https://doi.org/10.1175/1520-0442-11.8.2070, 1998.
Mann, H. B.: Non-parametric tests against trend, Econometrica, 13, 163–171, https://doi.org/10.2307/1907187, 1945.
Masselot, P., Mistry, M., Vanoli, J., Schneider, R., Iungman, T., Garcia-Leon, D., Ciscar, J.-C., Feyen, L., Orru, H., Urban, A., Breitner, S., Huber, V., Schneider, A., Samoli, E., Stafoggia, M., de'Donato, F., Rao, S., Armstrong, B., Nieuwenhuijsen, M., Vicedo-Cabrera, A. M., and Gasparrini, A.: Excess mortality attributed to heat and cold: a health impact assessment study in 854 cities in Europe, Lancet Planet. Health, 7, e271–e281, https://doi.org/10.1016/S2542-5196(23)00023-2, 2023.
Matějíček, J. and Hladný, J.: Povodňová katastrofa 20. století na území České republiky (Flood Disaster of the 20th Century on the Territory of the Czech Republic), Ministerstvo životního prostředí České republiky, Praha, Czech Republic, 60 pp., ISBN 80-7212-130-8, 1999.
Mills, B.: An updated assessment of lightning-related fatality and injury risk in Canada: 2002–2017, Nat. Hazards, 102, 997–1009, https://doi.org/10.1007/s11069-020-03942-9, 2020.
Münster, P.: Tornádo na jihu Moravy 24.6.2021 (Tornado on South Moravia on 24 June 2021), Meteorol. Zpr., 75, 17–24, 2022.
Nešporová, O., Holpuch, P., Janurová, K., and Kuchařová, V.: Sčítání osob bez domova v České republice 2019 (Census of Homeless in the Czech Republic 2019), VÚPSV, v.v.i., Praha, Czech Republic, 95 pp., ISBN 978-80-7416-351-7, 2019.
Orru, H. and Åström, D. O.: Increases in external cause mortality due to high and low temperatures: evidence from northeastern Europe, Int. J. Biometeorol., 61, 963–966, https://doi.org/10.1007/s00484-016-1270-4, 2017.
Papagiannaki, K., Petrucci, O., Diakakis, M., Kotroni, V., Aceto, L., Bianchi, C., Brázdil, R., Grimalt Gelabert, M., Inbar, M., Kahraman, A., Kılıç, Ö., Krahn, A., Kreibich, H., Llasat, M. C., Llasat-Botija, M., Macdonald, N., Madruga de Brito, M., Mercuri, M., Pereira, S., Řehoř, J., Rossello Geli, J., Salvati, P., Vinet, F., and Zêzere, J. L.: Developing a large-scale dataset of flood fatalities for territories in the Euro-Mediterranean region, FFEM-DB, Sci. Data, 9, 166, https://doi.org/10.1038/s41597-022-01273-x, 2022.
Paprotny, D., Morales-Nápoles, O., and Jonkman, S. N.: HANZE: a pan-European database of exposure to natural hazards and damaging historical floods since 1870, Earth Syst. Sci. Data, 10, 565–581, https://doi.org/10.5194/essd-10-565-2018, 2018a.
Paprotny, D., Sebastian, A., Morales-Nápoles, O., and Jonkman, S. N.: Trends in flood losses in Europe over the past 150 years, Nat. Commun., 9, 1985, https://doi.org/10.1038/s41467-018-04253-1, 2018b.
Pascal, M., Wagner, V., Corso, M., Laaidi, K., Ung, A., and Beaudeau, P.: Heat and cold related-mortality in 18 French cities, Environ. Int., 121, 189–198, https://doi.org/10.1016/j.envint.2018.08.049, 2018.
Petkova, E. P., Dimitrova, L. K., Sera, F., and Gasparrini, A.: Mortality attributable to heat and cold among the elderly in Sofia, Bulgaria, Int. J. Biometeorol., 65, 865–872, https://doi.org/10.1007/s00484-020-02064-y, 2021.
Petrucci, O., Salvati, P., Aceto, L., Bianchi, C., Pasqua, A. A., Rossi, M., and Guzzetti, F.: The vulnerability of people to damaging hydrogeological events in the Calabria Region (Southern Italy), Int. J. Environ. Res. Publ. Health, 15, 48, https://doi.org/10.3390/ijerph15010048, 2018.
Petrucci, O., Aceto, L., Bianchi, C., Bigot, V., Brázdil, R., Pereira, S., Kahraman, A., Kiliç, Ö., Kotroni, V., Llasat, M. C., Llasat-Botija, M., Papagiannaki, K., Pasqua, A. A., Řehoř, J., Geli, J. R., Salvati, P., Vinet, F., and Zêzere, J. L.: Flood fatalities in Europe, 1980–2018: variability, features, and lessons to learn, Water, 11, 1682, https://doi.org/10.3390/w11081682, 2019a.
Petrucci, O., Papagiannaki, K., Aceto, L., Boissier, L., Kotroni, V., Grimalt, M., Llasat, M. C., Llasat-Botija, M., Rosselló, J., Pasqua, A. A., and Vinet, F.: MEFF: The database of MEditerranean Flood Fatalities (1980 to 2015), J. Flood Risk Manage., 12, e12461, https://doi.org/10.1111/jfr3.12461, 2019b.
Pilorz, W., Laskowski, I., Surowiecki, A., and Łupikasza, E.: Fatalities related to sudden meteorological events across Central Europe from 2010 to 2020, Int. J. Disast. Risk Reduct., 88, 103622, https://doi.org/10.1016/j.ijdrr.2023.103622, 2023.
Plavcová, E. and Urban, A.: Intensified impacts on mortality due to compound winter extremes in the Czech Republic, Sci. Total Environ., 746, 141033, https://doi.org/10.1016/j.scitotenv.2020.141033, 2020.
Raga, G. B., de la Parra, M. G., and Kucienska, B.: Deaths by lightning in Mexico (1979–2011): Threat or vulnerability?, Weather Clim. Soc., 6, 434–444, https://doi.org/10.1175/WCAS-D-13-00049.1, 2014.
Romaszko, J., Cymes, I., Dragańska, E., Kuchta, R., and Glińska-Lewczuk, K.: Mortality among the homeless: Causes and meteorological relationships, PLoS ONE, 12, e0189938, https://doi.org/10.1371/journal.pone.0189938, 2017.
Ryti, N. R., Guo, Y., and Jaakkola, J. J.: Global association of cold spells and adverse health effects: a systematic review and meta-analysis, Environ. Health Perspect., 124, 12–22, https://doi.org/10.1289/ehp.1408104, 2016.
Sálusová, D., Zavázal, P., Kovář, J., Makovičková, J., Nováková, H., and Švec, J.: České zemědělství očima statistiky (Czech Agriculture from View of Statistics), Český statistický úřad, Praha, Czech Republic, 48 pp., ISBN 80-250-0552-6, 2003.
Sen, P. K.: Estimates of the regression coefficient based on Kendall's tau, J. Am. Stat. Assoc., 63, 1379–1389, https://doi.org/10.1080/01621459.1968.10480934, 1968.
Singh, O. and Singh, J.: Lightning fatalities over India: 1979–2011, Meteorol. Appl., 22, 770–778, https://doi.org/10.1002/met.1520, 2015.
Smith, E. T. and Sheridan, S. C.: The influence of extreme cold events on mortality in the United States, Sci. Total Environ., 647, 342–351, https://doi.org/10.1016/j.scitotenv.2018.07.466, 2019.
Stickley, A., Baburin, A., Jasilionis, D., Krumins, J., Martikainen, P., Kondo, N., Shin, J. I., Oh, H., Waldman, K., and Leinsalu, M.: Educational inequalities in hypothermia mortality in the Baltic countries and Finland in 2000–15, Eur. J. Publ. Health, 33, 555–560, https://doi.org/10.1093/eurpub/ckad062, 2023.
Theil, H.: A rank-invariant method of linear and polynomial regression analysis, in: Henri Theil's Contributions to Economics and Econometrics, Advanced Studies in Theoretical and Applied Econometrics 23, edited by: Raj, B. and Koerts, J., Springer, Dordrecht, 345–381, https://doi.org/10.1007/978-94-011-2546-8_20, 1992.
Tilev-Tanriover, Ş., Kahraman, A., Kadioğlu, M., and Schultz, D. M.: Lightning fatalities and injuries in Turkey, Nat. Hazards Earth Syst. Sci., 15, 1881–1888, https://doi.org/10.5194/nhess-15-1881-2015, 2015.
UNODRR – United Nations Office for Disaster Risk Reduction: Sendai Framework for Disaster Risk Reduction 2015–2030, https://www.undrr.org/publication/sendai-framework-disaster-risk-reduction-2015-2030 (last access: 10 December 2020), 2020.
Urban, A., Hanzlíková, H., Kyselý, J., and Plavcová, E.: Impacts of the 2015 heat waves on mortality in the Czech Republic – a comparison with previous heat waves, Int. J. Environ. Res. Publ. Health, 14, 1562, https://doi.org/10.3390/ijerph14121562, 2017.
Urban, A., Kyselý, J., Plavcová, E., Hanzlíková, H., and Štěpánek, P.: Temporal changes in years of life lost associated with heat waves in the Czech Republic, Sci. Total Environ., 716, 137093, https://doi.org/10.1016/j.scitotenv.2020.137093, 2020.
Urban, A., Fonseca-Rodríguez, O., Di Napoli, C., and Plavcová, E.: Temporal changes of heat-attributable mortality in Prague, Czech Republic, over 1982–2019, Urban Clim., 44, 101197, https://doi.org/10.1016/j.uclim.2022.101197, 2022.
van der Schrier, G., Allan, R. P., Ossó, A., Sousa, P. M., Van de Vyver, H., Van Schaeybroeck, B., Coscarelli, R., Pasqua, A. A., Petrucci, O., Curley, M., Mietus, M., Filipiak, J., Štěpánek, P., Zahradníček, P., Brázdil, R., Řezníčková, L., van den Besselaar, E. J. M., Trigo, R., and Aguilar, E.: The 1921 European drought: Impacts, reconstruction and drivers, Clim. Past, 17, 2201–2221, https://doi.org/10.5194/cp-17-2201-2021, 2021.
Vicedo-Cabrera, A. M., Scovronick, N., Sera, F., Royé, D., Schneider, R., Tobias, A., Astrom, C., Guo, Y., Honda, Y., Hondula, D. M., Abrutzky, R., Tong, S., Coelho, M. D. S. Z. S., Saldiva, P. H. N., Lavigne, E., Correa, P. M., Ortega, N. V., Kan, H., Osorio, S., Kyselý, J., Urban, A., Orru, H., Indermitte, E., Jaakkola, J. J. K., Ryti, N., Pascal, M., Schneider, A., Katsouyanni, K., Samoli, E., Mayvaneh, F., Entezari, A., Goodman, P., Zeka, A., Michelozzi, P., De'donato, F., Hashizume, M., Alahmad, B., Diaz, M. H., Valencia, C. D. L. C., Overcenco, A., Houthuijs, D., Ameling, C., Rao, S., Di Ruscio, F., Carrasco-Escobar, G., Seposo, X., Silva, S., Madureira, J., Holobaca, I. H., Fratianni, S., Acquaotta, F., Kim, H., Lee, W., Iniguez, C., Forsberg, B., Ragettli, M. S., Guo, Y. L. L., Chen, B. Y., Li, S., Armstrong, B., Aleman, A., Zanobetti, A., Schwartz, J., Dang, T. N., Dung, D. V., Gillett, N., Haines, A., Mengel, M., Huber, V., and Gasparrini, A.: The burden of heat-related mortality attributable to recent human-induced climate change, Nat. Clim. Change, 11, 492–500, https://doi.org/10.1038/s41558-021-01058-x, 2021.
Vinet, F., Boissier, L., and Saint-Martin, C.: Flashflood-related mortality in southern France: first results from a new database, in: 3rd European Conference on Flood Risk Management (FLOODrisk 2016), E3S Web Conf., 7, 06001, https://doi.org/10.1051/e3sconf/20160706001, 2016.
Vinet, F., Bigot, V., Petrucci, O., Papagiannaki, K., Llasat, M. C., Kotroni, V., Boissier, L., Aceto, L., Grimalt, M., Llasat-Botija, M., Pasqua, A. A., Rossello, J., Kılıç, Ö., Kahraman, A., and Tramblay, Y.: Mapping flood-related mortality in the Mediterranean basin. Results from the MEFF v2.0 DB, Water, 11, 2196, https://doi.org/10.3390/w11102196, 2019.
Wang, Y., Shi, L., Zanobetti, A., and Schwartz, J. D.: Estimating and projecting the effect of cold waves on mortality in 209 US cities, Environ. Int., 94, 141–149, https://doi.org/10.1016/j.envint.2016.05.008, 2016.
WMO: Atlas of Mortality and Economic Losses from Weather, Climate and Water Extremes (1970–2019), WMO-No. 1267, World Meteorological Organization, Geneva, Switzerland, 90 pp., ISBN 978-92-63-11267-5, 2021.
World Health Organization: International Statistical Classification of Diseases and Related Health Problems (ICD), https://www.who.int/standards/classifications/classification-of-diseases (last access: 2 November 2023), 2023.
Wright, N., Fagan, L., Lapitan, J. M., Kayano, R., Abrahams, J., Huda, Q., and Murray, V.: Health emergency and disaster risk management: Five years into implementation of the Sendai framework, Int. J. Disast. Risk Sci., 11, 206–217, https://doi.org/10.1007/s13753-020-00274-x, 2020.
Zahradníček, P., Brázdil, R., Štěpánek, P., and Trnka, M.: Reflections of global warming in trends of temperature characteristics in the Czech Republic, 1961–2019, Int. J. Climatol., 41, 1211–1229, https://doi.org/10.1002/joc.6791, 2021.
Zêzere, J., Pereira, S., Tavales, A., Bateira, C., Trigo, R., Quaresma, I., Santos, P., Santos, M., and Verde, J.: DISASTER: A GIS database on hydro-geomorphologic disasters in Portugal, Nat. Hazards, 72, 503–532, https://doi.org/10.1007/s11069-013-1018-y, 2014.
Zhang, W., Meng, Q., Ma, M., and Zhang, Y.: Lightning casualties and damages in China from 1997 to 2009, Nat. Hazards, 57, 465–476, https://doi.org/10.1007/s11069-010-9628-0, 2011.