the Creative Commons Attribution 4.0 License.
the Creative Commons Attribution 4.0 License.
 | 02 Feb 2023
Potential tsunami hazard of the southern Vanuatu subduction zone: tectonics, case study of the Matthew Island tsunami of 10 February 2021 and implication in regional hazard assessment
Bernard Pelletier
Aditya Gusman
William Power
Xiaoming Wang
David Burbidge
Maxime Duphil
The Vanuatu subduction zone (VSZ) is known to be seismically very active, due to the high convergence rate between the Australian and Pacific tectonic plates for the majority of the margin. However, this is not the case on its southernmost part south of latitude 22.5∘ S and east of longitude 170∘ E, which is neither highly tectonically active nor has it produced large tsunamis over the past 150 years. It has also not been widely studied. On the 11 February 2021 (10 February UTC), a magnitude Mw 7.7 earthquake triggered a tsunami warning in New Caledonia and Vanuatu 20 min after midnight (local time). With an epicentre located close to the volcanic islands of Matthew and Hunter, this shallow reverse-faulting rupture (< 30 km depth) was able to deform the seabed and produce a tsunami. This was confirmed 45 min later by the coastal gauges of the Loyalty and the south Vanuatu islands, which recorded the first tsunami waves. Showing a typical recorded amplitude of less than 1 m, with a maximum of ∼ 1.5 m in Lenakel (Tanna, Vanuatu), it was observed on most coastal gauges and DART stations in the south-west Pacific region as far as Tasmania to the south and Tuvalu to the north at distances of ∼ 3000 and ∼ 1800 km from the epicentre. In this study, the tsunamigenic potential of the southernmost part of the VSZ and the implications in terms of regional hazard assessment are discussed through (1) the presentation of the complex tectonic settings of this “transition zone” between the Solomon–Vanuatu and the Tonga–Kermadec trenches, (2) the case study of the 10 February 2021 tsunami at a south-west Pacific regional scale using three different tsunami generation scenarios computed with the COMCOT modelling code on a set of 48 nested bathymetric grids, and (3) the simulation of a plausible Mw 8.2 scenario encompassing the active part of this “transition zone”. The validation of the Mw 7.7 parameters for tsunami modelling provides the means to further assess the hazard from potential tsunamis triggered by higher magnitude earthquakes in this region. Tsunami records highlight that > 28 cm wave amplitudes were recorded at eight different coastal gauges, including one with an amplitude of more than 1 m (Lenakel, Tanna, Vanuatu). The tsunami threat at that location would be large enough to warrant an onshore evacuation. Finally, it helps to highlight the significant role played by the numerous submarine features in the region, the Norfolk Ridge being the most important, which acts like a waveguide from the north to the south.
- Article
(25984 KB) - Full-text XML
- BibTeX
- EndNote


1.1 Generalities
On 10 February 2021 at 13:19:55 UTC (11 February at 00:19:55 LT) a Mw 7.7 earthquake occurred at the southernmost part of the Vanuatu subduction zone (former New Hebrides subduction zone; called VSZ in the rest of this article), 420 km from Maré, Loyalty Islands, New Caledonia, and ∼ 80 km from the two small uninhabited volcanic islands of Matthew and Hunter, respectively located at 171.35∘ E and 22.34∘ S and 172.07∘ E and 22.4∘ S (Fig. 1). While this earthquake was only felt by a few people in New Caledonia and Vanuatu, because it occurred far away from the inhabited islands and during the night, it was quickly followed by a regional tsunami warning provided by the Pacific Tsunami Warning Centre (PTWC) and the New Zealand National Geohazards Monitoring Centre (NGMC). From 45 min after the shaking, a tsunami was recorded by the coastal gauges located along the coast of New Caledonia and Vanuatu, and later along the northern coast of New Zealand, Norfolk Island, the eastern coast of Australia, and most of the coastal gauges located in the south-west Pacific Ocean.
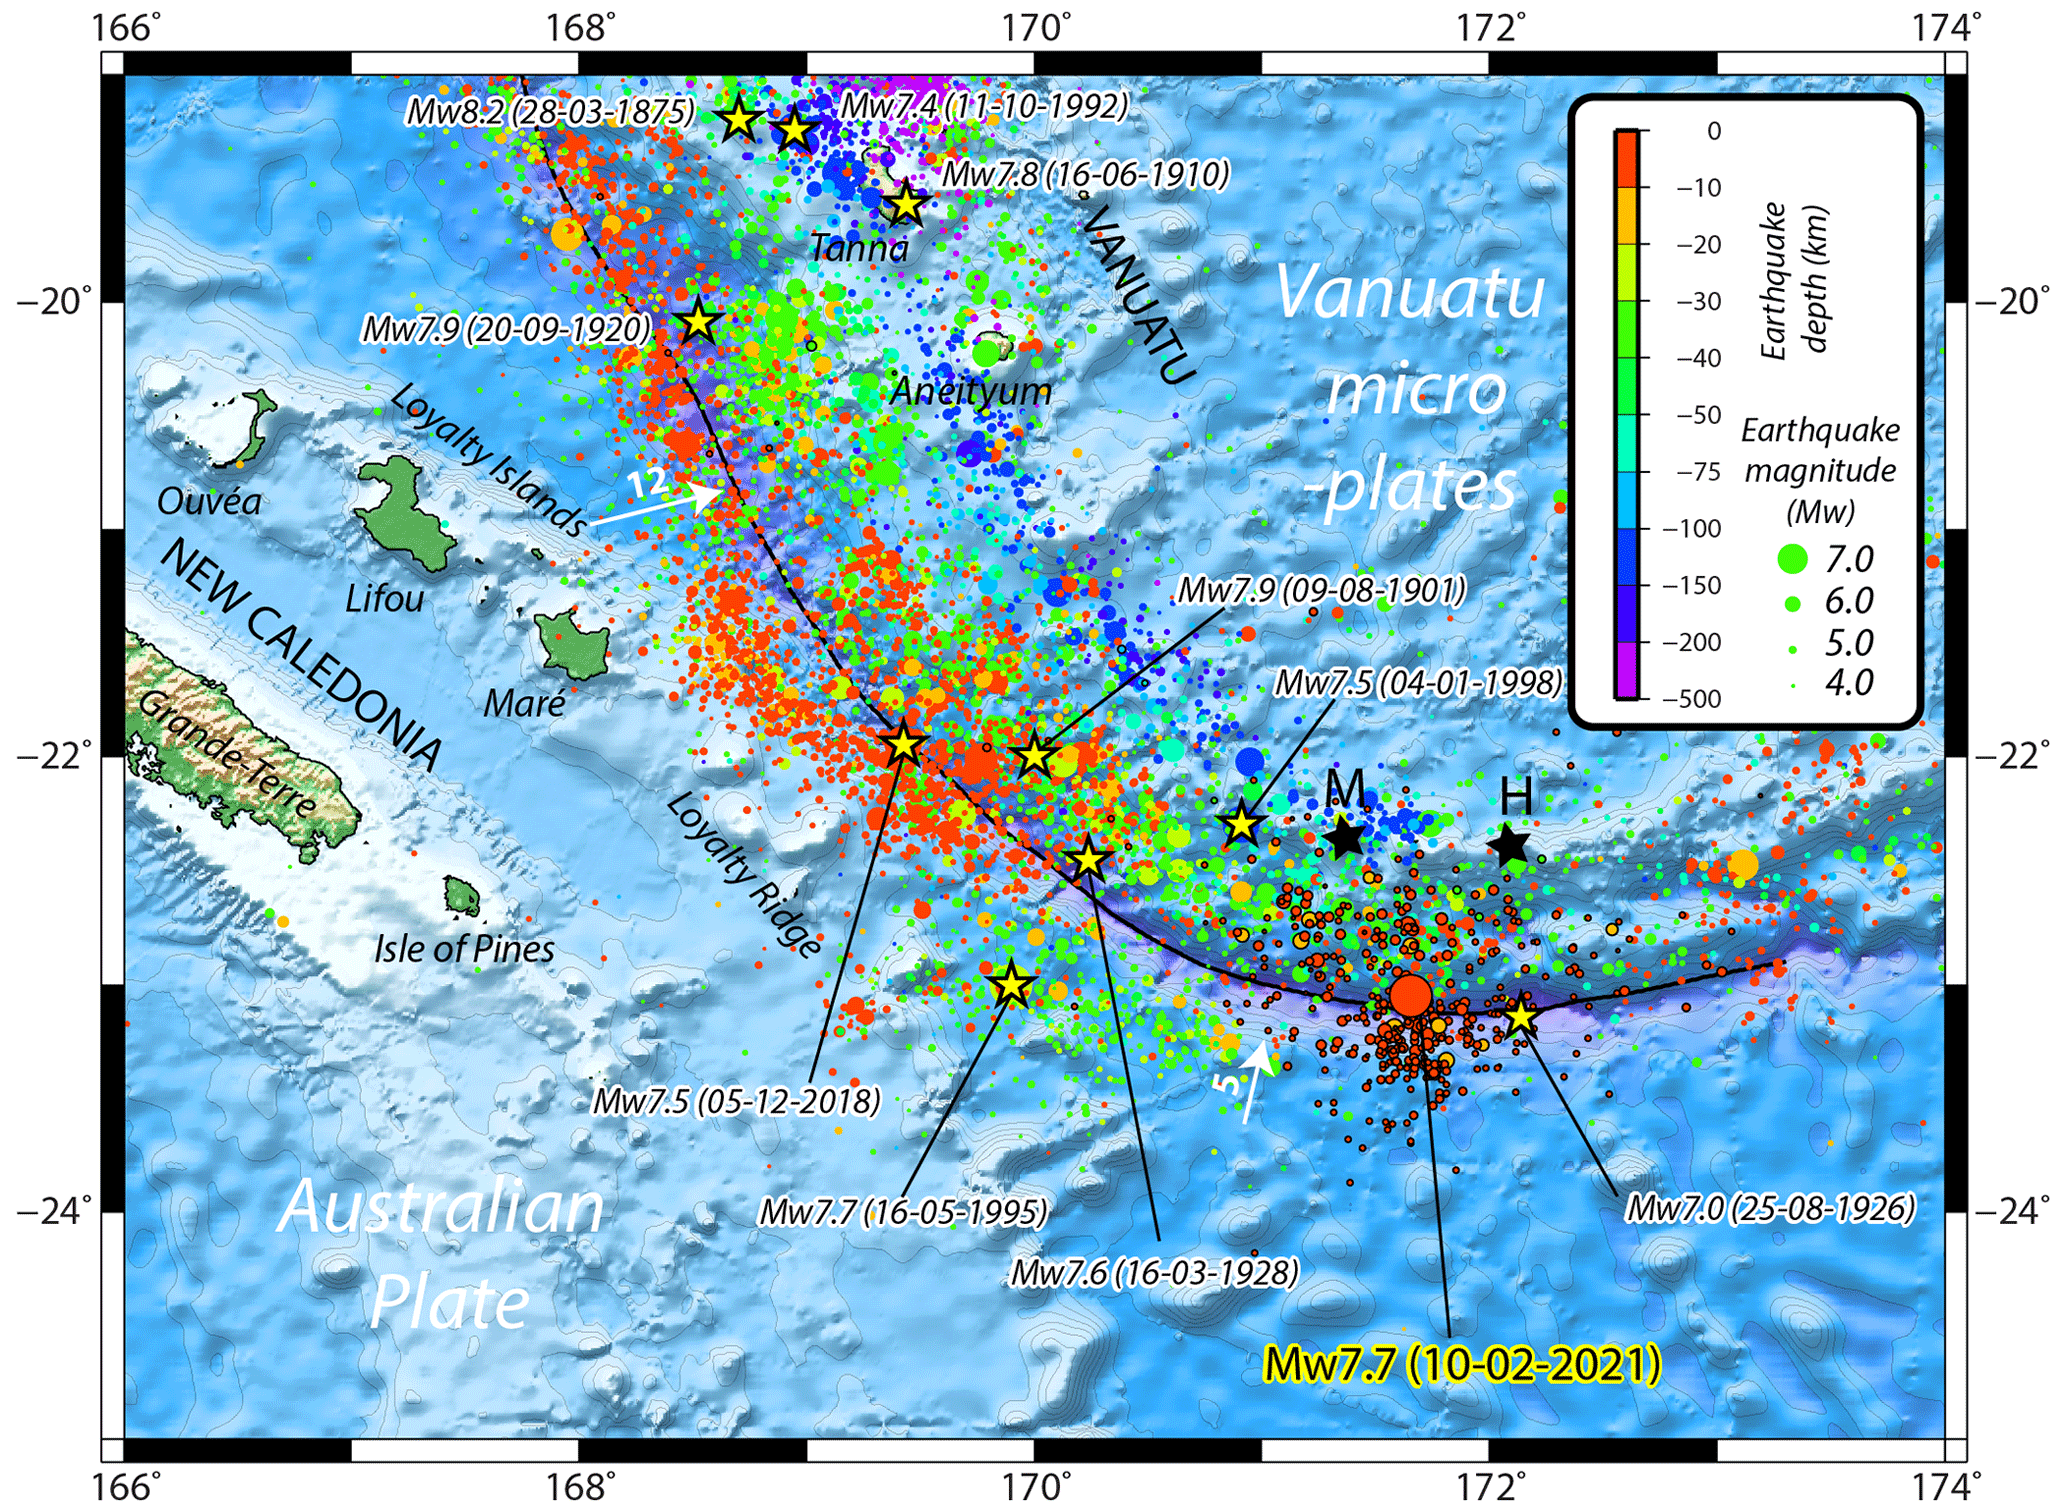
Figure 1Local seismotectonic context: location of the 10 February 2021 Mw 7.7 earthquake at the interface between the Australian plate and the Matthew–Hunter micro-plate (part of the Vanuatu micro-plates complex, southernmost Vanuatu arc). Earthquakes (Mw > 3.0) from USGS from 1 January 1970 to 31 March 2021 are shown by coloured circles, those with a black outline being recorded from the 10 February to 31 March. Convergence rates (in cm yr−1) are represented by the white arrows. Yellow stars locate strong historical earthquakes (Mw ≥ 7.4) and the 25 August 1926 Mw ≥ 7.0 easternmost earthquake. Note that not all tsunamigenic events are represented on this figure. The black line represents the subduction trench. The two black stars locate Matthew (M) and Hunter (H) islands. Topographic data is extracted from GEBCO2021 dataset (VLIZ/IOC, 2021).
1.2 Objectives of this study
From a hazard assessment perspective, this study aims to understand what happened in this relatively inactive part of the VSZ by (1) discussing the complex seismotectonic context; (2) using numerical simulations of the 10 February 2021 tsunami generation and propagation in the south-west Pacific Ocean: three tsunami generation scenarios were tested, going from a simple uniform slip model prepared with seismic data and empirical relationships between fault parameters, the USGS finite fault model provided for this earthquake, and a subsequent waveforms inversion of the signal recorded at New Zealand DART and coastal gauges; (3) proposing a plausible Mw 8.2 earthquake rupture scenario and simulating its propagation in the south-west Pacific region. Notice that all the dates and times are in UTC in the rest of the article.
The VSZ (10–23∘ S, 165–173∘ E), including from south to north the French, Matthew, and Hunter volcanic islets, Vanuatu and Eastern Solomon Islands, is among the world's fastest moving plate boundaries, with a convergence rate of up to 16–17 cm yr−1 in the northern part (around latitude −11∘; not shown in Fig. 1) between the Australian plate on the west and several Vanuatu micro-plates on the border of the Pacific plate to the east (Louat et Pelletier, 1989; Pelletier et al., 1998; Calmant et al., 2003). It has a history of producing numerous moderate to strong earthquakes (Louat and Baldassari, 1989; Cleveland et al., 2014; Ioualalen et al., 2017). The largest events recorded during the instrumental period (since 1900) have moment magnitudes of between Mw 7.8 to 8.0 and are located in both the northern (Mw 7.8 on 7 October 2009 and Mw 8.0 on 6 February 2013 events) and the southern parts (Mw 7.9 on 9 August 1901, Mw 7.9 on 20 September 1920 and Mw 7.9 on 2 December 1950 events) of the subduction zone. However, the maximum magnitude of earthquakes on the zone may be higher, the moment magnitude of the 28 March 1875 earthquake in the southern part having been estimated to Mw 8.1–8.2 (Ioualalen et al., 2017). Note that there are some questions raised about the 9 August 1901 earthquake location (−22, 170∘) and magnitude: it goes from Mw 7.9 to 8.4 according to Gutenberg (1956), Richter (1958), and Engdahl and Villasenor (2002), but it has not been reported in the highly detailed earthquake catalogue of New Caledonia from Louat and Baldassari (1989). By contrast, no large thrust events have been recorded in the central part (between 14 and 17∘ S), the maximum recorded magnitude being Mw 7.6 on 11 August 1965, and especially in the southernmost part of the subduction zone (south 22.5∘ S and east of 170∘ E), with a maximum magnitude of Mw 7.0 on 25 August 1926 (see Fig. 1 for earthquakes location).
Calmant et al. (2003) estimated the convergence rate on the subduction zone to the south of the Matthew–Hunter islands to be ∼ 45 mm yr−1. This value has been confirmed by Power et al. (2012), who obtained 46–48 mm yr−1 in their best fitting elastic block model requiring minimal interseismic coupling (less than about 0.2). However, the large uncertainties in GPS data meant that it was not possible to constrain the degree of coupling in this area with any accuracy (Power et al., 2012). If the coupling was indeed this low, it would suggest that the seismicity expected in this area would be much lower than expected for a zone with this rate of convergence.
The area of the southern part of the VSZ between the latitudes 21.5 and 22.5∘ S and the longitudes 169 and 170∘ E is very active seismically and has produced several seismic crises with earthquakes of magnitude Mw 7.0+ during recent decades (1980, 1995, 2003–2004, 2017, 2018). These events are felt by the population in New Caledonia and Vanuatu, as discussed by Roger et al. (2021). From a geological point of view, this region is characterized by the progressive subduction/collision of the NW–SE trending Loyalty Ridge located on the Australian plate under the southern Vanuatu micro-plates. This leads to strain accumulation that is regularly partially released through moderate to strong earthquakes during remarkable sequences (1980, 2003–2004, 2017, 2018), which include both interplate thrust faulting earthquakes and outer rise normal faulting earthquakes west and south-west of the trench, in which events of one mechanism appear to trigger events of the other (Roger et al., 2021).
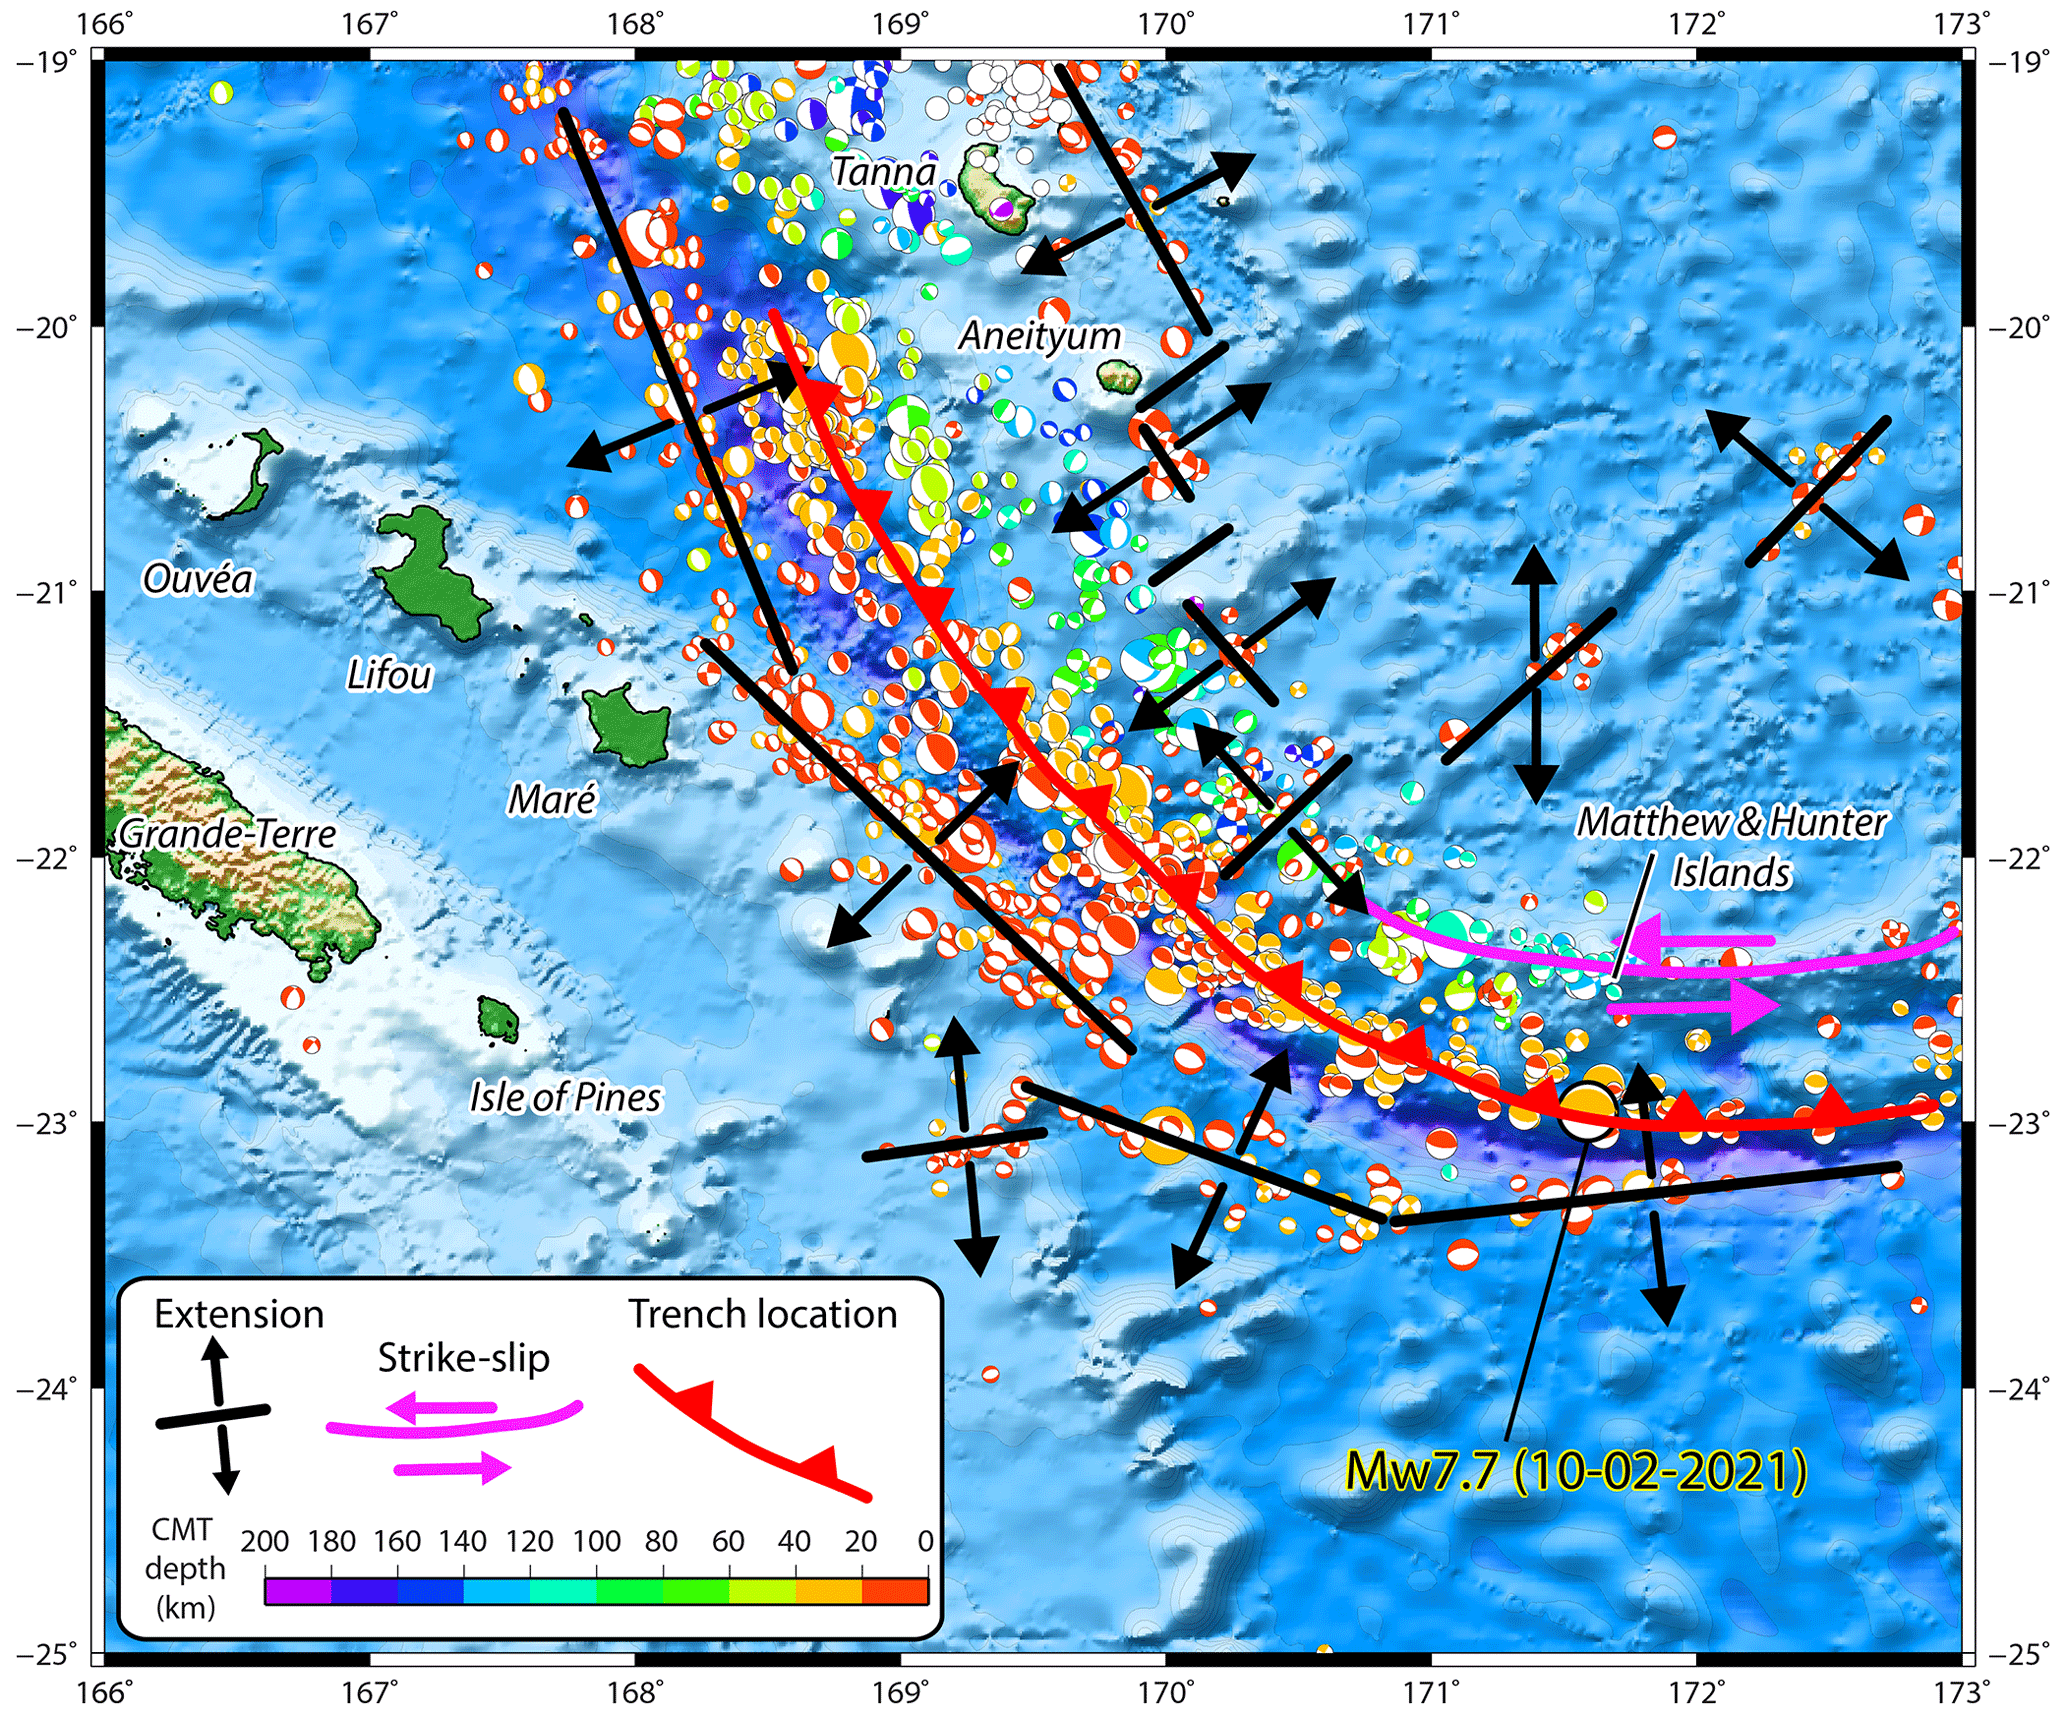
Figure 2Focal mechanisms from the Global Centroid Moment Tensor (GCMT) project in the southern part of the Vanuatu subduction zone and geodynamical interpretation.
The subduction/collision of the Loyalty Ridge is considered to have a large influence on the local tectonics, on both the overthrusting and the subducting plates (Louat et Pelletier, 1989; Pelletier et al., 1998; Calmant et al., 2003). North-west of the Loyalty Ridge and trench junction (southern part of the VSZ) the GPS-derived convergence is 12 cm yr−1 and is trending ENE–WSW, while south-east of the junction (22∘ S) the convergence is reduced (5 cm yr−1) and is almost N–S in front of Matthew–Hunter islands, implying a large (9 cm yr−1) left lateral motion and/or NW–SE extension in the upper plate along or at the rear of the Matthew–Hunter islands (Fig. 2) as also shown by numerous strike slip and NE–SW trending normal faulting events. The region is thus potentially able to trigger tsunamis with a main propagation axis striking from WSW–ENE (potential main energy path towards New Caledonia and south Vanuatu) to S–N (potential main energy path toward New Zealand and Vanuatu). Deformation of the subducting plate is well illustrated by the seismicity and the focal mechanism solutions of normal faulting earthquakes on the outer rise of the trench, which follow the bend of the trench (Fig. 2). From north to south these outer rise events are distributed along three lineations trending WNW–ESE, NW–SE, and almost W–E and located further and further from the trench, suggesting a twist of the plate. The largest normal faulting earthquake (Mw 7.7 on 16 May 1995) was located on this southern lineament which in detail includes three segments and strikes almost E–W toward the Isle of Pines in southern New Caledonia. Possibly the seismicity in the southern part of the Grande Terre and the south lagoon of New Caledonia (showing Mw 5.6 normal faulting and Mw 5.1 strike slip faulting earthquakes respectively on December 1990 and February 1991) may result from stress induced by the ongoing subduction of the Loyalty Ridge at the southern end of the VSZ.
From a tsunami generation point of view, whether the VSZ has the potential to trigger catastrophic tsunamis able to strongly impact coastal communities is not as well understood as it is for other subduction zones. According to recent catalogues of tsunamis in New Caledonia (Sahal et al., 2010; Roger et al., 2019a), only 16 of the 37 (17 of the 38 if including the 10 February 2021 tsunami) have been generated at the VSZ since 1875 and, amongst them, five show a maximum recorded/reported amplitude > 50 cm. The ratio is to be considered with caution: most of the small tsunamis have been recorded by coastal gauges (but not reported by witnesses) during the last decade, and thus the real number of tsunamis having reached New Caledonia, at least from the VSZ, is probably considerably bigger than 17. The latest earthquake-generated tsunami triggered by the VSZ occurred on 5 December 2018, following an Mw 7.5 normal faulting earthquake (Roger et al., 2019a, b, 2021): its amplitude reached more than 2 m in some locations in the south of New Caledonia and Vanuatu (note: at the time of the article submission, there are at least two new tsunamigenic earthquakes of magnitude Mw 6.9 and 7.0 having occurred on the VSZ on 30 and 31 March 2022).
3.1 The earthquake
The 10 February 2021 Mw 7.7 earthquake, located around 23∘ S, 171.6∘ E, 170 km east of the 1995 Mw 7.7 earthquake, hitherto known to be the strongest recorded earthquake in southernmost VSZ, is interesting in the sense that it occurred nearly at the south-easternmost part of the trench, with a magnitude much stronger than the usual low seismicity previously recorded in this region (Figs. 1 and 2). Indeed, the prior and closest main event in this area was the 25 August 1926 Mw 7.0 earthquake, located at 23.14∘ S, 172.14∘ E, about 60 km further east. Due to the epicentre being closer to Matthew Island than Hunter Island, the name “Matthew Island earthquake” was retained in the aftermath of the event.
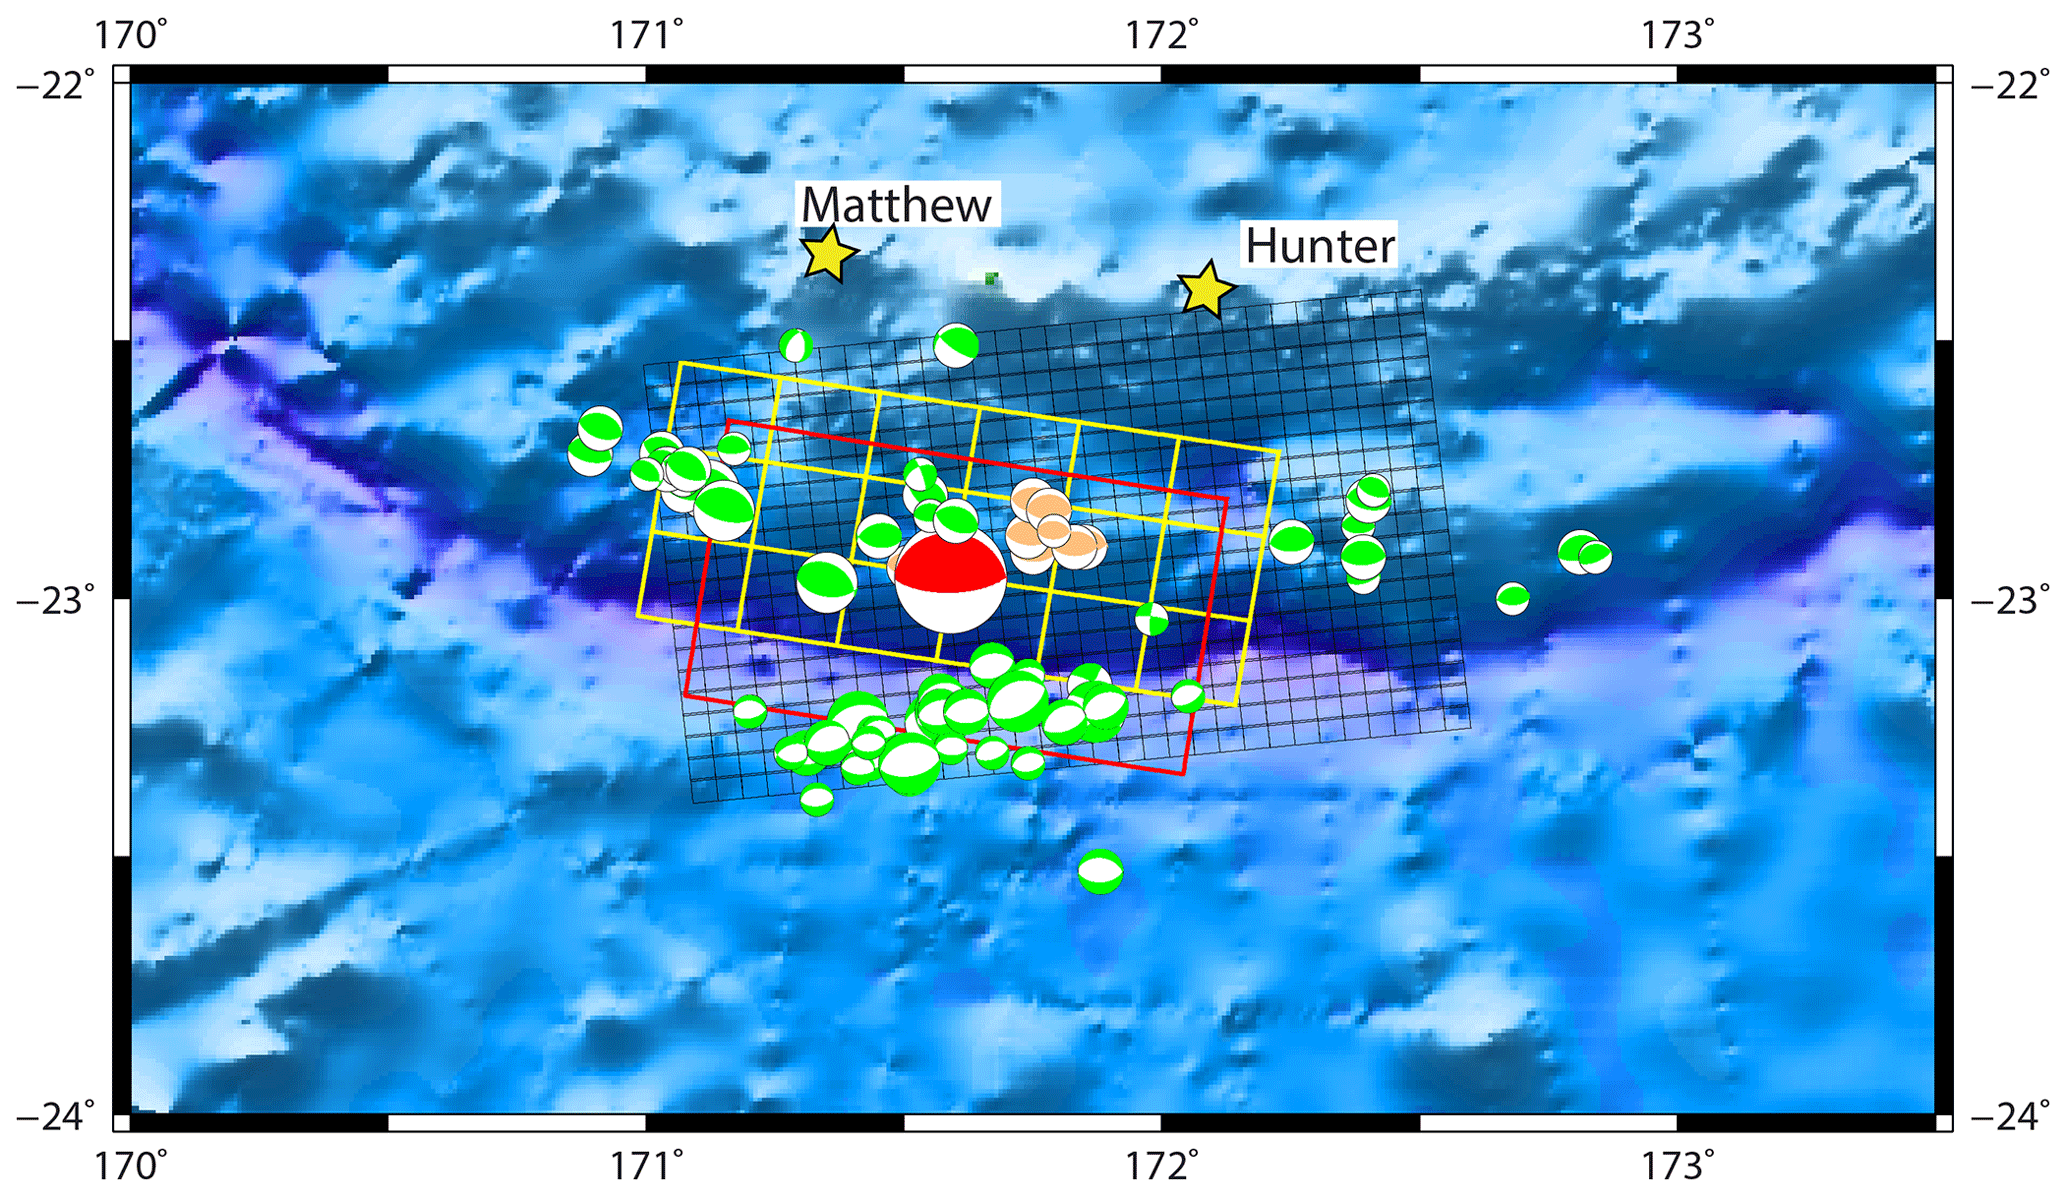
Figure 3Map of the centroid moment tensors (GCMT project; last accessed on 10 May 2022) calculated for the main earthquakes (Mw ≥ 5) occurring during the February 2021 seismic crisis (from 1 to 28 February) south of Matthew and Hunter islands (yellow stars). Red colour stands for the main shock, orange for the foreshocks, and green for the aftershocks. The extent and the number of subfaults of the three scenarios used in this study is represented by the black, yellow, and red rectangles standing respectively for the USGS finite fault model, the non-uniform model obtained from tsunami waveforms inversion, and the uniform slip model.
The Mw 7.7 main shock was preceded by 13 foreshocks with notably six events (Mw 5.1 to 5.8) in 1 h on 2–3 February and three events (Mw 5.8 to 6.1) within the hour before the mainshock. All the main foreshocks have similar focal mechanism solutions to the main shock, i.e. thrust faulting, as shown with the moment tensor solutions (GCMT project: Dziewonski et al., 1981; Ekström et al., 2012) in Fig. 3. Almost 100 aftershocks of magnitude Mw 5+ have occurred after the main shock.
According to the focal mechanism solutions provided by USGS (https://earthquake.usgs.gov/earthquakes/eventpage/us6000dg77/moment-tensor, last access: 24 January 2023), GCMT (https://www.globalcmt.org, last access: 24 January 2023), GEOSCOPE-IPGP-Scardec (http://geoscope.ipgp.fr, last access: 24 January 2023), French Polynesia tsunami warning center (cppt@labogeo.pf), and GFZ Geofon (http://geofon.gfz-potsdam.de/eqinfo, last access: 24 January 2023), this earthquake exhibits a nearly pure compression mechanism (reverse-faulting event with a small strike-slip component) and likely occurred at the subduction interface on a shallow (depth ranges from 12 to 29 km depending of the agencies: 25.5 km (USGS) and 21.8 km (GCMT)) fault striking parallel to the trench (strike ranges from 246 to 281∘ (USGS and GCMT strike of 246 and 279∘ respectively) as shown in Fig. 3, and dipping to the north (dip ranges from 11 to 27∘: 17∘ (USGS) and 23∘ (GCMT)).
3.2 Fault slip models
Within the framework of the present study, three different rupture scenarios have been used to simulate the initial seafloor displacement: (1) a uniform slip model, (2) a non-uniform slip model obtained with inversion of tsunami waveforms, (3) a non-uniform slip model obtained with inversion of seismic and GPS data. An additional uniform slip scenario is proposed for further consideration of tsunami hazard from this region of the VSZ. (Note that the authors are aware of the recent publication of Ye et al. (2021) in December 2021 proposing another finite-fault slip model from inversion of teleseismic body waves).
3.2.1 Uniform slip model (scenario #1)
GCMT, Geoscope, and the USGS calculated the seismic moment associated to the earthquake of respectively M0 = 4.01 × 10²⁰ N m, M0 = 4.25 × 10²⁰ N m, and M0 = 4.364 × 10²⁰ N m. This corresponds to a magnitude Mw = 7.67 to 7.69 according to (Hanks and Kanamori, 1979), where M0 is in dyne.cm. Geoscience Australia estimated the moment magnitude to be slightly lower (Mw = 7.61).
Table 1Parameters used for the initial deformation calculation associated to uniform slip ruptures corresponding to Mw 7.7 and Mw 8.2 earthquakes.
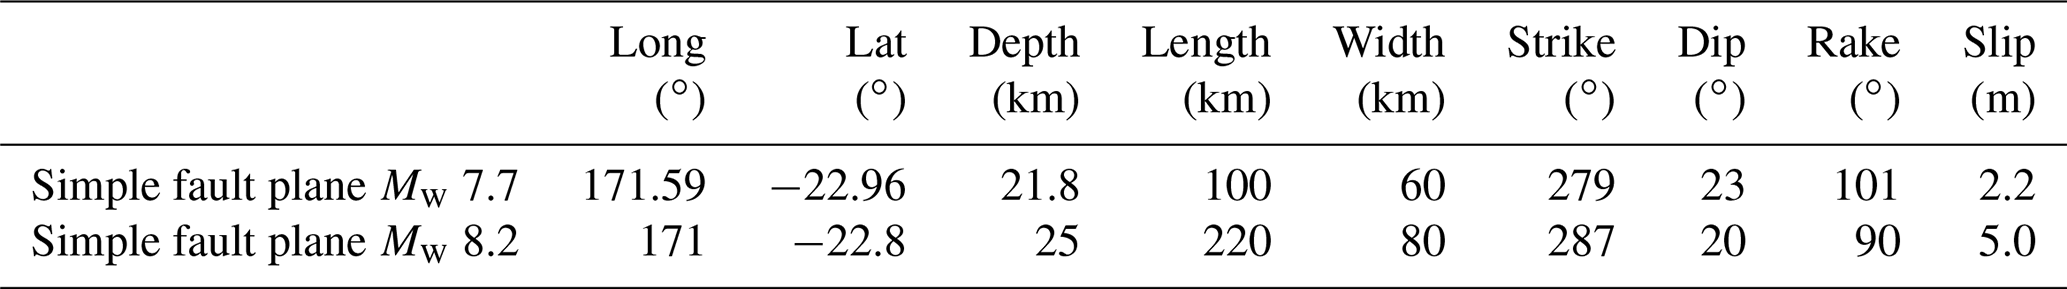
In this study, a uniform slip scenario has been built based on the GCMT solution (https://www.globalcmt.org, last access: 24 January 2023), which is generally more accurate than other solutions in terms of epicentre location and fault azimuth correlated with existing features for earthquakes located at the VSZ and nearby. For this purpose, it is assumed that the rigidity coefficient is dyn. cm−2, corresponding to a depth of 22 km (Bilek and Lay, 1999). According to the empirical relationships of Blaser et al. (2010) and Strasser et al. (2010), the length L and width W of the fault plane have been respectively calculated to 100 and 60 km. To match with the GCMT seismic moment, this corresponds to an average coseismic displacement on the fault plane S = ∼ 2.2 m. The parameters determined for the uniform slip modelling are summarized in Table 1.
3.2.2 Non-uniform slip model (scenario #2)
The observed tsunami waveforms recorded at four DART and 24 coastal stations were used in a tsunami waveforms inversion to estimate the fault slip distribution of the 2021 Loyalty Island earthquake (Gusman et al., 2022). The geometry for the fault model was based on the GCMT solution. The estimated slip distribution has a major slip region with maximum slip amount of 4.1 m located near the trench, this estimated large slip near the trench being consistent with the fault slip model estimated by the USGS (see Sect. 3.2.3). The estimated maximum uplift near the trench is 2.1 m, while the subsidence is 0.24 m. The previous study by Gusman et al. (2022) used an assumed rigidity of 4 × 10¹⁰ N m−2 to get a seismic moment of 3.39 × 10²⁰ N m (Mw 7.65) from the estimated slip distribution. However, if we assume the rigidity to be of 3 × 10¹⁰ N m−2, the calculated seismic moment of the fault slip model would be 2.54 × 10²⁰ N m (Mw 7.57), which is ∼ 1.6 times smaller than those calculated by GCMT and USGS.
3.2.3 USGS finite fault model (scenario #3)
In the aftermath of the main shock, the USGS released a kinematic finite fault model of the rupture (https://earthquake.usgs.gov/earthquakes/eventpage/us6000dg77/finite-fault, last access: 24 January 2023) calculated from inversion of seismic and GPS data with an approach based on Ji et al. (2002)'s methodology.
The resulting model is composed of 620 5 km-by-5 km sub-segments. Each segment has its own depth, slip, rake, and rupture time values. The file used in this study is available here: https://earthquake.usgs.gov/product/finite-fault/us6000dg77_1/us/1613004810949/basic_inversion.param (last access: 24 January 2023).
3.2.4 Plausible Mw 8.2 uniform slip model (scenario #4)
This scenario is based on the fact that the southernmost part of the VSZ (east of 170∘ E) has not experienced any strong earthquakes for at least 100 years, exhibiting a shortening of at least 5 m and corresponding to a convergence rate of 5 cm yr−1, enabling it to easily produce a magnitude Mw 8.0–8.2 earthquake according to the length of active plate boundary available here (∼ 250–300 km). This magnitude corresponds to the maximum magnitude (Mw 8.1–8.2) proposed by Ioualalen et al. (2017) for the 1875 South Vanuatu earthquake and to the maximum value found in the USGS earthquake catalogue for the VSZ (Mw 8.1 on 21 September 1920).
The empirical relationships (Blaser et al., 2010; Strasser et al., 2010) used for scenario #1 have been applied to set up the corresponding parameters of a Mw 8.2 rupture: pure thrust mechanism (rake = 90∘) with 5 m displacement on the fault plane, length, width, and depth of the fault plane of respectively 220, 80, and 25 km, an azimuth of 287∘, and a dip of 20∘. The epicentre of the rupture is chosen at 171∘ E, 22.8∘ S. The parameters are summarized in Table 1. Note that this scenario does not consider a possible rupture of the VSZ toward the north, between the Loyalty Islands and Vanuatu, which would potentially lead to a larger magnitude earthquake. Also, due to the bending of the VSZ, this scenario represents only one of many possibilities for rupture energy directivity by using a mean strike value on a pure thrust rupture, with the intention being to provide a basis for discussion of what could happen with a stronger magnitude than the one of the February 2021 earthquake: depending on the strike, the rake, and the epicentre location, the main energy paths could probably completely change the directivity pattern of the tsunami. A more accurate study would consider incorporating the shape of the subduction interface as proposed with the SLAB 2.0 model (Hayes, 2018) using for example a triangular mesh of the source, with variations of the strike, rake, and eventually, different slip distributions and a rupture time pattern.
3.3 The tsunami
The tsunami triggered by the 10 February 2021 earthquake can be classified as a region-wide event as it was recorded at least on 31 coastal gauges and four DART stations in the south-west Pacific, firstly on those of New Caledonia and Vanuatu, but also in Fiji, New Zealand (∼ 1200 km), Australia (∼ 1800 km), and as far as Tasmania (∼ 3000 km) in the south and Western Samoa (∼ 2000 km) in the east. For the purpose of this study the records of those gauges have been downloaded from the LINZ website for the New Zealand coastal gauges network (https://www.linz.govt.nz/sea/tides/sea-level-data/sea-level-data-downloads, last access: 24 January 2023) and from the IOC website (VLIZ/IOC, 2021) for other regional gauges. The New Zealand DART data are now publicly available on https://www.geonet.org.nz/tsunami/dart (last access: 31 May 2022). They are shown in Fig. 4 in a chronologic order, and they represent the sea level fluctuation with a sample rate of 1 min (coastal gauges) and 15 s (DART stations). Figure 4 also shows the arrival of the tsunami at different stages of the tide from one station to another one. Figure 5 shows the locations of the coastal gauges and New Zealand DART stations that recorded the tsunami. The tsunami arrival times and amplitudes at each coastal gauge and DART station are summarized in Table 2. They have been obtained through de-tiding and filtering of the data using the following methodology: on one hand, a polynomial (up to 20th-order) was fitted to and subtracted from the recorded data in order to remove the long-period tide components of the signals, and on the other hand, a low-pass Butterworth filter was used to remove the high frequencies related to parasitic waves generated for example by storms or large vessels; the analysis of the pre-event background noise recorded at several stations helps to constrain the cut-off frequency to 5 min. The amplitude of the waves was measured between 0 and the wave crest.
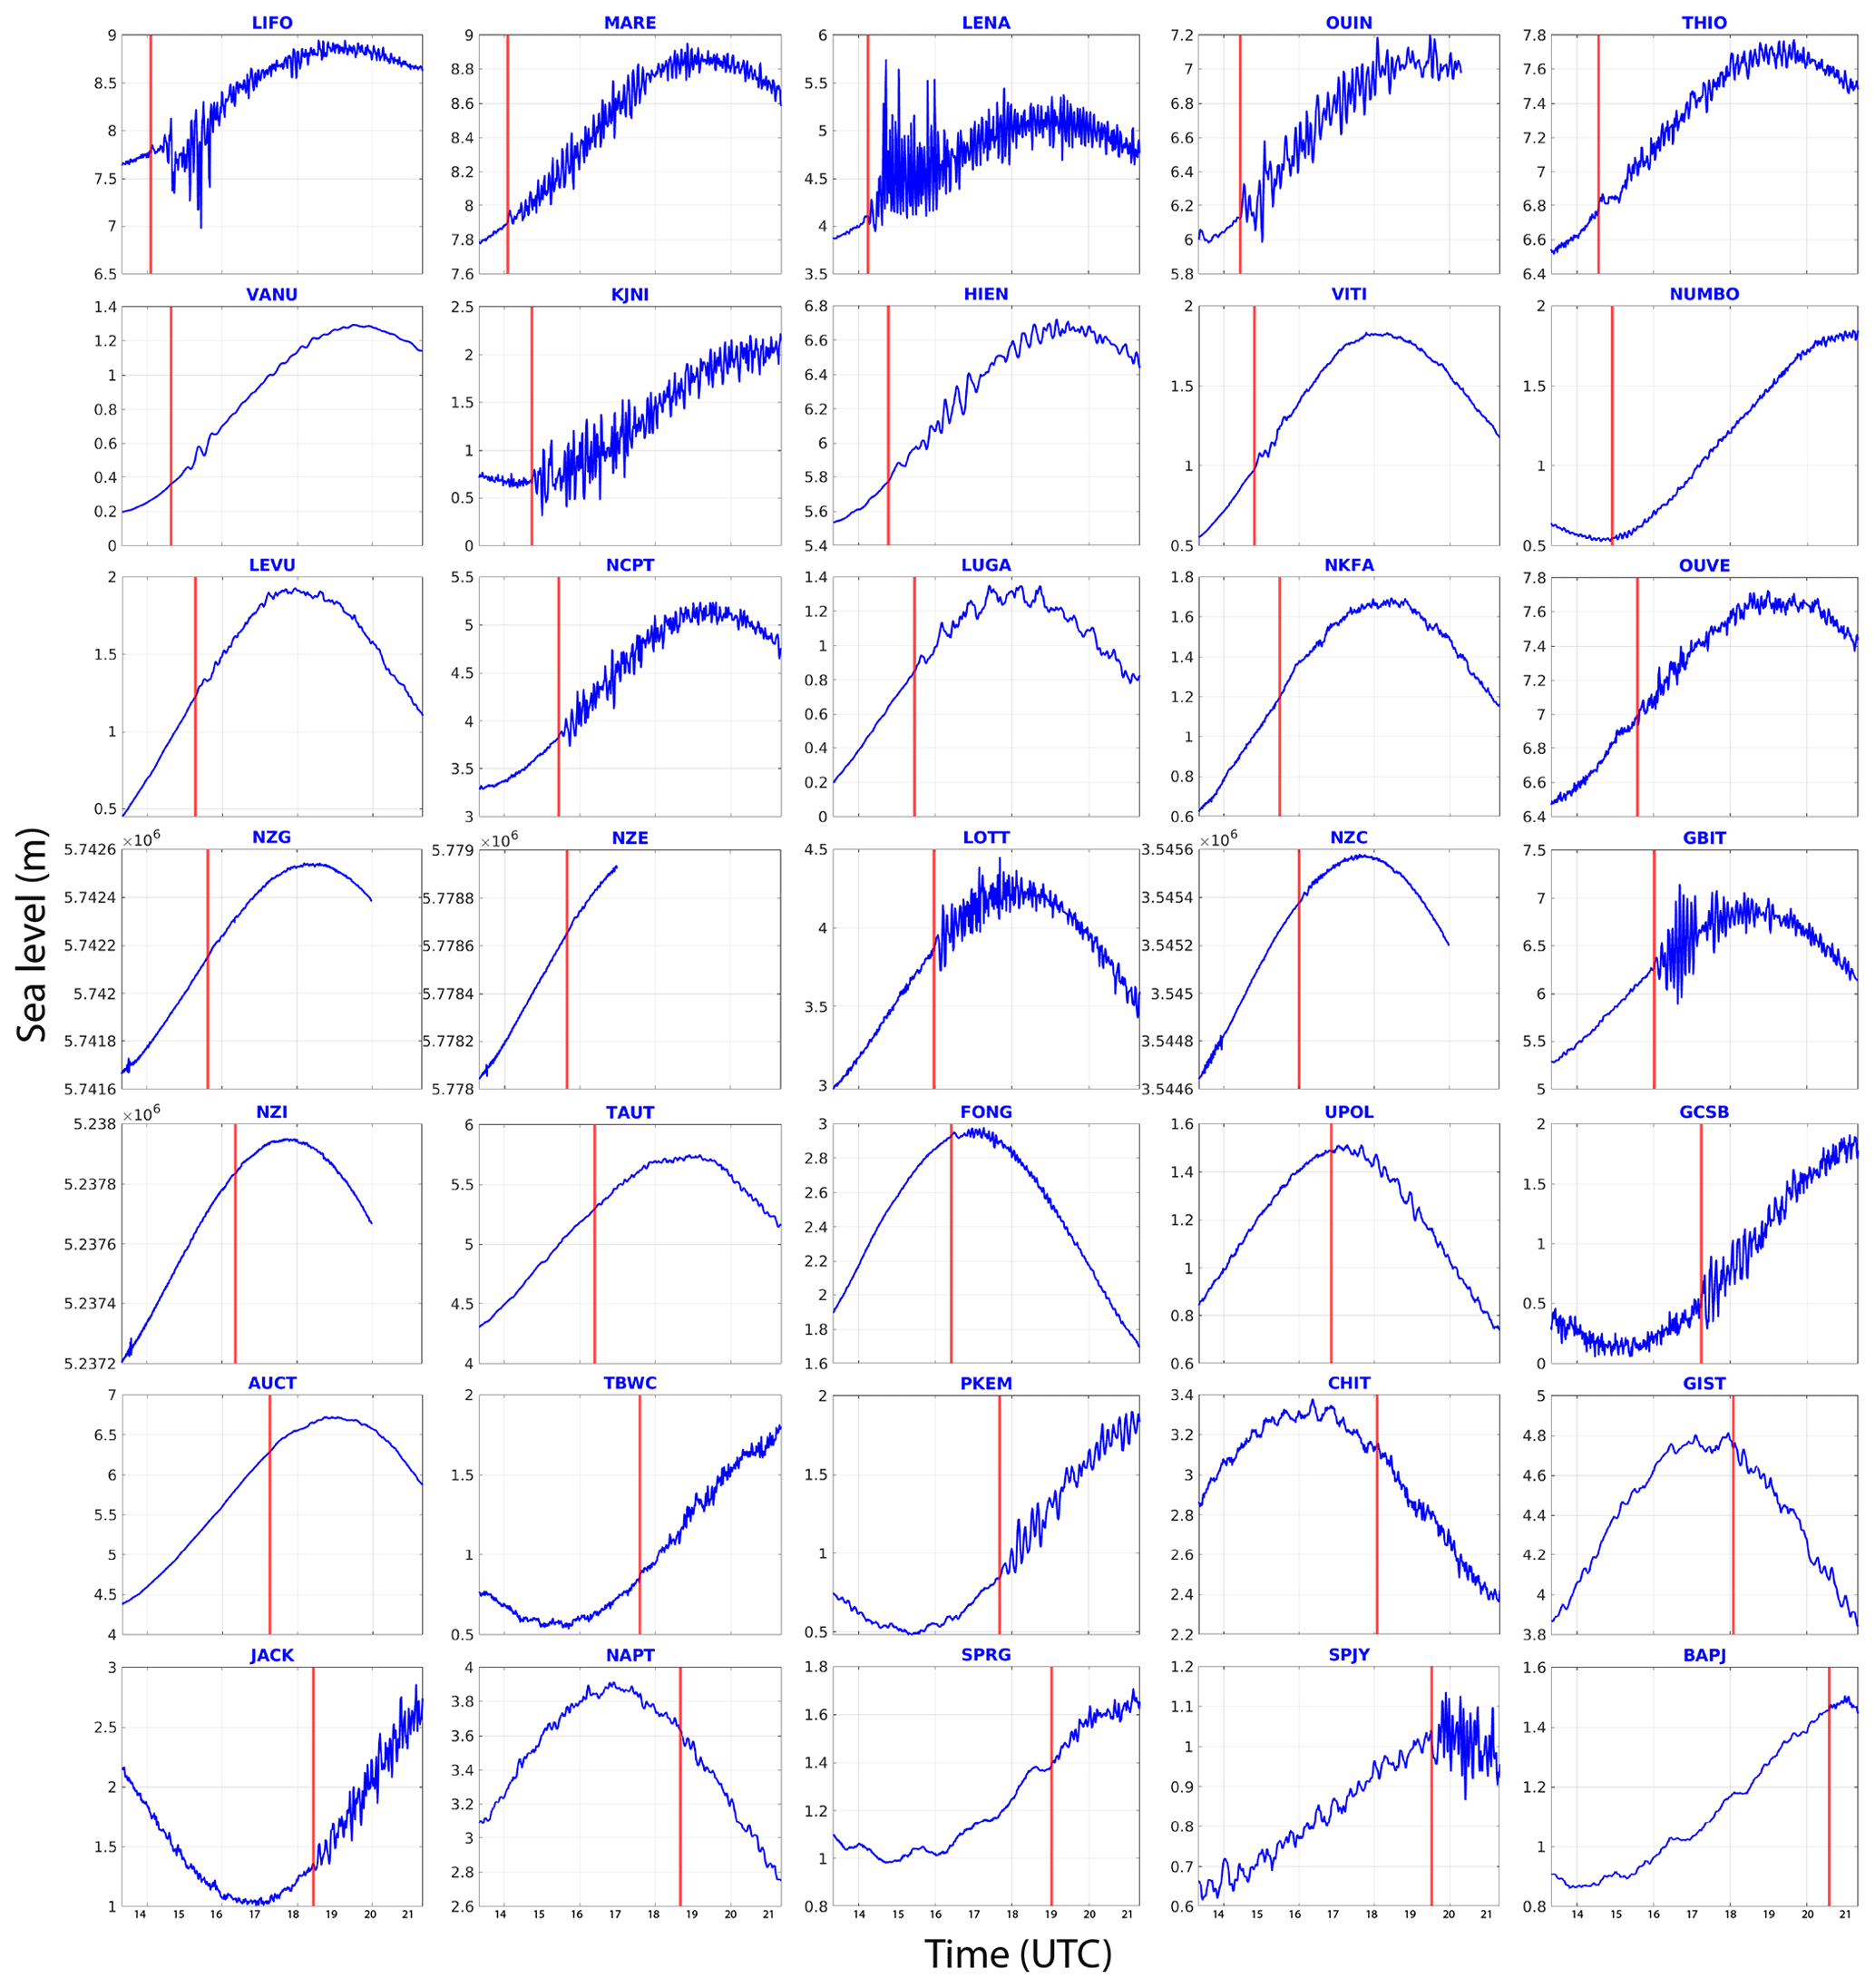
Figure 4Thirty-five coastal gauge and New Zealand DART station records of the 10 February 2021 tsunami in the south-west Pacific Ocean. Each record begins at the time of the earthquake and goes on for 9 h. The vertical red line represents the tsunami arrival time (reported in Table 2). For the four DART records, only the high-resolution signal (15 s sampling rate) transmitted in real time by the bottom pressure recorder (BPR) to the monitoring centre is plotted.
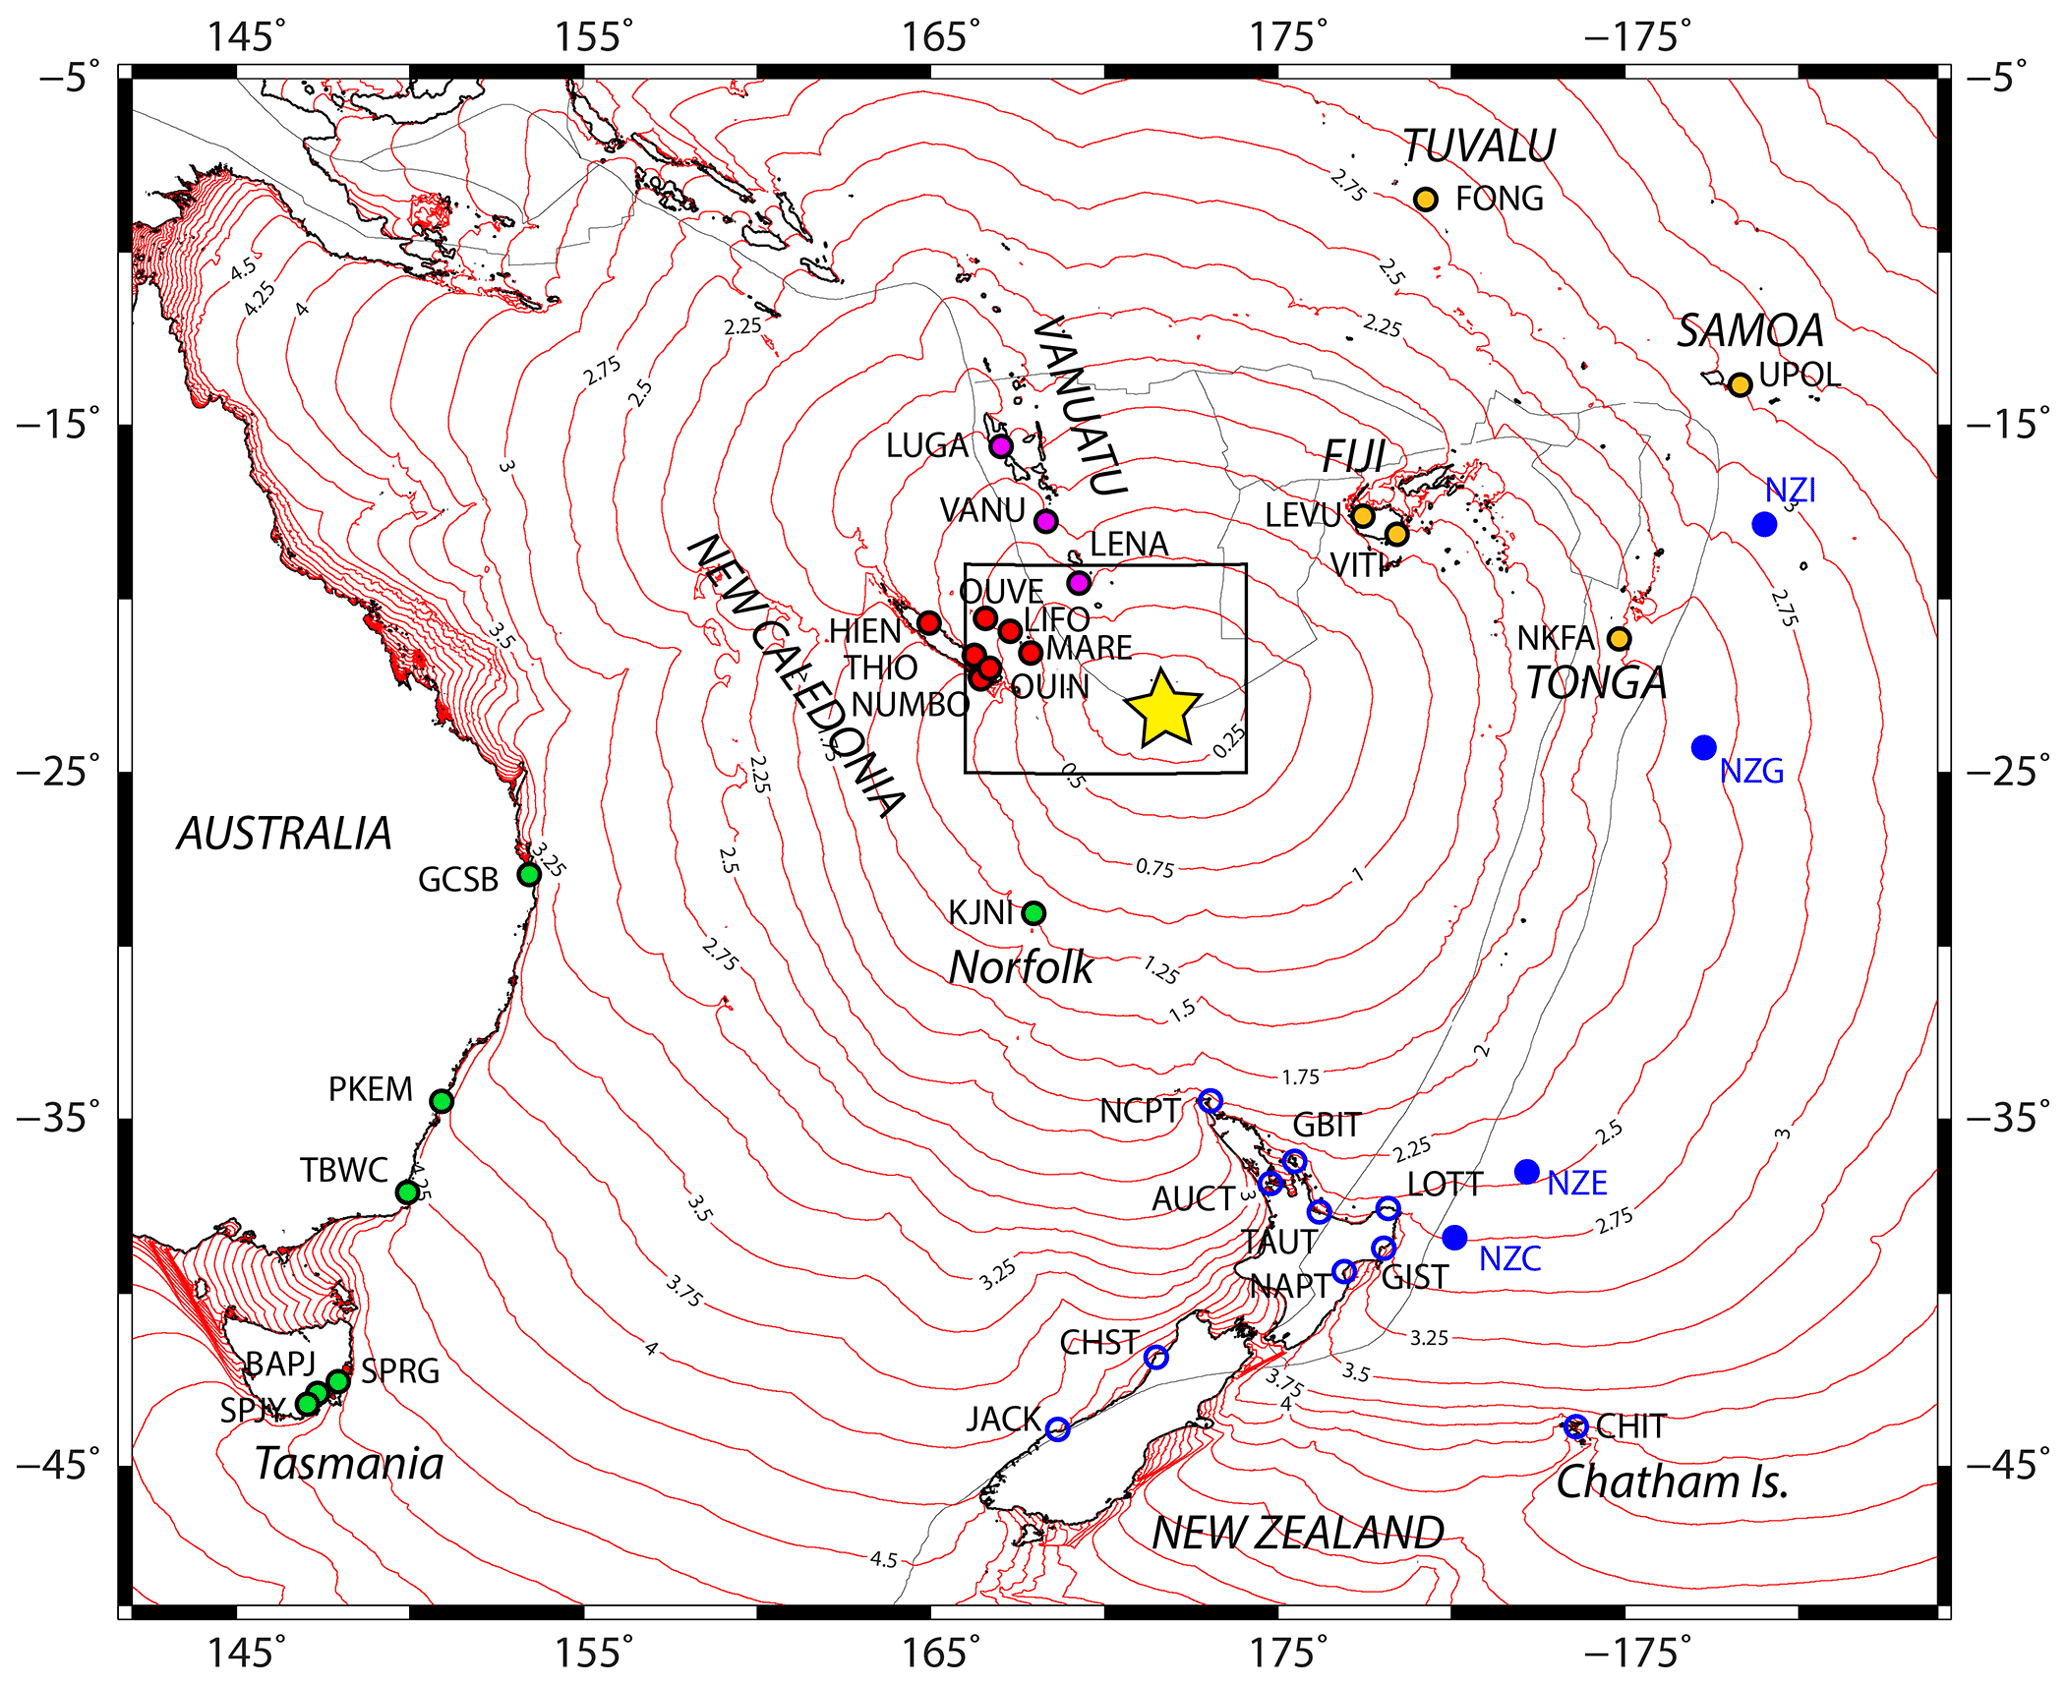
Figure 5Location of the coastal gauges having recorded the 10 February 2021 tsunami and computed tsunami travel times (TTT) at a regional scale (in hours). Coloured circles show the location of the stations (blue: New Zealand – blue contour: coastal stations; full blue: DART stations; green: Australia; red: New Caledonia; purple: Vanuatu; orange: other countries) which recorded the tsunami; red lines represent the TTT isolines with a time step of 15 min calculated using MIRONE software (Luis, 2007). The yellow star locates the earthquake's epicentre; light grey lines represent the tectonic plate boundaries (provided by GMT software; Wessel et al., 2019). The black rectangle locates the extent of Fig. 1.
Table 2Arrival times and amplitudes of the 10 February 2021 tsunami on DART stations and coastal gauges. They are classified from the first station (top row) recording the tsunami to the last one (bottom row). Coloured cells locate the stations which recorded wave amplitude of nearly 30 cm (italic), more than 30 cm (bold-italic), and more than 1 m (bold).
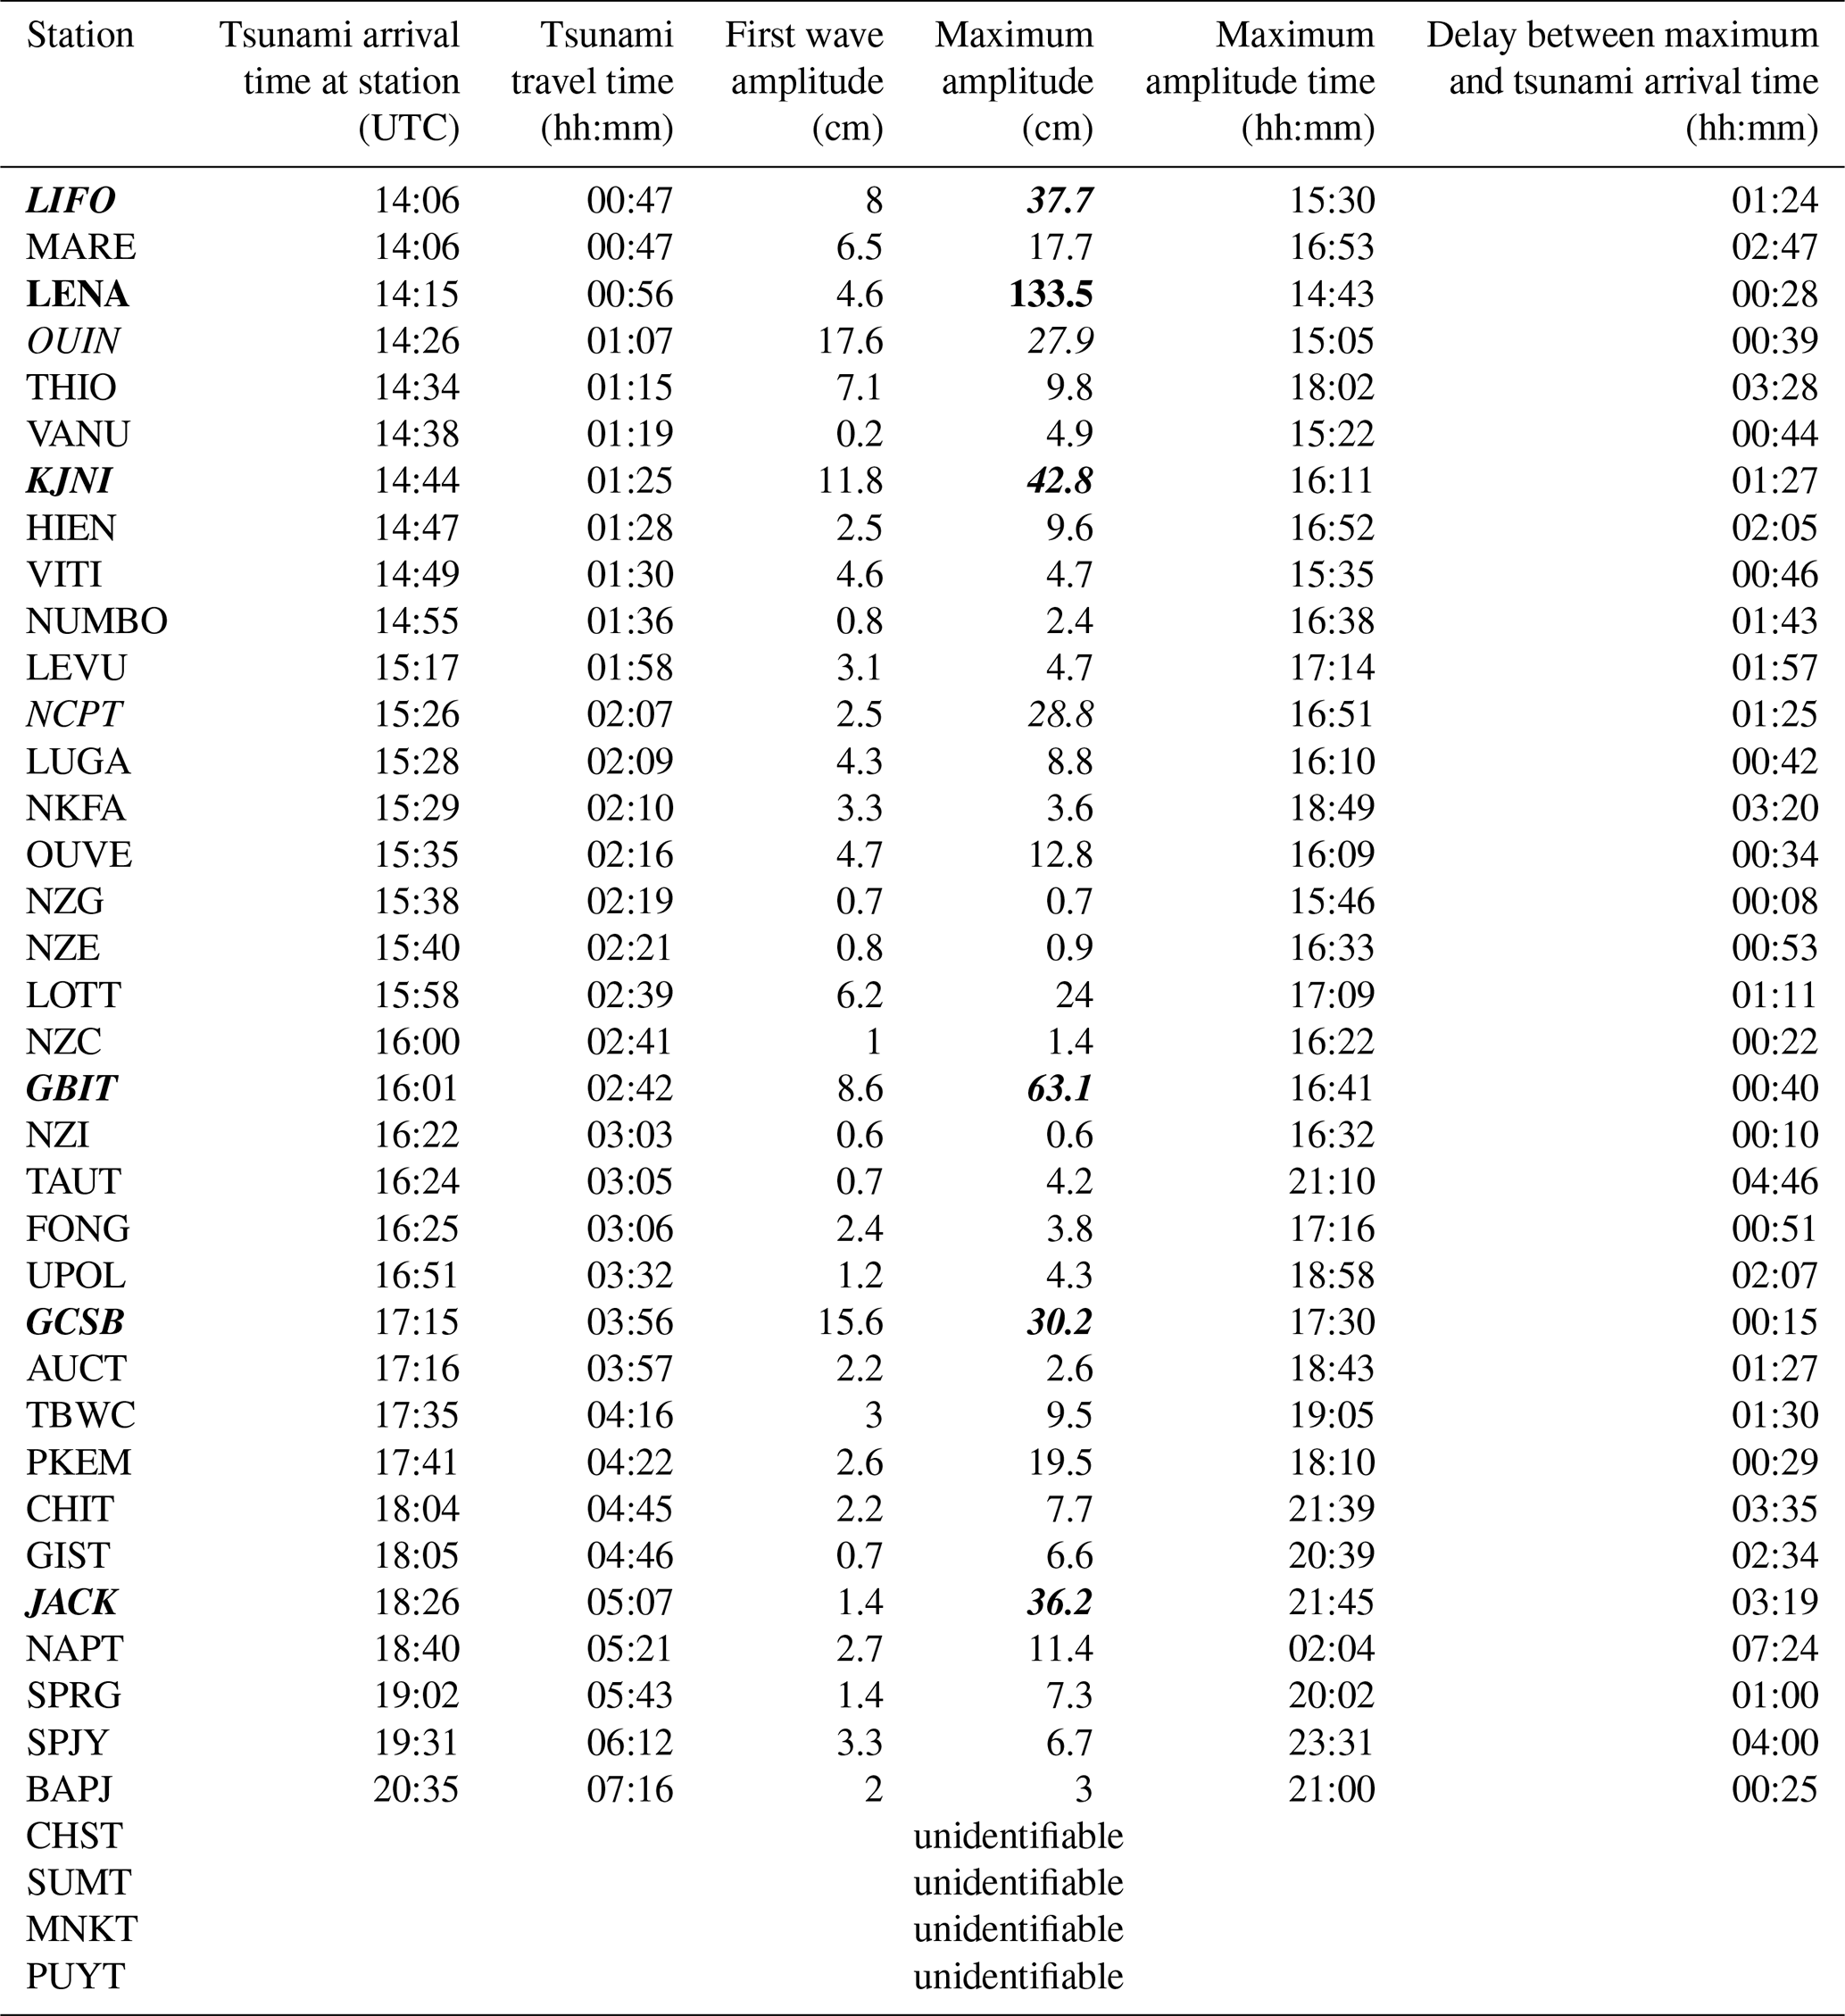
In good agreement with the tsunami travel times (TTT) computed with Mirone software (Luis, 2007) on a 30 s GEBCO grid also shown in Fig. 5, it was first recorded on MARE (Tadine, Maré, Loyalty Islands, New Caledonia)'s coastal gauge and LIFO (Wé, Lifou, Loyalty Islands, New Caledonia) at 14:06 UTC, 46 min after the earthquake, shortly followed by LENA (Lenakel, Tanna, Vanuatu) at 14:16 UTC. Meanwhile, the tsunami propagated towards the south/south-west and reached KJNI (Norfolk Island, Australia)'s coastal gauge at 14:44 UTC, NCPT (Cape North, New Zealand)'s tsunami gauge at 15:26 UTC and finally SPJY (Southport) and BAPJ (Battery Point) in Tasmania, Australia's southernmost coastal gauges, at 19:31 and 20:35 UTC respectively 6 h and 12 min and 7 h and 16 min after the earthquake. Also, it was recorded to the east on VITI and LEVU (Suva and Lautoka, Viti Levu, Fiji)'s coastal gauges at ∼ 14:49 and ∼ 15:17 UTC respectively, UPOL (Apia, Upolu Island, Western Samoa) at ∼ 16:51 UTC, NKFA (Nuku'alofa, Tonga) at ∼ 16:29 UTC and in the north at FONG (Fongafale, Tuvalu) at ∼ 16:25 UTC. Its typical maximum amplitude of less than 1 m classifies it in the small tsunami category, but nevertheless it exhibited two records of ∼ 30 cm, five records between 30 cm, and 1 m, and a stronger maximum amplitude of ∼ 1.3 m recorded on LENA (Lenakel, Tanna, Vanuatu). In addition to LENA, LIFO, and GBIT are particularly interesting: they present sea level disturbances which are certainly linked to the interaction of the tsunami waves with the semi-enclosed water body in which the coastal gauge is located. LIFO and LENA are located within small harbours, and GBIT is located within a bay. The period of the incoming waves can be equal or close to the harbour/bay eigenperiod and these could result in strong oscillations which represent a resonance behaviour. LENA is particularly inclined to such phenomena and a dedicated study would provide keys to the understanding of Lenakel Bay's reaction to long waves. Higher amplitudes can be expected in nearby exposed areas showing particular geometries like V-shape bays, harbours and river mouths, or specific submarine features like submarine canyons and seamounts able to trigger amplification and/or resonance effects of the incoming waves as was highlighted in the 5 December 2018 tsunami (Roger et al., 2021). At the regional scale, the tsunami amplitude is higher close to the source region (New Caledonia, Vanuatu) and in the south-western quadrant (New Zealand, Australia). It is worth noting that the delay between the first wave arrival and maximum amplitude reached by the tsunami has a median value of 1 h and 24 min, with a minimum delay of 8 min (the maximum amplitude recorded on DART NZG corresponds to the first wave recorded on this DART) and a maximum delay of 7 h and 24 min (NAPT, Napier, New Zealand).
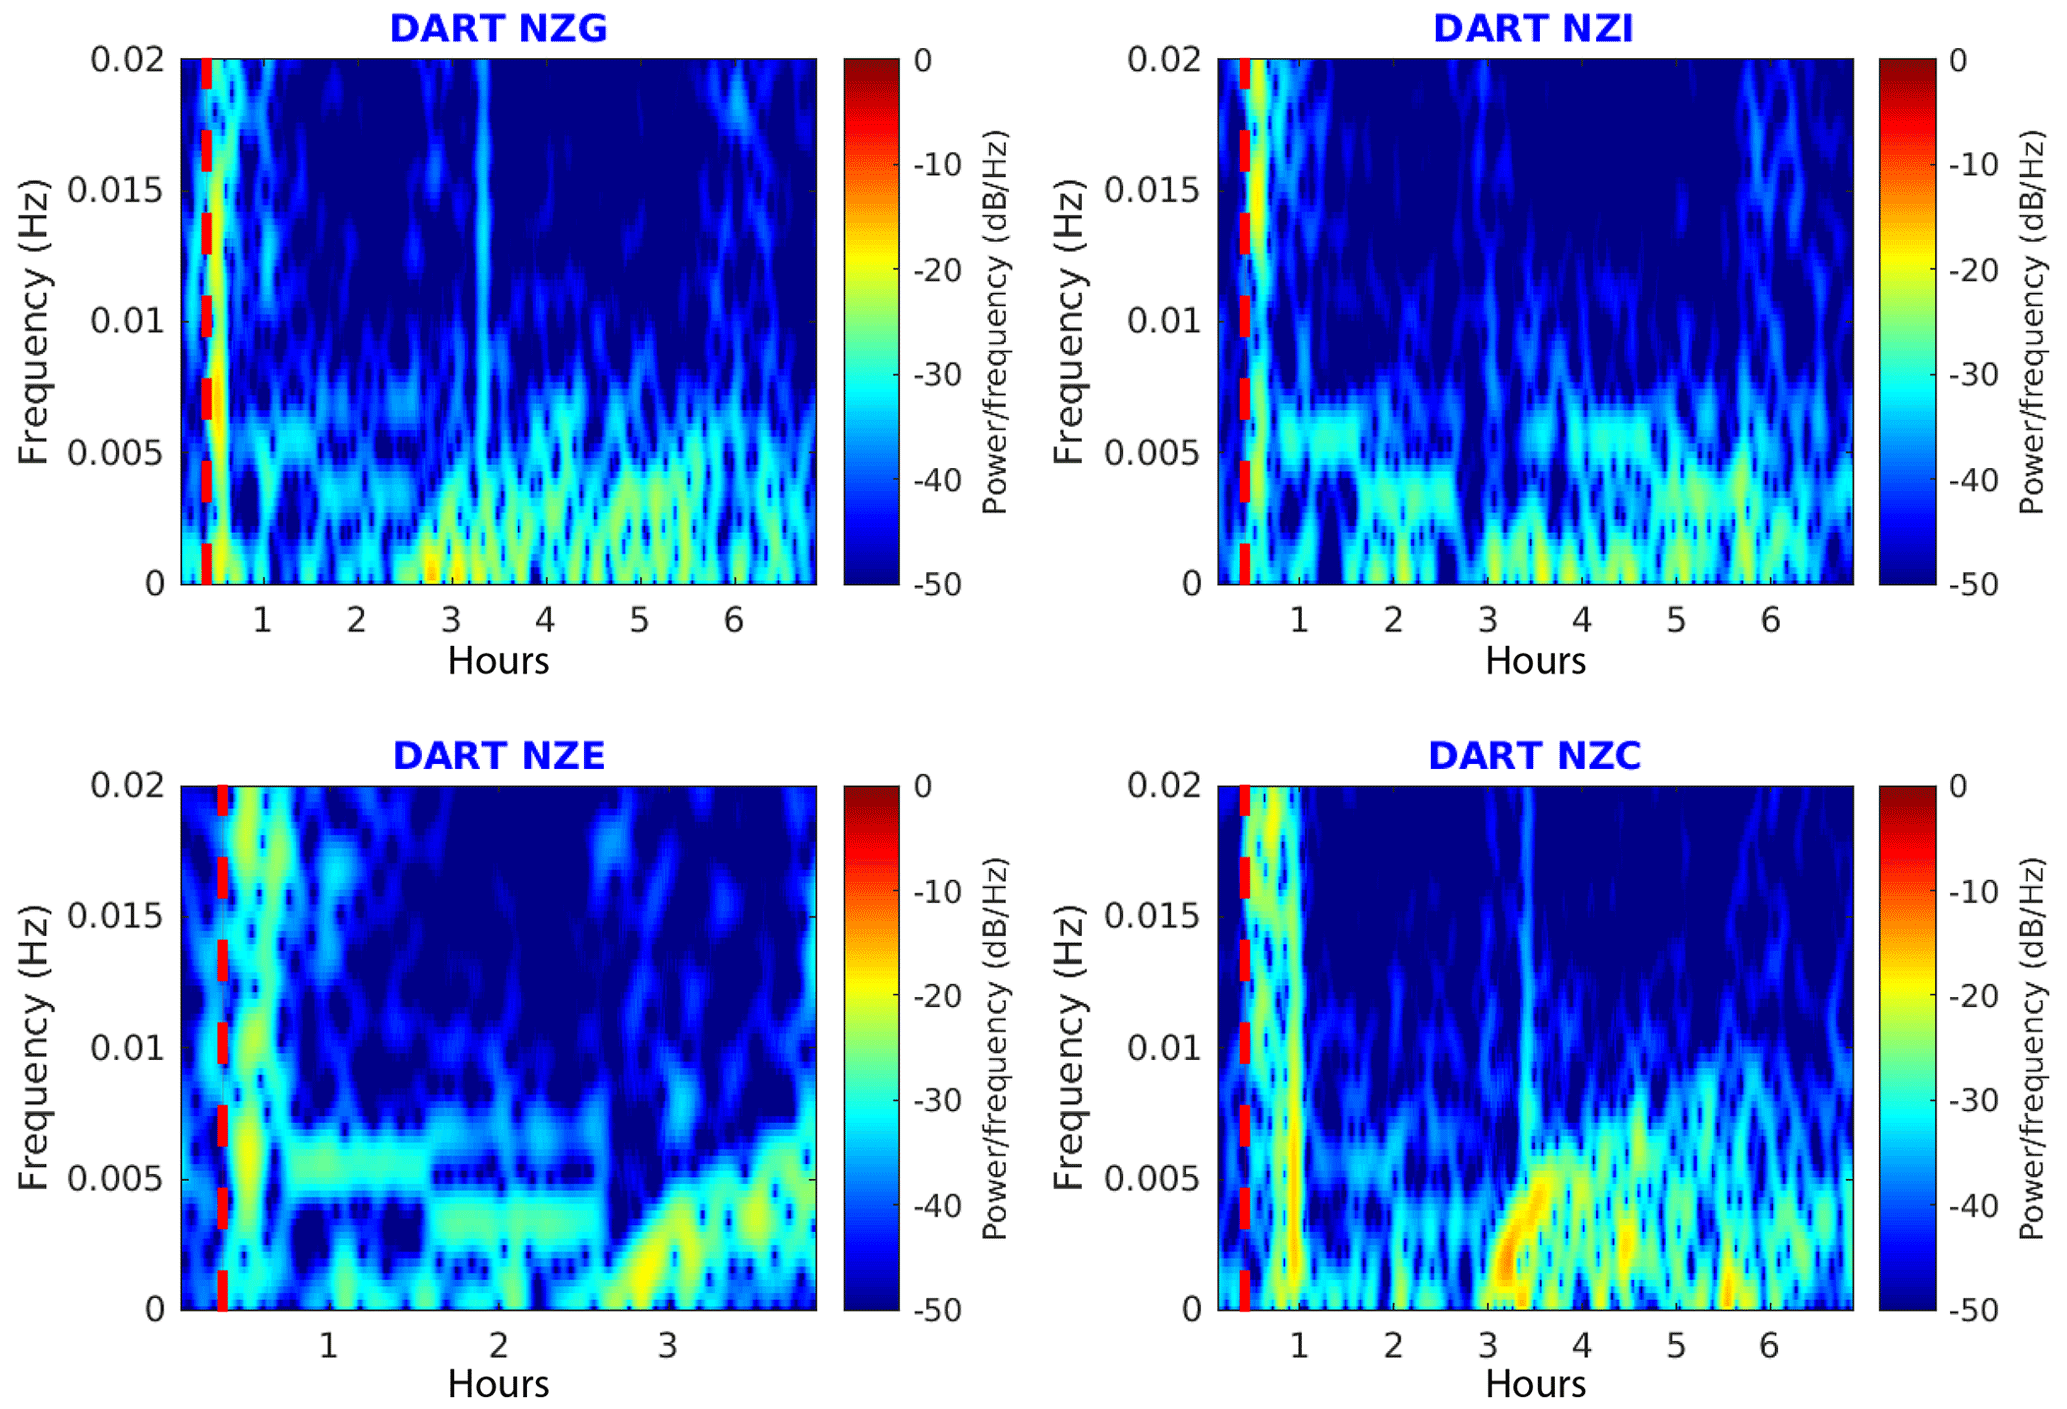
Figure 6Wavelet spectrograms for the 10 February 2021 Loyalty Island tsunami recorded on New Zealand DART stations. The red dashed lines symbolize the earthquake time.
Four of the six newly deployed New Zealand DART sensors were able to record the 10 February 2021 tsunami, arriving on DART NZE first, followed by NZG, NZC, and NZI. Their records are shown in Fig. 4 and the stations are located in Fig. 5; the related tsunami arrival times and amplitudes are summarized in Table 2. In each case, the record shows high frequency waves arriving a few minutes after the earthquake, which are directly linked to the bottom shaking from internal seismic waves. This is particularly highlighted on the wavelet's spectrograms computed for each record (Fig. 6). This is followed by lower frequency waves probably linked to the surface seismic waves (for more details about seismic wave records on DART, see Kubota et al., 2020). Then, between 2 and 3 h after the main shock, the tsunami wave train is recorded showing a leading wave period of ∼ 15 to 20 min depending on the azimuthal location of the DART station relative to the strike of the fault: the closer the DART station is to the azimuth direction of the fault, the larger the period is.
It is important to notice that at the time of the earthquake the south-west Pacific Ocean was subject to one tropical storm (named 20P) south of Tonga and Fiji and a second storm located south of New Zealand and affecting some coastal gauge records with a wide range of frequencies. As underlined by Thomson et al. (2007) during the 2004 Sumatra tsunami, the frequency content of the storm-generated waves possibly overlaps the tsunami signal, being able to show periods of several minutes. This is particularly the case for the Puysegur gauge (PUYT) as shown in Fig. 7.

Figure 7Two storms on 10 February 2021 in the south-west Pacific Ocean. The south one is recorded by the Puysegur gauge (PUYT) at the predicted arrival time of the tsunami (red ellipse and dashed line) (satellite image credits: Zoom Earth, NASA/NOAA/GSFC/EOSDIS, Suomi-NPP VIIRS).
4.1 Methodology
The numerical simulations of tsunami generation and propagation for the four scenarios were done using COMCOT (Cornell multi-grid coupled tsunami model), a model progressively developed during the mid-90s at Cornell University and then continuously developed at GNS Science, New Zealand, carefully tested and widely applied to numerous tsunami studies (e.g. Liu et al., 1995; Wang and Power, 2011; Wang et al., 2020). It computes tsunami generation, propagation, and coastal interaction by solving both linear and non-linear shallow water equations using a modified explicit leap-frog finite difference scheme and considering the weak dispersion effect (Wang, 2008). The initial sea surface deformation is calculated using the Okada (1985)'s formulae with the fault plane geometry and either a uniform or non-uniform slip distribution. Water surface elevation and horizontal velocities are calculated respectively at the cell centre and at the edge centres of each grid cell of the computational domain. Absorbing boundary schemes are used at the boundaries of the computational domain to dampen the incoming waves, avoiding reflection from the grid boundaries.
For the purpose of this study, a set of nested numerical grids at different resolution levels was prepared, covering the whole south-west Pacific region from 140 to 200∘ E and 0 to 50∘ S (first level grid 01), and specific areas (second level and its sub-level grids) focusing on each coastal gauge and DART station that recorded the 10 February 2021 tsunami were used in this study. Digital elevation models (DEM) used for these grids were built from different datasets within the framework of previous projects. The Norfolk Island high-resolution DEM was specifically built for this study (Roger, 2022). The first level (grid 01) is at the lowest resolution (2 arcmin) and covers the whole south-west Pacific region; its data come from the ETOPO 1 global dataset (Amante and Eakins, 2009) with some refinements around New Zealand. The second level of grids, with higher resolutions of 30 to 24 arcsec (∼ 930 and 740 m respectively), cover several sub-regions focusing on New Zealand (grid 02), New-Caledonia/south Vanuatu (03), Norfolk Island (04), Australia east coast (Gold Coast – 05 and New South Wales – 06), Tasmania (07), Fiji (08), Raoul Island (09), Tonga (10), Samoa (11), and Tuvalu (12). Then, depending on the availability of higher resolution data, there is either one or two additional sub-level grids with increasing resolution toward the area where a coastal gauge is located. The extent of most of the grids is presented in Fig. 8. The resolution of each sub-level grid is calculated by COMCOT based on an input grid size ratio to the resolution of the previous level grid. The highest resolution used in this study is ∼ 10 min places where the bathymetry and the coastal shape is very complicated like Lenakel (Tanna Island, Vanuatu), as even minor inaccuracies in how these areas are represented could lead to very inaccurate results. For places like Tonga, Fiji, Tuvalu, and Samoa, where a high-resolution dataset was not available for this study, virtual gauges have been positioned as closely as possible to the corresponding real gauge locations on the 30 s resolution grids used for these places.
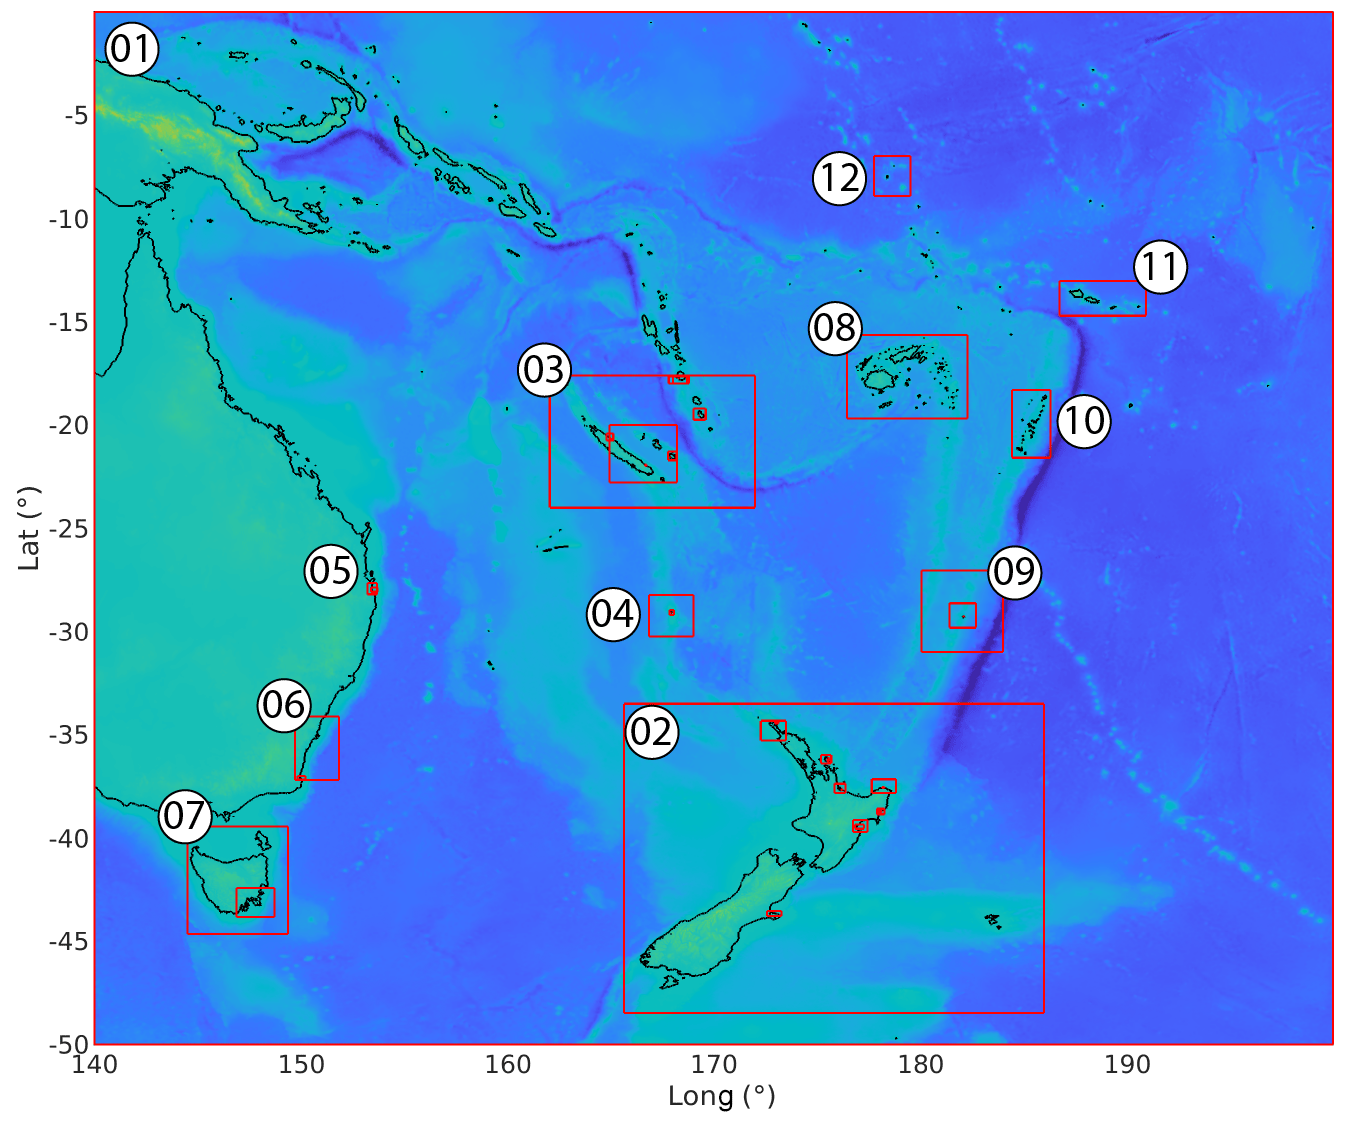
Figure 8Extent of the grids used for modelling within the framework of the study. Grid 01 (first level) covers the south-west Pacific region, from 140 to 200∘ E and from 50 to 0∘ S, with spatial resolution of 2 arcmin. Numbers are associated with the grids of the second level with spatial resolution of 30 or 24 arcsec. Higher resolution grids corresponding to additional levels are only indicated with red rectangles.
Tsunami wave propagation is subjected to linear, non-linear, and dispersion phenomena. As shown by Watada et al. (2014), the compressibility of the seawater, the elasticity of the solid Earth and ocean, and the gravitational potential variation associated with the mass motion during the tsunami propagation also play important roles on the tsunami travel times. These authors developed a method to automatically correct the phase of the simulated waveforms to incorporate those effects. The phase correction generally causes a slowdown of the tsunami, reducing the delay between the simulated waveforms and the observations and, incidentally, also reduces its amplitude (Gusman et al., 2015, 2016; Ho et al., 2017). A computer code has been developed to apply this correction to the synthetic time series obtained in the present study before comparing them to the recorded signals.
Note about the tides
The south-west Pacific region tide dynamic is complicated, showing tide currents exceeding 5 cm s−1 in some places (Poulain and Centurioni, 2015) and New Zealand being at one of the amphidromic points, while showing large coastal tide amplitudes (Bye and Heath, 1975). It results in the tide pattern being drastically different from one side of Cook Strait (the waterway separating New Zealand's two main islands) to the other. Also, as some of the coastal gauges used in this study are located within a coastal lagoon (e.g. New Caledonia, Tonga, Fiji), it is worth noting that such semi-enclosed water bodies are also subject to specific tide behaviours, including amplification, delays, asymmetry of the tide fluctuations, and additional response to tidal oscillations (e.g. Albrecht and Vennell, 2007; Lowe et al., 2015; Green et al., 2018). These reasons lead to very different tide patterns and amplitudes recorded on the gauges considered in this study as shown in Fig. 4. To simplify the problem, it has been decided to simulate the tsunami propagation at mean sea level (MSL) for each region without considering the tide variations, although it has been shown that the tide–tsunami interactions can result also into important modification of the tsunami characteristics (amplitude and velocity mainly) in coastal zones (e.g. Kowalik et al., 2006; Kowalik and Proshutinsky, 2010; Zhang et al., 2011; Tolkova et al., 2015).
4.2 Results
The simulation results obtained with a uniform and two non-uniform slip models generally show good agreement with the data recorded either by coastal gauges or DART stations in the south-west Pacific region. A close look at the results is necessary to highlight the differences and similarities between the three models. The results obtained with a maximum plausible Mw 8.2 scenario are presented afterward.
4.2.1 Coastal gauge records
As shown in Fig. 5, the 10 February 2021 tsunami was recorded by at least 31 coastal gauges in the south-west Pacific Ocean. For the purpose of this study, and according to the quality of available bathymetric data, synthetic tsunami time series have been calculated at 24 of these 31 coastal gauges at the same locations or very close and compared to the real sea level data (Fig. 9). The seven remaining gauges have not been considered because of the lack of quality bathymetric data at these locations. Generally, the simulated results are in good agreement with the real signals, in terms of travel time, amplitude, and polarity. Also, the wave patterns are very close from one scenario to another one in terms of first wave arrival time, general amplitude, and polarity.
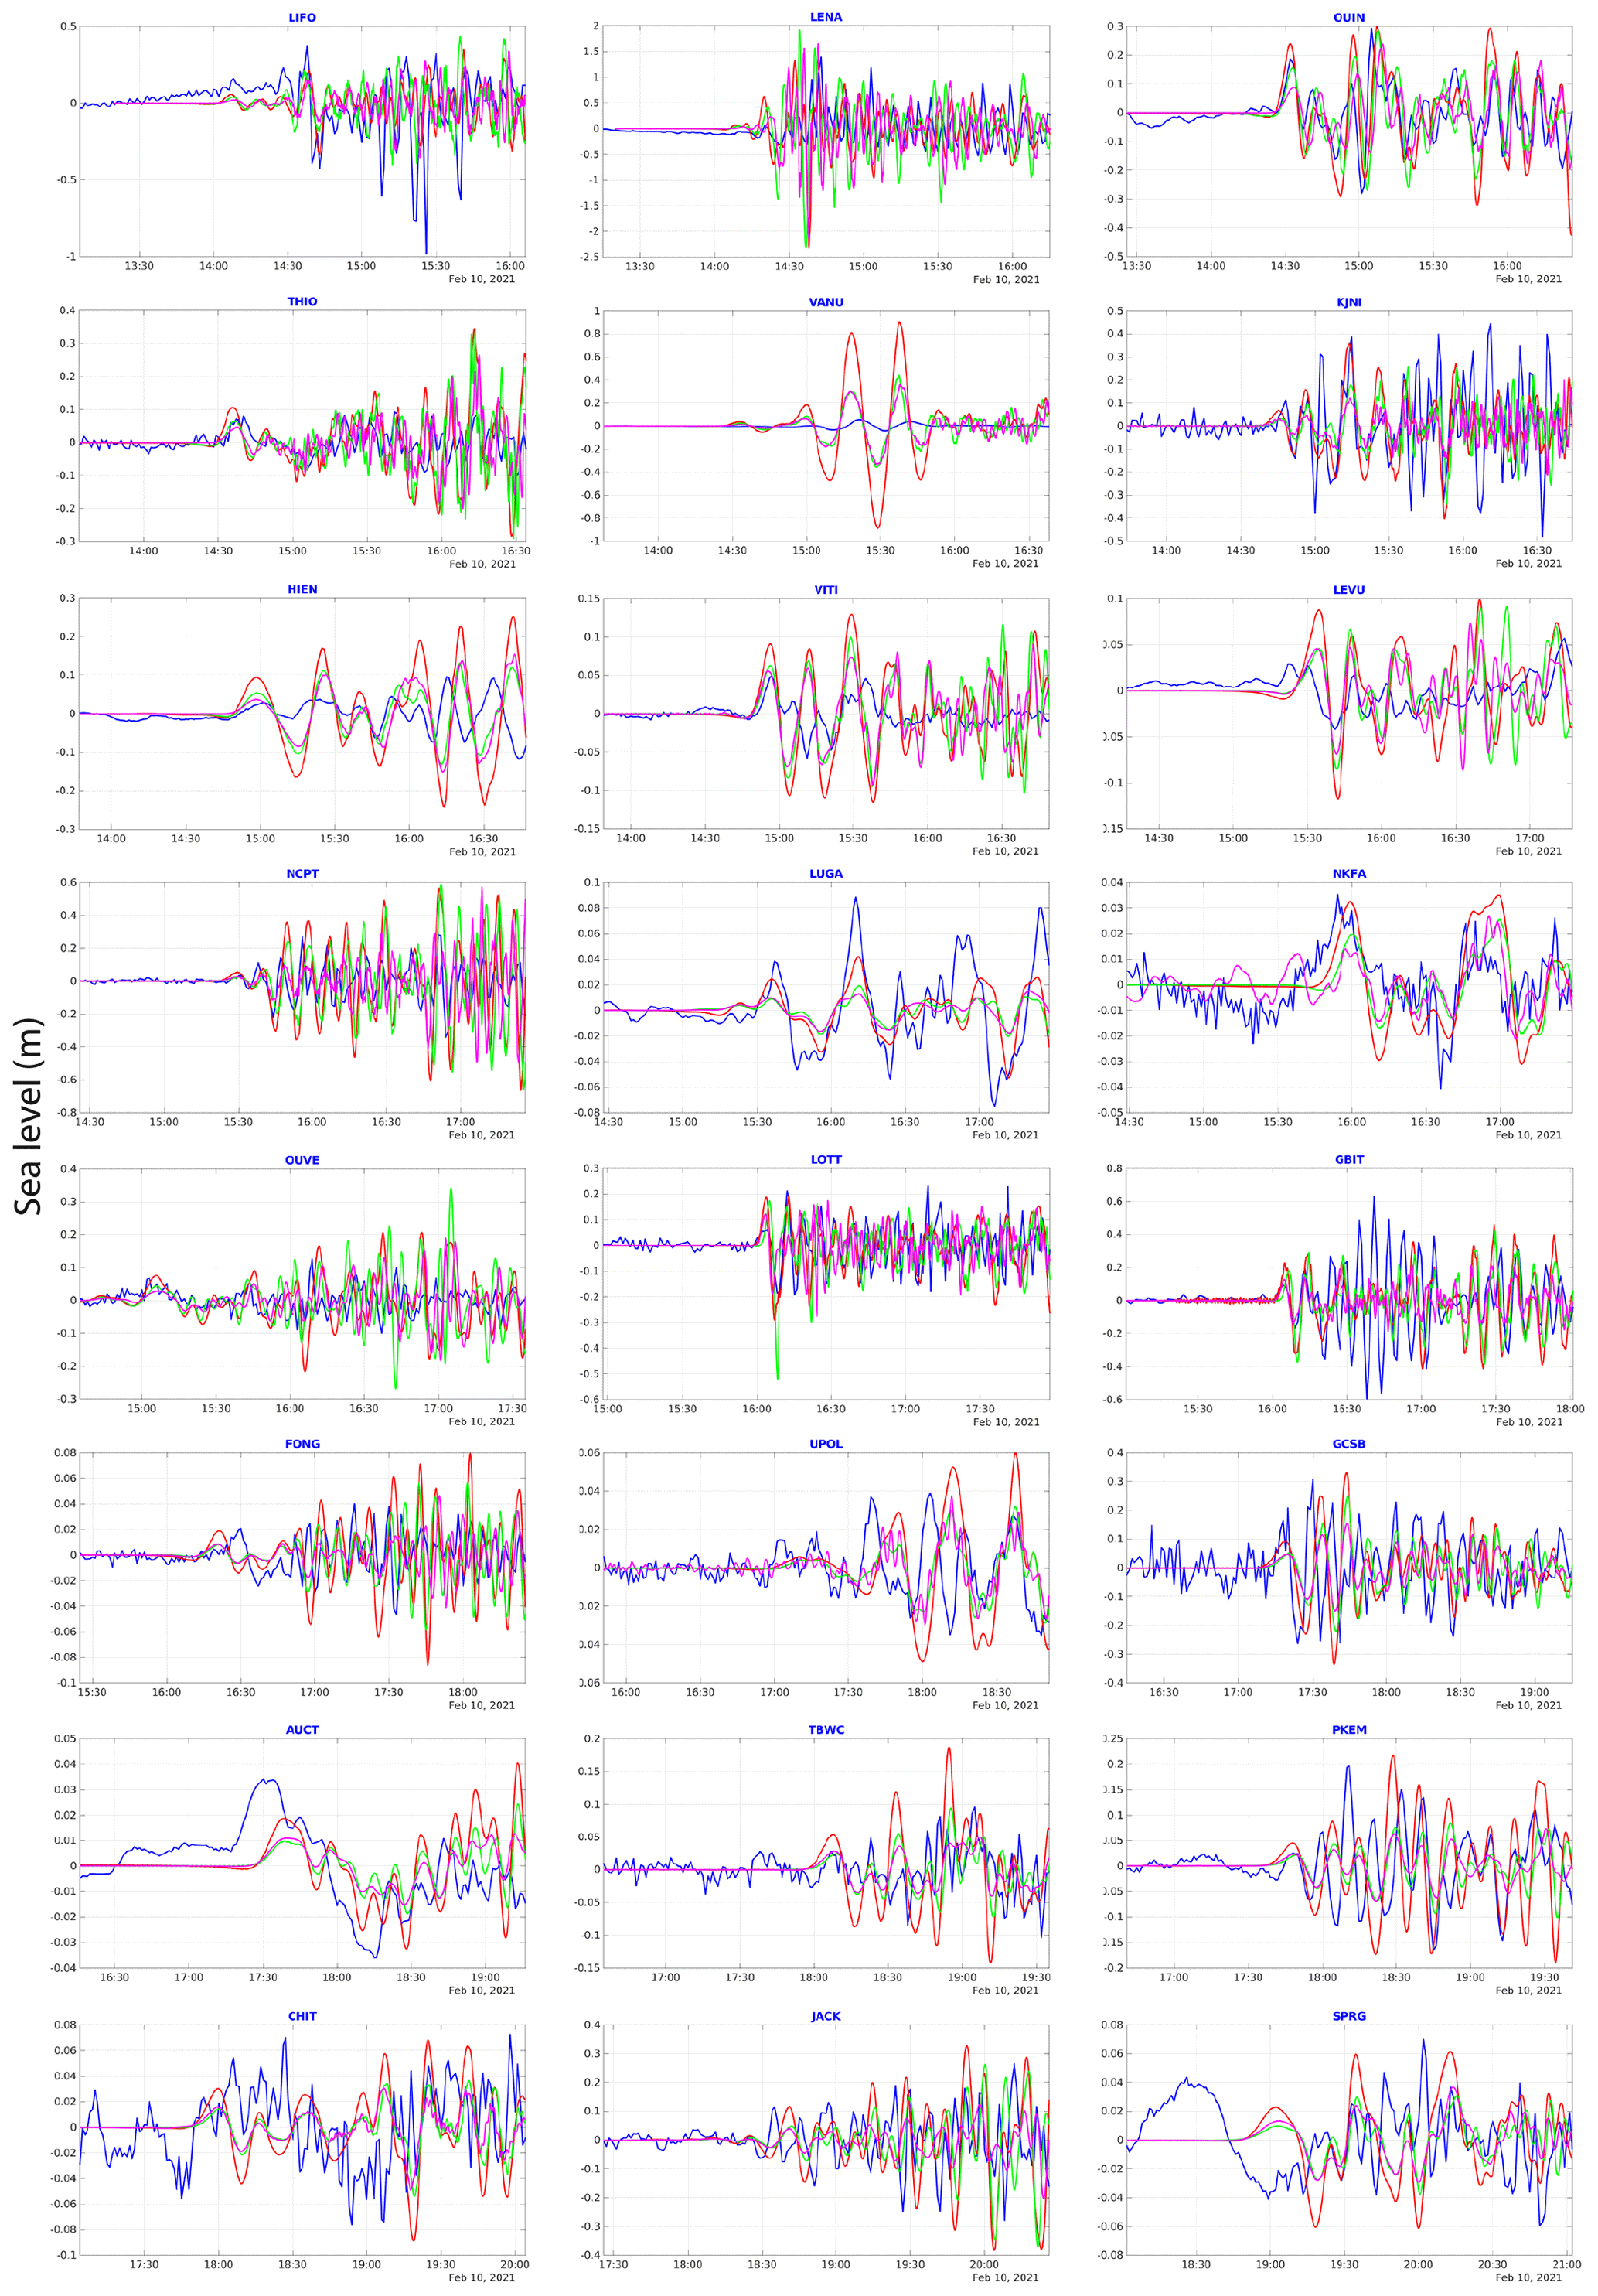
Figure 9Simulation results obtained with three different seismic source models compared to 24 coastal gauge records: uniform slip model (red), non-uniform slip model from waveform inversion (green), USGS finite fault model (magenta), real filtered records (blue).
When looking into detail, it appears that the travel time difference between simulated and real records shows a complicated pattern for each scenario, the simulations matching with the real tsunami arrival at gauges or being either too early or too late with a delay of up to 8 min. At LIFO, HIEN, NCPT, LUGA, OUVE, LOTT, and GSB, the three scenarios first wave arrival matches with the real records. The three scenarios first wave arrival is too early at VANU (∼ 3 min), VITI (∼ 1 min), FONG (∼ 8 min), TBWC (∼ 3 min), and PKEM (∼ 2 min). It is too late at LEVU (∼ 2 min), NKFA (∼ 7 min), UPOL (∼ 6 min), AUCT (∼ 8 min), JACK (∼ 3 min). In the other locations, it is a mix between the three scenarios: at LENA and OUIN, scenario #2 matches the real records although it is too early for scenario #1 (∼ 1 min) and too late for scenario #3 (∼ 2 min); at THIO and KJNI, scenario #2 and scenario #3 match the real records although scenario #1 is too early (∼ 3 min). The delays at CHIT and SPRG are undetermined due to the level of noise.
Concerning the tsunami waves' polarity, the overall observation is that it generally shows a good fit to the first wave(s) considering the potential delay of the first arrival time. However, even if the following wave train is well correlated with the records, it sometimes shows a phase shift, associated with higher frequencies after the first hour of tsunami arrival.
Concerning the wave amplitudes, scenario #1 overestimates by a factor of 0.5 to 2 the amplitudes of the first waves in near-field (LENA, OUIN, THIO, HIEN, VITI, LEVU) and northern New Zealand (LOTT, GBIT), although it fits it in further locations (KJNI, NCPT, LUGA, NKFA, OUVE). Scenario #2 fits correctly in some near-field locations (OUIN, THIO, VITI, LEVU, OUVE), overestimates in other near-field locations (VANU, HIEN) and in northern New Zealand (LOTT, GBIT), and lightly underestimates the wave amplitudes in most of the far-field locations (KJNI, LUGA, NKFA, FONG, GCSB, AUCT, PKEM, CHIT, JACK, SPRG). Scenario #3 also fits near-field locations (VITI, LEVU, OUVE) and one far-field location (GBIT), overestimates in other near-field locations (VANU, HIEN), and underestimates the amplitudes in nearly all other locations.
The non-uniform slip models (scenario #2 and scenario #3) show generally quite similar waveforms, scenario #3 being most of the time smaller than scenario #2 in terms of amplitude.
It is noticeable that the models are not able at all to reproduce the real signal at one location, VANU (Port Vila, Vanuatu), although numerous tests have been done to try to fit it correctly: changing the location of the virtual gauge, smoothing the bathymetric data, or increasing its resolution. The other differences are related to the de-tiding method of the real signals using a polynomial fitting that is not always able to remove the whole components of the tide or to meteorological conditions like storm surges producing low frequency waves (e.g. SPRG and CHIT).
These comparisons need to be considered cautiously with regards to the overall small amplitude of the tsunami. But globally, scenario #2 presents a good compromise between the two other scenarios, being able to satisfy both near and far-field expectations. Thus, scenario #2 has been retained for further analysis presented hereafter.
4.2.2 DART records
Simulated sea level fluctuations due to tsunami waves at DART C, E, G, and I location for each slip model are compared to real DART records in Fig. 10. The reader must consider that the available 15 s sampling rate record transmitted in real time by the BPR to the monitoring centre stops at 17:00 UTC for DART E and stops at 18:30 UTC for DART C, G, and I.
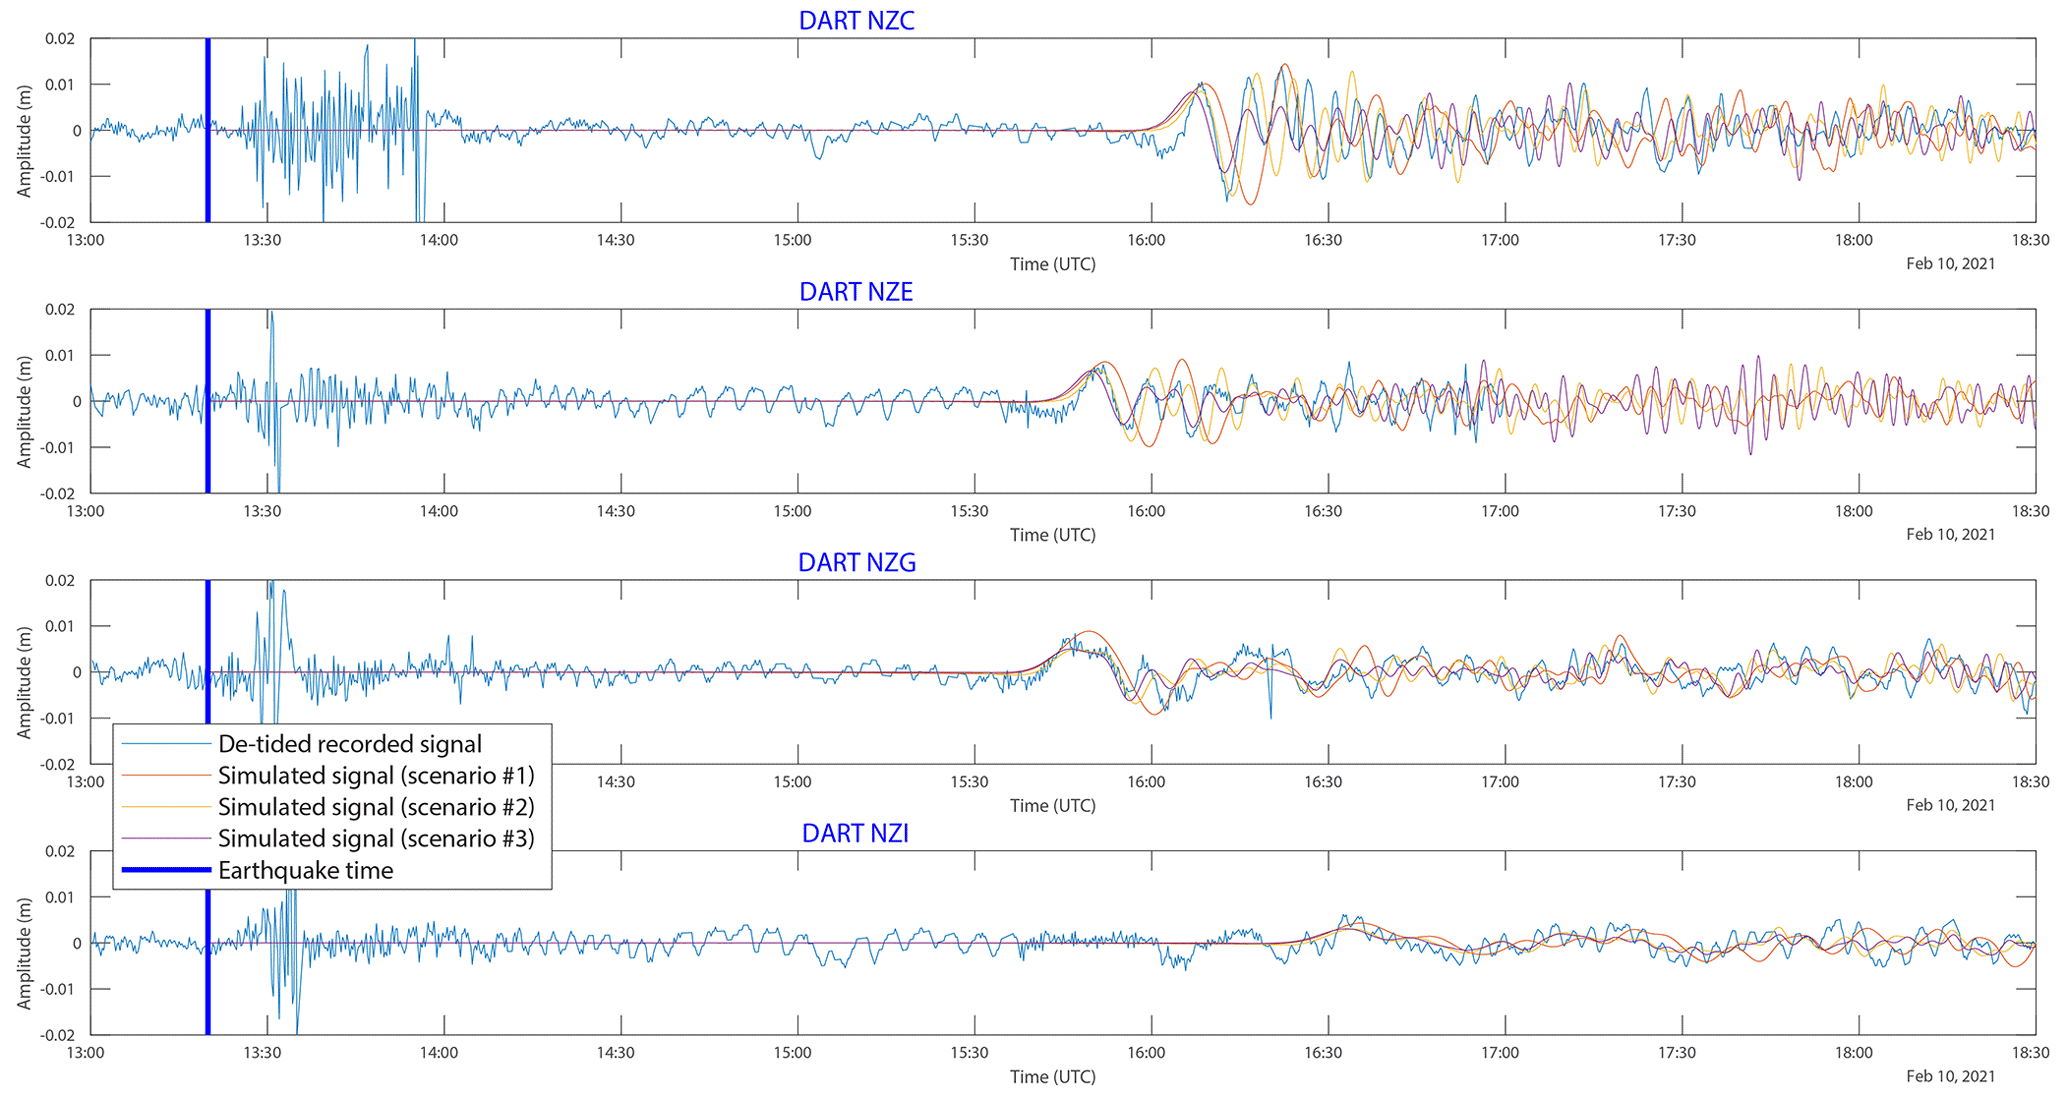
Figure 10Sea level fluctuations associated with the 10 February 2021 earthquake and tsunami recorded by the New Zealand DART NZC, NZE, NZG, and NZI: blue lines represent the de-tided real recorded data, red lines represent the simulated signal for a Mw 7.7 uniform slip model, yellow lines represent the simulated signal for a Mw 7.7 non-uniform slip model obtained from inversion of tsunami waveforms (Gusman et al., 2022), and purple lines represent the simulated signal obtained with the USGS Mw 7.7 non-uniform slip model. The blue vertical line symbolizes the earthquake time.
In terms of arrival time, the three scenarios show good visual agreement with the records for the four stations. In terms of periodicity on each station, scenario #1 produces a leading wave period longer of 3–4 min than the records, leading to a phase shift of the wave train.
On DART C and E, scenario #2 provides the best match with recorded data in terms of arrival time and first wave amplitude and periodicity. A time shift of ∼ 2 min occurs in the first trough (after the leading wave arrival) and is reflected on the following waves, which is not the case with the scenario #3, fitting better the oscillations coming after the first wave.
On DART G, both non-uniform slip models provide a good match with the leading wave and then with the following with a small time shift of ∼ 2 min.
On DART I, the three models seem to match the tsunami waves correctly, even if the interpretation of the results of such small amplitude signals of less than 5 mm must be done carefully.
To summarize, in terms of amplitude, the uniform slip model and the two non-uniform slip models are respectively slightly above or under the leading wave records within the range ±2 mm but generally show a good visual correlation between simulation results and records. Scenario #2 provides the best match for the leading wave without any surprises. The next few waves are better correlated with both non-uniform slip models in terms of amplitude and periodicity, the USGS model (scenario #3) showing a better fit with the oscillation and the other one (scenario #2) with the amplitude.
4.2.3 Maximum amplitudes
The maximum amplitude maps presented in Fig. 11 and discussed hereafter are those obtained with the scenario #2.

Figure 11Maximum wave amplitude maps obtained after 12 h of simulated tsunami propagation for the 10 February 2021 with a non-uniform slip model from waveform inversion (Gusman et al., 2022). The coloured circles locate the coastal gauges and DART stations having recorded the tsunami and used in this study, the colouration being linked to the maximum amplitude reported in Table 2. IdP: Isle of Pines, NI: Norfolk Island, NW Ridge: West Norfolk Ridge, VSZ: Vanuatu subduction zone (red dashed line).
At a regional scale, the maximum wave amplitude maps obtained after 12 h of tsunami propagation over the south-west Pacific region show maximum amplitude not exceeding 1.5 m in the whole studied region, a main energy path oriented N–S (toward the north and west coasts of New Zealand and toward Tuvalu in the north) and strong bathymetric effect on the propagation (Fig. 11). In fact, the presence of major bathymetric features of the mostly submerged Zealandia continent (Mortimer et al., 2017) like the Lord Howe Rise and the Norfolk and W,est Norfolk ridges (WN Ridge in Fig. 11) between the source area and New Zealand/Australia and the numerous banks located in the north-west of Fiji, associated to the Vityaz trench, act as natural barriers and focus the tsunami south-westward and north-westward in specific locations outside of the earthquake region.
The role played by those submarine features in focusing the wave energy is clearly visible: North Cape in New Zealand and the south of New Caledonia, especially the Isle of Pines, respectively prolonging toward the south and the north the Norfolk Ridge which acts as a waveguide, are particularly exposed to tsunami waves. The Loyalty Islands Ridge and the Vanuatu subduction arc act as waveguides as well, focusing the tsunami waves on the Loyalty Islands (Maré, Tiga, Lifou and Ouvéa) and the Vanuatu Islands (Aneityum, Tanna, Erromango, Efate mainly). This has already been highlighted by Roger et al. (2021) for the 5 December 2018 tsunami propagation. They are also two tsunami pathways clearly focusing the tsunami waves on Tasmania and along the Gold Coast (Australia). More locally, the tsunami shows relatively high amplitudes within lagoons and atolls like in Tuvalu, Tonga, and Fiji or trapped around islands like around Norfolk or the Samoa Archipelago. It is notable that the tsunami is also amplified around the Chatham Islands, east of New Zealand. This could also be linked to the trapping of waves on the islands' shelf. Finally, some places like Lenakel's Bay on Tanna Island, Vanuatu, or Jackson Bay on the south-western coast of New Zealand are acting as “tsunami magnets”, being able to catch tsunamis from a wide range of azimuths and to show higher amplitudes of waves than nearby locations.
4.2.4 Plausible Mw 8.2 scenario
The maximum wave amplitudes simulation of the tsunami triggered by a plausible Mw 8.2 earthquake rupture scenario proposed in this study are shown in Fig. 12.
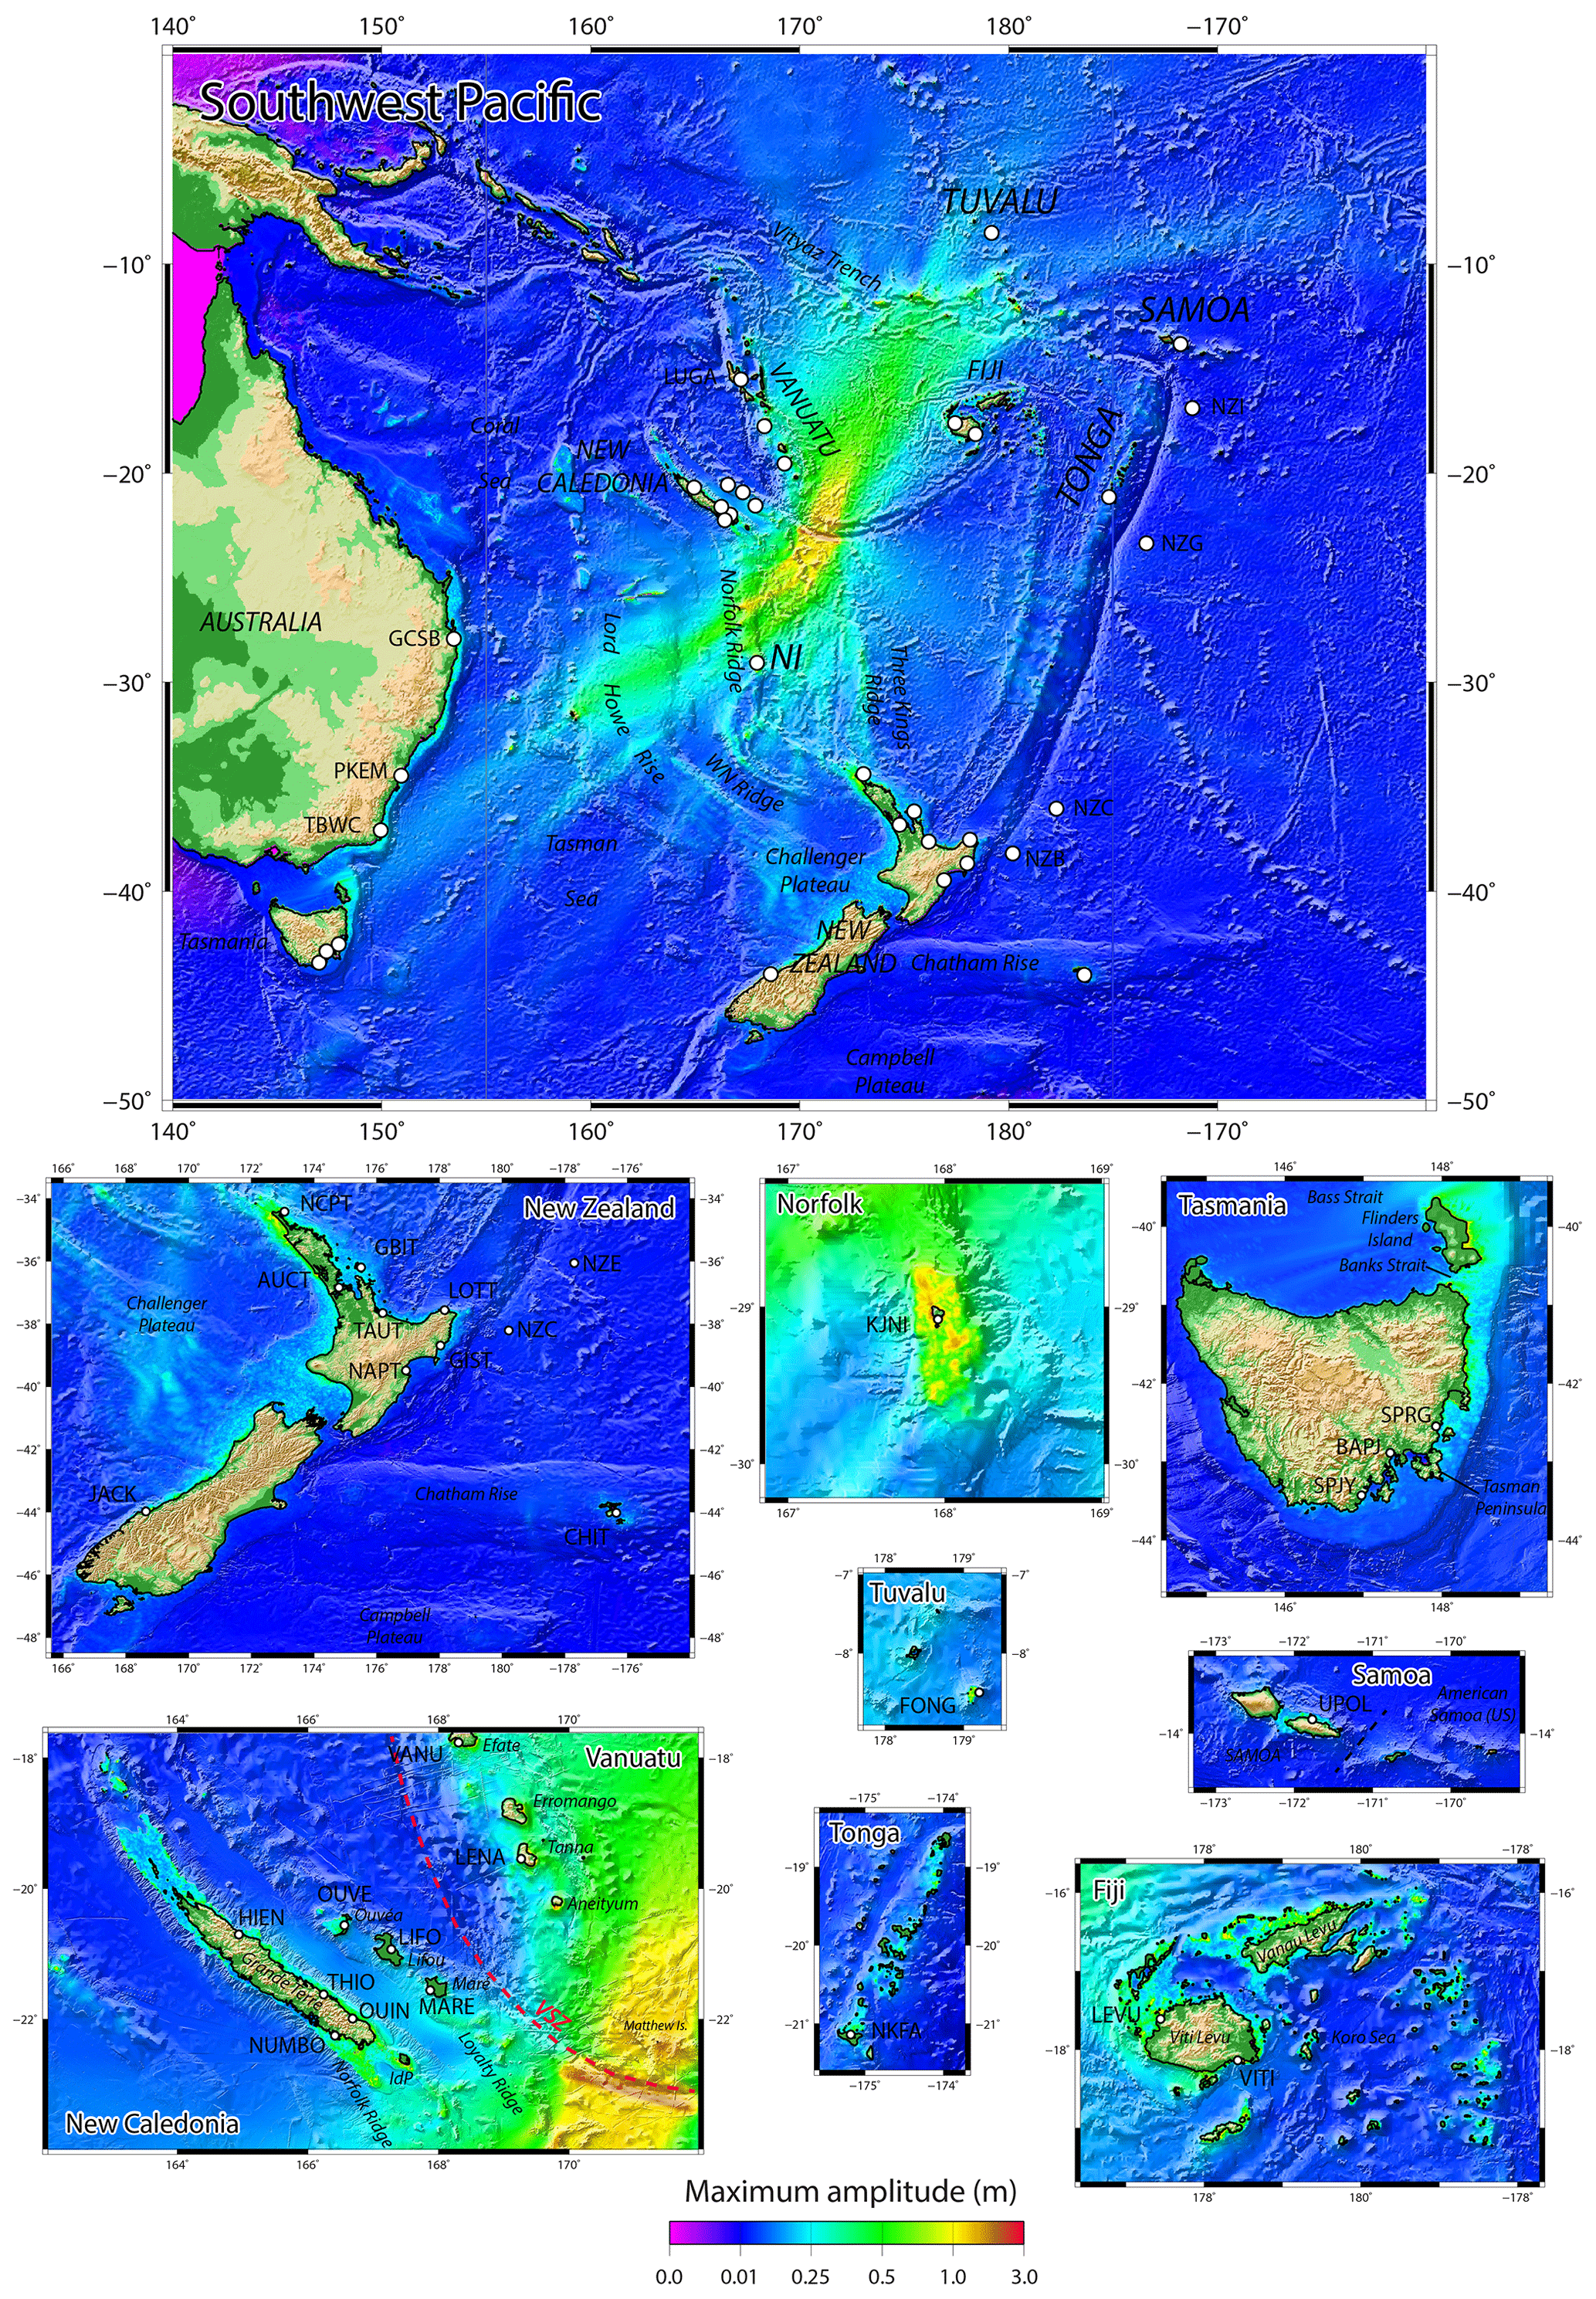
Figure 12Maximum wave amplitude maps obtained after 12 h of simulated tsunami propagation for a plausible Mw 8.2 rupture scenario with uniform slip proposed in this study. The white circles locate the coastal gauges and DART stations used in this study. IdP: Isle of Pines, NI: Norfolk Island, NW Ridge: West Norfolk Ridge, VSZ: Vanuatu subduction zone (red dashed line).
Unsurprisingly, at a regional scale, the maximum wave amplitude maps obtained after 12 h of tsunami propagation over the south-west Pacific region show maximum amplitudes exceeding 0.5 m in many coastal zones of the studied region. The chosen strike of the fault rupture (287∘ N) directly impacts the orientation of the main energy path, NE–SW in that case (axis 17–197∘ N), which needs to be considered cautiously: a slightly different strike would lead to a different orientation of the main energy path. Nonetheless, these simulation results underline strongly the bathymetric influence on the propagation. To the south of the trench, the main energy path is drastically deviated by the extension of the Loyalty Ridge south of the VSZ bending zone, leading to a propagation more perpendicular to the Norfolk Ridge, which seems to act as a barrier, with only one ray going through, directly toward Lord Howe Island. Part of the energy is still propagating toward New Zealand, using the ridges like the Three Kings Ridge toward the North Cape. To the north, the tsunami propagates within the North Fiji Basin, (between Vanuatu and Fiji) and is able to go through the Vityaz Trench region, reaching Tuvalu islands. Just a small portion of the energy propagates toward the east and seems to disappear when crossing the Kermadec–Tonga Trench. In details, the tsunami seems to be caught within the different lagoons or trapped by shelves surrounding oceanic islands: Norfolk Island's shelf, for which a high-resolution DEM has been specifically built using nautical charts, is the best example of waves being caught around an island in this study, leading to consequent amplitudes of 1.5 m and more. High amplitudes are also shown in Vanuatu, especially on the southern coast of Aneityum Island, its southernmost island, but also in Tanna or Erromango, at the same locations already highlighted with the Mw 7.7 scenario herein, but also for the 5 December 2018 tsunami study (Roger et al., 2021). In the nearby islands of New Caledonia, the amplitudes are less important as would have been expected, especially in the Loyalty Islands, but Ouvéa and Grande-Terre respective lagoons catch tsunami waves leading to amplitude records of around 0.5 m. Similarly, the tsunami waves are caught within the islands in Fiji, Tonga, and Tuvalu's Te Namo atoll. It is interesting to see that the tsunami can particularly affect the west coast of New Zealand much more than its northern shore: locations such as Jackson Bay (south-west coast of the South Island), already identified as reacting very easily to tsunami coming from a wide range of azimuths, also shows amplitudes of more than 1 m.
5.1 Comparison of the slip models results
The tsunami modelling results show that both the uniform slip model built from CMT solution (scenario #1) and non-uniform slip models calculated from tsunami waves inversion (scenario #2) or seismic data (scenario #3) are able to reproduce the recorded signal of the small tsunami following the 10 February 2021 Mw 7.7 thrust event generated at the south-easternmost part of the VSZ on most of the 24 coastal gauges and four DART stations of the south-west Pacific region considered in this study. This reproduction shows differences in some locations that can be attributed either to the resolution of the grids directly linked to the available bathymetric data quality, or to the dispersion phenomenon affecting the tsunami waves during propagation over long distances, or to the quality of the real coastal gauge data (including possible time and vertical offsets), or finally to the initial assumption on the source geometry used in tsunami inversion process.
This implies two things:
-
a simple fault plane with uniform slip model (scenario #1) provides a good approximation of the amplitudes of a small tsunami on a set of DEMs focussed over the south-west Pacific region. This supports the results obtained by Roger et al. (2021) for the 5 December 2018 Loyalty Islands tsunami;
-
we can use the first waves recorded at DART and coastal stations to produce a good estimation of the initial deformation (scenario #2) and use this initial (non-uniform) deformation to calculate the propagation over the whole region and confirm the related threat (for more information on the methodology, see Gusman et al., 2022). Depending on the relative location of the event epicentre to the stations' location, this could be done within a relatively short time using only the first 20–25 min of recorded tsunami waveforms. Considering that the New Zealand DART network is now fully operational with stations located close to the Hikurangi-Kermadec-Tonga and southern VSZ (three additional DART stations J, K, and L have been positioned closer to the VSZ in July 2021), with the capability to detect a tsunami within 30 min after an earthquake occurred in those two regions (Fry et al., 2020), it would be possible to invert tsunami waveforms to achieve a good estimation of the initial surface displacement within 50–55 min. This delay is unfortunately still too long to accurately confirm the threat for neighbouring regions, e.g. for New Caledonia and especially the Loyalty Islands and south Vanuatu if it occurs on the VSZ, but nevertheless in those specific cases it can help for further exposed regions like New Zealand, the east coast of Australia, or neighbouring Pacific Islands like Tonga, Fiji, Samoa, Tuvalu, Cook Islands, and French Polynesia. If it occurs in the southern VSZ like the 10 February 2021 event, it provides much more time for New Zealand to confirm the threat by running inversion calculations. This inversion methodology is interesting in the sense that it does not require a specific knowledge of the geology of the source area.
5.2 Role of submarine features
This study particularly highlights the role of the mostly submerged Zealandia continent on the tsunami propagation through the focusing and amplification of waves over particular submarine features. That is probably why Lenakel Harbour (Tanna, Vanuatu) and Jackson Bay (New Zealand) have recorded relatively important tsunami waves in comparison to neighbouring gauges. Concerning Vanuatu, this is consistent with de-aggregated hazard maps in probabilistic tsunami hazard assessments such as Thomas and Burbidge (2009), who show that countries such as Vanuatu are exposed to tsunami hazard from the entire VSZ (as well as the northern Kermadec-Tonga Subduction zone to a lesser extent) even if the main energy path of a given tsunami does not directly focused on Vanuatu.
It also highlights the trapping of waves around islands, especially around Norfolk Island, a phenomenon due to wave refraction and bottom-depth dependence on the island slope and shelf leading to the development of oscillations of standing waves (e.g. Tinti and Vannini, 1995; Roeber et al., 2010; Zheng et al., 2017). Resonance between islands probably needs to be considered to explain the wave amplitudes observed in some archipelagos (Tonga, Fiji, and Samoa) as explained by Munger and Cheung (2008) for the 2006 Kuril Islands tsunami in Hawaii.
Finally, it reveals that some specific locations which seem to be protected from a tsunami generated at the southernmost part of the VSZ like the Chatham Islands or Tuvalu can still be impacted.
5.3 Contribution to regional hazard assessment
The 10 February 2021 event brings new light on the ability of the southernmost part of the VSZ to produce a regional event, being able to reach far-field locations such as Tasmania in the south and Tuvalu in the north and showing particular behaviours associated with submarine features and coastal shapes.
It is important to note that this tsunami has not shown amplitudes like those of the 5 December 2018 tsunami (from a Mw 7.5 earthquake) on New Caledonia and Vanuatu coastal gauges because of its location (further east), a different triggering mechanism (reverse faulting versus normal faulting), and the direction of the main energy path (N–S instead SW–NE). Nevertheless, tsunami wave amplitudes of more than 28 cm have been recorded at eight locations. This means that, according to most standard warning level thresholds (issuance of advisories or warnings if amplitude above 20–30 cm), the threat linked to this tsunami required at least, in principle, a response of some kind for at least eight coastal sites, and probably many more (without available coastal gauge records) according to the simulated maximum wave amplitude map (shown in Fig. 11).
As the use of the model was validated with the Mw 7.7 scenarios, it was an opportunity to look at what would happen in the region if a tsunami was generated by a plausible magnitude Mw 8.2 earthquake at the southernmost part of the VSZ, which, as seen previously, has accumulated enough strain during at least the last 100 years to be able to produce such event. According to the simulation results, the role of a waveguide and focusing of tsunami waves by submarine features of the former Zealandia continent (limits from Mortimer and Scott, 2020) is enhanced, and a scenario of this type would have a greater impact on the whole region in addition to all neighbouring islands of New Caledonia, Vanuatu, and Fiji, affecting the New Zealand north and west coasts and the east coast of Australia from the Gold Coast to Tasmania as well. In fact, such an earthquake would generate tsunami wave heights at shoreline higher than 1 m in many coastal locations of the south-west Pacific region like in New Caledonia, Vanuatu, Fiji, New Zealand, etc., representing a potential land threat. It would be of major interest to test many potential scenarios in the southernmost part of the VSZ to see if they all behave the same way over those submarine features or not. The same way, a set of scenarios would help to focus on very specific areas in the region that are prone to higher tsunami amplitudes like Jackson Bay, Lenakel Harbor, Norfolk Island, etc., conducting high resolution studies with a specific look at the resonance periods, and the wave trapping.
The 10 February 2021 tsunami triggered by a magnitude Mw 7.7 earthquake at the southernmost part of the VSZ was recorded by at least 35 coastal gauges and DART sensors in the south-west Pacific region with amplitudes higher than 28 cm at eight locations. This small event is an opportunity to test the accuracy of the numerical model COMCOT used for tsunami hazard assessment for New Zealand and find ways to improve the operation of warning systems. The results of numerical simulations of tsunami propagation on a set of nested grids of both uniform and non-uniform slip models presented in this study are able to reproduce the real records with a relatively good correlation in terms of arrival times, wave amplitudes, and polarity, and the identified differences could be linked to the lack of accurate bathymetric data in some places, to the dispersion of the waves during the propagation, the potential bad quality of the real records, and eventually to the initial assumptions of the source location and geometry. As this event occurred in a region where neither strong earthquakes nor tsunamis occurred during at least the last 100 years, the validation of the Mw 7.7 parameters for tsunami modelling will help to develop plausible scenarios for the southernmost part of the VSZ in agreement with geophysical data including the subduction interface geometry which reproduces the curvature of the VSZ (SLAB 2.0: Hayes, 2018) and look at their potential tsunami impact in the south-west Pacific region. It helps to highlight the significant role played by the numerous submarine features in the region, focusing or stopping the tsunami waves, the Norfolk Ridge being the most important acting like a waveguide toward the north and the south. It also underlines the trapping of waves on Norfolk shelf and potentially around the Chatham Islands as well. Finally, it highlights the difficulty of identifying tsunami waves of small amplitude within a stormy background.
Most of the datasets used in the present study are available online: global bathymetric datasets ETOPO1 (https://doi.org/10.7289/V5C8276M, Amante and Eakins, 2009) and GEBCO2021 (https://doi.org/10.5285/c6612cbe-50b3-0cff-e053-6c86abc09f8f, GEBCO Bathymetric Compilation Group 2021, 2021) are publicly available; a high-resolution DEM covering New Caledonia and Vanuatu has been prepared as part of the New Caledonia TSUCAL project and can be shared for research purposes. Norfolk Island DEM has been specifically built for this project and is available at https://doi.org/10.21420/H889-5393 (Roger, 2022). Other DEMs have been built in the framework of GNS Science research or commercial projects and could be obtained under specific conditions (contact corresponding author for more information). The earthquakes (https://earthquake.usgs.gov, last access: 24 January 2023; U.S. Geological Survey, 2023), centroid moment tensors (https://www.globalcmt.org, last access: 24 January 2023; Dziewonski et al., 1981; Ekström et al., 2012), coastal gauge records (https://www.linz.govt.nz/sea/tides/sea-level-data/sea-level-data-downloads, last access: 24 January 2023; LINZ Data Service, 2023; https://doi.org/10.14284/482, VLIZ/IOC, 2021), and New Zealand DART data (https://doi.org/10.21420/8TCZ-TV02, GNS Science, 2020) are publicly available.
JR organized the study, performed the numerical simulations, analysed the results, and wrote the paper. BP wrote the tectonic context part and worked on the uniform slip scenarios definition. AG worked on the source from waveforms inversion and the analysis of the simulation results and helped to write the paper. WP and DB helped to improve the paper by providing constructive comments. XW provided COMCOT simulation code and assistance and worked on the methodology part. MD provided high-resolution DEM for New Caledonia and Vanuatu, prepared within the framework of a Master's thesis project. All authors agreed with the revised version of the paper.
The contact author has declared that none of the authors has any competing interests.
Publisher’s note: Copernicus Publications remains neutral with regard to jurisdictional claims in published maps and institutional affiliations.
This article is part of the special issue “Tsunamis: from source processes to coastal hazard and warning”. It is not associated with a conference.
We would like to acknowledge two anonymous referees for having reviewed this paper, providing constructive comments which helped to improve its quality.
This research has been supported by New Zealand's Strategic Science Investment Fund (SSIF).
This paper was edited by Fabrizio Romano and reviewed by two anonymous referees.
Albrecht, N. and Vennell, R.: Tides in two constricted New Zealand lagoons, New Zealand, J. Mar. Freshw. Res., 41, 103–118, https://doi.org/10.1080/00288330709509899, 2007.
Amante, C. and Eakins, B. W.: ETOPO1 1 Arc-Minute Global Relief Model: Procedures, Data Sources and Analysis, NOAA Technical Memorandum NESDIS NGDC-24, National Geophysical Data Center, NOAA [data set], https://doi.org/10.7289/V5C8276M, 2009.
Bilek, S. L. and Lay, T.: Rigidity variations with depth along interpolate megathrust faults in subduction zones, Nature, 400, 443–446, https://doi.org/10.1038/22739, 1999.
Blaser, L., Krüger, F., Ohrnberger, M., and Scherbaum, F.: Scaling relations of earthquake source parameter estimates with special focus on subduction environment, B. Seismol. Soc. Am., 100, 2914–2926, https://doi.org/10.1785/0120100111, 2010.
Bye, J. A. T. and Heath, R. A.: The New Zealand semi-diurnal tide, J. Mar. Res., 33, 423–442, 1975.
Calmant, S., Pelletier, B., Bevis, M., Taylor, F., Lebellegard, P., and Phillips, D.: New insights on the tectonics of the New Hebrides subduction zone based on GPS results, J. Geophys. Res., 108, 2319–2340, https://doi.org/10.1029/2001JB000644, 2003.
Cleveland, K. M., Ammon, C. J., and Lay, T.: Large earthquake processes in the northern Vanuatu subduction zone, J. Geophys. Res.-Sol. Ea., 119, 8866–8883, https://doi.org/10.1002/2014JB011289, 2014.
Dziewonski, A. M., Chou, T.-A., and Woodhouse, J. H.: Determination of earthquake source parameters from waveform data for studies of global and regional seismicity, J. Geophys. Res., 86, 2825–2852, https://doi.org/10.1029/JB086iB04p02825, 1981.
Ekström, G., Nettles, M., and Dziewonski, A. M.: The global CMT project 2004–2010: Centroid-moment tensors for 13,017 earthquakes, Phys. Earth Planet. Inter., 200–201, 1–9, https://doi.org/10.1016/j.pepi.2012.04.002, 2012.
Engdahl, E. R. and Villasenor, A.: Global Seismicity: 1900–1999, in: International Handbook of Earthquake and Engineering Seismology, edited by: Lee, W. H. K., Kanamori, H., Jennings, P. C., and Kisslinger, C., part A, GNS Library, 665–690, https://www.sciencedirect.com/bookseries/international-geophysics/vol/81/part/PA (last access: 24 January 2023), 2002.
Fry, B., McCurrach, S.-J., Gledhill, K., Power, W., Williams, M., Angove, M., Arcas, D., and Moore, C.: Sensor network warns of stealth tsunamis, EOS, 101, https://doi.org/10.1029/2020EO144274, 2020.
GEBCO Bathymetric Compilation Group 2021: The GEBCO_2021 Grid – a continuous terrain model of the global oceans and land, NERC EDS British Oceanographic Data Centre NOC [data set], https://doi.org/10.5285/c6612cbe-50b3-0cff-e053-6c86abc09f8f, 2021.
GNS Science: NZ Deep-ocean Assessment and Reporting of Tsunami (DART) Data set, GNS Science [data set], https://doi.org/10.21420/8TCZ-TV02, 2020.
Green, R. H., Lowe, R. J., and Buckley, M. L.: Hydrodynamics of a tidally forced coral reef atoll, J. Geophys. Res.-Oceans, 123, 7084–7101, https://doi.org/10.1029/2018JC013946, 2018.
Gusman, A. R., Murotani, S., Satake, K., Heidarzadeh, M., Gunawan, E., Watada, S., and Schurr, B.: Fault slip distribution of the 2014 Iquique, Chile, earthquake estimated from ocean-wide tsunami waveforms and GPS data, Geophys. Res. Lett., 42, 1053–1060, https://doi.org/10.1002/2014GL062604, 2015.
Gusman, A. R., Mulia, I. E., Satake, K., Watada, S., Heidarzadeh, M., and Sheehan, A. F.: Estimate of tsunami source using optimized unit sources and including dispersion effects during tsunami propagation: The 2012 Haida Gwaii earthquake, Geophys. Res. Lett., 43, 9819–9828, https://doi.org/10.1002/2016GL070140, 2016.
Gusman, A. R., Roger, J., Power, W., Fry, B., and Kaneko, Y.: The 2021 Loyalty Island earthquake (Mw 7.7): tsunami waveform inversion and implications for tsunami forecasting for New Zealand, Earth Space Sci., 9, e2022EA002346, https://doi.org/10.1029/2022EA002346, 2022.
Gutenberg, B.: Great Earthquakes, 1896–1903, Trans. Am. Geophys. Soc., 37, 608–614, https://doi.org/10.1029/TR037i005p00608, 1956.
Hayes, G.: A comprehensive subduction zone geometry model, U.S. Geological Survey data release, https://doi.org/10.5066/F7PV6JNV, 2018.
Hanks, T. C. and Kanamori, H.: A moment-magnitude scale, J. Geophys. Res., 84, 2348–2350, https://doi.org/10.1029/JB084iB05p02348, 1979.
Ho, T.-C., Satake, K., and Watada, S.: Improved phase corrections for transoceanic tsunami data in spatial and temporal source estimation: application to the 2011 Tohoku earthquake, J. Geophys. Res.-Sol. Ea., 122, 10155–10175, https://doi.org/10.1002/2017JB015070, 2017.
Ioualalen, M., Pelletier, B., and Solis Gordillo, G.: Investigating the March 28th 1875 and the September 20th 1920 earthquakes/tsunamis of the Southern Vanuatu arc, offshore Loyalty Islands, New Caledonia, Tectonophysics, 709, 20–38, https://doi.org/10.1016/j.tecto.2017.05.006, 2017.
Ji, C., Wald, D. J., and Helmberger, D. V.: Source description of the 1999 Hector Mine, California earthquake; Part I: Wavelet domain inversion theory and resolution analysis, B. Seism. Soc. Am., 92, 1192–1207, https://doi.org/10.1785/0120000916, 2002.
Kowalik, Z. and Proshutinsky, A.: Tsunami-tide interactions: A Cook Inlet case study, Cont. Shelf Res., 30, 633–642, https://doi.org/10.1016/j.csr.2009.10.004, 2010.
Kowalik, Z., Proshutinsky, T., and Proshutinsky, A.: Tide-tsunami interactions, Sci. Tsunami Hazards, 24, 242–256, 2006.
Kubota, T., Saito, T., Chikasada, N. Y., and Suzuki, W.: Ultrabroadband seismic and tsunami wave observation of high-sampling ocean-bottom pressure gauge covering periods from seconds to hours, Earth Space Sci., 7, e2020EA001197, https://doi.org/10.1029/2020EA001197, 2020.
LINZ Data Service: https://www.linz.govt.nz/sea/tides/sea-level-data/sea-level-data-downloads, last access: 24 January 2023.
Liu, P. L. F., Cho, Y.-S., Briggs, M. J., Synolakis, C. E., and Kanoglu, U.: Runup of solitary waves on a circular island, J. Fluid Mech., 302, 259–285, https://doi.org/10.1017/S0022112095004095, 1995.
Louat, R. and Baldassari, C.: Chronology of felt earthquakes and tsunamis in the region Vanuatu New Caledonia (1729–1989), Rapports Scientifiques et Techniques, Sciences de la Terre, Géophysique, no. 1, https://horizon.documentation.ird.fr/exl-doc/pleins_textes/divers08-01/27091.pdf (last access: 24 January 2023), 1989.
Louat, R. and Pelletier, B.: Seismotectonics and present-day relative plate motions in the New Hebrides - North Fiji basin region, Tectonophysics, 167, 41–55, https://doi.org/10.1016/0040-1951(89)90293-X, 1989.
Lowe, R. J., Leon, A. S., Symonds, G., Falter, J. L., and Gruber, R.: The intertidal hydraulics of tide-dominated reef platforms, J. Geophys. Res.-Oceans, 120, 4845–4868, https://doi.org/10.1002/2015JC010701, 2015.
Luis, J. F.: Mirone: a multi-purpose tool for exploring grid data, Comput. Geosci., 33, 31–41, https://doi.org/10.1016/j.cageo.2006.05.005, 2007.
Mortimer, N. and Scott, J. M.: Volcanoes of Zealandia and the Southwest Pacific, New Zeal. J. Geol. Geop., 63, 371–377, https://doi.org/10.1080/00288306.2020.1713824, 2020.
Mortimer, N., Campbell, H. J., Tulloch, A. J., King, P. R., Stagpoole, V. M., Wood, R. A., Rattenbury, M. S., Sutherland, R., Adams, C. J., Collot, J., and Seton, M.: Zealandia: Earth's hidden continent, GSA Today, 27, 27–35, https://doi.org/10.1130/GSATG321A.1, 2017.
Munger, S. and Cheung, K. F.: Resonance in Hawaii waters from the 2006 Kuril Islands tsunami, Geophys. Res. Lett., 35, L07605, https://doi.org/10.1029/2007GL032843, 2008.
Okada, Y.: Surface deformation due to shear and tensile fault in a half-space, B. Seism. Soc. Am., 75, 1135–1154, https://doi.org/10.1785/BSSA0750041135, 1985.
Pelletier, B., Calmant, S., and Pillet, R.: Current tectonics of the Tonga-New Hebrides region, Earth Planet. Sci. Lett., 164, 263–276, https://doi.org/10.1016/S0012-821X(98)00212-X, 1998.
Poulain, P.-M. and Centurioni, L.: Direct measurements of World Ocean tidal currents with surface drifters, J. Geophys. Res.-Oceans, 120, 6986–7003, https://doi.org/10.1002/2015JC010818, 2015.
Power, W., Wallace, L., Wang, X., and Reyners, M.: Tsunami hazard posed to New Zealand by the Kermadec and Southern New Hebrides Subduction Margins: An assessment based on plate boundary kinematics, interseismic coupling, and historical seismicity, Pure Appl. Geophys., 169, 1–36, https://doi.org/10.1007/s00024-011-0299-x, 2012.
Richter, C. F.: Elementary Seismology, W.H. Freeman, San Francisco, CA, 768 pp., https://doi.org/10.1111/j.2153-3490.1959.tb00030.x, 1958.
Roeber, V., Yamazaki, Y., and Cheung, K. F.: Resonance and impact of the 2009 Samoa tsunami around Tutuila, American Samoa, Geophys. Res. Lett., 37, L21604, https://doi.org/10.1029/2010GL044419, 2010.
Roger, J.: Digital Elevation Model of Norfolk Island and Sydney Bay, Australia, GNS Science [data set], https://doi.org/10.21420/H889-5393, 2022.
Roger, J., Pelletier, B., and Aucan, J.: Update of the tsunami catalogue of New Caledonia using a decision table based on seismic data and marigraphic records, Nat. Hazards Earth Syst. Sci., 19, 1471–1483, https://doi.org/10.5194/nhess-19-1471-2019, 2019a.
Roger, J., Aucan, J., Pelletier, B., Lebellegard, P. and Lefèvre, J.: The December 5, 2018 Mw 7.5 earthquake on the south Vanuatu subduction zone: numerical modelling and development of a scenario database for New Caledonia tsunami hazard assessment, European Geosciences Union, Vienna, Austria, 7–12 April 2019, Geophys. Res. Abstr., 21, EGU2019-3210, https://meetingorganizer.copernicus.org/EGU2019/EGU2019-3210.pdf (last access: 24 January 2023), 2019b.
Roger, J., Pelletier, B., Duphil, M., Lefèvre, J., Aucan, J., Lebellegard, P., Thomas, B., Bachelier, C., and Varillon, D.: The Mw 7.5 Tadine (Maré, Loyalty Islands) earthquake and related tsunami of 5 December 2018: seismotectonic context and numerical modeling, Nat. Hazards Earth Syst. Sci., 21, 3489–3508, https://doi.org/10.5194/nhess-21-3489-2021, 2021.
Sahal, A., Pelletier, B., Chatelier, J., Lavigne, F., and Schindelé, F.: A catalog of tsunamis in New Caledonia from 28 March 1875 to 30 September 2009, C. R. Geosci., 342, 437–444, https://doi.org/10.1016/j.crte.2010.01.013, 2010.
Strasser, F. O., Arango, M. C., and Bommer, J. J.: Scaling of the source dimensions of interface and intraslab subduction-zone earthquakes with moment magnitude, Seismol. Res. Lett., 81, 941–950, https://doi.org/10.1785/gssrl.81.6.941, 2010.
Thomas, C. and Burbidge, D.: A Probabilistic Tsunami Hazard Assessment of the Southwest Pacific Nations, Geoscience Australia Professional Opinion, No. 2009/02, 60 pp. Re-released in 2011, http://www.ga.gov.au/webtemp/image_cache/GA20154.pdf (last access: 24 January 2023), 2009.
Thomson, R. E., Rabinovich, A. B., and Krassovski, M. V.: Double jeopardy: Concurrent arrival of the 2004 Sumatra tsunami and storm-generated waves on the Atlantic coast of the United States and Canada, Geophys. Res. Lett., 34, L15607, https://doi.org/10.1029/2007GL030685, 2007.
Tinti, S. and Vannini, C.: Tsunami trapping near circular islands, Pure Appl. Geophys., 144, 595–619, https://doi.org/10.1007/BF00874385, 1995.
Tolkova, E., Tanaka, H., and Roh, M.: Tsunami observations in rivers from a perspective of tsunami interaction with tide and riverine flow, Pure Appl. Geophys., 172, 953–968, https://doi.org/10.1007/s00024-014-1017-2, 2015.
U.S. Geological Survey: https://earthquake.usgs.gov, last access: 24 January 2023.
VLIZ/IOC: Sea level station monitoring facility, VLIZ (Flanders Marine Institute)/IOC (Intergovernmental Oceanographic Commission) [data set], https://doi.org/10.14284/482, 2021.
Wang, X.: Numerical modelling of surface and internal waves over shallow and intermediate water, PhD Thesis, Ithaca (NY), Cornell University, 245 pp., ISBN 9780549969846, https://newcatalog.library.cornell.edu/catalog/8294421 (last access: 26 January 2023), 2008.
Wang, X. and Power, W.: COMCOT: a tsunami generation, propagation and run-up model, GNS Science Report, 2011/43, GNS Science, Lower Hutt, New Zealand, 121 pp., https://shop.gns.cri.nz/sr_2011-043-pdf (last access: 26 January 2023), 2011.
Wang, X., Holden, C., Power, W., Liu, Y., and Mountjoy, J.: Seiche effects in Lake Tekapo, New Zealand, in an Mw 8.2 Alpine Fault earthquake, Pure Appl. Geophys., 177, 5927–5942, https://doi.org/10.1007/s00024-020-02595-w, 2020.
Watada, S., Kusumoto, S., and Satake, K.: Traveltime delay and initial phase reversal of distant tsunamis coupled with the self-gravitating elastic Earth, J. Geophys. Res.-Sol. Ea., 119, 4287–4310, https://doi.org/10.1002/2013JB010841, 2014.
Wessel, P., Luis, J. F., Uieda, L., Scharroo, R., Wobbe, F., Smith, W. H. F., and Tian, D.: The Generic Mapping Tools Version 6, Geochem. Geophy. Geosy., 20, 5556–5564, https://doi.org/10.1029/2019GC008515, 2019.
Ye, L., Gong, W., Lay, T., Kanamori, H., and Chen, X.: Shallow Megathrust Rupture during the 10 February 2021 Mw 7.7 Southeast Loyalty Islands Earthquake Sequence, The Seismic Record, 1, 154–163, https://pubs.geoscienceworld.org/ssa/tsr/article/1/3/154/610047/Shallow-Megathrust-Rupture-during-the-10-February (last access: 26 January 2023), 2021.
Zhang, Y. J., Witter, R. C., and Priest, G. R.: Tsunami-tide interaction in 1964 Prince William Sound tsunami, Ocean Model., 40, 246–259, https://doi.org/10.1016/j.ocemod.2011.09.005, 2011.
Zheng, J., Fu, D., and Wang, G.: Trapping mechanisms for long waves over circular islands with power function profiles, J. Ocean Univ. China, 16, 655–660, https://doi.org/10.1007/s11802-017-3404-7, 2017.
- Abstract
- Introduction
- Seismotectonic context
- Case study: the 10 February 2021 earthquake and tsunami
- Tsunami numerical simulation
- Discussion
- Conclusion
- Data availability
- Author contributions
- Competing interests
- Disclaimer
- Special issue statement
- Acknowledgements
- Financial support
- Review statement
- References