the Creative Commons Attribution 4.0 License.
the Creative Commons Attribution 4.0 License.
 | 15 Dec 2023
Wind as a natural hazard in Poland
Tadeusz Chmielewski
Piotr A. Bońkowski
The paper deals with wind speeds of extreme wind events in Poland and the descriptions of their effects. Two recent estimations developed by the Institute of Meteorology and Water Management in Warsaw and by Halina Lorenc (a previous co-worker of the institute) are presented here. Their strong and weak points are briefly described. The 37 annual maximum gusts of wind speeds measured at all meteorological stations between 1971 and 2007 are analysed by an extremal probability paper, block-maxima (BM), and peak-over-threshold (OVT) approaches. Based on the measured and estimated wind speeds (taken from existing literature), the authors suggest new estimations for extreme winds that may occur in Poland. Shortly, Poland will construct important structures, such as a central air terminal and (some) nuclear power plants, so knowledge about extreme winds in our country is significant for engineers who will design these structures.
- Article
(453 KB) - Full-text XML
- BibTeX
- EndNote


The wind is the dominant environmental load affecting structural design in the world (e.g. Krishna, 1995; Goliger et al., 2013). In many countries, including in Poland, it is responsible for damage to ecosystems (Pawlik and Harrison, 2022; Pettit et al., 2021) and structures (Unanwa et al., 2000; Chmielewski et al., 2020). Moreover, hurricanes and tornadoes can cause economic losses and have a negative impact on society (Fricker, 2020; Kafi et al., 2021). Also, in Poland, wind storms such as synoptic wind storms, thunderstorms, and downslope winds in the Tatra and Karkonosze (in English, Giant Mountains) mountain regions; tornadoes; downbursts; and derechos are the leading causes of economic loss (see, for example, damage model for Europe by Koks and Haer, 2020).
From an engineering perspective, it is important to consider rare and extreme events to design critical infrastructure. Properly estimating these extreme events and analysing their effects on structures and infrastructure are still current research issues. Examples of such analyses for the European region can be found in the paper by Outten and Sobolowski (2021), who used EURO-CORDEX regional climate models; in the paper by Della-Marta et al. (2009), who used ERA-40 reanalysis data; or in the paper by Taszarek et al. (2020a, b), who used, for example, the European Severe Weather Database (ESWD) for their analyses.
The recent estimation of the wind speed for all types of wind events was developed by Lorenc (2012). Five names were proposed for gust wind speeds ranging from 11 to 32 m s−1 at 10 m above ground: gusty wind, violent wind, storm, strong wind, and hurricane wind. They are not used in everyday life, and this paper's authors oppose this proposal (for example, no tropical storms occur in Poland; i.e. there are no hurricanes). The authors' study of maximum wind speeds in Poland is based on a set of annual maximum gust wind speeds measured at 39 meteorological stations from 1971 to 2010 (40 years), tornado reports collected from 1899 to 2019 (120 years), and estimation of wind speeds of derechos and recent tornadoes in Poland (Polish Government Centre for Security, 2013; Chmielewski et al., 2013, 2020; Taszarek and Brooks, 2015). Based on the available data, the authors' proposals for maximum wind speeds in Poland are given in Tables 2 and 3.
The case study of estimating intense and extreme wind speeds in Poland based on the measured and estimated wind speeds is analysed in Sect. 3. In Sect. 4, a new radical wind estimation is proposed. Shortly, Poland will construct some critical structures, such as a central air terminal and (some) nuclear power plants.
Poland is located in the centre of Europe between the Baltic Sea in the north and the mountain ranges of the Carpathians and Sudetes in the south. So, two types of climatic conditions prevail, i.e. the continental and coastal. The country is generally flat and situated 200 or 300 m above sea level. Five different types of wind events may be identified in Poland. They are western or north-western extratropical cyclones; downslope winds in the Tatra and Karkonosze mountain regions (foehn winds); thunderstorms; tornadoes which belong to the most devastating wind events, as described in Chmielewski et al. (2013); and derechos, an example of such an event is described in the paper of Chmielewski et al. (2020).
Two classifications of weak and strong winds exist in Poland. The first was performed by the Institute of Meteorology and Water Management (IMWM) (only for weak and strong winds and not for extreme winds such as tornadoes or derechos) (Polish Government Centre for Security, 2013; IMWM, 2023). Three threats were considered for three different wind speeds with a description of the effects of the wind action as follows: first-degree threat – Vav>15 m s−1 or V>20 m s−1, damage to buildings, roofs, damage to trees, breaking branches and trees, and traffic difficulties; second-degree threat – Vav>20 m s−1 or V>25 m s−1, damage to buildings and roofs, breaking and uprooting trees, difficulties in communication, and damage to overhead lines; and third-degree threat – Vav>25 m s−1 or V>35 m s−1, destroying buildings, tearing off roofs, destroying overhead lines, large damage to trees, significant difficulties in communication, and being life-threatening.
The second classification was proposed by Lorenc (2012), a co-worker at the Institute of Meteorology and Water Management. This proposal comprises eight classes in the range of wind speeds from 11 to more than 251 m s−1, with a damage description for each class. These classes are as follows: gusty wind, violent wind, storm, strong wind, hurricane wind, hurricane/tornado first degree, very strong hurricane/tornado second degree, and destructive hurricane/tornado third degree. As the Introduction mentions, this proposal is not used in everyday life. The authors of this study are opposed to this proposal. We do not have tropical storms in Poland; therefore, the name hurricane should not be used.
3.1 Yearly maximum wind speeds measured at the meteorological stations in Poland
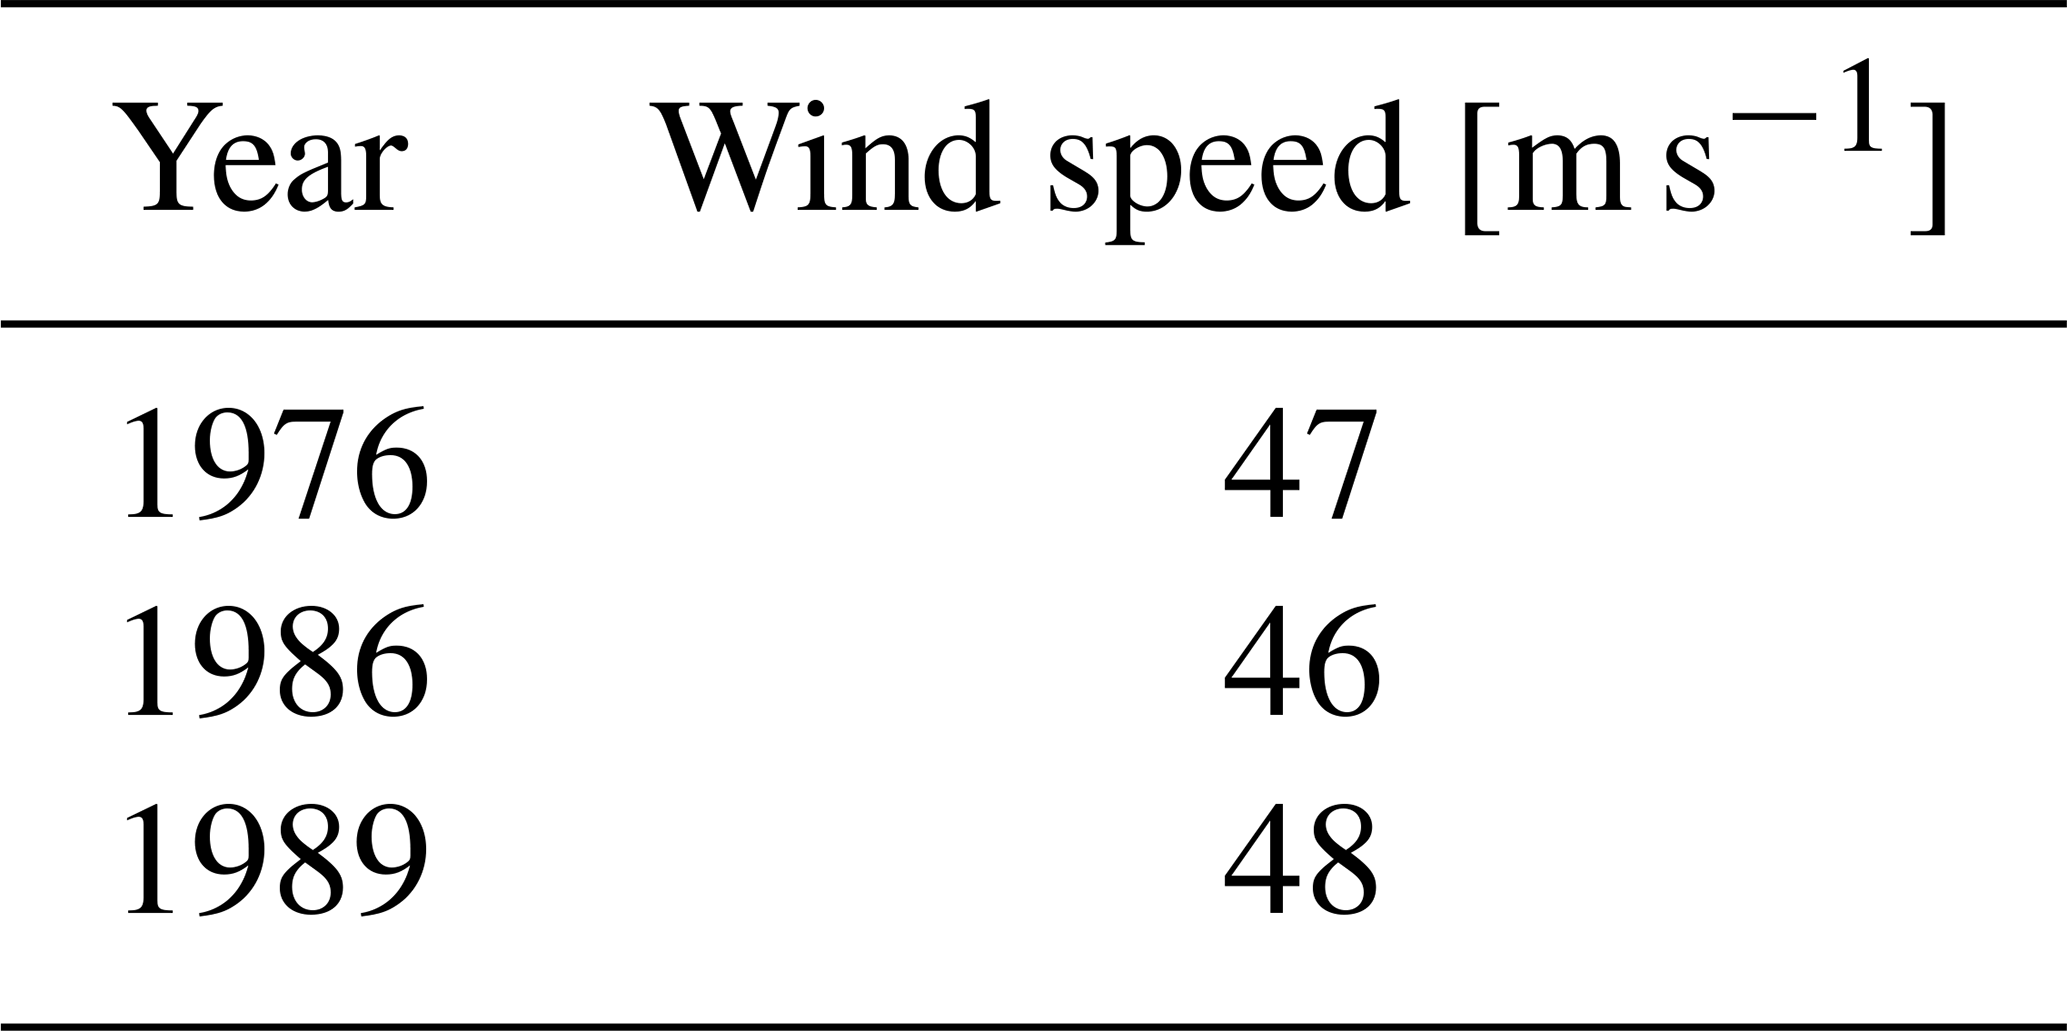
To analyse the return period of extreme wind speeds, wind speed records in gusts measured in 1971 to 2010+ were used. These extreme winds were in the range of 25–40 m s−1, with extreme values recorded on 6 November 1986 at Bielsko-Biała of 48 m s−1, on 1 December 1975 at Zakopane of 47 m s−1, on 21 October 1986 at Kalisz of 46 m s−1, on 8 February 1990 at Łeba of 44 m s−1, and on 4 December 1999 at Hel of 41 m s−1. The sample data set of annual maximum wind speeds in metres per second is as follows {25, 26, 26, 27, 27, 29, 29, 30, 30, 31, 31, 32, 32, 33, 34, 34, 34, 34, 35, 36, 36, 37, 37, 37, 37, 38, 38, 38, 39, 39, 40, 41, 43, 44, 46, 47, 48}.
For the above data set, three approaches have been applied to identify and model the extrema: the Gumbel extremal probability paper, the block-maxima approach where the extrema follow a generalised extreme-value distribution (BM-GEV), and the peak-over-threshold approach that fits the extrema in the generalised Pareto distribution (POT-GPD).
3.2 The extremal probability paper
In Fig. 1, a total of 37 annual maximum gust wind speeds measured at all meteorological stations during 1971–2007 (Lorenc, 2012) are plotted on the Gumbel probability paper. The red line indicates the regression line fitted to the data with the following coefficients: un=32.4 and . The regression line fits the measured data well, meaning that the random phenomenon of extremal wind speed described at this point can be modelled with a log-normal distribution, also known as the Gumbel distribution, which is an extreme-value distribution.
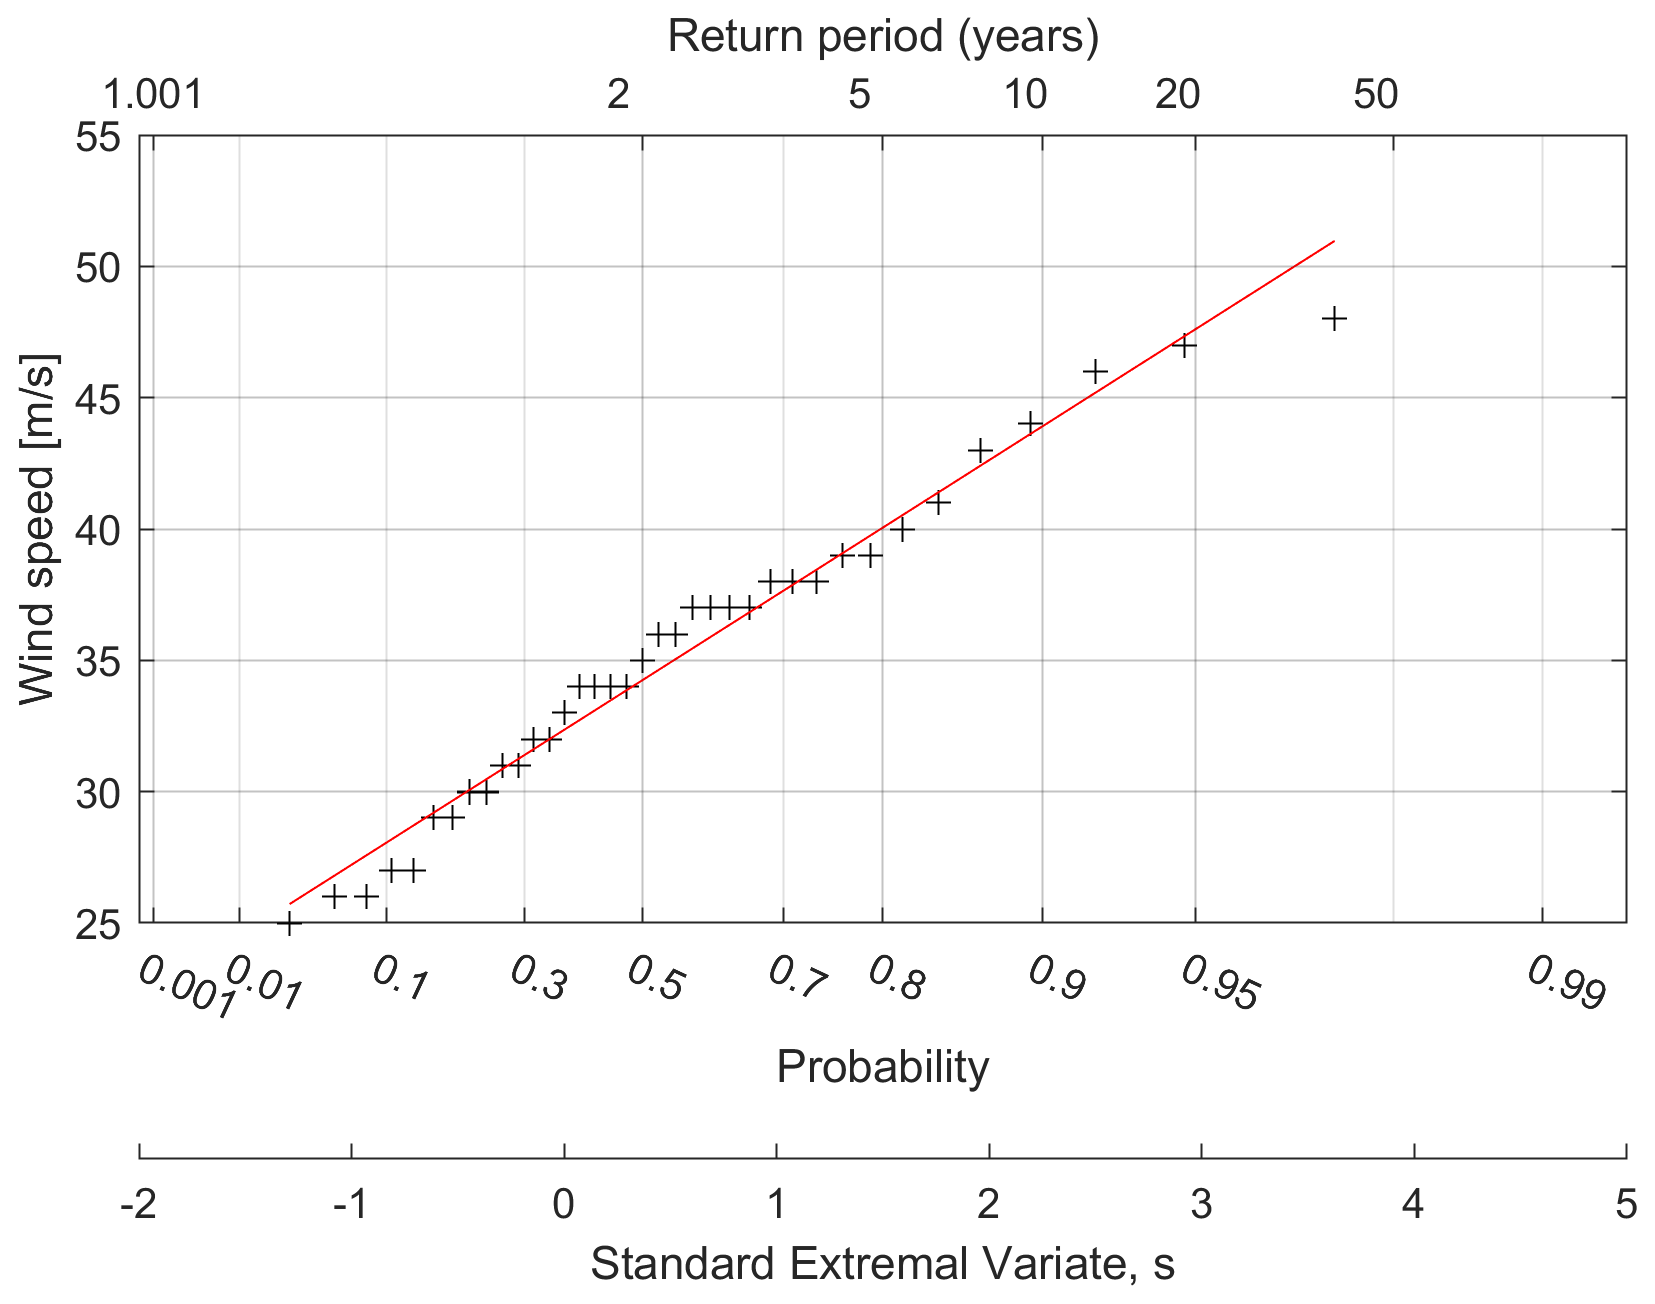
From the straight-line graph, the probability associated with annual wind speeds in Poland for a given value can be read directly. For example, the annual probabilities of gust wind speeds exceeding magnitudes of 30 and 40 m s−1 are as follows: ; . The return period for wind speeds greater than 45 m s−1 can be easily estimated. For example, the 50-year return period corresponds to and wind speed m s−1. The authors would like to remark that the analysis is based on historical data. However, some studies predict an increased frequency of severe wind occurrence (Rädler et al., 2019) and changes in the gust field due to climate change (Schwierz et al., 2010), which may influence current return period predictions.
3.3 The block-maxima method
The block-maxima method analysis has been done using the following steps. After the division of our data set into non-overlapping blocks of six elements (for the two first blocks) or five elements (for the rest blocks), we obtained new block maxima as follows: {39, 47, 48, 44, 36, 38, 43}. The statistical Python software scipy.stats (Virtanen et al., 2020) was used in the inverse cumulative distribution function (genextreme.ppf function) to fit the generalised extreme value. It resulted in the following distribution parameters: shape (ξ), 1.1276862002991992; location (μ), 42.75887436787345; scale (σ), 5.910345049383524. With this method, the following wind speeds were obtained for 10-, 20-, and 50-year return periods: 10-year return level, 47.59 m s−1; 20-year return level, 47.82 m s−1; and 50-year return level, 47.94 m s−1.
3.4 The peak-over-threshold method
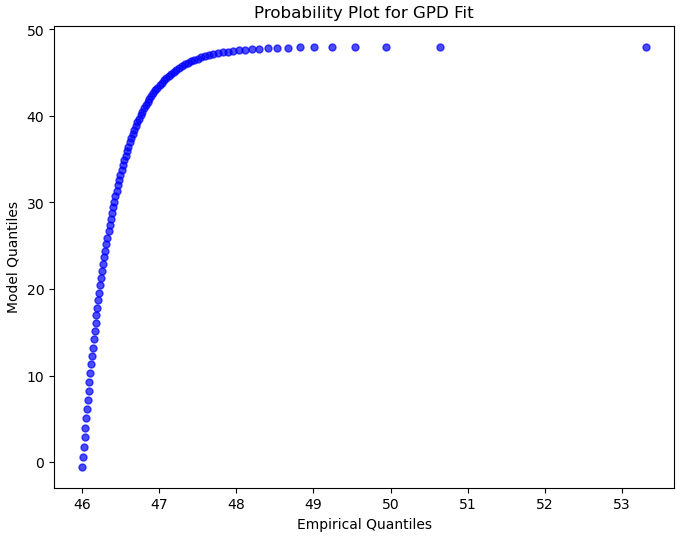
The peak-over-threshold method analysis has been done using the following steps. In the first step, we must choose a threshold above which we consider data points extreme events. Let the threshold be 45 m s−1. This method uses values that exceed a certain threshold to define extreme events. This threshold was set at 45 m s−1, which left us with three values that exceeded it, presented in Table 1.
Then, following the assumption that the exceedances follow the generalised Pareto distribution (GPD), these values were used to determine the parameters of the Pareto distribution by applying the genpareto.fit function of the scipy.stats Python library. With these parameters established, the inverse cumulative distribution function (genpareto.ppf function) was used to make long-term predictions and create a distribution plot (Fig. 2). It resulted in the following distribution parameters: shape parameter (ξ), −2.372618164968692; location parameter (μ), −0.6502177076262381; and scale parameter (σ), 115.42839026279556. The following wind speeds were obtained for 10-, 20- and 50-year return periods: 10-year return level, 47.79 m s−1; 20-year return level, 47.96 m s−1; and 50-year return level, 48.00 m s−1.
Comparing these three approaches gives similar results for a 50-year return period of around 50 m s−1. From the analysis, it is predicted that 10-, 20-, and 50-year wind yields a similar threat to that of P2 (Table 3), according to the proposed new classification described in the next section.
3.5 Estimated wind speeds of tornadoes and derechos
To further analyse possible extreme wind speeds in Poland, an estimation of wind speeds using observation of damage caused by tornadoes and derechos can be used. Taszarek and Brooks (2015) described the updated climatology of tornadoes in Poland and the significant problems related to the database. A total of 269 tornado cases derived from the European Severe Weather Database were used in the analysis, and the tornadoes were divided according to their strengths. On average, 8–14 tornadoes (including two to three waterspouts) with two strong tornadoes occur yearly, and one violent tornado occurs every 12–19 years. Cases of strong and even violent tornadoes that cause death indicate that the possibility of a large-fatality tornado in Poland cannot be ignored.
Table 2Classification of the levels of threats caused by strong wind by authors (based on IMWM, 2023).
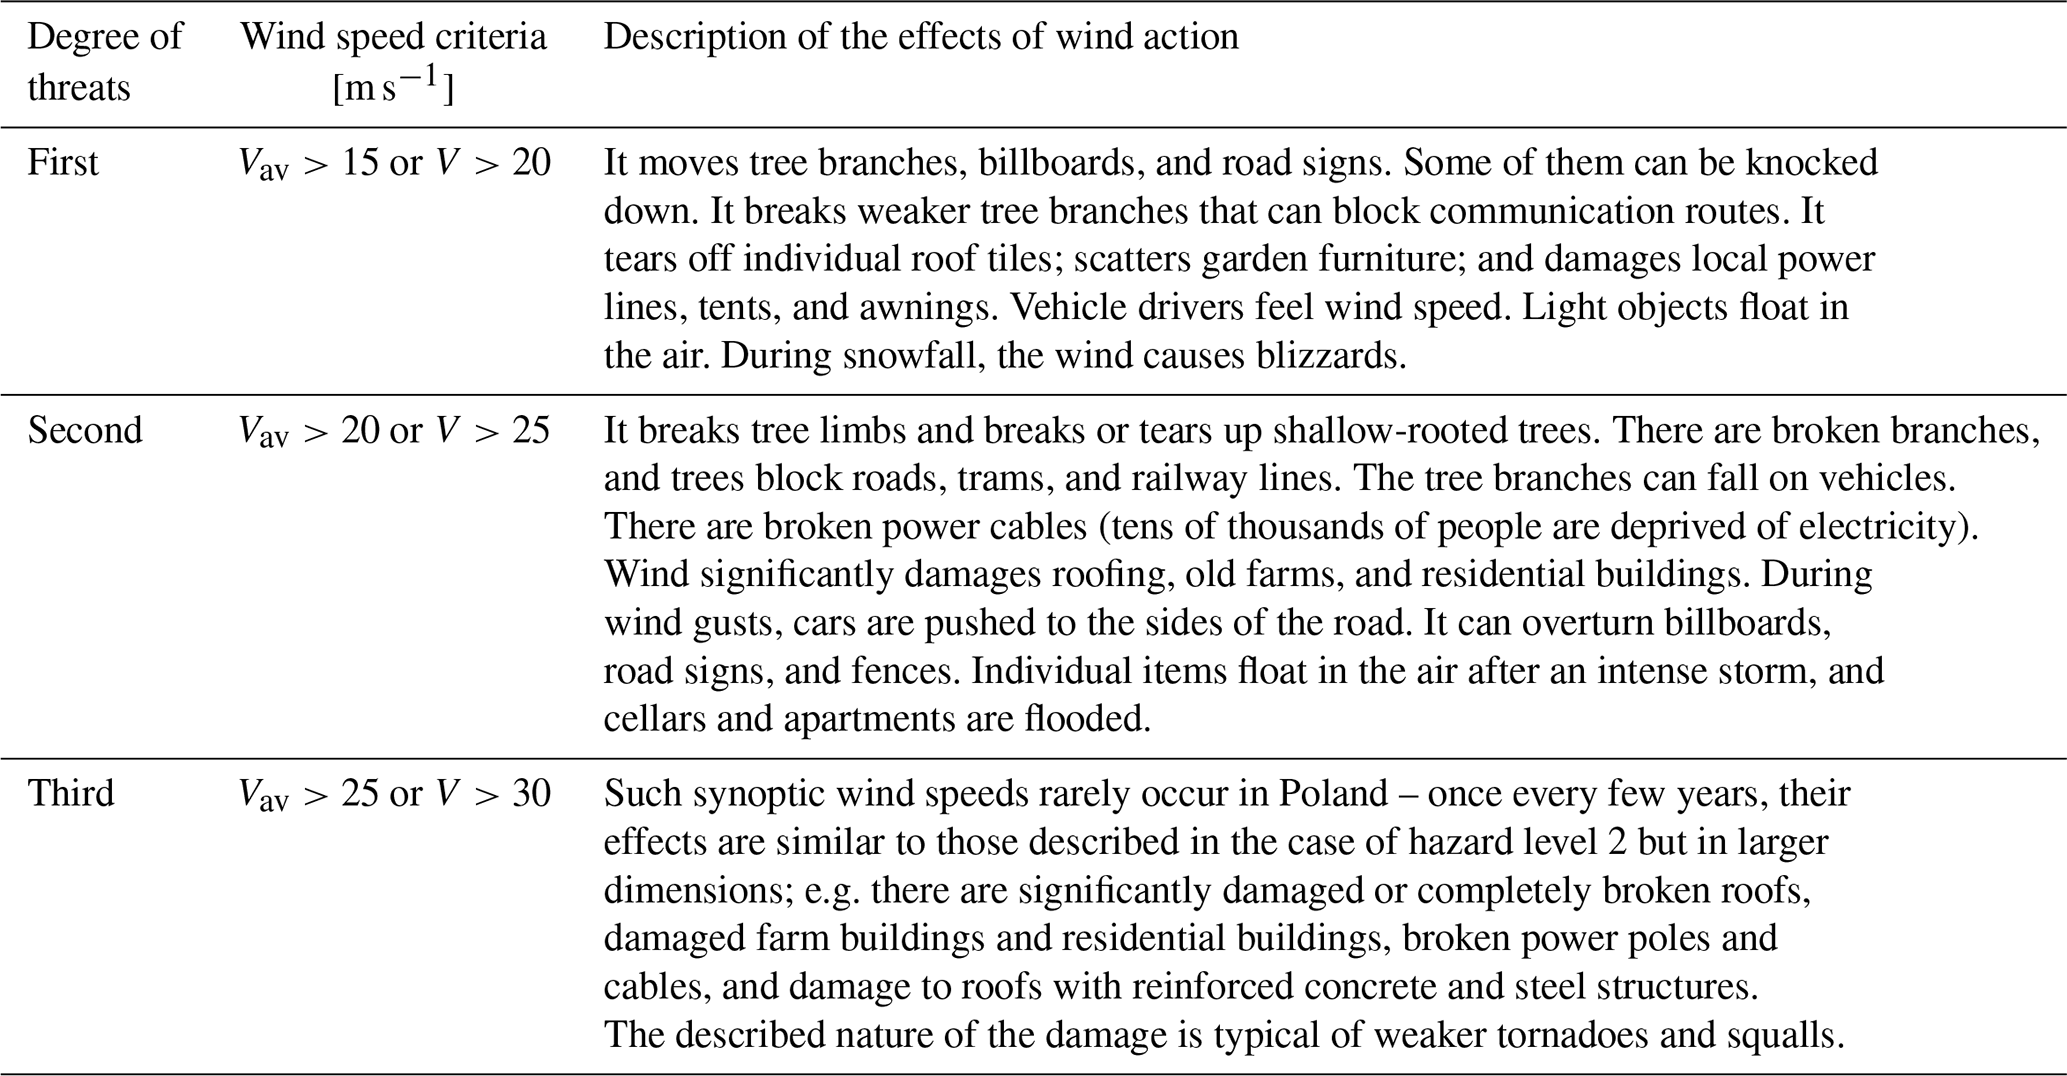
Vav – mean wind speed. V – gust wind speed.
The estimated extreme wind speeds of tornadoes and derechos were based on recent works using two case studies of these phenomena, which have occurred in Poland (e.g. Chmielewski et al., 2013, 2020). In the first case, i.e. on 15 August 2008, a tornado caused severe damage in the three following provinces of Poland: Opole, Silesia, and Łódź. Along the 105 km path, 1624 buildings were damaged, 4 people were killed, 60 people were injured, and some livestock were killed. Two approaches were used to estimate the tornado's wind speed. The first one was based on a comparison of the examined damage caused by the tornado in the affected area with TORRO (tornado intensity scale). The second approach is based on the structural analysis of the destroyed freestanding structures. Three road signs, which were bent while the tornado passed, were examined in these studies. In the first approach, wind speeds were estimated in the range of 52–72 m s−1 at a reference height of 10 m. In the second approach, the wind speed was approximately 71 m s−1 at 2.3 m above the ground.
In the second case, a strong thunderstorm occurred on 11–12 August 2017, resulting in catastrophic damage in three provinces in Poland: Wielkopolskie (in English, Greater Poland), Kujawsko–Pomorskie (in English, Kuyavian–Pomeranian), and Pomorskie (in English, Pomeranian). This disaster resulted in the deaths of six people, the injuring of several dozen others, and enormous property losses. The event has been described and analysed in a previous study (Chmielewski et al., 2020). A house with its roof blown off is an excellent example of wind speed for this derecho. The weight of the roof was calculated based on the rafter framing of the house. By estimating the connection strength between the rafter plates and knee walls, it was possible to calculate the total force required to blow off the roof of the house. Subsequently, the pressure coefficients were obtained from the Tokyo Polytechnic University aerodynamic database. The aerodynamic force acting on the blown-off roof was calculated for the low-rise building with a gable roof because of the similar ratios of length, width, and height. By comparing the aerodynamic force with the total force required to blow off the roof of the house, it was possible to calculate the critical wind speed necessary for the roof to blow off. The critical wind speed is approximately 60 m s−1. It was much larger than wind speeds measured by meteorological stations on the path of the derecho in Chojnice (31.2 m s−1), Gniezno (34.8 m s−1), Chrząstowo (36 m s−1), and Elbląg (42 m s−1).
It is important to note that for both events analysed here, the estimated wind speeds are also higher than extreme wind speeds recorded by meteorological stations in the period 1971 to 2010+. This means that wind speeds predicted for the respective return periods using methods presented in Sect. 3.2–3.4 may be underestimated.
As indicated in Sect. 2, two wind speed classifications exist in Poland. Both of them have some drawbacks; i.e. in the classification used by IMWM (2023), the description of wind effects is not detailed enough and the scale ends at the gust wind speed equal to 32 m s−1, while Lorenc's (2012) classification considers, for example, hurricanes, which do not occur in Poland. For these reasons, the authors suggest a new estimation for strong and extreme winds in Poland based on the observation of their effects.
Table 3Classification of extreme wind speeds. Comparison of the enhanced Fujita (EF) scale (Mehta, 2013) and proposal of the P scale by the authors.
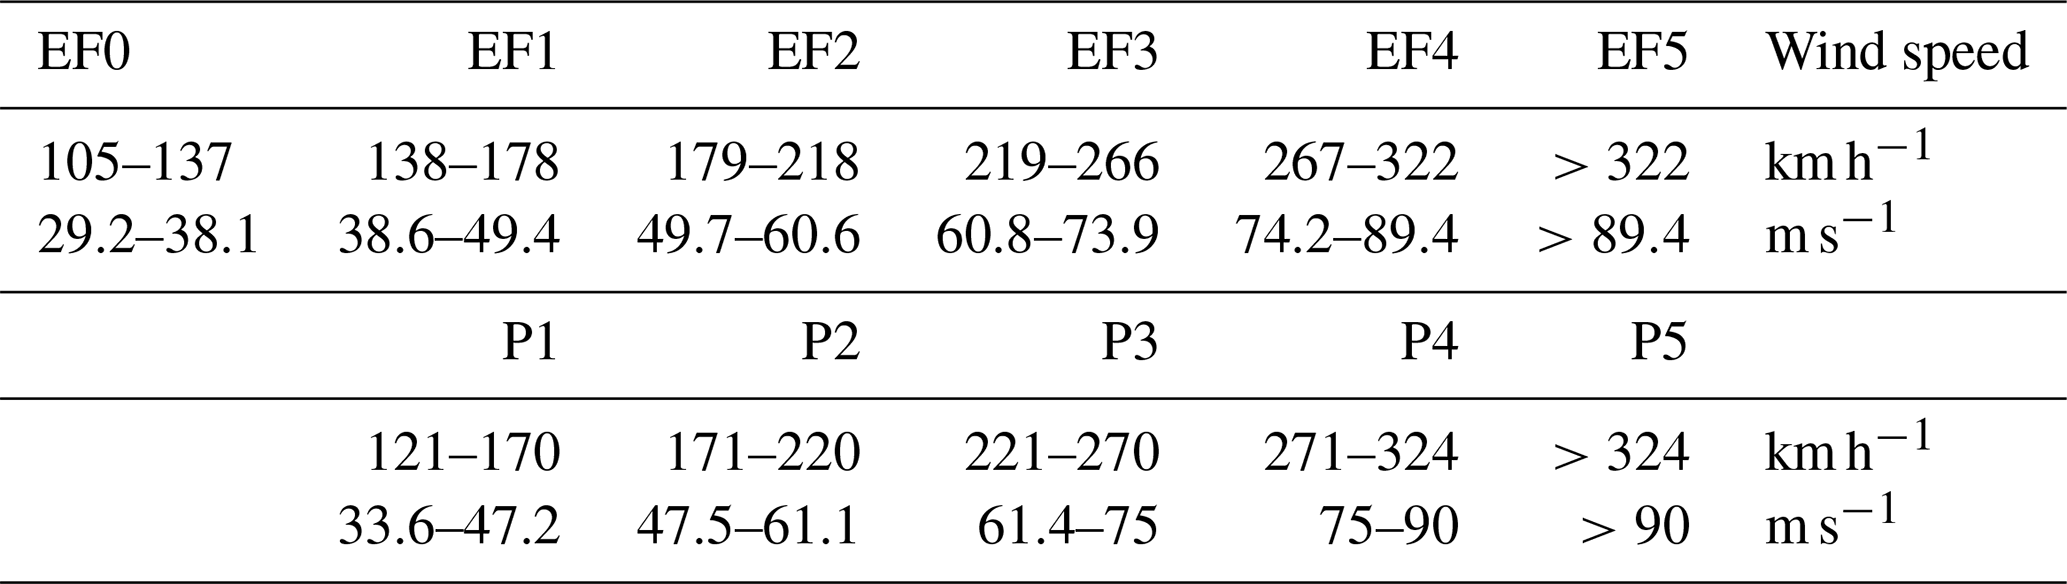
It is assumed that the border between strong and extreme wind is the wind speed of 30 m s−1. For the new estimation, the authors propose Tables 2 and 3. To create Tables 2 and 3, the estimation developed by IMWM and Lorenc and by Fujita (F scale) and Mehta (EF scale) were considered. In Table 2, the first two columns are the same as by IMWM (with V≤30 m s−1 for the third degree). However, the description of the effects of wind action is based on 10 years of the authors' observations of wind damage for particular degree threats after wind events. To consider higher wind speeds, Table 3 for extreme winds is proposed (P scale). It is the modification of the EF scale for tornado intensity developed in the USA (Mehta, 2013). The modification was needed to match wind speeds from Table 2 (especially for EF0 and EF1, into P0 and P1 degrees).
The authors formulated the following conclusions based on the analyses of measured wind speeds and annual maximum wind speeds in Poland in the past and damage observations caused by strong and extreme winds:
- a.
The proposed wind speed estimation has been developed using data available in Poland, as described in Sect. 3. It estimates wind speed for strong winds (Table 2) and extreme winds (Table 3) as tornadoes, derechos, etc.
- b.
The 37 annual maximum gusts of wind speeds measured at all meteorological stations between 1971 and 2007 are analysed by the extremal probability paper, block-maxima (BM), and peak-over-threshold (OVT) methods. The results of these analyses are similar. The 50-year return period for these three methods is around 50 m s−1.
- c.
Two recent extreme wind events in Poland and their wind speeds are summarised. The wind speeds estimated by observing damage caused by them are higher than wind speeds recorded by meteorological stations.
- d.
The authors propose, for synoptic, downslope winds in the Tatra and Karkonosze mountain regions, the estimation of strong winds proposed by IMWM with an improved description of the effects of wind action (Table 2) and adaptation of the EF tornado intensity scale with some modifications to extreme winds presented in Table 3 (the P scale).
As wind is one of the most important loads during structural design, properly estimating wind speed return periods is crucial. In this paper, wind speeds are estimated using recorded data and three methods are compared. Recorded wind speeds, however, are lower than the ones estimated from the observed damage of two extreme events. This indicates that apart from predicted changes in future wind speeds, the wind speeds for respective return periods estimated using only recorded data may be underestimated. This may be important regarding the design of the most important structures in Poland. For this reason, it may be beneficial to include data from the observed damage in future wind speed predictions.
Data and codes can be made available upon request to the corresponding author.
TC: conceptualisation, formal analysis, investigation, methodology, visualisation, writing (original draft preparation), writing (review and editing). PAB: formal analysis, visualisation, writing (review and editing).
The contact author has declared that neither of the authors has any competing interests.
Publisher's note: Copernicus Publications remains neutral with regard to jurisdictional claims made in the text, published maps, institutional affiliations, or any other geographical representation in this paper. While Copernicus Publications makes every effort to include appropriate place names, the final responsibility lies with the authors.
This article is part of the special issue “Natural hazards' impact on natural and built heritage and infrastructure in urban and rural zones”. It is not associated with a conference.
We would like to thank Szymon Chmielewski for his valuable help in the analysis of wind return periods.
This paper was edited by Maria Bostenaru Dan and reviewed by Thanh Cong and one anonymous referee.
Chmielewski, T., Nowak, H., and Walkowiak, K.: Tornado in Poland of August 15, 2008: Results of post-disaster investigation, J. Wind Eng. Indust. Aerodynam., 118, 54–60, https://doi.org/10.1016/j.jweia.2013.04.007, 2013.
Chmielewski, T., Szer, J., and Bobra, P.: Derecho wind storm in Poland on 11–12 August 2017: results of the post-disaster investigation, Environ. Hazards, 19, 508–528, https://doi.org/10.1080/17477891.2020.1730154, 2020.
Della-Marta, P. M., Mathis, H., Frei, C., Liniger, M. A., Kleinn, J., and Appenzeller, C.: The return period of wind storms over Europe, Int. J. Climatol., 29, 437–459, https://doi.org/10.1002/joc.1794, 2009.
Fricker, T.: Evaluating tornado casualty rates in the United States, Int. J. Disast. Risk Reduct., 47, 101535, https://doi.org/10.1016/j.ijdrr.2020.101535, 2020.
Goliger, A., Żuranski, J., Giżejowski, M., Gaczek, M., Retief, J., Kruger, A., Dunaiski, P., Fiszer, S., and Ćwik, M.: Comparative Study Between Poland and South Africa Wind Climates, the Related Damage and Implications of Adopting the Eurocode for Wind Action on Buildings, Arch. Civ. Eng., 59, 51–95, https://doi.org/10.2478/ace-2013-0003, 2013.
IMWM: Highlighted threat thresholds, https://imgw.isok.gov.pl/mapy-zagrozen-i-ryzyka/zagrozenia-meteorologiczne/silny-wiatr/wyroznione-progi-zagrozen.html (last access: 24 October 2023), 2023.
Kafi, K. M., Barau, A. S., and Aliyu, A.: The effects of windstorm in African medium-sized cities: An analysis of the degree of damage using KDE hotspots and EF-scale matrix, Int. J. Disast. Risk Reduct., 55, 102070, https://doi.org/10.1016/j.ijdrr.2021.102070, 2021.
Koks, E. E. and Haer., T.: A high-resolution wind damage model for Europe, Sci. Rep., 10, 6866, https://doi.org/10.1038/s41598-020-63580-w, 2020.
Krishna, P.: Wind loads on low rise buildings – A review, J. Wind Eng. Indust. Aerodynam., 54–55, 383–396, https://doi.org/10.1016/0167-6105(94)00055-I, 1995.
Lorenc, H.: Maximum wind speeds in Poland, Institute of Meteorology and Water Management, Warszawa, ISBN 978-83-61102-62-5, 2012.
Mehta, K. C.: Development of the EF-Scale for Tornado Intensity, J. Disast. Res., 8, 1034–1041, https://doi.org/10.20965/jdr.2013.p1034, 2013.
Outten, S. and Sobolowski, S.: Extreme wind projections over Europe from the Euro-CORDEX regional climate models, Weather Clim. Extrem., 33, 100363, https://doi.org/10.1016/j.wace.2021.100363, 2021.
Pawlik, Ł. and Harrison, S. P.: Modelling and prediction of wind damage in forest ecosystems of the Sudety Mountains, SW Poland, Sci. Total Environ., 815, 151972, https://doi.org/10.1016/j.scitotenv.2021.151972, 2022.
Pettit, J. L., Pettit, J. M., Janda, P., Rydval, M., Čada, V., Schurman, J. S., Nagel, T. A., Bače, R., Saulnier, M., Hofmeister, J., Matula, R., Kozák, D., Frankovič, M., Turcu, D. O., Mikoláš, M., and Svoboda, M.: Both Cyclone-induced and Convective Storms Drive Disturbance Patterns in European Primary Beech Forests, J. Geophys. Res.-Atmos., 126, e2020JD033929, https://doi.org/10.1029/2020JD033929, 2021.
Polish Government Centre for Security: Periodic threats in Poland – update, Warszawa, ISBN 978-83-64979-05-7, 2013.
Rädler, A. T., Groenemeijer, P. H., Faust, E., Sausen, R., and Púčik, T.: Frequency of severe thunderstorms across Europe expected to increase in the 21st century due to rising instability, npj Clim. Atmos. Sci., 2, 30, https://doi.org/10.1038/s41612-019-0083-7, 2019.
Schwierz, C., Köllner-Heck, P., Zenklusen Mutter, E., Bresch, D. N., Vidale, P.-L., Wild, M., and Schär, C.:. Modelling European winter wind storm losses in current and future climate, Climatic Change, 101, 485–514, https://doi.org/10.1007/s10584-009-9712-1, 2010.
Taszarek, M. and Brooks, H. E.: Tornado Climatology of Poland, Mon. Weather Rev., 143, 702–717, https://doi.org/10.1175/MWR-D-14-00185.1, 2015.
Taszarek, M., Allen, J. T., Groenemeijer, P., Edwards, R., Brooks, H. E., Chmielewski, V., and Enno, S.-E.: Severe Convective Storms across Europe and the United States. Part I: Climatology of Lightning, Large Hail, Severe Wind, and Tornadoes, J. Climate, 33, 10239–10261, https://doi.org/10.1175/JCLI-D-20-0345.1, 2020a.
Taszarek, M., Allen, J. T., Púčik, T., Hoogewind, K. A., and Brooks, H. E.: Severe Convective Storms across Europe and the United States. Part II: ERA5 Environments Associated with Lightning, Large Hail, Severe Wind, and Tornadoes, J. Climate, 33, 10263–10286, https://doi.org/10.1175/JCLI-D-20-0346.1, 2020b.
Unanwa, C. O., McDonald, J. R., Mehta, K. C., and Smith, D. A.: The development of wind damage bands for buildings, J. Wind Eng. Indust. Aerodynam., 84, 119–149, https://doi.org/10.1016/S0167-6105(99)00047-1, 2000.
Virtanen, P., Gommers, R., Oliphant, T. E., Haberland, M., Reddy, T., Cournapeau, D., Burovski, E., Peterson, P., Weckesser, W., Bright, J., van der Walt, S. J., Brett, M., Wilson, J., Millman, K. J., Mayorov, N., Nelson, A. R. J., Jones, E., Kern, R., Larson, E., Carey, C. J., Polat, İ., Feng, Y., Moore, E. W., VanderPlas, J., and SciPy 1.0 Contributors: SciPy 1.0: fundamental algorithms for scientific computing in Python, Nat. Meth., 17, 261–272 https://doi.org/10.1038/s41592-019-0686-2, 2020.
- Abstract
- Introduction
- Review of existing wind types and classifications in Poland
- Materials and methods
- Development of estimation of maximum wind speeds in Poland
- Conclusions
- Code and data availability
- Author contributions
- Competing interests
- Disclaimer
- Special issue statement
- Acknowledgements
- Review statement
- References