the Creative Commons Attribution 4.0 License.
the Creative Commons Attribution 4.0 License.
 | 04 Dec 2023
Characteristics of cloud-to-ground lightning (CG) and differences between +CG and −CG strokes in China regarding the China National Lightning Detection Network
Ruijiao Jiang
Guoping Zhang
Shudong Wang
Bing Xue
Zhengshuai Xie
Tingzhao Yu
Kuoyin Wang
Jin Ding
Xiaoxiang Zhu
A lightning location system consisting of multiple ground-based stations is an effective means of lightning observation. The dataset from CNLDN (China National Lightning Detection Network) in 2016–2022 is employed to analyze the temporal and spatial lightning distributions and the differences between +CG (positive cloud-to-ground lightning) and −CG (negative cloud-to-ground lightning) strokes in China. On the annual scale, lightning activity is most prevalent during the summer months (June, July, and August), accounting for 72.6 % of the year. Spring sees more lightning than autumn, and winter has only a small amount in southeastern coastal areas. During the day, the frequency of lightning peaks at 15:00–17:00 CST (China standard time) and is lowest at 8:00–10:00 CST. For the period with high CG stroke frequency (summer of a year or afternoon of a day), the proportion of +CG strokes and the discharge peak current are relatively small. Winter in a year and morning or midnight in a day correspond to a greater +CG stroke proportion and discharge current. Spatially, low latitudes, undulating terrain, the seaside, and humid surfaces are favorable factors for lightning occurrence. Thus, the southeast coastland has the largest lightning stroke density, while the northwest deserts and basins and the western and northern Tibetan Plateau, with altitudes over 6000 m, have almost no lightning. The proportion of +CG strokes and the peak current are low in the southern region with high density but diverse in other regions. The Tibetan Plateau causes the diversity of lightning activity in China and lays the foundation for studying the impact of surface elevation on lightning. Results indicate that the +CG stroke proportion on the eastern and southern Tibetan Plateau is up to 15 %, larger than the plain regions. The peak current of −CG strokes is positively correlated with altitude, but +CG strokes show a negative correlation, resulting in a large difference in peak current between +CG and −CG on the plain and a small difference on the plateau.
- Article
(7027 KB) - Full-text XML
- BibTeX
- EndNote


Most lightning is generated mainly through mesoscale or small-scale severe convective weather, occasionally occurring in tropical cyclones, volcanic eruptions, and dust storms (Rakov and Uman, 2003). Lightning, a violent long-distance transient discharge phenomenon, could cause severe disasters such as human and animal casualties, forest fires, and electronic and communication equipment interruptions. Lightning is also associated with extreme weather events such as heavy rainfall, hail, and strong winds. These events can cause damage to infrastructure, crops, and property and pose a threat to public safety. Therefore, the timely and accurate monitoring of lightning serves as an effective approach for the development of lightning science and scientifically mitigating the hazards of lightning strikes.
Lightning discharge emits a broad range of electromagnetic spectrums, providing an essential avenue for lightning detection. The very low-frequency to low-frequency (VLF/LF, 20–300 kHz) band radiation is mainly produced by the cloud-to-ground lightning (CG) return strokes, intracloud (IC) K changes, and other discharge processes with a large spatial scale (Preston and Tolver, 1989; Schulz et al., 2016; Cummins et al., 1998). VLF/LF electromagnetic waves can propagate along the ground surface or be reflected between the surface and ionosphere, with the advantages of long propagation distance (hundreds to thousands of kilometers) and slow attenuation. This frequency range thus is suitable for large-scale lightning detection and is currently the most commonly used target detection band for ground-based lightning location systems (Wang et al., 2020).
Representative examples of modern lightning location systems working in VLF/LF band are mainly the US National Lightning Detection Network (NLDN) (Rudlosky and Fuelberg, 2010), Los Alamos Sferic Array (LASA) (Shao et al., 2006), European Cooperation for Lightning Detection (EUCLID) (Schulz et al., 2016), Vaisala's Global Lightning Dataset (GLD360) (Said et al., 2013), World Wide Lightning Location Network (WWLLN) (Rudlosky and Shea, 2013), etc. The three nationwide detection networks in China are China National Lightning Detection Network (CNLDN), operated by the Meteorological Observation Center of China Meteorological Administration (CMA), the Lightning Location System (LLS) of the State Grid Corporation of China, and the Three-Dimensional Lightning Location System (3D-LLS) deployed by the Institute of Electrical Engineering of the Chinese Academy of Sciences (CAS). There are also small-scale and refined detection systems in local China areas, such as the Beijing Lightning Network (BLNET) established by the Institute of Atmospheric Physics of CAS and the Guangdong–Hong Kong–Macao Lightning Location System (GHMLLS) deployed by the meteorological departments of Guangdong Province, Hong Kong, and Macao.
China spans a wide range of latitudes from north to south and has significant terrain changes from east to west. The western and northern parts of the Tibetan Plateau have large uninhabited areas with altitudes above 6000 m. The above factors pose challenges for the installation of lightning detectors and the improvement in the accuracy of locating algorithms. Currently, most of the analyses of lightning characteristics in China are based on lightning imagers on satellites and the World Wide Lightning Location Network (WWLLN) (Ma et al., 2005, 2021; You et al., 2019). However, the Optical Transient Detector (OTD) on Microlab 1 and Lightning Imaging Sensor (LIS) on the TRMM (Tropical Rainfall Measuring Mission) satellite discontinued updates, and the Chinese Lightning Mapping Imager (LMI) on FY-4A is not oriented to the China area all year round. Meanwhile, the detection efficiency of the satellite sensor and WWLLN is relatively low and not valuable for analyzing the difference between positive cloud-to-ground lightning (+CG) and negative cloud-to-ground lightning (−CG). CNLDN is nowadays the most widely used system by the meteorological departments in China and has accumulated observational data for many years. Currently, there has been no study evaluating the detection performance of CNLDN on a national scale. Based on some localized assessments, the detection efficiency for lightning flash and stroke in Beijing was reported to be 49.4 % and 36.5 % (Srivastava et al., 2017). In Jiangsu, the detection efficiency for lightning flash was documented as 61.4 % (Feng et al., 2015). In our previous study, we calculated the lightning density in the vicinity of the Canton Tower in Guangdong using optical observation by the Tall-Object Lightning Observatory in Guangzhou (TOLOG), which is currently regarded as a nearly no-miss observation (Wu et al., 2019; Jiang, 2021). The result was that the CG flash density was 20 km−2 yr−1 within a 3 km radius of the Canton Tower. The detection efficiency of lightning flash for CNLDN was correspondingly only 33.7 % in the same region. Despite the relatively lower detection efficiency of CNLDN compared to other advanced international systems, it still holds significant importance in analyzing the lightning characteristics nationwide in China.
This study makes use of CNLDN data from 2016–2022 to analyze the lightning climate over China by dividing the continental region into four blocks. We also focus on comparing the differences between +CG and −CG strokes regarding temporal and spatial distribution. Furthermore, China's extensive geographical expanse, spanning a wide range of latitudes and longitudes, coupled with its intricate topography, provides a unique opportunity for investigating the correlation between lightning occurrences and geographic factors.
CNLDN was initially developed in 2007 by the National Space Science Center (NSSC) of CAS and is now operated by the Meteorological Observation Centre of CMA. It carries out the monitoring and early warning of strong convective weather in thunderstorms. The CNLDN system is comprised of 435 sub-stations (as of 2020), each equipped with a lightning detector, and a central data processing station located at the National Meteorological Information Center. The baseline distance typically ranges from tens to hundreds of kilometers. Although with some blind areas in the desert regions of Xinjiang and the uninhabited high-altitude areas of Tibet, CNLDN can generally achieve nationwide lightning detection. The distribution of sub-stations is illustrated in Fig. 1.
The network uses a time-of-arrival (TOA) technique, with a GPS timing error of less than 20 ns (in clear-sky conditions), to detect VLF/LF pulses of CG return strokes. A lightning flash may consist of several CG strokes, and the stroke locations within each flash do not always overlap, causing striking instances in different areas. In this study, we analyze lightning stroke characteristics in inland China using the CNLDN dataset from 2016–2022, downloaded from the CMA big data cloud platform. For each stroke, we can obtain information on the time of occurrence, latitude, longitude, peak current value, and the number of reporting sensors.
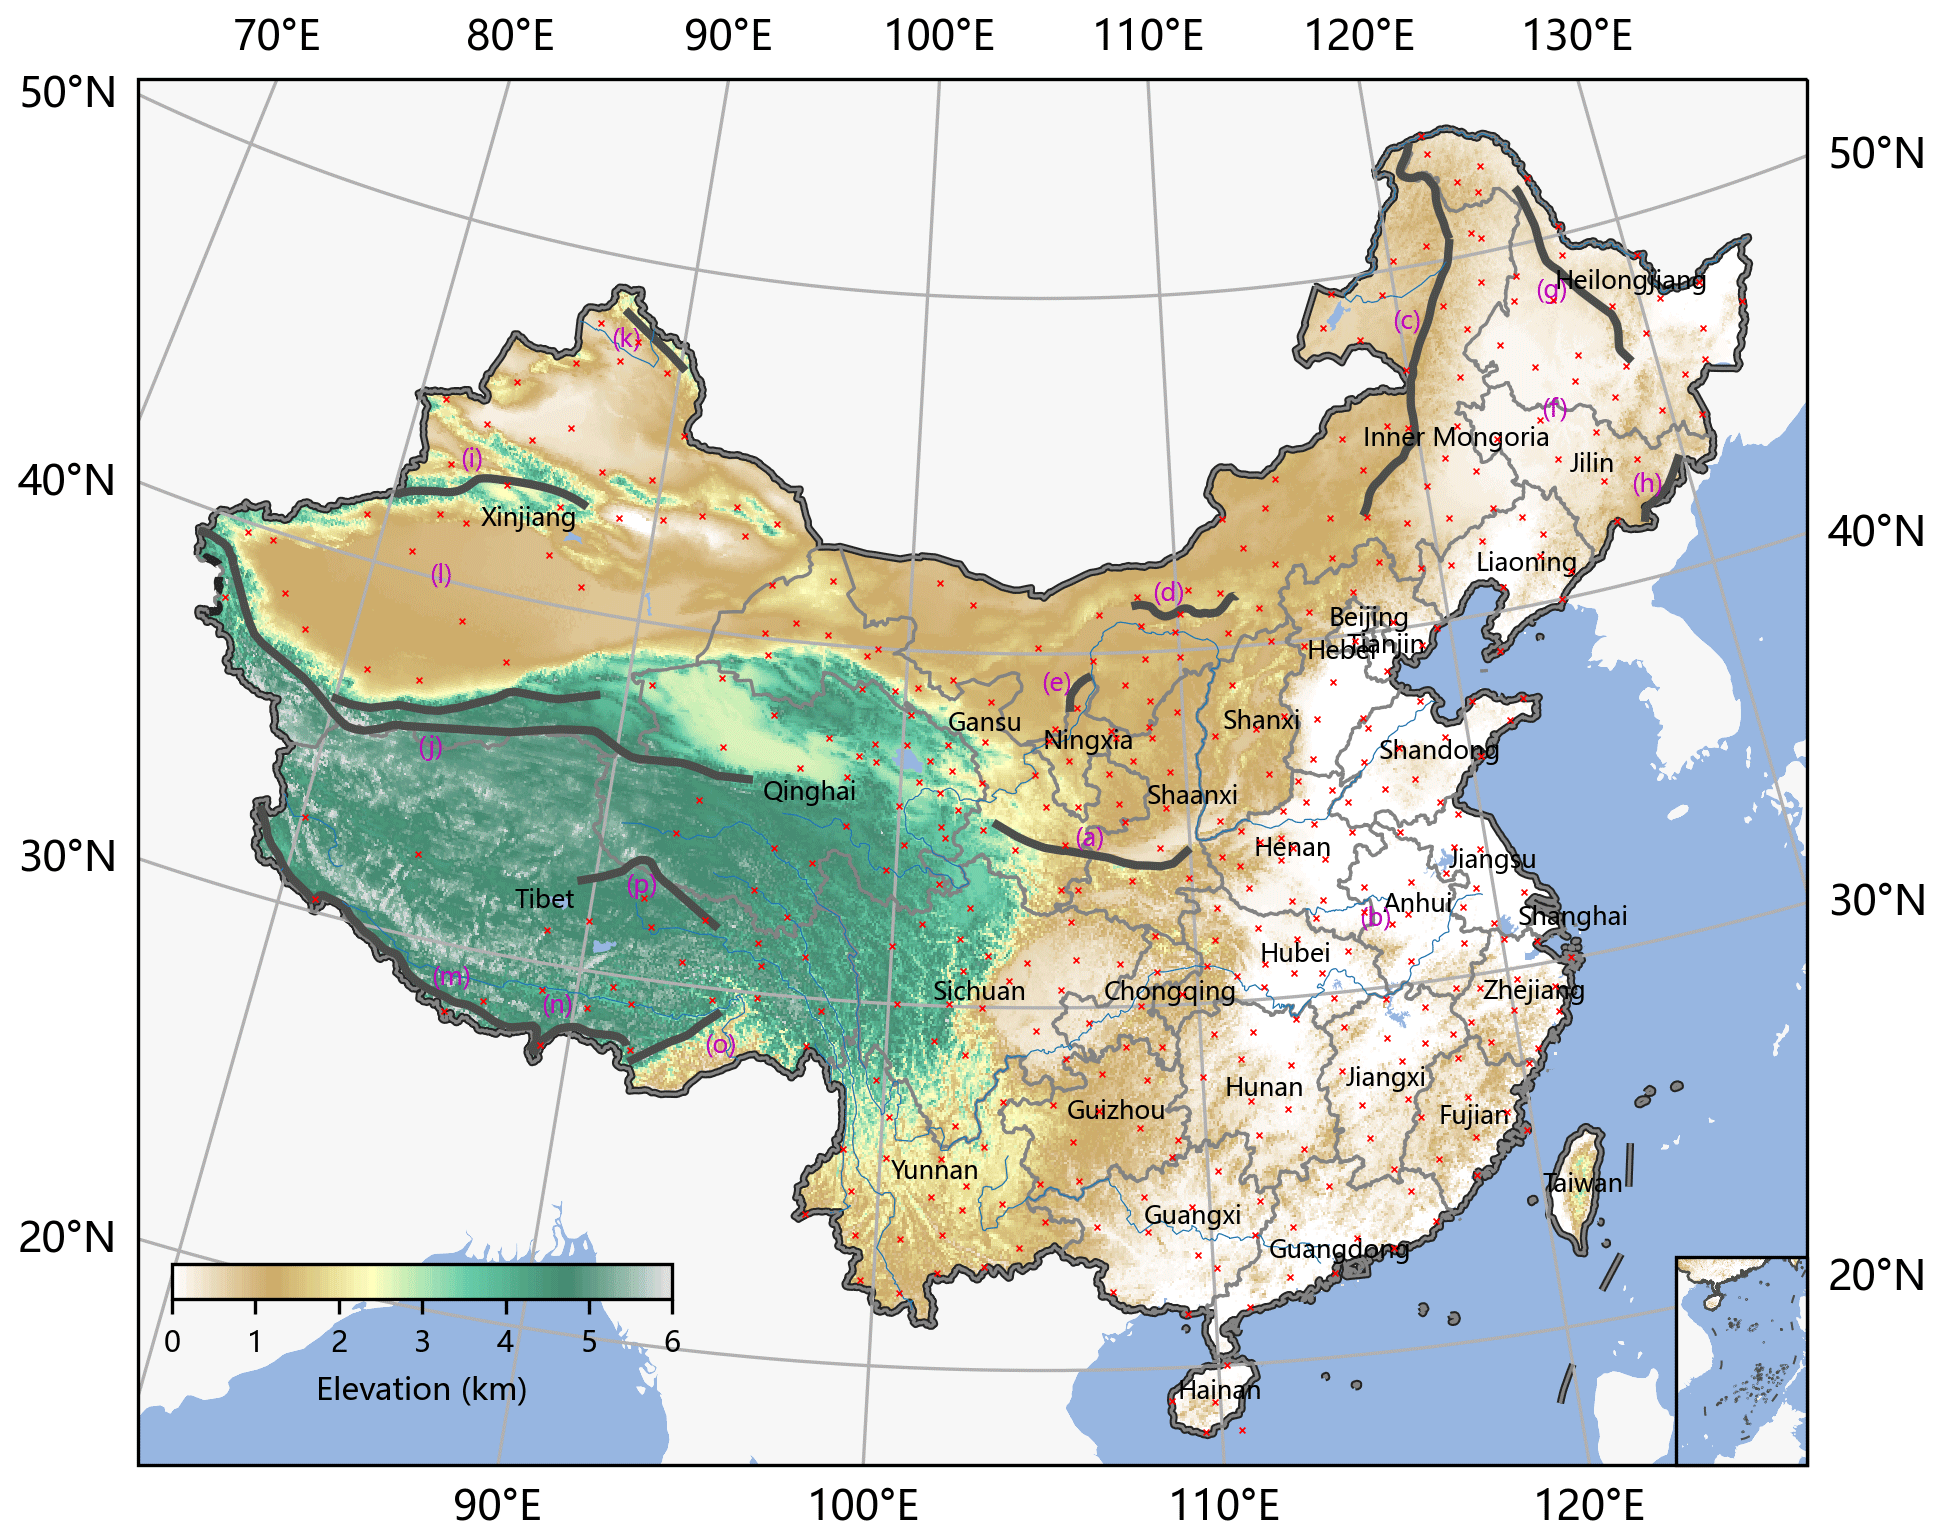
Figure 1CNLDN sites distribution and altitude distribution map of China with labeled names of each province and municipality. The alphabetical labels (a, b, c, d, etc.) in the figure indicate the positions of the locations referred to in the text. Publisher's remark: please note that the above figure contains disputed territories.
China's climate features are greatly influenced by its wide latitudinal span, significant terrain disparity, complex topography, and ocean currents (Ren et al., 2012). Lightning is a fundamental meteorological element, and its long-term accumulation characteristics are closely linked to China's climate. The spatial distribution of lightning in China is determined by a combination of factors, including atmospheric circulation, topography, distance from the sea, and latitude.
3.1 CG stroke distribution in China
Previous studies have often divided China into four major geographical regions, each with relatively uniform climatic characteristics. These regions are southern China (Region-I), northern China (Region-II), northwestern China (Region-III), and the Qinghai–Tibet region of China (Region-IV), as illustrated in Fig. 2. The Qinling Mountains (a) and Huai River (b) line, which roughly coincides with the line marked by the 0∘ isotherm and 800 mm annual precipitation in January, serves as the boundary between Region-I and Region-II. The Daxing'an Mountains (c), Yinshan Mountains (d), and Helan Mountains (e), which divide the monsoon and non-monsoon regions and the 400 mm annual precipitation line, serve as the boundaries between Region-II and Region-III. The boundary between Region-IV and Regions I–II–III is approximately the line between China's first and second steps in terrain.
Table 1Statistics on the annual average numbers of return strokes, the stroke densities, and the peak current values of the four regions.
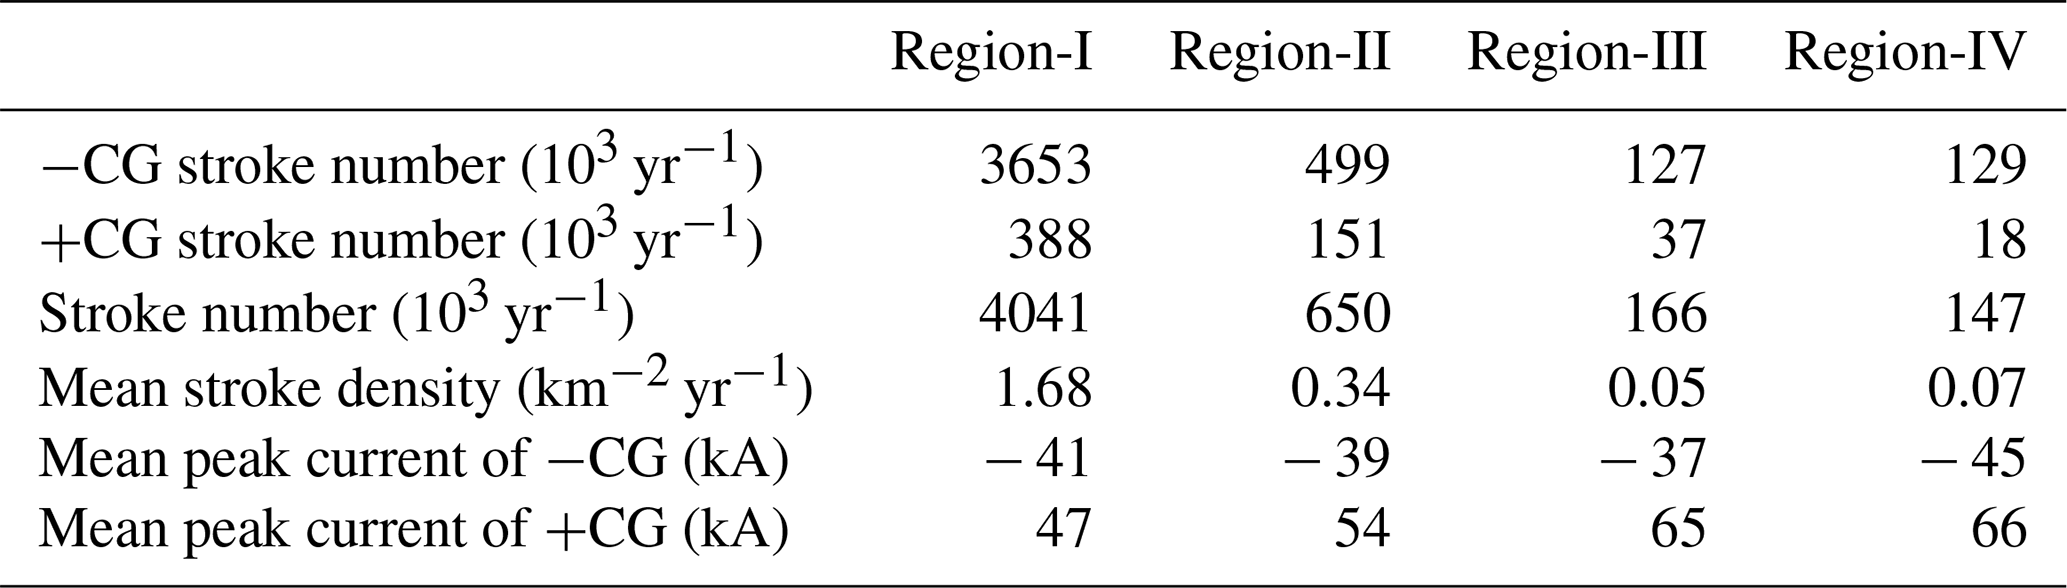
The statistical results of the annual average number of −CG return strokes, +CG return strokes, all types of stroke, and the mean stroke density of the four regions are shown in Table 1. The data indicate a sequential decrease in lightning activity across the four regions. Figure 2 displays the distribution of annual average CG stroke density from 2016–2022. When calculating lightning density, it is necessary to determine the size of grid cells. According to the research of Diendorfer (2008), lightning is a highly stochastic phenomenon, and if we require an uncertainty of less than ±20 % per grid cell, there should be more than 80 events in it. Therefore, we establish the grid size as , ensuring that the results are within the confidence interval for almost all regions, except for part of the areas in Xinjiang and Tibet. Lightning primarily occurs in convective precipitation and, to a lesser extent, in stratus cloud precipitation. Generally, the spatial distribution of lightning strokes in Fig. 2 is consistent with the distribution of annual average precipitation in China, as illustrated in Fig. 3 in Jin et al. (2021).
Region-I has the highest concentration of CG strokes, with an average density of 1.68 km−2 yr−1. The leap line of lightning density corresponds well with the 0∘ isotherms in January, the 800 mm annual equivalent precipitation line, and the eastern dividing line of the first and second terrain steps. The climate in Region-I is mainly influenced by the tropical and subtropical monsoon. The southeast monsoon from the Pacific Ocean and the southwest monsoon from the Indian Ocean make the summer hot and humid and prone to thunderstorms. In particular, the monsoon influence is more pronounced in coastal areas with abundant water vapor and thermal conditions. In the mountainous regions of Hainan, Guangdong, Fujian, and Zhejiang, where the rolling topography lifts the warm and humid air masses, thunderstorm activity is most frequent, resulting in high lightning density. Although the Sichuan Basin and Yunnan are far from the coastline, they are located at the eastern and southern windward slopes of the Tibetan Plateau, which benefits the generation of thunderstorm activity due to the topographic uplift. The distribution in Region-I is similar to the observation results by Xia et al. (2015).
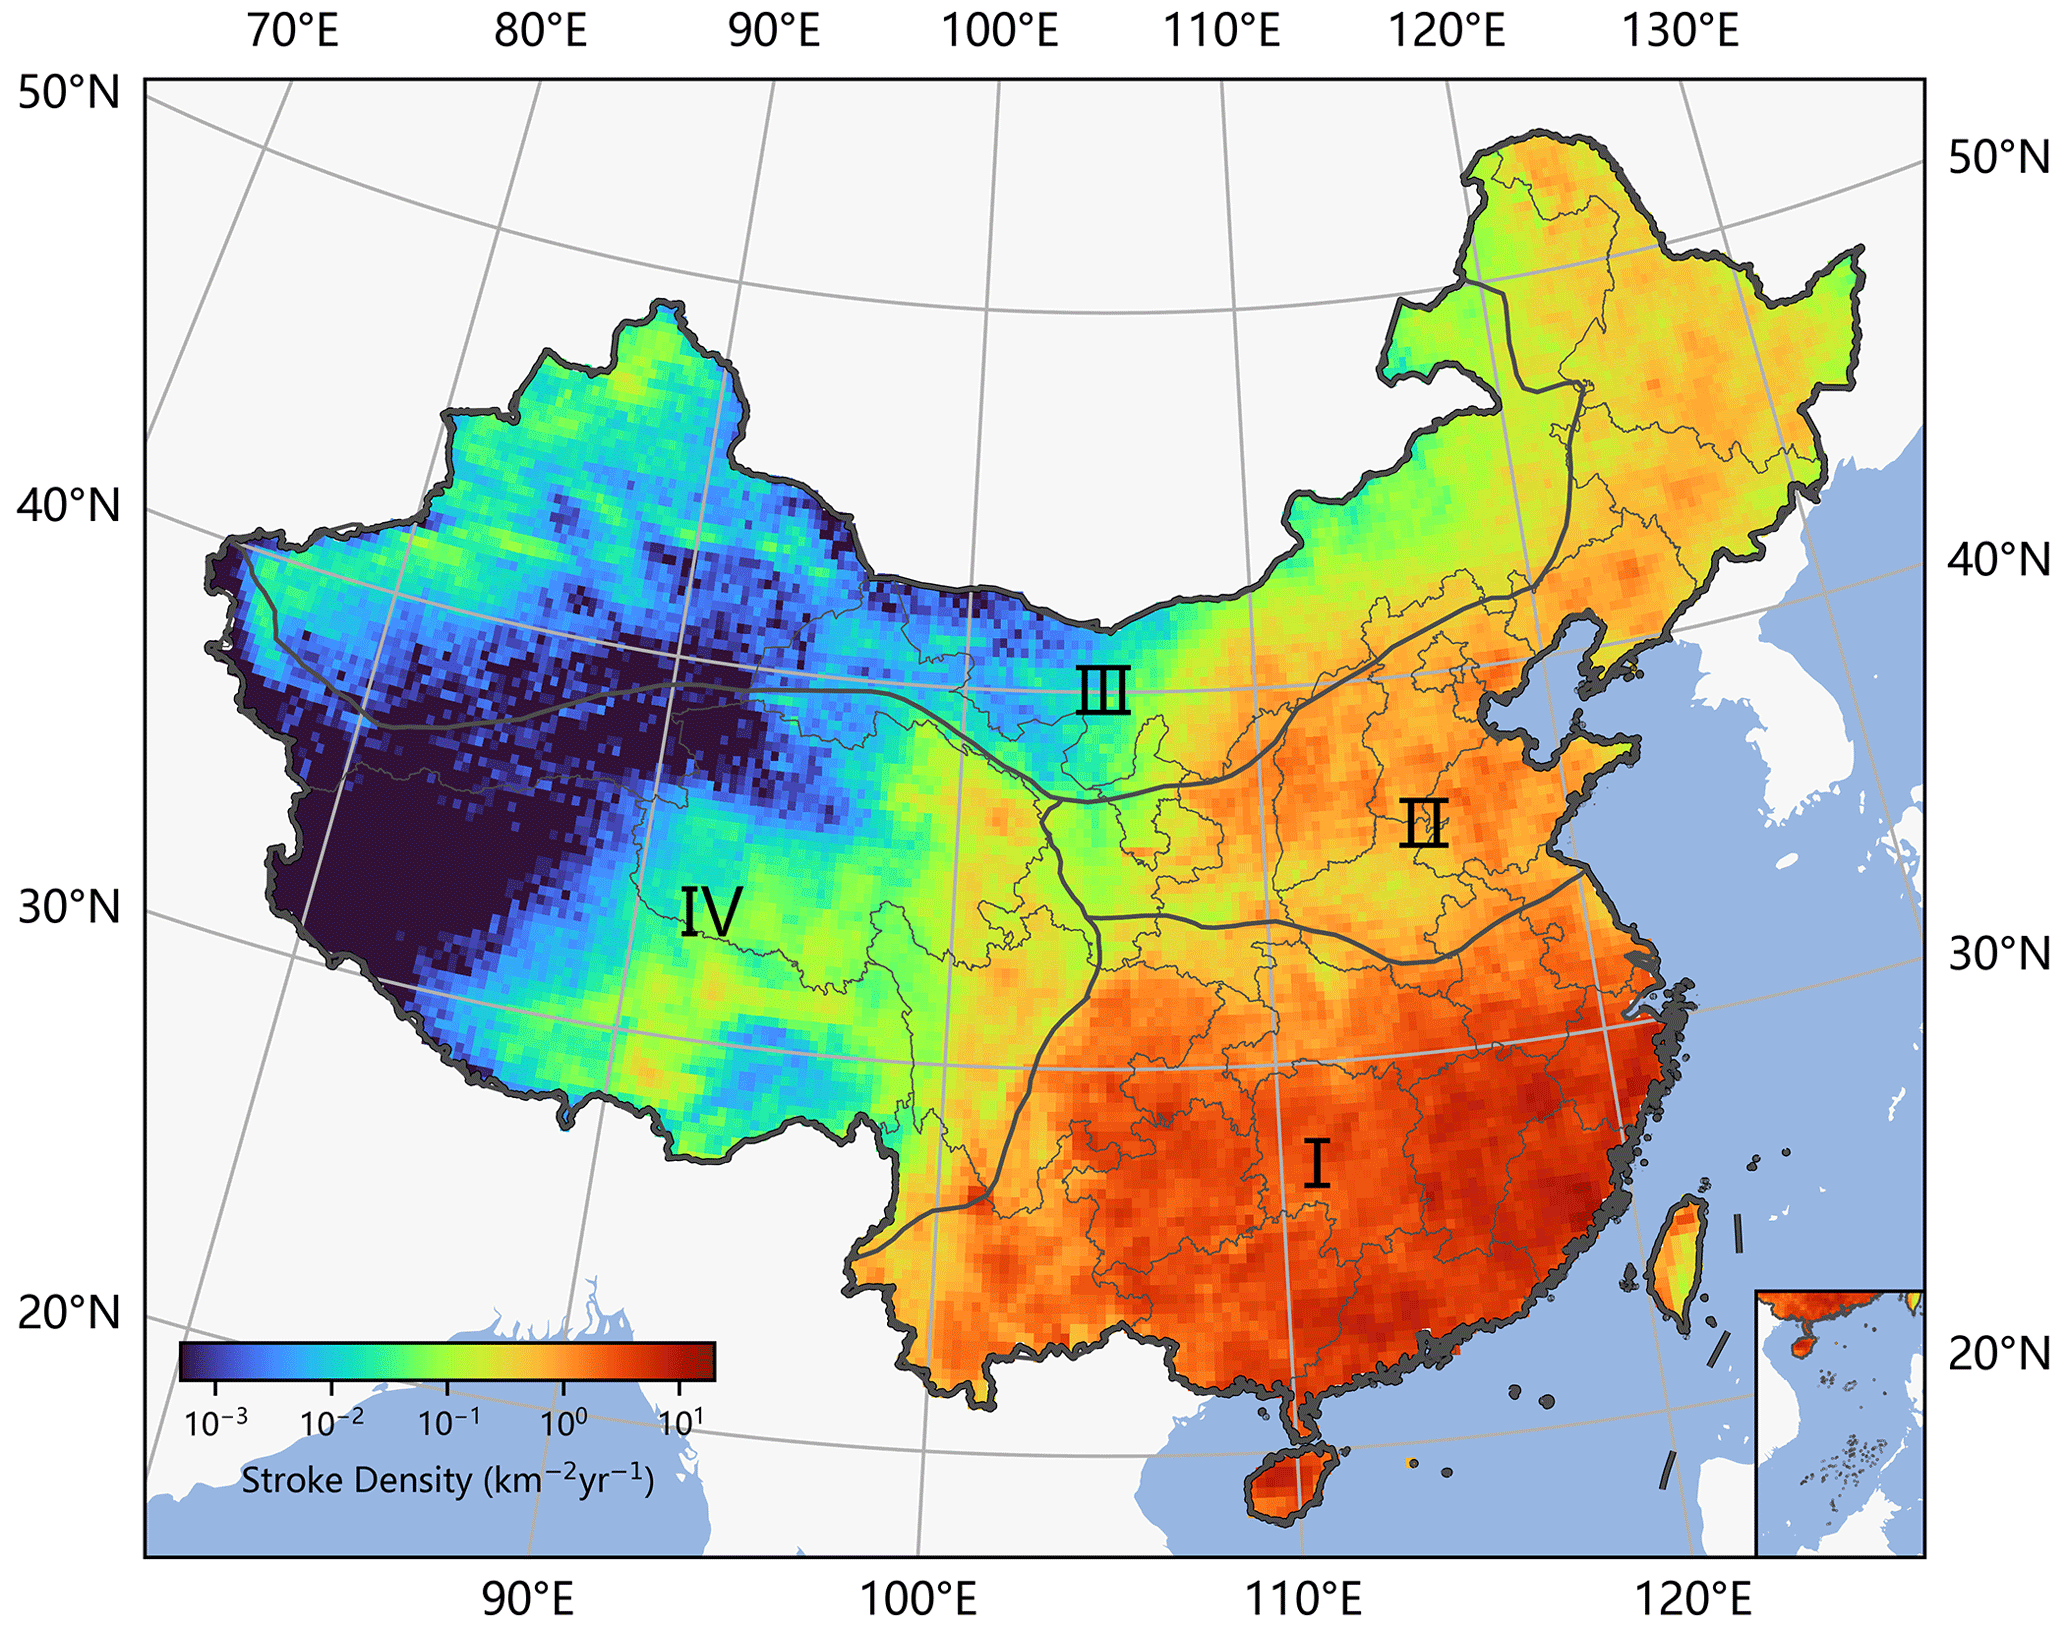
Figure 2The 2016–2022 annual average CG stroke density distribution in China. Region-I: southern China; Region-II: northern China; Region-III: northwestern China; Region-IV: Qinghai–Tibet region of China. The grid size is . Publisher's remark: please note that the above figure contains disputed territories.
Region-II has a temperate monsoon climate, with summer influenced by the southeast monsoon carrying a temperate marine air mass or degenerative tropical marine air mass, making summer warm and rainy. Most areas have a CG stroke density between 0.1–1 km−2 yr−1, slightly lower than Region-I. The lightning activity in Region-II is also greater in the seaside area than inland areas. Shanxi is located in a mountainous region, and the undulating terrain makes it a high-incidence area for thunderstorm activity. Region-II has the most extensive plain, Northeast China Plain (f), surrounded by the Daxing'an Mountains (c), the Xiaoxing'an Mountains (g), and the Changbai Mountains (h). The landform is conducive to the southeast monsoon reaching the inland areas of Region-II and forming summer thunderstorms. Jilin is only a dozen kilometers from the Sea of Japan, facilitating the entry of warm air currents. Therefore, despite its high latitude, thunderstorm activity is relatively intense in Region-II.
Region-III, which includes Xinjiang, northern Gansu, and most of the land of Inner Mongolia, has a temperate continental climate. There are significant differences in lightning distribution characteristics within this region. The southern and central parts of Region-III consist primarily of vast deserts and gobies. The Tibetan Plateau blocks the humid South Asian monsoon, and its arid surface cannot produce abundant water vapor, resulting in few thunderstorms. However, the Tian Shan Mountains (i), Kunlun Mountains (j), and Altai Mountains (k), located in the hinterland of the Eurasian continent, are provided with water vapor for thunderstorm generation through the westerly circulation that transports evaporated water vapor from the Atlantic Ocean and the Eurasian continent. As a result, the northern mountainous areas contain almost all the lightning activity in Xinjiang. The southeastern monsoon flowing through Region-II can also bring some thunderstorm processes to the eastern and central mountainous regions in Inner Mongolia during summer.
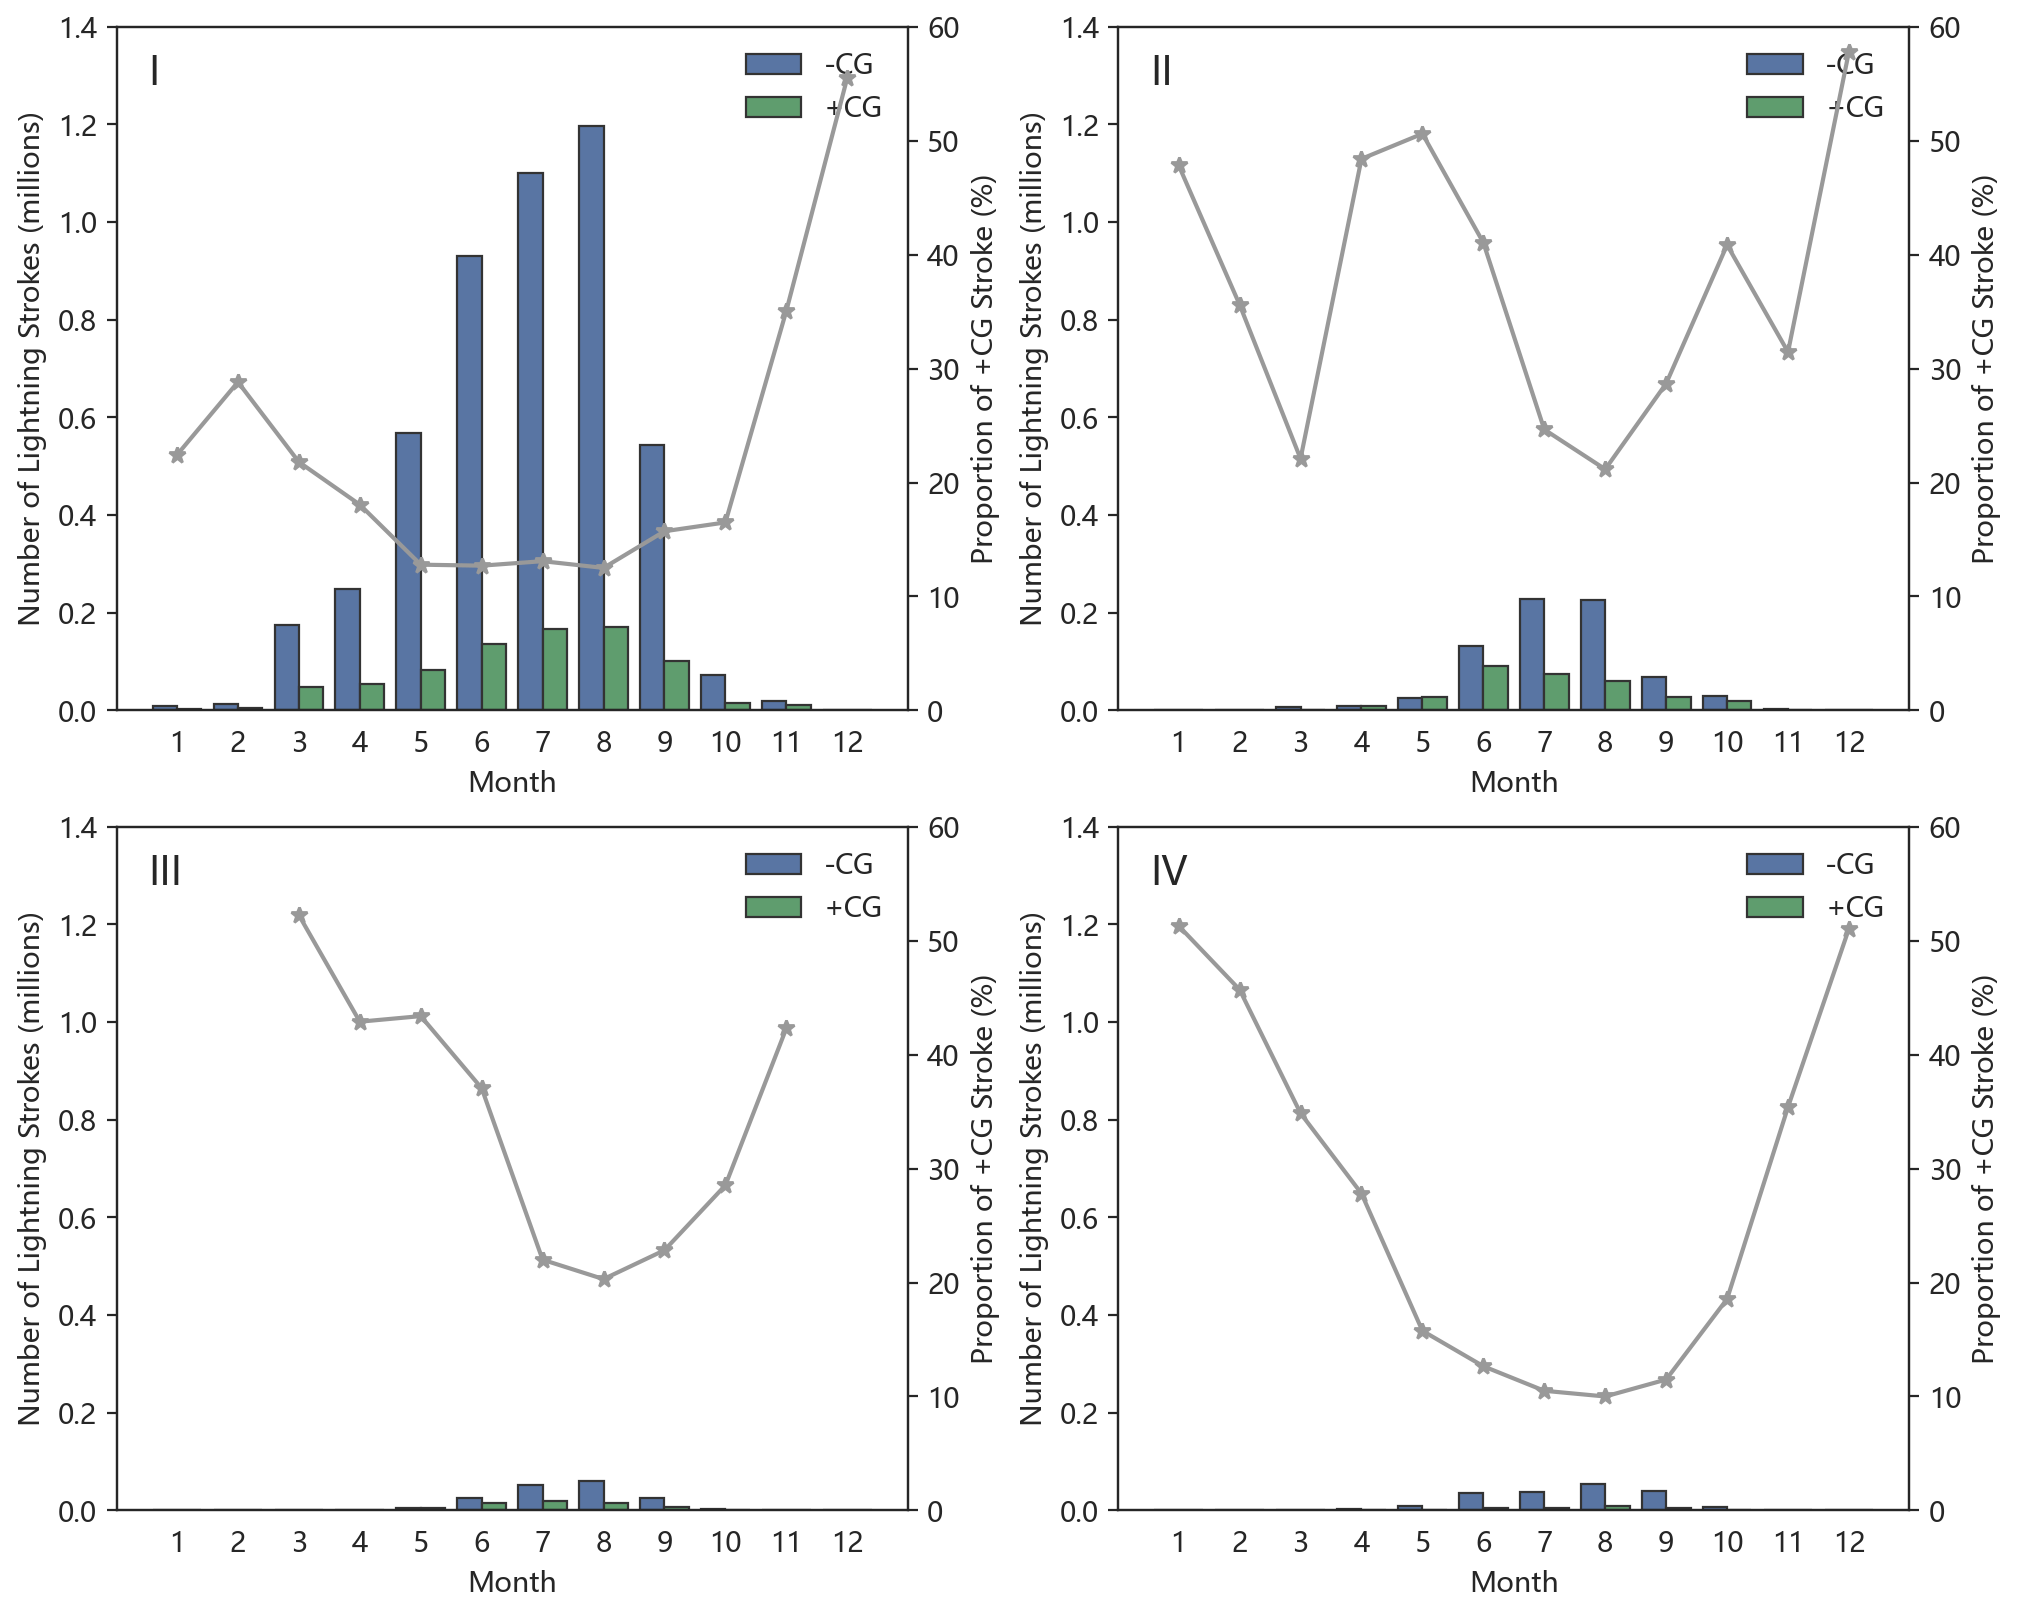
Figure 3Annual-scale variation in the frequency distribution of +CG and −CG strokes. The gray line represents the proportion of +CG strokes.
Region-IV's primary landmass is the Tibetan Plateau, which includes Tibet, Qinghai, southern Xinjiang, and western Sichuan. It has a highland mountain climate, and the overall geomorphic distribution trend increases from east to west (Ma et al., 2021). The uninhabited areas above 4500 m in elevation in the west and north of Region-IV are icy all year round, covered by snow and glaciers. The Qaidam Basin (l) in Qinghai is a closed, huge, interrupted basin, where dry sinking airflow from the northern edge of the plateau in summer leads to a water shortage. Consequently, there are few thunderstorms in these areas, and the distribution of sub-stations is sparse, making them the regions with the lowest lightning density detected in China, with a CG stroke density less than 10−3 km−2 yr−1. In contrast, the southern Himalayas (m), near the Yarlung Tsangpo Grand Canyon (n), have a relatively low altitude, opening a “gap” for the influx of abundant water vapor from the Bay of Bengal. However, this narrow plain area, located in Mêdog County (o), has very high precipitation but low lightning density, which can also be concluded from the observations of TRMM. The remaining moisture continues northward across this plain, causing most thunderstorms between the east–west Himalayas and Tanggula Mountains (p). The thunderstorms on the east side of the plateau are mainly influenced by the low vortex and the shear line, which is usually stable at around 32.5∘ N (You et al., 2019; Qie et al., 2003). The high-lightning-density area is precisely located on the south side of the shear line.
3.2 Differences between +CG and −CG strokes
Based on the different polarities of neutralized charges in thunderclouds, CG can be classified into two types: +CG and −CG. Generally, +CG has a lower occurrence probability, accounting for only about 10 % of all CG, but it is characterized by a larger charge transfer, which results in a more significant hazard (Preston and Tolver, 1989; Carey and Buffalo, 2007). Studies have suggested that thunderstorms dominated by +CG are more likely to result in tornadoes and hail, particularly if the dominant phase lasts for tens of minutes. This may be related to changes in the charge distribution structure within thunderstorm clouds during extreme weather events (Williams, 1985). Previous research has been conducted on the comparative analysis of +CG and −CG in specific regions (Nag et al., 2014; Rakov and Uman, 2003). Based on these findings, this study aims to investigate further the spatial and temporal variability in +CG and −CG strokes in China, taking into account the complex climatic and geographical factors that influence lightning activity.
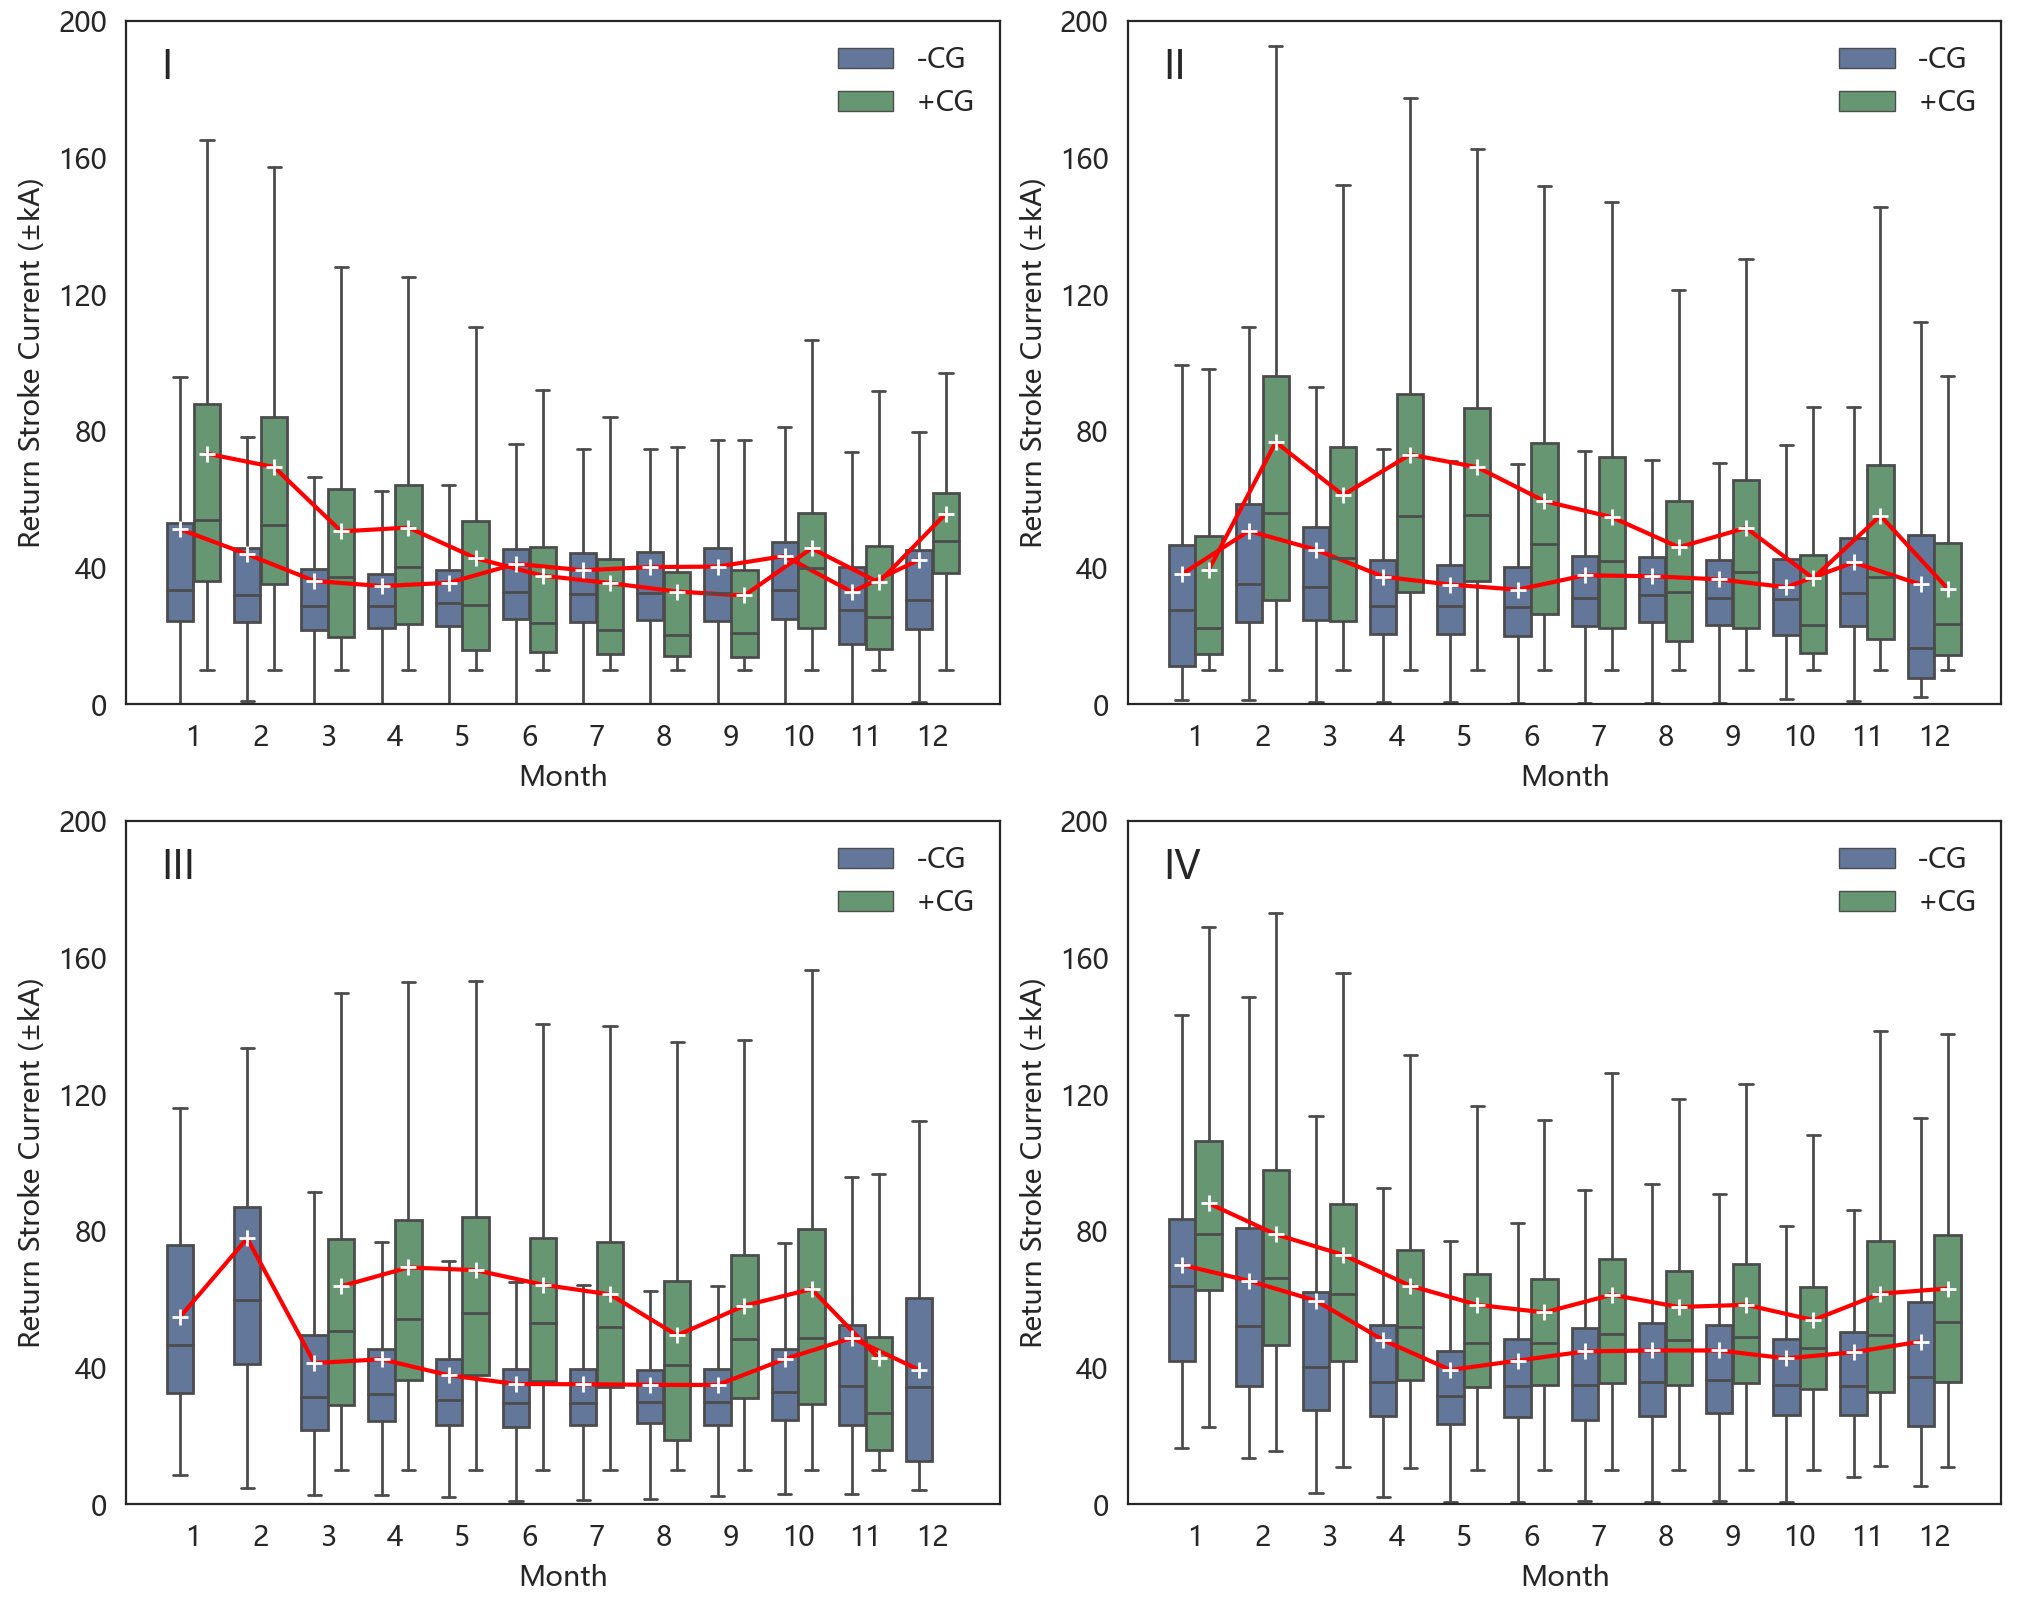
Figure 4Annual-scale variation in the peak current distribution of +CG and −CG strokes. The red line represents the average peak current value of each month.
3.2.1 Comparison of temporal distribution of +CG and −CG strokes
The geographical and climatic features differ considerably across the four regions. Therefore, we analyze the temporal distribution of lightning strokes separately for each region.
Figure 3 illustrates the monthly average CG stroke frequency distribution in China over a 7-year period from 2016 to 2022. The stroke frequency varies significantly across the four regions, with Region-I having the highest frequency, followed by Region-II and Region-III, and Region-IV having the lowest. But the stroke frequency shows similar fluctuations throughout the year among the regions, with August having the highest frequency and December having the lowest. Lightning activity is also scarce in November, January, and February, with a sudden surge in March and a gradual increase in the following months. Based on the seasonal classification, lightning activity is most active in summer (June, July, and August), accounting for 72.6 % of the year. In other seasons, lightning is more frequent in spring (18.4 %) than in autumn (8.6 %) but much less frequent than in summer. This is mainly because the summer monsoon affecting China starts to form during April and May, while the cold and dry winter monsoon starts to build up and push southward from September, making thunderstorm activity in spring and autumn mainly concentrated in southern areas, particularly coastal areas. In winter, most regions in China are controlled primarily by cold high pressure, resulting in very little lightning, with only a small amount occurring in southeastern coastal areas, accounting for just 0.4 % of the year. Overall, lightning stroke distribution follows a seasonal trend that advances from south to north and then retreats southward, which is consistent with the trend of the summer monsoon. The above proportions of four seasons closely resemble the statistical results conducted in the US by Holle and Cummins (2010).
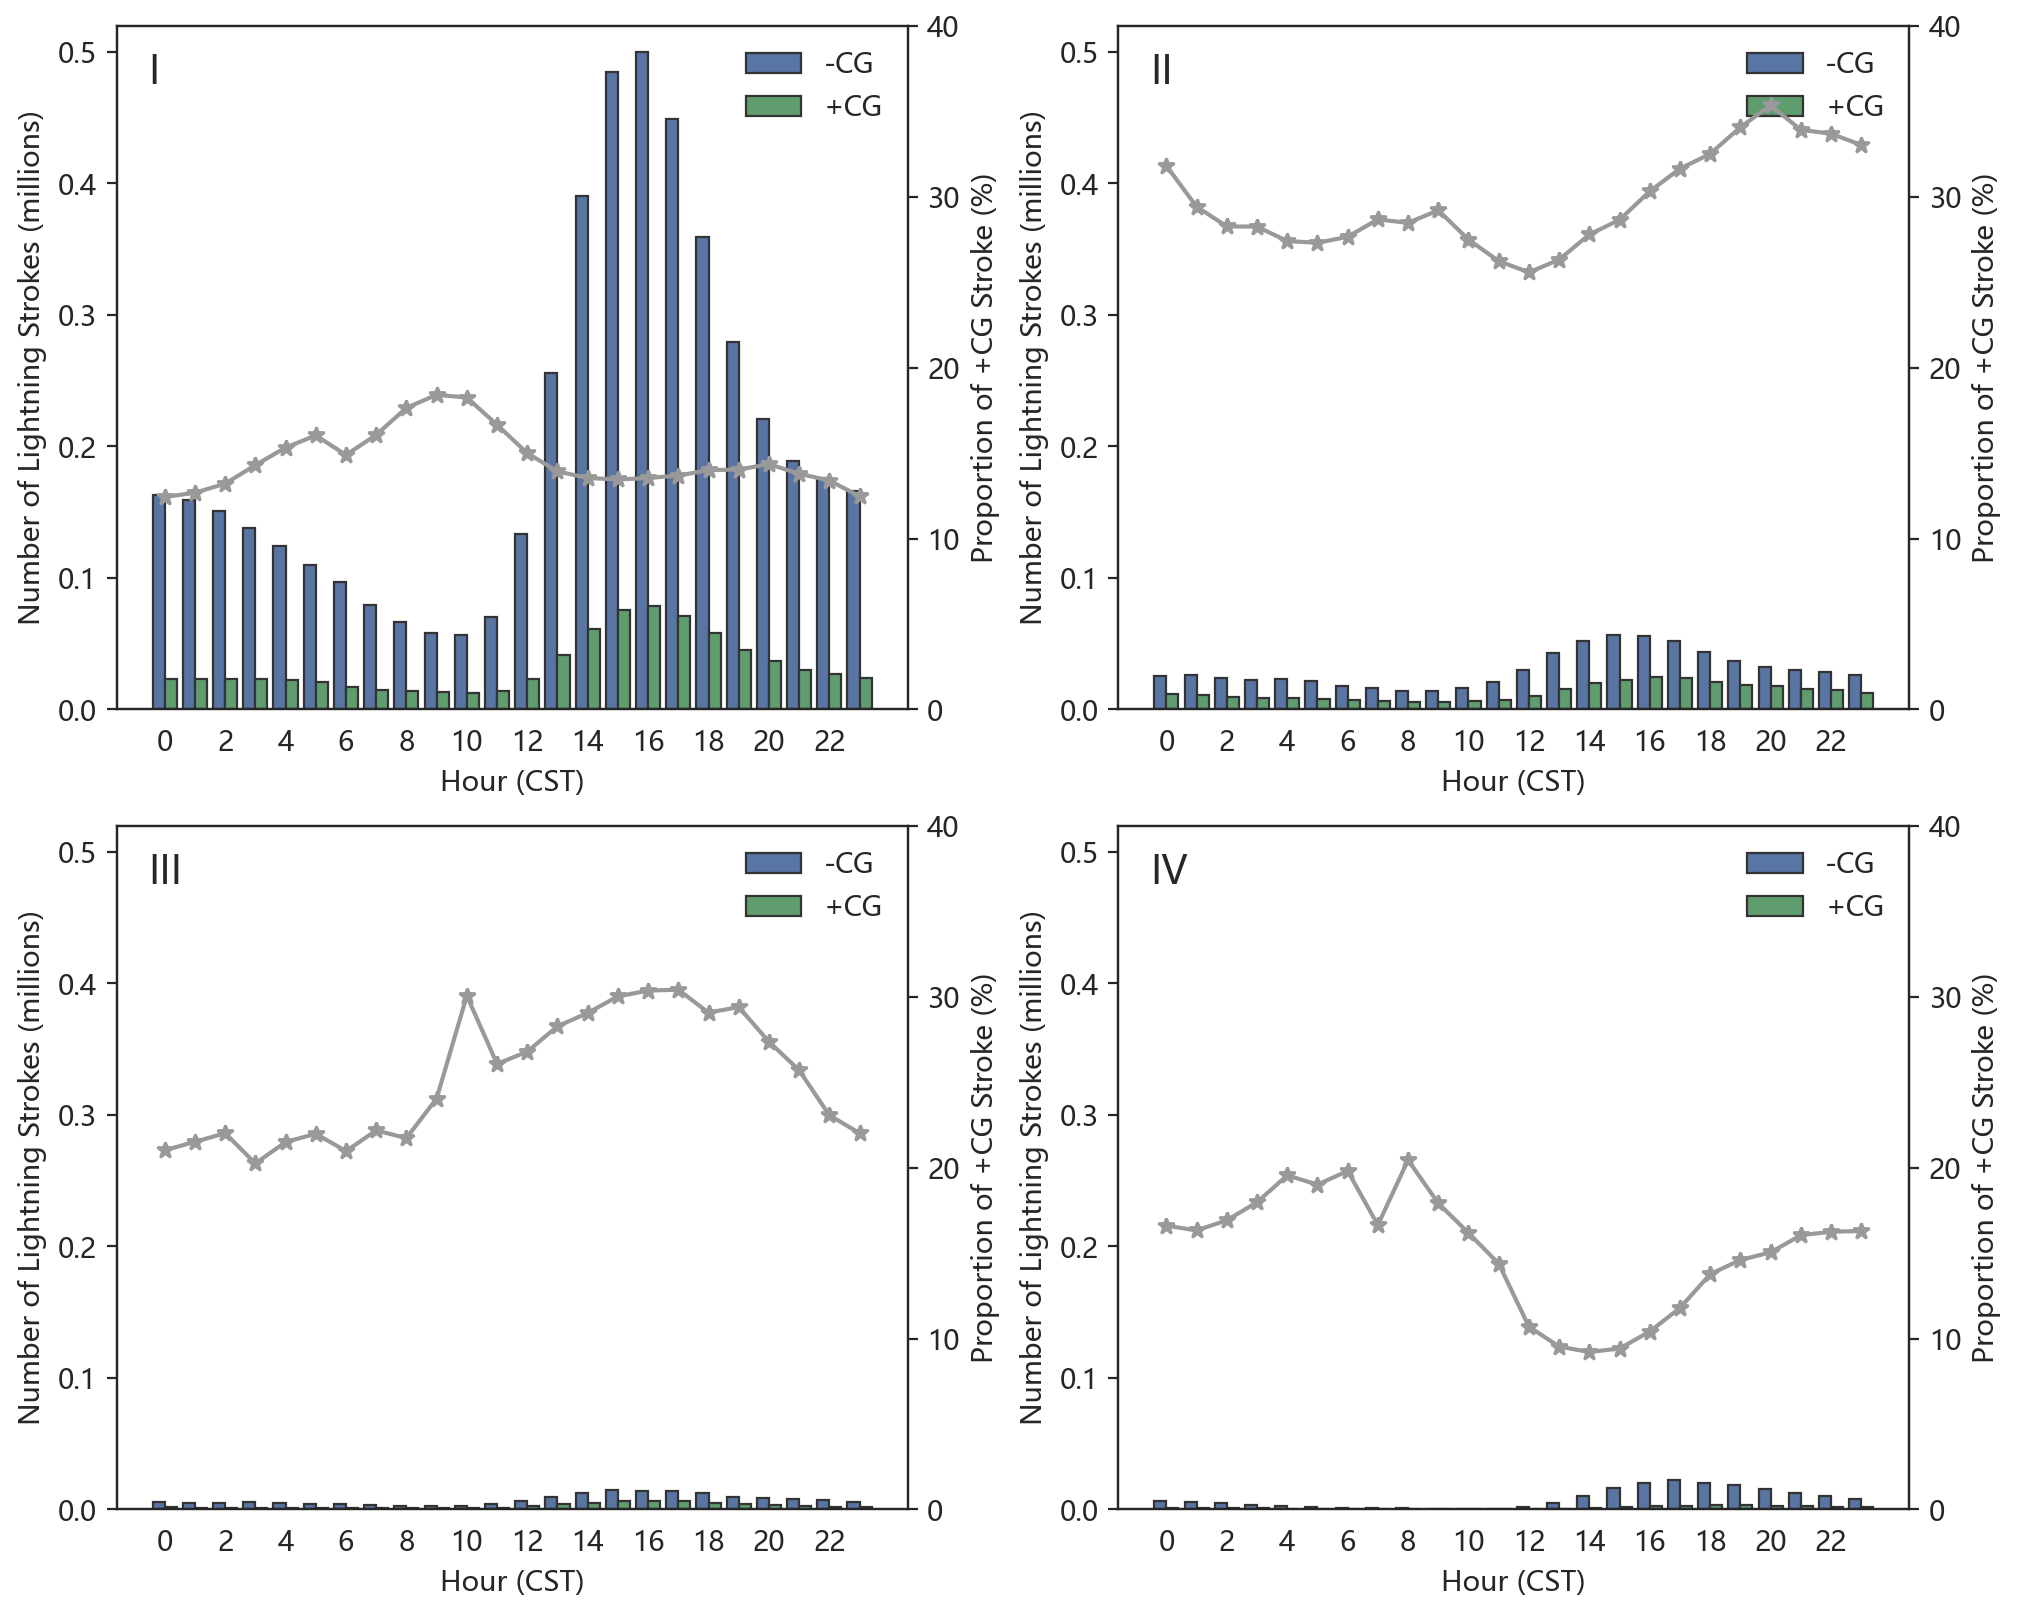
Figure 5Daily-scale variation in the frequency distribution of +CG and −CG strokes. The gray line represents the proportion of +CG strokes. The time zone is CST (UTC+8 h).
Furthermore, the proportion of +CG strokes in different months is calculated and represented by the gray line in Fig. 3. To ensure the reliability of the analysis, months with fewer than 50 +CG strokes are excluded to avoid the impact of outliers. Results indicate an evident inverse relationship between the proportion of +CG strokes and the frequency of strokes. Notably, the months with the highest incidence of CG strokes, namely July and August, exhibit the lowest proportion of +CG strokes across the four regions. During this period, Region-I and Region-IV, located at lower latitudes, exhibit a proportion of +CG strokes of approximately 10 %, while Region-II and Region-III display proportions between 10 % and 30 %. Winters in the four regions have rare thunderstorms but demonstrate the highest proportion of +CG strokes, even reaching over 50 % in December in Region-I, Region-II, and Region-IV. In other months, some irregular fluctuations are observed, Region-I and Region-II show significantly high proportions of +CG strokes in February and April–May, respectively.
Table 1 also displays the mean peak current values of two types of CG strokes in the four regions. The results reveal that the +CG stroke current in Region-III and Region-IV exhibits a notably higher magnitude compared to the other two regions, and the disparity between +CG and −CG is more pronounced, while the average peak current values of both types are found to be in close proximity in Region-I. The value fluctuation in different months is illustrated in Fig. 4. To avoid outliers, no box is drawn when the stroke count is less than 50. Overall, the distribution range is wider in winter than in other seasons, and Region-II has a wider current distribution interval than other regions. The average peak current value of each month is indicated by a white cross, and the variation trend is shown by a red line. The results indicate that +CG strokes generally have a higher peak current than −CG strokes. The peak current and the proportion of +CG strokes exhibit similar trends, with a higher proportion and stronger peak current in winter and a lower proportion and weaker peak current in summer. In Region-I and Region-II, the seasonal fluctuations in +CG peak current are more pronounced than −CG peak current, with the peak current of +CG strokes falling even below −CG strokes in summer and early autumn in Region-I. The trends of +CG and −CG stroke peak currents are more consistent in Region-III and Region-IV.
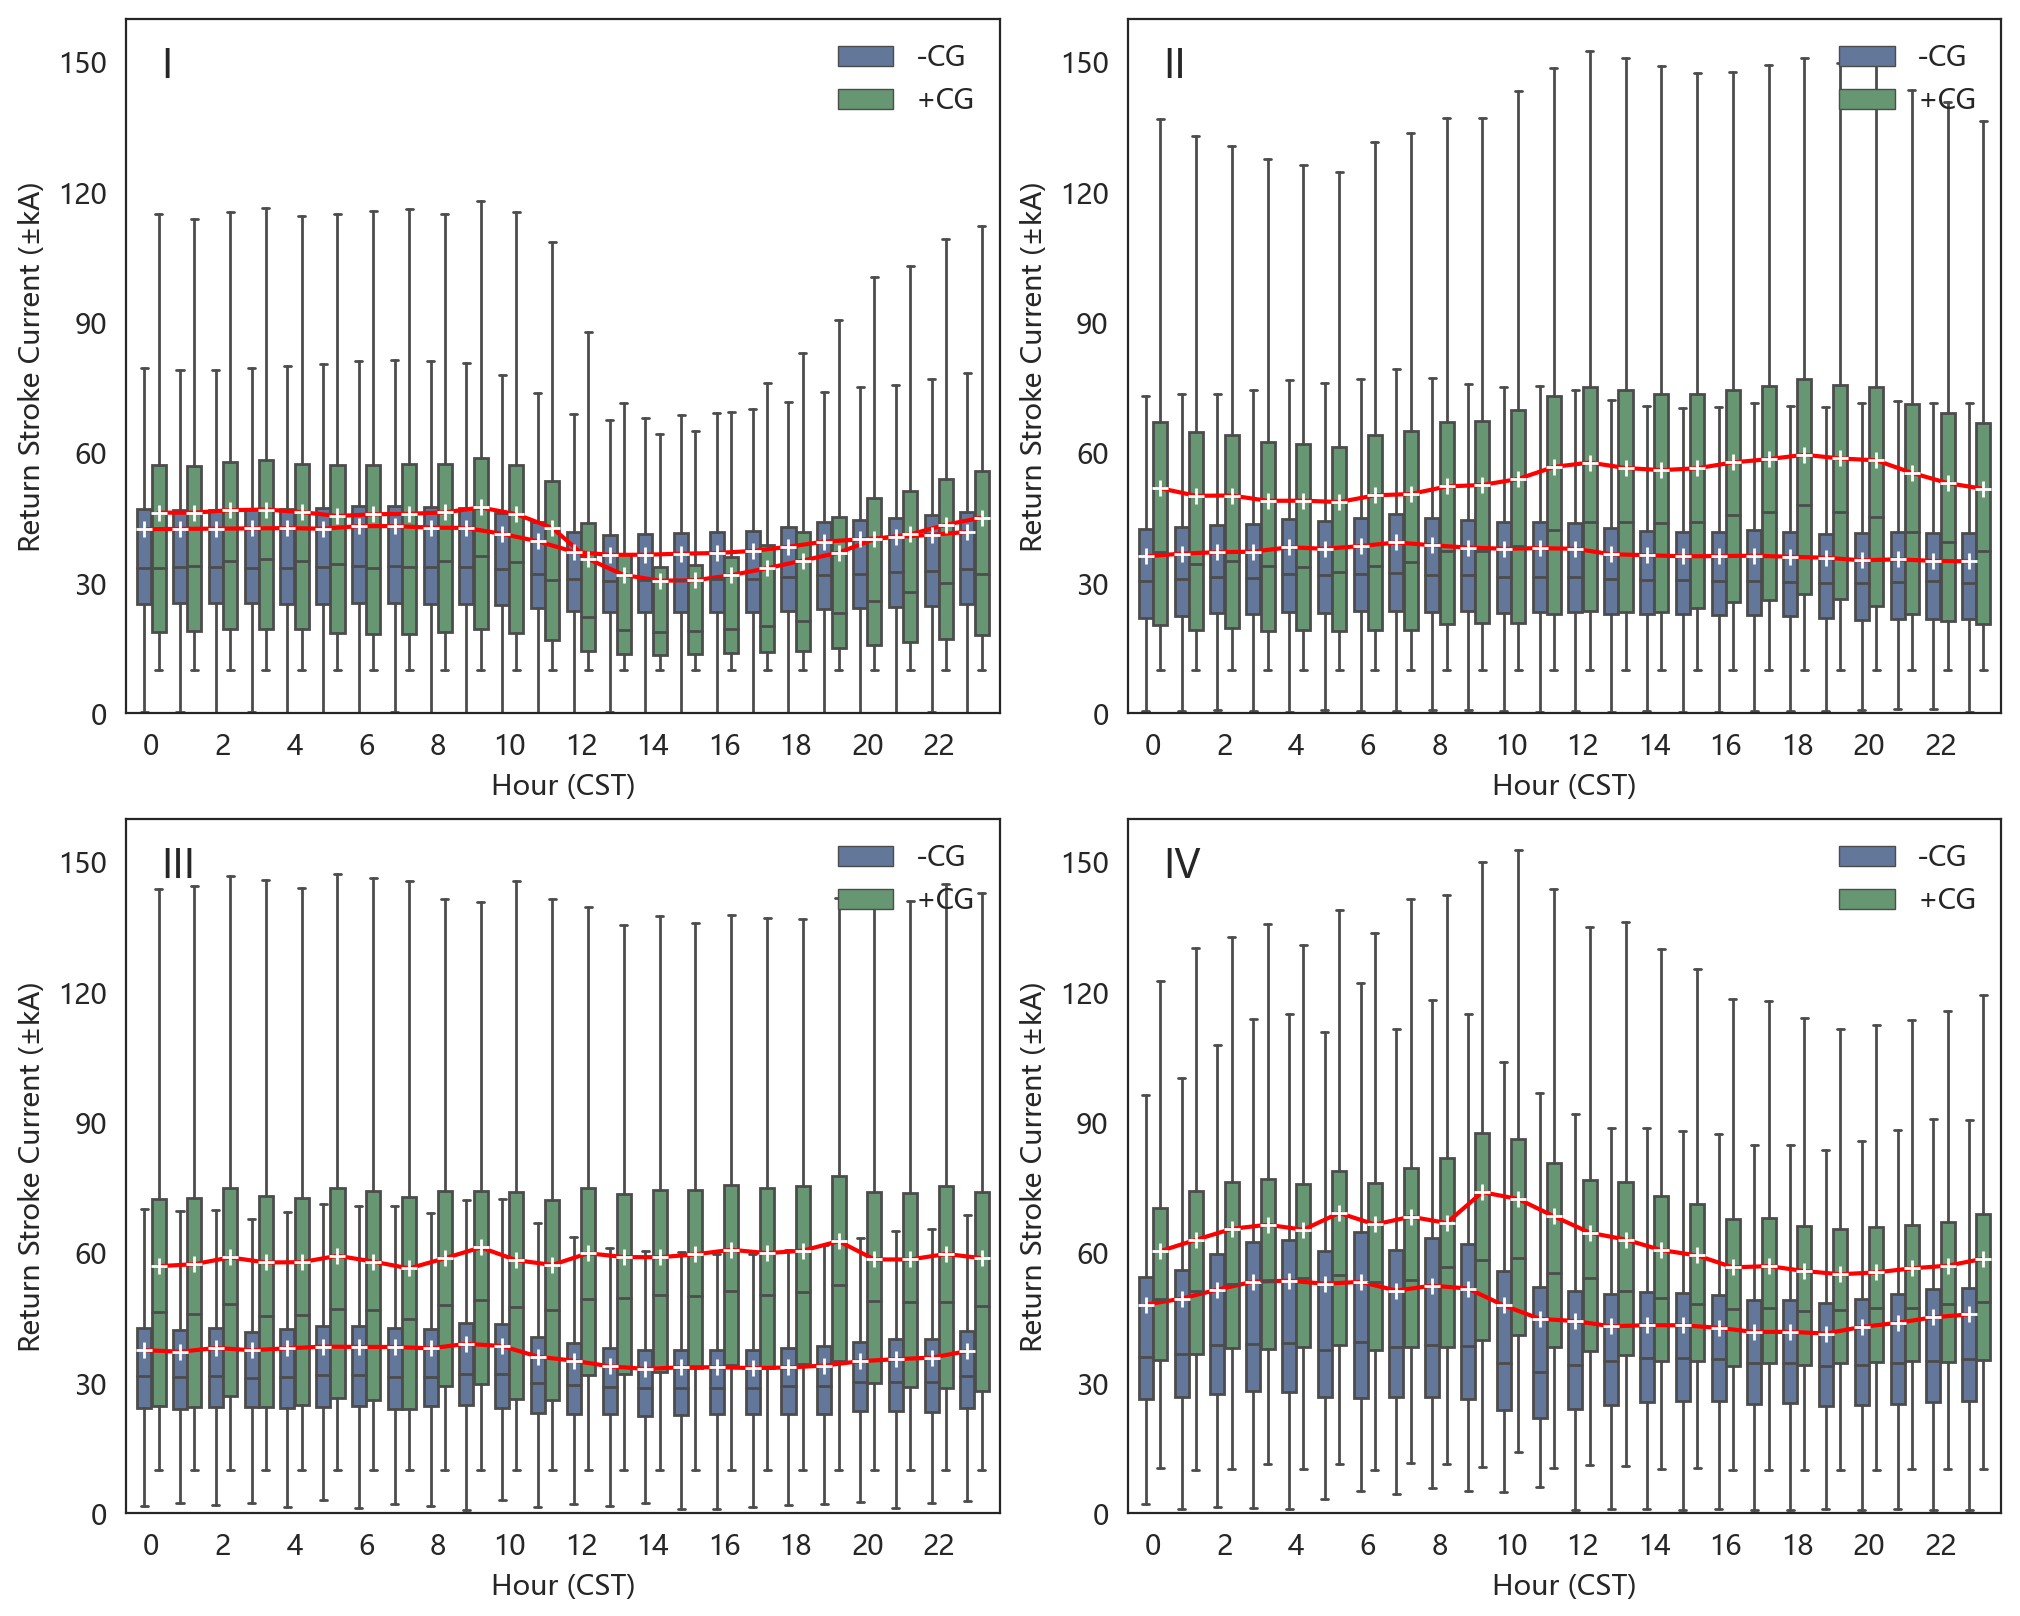
Figure 6Daily-scale variation in the peak current distribution of +CG and −CG strokes. The red line represents the average peak current value of each hour. The time zone is CST (UTC+8 h).
Figure 5 illustrates the hour-by-hour frequency and proportion variation in +CG strokes throughout the day. The frequency of both +CG and −CG strokes show noticeable and consistent fluctuations. The active period for lightning activity is concentrated in the late afternoon to the early hours, which coincides with the maximum accumulation of radiative heating and vapor conducive to the development of convection, particularly during summer thunderstorms in China. Stroke frequency peaks at 15:00 to 16:00 CST (China standard time, UTC+8 h) in Region-I and Region-II in the east of China and 1–2 h later in Region-III and Region-IV in the west of China. After nightfall, lightning activity gradually weakens due to the decline in unstable energy, dropping to a trough at 8:00–10:00 CST the following day. The monthly and hourly variations in lightning frequency are similar to the observations in Europe by EUCLID (Poelman et al., 2016) and in the US by NLDN (Koehler, 2020; Holle and Cummins, 2010).
The proportion of +CG strokes is inversely correlated with the total number of CG strokes in a day in Region-I, Region-II, and Region-IV, as shown in Fig. 5. The maxima of the +CG stroke proportion coincides with the lowest frequency at 8:00–10:00 CST in all four regions, but the minima appear 2–3 h earlier than the frequency peak. Region-I and Region-IV at low latitudes have maximum proportions in the morning, while Region-II and Region-III at high latitudes have maximum proportions in the evening. Additionally, the proportion of +CG strokes is lower in Region-I and Region-IV, with values of less than 20 %, than in Region-II and Region-III, with values of over 20 %. These findings demonstrate a close relationship between thunderstorm characteristics and geographical features such as latitude, topography, and sea distance.
The hourly distribution of the peak current value and its average is illustrated in Fig. 6. Region-II and Region-III, situated at higher latitudes, exhibit a broader range of peak current distribution. Despite this, their variation remains relatively stable, with a slightly larger current for +CG strokes in Region-III than Region-II. In Region-1, there is a significant decrease in current during the midday and afternoon periods, with a more pronounced change observed in +CG strokes than in −CG strokes. This phenomenon leads to a situation where the absolute peak current of the two types of stroke can even be reversed. Conversely, Region-IV, characterized by the intricate terrain resulting from the Tibetan Plateau, showcases complex current variations. Specifically, there is an increase in peak current for +CG strokes and a decrease for −CG strokes since 08:00 CST in this region. Consequently, a substantial disparity in peak current between the two types emerges around the daytime hours.
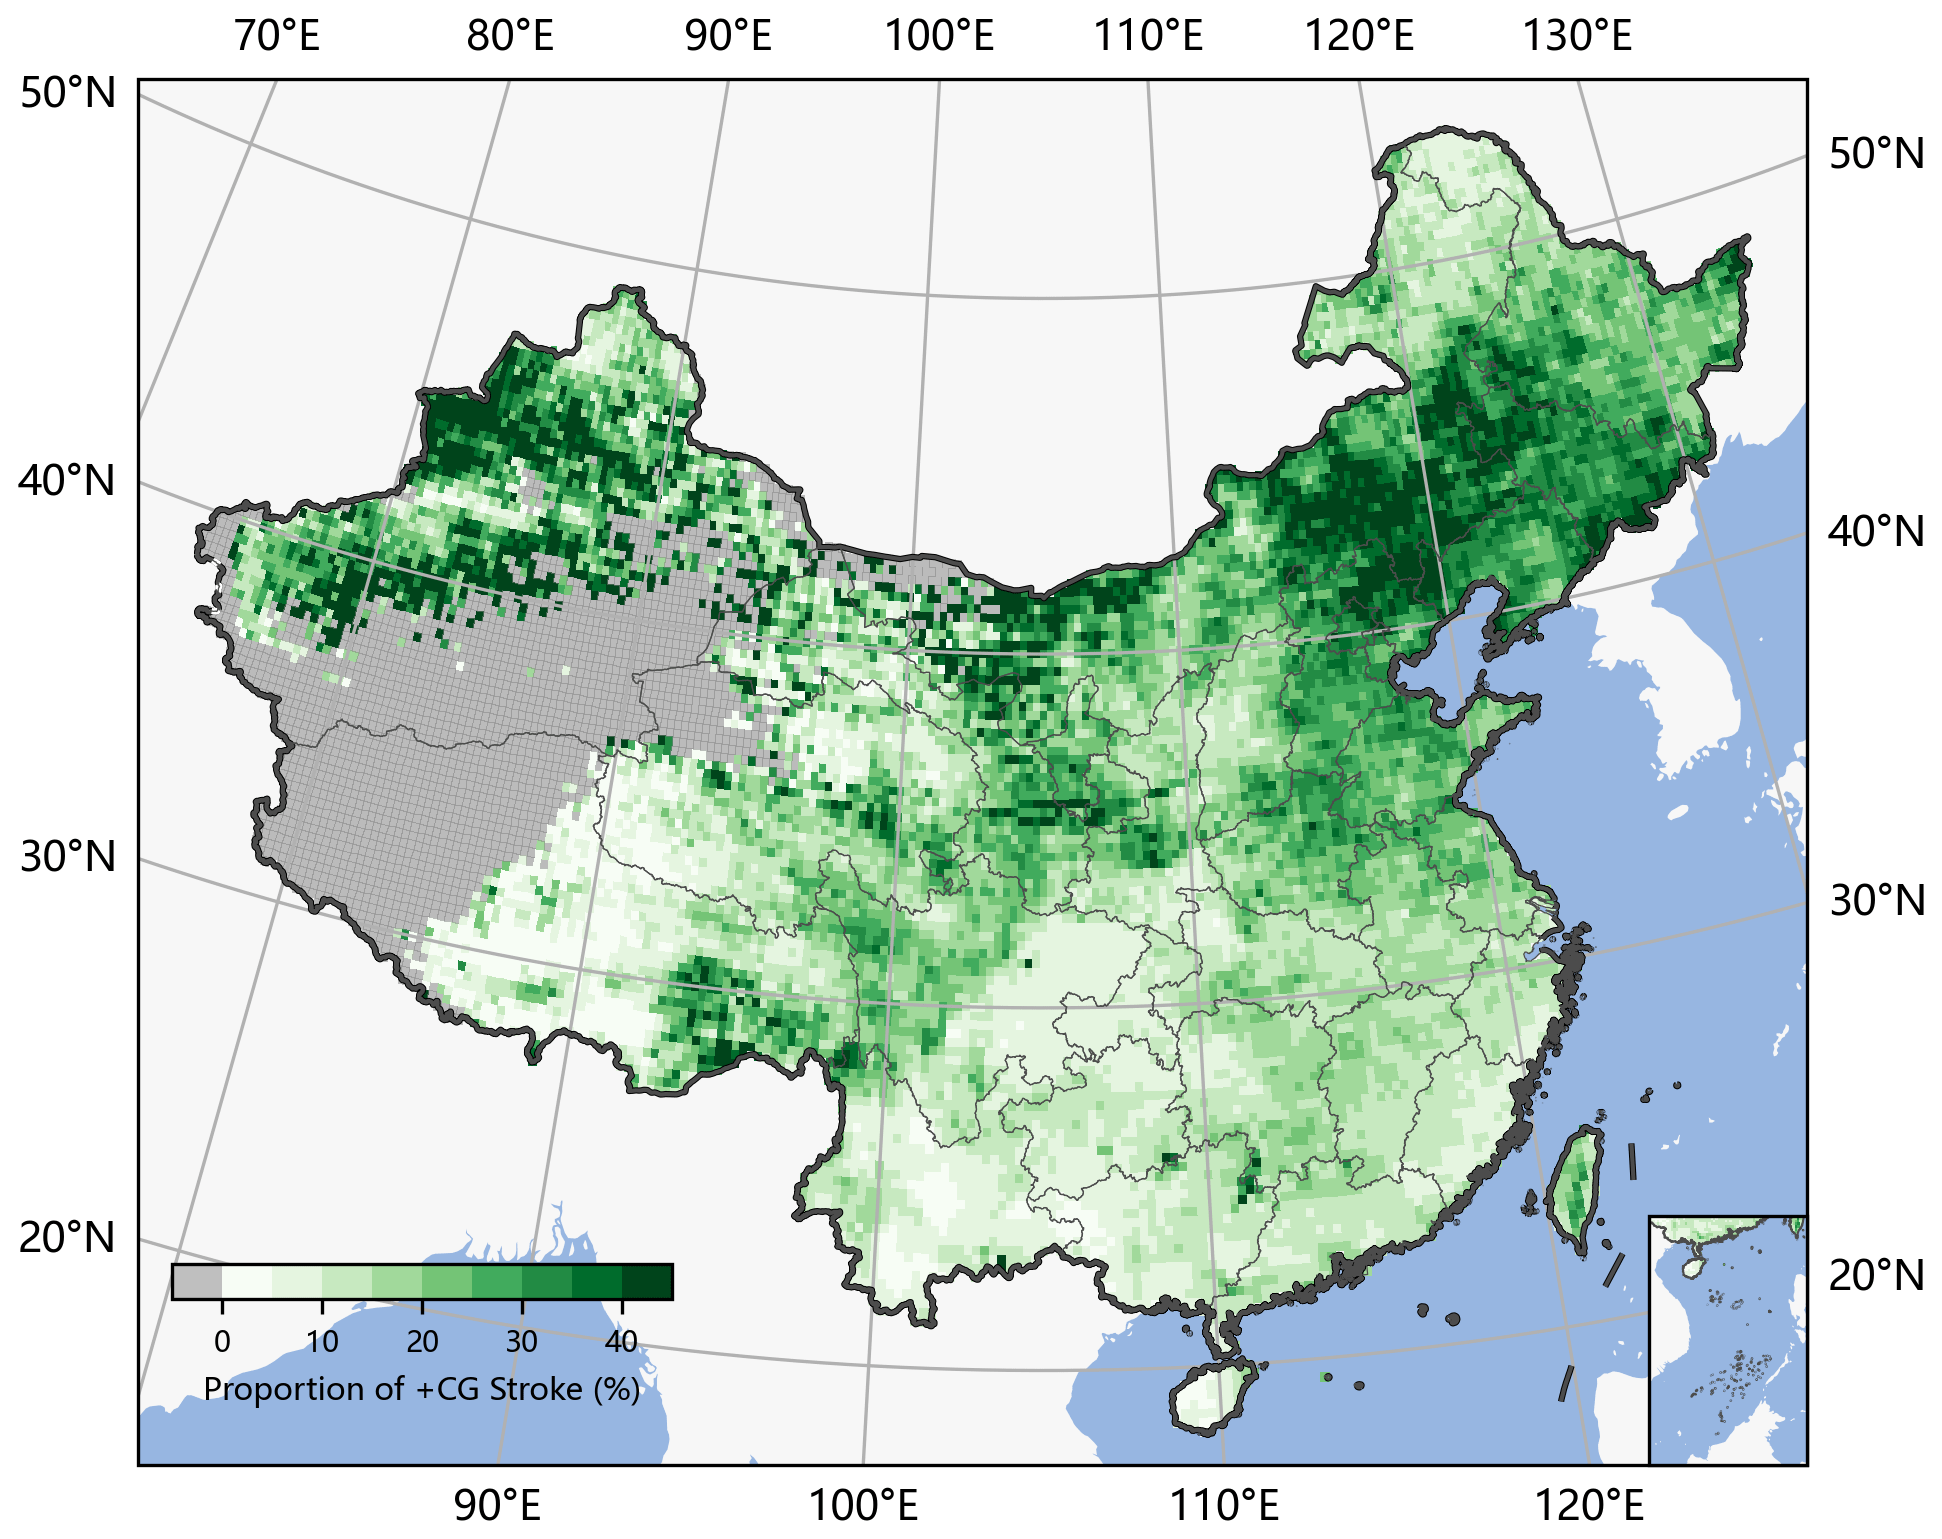
Figure 7Distribution of the proportion of +CG strokes in China. The gray grids have a CG stroke number of less than 50 in 7 years and thus are not calculated. The grid size is . Publisher's remark: please note that the above figure contains disputed territories.
3.2.2 Comparison of spatial distribution of +CG and −CG strokes
The geographical features of China contribute to the complex distribution of +CG and −CG strokes across various regions, which is reflected in the variability in the ratio of +CG and −CG strokes. Figure 7 illustrates the spatial distribution of the proportion of +CG strokes, with gray areas indicating grids with fewer than 50 CG strokes accumulated over a 7-year period. These grids are mainly located in the central, western, and northern parts of Tibet and the western and southern parts of Xinjiang. Region-I, which has the highest density of CG strokes, has a low proportion of +CG strokes, at less than 10 %. Conversely, the other three regions have a higher proportion of +CG strokes, particularly the North China Plain and adjacent Inner Mongolia, as well as some parts of Xinjiang, where the +CG proportion can reach 30 %–40 %. The proportion of +CG strokes in Shanxi and Shaanxi, both located in Region-II, is lower than in other regions of the same area. Overall, regions with lower CG stroke density tend to have a higher proportion of +CG strokes, and high latitudes correspond to a higher +CG stroke proportion.
Based on Fig. 8, it can be inferred that the spatial distribution of the peak current values for both +CG and −CG strokes is generally similar, with lower peak current values observed in southeast China where lightning activity is more frequent and higher peak current values found in other inland areas. Notably, the peak current in Mêdog County (o) is especially high, with most areas with an average of over 100 kA. Besides, southern Gansu; southern Shaanxi; and the intersection of Guizhou, Hunan, and Guangxi are also recognized as high-value regions, where the proportion of +CG strokes is also relatively high. Therefore, it can be concluded that a high proportion of +CG strokes typically corresponds to larger peak current values in terms of temporal and spatial scales.
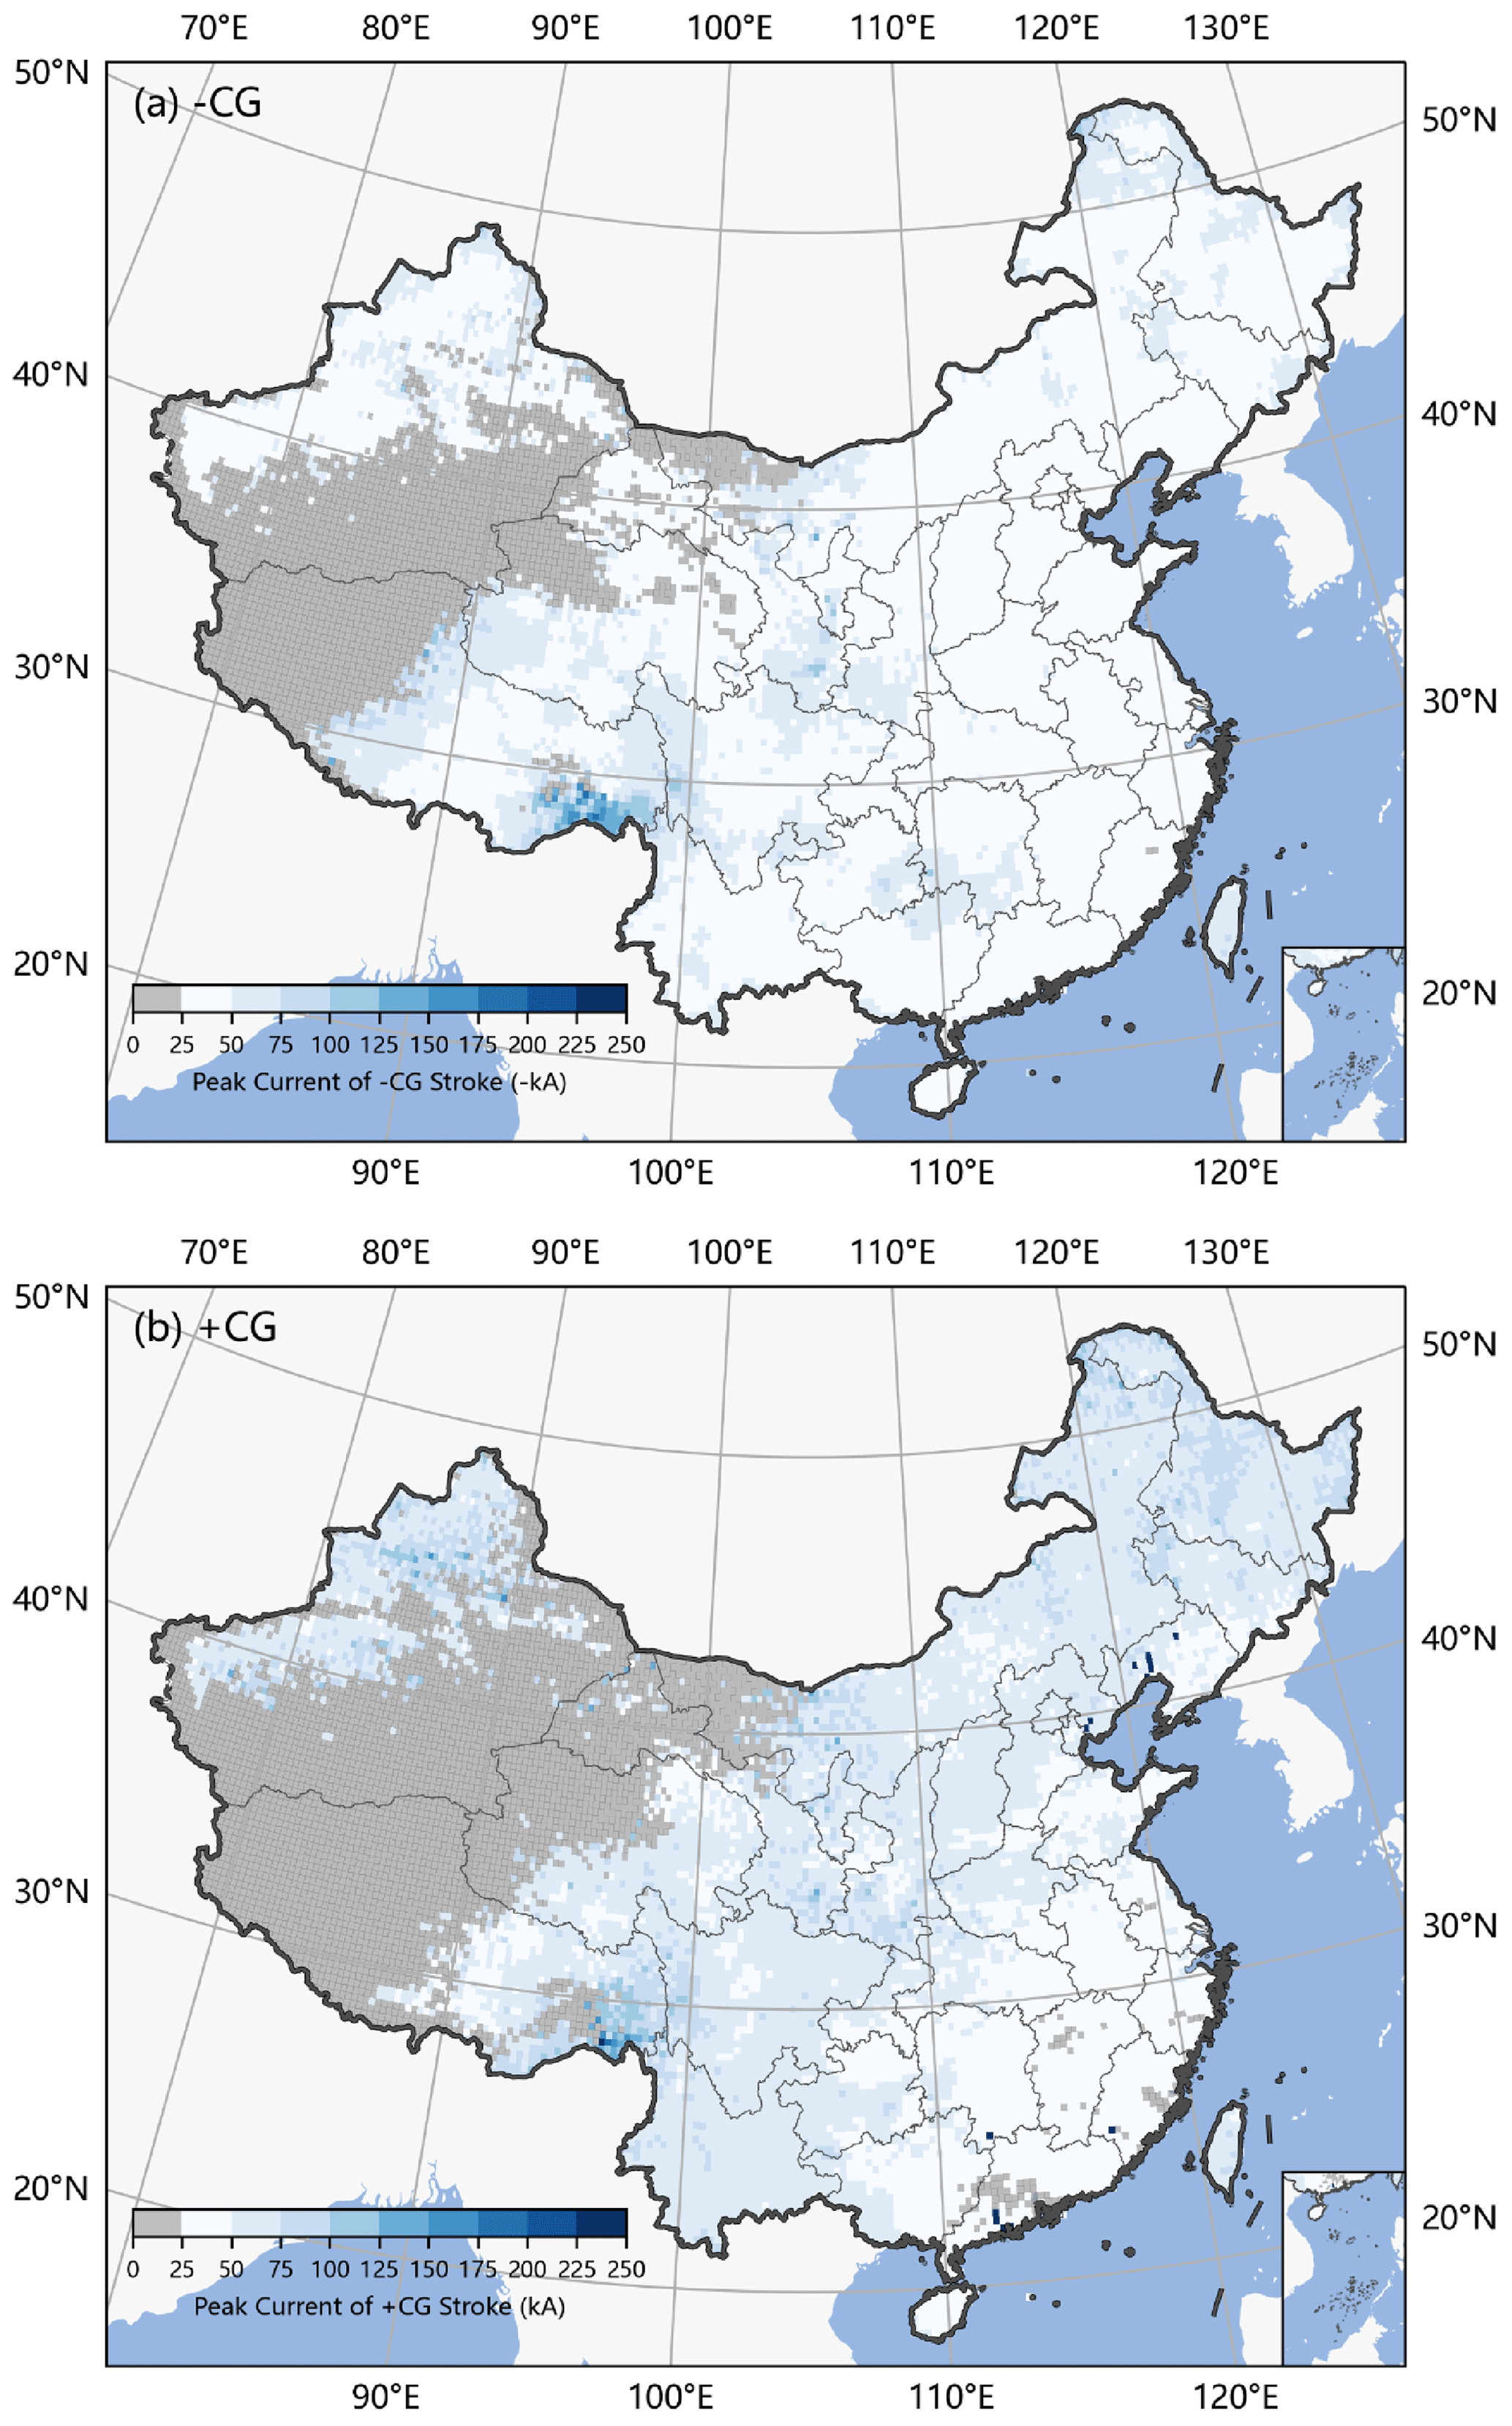
Figure 8Distribution of the average peak current values of (a) −CG strokes and (b) +CG strokes in China. The gray grids have a −CG stroke or +CG stroke number of less than 50 in 7 years and thus are not calculated. The grid size is . Publisher's remark: please note that the above figure contains disputed territories.
The proportion of +CG strokes in different altitude layers is calculated, as shown by the gray line in Fig. 9. Below 4500 m altitude, the proportion increases with altitude, ranging from 7 % to over 15 %. A sub-peak is observed at 1500 m, which is caused by the high-proportion region of +CG strokes in Xinjiang and Inner Mongolia. However, above 4500 m altitude, which mainly comprises the uninhabited areas of the western and northern Tibetan Plateau, the proportion of +CG strokes decreases rapidly. It is worth noting that only 91 CG strokes were observed above 6000 m altitude during the 7-year period and are not included in the statistics.
The box plot in Fig. 9 shows the peak current distribution of +CG and −CG strokes at different altitudes. The distribution of +CG peak current narrows with increasing altitude. Interestingly, the average peak current of −CG strokes shows a slight positive correlation with altitude, whereas +CG strokes exhibit a negative correlation with altitude. The opposite trend of the two types of lightning strokes leads to a large difference in their peak current at low altitudes and coincidence at high altitudes. The Tibetan Plateau is primarily responsible for the intricate lightning activity versus altitude over China. As the “third pole” of the Earth, the charge structure of thunderstorm clouds on the Tibetan Plateau always has some special characteristics due to the high-altitude ground surface (Li et al., 2013; Qie et al., 2005). Furthermore, its influence on the uplift and obstruction of water vapor can also affect the climatic characteristics of other regions.
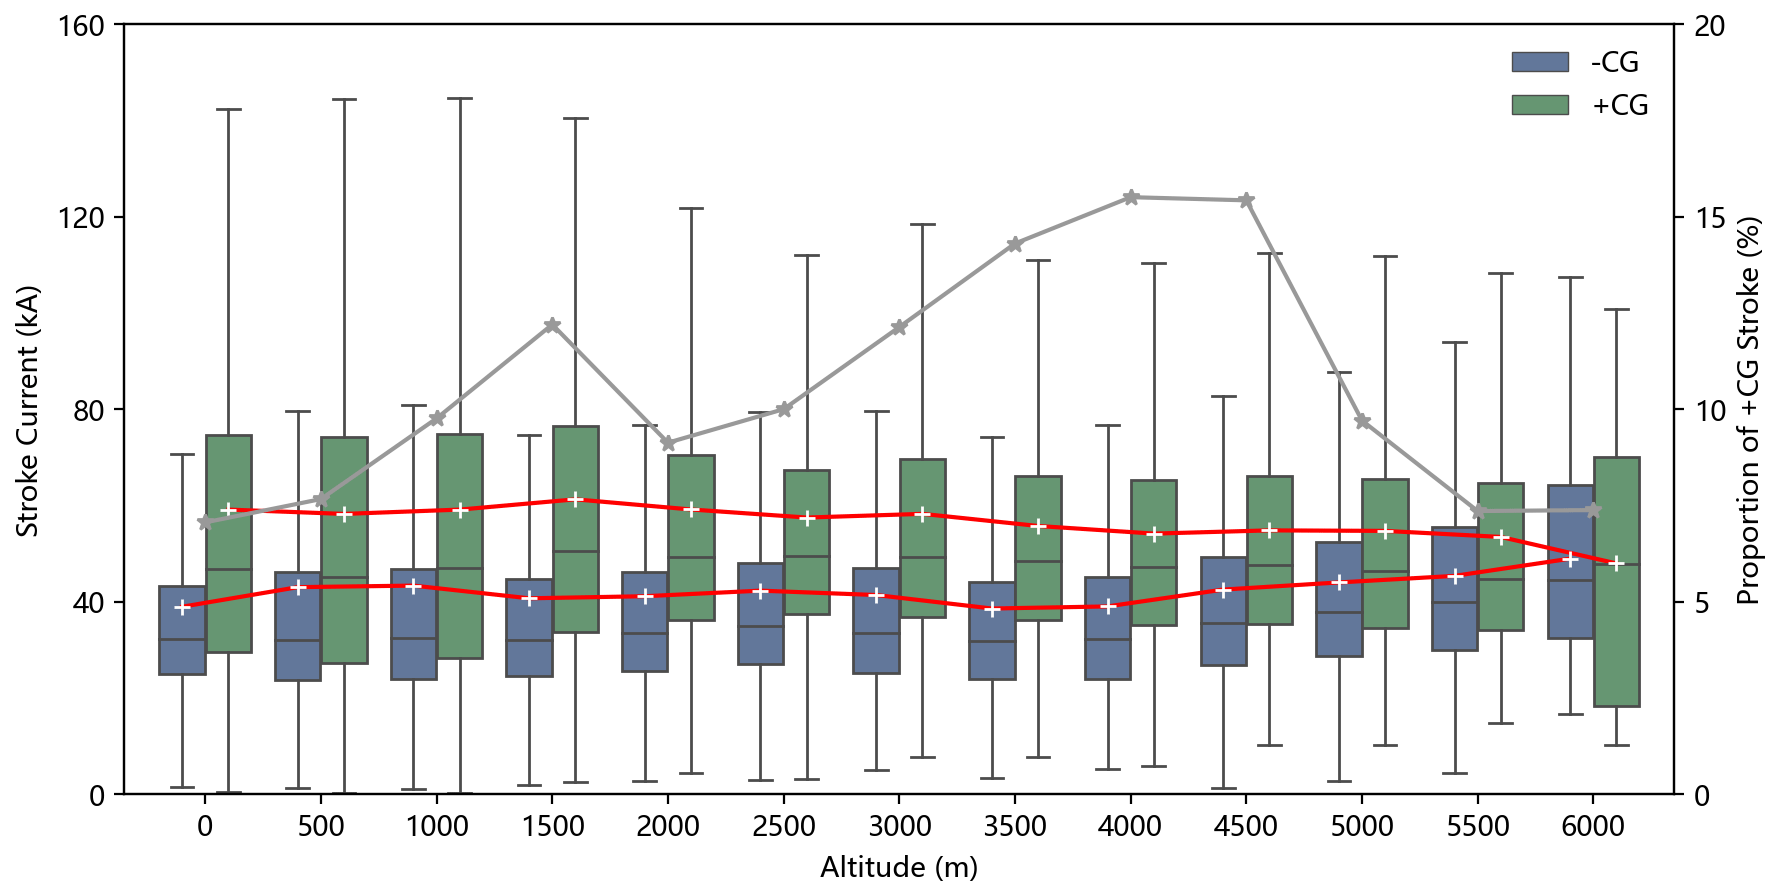
Figure 9The peak current distribution of +CG and −CG strokes and the proportion of +CG versus altitude.
China is primarily located in temperate and subtropical zones, with climate subject to a variety of factors, including cold and warm monsoons, the interplay of land and sea, and varied topography. As a result, there are frequent convective weather events and a high prevalence of lightning activity. This paper utilizes the dataset from a ground-based lightning location system, CNLDN, which serves as the most extensively deployed national lightning detection system in China, to analyze the CG characteristics in China over the past 7 years. The spatial and temporal distribution of +CG and −CG strokes exhibits regular patterns in terms of their frequency, proportion, and peak current.
The results indicate that there is more CG in southern regions than in northern regions, more in mountainous areas than in plains at the same latitude, more in humid areas than in arid areas, and more in coastal areas than in inland areas within the same climate zone. The southeast coastland of China has the highest CG stroke density, while the northwest deserts and basins, as well as the east and north Tibetan Plateau, have the lowest density. The monsoon system plays a critical role in lightning activity in southern and northern China, while the Tibetan Plateau contributes to the variability in lightning activity in northwestern China and the Qinghai–Tibet region. Overall, the distribution of lightning activity across China is consistent with the precipitation distribution observed at a climatic scale.
In general, +CG strokes have a lower occurrence rate than −CG strokes, but they carry higher currents and are more destructive. The spatial and temporal distribution of +CG and −CG strokes also varies significantly due to different storm structures. In terms of annual scale, the lightning activity follows a seasonal pattern, with the highest frequency occurring during summer (72.6 %), followed by spring (18.4 %) and autumn (8.6 %), and the least frequent in winter (0.4 %). In spring, autumn, and winter, lightning is mainly concentrated in the southeastern coastal areas. The percentage of +CG strokes is always inversely correlated with lightning frequency. High stroke frequency in summer generally corresponds to a low proportion of +CG strokes, while low frequency in winter corresponds to a high proportion of +CG strokes. The proportion of +CG strokes in December in most regions reaches up to 50 %. The average peak current of return strokes is strongly correlated with the proportion of +CG strokes and also follows a seasonal pattern of being high in winter and low in summer. The seasonal fluctuations in +CG strokes are stronger than −CG strokes in southern China and northern China, where the average intensity of +CG strokes in summer is even below −CG strokes. On the hourly scale, lightning is active in the late afternoon, with a peak between 15:00–17:00 CST, and drops to a trough the following day between 8:00–10:00 CST. The proportion of +CG strokes throughout the day follows an inverse trend with the frequency of strokes in most regions, but the minimum proportion occurs 2–3 h earlier than the maximum frequency. The highest proportion of +CG strokes at low latitudes always occurs in the morning, while at high latitudes, it tends to occur at midnight. The changes in peak current during the day at high latitudes are not significant. In southern China, the peak current of +CG and −CG strokes drops significantly at noon and afternoon, with +CG dropping even lower than −CG.
The distribution of the +CG stroke proportion exhibits significant spatial variability. In southern China, where the density of CG is the highest, the +CG stroke proportion is the lowest, at less than 10 %. In contrast, the high-latitude regions such as the North China Plain, Inner Mongolia, and northern and central Xinjiang have a much higher proportion of 30 %–40 %. The proportion of +CG strokes below 4500 m is positively correlated with altitude and drops sharply after exceeding 4500 m in the western and northern regions of the Tibetan Plateau. The spatial distribution of peak current values of +CG and −CG strokes is consistent, and a higher proportion of +CG strokes is generally associated with greater peak current for both types. As latitude increases, the current distribution widens. The peak current of +CG shows a slight decrease with increasing altitude, while the peak current of −CG increases with altitude. Consequently, there is a significant difference in discharge intensities between the two types at low altitudes, but they tend to be similar at higher altitudes.
The lightning location system sites cannot be evenly distributed due to geographic factors, thus bringing about errors in lightning distribution analysis. The observation from the Lightning Mapping Imager (LMI) on the FY-4A satellite will be used to correct the distribution deviations by ground-based data in our following research. Given the vast size of China, a simple division into four regions may be too crude to study the influence of geographic and climatic factors on CG characteristics in depth. Therefore, a more detailed division will be necessary for future studies.
The codes are freely available to the public and can be downloaded from https://figshare.com/articles/software/Characteristics_of_cloud-to-ground_lightning_CG_and_differences_between_CG_and_-CG_strokes_in_China_regarding_the_China_National_Lightning_Detection_Network/24598173 (Jiang, 2023).
The data from the research findings cannot be shared because the observation data of basic meteorological elements of the China Meteorological Administration are not open to the public.
RJ did the main numerical analysis and was involved in writing the paper and in scientific discussions for the whole text. XZ, GZ, and SW were involved in editing the paper and in scientific discussions for the whole text. BX and ZX were involved in preparing the background material, editing the paper, and participating in the scientific discussions for the whole text. TY, KW, and JD were involved in the creation of the numerical code, in editing the paper, and in coordinating the scientific discussions for the whole text. All authors read and commented on the text of the paper at all stages.
The contact author has declared that none of the authors has any competing interests.
Publisher’s note: Copernicus Publications remains neutral with regard to jurisdictional claims made in the text, published maps, institutional affiliations, or any other geographical representation in this paper. While Copernicus Publications makes every effort to include appropriate place names, the final responsibility lies with the authors.
We appreciate the Meteorological Observation Centre of CMA and the Institute of Electrical Engineering of CAS for their data support. We also thank the reviewers and editors for their valuable suggestions for this study.
This research has been supported by the Key Technologies Research and Development Program (grant no. 2020YFB1600103).
This paper was edited by Vassiliki Kotroni and reviewed by three anonymous referees.
Carey, L. D. and Buffalo, K. M.: Environmental control of cloud-to-ground lightning polarity in severe storms, Mon. Weather Rev., 135, 1327—1353, 2007.
Cummins, K. L., Murphy, M. J., Bardo, E. A., Hiscox, W. L., Pyle, R. B., and Pifer, A. E.: A combined TOA/MDF technology upgrade of the US National Lightning Detection Network, J. Geophys. Res.-Atmos., 103, 9035–9044, 1998.
Diendorfer, G.: Some comments on the achievable accuracy of local ground flash density values, in: International Lightning Detection Conference, June 2008, Uppsala, Sweden, 2008.
Feng, M. X., Zhou, Y., Yu, M., and Zhang, Y. H.: Evaluation of Jiangsu ADTD Lightning Location System Data in 2013, Sci. Technol. Eng, 15, 7984, 2015.
Holle, R. L. and Cummins, K. L.: Monthly distributions of US NLDN cloud-to-ground lightning, in: 3rd International Lightning Meteorology Conference, April 2010, Orlando, FL, USA, 21–22, 2010.
Jiang, R.: Observation and Simulation of CG Lightning Activity Characteristics in the Regions with Tall Structures, PhD Thesis, Beijing, University of Chinese Academy of Sciences, 2021.
Jiang, R.: Characteristics of cloud-to-ground lightning (CG) and differences between +CG and -CG strokes in China regarding the China National Lightning Detection Network, https://figshare.com/articles/software/Characteristics_of_cloud-to-ground_lightning_CG_and_differences_between_CG_and_-CG_strokes_in_China_regarding_the_China_National_Lightning_Detection_Network/24598173 (last access: 21 November 2023), 2023.
Jin, H., Chen, X., Wu, P., Song, C., and Xia, W.: Evaluation of spatial-temporal distribution of precipitation in mainland China by statistic and clustering methods, Atmos. Res., 262, 105772, https://doi.org/10.1016/j.atmosres.2021.105772, 2021.
Koehler, T. L.: Cloud-to-ground lightning flash density and thunderstorm day distributions over the contiguous United States derived from NLDN measurements: 1993–2018, Mon. Weather Rev., 148, 313–332, 2020.
Li, Y., Zhang, G., Wen, J., Wang, D., Wang, Y., Zhang, T., Fan, X., and Wu, B.: Electrical structure of a Qinghai–Tibet Plateau thunderstorm based on three-dimensional lightning mapping, Atmos. Res., 134, 137–149, 2013.
Ma, M., Tao, S., Zhu, B., and Lü, W.: Climatological distribution of lightning density observed by satellites in China and its circumjacent regions, Sci. China Ser. D, 48, 219–229, 2005.
Ma, R., Zheng, D., Zhang, Y., Yao, W., Zhang, W., and Cuomu, D.: Spatiotemporal Lightning Activity Detected by WWLLN over the Tibetan Plateau and Its Comparison with LIS Lightning, J. Atmos. Ocean. Tech., 38, 511–523, 2021.
Nag, A., Rakov, V. A., and Cummins, K. L.: Positive Lightning Peak Currents Reported by the U.S. National Lightning Detection Network, IEEE T. Electromagn. C., 56, 404–412, 2014.
Poelman, D. R., Schulz, W., Diendorfer, G., and Bernardi, M.: The European lightning location system EUCLID – Part 2: Observations, Nat. Hazards Earth Syst. Sci., 16, 607–616, https://doi.org/10.5194/nhess-16-607-2016, 2016.
Preston and Tolver, S.: The lightning discharge, Philosophical Magazine Series 1, 31, 443–445, 1989.
Qie, X., Toumi, R., and Zhou, Y.: Lightning activity on the central Tibetan Plateau and its response to convective available potential energy, Chinese Sci. Bull., 48, 296–299, 2003.
Qie, X., Zhang, T., Chen, C., Zhang, G., Zhang, T., and Wei, W.: The lower positive charge center and its effect on lightning discharges on the Tibetan Plateau, Geophys. Res. Lett., 32, L05814, 2005.
Rakov, V. A. and Uman, M. A.: Lightning: Physics and Effects, Cambridge Univ. Press, 2003.
Ren, G., Ding, Y., Zhao, Z., Zheng, J., Wu, T., Tang, G., and Xu, Y.: Recent progress in studies of climate change in China, Adv. Atmos. Sci., 29, 958–977, 2012.
Rudlosky, S. D. and Fuelberg, H. E.: Pre-and postupgrade distributions of NLDN reported cloud-to-ground lightning characteristics in the contiguous United States, Mon. Weather Rev., 138, 3623–3633, 2010.
Rudlosky, S. D. and Shea, D. T.: Evaluating WWLLN performance relative to TRMM/LIS, Geophys. Res. Lett., 40, 2344–2348, 2013.
Said, R., Cohen, M., and Inan, U.: Highly intense lightning over the oceans: Estimated peak currents from global GLD360 observations, J. Geophys. Res.-Atmos., 118, 6905–6915, 2013.
Schulz, W., Diendorfer, G., Pedeboy, S., and Poelman, D. R.: The European lightning location system EUCLID – Part 1: Performance analysis and validation, Nat. Hazards Earth Syst. Sci., 16, 595–605, https://doi.org/10.5194/nhess-16-595-2016, 2016.
Shao, X.-M., Stanley, M., Regan, A., Harlin, J., Pongratz, M., and Stock, M.: Total lightning observations with the new and improved Los Alamos Sferic Array (LASA), J. Atmos. Ocean. Technol., 23, 1273–1288, 2006.
Srivastava, A., Tian, Y., Qie, X., Wang, D., Sun, Z., Yuan, S., Wang, Y., Chen, Z., Xu, W., and Zhang, H.: Performance assessment of Beijing Lightning Network (BLNET) and comparison with other lightning location networks across Beijing, Atmos. Res., 197, 76–83, 2017.
Wang, J., Huang, Q., Ma, Q., Chang, S., He, J., Wang, H., Zhou, X., Xiao, F., and Gao, C.: Classification of VLF/LF Lightning Signals Using Sensors and Deep Learning Methods, Sensors, 20, 1030, 2020.
Williams, E. R.: Large-scale charge separation in thunderclouds, J. Geophys. Res.-Atmos., 90, 6013–6025, 1985.
Wu, S., Weitao, L., Qi, Q., Wu, B., Chen, L., Su, Z., Jiang, R., and Zhang, C.: Characteristics of Downward Cloud-to-ground Lightning Flashes Around Canton Tower Based on Optical Observations, Journal of Applied Meteorological Science, 30, 203–210, 2019.
Xia, R., Zhang, D.-L., and Wang, B.: A 6-yr cloud-to-ground lightning climatology and its relationship to rainfall over central and eastern China, Journal of Applied Meteorology and Climatology, 54, 2443–2460, 2015.
You, J., Zheng, D., Zhang, Y., Yao, W., and Meng, Q.: Duration, spatial size and radiance of lightning flashes over the Asia-Pacific region based on TRMM/LIS observations, Atmos. Res., 223, 98–113, 2019.