the Creative Commons Attribution 4.0 License.
the Creative Commons Attribution 4.0 License.
 | 20 Nov 2023
Boulder transport and wave height of a seventeenth-century South China Sea tsunami on Penghu Islands, Taiwan
Neng-Ti Yu
Cheng-Hao Lu
I-Chin Yen
Jia-Hong Chen
Jiun-Yee Yen
Shyh-Jeng Chyi
The South China Sea faces widespread tsunami risks from diverse sources, including trench megathrusts, intraplate earthquakes, and landslides. However, historical and geological records to constrain worse-case simulations are scarce. The cliff-top basalt boulders on the Penghu Islands in the Taiwan Strait provide wave estimates from incipient motion formulas and stratigraphic links to the probable sources. Calibrating for ancient local sea levels and a 100-year surge indicates that storm waves in the shallow interisland bathymetry only enable boulder sliding–rolling below the 2.5 m high cliff. A minimum tsunami wave height of ∼ 3.2 m is necessary for cliff-top overflow to exceed boulder height and terminal rolling before deposition. Coeval gravels in two other outcrops also record the time and extent of tsunami deposition with beach-derived bioclasts, stranded pumices, a sharp base, matrix support, poor sorting, and elevations surpassing the 100-year surge. These gravels mark local minimum wave run-ups, reaching 2.4–4.0 m above sea level. The radiocarbon age of the studied boulder, between 1575 and 1706, suggests a probable tie to the disastrous 1661 earthquake in southwest Taiwan and the megathrust source in the northern Manila Trench.
- Article
(9489 KB) - Full-text XML
- BibTeX
- EndNote


Devastating wave impacts, such as those associated with annual typhoons, pose a constant threat along the coasts of the South China Sea. Despite being often overlooked because of extended recurrence, tsunamis present severe risks in the region due to their ubiquitous and diverse sources, such as the Manila Trench in the east, intraplate seismicity in the north–west, and steep slopes with pronounced landslide potential throughout the area (Fig. 1a; Goff et al., 2020; Terry et al., 2017).
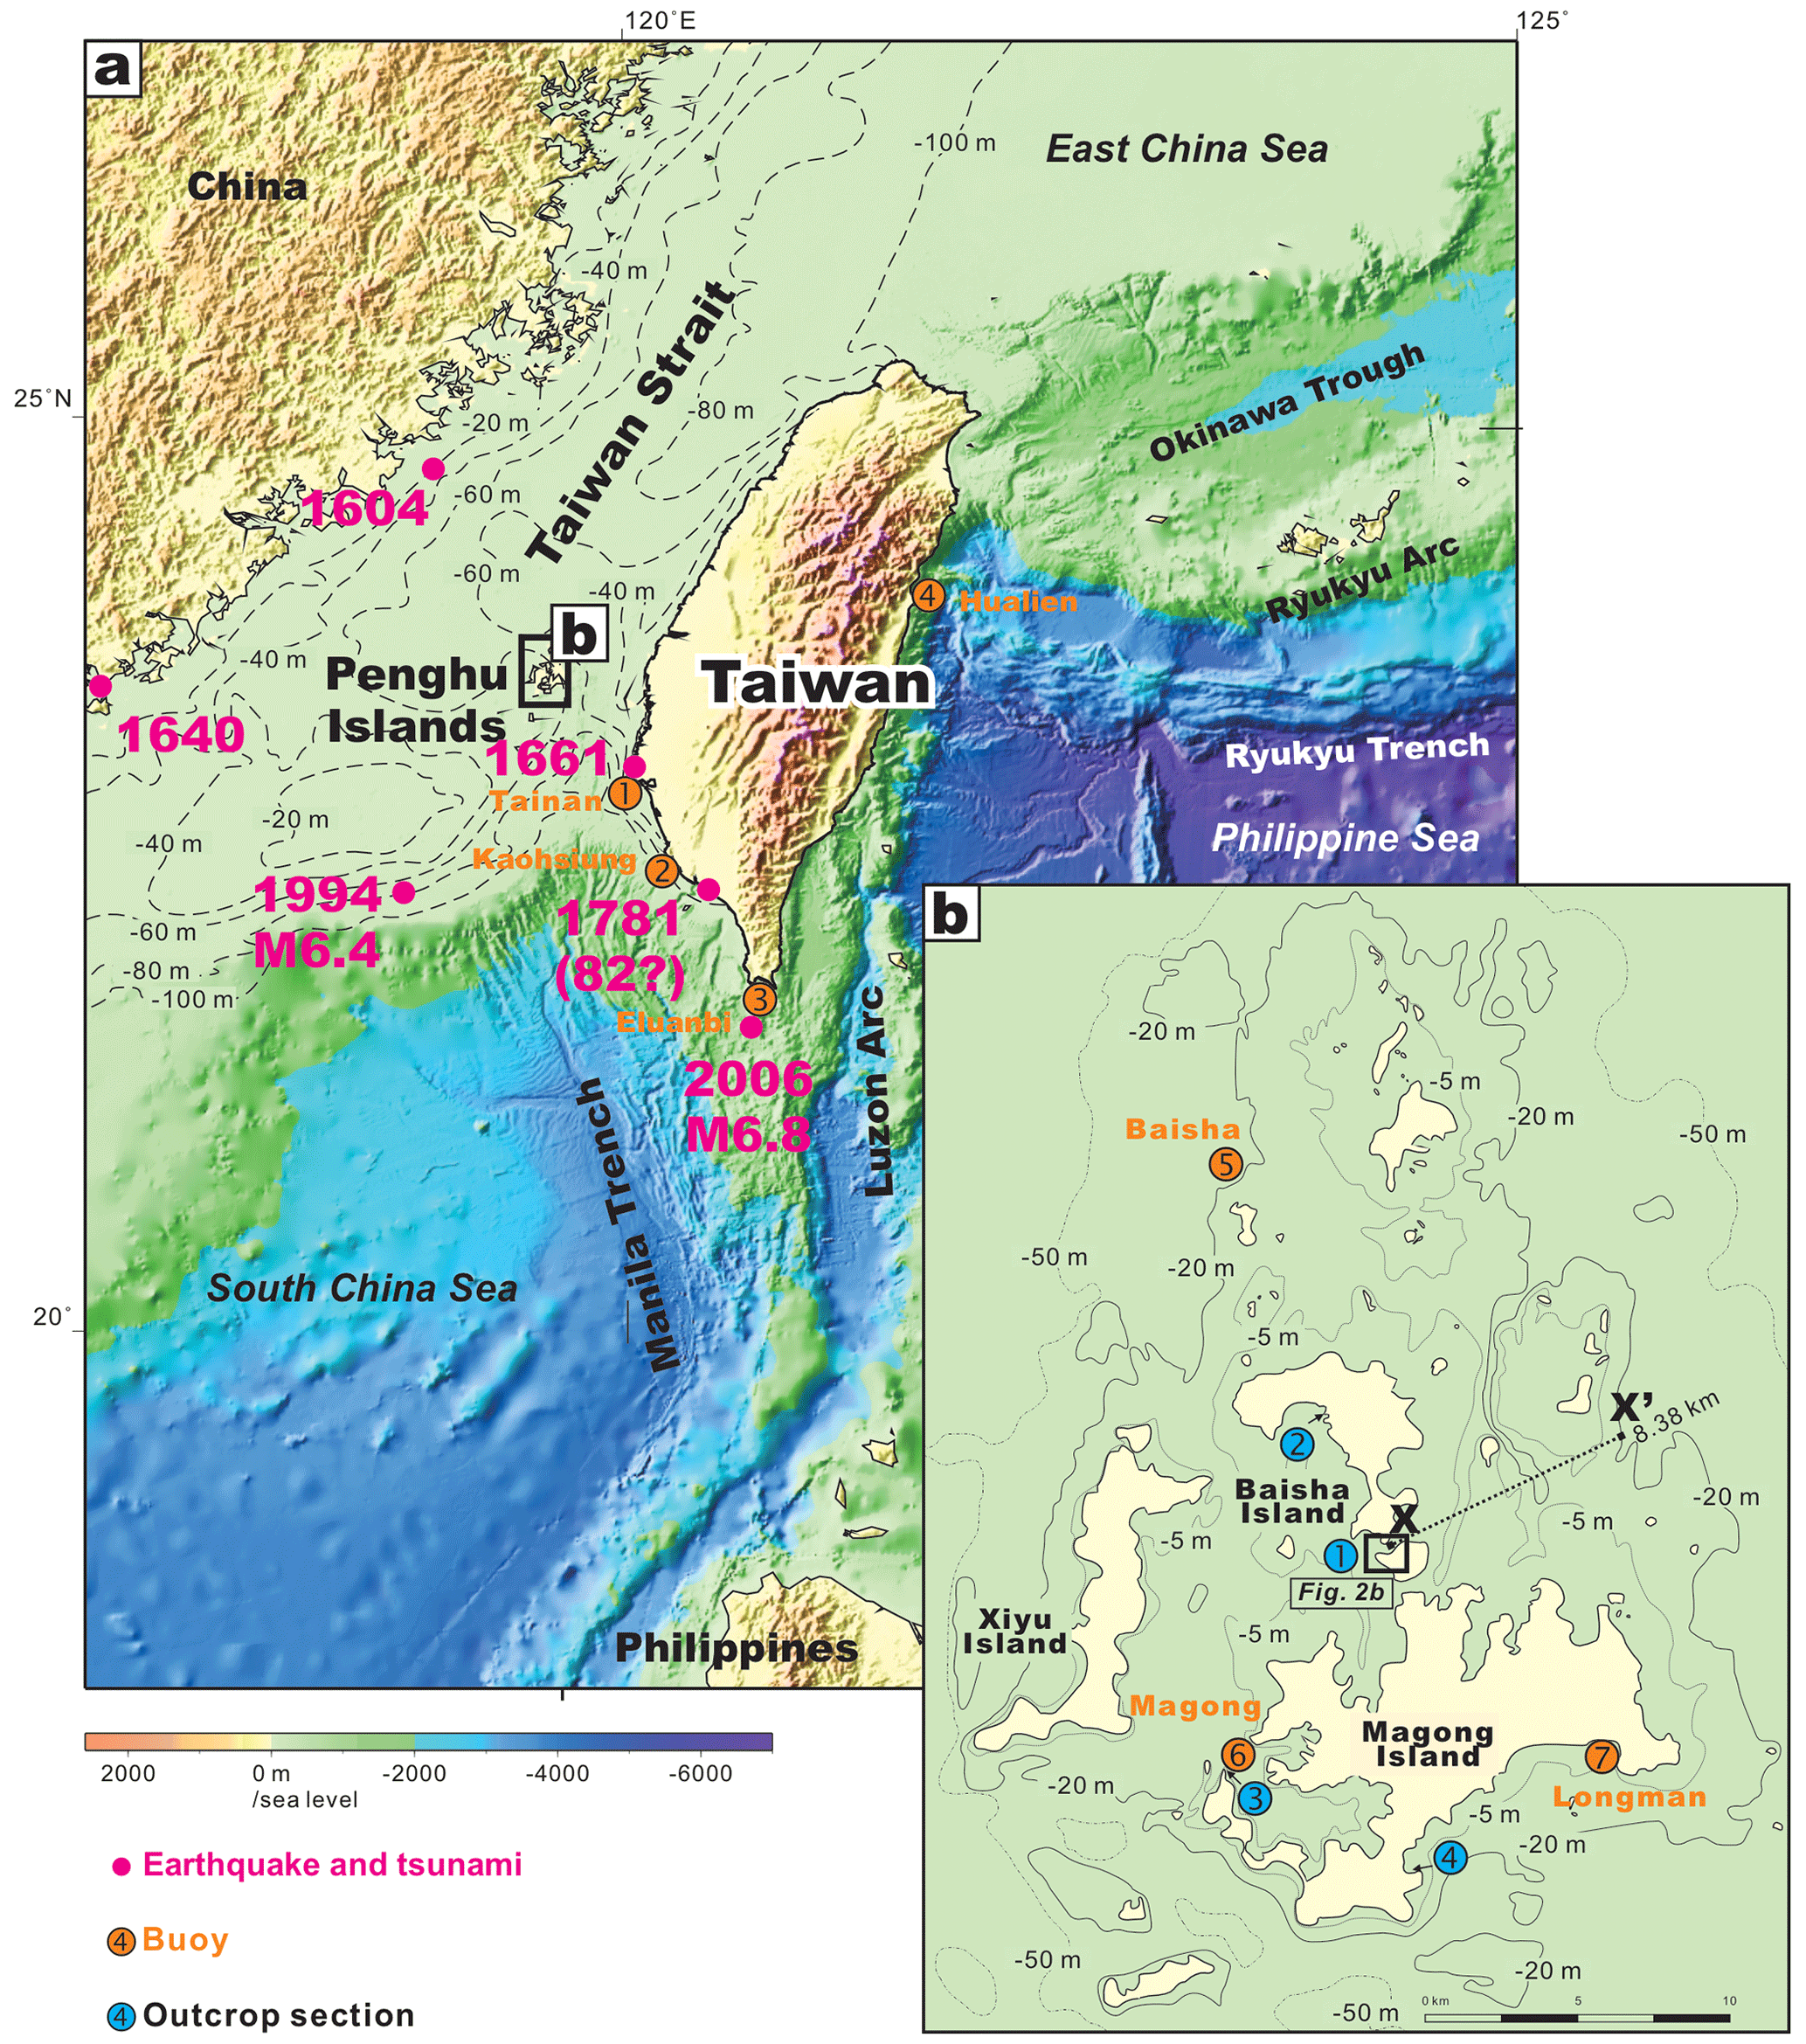
Figure 1Geomorphology of the study area. (a) Regional map of Taiwan with earthquakes and tsunamis from the seventeenth century. The earthquake and tsunami events are based on Keimatsu (1963) and Central Weather Bureau (2022). (b) Penghu Islands and local bathymetry. The X–X′ transect manifests a bathymetric gradient of 20:8380.
To take proper precautions against tsunamis, numerous forward hydrodynamic simulations have been generated to illustrate the worst-case scenarios of tsunami wave generation, propagation, and inundation resulting from geological sources in the area (e.g., Qiu et al., 2019; Li et al., 2019, 2016, 2015; Okal et al., 2011; Wu and Huang, 2009; Megawati et al., 2009; Liu et al., 2022). However, the effectiveness of these simulations has not been assessed due to limited data from modern observation, historical accounts, and geological evidence. Modern tsunamis originating in the South China Sea have been insignificant, including those that followed the 1994 and 2006 earthquakes, with wave heights reaching less than 60 cm (Fig. 1a; Central Weather Bureau, 2022). Historical accounts of events such as the 1604, 1640, and 1661 earthquakes are often vague and only describe seawater overflow, which is not necessarily indicative of a tsunami (Lau et al., 2010; Keimatsu, 1963; Nakamura, 1937; Lei and Ou, 1991). Accounts of the late eighteenth-century tsunami in southwest Taiwan remain controversial in terms of several aspects, including the exact date (1781 or 1782), the death toll (one person or tens of thousands), the extent of inundation (tens of meters or tens of kilometers inland), and whether the event was coupled with an earthquake (Li et al., 2015; Lau et al., 2010; Liu et al., 2022). Recent geological investigations have identified three event layers from the fourth to the sixteenth centuries across the South China Sea (Lu et al., 2019; Sun et al., 2013; Ramos et al., 2017; Yang et al., 2019). However, these findings provide limited information for an accurate quantitative evaluation of the landward inundation, wave heights, and run-ups.
In this study, the Penghu Islands in the Taiwan Strait, located in the northeast South China Sea, were selected for further geological investigation due to their close proximity to potential tsunami sources and the previous discovery of three paleotsunami deposits (Fig. 1a; Lu et al., 2019). A new and younger marine gravel deposit from the seventeenth century was identified at several coastal localities. Cliff-top basalt boulders are present in one of these sites, providing crucial clues for estimating wave heights and periods during sediment transport and deposition. The matrix-supported boulders and the fine-grained matrix are well preserved and represent key facies for understanding transport modes and flow processes.
To better distinguish between tsunami and typhoon wave processes in the gravel deposit and reduce uncertainties in the wave estimation, multiple previously modified incipient motion formulas were utilized in conjunction with the constraints obtained from facies, stratigraphy, geomorphology, and modern observations (Nandasena, 2020; Cox et al., 2020; Kennedy et al., 2021; Barbano et al., 2010; Lorang, 2011; Nandasena et al., 2011, 2022; Pignatelli et al., 2009; Nott, 2003). The modifications and constraints considered various factors, such as the virtual boulder dimensions, maximum lifting surface, sediment sources, transport distances, shore slope angle, bathymetry, ancient local sea level, modern records of typhoon waves, surges, and tsunamis, as well as estimated heights of 100-year significant waves and surges. Radiocarbon dating facilitated accurate determination of the depositional age of the boulders and allowed correlation with probable historical typhoon and tsunami events. This study aimed to delineate quantitative and qualitative estimations of the wave extent and boulder transport during impact, ultimately enhancing our understanding of tsunami risks in the South China Sea by comparing the results with those obtained in previous simulations.
The Taiwan Strait is a narrow and shallow channel located west of Taiwan, connecting the East China Sea and South China Sea, extending from northeast to southwest, with an average width of 180 km and an average water depth of 60 m (Fig. 1a). The southern part of the strait contains the Penghu Islands, which consist of more than 90 volcanic islands made of Miocene basalt. These islands have an elevation of 10–20 m a.s.l. and are fringed by rocky shore terraces and platforms that reach a depth of 20 m offshore (Fig. 1b; Yen and Lee, 2017). Although the Penghu area is not far from the active plate convergence zone at the orogenic island of Taiwan, it remains tectonically stable and is often used as a fixed reference point for geodetic studies (Yu et al., 1997). Accordingly, the local sea level in this area has been controlled by global sea level fluctuations, falling at approximately 5.1 cm per century from a 2.4 m highstand in 4.7 ka (Chen and Liu, 1996).
Both Taiwan and the Taiwan Strait are subjected to powerful typhoons, which have set wave height and period records at the Paisha buoy in the Penghu Islands and the Tainan, Kaohsiung, Eluanbi, and Hualien buoys in southern and eastern Taiwan (Table 1, Fig. 1a–b; Central Weather Bureau, 2022). The estimated significant wave heights over 50- and 100-year periods are available from the Paisha, Tainan, Kaohsiung, and Hualien buoys (Jiang et al., 2012, 2011; Chang, 2009). In general, typhoon-induced waves are less intense in the Taiwan Strait due to its narrow, shallow, and tide-dominated nature, as shown by the maximum wave height of 6.8 m recorded at the Paisha buoy, compared to the 11.9–17.8 m maxima observed at the other buoys adjacent to deeper open water.
Table 1Most typhoon-active month (August) and yearly wave records and estimated significant wave heights at buoys in the study area. For buoy locations, see Fig. 1a.
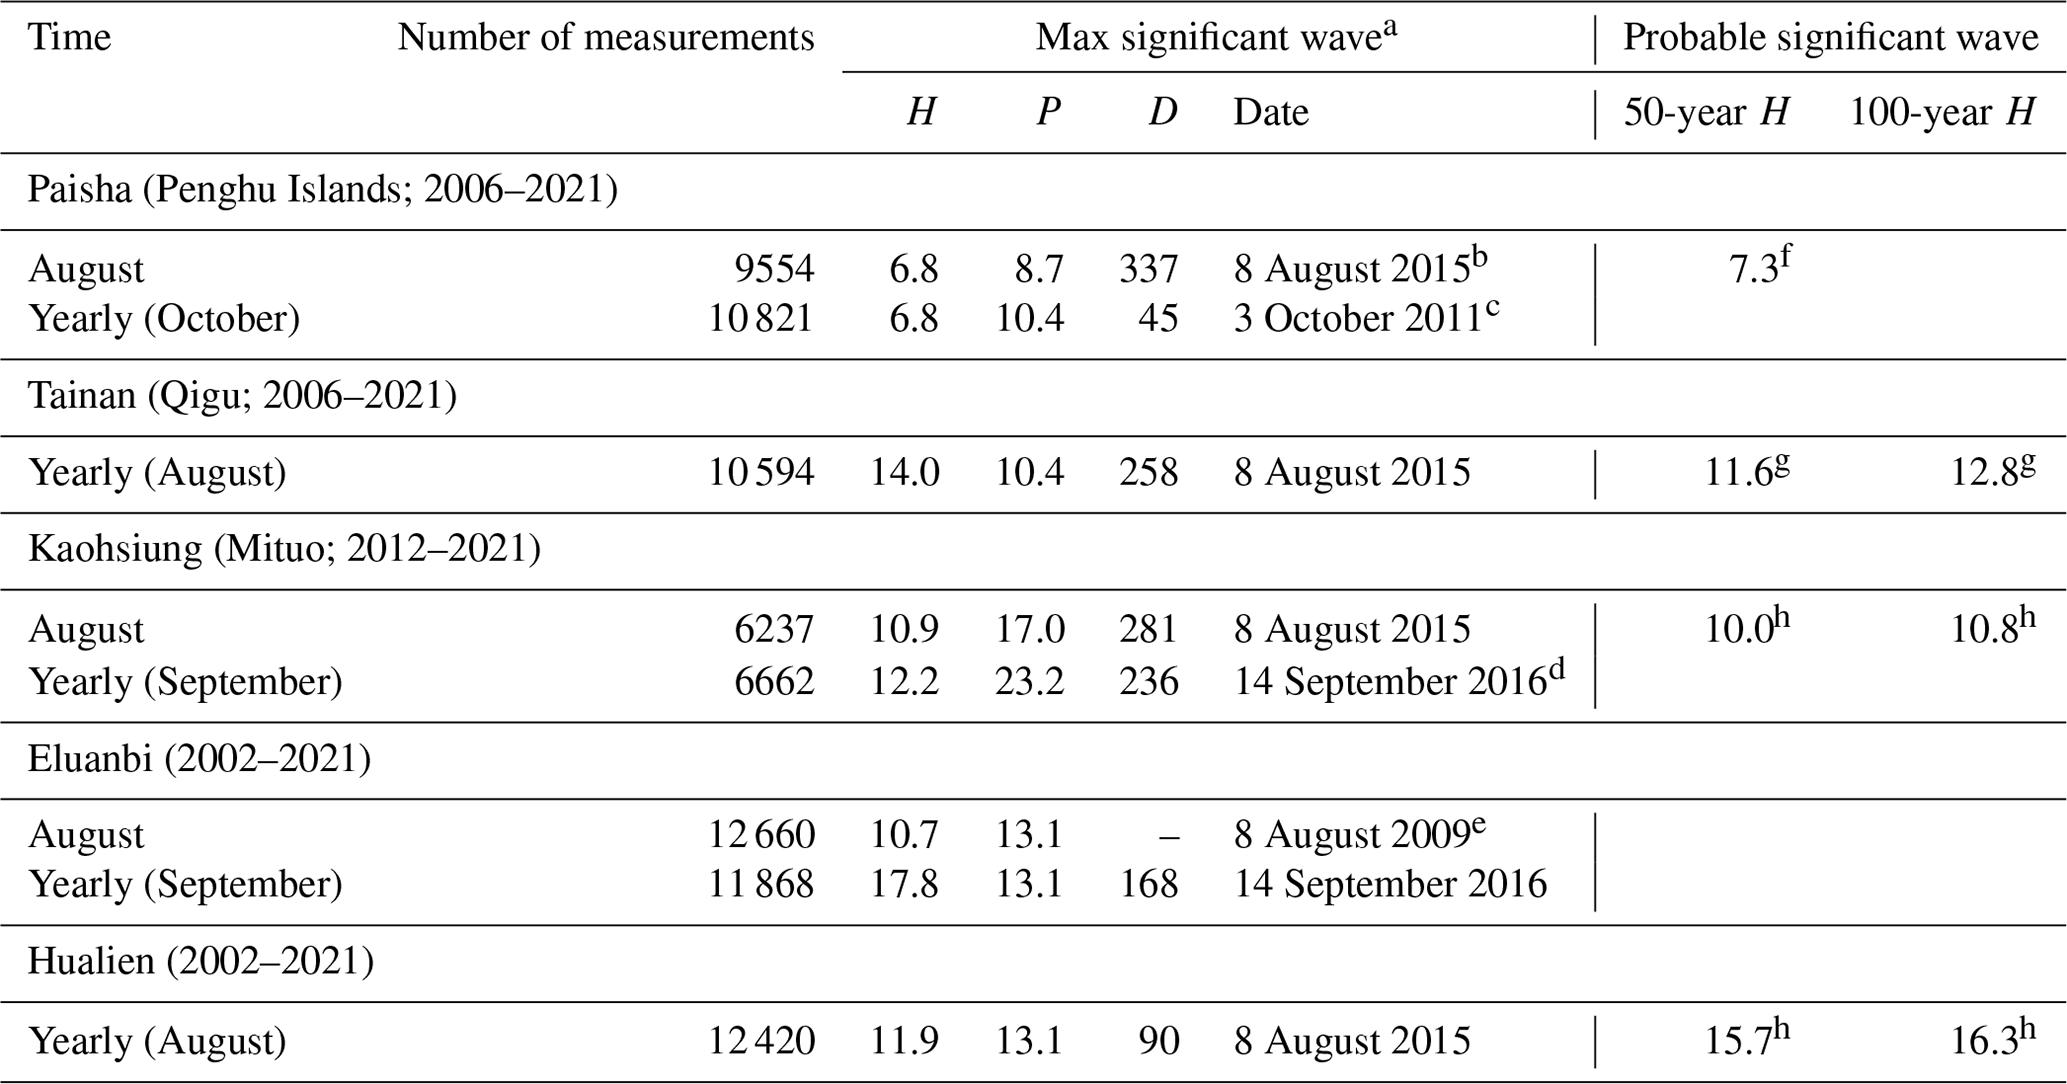
H: wave height (m), P: wave period (s), D: wave direction (degrees). a Wave statistics from buoys at a depth of 20–40 m (Central Weather Bureau, 2022). b Typhoon Soudelor. c Atmospheric pressure low. d Super Typhoon Meranti. e Typhoon Morakot. f Chang (2009). g Jiang et al. (2012). h Jiang et al. (2011).
Modern and ancient typhoon surges from the seventeenth century have been prominent in the Penghu area, with a mesotidal range of 2.0–3.2 m (Hsu, 2007; Central Weather Bureau, 2022). Notably, Typhoon Mitag in 2009 caused a surge with a maximum elevation of 1.8 m a.s.l. Between 1997 and 2021, 87 % of the 118 observed surges were within the range of 0.8–1.5 m a.s.l., with a mode of 1.1 m a.s.l. Ancient records document a surge of 1.2 m a.s.l. in 1683, as well as two surges reaching 1.5 m a.s.l. in 1832. In this study, the modern surge maximum of 1.8 m a.s.l. tentatively serves as an approximation for a 100-year surge.
The history of severe wave events at the Penghu Islands dates back to the thirteenth century, and no ancient tsunamis were recorded. The highest wave height associated with an earthquake-related tsunami occurred in 1994, measuring 0.4 m (Fig. 1a; Central Weather Bureau, 2022).
3.1 Cliff-top boulder and incorporative hydrodynamic approach
The cliff-top basalt boulder is located in outcrop Chungtun-1, which lies on the southern shore of a narrow and shallow interisland channel known as the Chungtun Channel (Fig. 2a). The channel is 350–500 m wide and approximately 2 m deep (Fig. 2b–c).
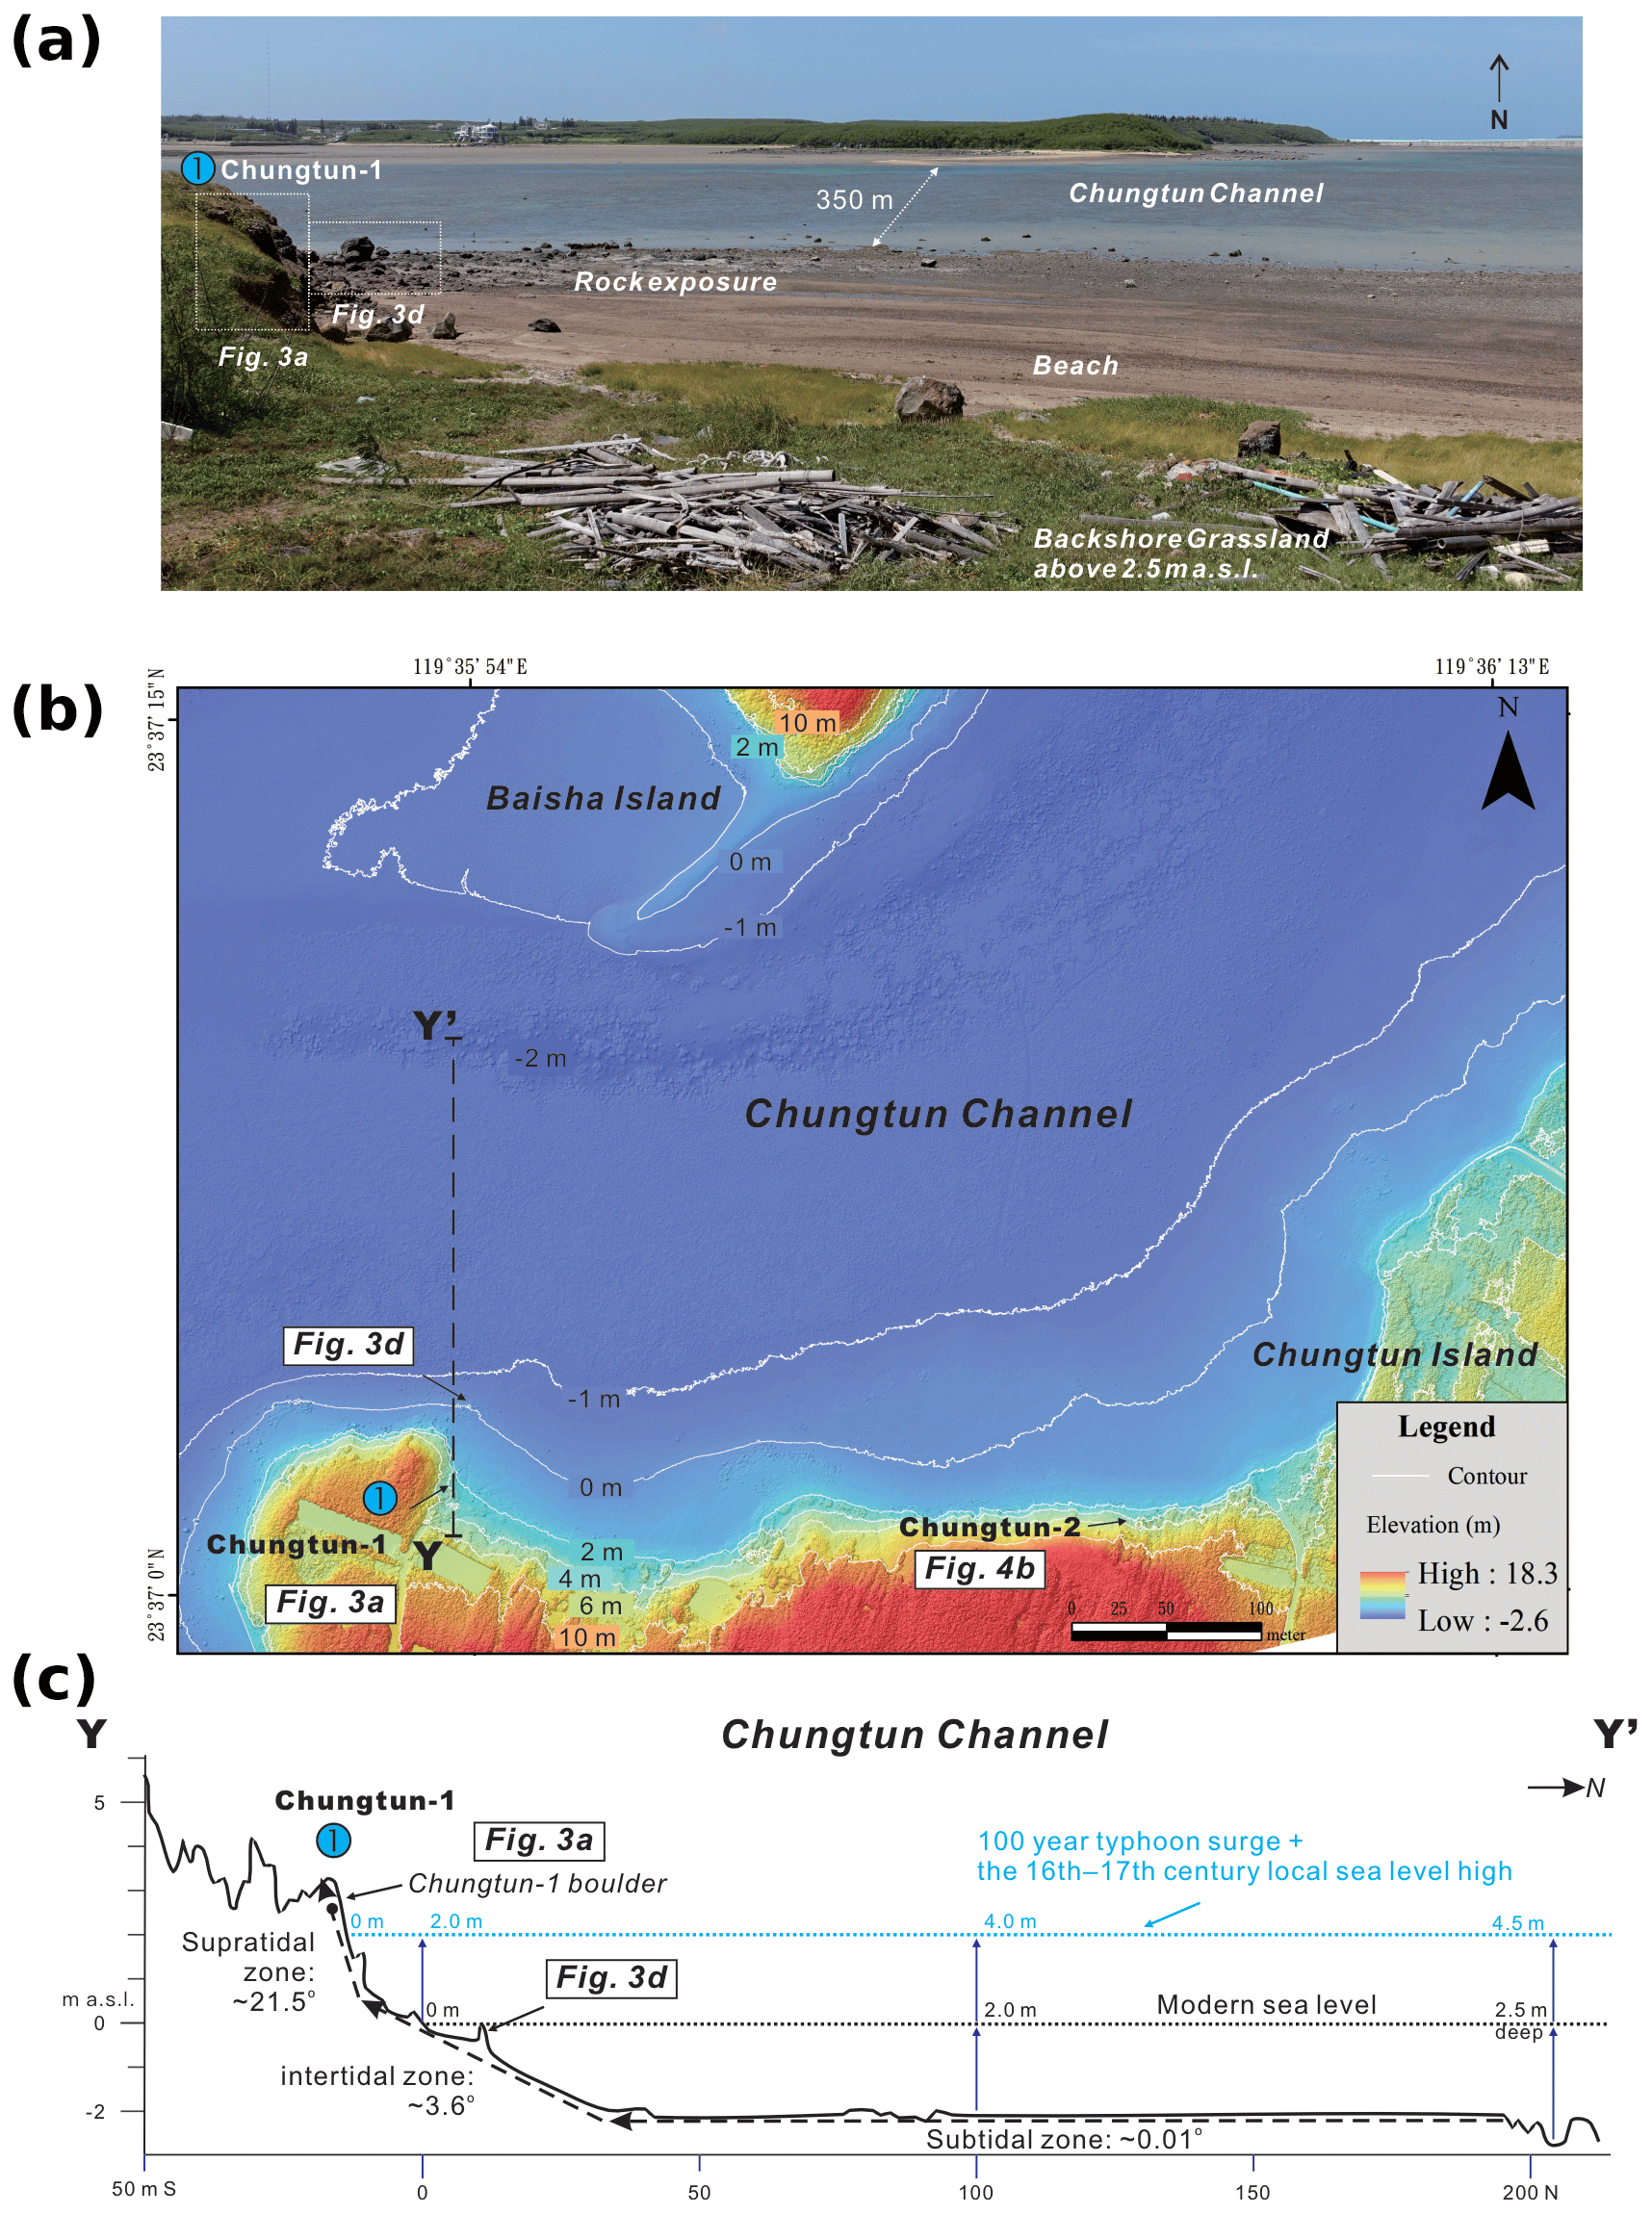
Figure 2Regional view and bathymetry of the outcrop Chungtun-1. The location is shown in Fig. 1b (blue circle 1). (a) The Chungtun Channel at low tide; the channel is less than 2.5 m in depth. (b) DEM image. (c) Y–Y′ transect showing the flat subtidal, the gentle intertidal, and the steep supratidal zones. The dotted blue line marks the maximum depth in the seventeenth century, when the local sea level was 0.2 m higher (Chen and Liu, 1996) and was superimposed by the 100-year typhoon surge at 1.8 m a.s.l.
The largest boulder clast, hereafter referred to as the “Chungtun-1 boulder”, was selected for analysis due to its significantly larger size compared to the others in the outcrop (Fig. 3a). These boulder clasts form a cluster in a mud-matrix-supported gravel layer that is laterally continuous and gradually thins out upwards from 2.5 to 4.0 m a.s.l. This layer is referred to as the “Chungtun-1 layer” (Fig. 3a). Marine shells and rounded pumice pebbles are abundant in the matrix and also on the channel beach (Fig. 3b); however, they are absent in the underlying basalt basement and basal soil, as well as in the overlying angular-gravel colluvium. Accordingly, it is assumed that the cliff-top boulder and gravel layer have a marine sediment origin.
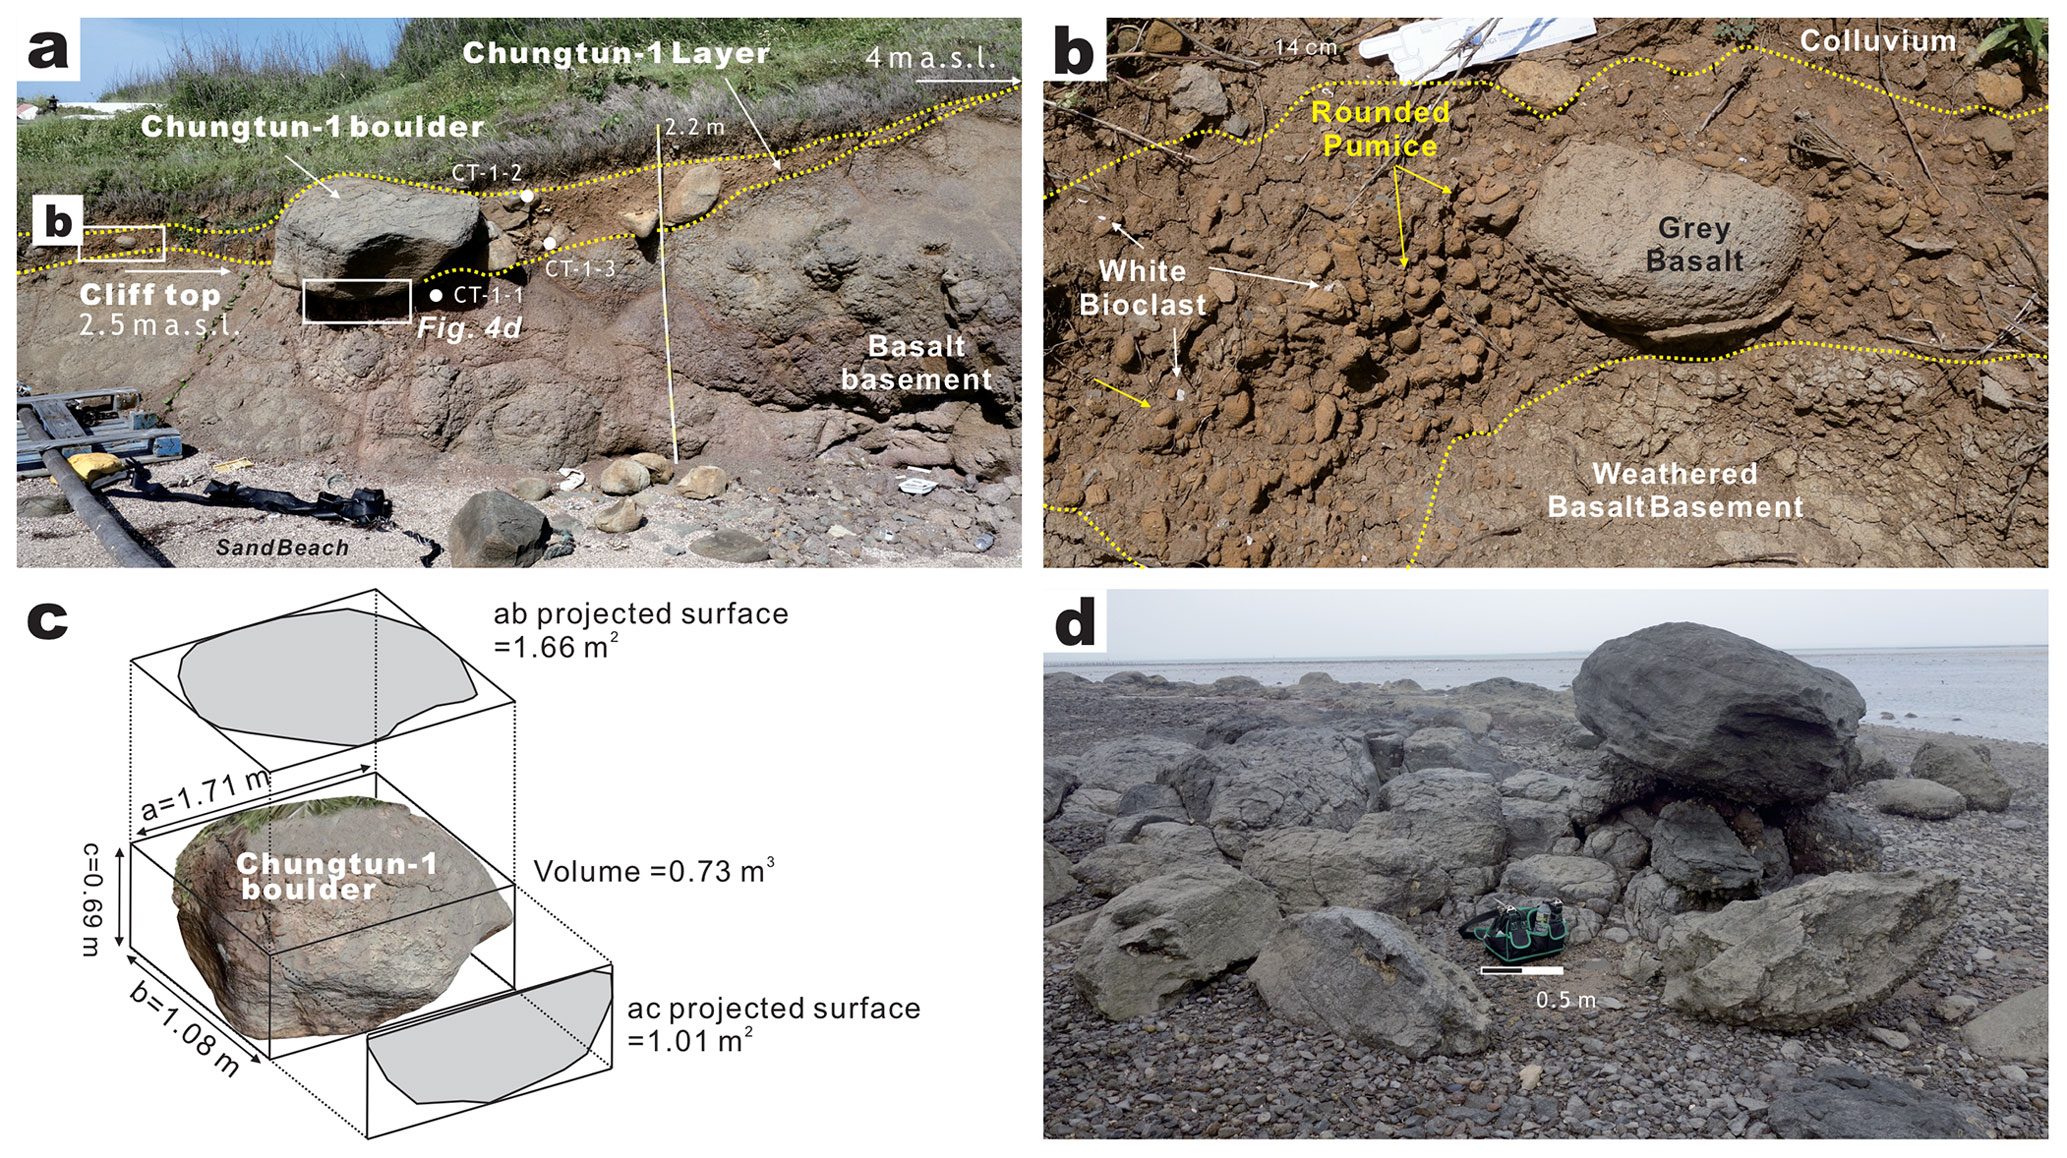
Figure 3Outcrop views and scanned boulder image. Locations of panels (a) and (d) are shown in Fig. 2. (a) Outcrop section from the basalt basement to the Chungtun-1 layer and topsoil. A boulder cluster, including the Chungtun-1 boulder, is prominent in the matrix-supported Chungtun-1 layer that pinches out upwards from 2.5 to 4.0 m a.s.l. Note the spheroidal weathering and rock residues in the basement. CT-1-1, CT-1-2, and CT-1-3 mark the radiocarbon sample locations. (b) Close-up view of the matrix-supported Chungtun-1 layer composed of rounded brownish pumice, grey basalt, and white bioclast. (c) Chungtun-1 boulder metrics obtained using Autodesk Meshmixer and ContextCapture. (d) Intertidal joint-bounded basalt exposure, boulder stacks, and isolated boulders. Note that the boulders are comparable in size and shape to those in the Chungtun-1 layer in panel (a).
The metrics of the Chungtun-1 boulder were measured using Autodesk Meshmixer and ContextCapture; the measurements include a density of 2.91 g cm−3, a volume of 0.73 m3, a mass of 2.12 t, an axis length of 1.71–0.69 m, and a projected surface area of 1.66–1.01 m2 (Fig. 3c). The boulder shape is angular, indicating its origin from a joint-bounded source in the intertidal–subtidal zone since subaerial spheroidal weathering and rock residue are well developed across the islands, including the basalt cliff of outcrop Chungtun-1 (Fig. 3a). There is an intertidal rock exposure at 0.5 m below sea level, which exhibits well-developed joint fractures and rock debris similar in size and shape to the boulder clasts of the Chungtun-1 layer (Fig. 3a and d). This rock exposure forms a wave-cut bench and marks an inflection point on the shore profile, indicating a transport distance of 31.7 m to the Chungtun-1 outcrop (Fig. 2; Lorang, 2011). A transect through the outcrop to the probable source, and the deepest channel shows shore slope angles of 21.5∘ in the supratidal zone, 3.6∘ in the beach–intertidal zone, and 0.01∘ in the subtidal zone (Y–Y′ in Fig. 2c).
The incorporative hydrodynamic approach used in this study involves two main procedures: (1) an estimation of the minimum wave heights and periods required for the initiation of transport of the Chungtun-1 boulder using the modified incipient motion formulas and (2) distinguishing between the typhoon and tsunami wave origins by comparing the estimation results with various wave sources such as modern and ancient tsunami waves, typhoon waves, 100-year significant waves, and 100-year surge (Cox et al., 2020). The comparison also integrates the constraints from the geomorphology, bathymetry, ancient local sea level, and ratio of wave height to water depth at the wave break. The wave estimate is delineated a step further from flow velocity, as it has been deemed the most useful parameter in the analysis of ancient wave events and deposits (see Nandasena et al., 2022). Moreover, only the wave height records of historical and modern tsunamis and typhoons are available for comparison in the study area.
The previously modified Nott equations, which consider the maximum lifting surface; shore slope angle; and transport modes of sliding, rolling, and saltation and cover submerged, subaerial, and joint-bounded scenarios, were adopted in the calculation (Table 2; Nott, 2003; Pignatelli et al., 2009; Barbano et al., 2010; Lorang, 2011; Nandasena et al., 2022). The modifications also incorporate the virtual boulder shape, volume, and projected surfaces into the drag and lift coefficients (Table 2; Nandasena et al., 2022). The Hudson formula is then adopted for independent storm wave estimates of the beach–intertidal zone (Lorang, 2011; Hudson, 1953). The Froude number is set at 2.0 for tsunami waves and 1.0 for storm waves. This choice is based on the tendency of these waves to induce highly supercritical and critical flows, respectively (Nott, 2003). It is worth noting that various supercritical flow regimes are associated with both tsunamis and storm waves (Cox et al., 2020; Nandasena, 2020), which will be addressed in Sect. 4.1. The wave periods are then derived from (1) the estimated heights and (2) the modified Noormets equation for maximum water flooding (Noormets et al., 2004; Barbano et al., 2010; Lorang, 2011). In the Noormets equation, the cliff-top elevation is measured at the outcrop, 2.5 m a.s.l., and the minimum run-up height is marked by the pinch-out of the Chungtun-1 layer at 4.0 m a.s.l. (Fig. 3a). The regional bathymetric gradient, which is used to delineate the ratio of wave height to water depth at the wave break, was derived from the X–X′ transect between the Chungtun Channel and an abandoned offshore buoy in the northeast (Fig. 1b, Table 2; Collins, 1970; Noormets et al., 2004). The water depth change is 20 m, the distance is 8380 m, and the ratio is 0.73.
Table 2Modified incipient motion formulas adopted in this study.
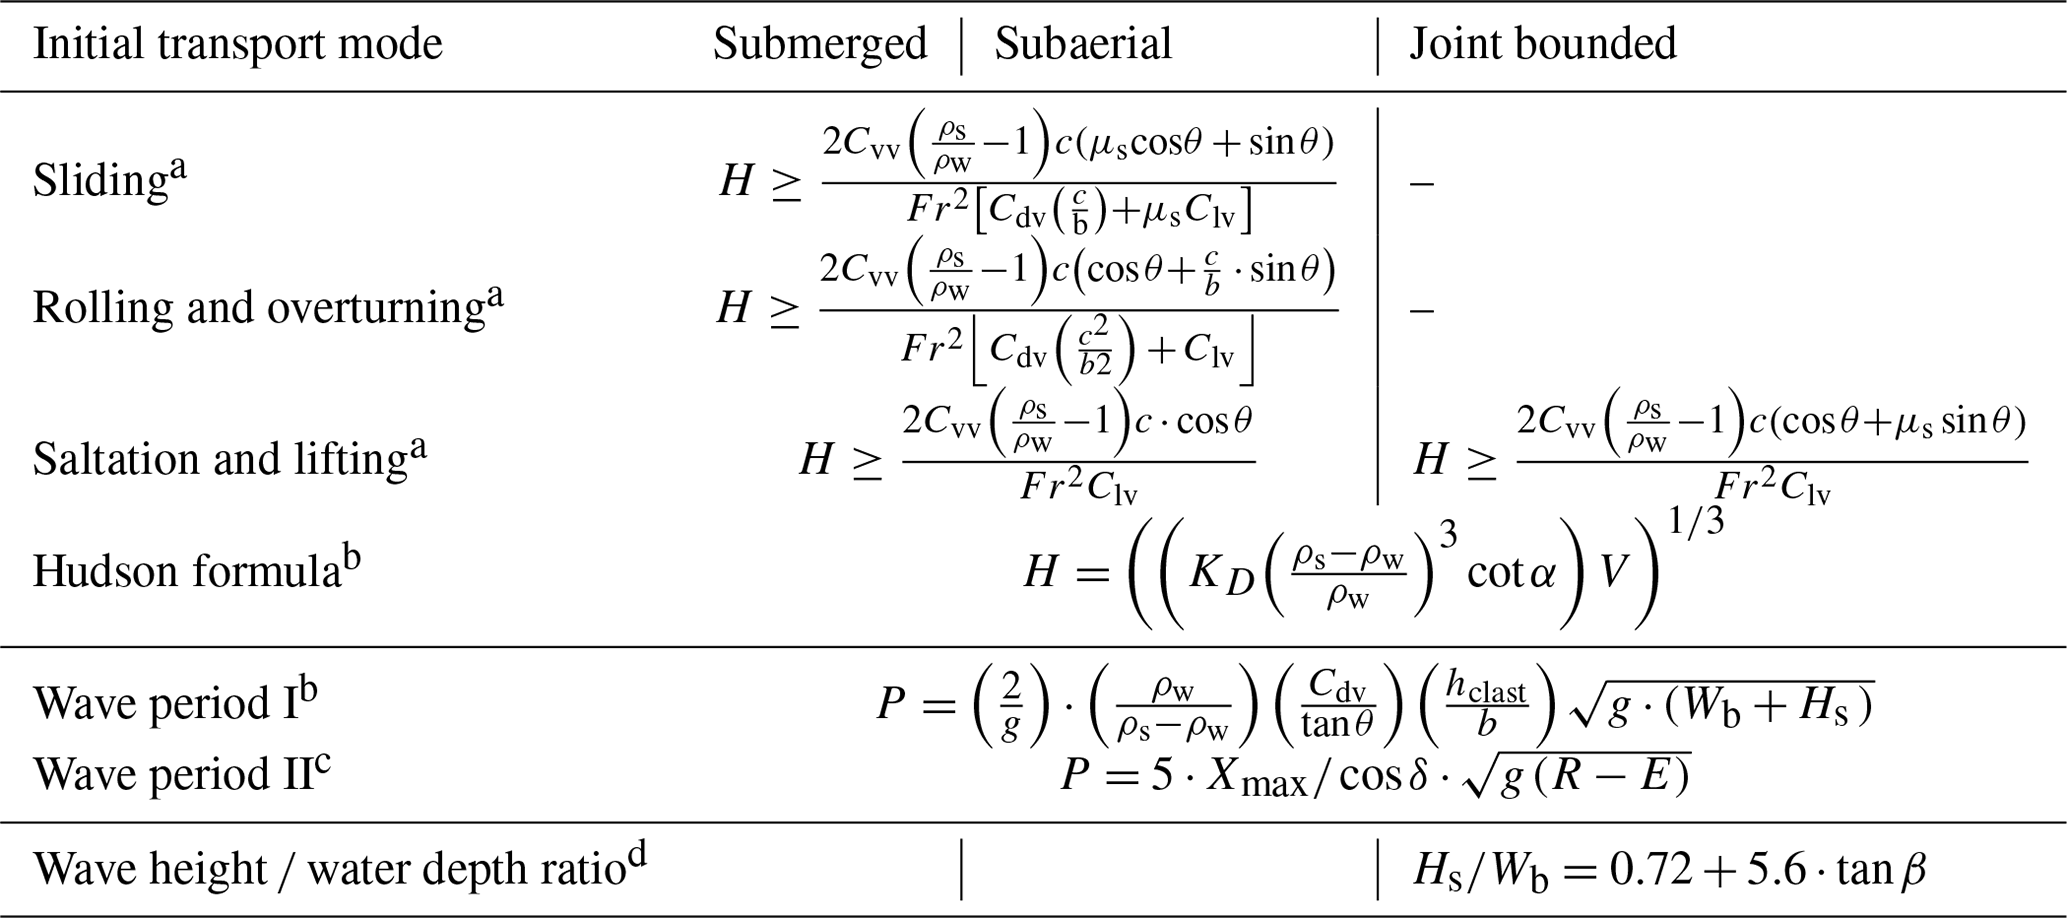
a Nott (2003), Nandasena (2020), Nandasena et al. (2022). b Lorang (2011). c Barbano et al. (2010). d Collins (1970). Wave height: H; storm wave weight: Hs; wave period: P; water depth at wave break: Wb. Chungtun-1 boulder axis lengths: a= 1.71 m, b= 1.08 m, c= 0.69 m. Volume: V, 0.73 m3. Projected ab surface: Aab, 1.66 m2; projected ac surface: Aac, 1.01 m2. Density: ρs, 2910 kg m−3; seawater density: ρw, 1020 kg m−3. Virtual lift coefficient: ; virtual drag coefficient: ; virtual volume coefficient: . Lift coefficient: Cl, 0.178; drag coefficient: Cd, 1.95; static friction coefficient: μs, 0.7; boulder interlocking coefficient: KD, 1.5 for smooth stone; Froude number: Fr, 1 for storm wave, 2 for tsunami wave; gravity: g, 9.8 m s−2. Shore slope: θ; beach slope: α; regional slope: β, (X–X′ in Fig. 1b); Mean CT-1 coastal overland slope: δ, 21.5∘. Chungtun-1 boulder elevation: hclast, 2.5 m a.s.l.; maximum flooding distance from the probable intertidal source to the Chungtun-1 outcrop: Xmax, 31.7 m; run-up of event layer: R, 4.0 m a.s.l.; cliff-top elevation: E, 2.5 m a.s.l.
3.2 Coastal outcrops and facies stratigraphic analysis
To obtain a better understanding of the facies and stratigraphic constraints on the transport and deposition of the cliff-top boulder, the Chungtun-1 outcrop and three additional outcrops with gravel layers of marine sediment origin were investigated; these include the adjacent outcrop Chungtun-2 (Figs. 2b and 4a) and the Watong and Shetoushan outcrops located at a distance (blue circles 2 and 3 in Figs. 1b and 4b–c). A previously reported outcrop at Suogang was included for comparison (blue circle 4 in Fig. 1b; Lu et al., 2019). All studied outcrops are situated in the supratidal zone with top surfaces at elevations of 2.5–5.3 m a.s.l.
Analyses of the sedimentary facies, granulometry, and radiocarbon dating were conducted on the newly investigated outcrops. Facies analysis involves the integration of lithology, sedimentary structure, and fossil content. Granulometric samples were collected from the Chungtun-2 and Shetoushan outcrops, chosen for their substantial total thicknesses and massive gravel layer texture. These samples were analyzed using a sieve shaker and a Microtrac S3500 laser particle size analyzer. Charred material samples from the investigated gravel layers and ambient deposits were sent to Beta Analytic, Miami, Florida, USA, for radiocarbon dating. The modeled ages of the newly investigated and previously reported gravel layers were calculated using OxCal 4.4 from the University of Oxford and the IntCal13 calibration curves (Ramsey, 2021; Reimer et al., 2013).
4.1 Wave conditions during cliff-top boulder transport and deposition
4.1.1 Storm wave height
The estimated minimum storm wave height required to initiate the transport of the Chungtun-1 boulder is 0.87–9.5 m (Table 3), which is well within the 6.8–17.8 m maximum height of modern typhoon waves and the previously estimated significant wave heights for the 50- and 100-year periods (Table 1; Central Weather Bureau, 2022). These results seem plausible because western Pacific typhoons are notoriously powerful, and the Chungtun-1 boulder is relatively small in volume and mass.
Table 3Results of wave estimation from equations in Table 2.
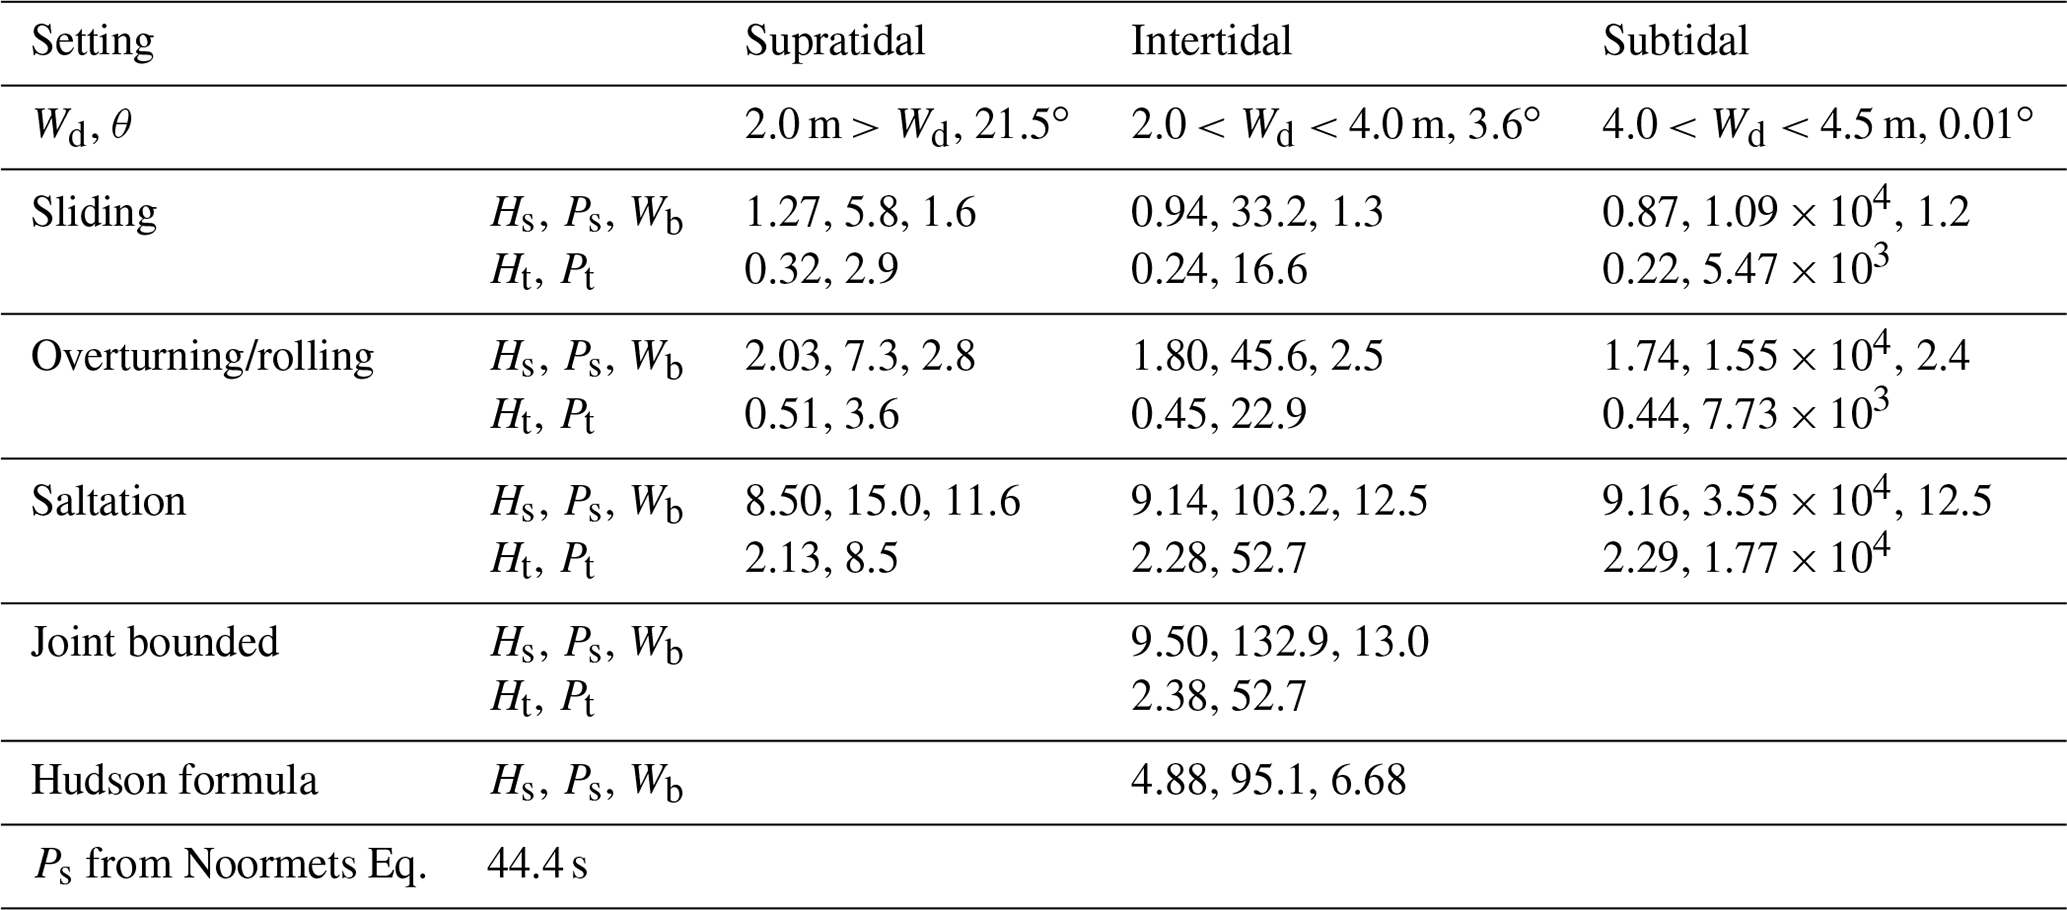
Wd: maximum water depth during the 100-year surge in the seventeenth century; θ: shore slope. Hs: storm wave weight (m); Ps: storm wave period (s); Wb: wave break depth (m). Ht: tsunami wave weight, i.e., 0.25⋅HS (m); Pt: tsunami wave period (s).
However, when considering the ancient bathymetry during deposition, facies, and probable transport modes, typhoon waves are unlikely to have been responsible for the deposition of the Chungtun-1 boulder at its current cliff-top position. According to the dating results, the Chungtun-1 boulder may have been deposited in the sixteenth–seventeenth centuries (CT-1-1 and CT-1-3 in Fig. 3a and Table 4). During this period, the maximum water depth in the Chungtun Channel could have reached 4.5 m because the local sea level was approximately 0.2 m higher than it is at present, allowing a 100-year surge of 1.8 m a.s.l. to occur (Fig. 2c; Chen and Liu, 1996; Central Weather Bureau, 2022). The tallest typhoon waves that can form in the subtidal–intertidal water depths (1.46–3.29 m; wave height = 0.73 × water depth) could trigger the sliding and rolling of the Chungtun-1 boulder upon breaking (Table 3). The sliding–rolling movement is likely to cease in the steeper supratidal zone because the estimated minimum waves are too tall to form in the shallow depth of the inundated supratidal zone and will break earlier before attenuating rapidly and exponentially landwards (Barbano et al., 2010; Goto et al., 2009). The estimated minimum wave heights of 8.5–9.5 m required for saltation and lift from the probable intertidal joint-bounded source cannot occur in the 4.5 m deep Chungtun Channel.
Table 4Accelerator mass spectrometry (AMS) radiocarbon dating results. See sample locations in Figs. 3a and 5a–b.
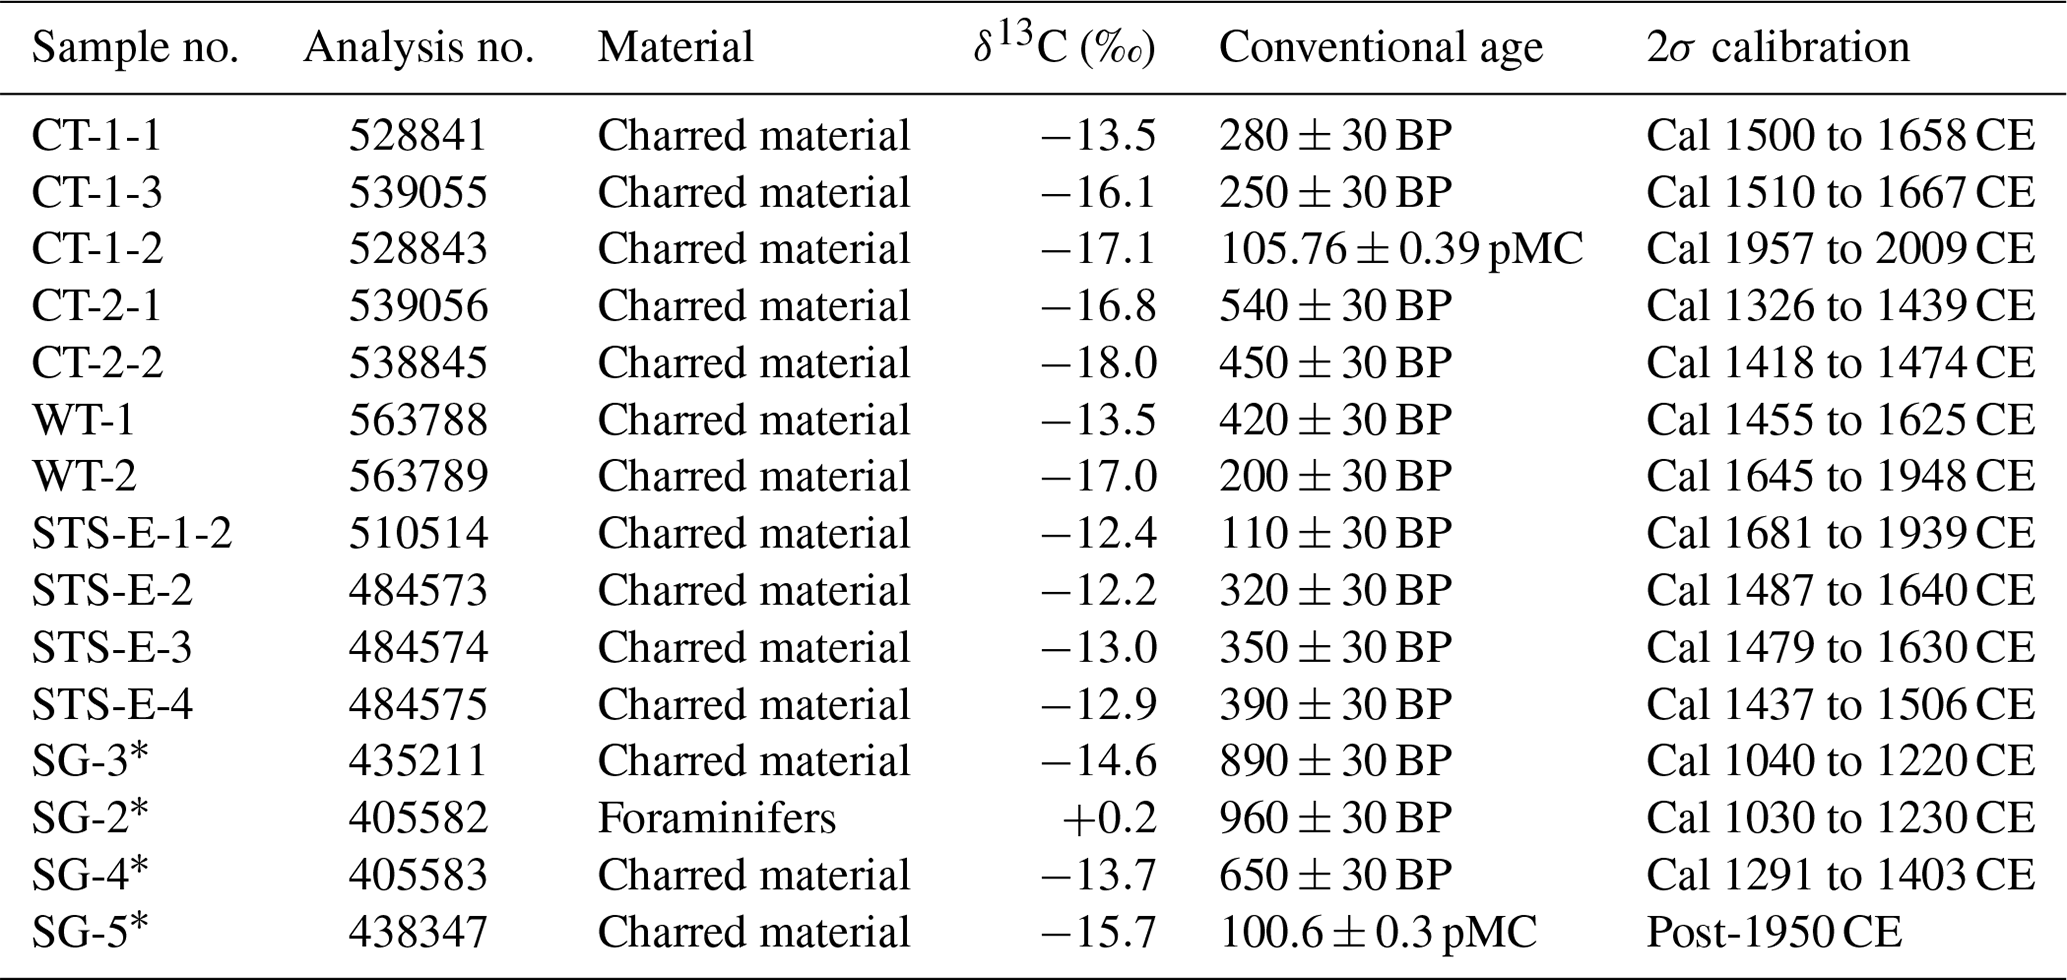
* Lu et al. (2019). pMC: percent modern carbon.
The onshore flows induced by storm waves have been determined as supercritical, with a Froude number greater than 1, and capable of displacing large coastal cliff-top boulders (Cox et al., 2020). In the case of the Chungtun-1 boulder, which stands at a height of 0.69 m, the estimated Froude number is between 1.0 and 1.6 for the flow to be able to overtop and entrain the boulder into motion (see Nandasena, 2020), and the estimated minimum wave height is 1.1–1.9 m. Accordingly, the corresponding water depth required is 1.46–2.65 m, which generally exceeds the depth of the inundated supratidal zone of the seventeenth century (< 2.0 m). Alternatively, the estimated waves will break and attenuate in the deeper channel, and the boulder will stop moving in the intertidal–supratidal zone.
4.1.2 Tsunami wave height
The estimated minimum heights of tsunami waves fall into two groups: (1) heights ranging from 0.22–0.51 m, which are associated with the initiation of the Chungtun-1 boulder sliding and rolling and are comparable to the observed 0.4 m high tsunami on the Penghu Islands in 1994, and (2) heights ranging from 2.13–2.38 m, linked to the saltation and joint-bounded scenario (Table 3). The first group must be modified to > 0.69 m or 0.87–2.03 m. This is because the initial estimate is smaller than the 0.69 m boulder height, which is discordant with the formula assumption (see Nandasena, 2020). This suggests that the supercritical waves (Froude number = 2) are at least taller than the boulder height or that the waves are less supercritical (1 < Froude number < 1.6) and may be as tall as the estimated storm waves (0.87–2.03 m high, Table 3). As for the second group, the minimum height of the supercritical waves (Froude number = 2) is concordant with the boulder height assumption. Alternatively, the wave height may range between 3.33–3.72 and 9.16–9.50 m as the flow regime becomes less supercritical (1 < Froude number < 1.6).
Based on the facies and outcrop geomorphology, it appears that these tsunami wave height minima are largely insufficient to deposit the Chungtun-1 boulder on the cliff top. The boulder is underlain by the pumice-bearing gravel and mud matrix above the cliff basement (Fig. 4d) and evidently part of the matrix-supported Chungtun-1 gravel layer (Fig. 3a–b). This indicates that the terminal boulder transport to the cliff top was controlled by suspension-rich turbulent flow processes and very likely involved rolling or saltation before deposition. This finding is in agreement with the bore-like long-wavelength waves that tend to lead to boulder rolling and saltation (Imamura et al., 2008), especially for boulders smaller than 2 m in length, such as the Chungtun-1 boulder (Nandasena et al., 2011). The greater height of the first sliding–rolling group, 1.65–2.03 m, is sufficient to rotate the median point of the 1.7 m long boulder to exceed the cliff-top elevation (2.50 = 1.65 ), enabling the cliff-top deposition (Fig. 3a). The smaller height range of 0.69–1.65 m would cause the boulder to rotate and reach below the cliff-top elevation and finally rest on the cliff slope. However, given the tallest wave height of 2.03 m, the finer sediment would be trapped below the cliff top, resulting in a clast-supported fabric rather than the observed matrix-supported fabric (Figs. 3a and 4d).
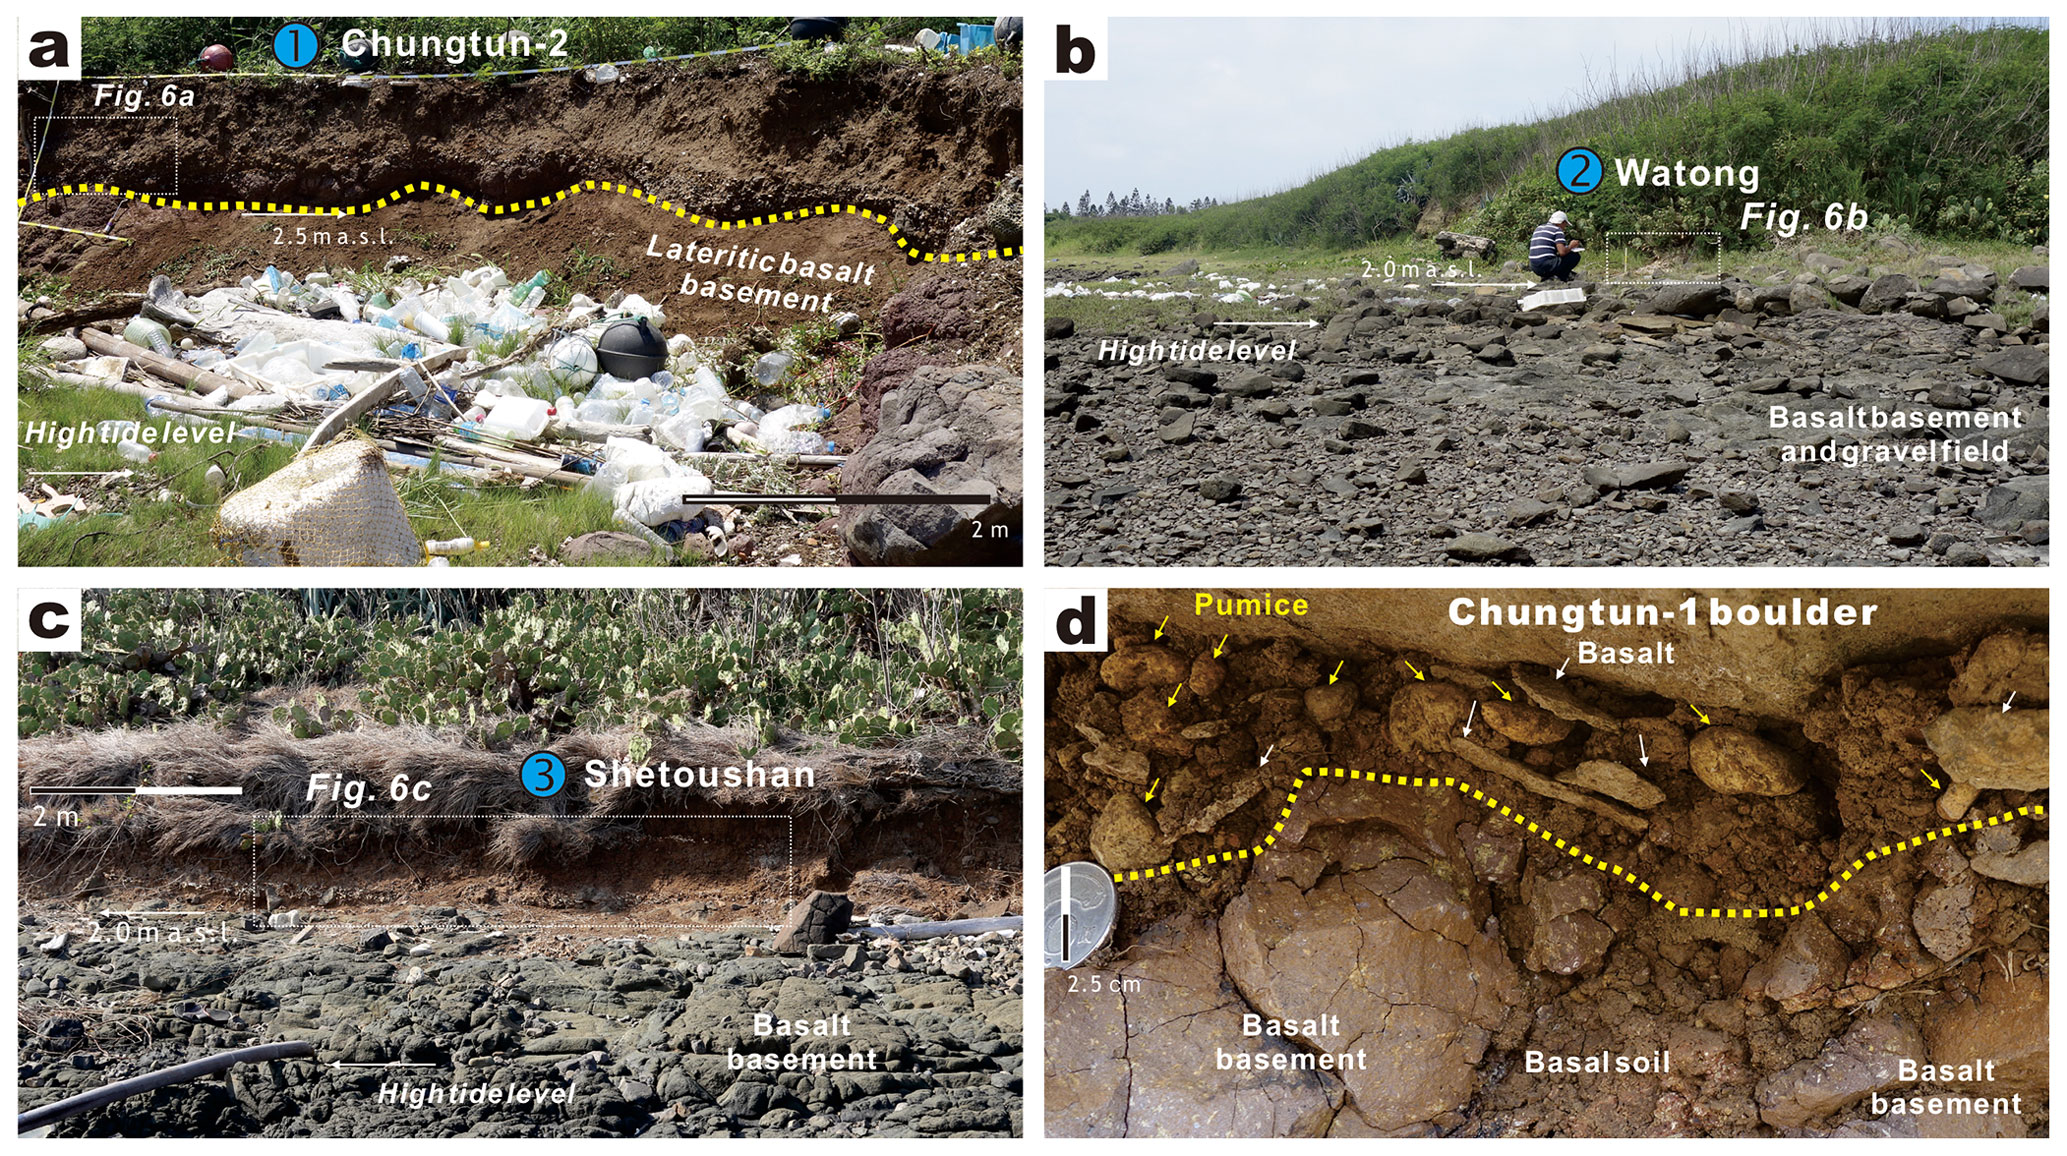
Figure 4Regional and close-up views of the investigated outcrops at low tide. (a) Chungtun-2 outcrop with the basalt basement top at 2.5 m a.s.l. (location in Fig. 2b). (b) Watong outcrop with the basalt basement top at 2.0 m a.s.l. (location in Fig. 1b). (c) Shetoushan outcrop with the basalt basement top at 2.0 m a.s.l. (location in Fig. 1b). (d) Close-up view of the base of the Chungtun-1 boulder. Location is shown in Fig. 3a. The base is separated by the mud-supported gravels from the basalt basement and basal soil. The gravels include rounded pumice (yellow arrows) and platy–angular basalt (white arrows).
The wave height of the second saltation and joint-bounded group is sufficient to lift the 1.7 m long Chungtun-1 boulder onto the cliff top, while the 2.13–2.38 m tall waves of the supercritical regime (Froude number = 2) may lead to the deposition of fine-grained material below the cliff top and the formation of an undetected clast-supported fabric. Furthermore, additional overtop wave run-up and sediment transport are required to prevent the boulder from falling back down the cliff due to tsunami backwash (Pignatelli et al., 2009; Imamura et al., 2008; Lorang, 2011). Considering that the Chungtun-1 boulder was probably moving in a rolling–saltation manner before deposition, the substantial depth required for the cliff-top run-up/overflow is unlikely to result from tsunami waves that are only 2.13–2.38 m in height (Figs. 3a and 4d).
Taken together, these results suggest that a tsunami wave height significantly exceeding the majority of the calculated results is required. It is estimated to be 3.19 m, ensuring that the cliff-top overflow surpasses the 0.69 m tall boulder and allows the terminal rolling before deposition. Alternatively, the tsunami waves were low in the supercritical regime (1 < Froude number < 1.6) and at least taller than 3.37 m (2.5 m cliff height + 0.87 m rolling wave height). The outcrop observation also indicates the run-up and local wave height could reach 4.0 m, based on the pinch-out of the Chungtun-1 layer at 4.0 m a.s.l. (Fig. 3a; Pignatelli et al., 2009; Nanayama and Shigeno, 2006; Paris et al., 2018).
4.1.3 Wave period
The estimated wave period ranges from 2.9–15.0 s in the supratidal zone to 19.6–132.9 s in the intertidal zone and 6.47 × 10³–3.55 × 10⁴ s in the subtidal zone (Table 3). According to the formulas used (Table 2), the prominent seaward increase is primarily influenced by the slope angle, which decreases drastically to 0.01∘ in the nearly horizontal subtidal zone (Fig. 2; Barbano et al., 2010; Lorang, 2011). The observed increases in water depth and wave height also favor a wave period increase.
Comparing the estimated wave periods with the modern wave records, it is evident that typhoon waves play an insignificant role in the transport and deposition of the Chungtun-1 boulder (Tables 1 and 3). Only the estimated range of 6.8–15.0 s for the supratidal zone is comparable to the modern wave maximum of 8.7–23.2 s, which, however, occurs at a depth of 20–40 m offshore (Central Weather Bureau, 2022).
In contrast, the estimated subtidal period that is associated with the minimum tsunami wave height and ranges from 1.5–4.9 h (5.47 × 10³–1.77 × 10⁴ s) is comparable to the typical periods of modern tsunamis (Barbano et al., 2010; Lorang, 2011). The estimated period extends to 5.8 h when the waves are 3.19 m high. The successive shortening of the estimated period in the intertidal–supratidal zone likely corresponds to the deceleration of the tsunami waves through shoaling, which also causes a landward decrease in wavelength and a landward increase in wave height. Therefore, the Chungtun-1 boulder transport is attributed to long-periodicity tsunamis or tsunami-like composite waves produced by the interplay between typhoon waves, surge, infra-gravity waves, and astronomical high tides (Baumann et al., 2017; Brill et al., 2016; Nakamura et al., 2014; Sohn and Sohn, 2019; Watanabe et al., 2017).
4.2 Supratidal Upper Holocene facies
4.2.1 Description
The newly investigated and previously reported Upper Holocene outcrops are situated on the supratidal shore platforms at elevations of 2.5 m a.s.l. (Chungtun-1 and Chungtun-2 outcrops; Figs. 3a and 4a) and 2.0 m a.s.l. (Shetoushan, Watong, and Suogang outcrops; Fig. 4a–c). The outcrops have a thickness ranging from 0.4 to 1.2 m and are primarily composed of common colluvium and dune deposits on the islands (Fig. 5a–b; Yen and Lee, 2017; Lu et al., 2019). Overlying the weathered, lateritic basalt basement, the Upper Holocene is composed of the mottled/weathered gravelly colluvium (Chungtun-1 and Chungtun-2 outcrops; Figs. 3b and 6a), bioclastic sand (Watong outcrop; Fig. 6b), and brownish sandy soil (Shetoushan and Suogang outcrops; Fig. 6c–d) as well as the top humic soil. The mottled brownish sandy soil and colluvium are poorly sorted (CT-2-03, STS-01, STS-03, STS-04, and STS-06 in Fig. 5c) and contain angular basalt debris (Figs. 3a–b, 4d, 6a, c–d). The bioclastic sands are better sorted and predominantly consist of shell fragments and foraminifers, forming local dunes (Figs. 4b and 6b). According to the radiocarbon dating results, the newly studied Upper Holocene sections have accumulated since the fifteenth century, and the Suogang section started accumulating in the tenth century (Fig. 5a–b, Table 4; Lu et al., 2019).
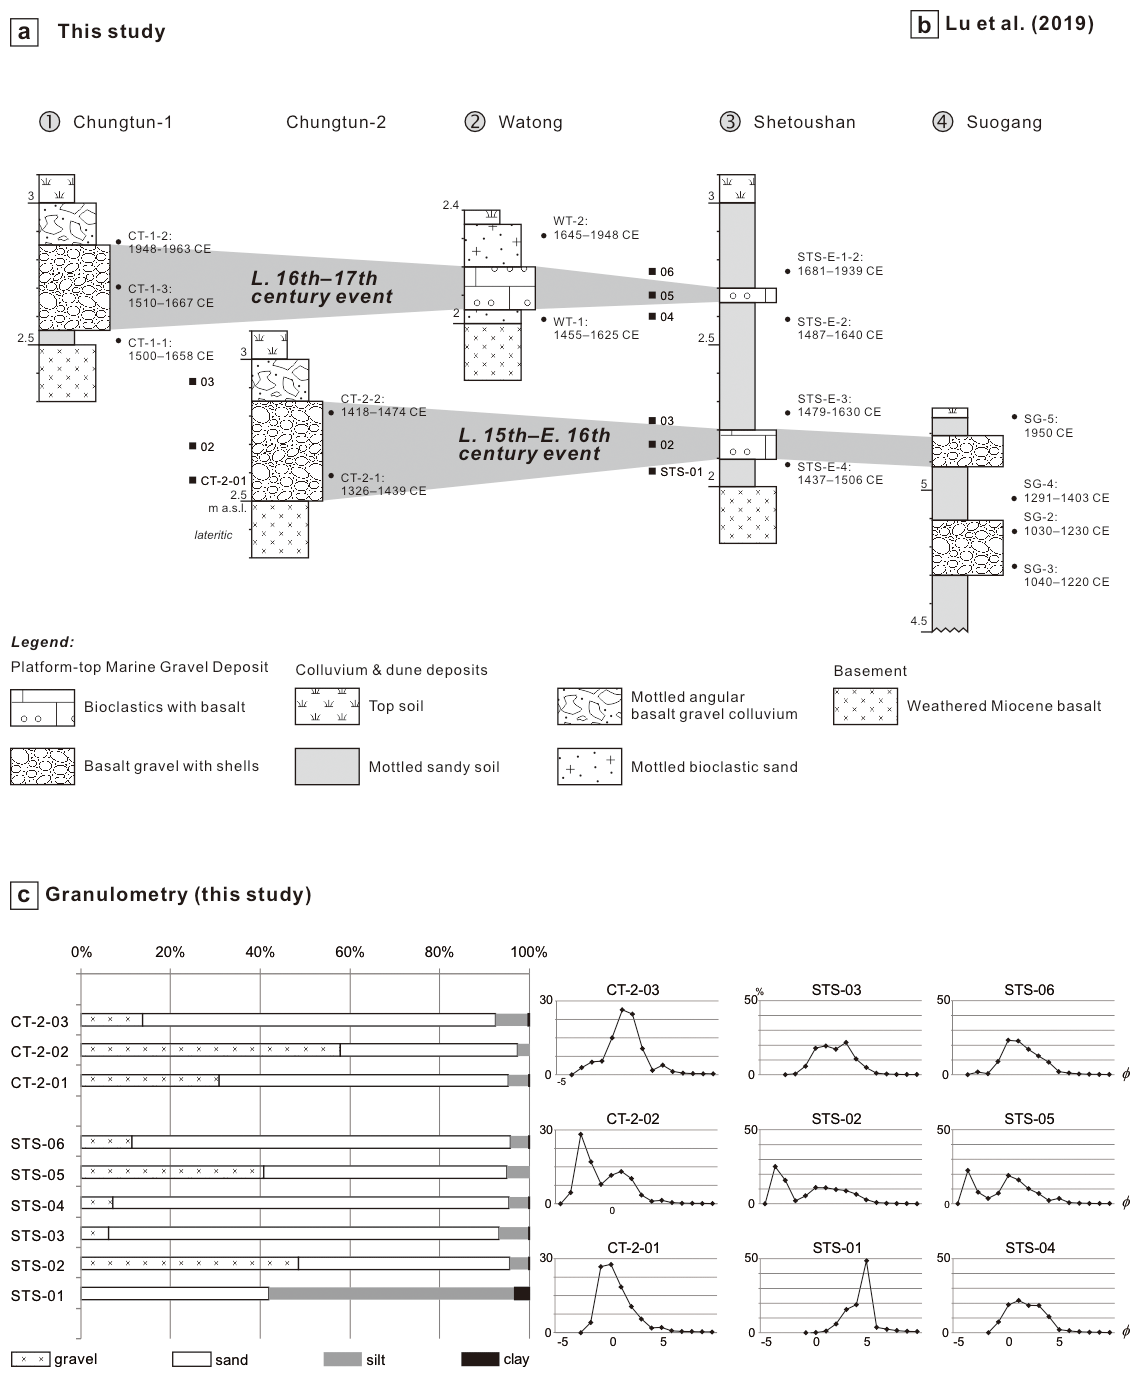
Figure 5Stratigraphic correlation between outcrops and granulometry in this study. (a, b) Stratigraphic columns and correlation. Radiocarbon dating details are shown in Table 4. (c) Granulometry of Shetoushan and Watong outcrops showing an abrupt grain size increase from the underlying samples to the candidate event layer samples (CT-2-01 and CT-2-02, STS-02 and STS-05).
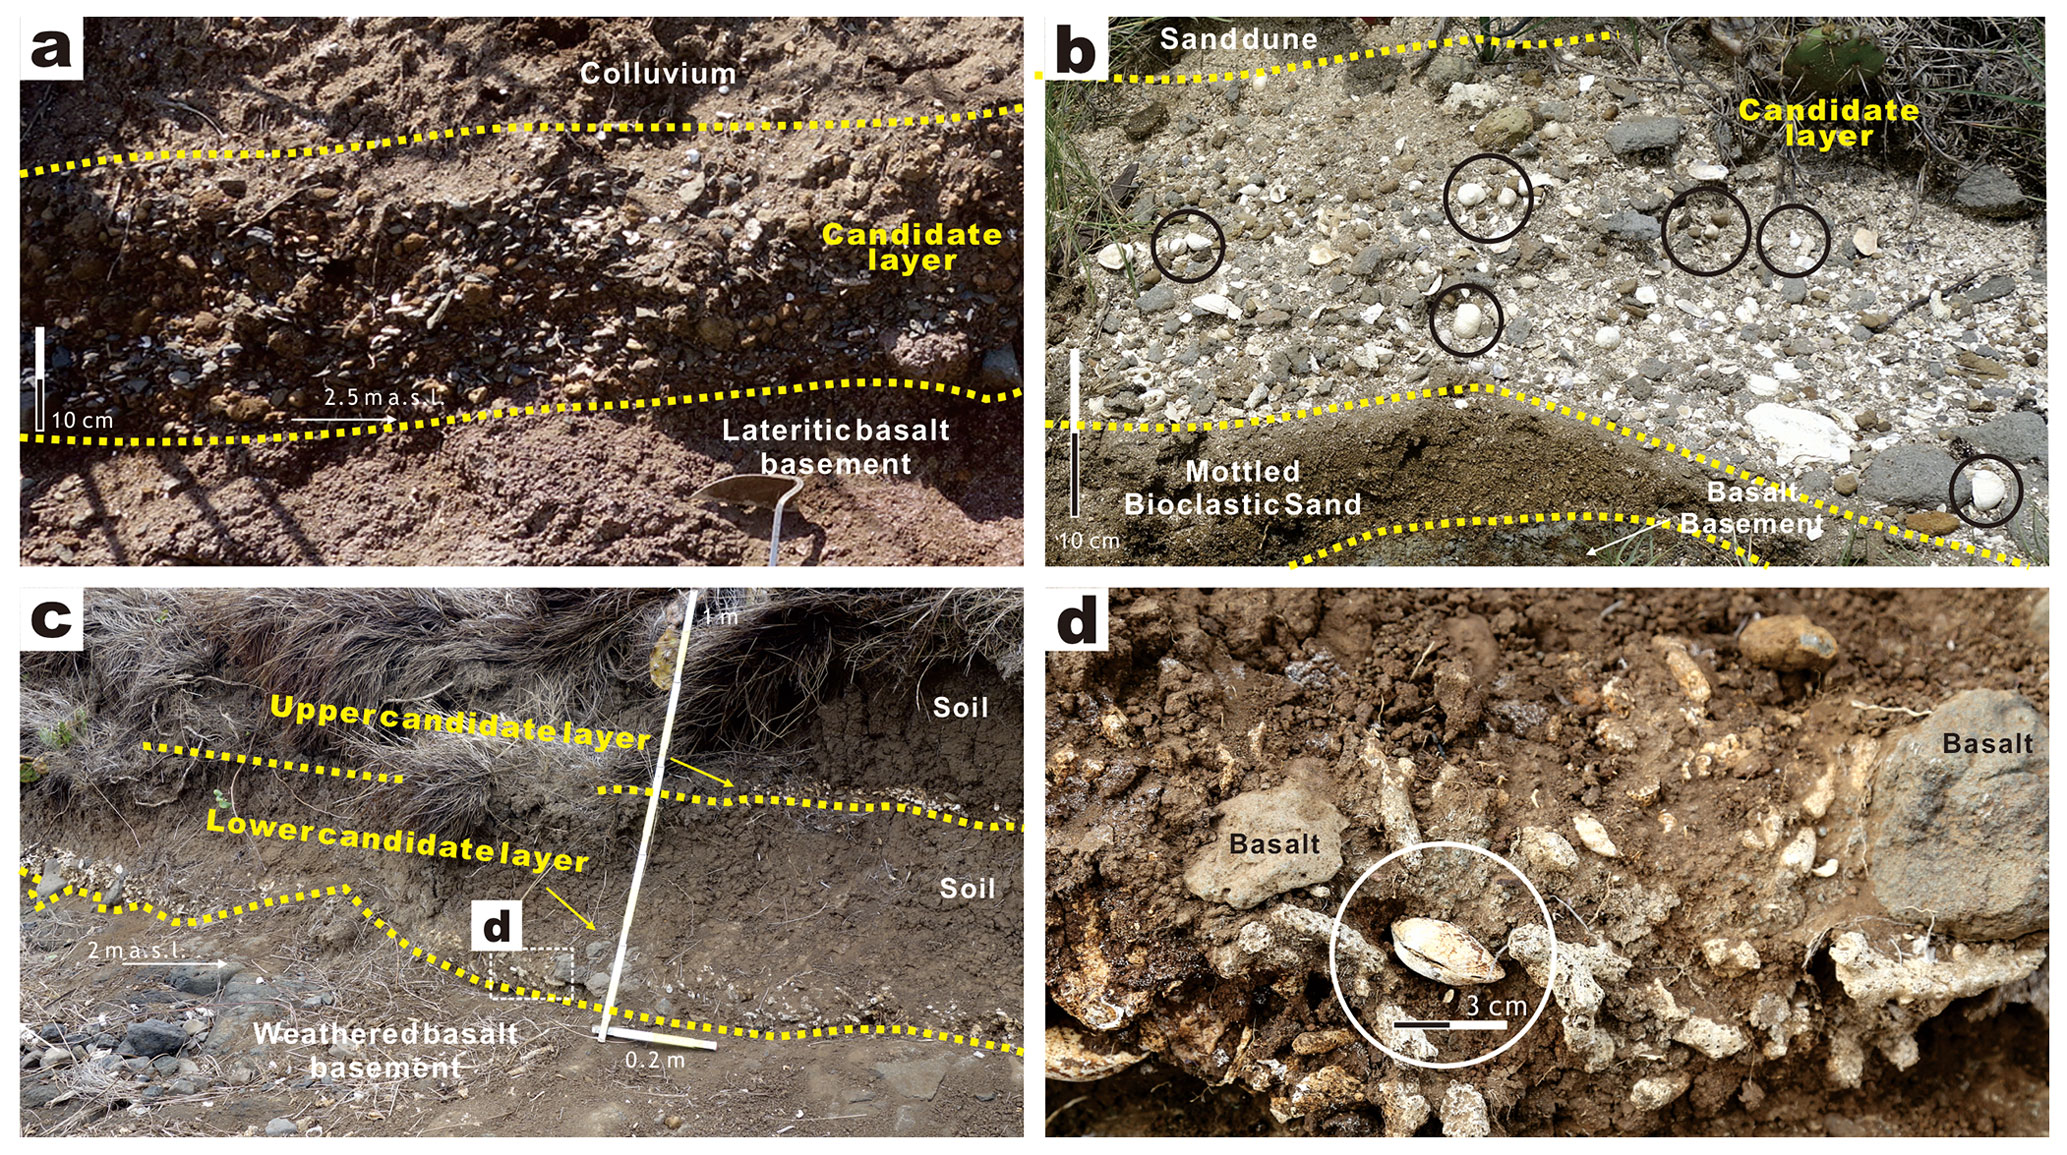
Figure 6Outcrop views of the candidate event gravel layers in this study. See locations in Fig. 4. (a) Matrix-supported candidate gravel layer in the Chungtun-2 outcrop, characterized by pebbles of rounded rusty brown pumice, grey basalt, and white bioclast. (b) Candidate gravel layer in the Watong outcrop, characterized by well-preserved gastropods (black circles) and dominated by white bioclast with grey basalt and yellowish–rusty grey rounded pumice. (c) The Shetoushan outcrop showing intercalated soil and two candidate layers. (d) Close-up view of articulated bivalves (white circle) among the coral and basalt debris in the matrix-supported lower candidate layer in (c).
Embedded in the colluvium and dune deposit, the candidate gravel layers that are associated with events of marine inundation and deposition are 10–70 cm thick and lie at an elevation of 2.0–4.5 m a.s.l. (Fig. 5a–b). These layers are poorly sorted, matrix-supported, massive/structureless, and in sharp basal contact with the weathered basalt residues and mottled deposits (Figs. 3b and 6). In addition to field observation, the sharp contact is also evidenced by abrupt upward increases in granulometry from the lateritic basalt basement to the CT-2-01 sample, from STS-01 to STS-02, and from STS-04 to STS-05 (Fig. 5b–c). The gravel components include basalt, pumice, and bioclast (Figs. 3a, 6, and 5b; Lu et al., 2019). The basalt grain size is pebble–cobble in most of the examined candidate layers and reaches medium boulder size in the Chungtun-1 layer (Fig. 3a). The pumice is rounded to subrounded in shape, pebble in size, and rusty–yellowish brown in color (Figs. 3b and 6a–b). The bioclasts include coral, mollusks, and foraminifera and are characterized by articulated bivalves and well-preserved gastropods in the Shetoushan and Watong candidate layers (Fig. 6b and d). The matrix contains sediments that are similar to the underlying deposits and basement soils, including weathered–lateritic angular basalt debris, mottled brownish sandy soil, and bioclastic sand (Figs. 4d and 6).
4.2.2 Interpretation
The mottled colluvium and dune deposits are interpreted as terrestrial and/or supratidal accumulations that have been subjected to post-depositional soil formation. The soil preservation is attributed to the regional tectonic and geomorphological stability and the lack of wave and tidal reworking in the supratidal zone (Fig. 4a–c). The angular basalt colluvium in the Chungtun-1 and Chungtun-2 outcrops may represent the deposits resulting from rockslides on relatively steep slopes (Figs. 2b and 4a). The mottled sandy soil in the Shetoushan and Suogang outcrops, as well as the bioclastic sand in the Watong outcrop, is likely indicative of supratidal dune deposits (Fig. 4b–c).
The matrix-supported candidate gravel layers, characterized by a sharp base and poor sorting, are interpreted as event deposits that record initial scouring and rapid fallout from suspension-rich turbulent flows (Fujiwara and Kamataki, 2008; Lowe, 1982; Nanayama and Shigeno, 2006; Paris et al., 2018; Madeira et al., 2020; Pérez-Torrado et al., 2006). Based on the coarse-grained size of cobbles–boulders and the 1.7 m long Chungtun-1 boulder, the flow velocity, density, and turbulence were evidently high, creating a powerful combined hydraulic lift and dispersive pressure that effectively prevented settling during transport. During deposition, the rapid fallouts are highlighted by the matrix-supported gravel fabric and the mixed particles with a wide range of densities and sizes, including vesicular pumice, carbonate bioclast, and mafic igneous basalt (CT-2-01, CT-2-02, STS-02, and STS-05 in Fig. 5c).
The sediments found in the candidate gravel layers were originated from coastal marine environments and reworked from beach–dune environments to a high supratidal location. The beach-derived sediments include bioclasts, such as coral, foraminifera, and mollusks, as well as pumice, all of which are commonly observed on local beaches (Figs. 3a and 4a–c). On the Penghu Islands, modern beach pumice includes stranded rafts from the 2021 submarine eruption in the southern Izu–Bonin Arc, whereas pumice is absent in the Miocene basalt and sedimentary basement (Yen and Lee, 2017; Yu et al., 2022). Ancient stranded pumice rafts are commonly incorporated into backshore event redepositions and have been reported in northern Taiwan from the past 2.4 kyr (Yu et al., 2022). The redeposited dune and supratidal material is represented by angular basalt, brownish soil, and bioclastic sand in the matrix and is present in the sections below the candidate layers (Figs. 4d and 6a–d).
4.3 Age dating and correlation
The investigated Upper Holocene stratigraphy is best manifested by the Shetoushan outcrop because of the continuous exposure with two candidate layers and the radiocarbon dates in ascending and decreasing order (Fig. 5a–b).
The lower Shetoushan layer is intercalated into sandy soil dating from the fifteenth–early seventeenth centuries. Laterally, the layer is comparable in age to the candidate layer in outcrop Chungtun-2, which was deposited in the fourteenth–fifteenth centuries at the earliest based on the age of the detrital sediment matrix. The upper Suogang layer is also of a comparable age, overlying soil from the thirteenth–fourteenth centuries.
The upper Shetoushan layer overlies the soil dating to the sixteenth–seventeenth centuries and underlies the soil dating to the seventeenth–nineteenth centuries; it is correlated with the Chungtun-1 layer and the calculated boulder, which were deposited in the sixteenth–seventeenth centuries, according to the dating results obtained for the Chungtun-1 layer and the underlying soil. Correlation is extended to the candidate layer in the Watong outcrop, which lies between deposits from the fifteenth–sixteenth centuries and the seventeenth–nineteenth centuries.
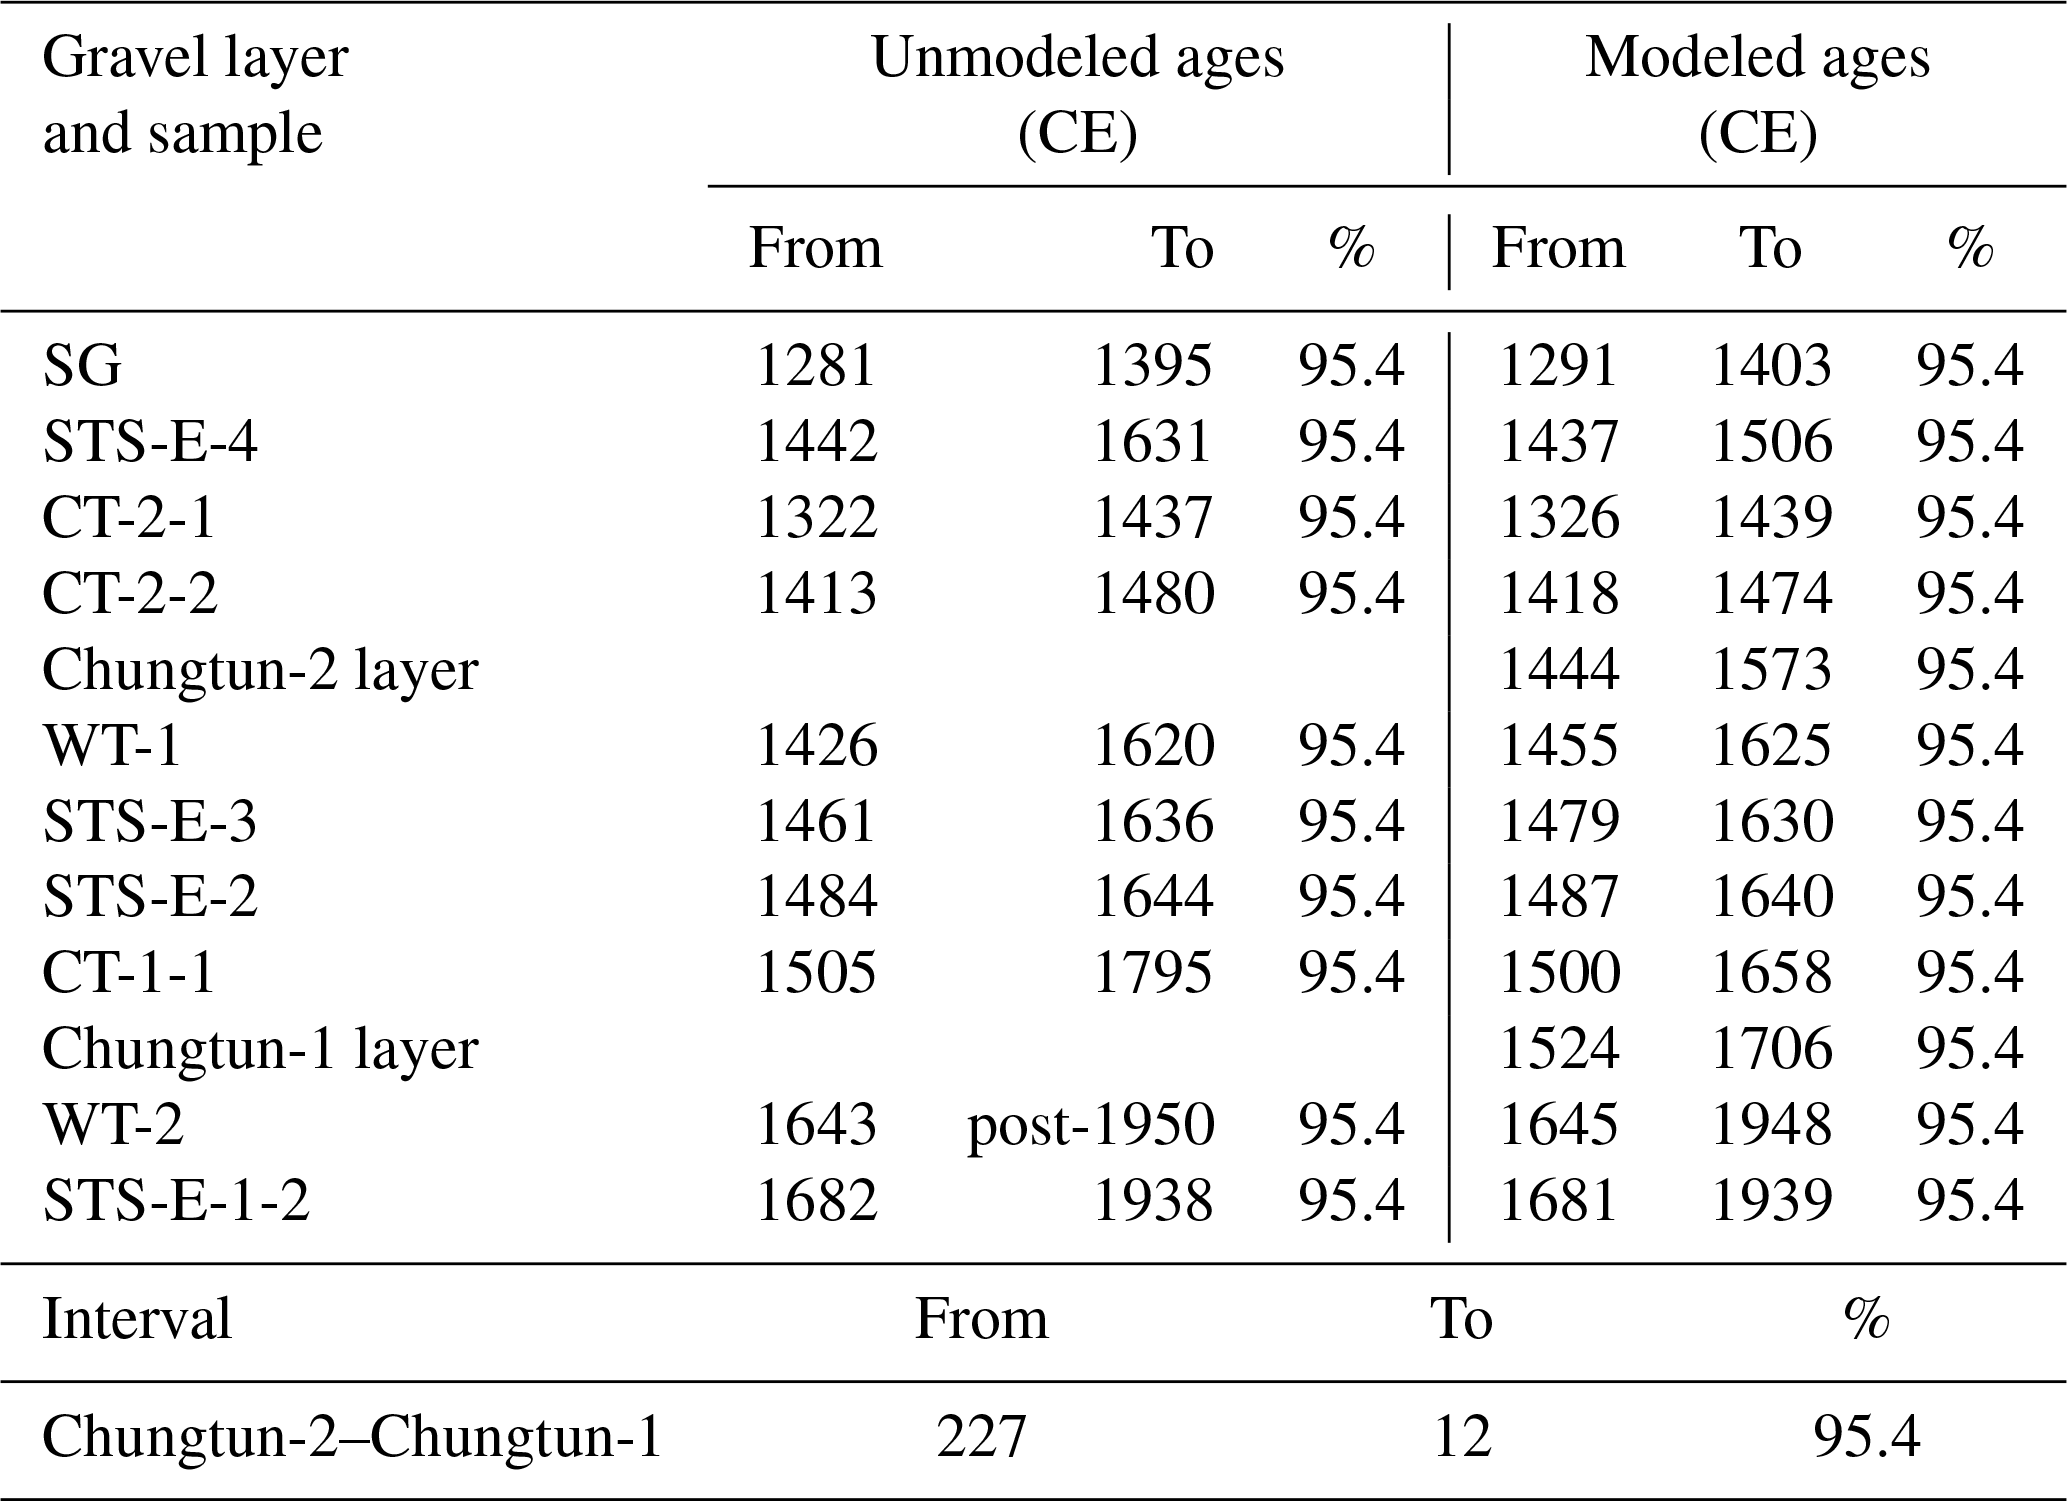
The dating results are refined by the modeled ages from the calculation results obtained using OxCal 4.4 (Fig. 7, Table 5; Ramsey, 2021). The modeled ages of the Shetoushan layers are 1444–1573 and 1524–1706, forming a continuous time span with the 1575 midpoint. A modeled interval of 12–227 years lies between the layers.
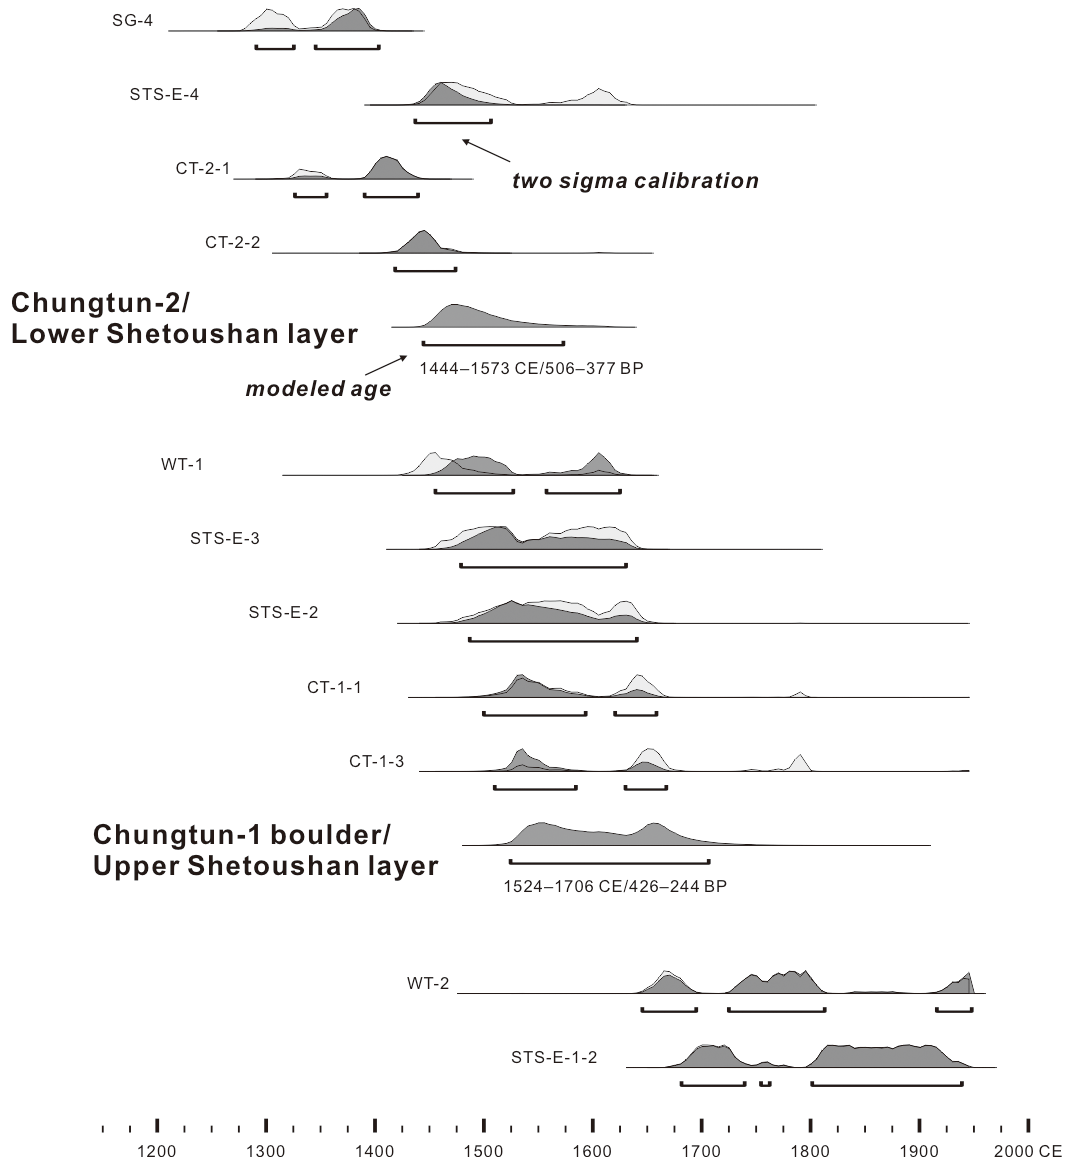
Figure 7Modeled ages of the radiocarbon samples and the Chungtun-1 boulder/upper Shetoushan and Chungtun-2/lower Shetoushan layers obtained using the OxCal 4.4 program (Ramsey, 2021). Further details are given in Table 5.
Table 5Modeled ages of the radiocarbon samples and candidate event layers obtained using OxCal 4.4 program of Ramsey (2021).
Collectively, the Chungtun-1 layer including the calculated boulder is attributed to the event that led to marine inundation and deposition in the seventeenth century (1575–1706, 1640 ± 66). This event is reported for the first time in the study area and also in the South China Sea region. The candidate layer in the Chungtun-2 outcrop records an earlier event that probably occurred in the late fifteenth–late sixteenth centuries (1444–1575, 1510 ± 65). The source event was previously reported by Lu et al. (2019) based on the earlier finding of the upper Suogang layer. The coeval deposits in the Shetoushan and Chungtun-2 outcrops that were firstly examined in this study appear to constrain the northern extent of this marine inundation and deposition on the Penghu Islands (Fig. 1b).
5.1 Tsunami wave processes acting on the candidate gravel and boulder deposits
Integrating the results of the incorporative hydrodynamic approach and the facies stratigraphic analysis indicates that the event depositions of both the Chungtun-1 and the Chungtun-2 gravel layers are attributed to tsunamis rather than typhoons.
Based on the size, shape, facies, elevation, and dating of the Chungtun-1 boulder, the wave process is thought to have lifted the boulder from the intertidal joint-bounded exposure, transported it via incipient saltation and terminal rolling over a total distance of over 30 m, and significantly overflowed the cliff (Fig. 2). As a result, an estimated minimum wave height of 3.19 (∼ 3.2) m is required. After calibrating the ancient local sea level and 100-year surge, the tallest typhoon waves that can form in the Chungtun Channel are ruled out as insufficient for the boulder deposition. Typhoon waves reach only a maximum height of 3.3 m in the channel (height = 0.73 × water depth), which would only cause the Chungtun-1 boulder to undergo slide–roll movement in the intertidal–subtidal zone (Table 3). The tallest typhoon waves in the supratidal zone may be less than 1.5 m high and too weak to push or roll the boulder onto the 2.5 m high cliff. Moreover, the typhoon waves that are likely to form in the channel are probably overestimated because the modeled ratio of 0.73 of wave height to water depth at wave break appears to be excessive (Collins, 1970). This is because the ratio tends to be small, at around 0.44–0.6, in nearly horizontal bathymetry such as that observed in the Penghu area (Fig. 1b; Noormets et al., 2004). This finding is supported by the wave height maximum that was set by the 2015 Super Typhoon Soudelor, which decreased from 6.8 m in the 26 m deep Paisha offshore area to 6.5 m in the 14 m deep Makong Channel and 2.8 m in the 8 m deep Longman nearshore area (Fig. 1b; Liu et al., 2016). The ratio of 0.26–0.46 from these observations is probably more applicable to the Chungtun Channel. Accordingly, the tallest typhoon waves may have reached only 0.9–1.8 m in the channel during the sixteenth–seventeenth centuries, which is barely enough to initiate Chungtun-1 boulder sliding in the intertidal–subtidal zone (Fig. 2c, Table 3).
The estimated wave period also associates the Chungtun-1 boulder transport with long-periodicity tsunamis or tsunami-like composite waves (Table 3). The tsunami wave origin appears to be dominant over the tsunami-like composite wave, according to the facies characteristics of poor sorting, abundant fine-grained sediment, and matrix support (Figs. 3 and 6). The composite waves and induced currents usually have a low sediment capacity due to rapid attenuation following the wave break and low velocity as compared to tsunami waves (Watanabe et al., 2017; Dietrich et al., 2011; Bricker et al., 2014). Composite wave breaks tend to result in multiple overwashes and sublayers that are characterized by normal sedimentary grading and moderate-to-high sorting (Baumann et al., 2017; Brill et al., 2016; Sohn and Sohn, 2019). These features of better sorting and stratification are absent in the candidate gravel layers found in this study.
The supratidal elevation of most of the candidate gravel layers, 2.5–5.1 m a.s.l., also marks tsunami wave heights exceeding the 100-year typhoon surge of 1.8 m a.s.l. (Fig. 5a–b). The candidate layer elevation in the Watong and lower Shetoushan sections is only 2.0–2.1 m a.s.l., indicating the two layers may have been deposited by the 100-year surges in the fifteenth–seventeenth centuries when the local sea level was 0.2–0.3 m higher (Chen and Liu, 1996). However, the modern surge maximum at 1.8 m a.s.l. that is associated with ongoing global warming may be too large to represent the surge conditions during the seventeenth–nineteenth centuries of the Little Ice Age. This is because the historical surges at only 1.2–1.5 m a.s.l. are theoretically concordant with the cool climate control (Hsu, 2007; Oey and Chou, 2016; Mei and Xie, 2016). Moreover, the Watong and lower Shetoushan layers are characterized by well-preserved articulated bivalves and gastropods, and they feature depositions from rapid catastrophic events rather than prolonged storm depositions with intense collision and abrasion between shells and rock clasts (Fig. 6b and d; Donato et al., 2008; Madeira et al., 2020; Pérez-Torrado et al., 2006).
The estimated minimum tsunami waves that reach 3.2 m in height significantly surpass the modern record of 0.4 m height for the 1994 tsunami on the Penghu Islands. The wave height of several meters that is inferred from the paleotsunami deposits is not uncommon and has been recently reported both in the study area and in northern Taiwan (Yu et al., 2016; Lu et al., 2019; Sugawara et al., 2019). Despite the outcrops other than the Chungtun-1 outcrop being barren of cliff-top boulders, the elevation of the candidate layers quantitatively marks the minimum tsunami wave run-up (Pignatelli et al., 2009; Nanayama and Shigeno, 2006; Paris et al., 2018). It is noteworthy that the present layer elevation was likely 0.2–0.3 m lower during deposition in the fifteenth–seventeenth centuries when the local sea level was higher, and the beach profiles may shift landwards and upwards accordingly (Chen and Liu, 1996). Thus, the local wave height at the Shetoushan outcrop during the seventeenth-century Chungtun-1 event is estimated at 2.4 m (Fig. 5a). The local wave height during the sixteenth-century Chungtun-2 event was probably 2.2 m at the Chungtun-2 outcrop and 4.8 m at the Suogang outcrop (Fig. 5a–b).
5.2 Probable event sources
Because no historical earthquakes and tsunamis are recorded on the Penghu Islands, far-field sources for the Chungtun-1 and Chungtun-2 events are likely, similarly to the epicenter of the 1994 earthquake tsunami, which was far away in the southwest Taiwan Strait (Fig. 1a). Across the Taiwan Strait, three distant candidate earthquakes with seawater overflows occurred in the period of the two Chungtun events, namely the 1604 and 1640 earthquakes in southeast China and the 1661 earthquake in southwest Taiwan (Keimatsu, 1963; Nakamura, 1937; Lei and Ou, 1991).
The newly identified seventeenth-century Chungtun-1 tsunami is tentatively associated with the 1661 earthquake based on the historical accounts and the results of comparison with the previously reported forward simulations. According to the estimated local wave height of 2.4–4.0 m, the Chungtun-1 tsunami was evidently much larger than the 0.4 m high tsunami that followed the 1994 M 6.4 earthquake (Central Weather Bureau, 2022). The 1640 earthquake and overflow are readily ruled out because they were insignificant and less disastrous than the 1604 and 1661 events (Keimatsu, 1963; Lei and Ou, 1991; Nakamura, 1937). The 1604 earthquake was previously associated with a shore-parallel northeast–southwest offshore rupture and an inferred magnitude of 8.0 near the southeast China coast (Fig. 1a; Lei and Ou, 1991). However, the previously reported simulations of the earthquake do not match the results of this study, showing a marked cross-strait wave dissipation from 0.96 m high in southeast China to 0.3 m high in northwest Taiwan (Huang et al., 2006; Wu, 2015). The 1661 earthquake was the largest on southwest Taiwan and could be associated with the pronounced compressional tectonics of the orogenic island (Hsu, 2007; Nakamura, 1937). The previously reported simulations feature 2–4 m high tsunamis in southwest Taiwan in association with scenarios of M 8.2 earthquakes and reverse faulting and nonuniform slip distributions in the northern Manila Trench (Fig. 1a; Li et al., 2015). The estimated wave heights across southwest Taiwan and the Penghu Islands shown in previous studies and the present study are comparable and thus ought to be included in future studies.
The sixteenth-century Chungtun-2 tsunami has been previously correlated to the 1604 earthquake (Lu et al., 2019). However, based on the new dating results (1444–1575, 1510 ± 65), it is now associated with an unidentified event, showing a significant age discrepancy. The 2.2–4.8 m wave height derived from the candidate layer elevation is reported for the first time and is comparable to the Chungtun-1 tsunami wave height, which likewise suggests a major event and calls for further investigation. One plausible explanation for the source of the tsunami is a submarine landslide because steep slopes of high landslide potential are omnipresent from the Penghu Islands to southwest Taiwan and no major historical earthquakes are recorded across the Taiwan Strait in the period under question (Fig. 1a). Future simulation that includes the Penghu Islands is important, as the previously reported landslide scenarios show 5 m high tsunamis in southwest Taiwan (Li et al., 2015; Liu et al., 2022).
The coastal tsunami impact of the South China Sea was quantitatively evaluated for the first time by applying incipient motion formulas to the newly identified seventeenth-century cliff-top boulder on the Penghu Islands in the Taiwan Strait. This study distinguishes the tallest typhoon waves that can form in the interisland bathymetry during the co-occurrence of ancient high sea levels and a 100-year surge, and it determines them to be too weak to account for the 2.5 m high cliff-top deposition. The required tsunami height and period are estimated to be 3.2 m and 5.8 h, respectively, rendering boulder deposition and terminal rolling possible. Additionally, local gravel layers at three different locations indicate an inferred run-up wave height of 2.4–4.0 m.
Compared to the other cliff-top boulders around the world (see Cox et al., 2020; Etienne et al., 2011; Goto et al., 2010, and references therein), the studied boulder is unique and is characterized by a matrix-supported fabric, an upslope pinch-out bedform, and lateral fining to pebble–cobble composition (Fig. 2). In addition to the angular boulder shape, the boulder facies record a suspension-rich turbulent flow process and the tsunami transport of bore-like waves from initial joint-bounded lift to saltation and rolling.
The new geological record obtained in this study improves our understanding of the South China Sea tsunamis and may contribute to future hydrodynamic simulations. The newly identified event during the period of 1575–1706 is related to the disastrous 1661 earthquake in southwest Taiwan, likely originating from megathrust activity in the northern Manila Trench (Fig. 1a). The date of the previously reported event in the fifteenth–sixteenth centuries is revised to between 1444 and 1575 and is correlated with an unspecified event, the type of which may be a submarine landslide. This is a prominent candidate because of the extensive steep slopes in the region (Lu et al., 2019).
The data are available upon request from the authors.
NTY led the field investigation, calculated the hydrodynamic estimation, and drafted the manuscript. CHL and ICY participated in the field survey, and CHL created the DEM image of the Chungtun Channel and carried out boulder measurements. JHC undertook the grain size analysis. JYY and SJC provided important advice that contributed to the discussion and conclusions.
The contact author has declared that none of the authors has any competing interests.
Publisher’s note: Copernicus Publications remains neutral with regard to jurisdictional claims made in the text, published maps, institutional affiliations, or any other geographical representation in this paper. While Copernicus Publications makes every effort to include appropriate place names, the final responsibility lies with the authors.
The authors are grateful to the editor, Rachid Omira; the reviewer Napayalage Nandasena; and the anonymous reviewer for their valuable comments and advice that greatly improved this paper. The fieldwork help from Yi-Quan Zeng is appreciated.
This study has been supported by the National Science and Technology Council, Taiwan (grant nos. 112-2116-M-007-001 and 112-2119-M-259-004).
This paper was edited by Rachid Omira and reviewed by Napayalage Nandasena and one anonymous referee.
Barbano, M. S., Pirrotta, C., and Gerardi, F.: Large boulders along the south-eastern Ionian coast of Sicily: storm or tsunami deposits?, Mar. Geol., 275, 140–154, https://doi.org/10.1016/j.margeo.2010.05.005, 2010.
Baumann, J., Chaumillon, E., Bertin, X., Schneider, J.-L., Guillot, B., and Schmutz, M.: Importance of infragravity waves for the generation of washover deposits, Mar. Geol., 391, 20–35, https://doi.org/10.1016/j.margeo.2017.07.013, 2017.
Bricker, J. D., Takagi, H., Mas, E., Kure, S., Adriano, B., Yi, C., and Roeber, V.: Spatial variation of damage due to storm surge and waves during Typhoon Haiyan in the Philippines, J. Jpn. Soc. Civ. Eng. Ser. B2, 70, I_231–I_235, https://doi.org/10.2208/kaigan.70.I_231, 2014.
Brill, D., May, S. M., Engel, M., Reyes, M., Pint, A., Opitz, S., Dierick, M., Gonzalo, L. A., Esser, S., and Brückner, H.: Typhoon Haiyan's sedimentary record in coastal environments of the Philippines and its palaeotempestological implications, Nat. Hazards Earth Syst. Sci., 16, 2799–2822, https://doi.org/10.5194/nhess-16-2799-2016, 2016.
Central Weather Bureau: Wave Statistics, https://www.cwb.gov.tw/V8/E/C/MMC_STAT/sta_wave.html (last access: 25 June 2022), 2022.
Chang, H. M.: On the reoccurrence period of joint events of typhoon waves and surges, MS thesis, Department of Hydraulic and Ocean Engineering, National Cheng Kung University, 110 pp., 2009.
Chen, Y.-G. and Liu, T.-K.: Sea level changes in the last several thousand years, Penghu Islands, Taiwan Strait, Quaternary Res., 45, 254–262, https://doi.org/10.1006/qres.1996.0026, 1996.
Collins, J. I.: Probabilities of breaking wave characteristics, in: Coastal Engineering 1970, American Society of Civil Engineers, 399–414, https://doi.org/10.1061/9780872620285.025, 1970.
Cox, R., Ardhuin, F., Dias, F., Autret, R., Beisiegel, N., Earlie, C. S., Herterich, J. G., Kennedy, A., Paris, R., Raby, A., Schmitt, P., and Weiss, R.: Systematic review shows that work done by storm waves can be misinterpreted as tsunami-related because commonly used hydrodynamic equations are flawed, Front. Mar. Sci., 7, 4, https://doi.org/10.3389/fmars.2020.00004, 2020.
Dietrich, J. C., Zijlema, M., Westerink, J. J., Holthuijsen, L. H., Dawson, C., Luettich, R. A., Jensen, R. E., Smith, J. M., Stelling, G. S., and Stone, G. W.: Modeling hurricane waves and storm surge using integrally-coupled, scalable computations, Coast. Eng., 58, 45–65, https://doi.org/10.1016/j.coastaleng.2010.08.001, 2011.
Donato, S. V., Reinhardt, E. G., Boyce, J. I., Rothaus, R., and Vosmer, T.: Identifying tsunami deposits using bivalve shell taphonomy, Geology, 36, 199–202, https://doi.org/10.1130/g24554a.1, 2008.
Etienne, S., Buckley, M., Paris, R., Nandasena, A. K., Clark, K., Strotz, L., Chagué-Goff, C., Goff, J., and Richmond, B.: The use of boulders for characterising past tsunamis: Lessons from the 2004 Indian Ocean and 2009 South Pacific tsunamis, Earth Sci. Rev., 107, 76–90, https://doi.org/10.1016/j.earscirev.2010.12.006, 2011.
Fujiwara, O. and Kamataki, T.: Chapter nine - Tsunami depositional processes reflecting the waveform in a Small Bay: Interpretation from the grain-size distribution and sedimentary structures, in: Tsunamiites, edited by: Shiki, T., Tsuji, Y., Yamazaki, T., and Minoura, K., Elsevier, Amsterdam, 133–152, https://doi.org/10.1016/B978-0-444-51552-0.00009-6, 2008.
Goff, J., Witter, R., Terry, J., and Spiske, M.: Palaeotsunamis in the Sino-Pacific region, Earth Sci. Rev., 210, 103352, https://doi.org/10.1016/j.earscirev.2020.103352, 2020.
Goto, K., Okada, K., and Imamura, F.: Characteristics and hydrodynamics of boulders transported by storm waves at Kudaka Island, Japan, Mar. Geol., 262, 14–24, https://doi.org/10.1016/j.margeo.2009.03.001, 2009.
Goto, K., Kawana, T., and Imamura, F.: Historical and geological evidence of boulders deposited by tsunamis, southern Ryukyu Islands, Japan, Earth Sci. Rev., 102, 77–99, https://doi.org/10.1016/j.earscirev.2010.06.005, 2010.
Hsu, H. and Chen, C. F. (Eds.): Renewed editions of Qiing dynastic historical accounts of Taiwan natural hazards, Taiwan Strait Reserach Series, Fujian People's publishing house, Fuchou, PROC, 396 pp., https://nthu.primo.exlibrisgroup.com/permalink/886UST_NTHU/vaplfb/alma990002949640206774 (last access: 5 May 2022), 2007.
Huang, Z., Wang, S. X., and Wang, X. N.: Analysis of the 1604 Quanzhou offshore earthquake-tsunami effects, Earthquake, 26, 94–102, 2006.
Hudson, R. Y.: Wave forces on breakwaters, T. Am. Soc. Civ. Eng., 118, 653–674, https://doi.org/10.1061/TACEAT.0006816, 1953.
Imamura, F., Goto, K., and Ohkubo, S.: A numerical model for the transport of a boulder by tsunami, J. Geophys. Res.-Oceans, 113, C01008, https://doi.org/10.1029/2007JC004170, 2008.
Jiang, W. D., Chang, H. K., Liou, J. C., Chen, W. W., and Ho, L. S.: Investigation of long-term wave statistics and design wave for main harbors of Taiwan. Report of institute of transportation, MOTC, Taiwan, 2/4, No. 100–52–7537, Taipei, 246 pp., https://www.grb.gov.tw/search/planDetail?id=2021679&docId=330483 (last access: 30 June 2022), 2011.
Jiang, W. D., Chang, H. K., Liou, J. C., Chen, W. W., and Ho, L. S.: Investigation of long-term wave statistics and design wave for main harbors of Taiwan. Report of institute of transportation, MOTC, Taiwan, 3/4, No. 101–16–7590, Taipei, 246 pp., https://www.grb.gov.tw/search/planDetail?id=2266341 (last access: 30 June 2022), 2012.
Keimatsu, M.: On the historical tidal waves in China, Zisin, J. Seismol. Soc. Jpn., 16, 149–160, 1963.
Kennedy, A. B., Cox, R., and Dias, F.: Storm waves may be the source of some “tsunami” coastal boulder deposits, Geophys. Res. Lett., 48, e2020GL090775, https://doi.org/10.1029/2020GL090775, 2021.
Lau, A. Y. A., Switzer, A. D., Dominey-Howes, D., Aitchison, J. C., and Zong, Y.: Written records of historical tsunamis in the northeastern South China Sea – challenges associated with developing a new integrated database, Nat. Hazards Earth Syst. Sci., 10, 1793–1806, https://doi.org/10.5194/nhess-10-1793-2010, 2010.
Lei, T. C. and Ou, B. S.: Earthquake and sea overflow in Taiwan Strait and its adjacent regions, J. Oceanogr. Taiwan Strait, 10, 264–270, 1991.
Li, L. L., Switzer, A. D., Wang, Y., Weiss, R., Qiu, Q., Chan, C. H., and Tapponnier, P.: What caused the mysterious eighteenth century tsunami that struck the southwest Taiwan coast?, Geophys. Res. Lett., 42, 8498–8506, https://doi.org/10.1002/2015GL065567, 2015.
Li, L. L., Switzer, A. D., Chan, C. H., Wang, Y., Weiss, R., and Qiu, Q.: How heterogeneous coseismic slip affects regional probabilistic tsunami hazard assessment: A case study in the South China Sea, J. Geophys. Res., 121, 6250–6272, https://doi.org/10.1002/2016JB013111, 2016.
Li, L. L., Shi, F. Y., Ma, G. F., and Qiu, Q.: Tsunamigenic potential of the Baiyun slide complex in the South China Sea, J. Geophys. Res., 124, 7680–7698, https://doi.org/10.1029/2019JB018062, 2019.
Liu, C. C., Lee, J. F., Lee, C. Y., Chen, M. T., and Su, C. H.: Development of an operational wind wave simulation system for Penghu sea areas, The 38th Ocean Engineering Conference in Taiwan, Taipei, Taiwan, 101–106, http://www.tsoe.org.tw/download/thesis/2016A16.pdf (last access: 30 June 2022), 2016.
Liu, T.-C., Wu, T.-R., and Hsu, S.-K.: Historical tsunamis of Taiwan in the 18th century: the 1781 Jiateng Harbor flooding and 1782 tsunami event, Nat. Hazards Earth Syst. Sci., 22, 2517–2530, https://doi.org/10.5194/nhess-22-2517-2022, 2022.
Lorang, M. S.: A wave-competence approach to distinguish between boulder and megaclast deposits due to storm waves versus tsunamis, Mar. Geol., 283, 90–97, https://doi.org/10.1016/j.margeo.2010.10.005, 2011.
Lowe, D. R.: Sediment gravity flows; II, Depositional models with special reference to the deposits of high-density turbidity currents, J. Sediment. Res., 52, 279–297, https://doi.org/10.1306/212F7F31-2B24-11D7-8648000102C1865D, 1982.
Lu, C.-H., Yen, J.-Y., Chyi, S.-J., Yu, N.-T., and Chen, J.-H.: Geological records of South China Sea tsunamis on Penghu Islands, Taiwan, J. Asian Earth Sci., 177, 263–274, https://doi.org/10.1016/j.jseaes.2019.02.027, 2019.
Madeira, J., Ramalho, R. S., Hoffmann, D. L., Mata, J., and Moreira, M.: A geological record of multiple Pleistocene tsunami inundations in an oceanic island: The case of Maio, Cape Verde, Sedimentology, 67, 1529–1552, https://doi.org/10.1111/sed.12612, 2020.
Megawati, K., Shaw, F., Sieh, K., Huang, Z., Wu, T.-R., Lin, Y., Tan, S. K., and Pan, T.-C.: Tsunami hazard from the subduction megathrust of the South China Sea: Part I. Source characterization and the resulting tsunami, J. Asian Earth Sci., 36, 13–20, https://doi.org/10.1016/j.jseaes.2008.11.012, 2009.
Mei, W. and Xie, S. P.: Intensification of landfalling typhoons over the northwest Pacific since the late 1970s, Nat. Geosci., 9, 753–757, https://doi.org/10.1038/ngeo2792, 2016.
Nakamura, M., Arashiro, Y., and Shiga, S.: Numerical simulations to account for boulder movements on Lanyu Island, Taiwan: tsunami or storm?, Earth Planets Space, 66, 1–20, https://doi.org/10.1186/1880-5981-66-128, 2014.
Nakamura, T.: Taiwan earthquake accounts in Dutch documents, Kagaku no Taiwan, 5, 6–10, http://stfj.ntl.edu.tw/cgi-bin/gs32/gsweb.cgi?o=dpjournal&s=id=%22jpli2008-pd-sxt_0705_84_v005n002-003_no02_j%22.&searchmode=basic (last access: 15 July 2022), 1937.
Nanayama, F. and Shigeno, K.: Inflow and outflow facies from the 1993 tsunami in southwest Hokkaido, Sediment. Geol., 187, 139–158, https://doi.org/10.1016/j.sedgeo.2005.12.024, 2006.
Nandasena, N. A. K.: Chapter 29: Perspective of incipient motion formulas: boulder transport by high-energy waves, in: Geological records of tsunamis and other extreme waves, in: Geological records of tsunamis and other extreme waves, edited by: Engel, M., Pilarczyk, J., May, S. M., Brill, D., and Garrett, E., Elsevier, 641–659, https://doi.org/10.1016/B978-0-12-815686-5.00029-8, 2020.
Nandasena, N. A. K., Paris, R., and Tanaka, N.: Reassessment of hydrodynamic equations: Minimum flow velocity to initiate boulder transport by high energy events (storms, tsunamis), Mar. Geol., 281, 70–84, https://doi.org/10.1016/j.margeo.2011.02.005, 2011.
Nandasena, N. A. K., Scicchitano, G., Scardino, G., Milella, M., Piscitelli, A., and Mastronuzzi, G.: Boulder displacements along rocky coasts: A new deterministic and theoretical approach to improve incipient motion formulas, Geomorphology, 407, 108217, https://doi.org/10.1016/j.geomorph.2022.108217, 2022.
Noormets, R., Crook, K. A., and Felton, E. A.: Sedimentology of rocky shorelines: 3.: Hydrodynamics of megaclast emplacement and transport on a shore platform, Oahu, Hawaii, Sediment. Geol., 172, 41–65, https://doi.org/10.1016/j.sedgeo.2004.07.006, 2004.
Nott, J.: Waves, coastal boulder deposits and the importance of the pre-transport setting, Earth Planet. Sc. Lett., 210, 269–276, https://doi.org/10.1016/S0012-821X(03)00104-3, 2003.
Oey, L. Y. and Chou, S.: Evidence of rising and poleward shift of storm surge in western North Pacific in recent decades, J. Geophys. Res., 121, 5181–5192, https://doi.org/10.1002/2016JC011777, 2016.
Okal, E. A., Synolakis, C. E., and Kalligeris, N.: Tsunami simulations for regional sources in the South China and adjoining seas, Pure Appl. Geophys., 168, 1153–1173, https://doi.org/10.1007/s00024-010-0230-x, 2011.
Paris, R., Ramalho, R. S., Madeira, J., Ávila, S., May, S. M., Rixhon, G., Engel, M., Brückner, H., Herzog, M., Schukraft, G., Perez-Torrado, F. J., Rodriguez-Gonzalez, A., Carracedo, J. C., and Giachetti, T.: Mega-tsunami conglomerates and flank collapses of ocean island volcanoes, Mar. Geol., 395, 168–187, https://doi.org/10.1016/j.margeo.2017.10.004, 2018.
Pérez-Torrado, F. J., Paris, R., Cabrera, M. C., Schneider, J.-L., Wassmer, P., Carracedo, J.-C., Rodríguez-Santana, Á., and Santana, F.: Tsunami deposits related to flank collapse in oceanic volcanoes: The Agaete Valley evidence, Gran Canaria, Canary Islands, Mar. Geol., 227, 135–149, https://doi.org/10.1016/j.margeo.2005.11.008, 2006.
Pignatelli, C., Sansò, P., and Mastronuzzi, G.: Evaluation of tsunami flooding using geomorphologic evidence, Mar. Geol., 260, 6–18, https://doi.org/10.1016/j.margeo.2009.01.002, 2009.
Qiu, Q., Li, L., Hsu, Y.-J., Wang, Y., Chan, C.-H., and Switzer, A. D.: Revised earthquake sources along Manila trench for tsunami hazard assessment in the South China Sea, Nat. Hazards Earth Syst. Sci., 19, 1565–1583, https://doi.org/10.5194/nhess-19-1565-2019, 2019.
Ramos, N. T., Maxwell, K. V., Tsutsumi, H., Chou, Y.-C., Duan, F., Shen, C.-C., and Satake, K.: Occurrence of 1 ka-old corals on an uplifted reef terrace in west Luzon, Philippines: Implications for a prehistoric extreme wave event in the South China Sea region, Geosci. Lett., 4, 1–13, https://doi.org/10.1186/s40562-017-0078-3, 2017.
Ramsey, C. B.: The OxCal program v 4.4, The Oxford Radiocarbon Acceleration Unit, University of Oxford [code], https://c14.arch.ox.ac.uk/oxcal/OxCal.html, 2021.
Reimer, P. J., Bard, E., Bayliss, A., Beck, J. W., Blackwell, P. G., Ramsey, C. B., Buck, C. E., Cheng, H., Edwards, R. L., Friedrich, M., Grootes, P. M., Guilderson, T. P., Haflidason, H., Hajdas, I., Hatté, C., Heaton, T. J., Hoffmann, D. L., Hogg, A. G., Hughen, K. A., Kaiser, K. F., Kromer, B., Manning, S. W., Niu, M., Reimer, R. W., Richards, D. A., Scott, E. M., Southon, J. R., Staff, R. A., Turney, C. S. M., and van der Plicht, J.: IntCal13 and Marine13 Radiocarbon Age Calibration Curves 0–50,000 Years Cal BP, Radiocarbon, 55, 1869–1887, https://doi.org/10.2458/azu_js_rc.55.16947, 2013.
Sohn, C. and Sohn, Y. K.: Volcaniclastic tide-modulated tempestite in a coastal tuff ring, Jeju Island, Korea, Sci. Rep.-UK, 9, 1–7, https://doi.org/10.1038/s41598-019-39784-0, 2019.
Sugawara, D., Yu, N. T., and Yen, J. Y.: Estimating a tsunami source by sediment transport modeling: A primary attempt on a historical/1867 Normal-Faulting Tsunami in Northern Taiwan, J. Geophys. Res., 124, 1675–1700, https://doi.org/10.1029/2018JF004831, 2019.
Sun, L. G., Zhou, X., Huang, W., Liu, X. D., Yan, H., Xie, Z. Q., Wu, Z. J., Zhao, S. P., Shao, D., and Yang, W. Q.: Preliminary evidence for a 1000-year-old tsunami in the South China Sea, Sci. Rep.-UK, 3, 1–5, https://doi.org/10.1038/srep01655, 2013.
Terry, J. P., Winspear, N., Goff, J., and Tan, P. H. H.: Past and potential tsunami sources in the South China Sea: A brief synthesis, Earth Sci. Rev., 167, 47–61, https://doi.org/10.1016/j.earscirev.2017.02.007, 2017.
Watanabe, M., Bricker, J. D., Goto, K., and Imamura, F.: Factors responsible for the limited inland extent of sand deposits on Leyte Island during 2013 Typhoon Haiyan, J. Geophys. Res., 122, 2795–2812, https://doi.org/10.1002/2016JC012023, 2017.
Wu, T. R.: Impact intensity analysis on the 1604 Quanzhou earthquake tsunami and the impacts to the western coast of Taiwan, National Central University, Taipei City, MOTC-CWB-104-E-19, 45 pp., https://www.grb.gov.tw/search/planDetail?id=11346444 (last access: 25 June 2022), 2015.
Wu, T. R. and Huang, H. C.: Modeling tsunami hazards from Manila Trench to Taiwan, J. Asian Earth Sci., 36, 21–28, https://doi.org/10.1016/j.jseaes.2008.12.006, 2009.
Yang, W. Q., Sun, L., Yang, Z., Gao, S., Gao, Y., Shao, D., Mei, Y., Zang, J., Wang, Y., and Xie, Z.: Nan'ao, an archaeological site of Song dynasty destroyed by tsunami, Chinese Sci. Bull., 64, 107–120, https://doi.org/10.1360/N972018-00740, 2019.
Yen, I. C. and Lee, C. Y.: Geologic map and explanatory text of Taiwan scale 1:50 000, 73–76, Penghu Islands, Central Geological Survey, MOEA, R.O.C., 104 pp., https://twgeoref.moeacgs.gov.tw/GipOpenWeb/wSite/ct?xItem=200633&mp=106&ctNode=333 (last access: 15 June 2022), 2017 (in Chinese).
Yu, N. T., Yen, J. Y., Chen, W. S., Yen, I. C., and Liu, J. H.: Geological records of western Pacific tsunamis in northern Taiwan: AD 1867 and earlier event deposits, Mar. Geol., 372, 1–16, https://doi.org/10.1016/j.margeo.2015.11.010, 2016.
Yu, N.-T., Yen, J.-Y., Yen, I. C., and Chu, M.-F.: An extended, 2.4-ka long record of western Pacific tsunamis and pumice rafts in northern Taiwan: Tsunami recurrence, pumice sources, and drifting routes, Quaternary Sci. Rev., 281, 107423, https://doi.org/10.1016/j.quascirev.2022.107423, 2022.
Yu, S.-B., Chen, H.-Y., and Kuo, L.-C.: Velocity field of GPS stations in the Taiwan area, Tectonophysics, 274, 41–59, https://doi.org/10.1016/S0040-1951(96)00297-1, 1997.