the Creative Commons Attribution 4.0 License.
the Creative Commons Attribution 4.0 License.
 | 02 Nov 2023
Rockfall monitoring with a Doppler radar on an active rockslide complex in Brienz/Brinzauls (Switzerland)
Marius Schneider
Nicolas Oestreicher
Thomas Ehrat
Simon Loew
We present and analyze a rockfall catalog from an active landslide complex in Brienz/Brinzauls of the Swiss Alps, collected with a new Doppler radar system. This radar system provides a complete and continuous time series of rockfall events with volumes of 1 m3 and greater since 2018 and serves as automatic traffic control for an important main road. In the period between January 2018 and October 2022, 6743 events were detected, which is 2 orders of magnitude higher activity than in stable continental cliffs. A few percent of all rockfall events reached the shadow area, which hosts an important road and agricultural area. The Doppler radar data set allows us to investigate the triggering factors quantitatively. We found that the background rockfall activity is controlled by seasonal climatic triggers. In winter, more rockfalls are observed during thawing periods, whereas in summer the rockfall activity increases with hourly rainfall intensity. We also found that, due to the geological setting in an active landslide complex, increased rockfall activity occurs clustered in space and time, triggered by local displacement hotspots. Thus, monitoring spatial and temporal variations of slope displacement velocity is crucial for detailed rockfall hazard assessment in similar geological settings.
- Article
(13047 KB) - Full-text XML
- BibTeX
- EndNote


Rockfall is a common hazard in alpine environments, endangering people on roads and on railways due to its high speed and energy (Hungr et al., 2014; Wyllie, 2015; Loew et al., 2022). Rockfalls are distinguished from rock mass falls and rock avalanches by their physical transport mechanisms (Loew et al., 2022). A common term used for this differentiation is “fragmental” rockfall, where individual blocks mainly interact by impacts with the substrate along the downslope motion, which can be described by rigid-body ballistics (e.g., Evans and Hungr, 1993). The spatial characteristics of rockfall source, transport and deposition areas have been described in detail by Evans and Hungr (1993). Of special importance for rockfall hazard analysis and risk mitigation are blocks that have rolled or bounced beyond the base (apex) of talus slopes. In this distal part of the deposition area, termed shadow, typically only a few boulders are sparsely distributed on the initial substrate (Fig. 1d).
Many past studies investigated rockfall driving and triggering factors (Peckover and Kerr, 1977; Matsuoka and Sakai, 1999; Chau et al., 2003; Frayssines and Hantz, 2006; Krautblatter and Moser, 2009; D'Amato et al., 2016; Macciotta et al., 2015, 2017). A review of rockfall causal factors has recently been presented by Loew et al. (2022). Long-term rockfall preparatory causal factors include daily and seasonal thermal cycles driving thermo-elastic strain and subcritical crack propagation (Gunzburger et al., 2005; Collins and Stock, 2016), brittle rock creep (Cruden, 1970; Brantut et al., 2013), and rock slope deformation in active rockslides (Gschwind and Loew, 2018). Regarding short-term triggers, rockfall activity was found to be related to freeze–thaw cycles in marly limestone cliffs near Grenoble (Frayssines and Hantz, 2006) and in sandstone and shale at Ainodake, Japan (Matsuoka and Sakai, 1999). Matsuoka and Sakai (1999) report a peak of the rockfall activity during the thawing period. A non-linear response of rockfall to rainfall, with a lower increase of rockfall activity during stronger rainfall, was often observed (Chau et al., 2003; Krautblatter and Moser, 2009). Both ice warming and thawing are considered to be important triggering mechanisms (D'Amato et al., 2016; Frayssines and Hantz, 2006), sometimes depending on the season, with a high importance of freeze–thaw in early spring (Peckover and Kerr, 1977; Macciotta et al., 2015, 2017). Hence, the major causal factors depend on the study site's location, elevation, exposure and climatic conditions (Macciotta et al., 2017). To understand such triggering mechanisms, a precise evaluation of the time and location of a rockfall event is needed.
A complete rockfall catalog should include a precise starting point with a precise start time, independent of the event time, location and volume. In reality, only a few almost complete rockfall inventories are available. The latter are often based on observations along roads and railways (Peckover and Kerr, 1977; Hungr et al., 1999; Macciotta et al., 2015; AWN, 2022). In the case of the Canadian Cordillera, railway personnel recorded each rockfall terminating on or close to the railway in a catalog. Similar methods are used by road authorities in the Swiss Alps. Since it is known that the rockfall reach angle highly depends on its mass (e.g., Copons et al., 2009), such catalogs include a bias towards large rockfall events, and only a rough estimation of the event timing is possible. Other methods to collect rockfall data include tree-ring injury analysis (Stoffel and Bollschweiler, 2008), rockfall volume estimations with traps (Krautblatter and Moser, 2009; Sass, 2005), time-lapse cameras (D'Amato et al., 2016; Frayssines and Hantz, 2006) or simple audience reports (AWN, 2017). All of these methods lack either temporal or spatial completeness and precision. More advanced techniques to detect rockfalls are repeated laser scans of rock walls (Rabatel et al., 2008), which can narrow down the volume and timing of events. However, the release of several small events from the same area between two acquisitions cannot be distinguished, among other biases (Dussauge-Peisser et al., 2002).
In this study we apply a new method of rockfall monitoring which was developed by Geopraevent AG, using a Doppler radar for very fast movement detection and immediate and automatic trigger of response, providing detailed temporal information for each rockfall event in all weather conditions and darkness (Geopraevent, 2022). This contribution aims to analyze rockfall frequency in time and space on the active rockslide complex of Brienz/Brinzauls to understand drivers and event triggers in such environments. We use the Doppler radar technology to monitor rockfall time series with unprecedented completeness, combined with robotic total station and ground-based interferometric radar measurements of the moving landslide. We elaborate on the benefits of the advanced Doppler radar monitoring system and show its potential and limitations for generating a complete rockfall catalog and immediate alarm. This is especially important for elements at risk located in the rockfall shadow area. Therefore, this study also provides new insights into statistical properties of rockfall blocks reaching this area.
The study site of this project is located above the village of Brienz/Brinzauls (1150 m a.s.l.), in the canton Grisons of Switzerland. Here, an old deep-seated mountain slope deformation hosts a very active landslide complex with a volume of 170×106 m3 and annual displacements of 1 to 10 m in southern directions (BTG, 2022a). The active landslide complex extends from an altitude of 1800 m a.s.l. down to the Albula River at about 800 m a.s.l. Tectonically, the Brienz mountain slope deformation is located in the transition area between the Penninic and Austroalpine sedimentary nappes (Brauchli, 1921). The landslide consists of the Flysch and Allgäu formation (Fm.), composed of schists with alternating limestone, sandstone and marl layers, overlaid by the Raibler Fm. (Rauwacke, dolomite) and Vallatscha Fm. (Arlberg dolomite), as shown in Fig. 1 (BTG, 2022a). The Vallatscha Fm. hosts most of the rockfall source areas and dips steeply in the downslope direction. Other source areas are located further downslope in the Raibler and Allgäu Fm. of the Caltgeras ridge, which dip subhorizontally or slightly into the slope. The groundwater table in the rockfall source is more than 100 m deep due to the high permeability of the fractured and karstified dolomites and the topographic setting. Different kinematics are observed within the active rockslide, and the landslide complex is divided into different compartments (Loew, 2022). This results in differential displacements within the rockslide complex, making monitoring indispensable.
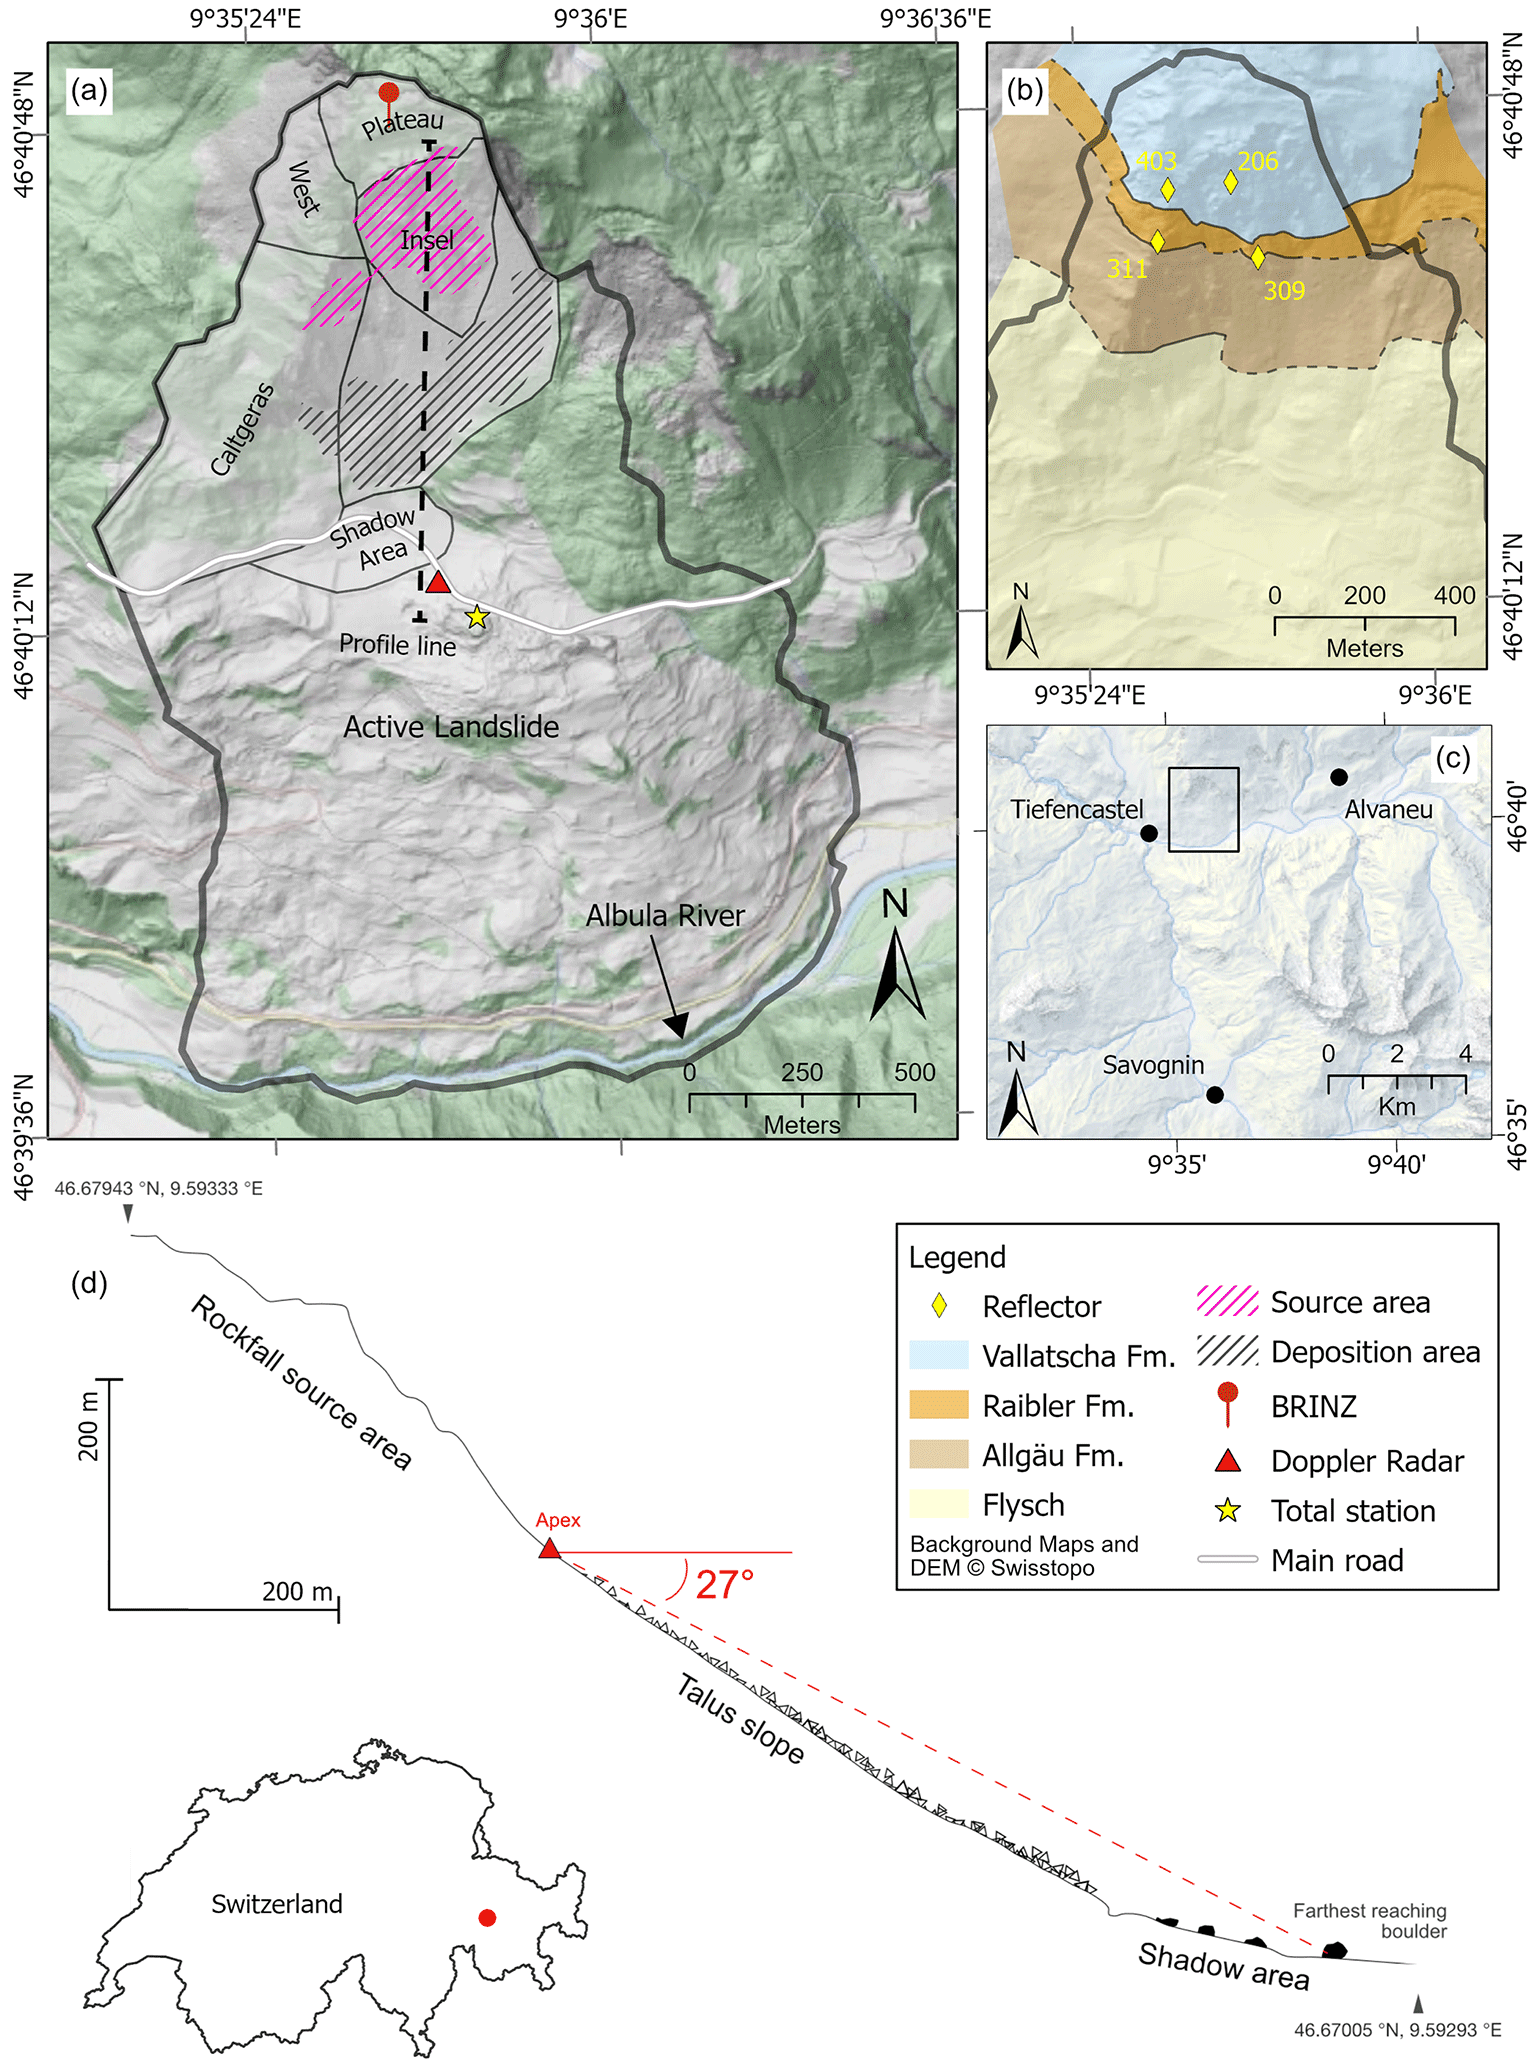
Figure 1Overview of the study area: (a) distribution of the landslide with various compartments and the positioning of the local weather station (BRINZ), Doppler radar, total station and profile trace of inset (d). (b) Geological map following BTG (2022b) depicting the local geology in the rockfall slope from bottom to top: Flysch, Allgäu Fm., Raibler Fm. and Vallatscha Fm. (c) Regional map showing the locations of weather stations. (d) Profile (trajectory seen as T shapes in a) through the rockfall area, featuring the source area, deposition zone and shadow area.
The active slope instability was under scrutiny for decades, when moderate accelerations took place in 2000–2001 (Sartorius et al., 2022; BTG, 2022a). In 2009, systematic GPS measurements started. Since 2011, a robotic total station monitoring system has monitored about 30 reflectors. In 2012, a dam was built above the main road to retain blocks reaching the shadow area. In 2019, a ground-based interferometric synthetic aperture radar (GBInSAR) was installed, together with a Doppler radar rockfall monitoring system for automatic closure of a main road during rockfall events (Fig. 1). Rockslide acceleration mostly takes place during winter and spring, when snowmelt occurs (Fig. 3). During the summer and fall months, landslide velocity fluctuates but mostly shows no trend towards acceleration (Fig. 3).
Several larger rockfall events were observed in recent years. Blocks of up to 60 m3 reached the main road in 2015 and 2019, while smaller blocks regularly come to a stop in the adjoining agricultural grassland. We define this grassland and the immediate surroundings as the rockfall shadow area (Fig. 1d). Hence, blocks that reach beyond the protection dam (Fig. 2f) are defined as an event reaching the shadow area. Rockfall events reaching into this area are of special interest due to the increased damage potential (traffic on the main road). Rock mass falls with volumes of up to 100 000 m3 took place in 2001 and 2015, where blocks were able to pass the retaining dam on the side and reach far into the shadow area (Krähenbühl and Nänni, 2017).
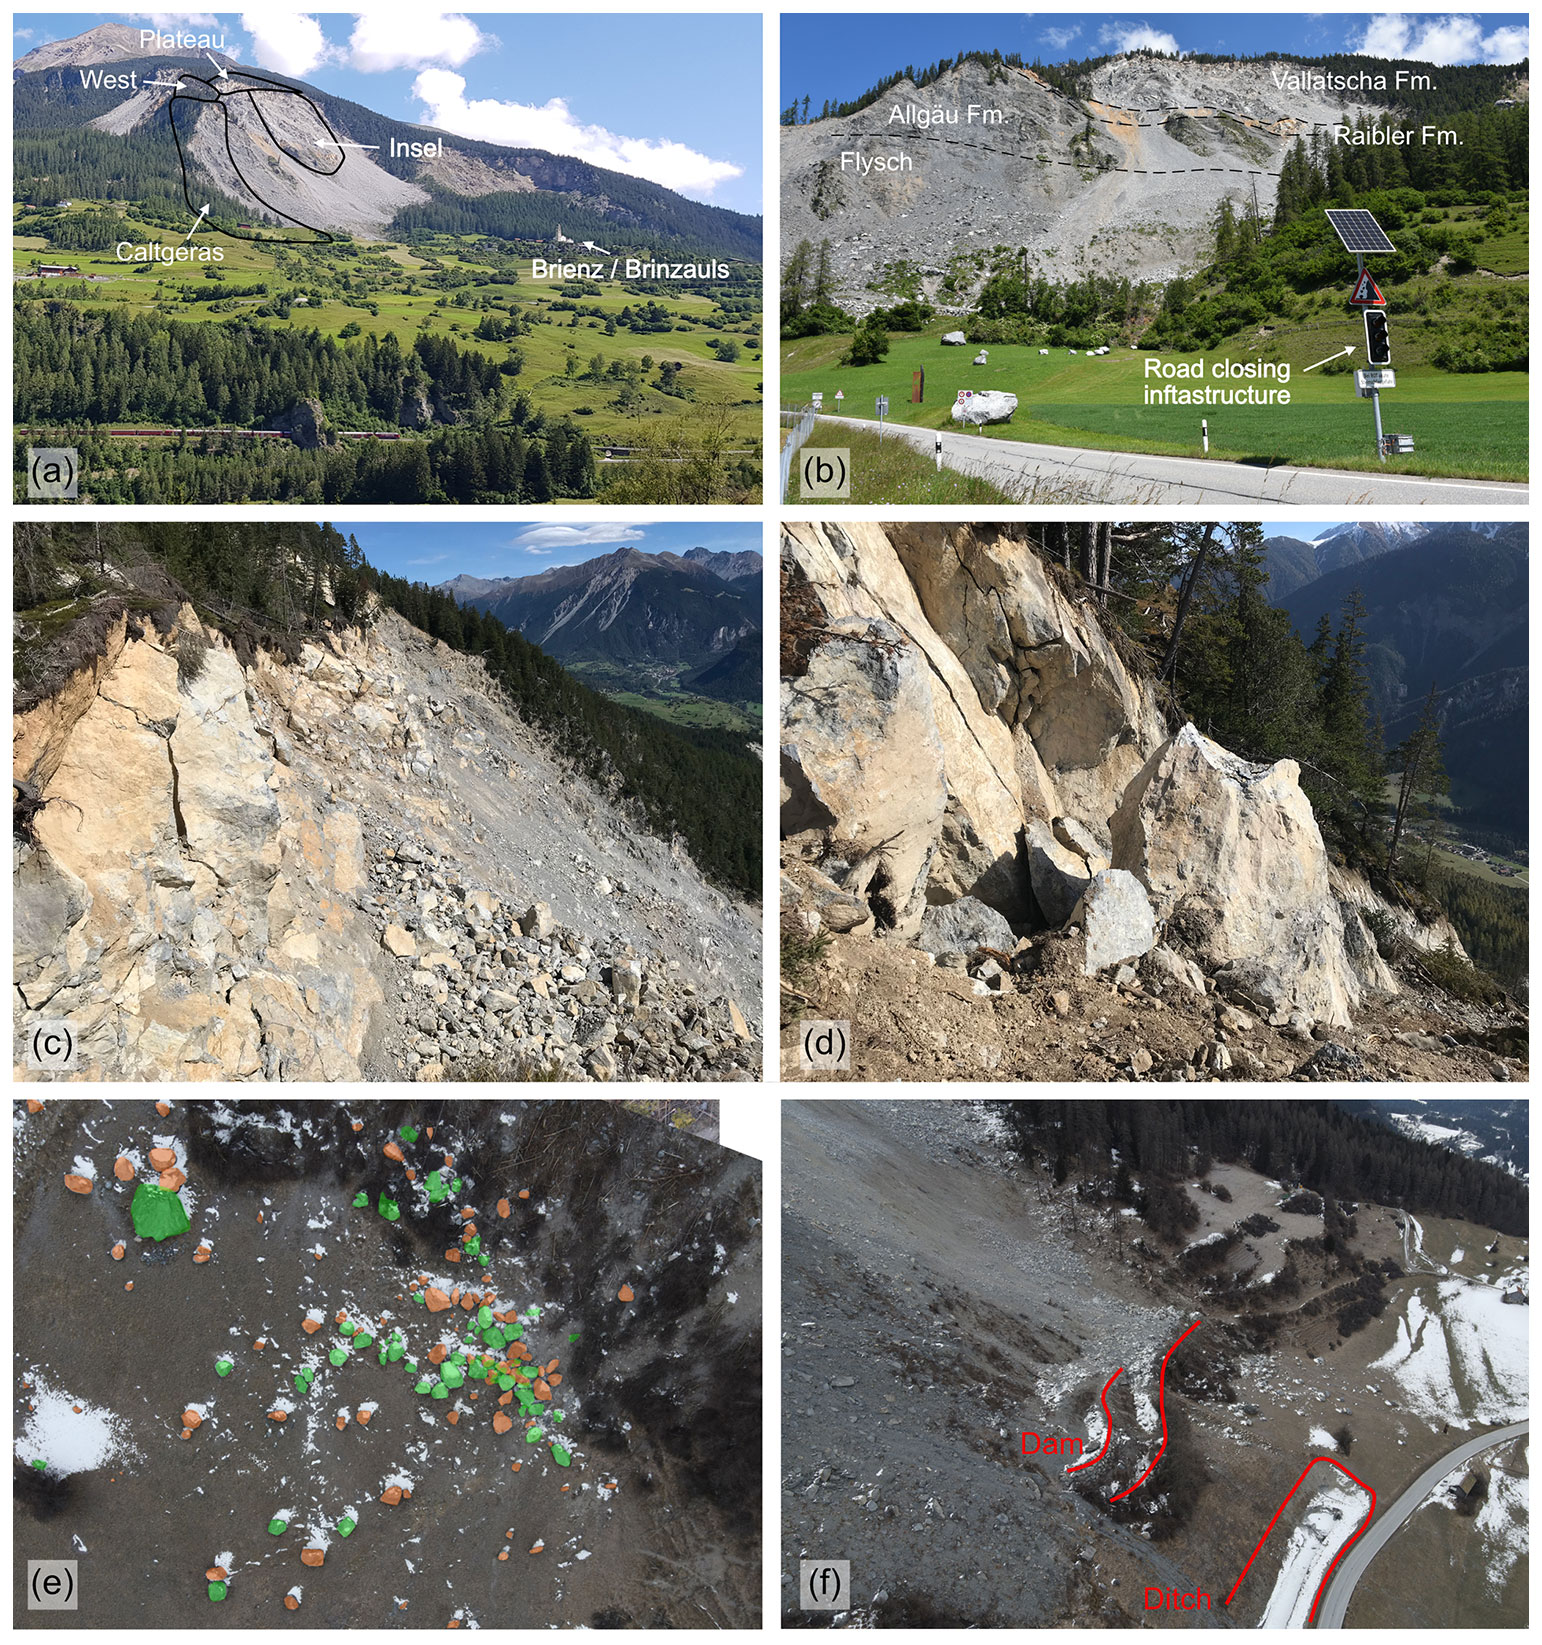
Figure 2Photos from the study site. (a) View from Ruteira (above Tiefencastel; see Fig. 1c) on the complete mountain slope deformation with marked compartments of Brienz/Brinzauls, looking NNE. (b) View of the rockfall release, transport and deposition areas from the Doppler radar location and main road, looking north with indicated geological contacts. The shadow area with the meadow and main road is in the foreground; the trees on the rockfall dam are located between the shadow area and talus cones. (c, d) Upper sector of the release area showing fractured Arlberg dolomite, looking east from the NW corner of the Insel compartment. (e) Deposited blocks in the shadow area. Green blocks were deposited before 21 April 2022. Orange-colored blocks were deposited in the period between 21 April and 30 January 2023. (f) Side view of the partially filled rockfall dam and the adjacent shadow area.
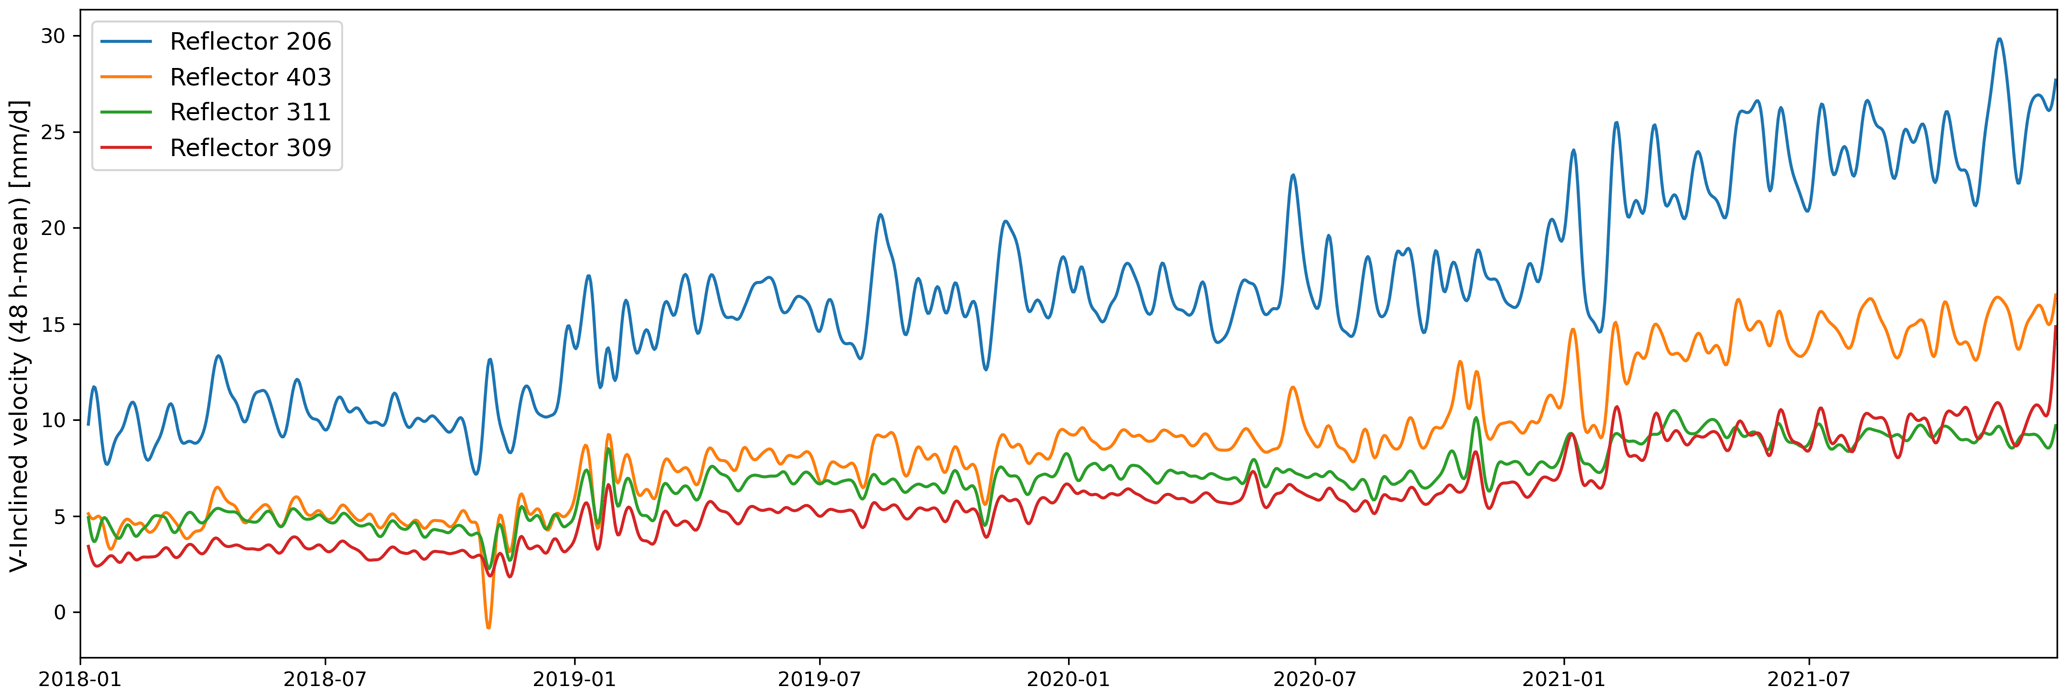
Figure 3TPS-derived (theodolite-based positioning system) landslide velocity (low-pass-filtered with a cutoff of per day) in different compartments along line of site recorded from a total station located in Brienz village. TPS reflector positions are indicated in Fig. 1b. The velocities show a long-term trend to higher velocity, superimposed by seasonal accelerations in winter time.
3.1 Meteorological data
For this study, meteorological data sets from the MeteoSwiss stations Tiefencastel, Alvaneu and Savognin and a local station above the rockfall release area from the Swiss Seismological Service are used (Fig. 1a, c). Tiefencastel and Alvaneu are manual measuring stations for precipitation and snow height, respectively (Table 1). These measurements are conducted every day at 07:30 LT. In Savognin, hourly precipitation and air temperature are measured automatically.
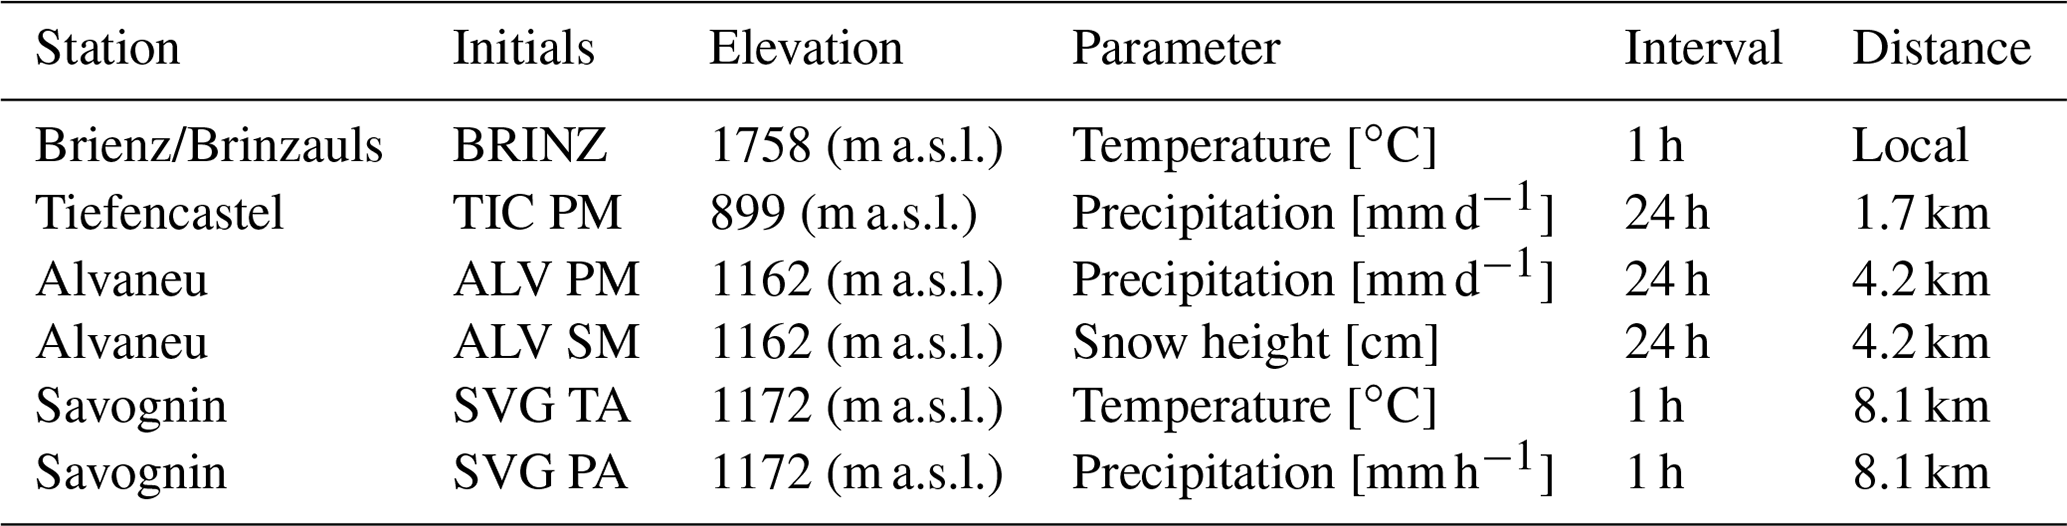
The local weather station, situated on the compartment plateau (Fig. 1a), measures the temperature 2 m above a forest-like surface. The temperature sensor is protected by a non-ventilated radiation shield and is exposed to the south, thus facing direct sunlight. According to the manufacturer's specifications, temperature measurements are conducted with an accuracy of 0.5 ∘C (Holfuy, 2023). However, we observe that during summer the temperature in Savognin is about 1 ∘C higher but in winter about 2 ∘C lower compared to the local weather station (BRINZ). The proximity to the process area makes it suitable to use the temperature data from the local station for further analysis. A high overall correlation (0.98) has been observed between the temperature of Savognin and the local station (BRINZ). The slight differences might be due to topographic temperature effects, as the station of Savognin measures lower mean temperatures in winter (2 ∘C) but higher temperatures in summer (1 ∘C).
To assess the influence of temperature on rockfall activity, we used two different metrics to investigate potential causal factors. First, we sum the hours with positive temperatures for each day with the temperature data set from Brienz/Brinzauls (positive degree hours). Secondly, we use freeze–thaw (FT) cycles, which we divide into three phases: negative cooling, when the temperature is below 0 ∘C and the temperature decreases (Eq. 1); negative warming, when the temperature is increasing but still below (Eq. 2) 0 ∘C; and thawing, when the temperature is above 0 ∘C (Eq. 3).
Assuming constant water seepage into the rock mass during winter, ice production can be characterized by the freezing potential (FP) (Matsuoka, 1994; D'Amato et al., 2016). The FP for one single FT cycle is defined by the following:
where t0 is the start of the freeze, Tf is the freezing temperature of water and T(t) is temperature at time t. The modeled FP allows us to identify all three phases during an FT cycle. The frost phase begins as soon as the temperature is below the freezing point of water and ends as soon as melting occurs. This is the case when temperature is above 0 ∘C again. However, during freezing, both negative cooling and warming can take place. Melting happens when the temperature is above the freezing point of water. It will continue until the FP reaches zero and no more ice is available (D'Amato et al., 2016). We calculate the FP with the daily mean temperature data set from the Brienz/Brinzauls station from October 2018 until November 2022.
The input of water at the soil surface from snowmelt and rain (surface water input, SWI) in the area of rockfall release was physically modeled based on the lidar-measured snow height by SLF (2022) and used in this study. The received SWI is very valuable and highlights the importance of the snowmelt for water available for infiltration into the groundwater in the study area. We consider the SWI a good indicator of the state of soil wetness in the shallow subsurface in our study area. However, we note that the groundwater recharge can strongly differ from the SWI, mainly due to evapotranspiration and surface runoff. The mean precipitation intensity per day was calculated using the Savognin station. We counted the number of hours with precipitation to be greater than zero. The total amount of precipitation per day was then divided by the number of hours of precipitation, resulting in the daily mean precipitation intensity.
3.2 Doppler radar
Radar is a general abbreviation for radio detection and ranging and is exploited in the microwave range of the electromagnetic spectrum (e.g., Cavell, 2017). By emitting radar waves with a known frequency from a stationary location on a moving object, the reflected radar waves show a different frequency. This phenomenon is known as the Doppler effect (Doppler, 1903), while the corresponding change in the frequency is known as the Doppler shift frequency. This allows one to detect and track fast movements in the field of view, which is used in regular-day life.
The implementation of a Doppler radar for monitoring rockfalls was used for the first time in Brienz/Brinzauls. Originally, this technology was used to monitor snow avalanche slopes in the Valais Alps. Since January 2018, the Doppler radar system has been fixed to the wall of the old school building in Brienz/Brinzauls, monitoring the active rockfall slope continuously. The Doppler radar operates at a frequency of 10 GHz, where damping due to snow and rain is relatively low (Gassner et al., 2022). The device has a 90∘ horizontal field of view and from 302 to 32∘ azimuth. The highest radar sensitivity is set at 20∘ vertical elevation. The monitored area covers about 0.5 km2, with a maximum distance of approximately 1 km. Measurements are done with a spatial resolution of added 20 m in a 347∘ N inclined coordinate system. The coordinate system origin is set to the Doppler radar position. The minimum detectable volume for moving objects depends on their distance from the radar system. Within a 100 m line of sight, the radar can detect moving masses larger than 0.1 m3. If the distance between the moving object and radar station is increased to 1 km, a moving volume of at least 1 m3 is required to be detected (Geopraevent, 2022). Further, the Doppler radar in Brienz/Brinzauls is only able to detect movements with a velocity in the range of meters per second (Meier et al., 2017). Slower movements are not detected. The system is combined with a triggered optical camera, providing 15–20 high-quality images of each rockfall event at 3 s intervals. These images indicate that many large rockfall events are rock mass failures, creating dozens of fragmental rockfall blocks in the transit area.
As the Doppler radar continuously scans the rockfall slope, permanent calculations of the signal-to-noise ratio are going on. Therefore, the mean activity of the last 30 min is calculated. Then, the signal is set in ratio with the noise. If this exceeds the threshold, a potential rockfall event is identified. Advanced algorithms further validate the detected potential rockfall and check if the pattern is related to other sources (e.g., wildlife, UAV and others). This validation is processed within seconds. The Doppler radar exhibits a low false positive rate of approximately 1 % (Gassner et al., 2022). At this point it has to be stressed that the methods employed by Geopraevent AG are not intended for public disclosure and are subject to confidentiality agreements. Therefore, sensitive descriptions and insights into the algorithm structure cannot be provided here.
3.3 Rockfall data processing
The Doppler radar of Brienz/Brinzauls creates a unique data set for rockfall information in time and space. For each event, an exact timestamp of the start and end time is registered. With these timestamps, an average frontal speed is estimated. The radar data also contain spatial information about the rockfall event. For this purpose, the activity of each point within the coordinate system is analyzed.
The activity map data (Fig. 4), provided by Geopraevent AG, are used to analyze the source, transit and deposition areas for all detected rockfall events. The activity map provides the averaged signal-to-noise ratio of the radar amplitudes for every grid cell for the time period of the entire rockfall motion. The time-lapse camera images indicate that for multi-block or rock mass fall events the activity map mainly describes the tracks of the larger blocks with the main intensity density. Therefore, the activity area is wider at the start and narrower with travel distance (Fig. 4a). Due to topographic effects, events released from the east region of the rockfall slope show a wide activity pattern regardless of the actual extent (Fig. 4b). Several other events show an indistinct scatter on the activity map (Fig. 4c). Incoming weather fronts (thunderstorms, hail, snowfall) during a rockfall event led to low signal-to-noise ratio activity maps. Therefore, these events are not classified as false positives but as true positive wrong extent (TPWE) events. Since the spatial information of TPWE events is inaccurate, they need to be removed from the data set for the spatial analysis but are kept for the temporal analysis.
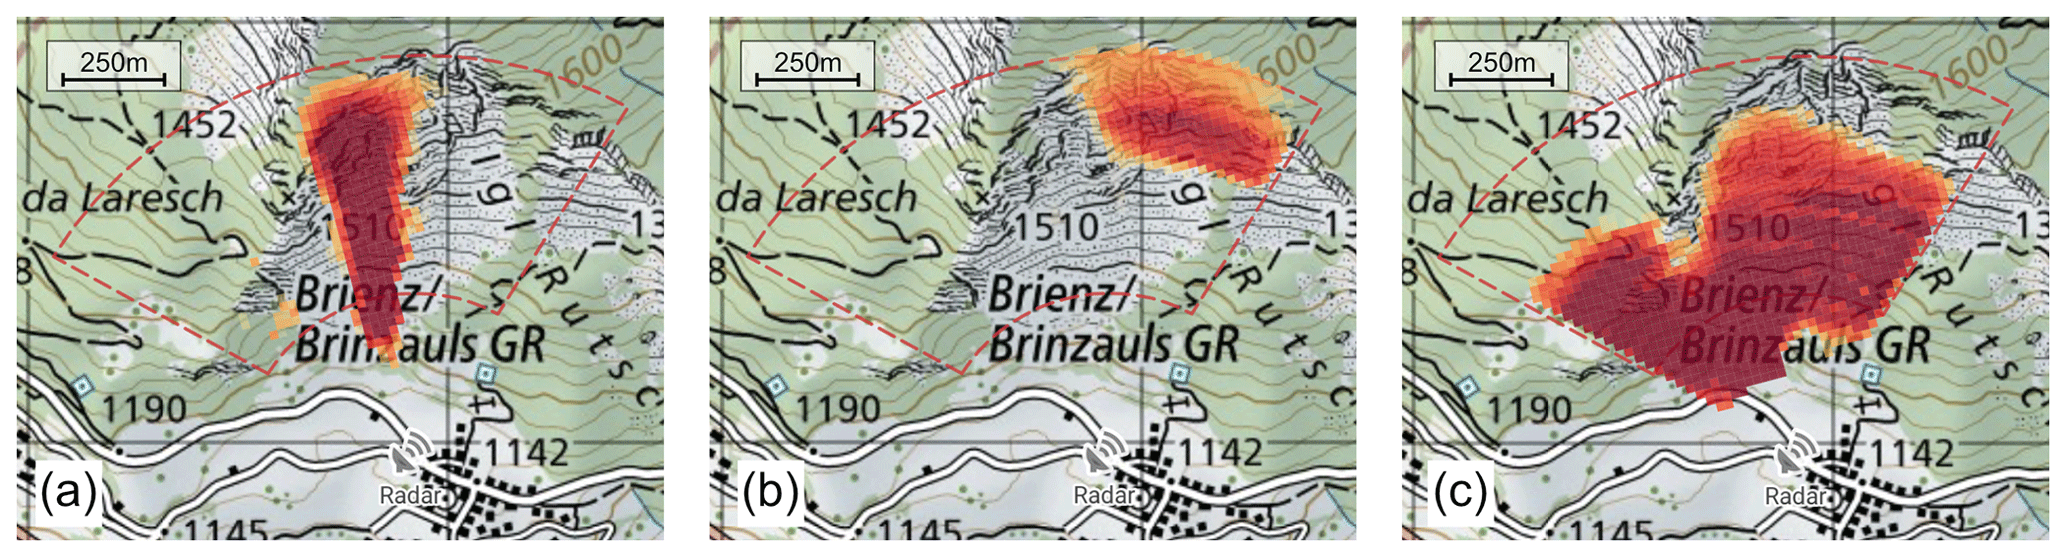
Figure 4Screenshots of rockfall activity maps provided in the Geopraevent AG data portal, background maps from © swisstopo. (a) Normal event pattern with a wider spread in the head region, getting narrow in the deposition area. (b) East event pattern. (c) True positive wrong extent (TPWE) event with an indistinct pattern, caused by an incoming weather front.
TPWE events are identified and removed from the spatial analysis data set with a supervised machine learning (ML) method (Abadi et al., 2015; Renotte, 2022). A total of 1000 rockfall activity maps were randomly picked and classified manually for training and validation purposes. The manual catalog contains 29 TPWE and 971 normal events. This data set is further split into a training set (70 %), validation set (20 %) and test set (10 %) (Fig. 5). The ML is trained by choosing random batches of rockfall activity maps from the training set. One training epoch contains 22 batches with 32 images. We trained the model for 120 epochs, with a test and validation loss of and , respectively. With this method, 185 TPWE events (3.1 %) are detected and removed from the spatial event catalog (185 events for the spatial analysis).
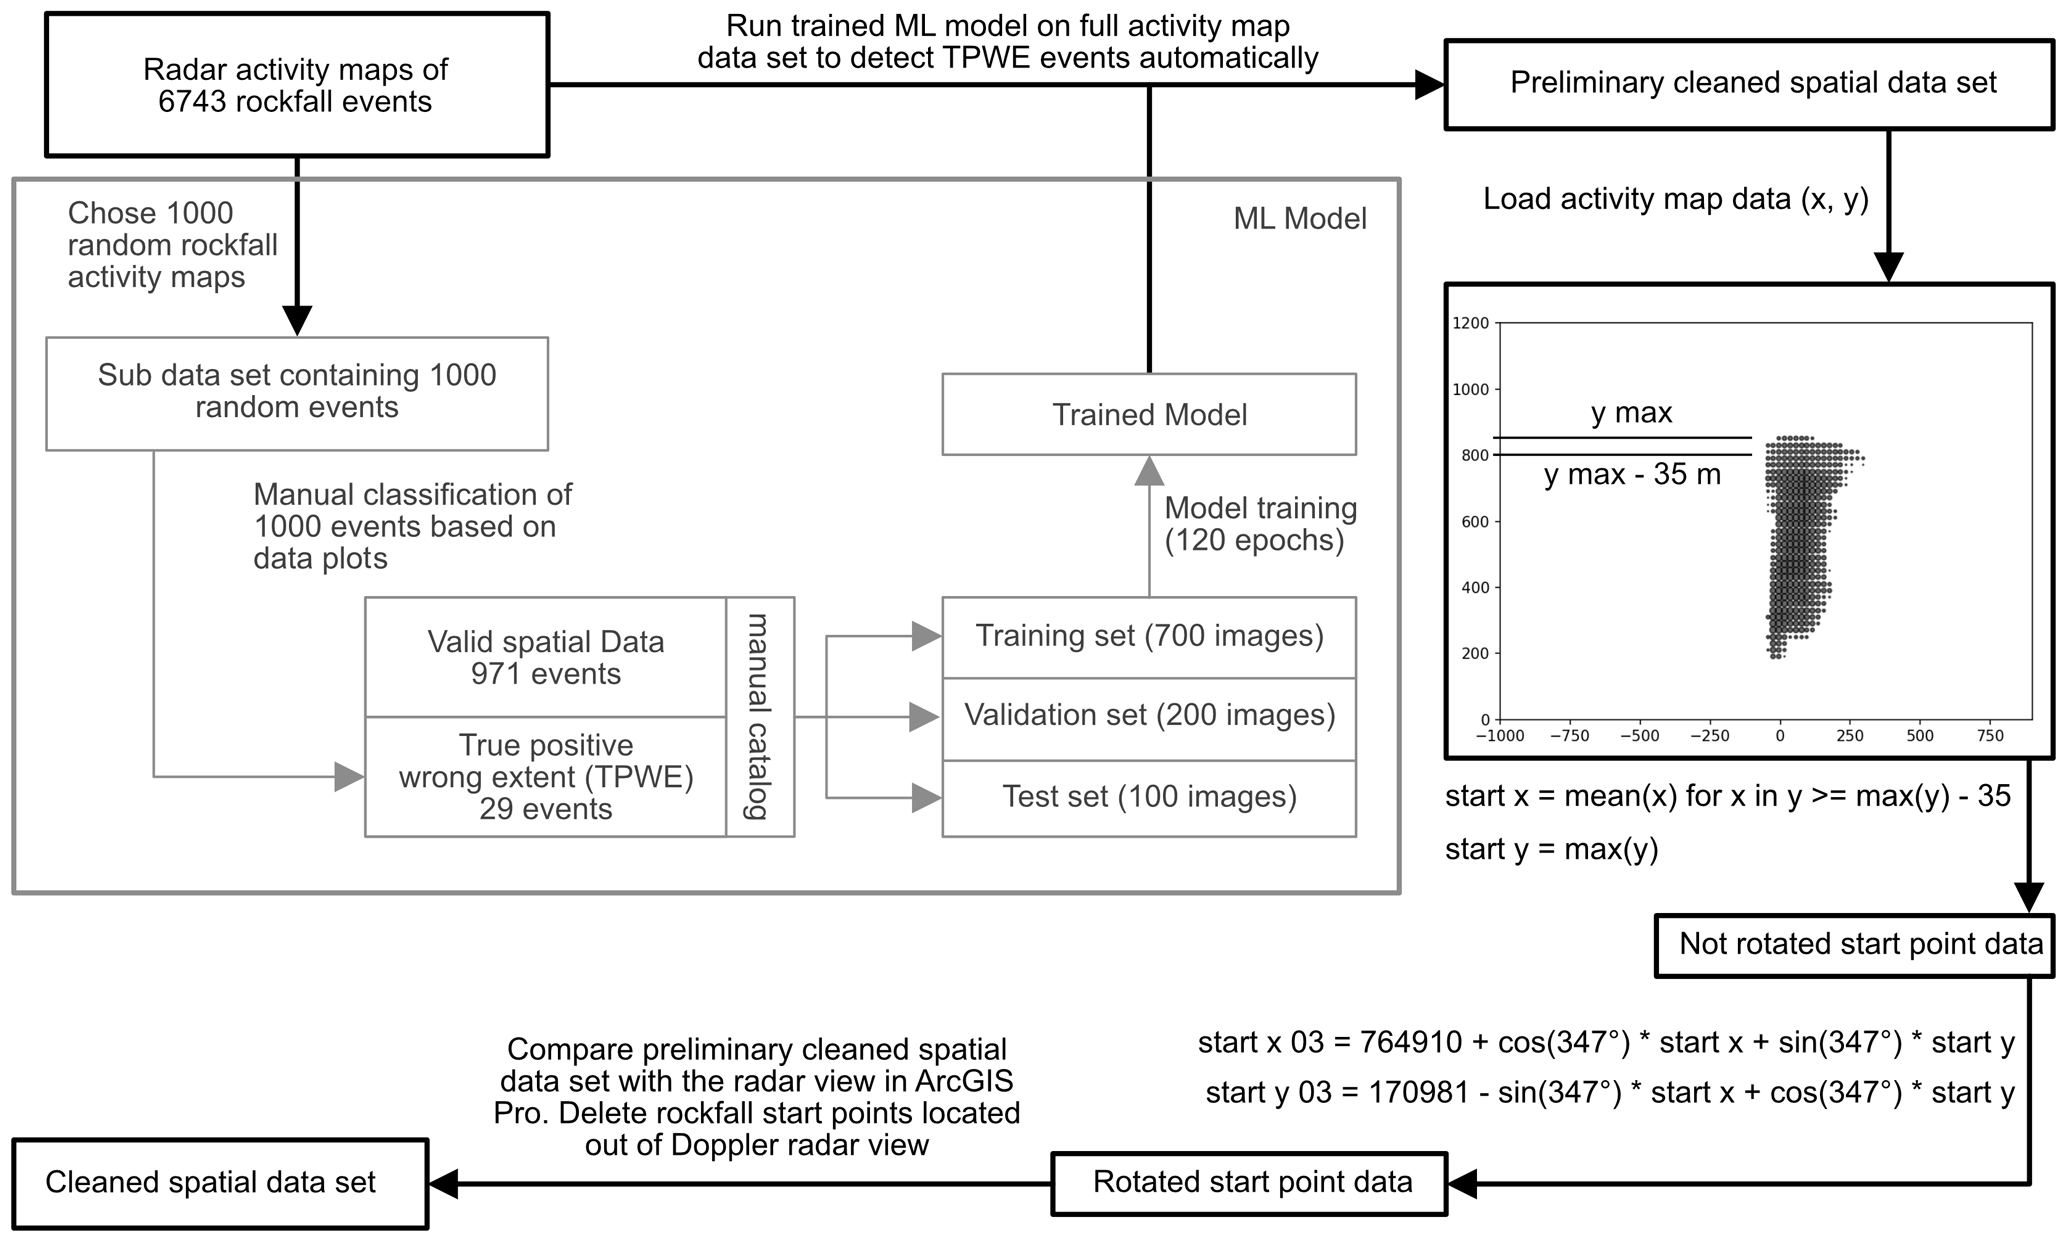
Figure 5Flowchart displaying the full spatial data set cleaning routine, containing the machine learning model (ML), start-point calculation, reference frame rotation and manual cleaning.
The following assumptions are made to calculate the starting point. First, rockfall is a gravitational process and can only happen from top to bottom (i.e., decreasing north). Second, the event always starts at the highest point of the activity map (farthest distance from the radar). Thus, y is the maximum north value of the event activity map. However, we must consider the lateral variability in the east–west direction (Fig. 4a). For this purpose, we calculate the mean of the corresponding x values for maximum north up to the maximum north minus 35 m (Fig. 5). The two data points ultimately yield the non-rotated rockfall start points. In order to integrate these points into a geographic reference system, it is necessary to apply a rotation transformation (Fig. 5). Although an elaborate procedure to remove TPWE events from the data set was developed, some remained unnoticed. The start-point analysis enabled us to identify such undetected TPWE events with an unrealistic extent (start point outside the radar field of view), which are manually removed from the spatial data set using ArcGIS Pro (Fig. 5).
3.4 Aerial image analysis
To investigate the time history and rockfall deposition frequency in the shadow area, we have analyzed a series of high-resolution (10 cm ground resolution and higher) aerial images. The study employed SWISSIMAGE orthophotos obtained from swisstopo for the years 2003, 2006, 2009, 2012, 2015, 2019 and 2020. Furthermore, two drone flights were conducted using a commercial DJI Mavic Air 2 drone in April 2022 and January 2023. Subsequently, each image was carefully compared with the preceding one, and the blocks that were newly deposited were identified and manually marked using ArcGIS.
The accuracy of the method utilized for detecting and describing the number of blocks deposited in the shadow area is constrained by several factors. The prolonged interval between successive orthophotos obtained from swisstopo contributes to increased uncertainty. This is attributed to the removal of boulders by farmers from the grassland during the period of low rockfall activity before the year 2020. The blocks that were mapped using drone imagery are most likely subject to random errors, which cannot be further quantified. The image resolution would allow the detection of small blocks with diameters of a few decimeters, which also introduces a truncation bias. Additionally, based on the deposition, it is not possible to determine whether multiple blocks were deposited as part of a single event or if they were transported in separate events.
Despite these limitations and potential errors, it is crucial to document the progression of the number of blocks deposited in the shadow area and any variations that may arise. However, it is anticipated that the quantitative analysis, especially for the period preceding 2020, may be underestimated and therefore must be interpreted cautiously.
4.1 Long-term rockfall variability in time and space
From 8 January 2018 to 5 October 2022, 6743 single events were detected from the Doppler radar. In general, rockfall events in Brienz/Brinzauls show a large variety in fragmentation, velocity and event volume. This is related to the geological complexity of the source area, composed of different lithologies, weathering grades, degree of fracturing and strengths. Rockfalls released from the main rockfall scarp, where predominantly massive dolomite is present, are mostly multi-block failures from bedrock and show the lowest grade of fragmentation. Accordingly, single-block volumes of up to 60 m3 may reach the shadow area by rolling, bouncing and sliding. During the observation period, all large events which reached the shadow area were released from the main scarp. Rockfalls from the Caltgeras ridge, where lower-strength graywacke with dolomite or even Allgäu schists are present, show a high grade of fragmentation. Rockfall events from this source area mainly propagate by sliding and falling. If dolomite blocks are present, jumping and rolling may also occur but are limited to single blocks and therefore reach further than the fragmented Allgäu schists. In either case, the event volume (describing the total volume of failed material) is in the range between 1 and 100 m3 but with a much higher frequency of small event volumes (1 m3). The Doppler radar only rarely recorded events released from colluvial deposits. However, after the failure of a larger rock mass (i.e., February 2020), some later rockfall events were released from the colluvial slope, mobilizing only very limited volumes. This is reflected in a small second peak in the N–S-histogram of Fig. 7.
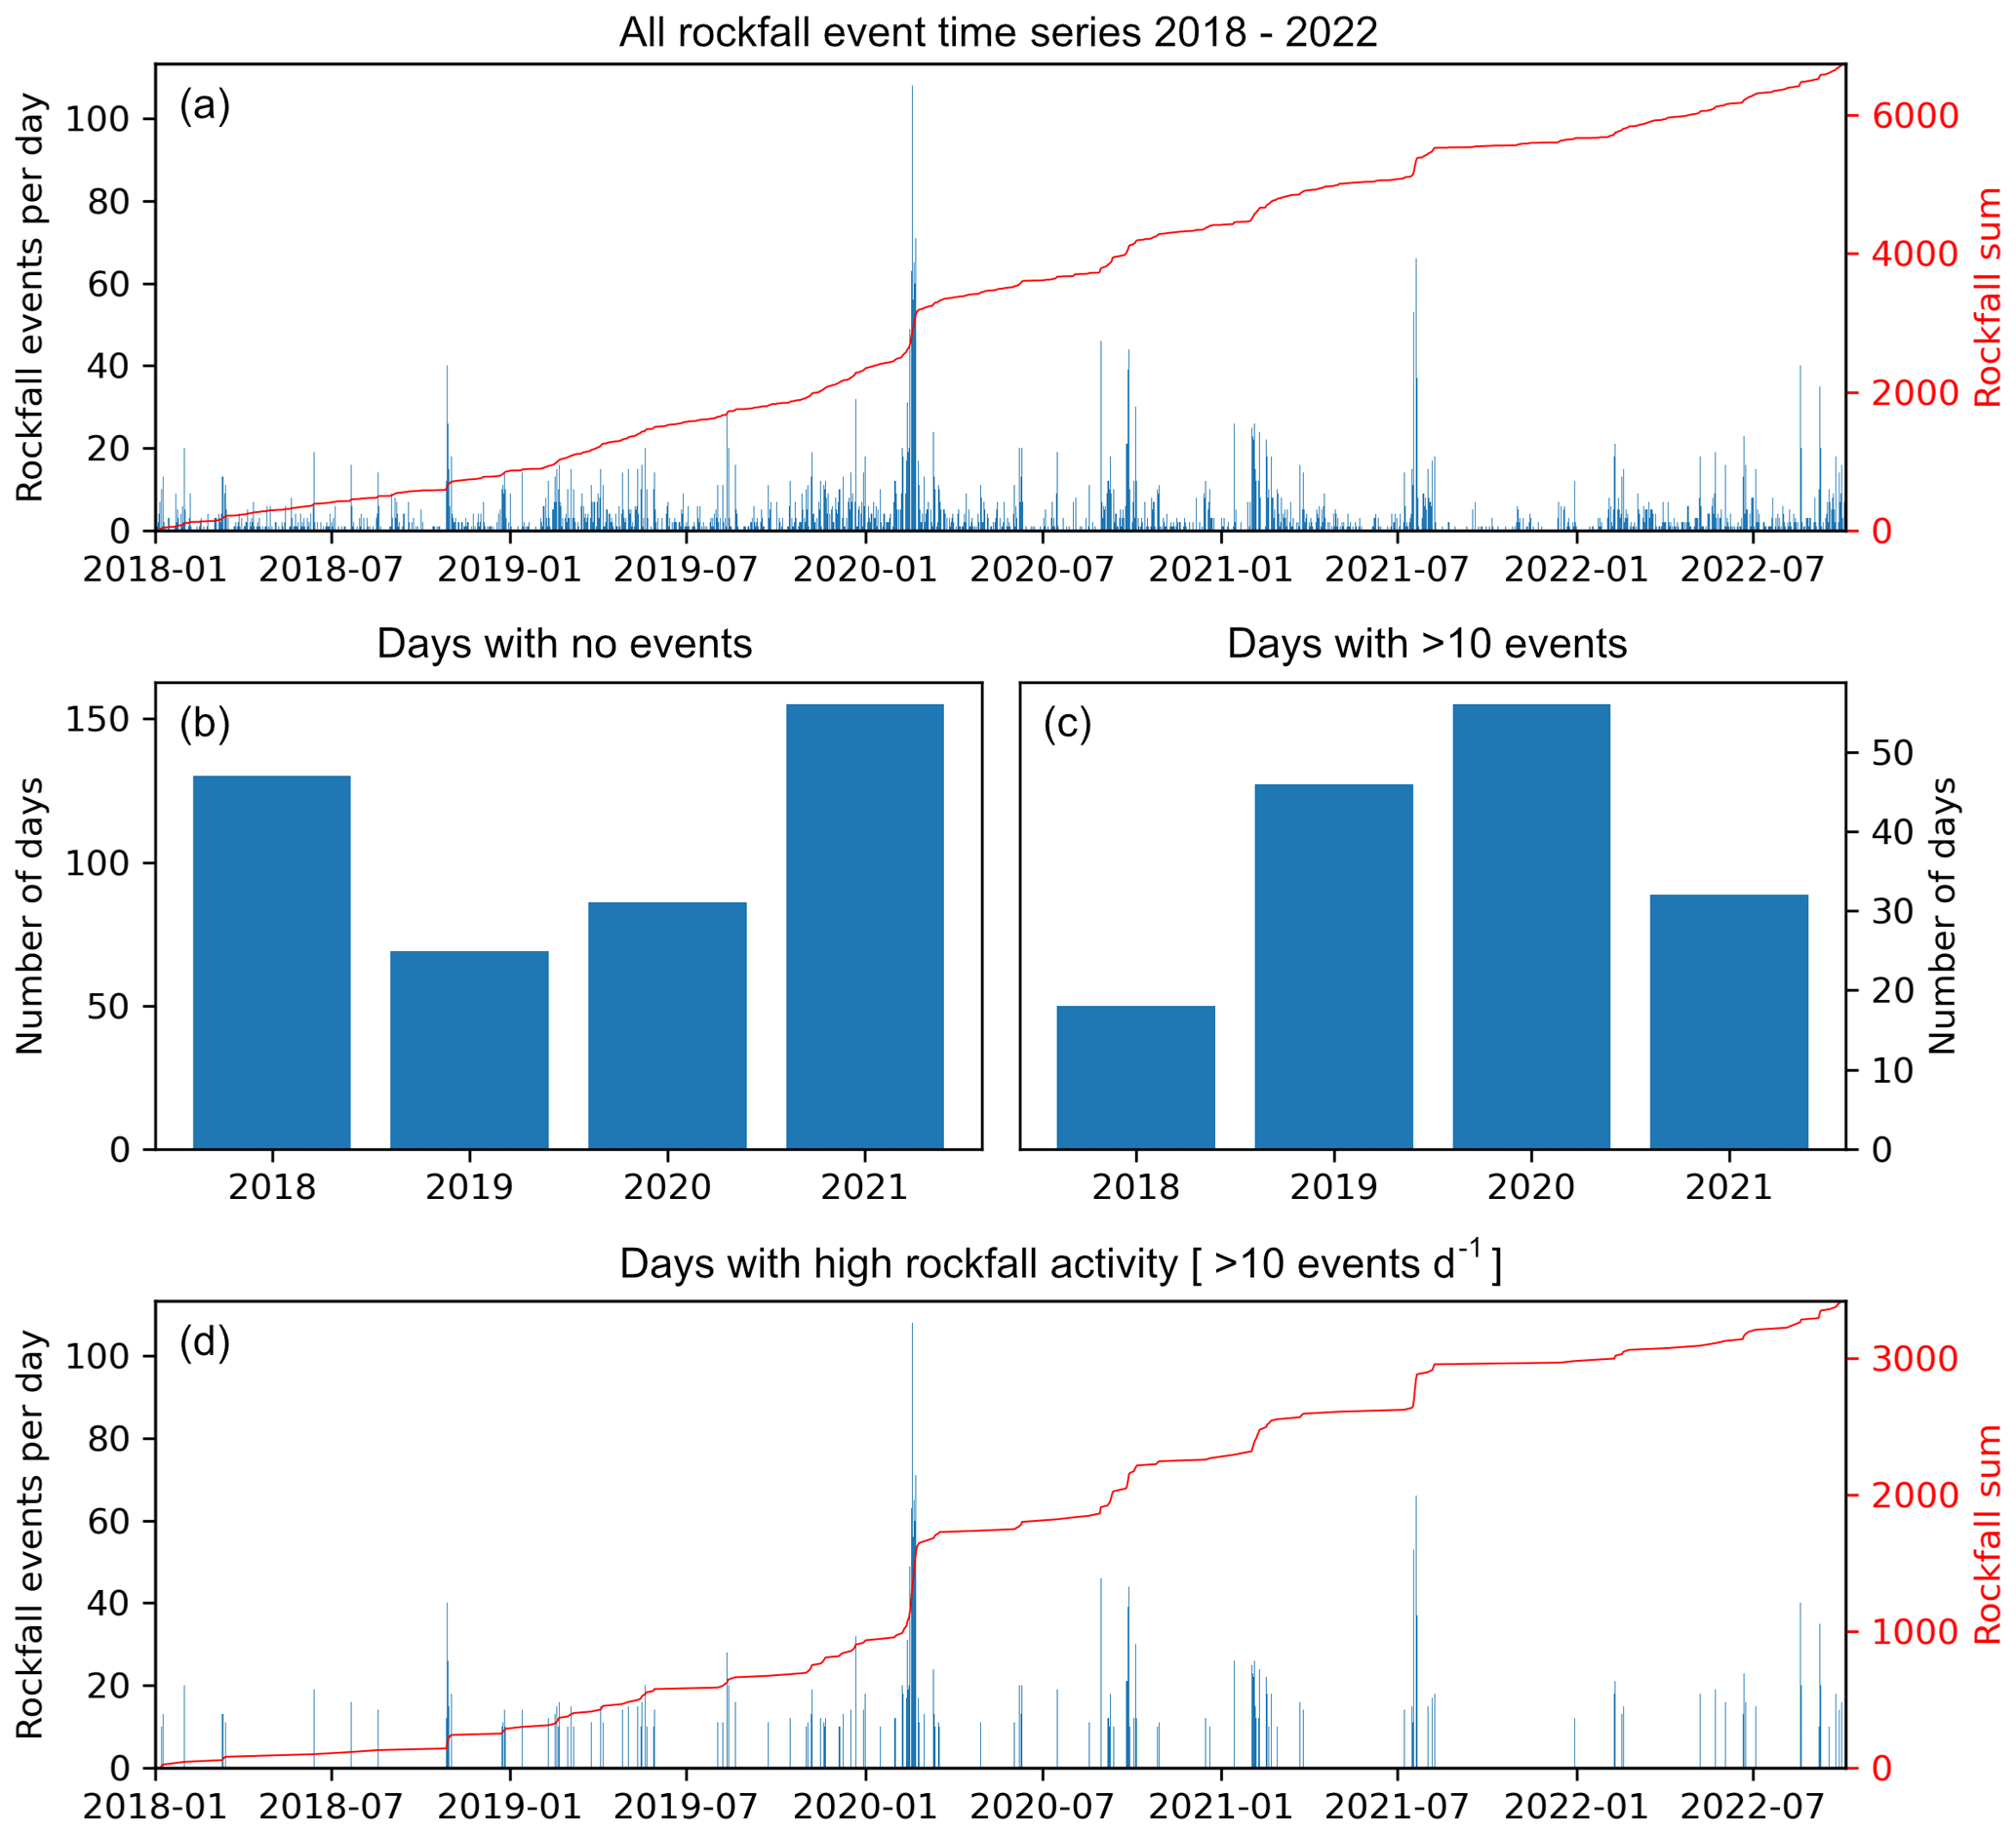
Figure 6Rockfall event time series from January 2018 to October 2022. (a) Rockfall event count. (b) Days with 0 events during the sampling years of 2018–2021. (c) Days with more than 10 events during the sampling years of 2018–2021. (d) Time series with high rockfall activity (more than 10 events registered).
The number of rockfalls per day fluctuates strongly, with a mean of 3.8 events per day and a standard deviation of 7.3. Also, the total number of detected rockfall events per year varies, with 856 in 2018, 1467 in 2019, 2088 in 2020 and 1256 in 2021. In 2022, 1076 rockfall events were detected until 5 October. This corresponds to a mean of 3.9 events per day. Two periods with intense rockfall activity occurred in February 2020 and July–August 2021, respectively, with 108 and 78 events recorded on a single day. A slight long-term increase in rockfall activity was present during 2019, ending with the rockfall cluster in February 2020. Since January 2022, a long-term increase in rockfall activity has been present, which can be seen in Fig. 6a. In total, 439 d did not have any rockfall events detected. A total of 152 d exceeded the 90th percentile of rockfall activity (equal or over 10 events in a day), hereafter considered days with high rockfall activity (Fig. 6d). A total of 18 took place in 2018, 46 in 2019, 56 in 2020 and 32 in 2021 (Fig. 6c). The 2 years on record with the largest number of high rockfall activity days are also the ones with the fewest number of days without any event recorded. Conversely, there were many more days without events in the years with a lower number of high-rockfall-activity days (e.g., 130 in 2018, 69 in 2019, 86 in 2020 and 155 in 2021; Fig. 6b).
During the period on record, a clustering of days with high rockfall activity can be identified in Fig. 6d, for example, in February 2020 and 2021 or August 2021. At these times, the number of events usually first increases exponentially and rapidly decays back to the baseline activity after the peak is reached. Such cluster patterns can also be observed in the rockfall activity plot of Fig. 6a.
We performed a spatial analysis to find patterns in rockfall events' spatial origins. A change in rockfall starting locations would influence the lithology of the involved blocks, give information about transport processes and modify the rockfall hazard for the road at the bottom of the slope. Spatial radar data are only available from 3 November 2018; hence, we decided not to include 2018 in the analysis. During this period, the average rockfall starting location moved westwards (about 40 m) from 2019 to 2021 (Fig. 7a). Fewer rockfall events have originated from the easternmost part of the slope since 2020. Simultaneously, the average rockfall release location has moved southwards (hence downwards), with a marked change between 2019 and 2020. Overall, most rockfall events are released from a compartment (termed “Insel”; see Fig. 1) in the Vallatscha Fm., especially at the contact of the Vallatscha and Raibler Fm. on the west side of the slope. Some TPWE events remain in the data set, where the release area is wrongly attributed to a part of the slope out of the radar field of view. Figure 2c and d show detailed photographs of the main release area in the massive dolomites of the Vallatscha Fm.
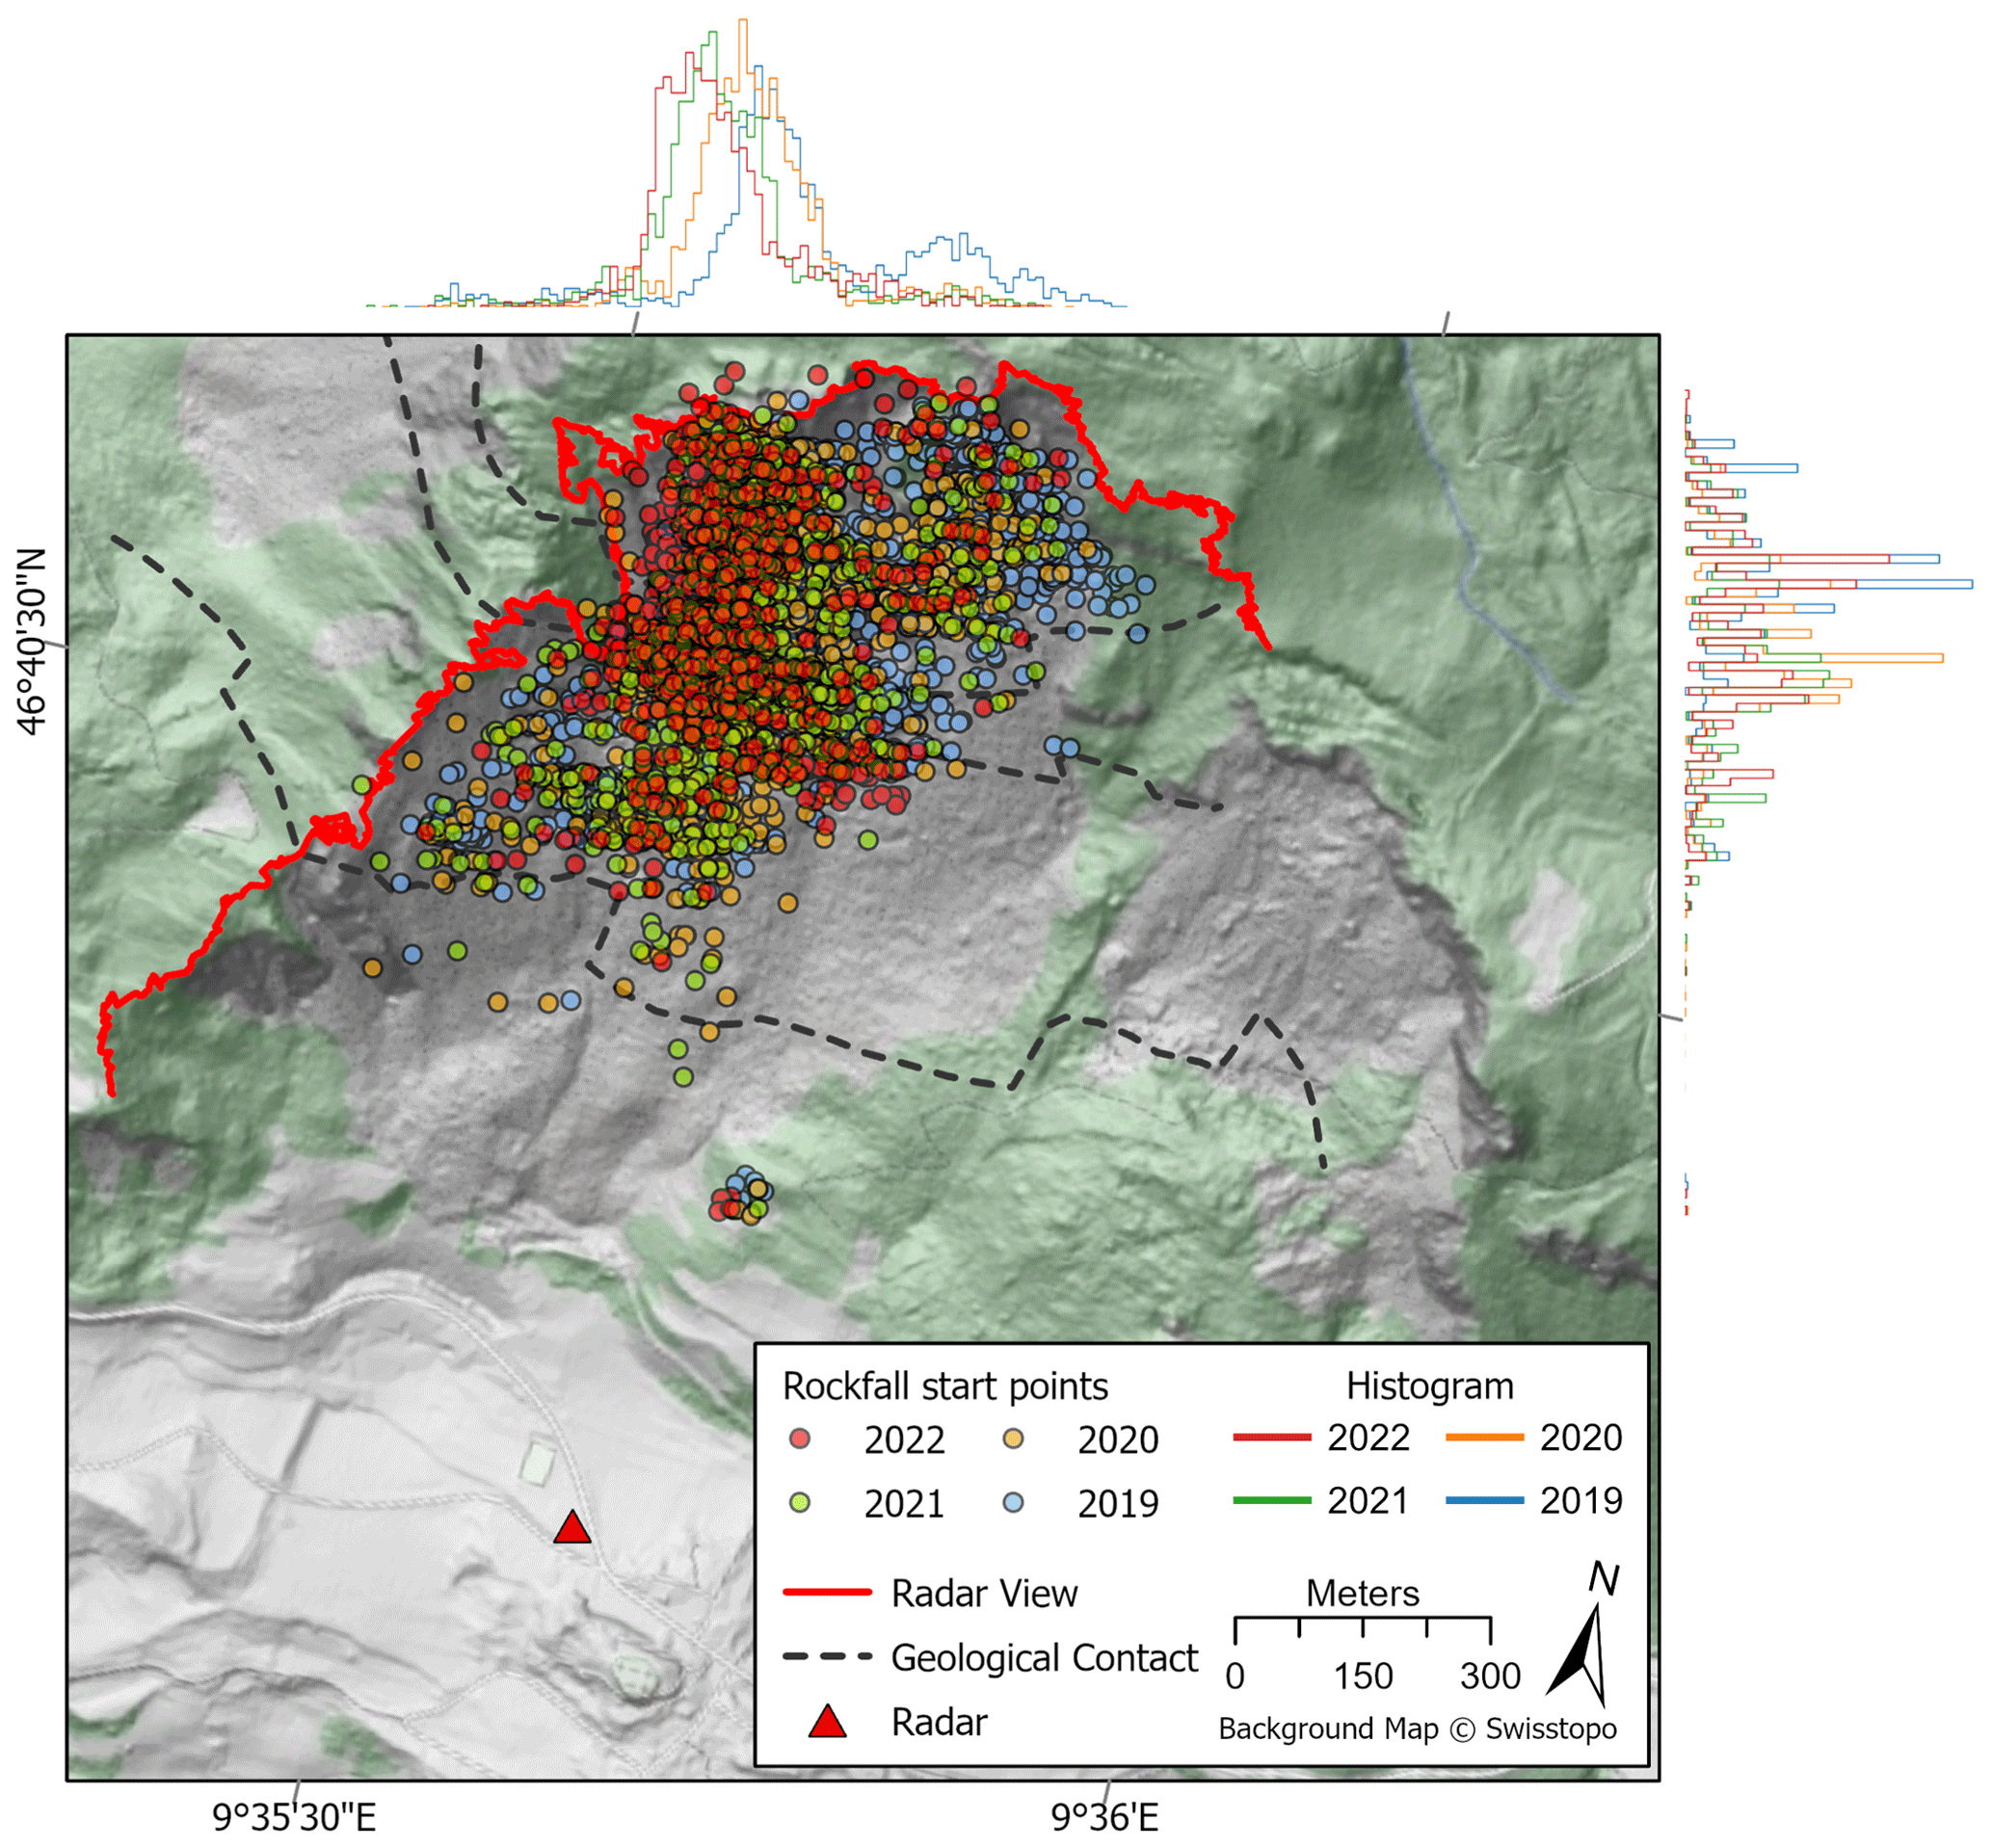
Figure 7Calculated event start points derived by year (2019–2022). Due to low spatial data availability, 2018 is not included. The coordinate system is World Geodetic System (WGS) 84. The histograms show the rockfall event start-point distribution along (right) and perpendicular to (top) the radar to the radar view direction for each year. The red line indicates the maximum radar view (crest line). The dashed black lines are geological boundaries according to BTG (2022b). The green background indicates forested area.
In the upper part of the rockfall slope the transport paths are dominated by bedrock outcrops (Fig. 2) and are strongly channelized. The talus cones begin at about one-third of the rockfall slope elevation and end at the retaining dam. Most blocks are deposited on these talus cones below the release areas (Fig. 2b). We observe a size grading described by increasing block size with increasing distance from the source area. Although the dam can hold back a large part of the blocks, from time to time, larger blocks get onto the grassland adjoining the main road. In the past, large blocks (mainly Arlberg dolomite) were even able to pass the main road. Aerial images recorded between 2003 and 2022 have been analyzed for rockfall deposits in the shadow area, corresponding roughly to the rockfall shadow area (Fig. 1d). We found that in total 183 blocks reached this shadow area during this long monitoring period, having a travel angle ranging between 25 and 27∘. However, it has to be mentioned that this number tends to be highly underestimated, since the time gap between each swisstopo orthophoto is large, and land users usually removed the blocks quickly after deposition until 2021. From a magnitude–cumulative-frequency analysis after Hungr et al. (1999), we can derive a long-term return period for the large 10 and 100 m3 sized blocks reaching the shadow area of 1 and 8 years, respectively. Flying rock fragments have been observed but not recorded systematically.
In the shorter time period between 2018 to 2022, even 166 blocks reached the shadow area. In addition, we observed that 88 blocks were deposited here between April and December 2022. The frequency of blocks reaching the shadow area is increased compared to the previous periods. Assuming that a single block is attributed to an event, this corresponds to a rate of 6 % of all events between April and December 2022 that enter the shadow area. Over the whole sampling time, about 2.5 % reach the shadow area. We examined the time-lapse camera images of events reaching the shadow area, which showed that the block trajectory primarily passed the dam on the east side. This pattern is also evident in the rockfall event map of the canton Grisons (AWN, 2022). However, since 2020, a higher frequency of blocks traveling directly over the dam by rolling and bouncing was observed. Additionally, the size distribution of the blocks has also changed, with smaller blocks (<1 m3) being deposited in the shadow area after 2020. Before, mainly larger blocks (>1 m3) were able to pass the dam.
4.2 The February 2020 event cluster
We have identified clustering rockfall events as a typical characteristic of rockfalls released from active rock slope movements. Here, we present in detail the rockfall event cluster of February 2020 because it corresponds to the highest rockfall rate observed in the monitoring period. From 1 January to 29 February, 878 events were registered, corresponding to 13 % of the total number of events registered in the entire rockfall catalog. The surface water input from snowmelt and rainfall was not exceptionally high during this period (Fig. 8). The temperature was fluctuating around the freezing point, as is usual for this time of the year (Fig. 8), and was progressively warming up, in particular after the end of a cloudy period, around 15 March 2020 (Fig. 8). While the cluster of rockfall events cannot be easily explained by weather or hydrologic factors, none of the nearby reflectors or GNSS stations recorded a significant increase in the velocity of the corresponding landslide compartment (Fig. 1).
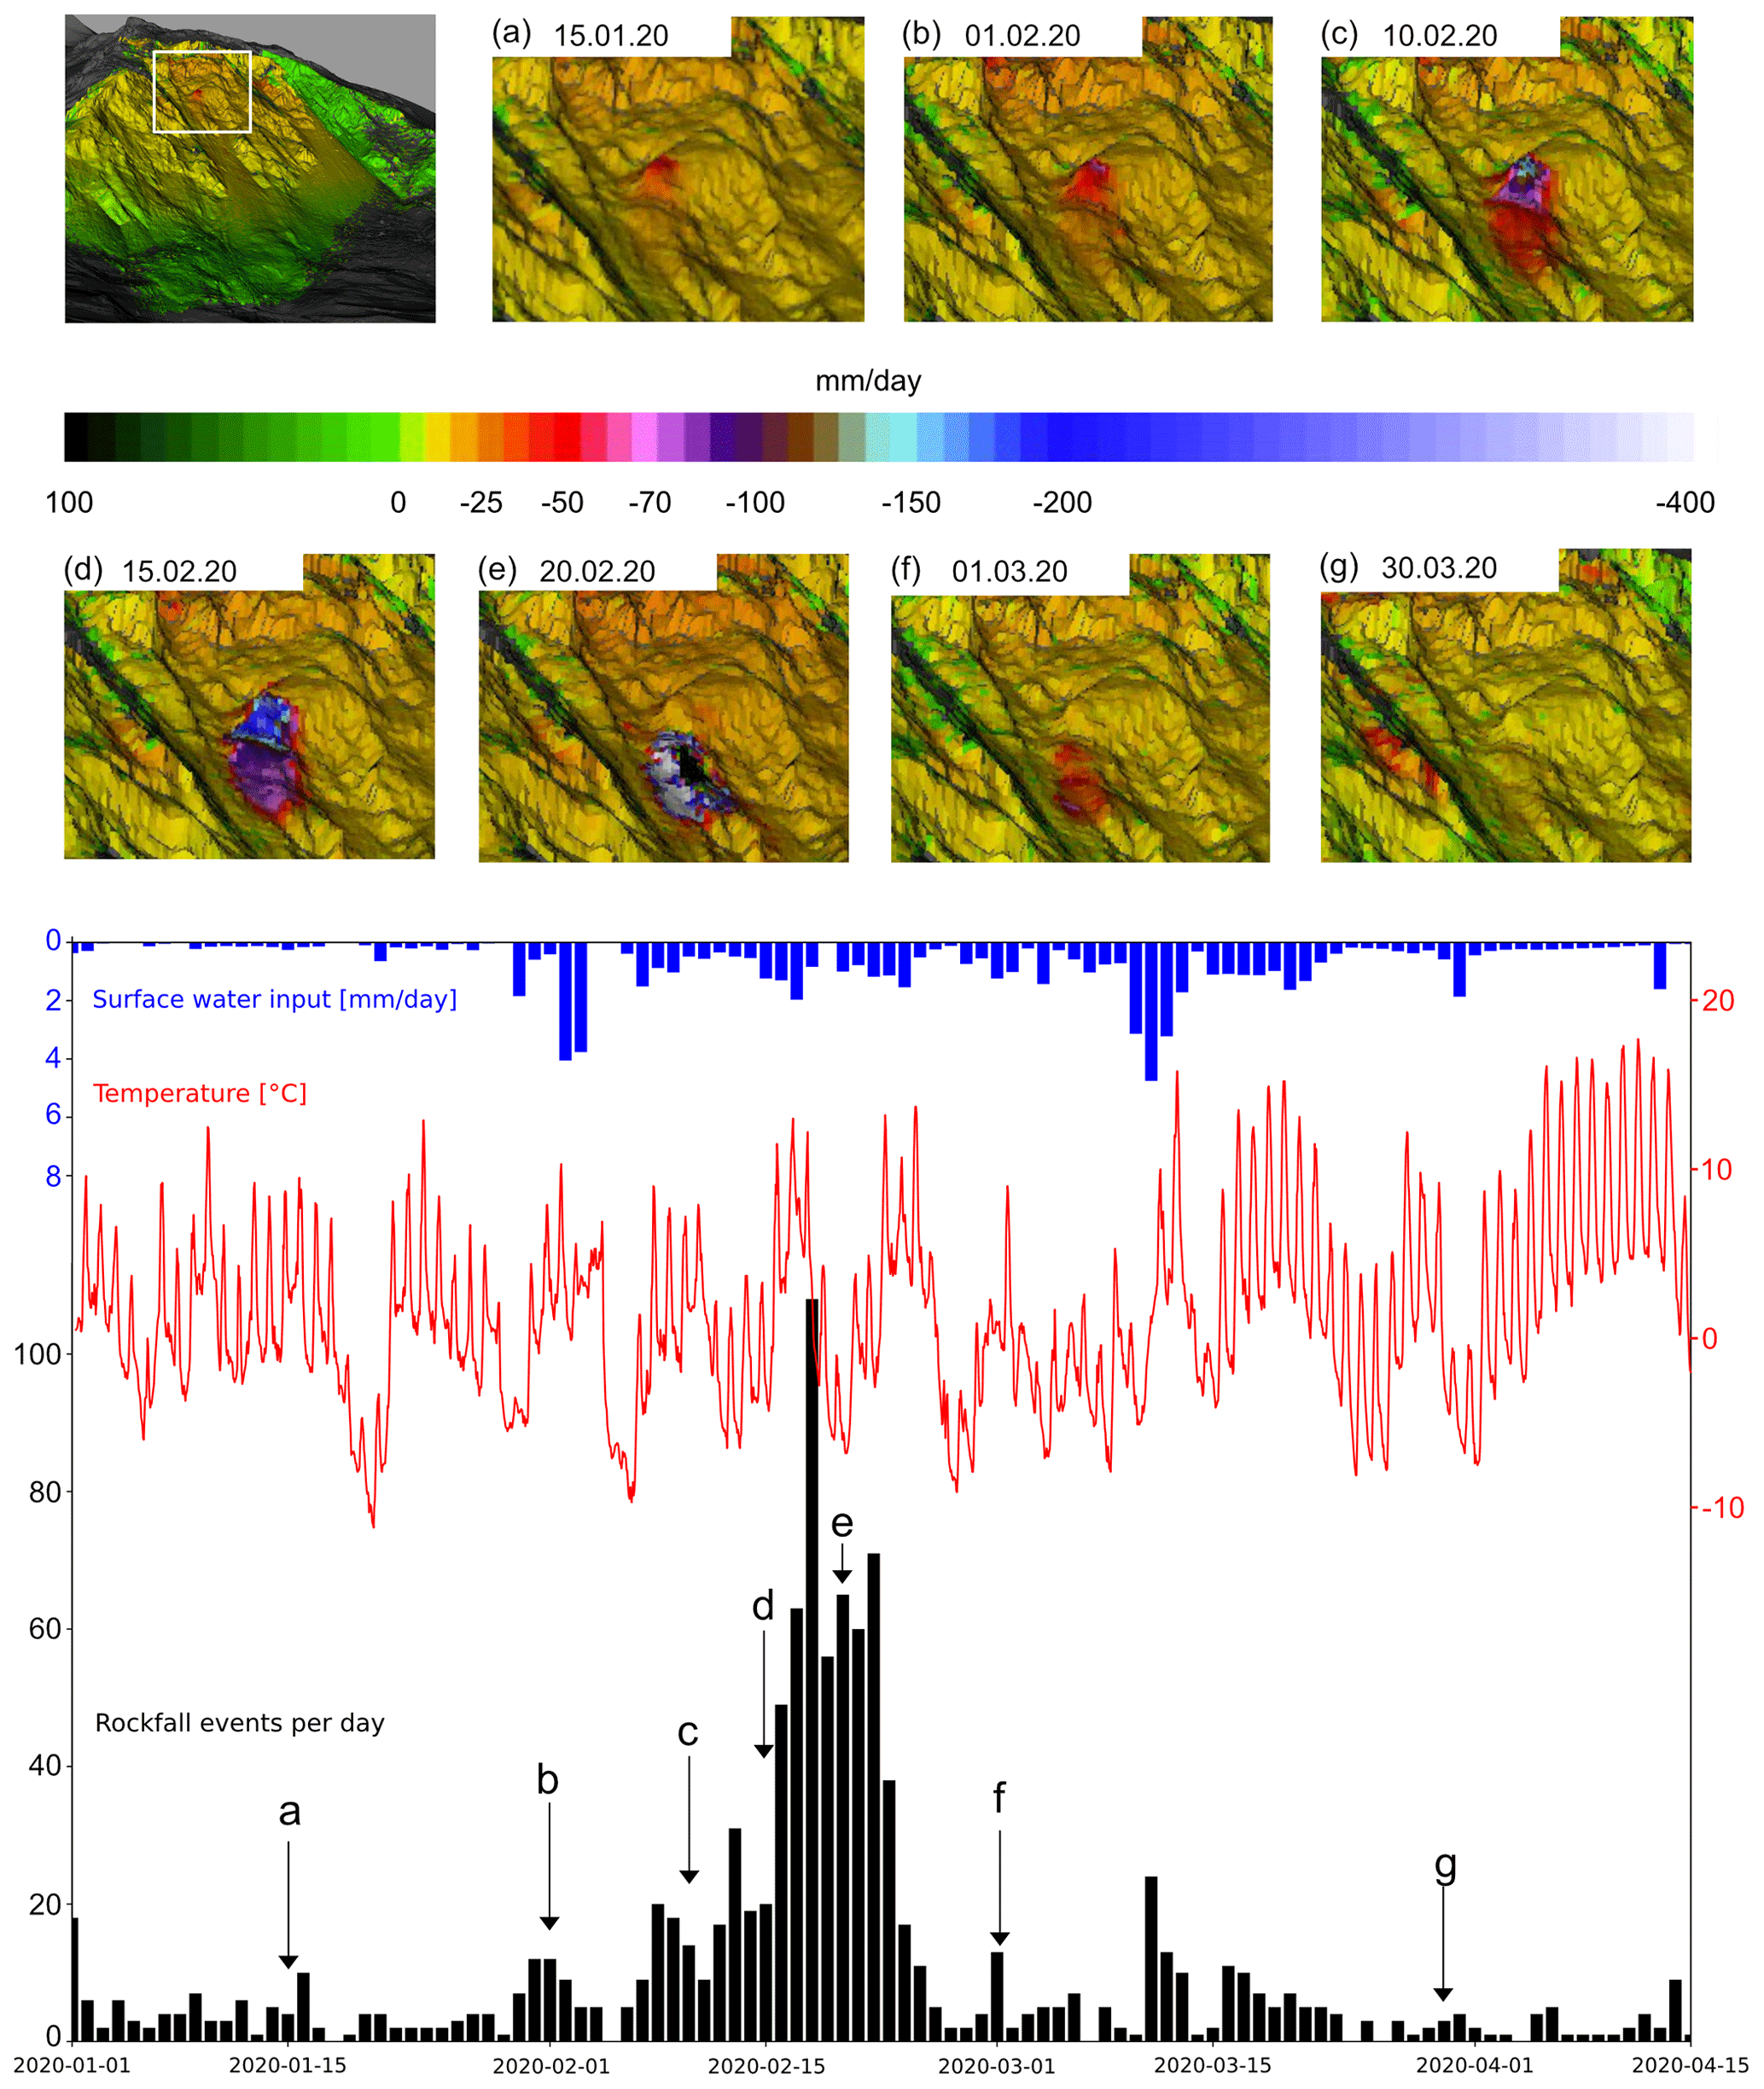
Figure 8Rockfall event cluster from February 2020. (a–c) Ground-based interferometric synthetic aperture radar (GBInSAR) images from 15 January to 30 March 2020 for the landslide displacement. (d–g) Time series with surface water input from SLF (2022) (blue bar), temperature from Brienz/Brinzauls (red line) and rockfall events per day (black bars). The letters and arrows indicate the corresponding GBInSAR image acquisition time.
On the other hand, detailed inspection of the ground-based InSAR data and optical images shows that a small (600 m2) patch of this compartment was moving at a much higher velocity than the rest of the landslide. In January 2020, this rock mass block started to accelerate and reached a velocity peak of 1.5 m d−1 around mid-February 2020 (see Fig. 8a–e), when it collapsed. The rockfall release points were grouped in the area where the local acceleration took place (Fig. 9). On 18 February, the highest rockfall frequency was recorded, with about 100 individual rockfall events. Many of them were released from the debris cone; i.e., the deposits from the collapsed rock mass patch were reactivated (Fig. 9). Afterward, the rock mass velocity decreased again (see Fig. 8f), back to the velocity of the surrounding parts of the slope (0.5 to 5 cm d−1) at the end of March (see Fig. 8d). During this period, the rockfall release points were more scattered across the slope, compared to the months of January and February 2020 (Fig. 9).
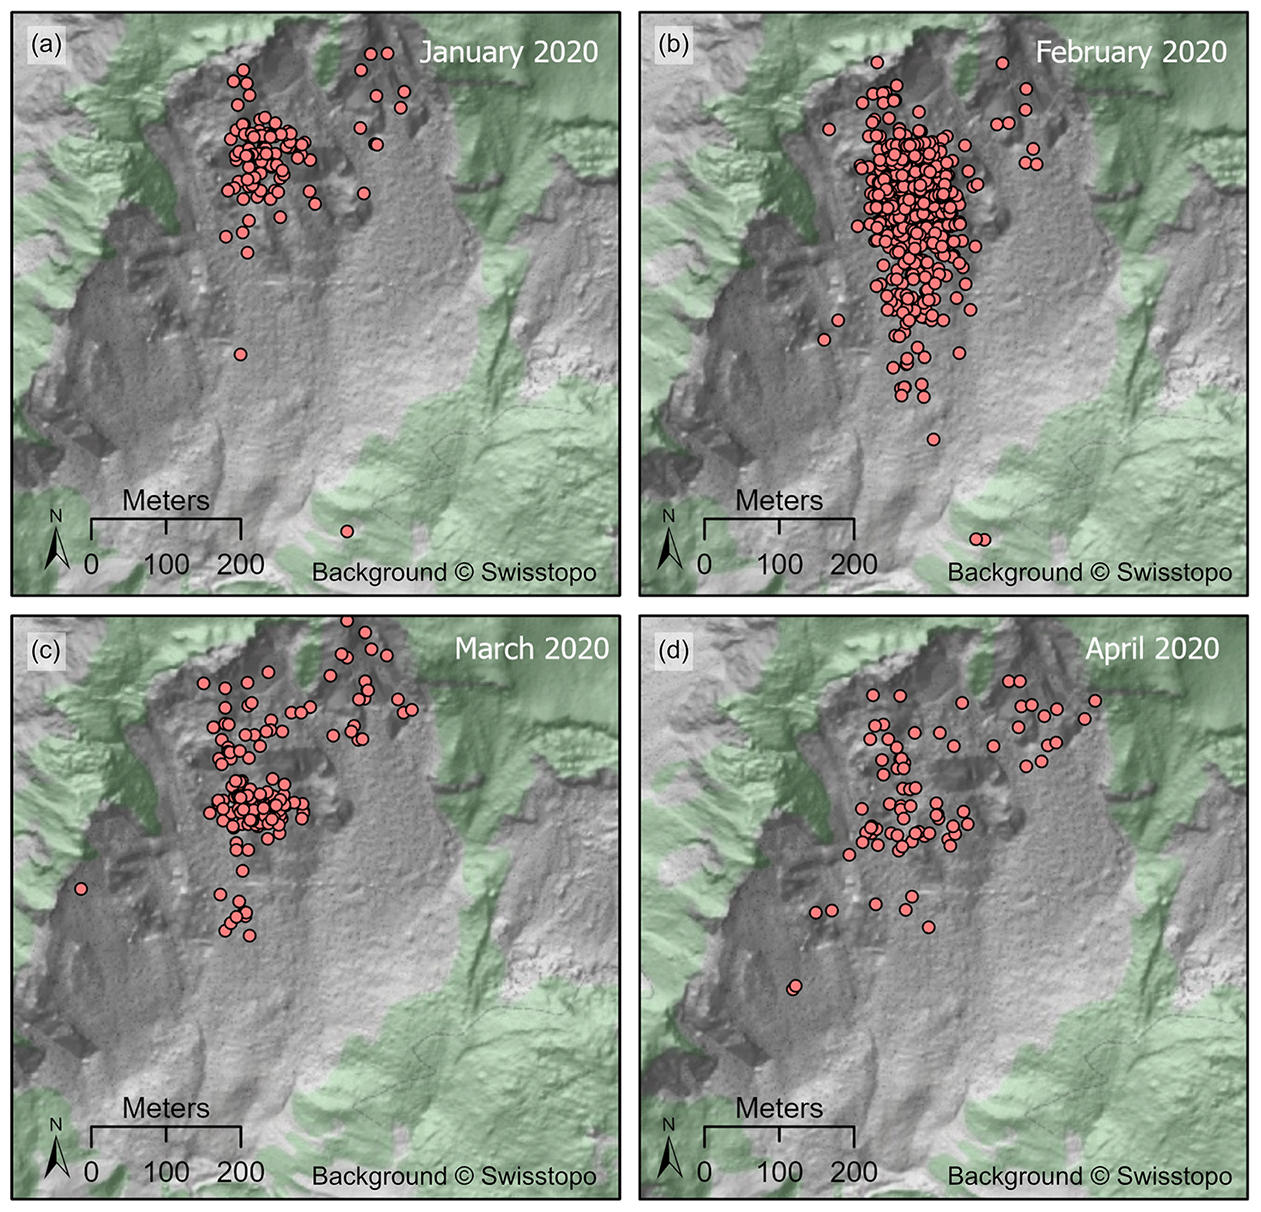
Figure 9Rockfall release points in (a) January, (b) February, (c) March and (d) April 2020. The green background indicates forested area.
4.3 Weather as a rockfall trigger
The rockfall data set was also investigated for potential climatic triggering factors, such as surface water input from rainfall and snowmelt, temperature, and freeze–thaw cycles. Although the SWI data set from SLF (2022) is limited to summer 2021, we used it as the best approximation for meltwater availability. We used Pearson's correlation factors to investigate linear correlations between climatic factors and rockfall frequency. At Brienz/Brinzauls, the potential water input is mainly dominated by snowmelt during winter, while in summer, strong thunderstorms lead to large amounts of available water input in a short time. Because of the seasonality in temperature and surface water input, we divide the data set into summer (April to September, Fig. 10b and c) and winter (October to March, Fig. 10d and e) months. This allows a more precise analysis of the meteorological influences on rockfall activity.
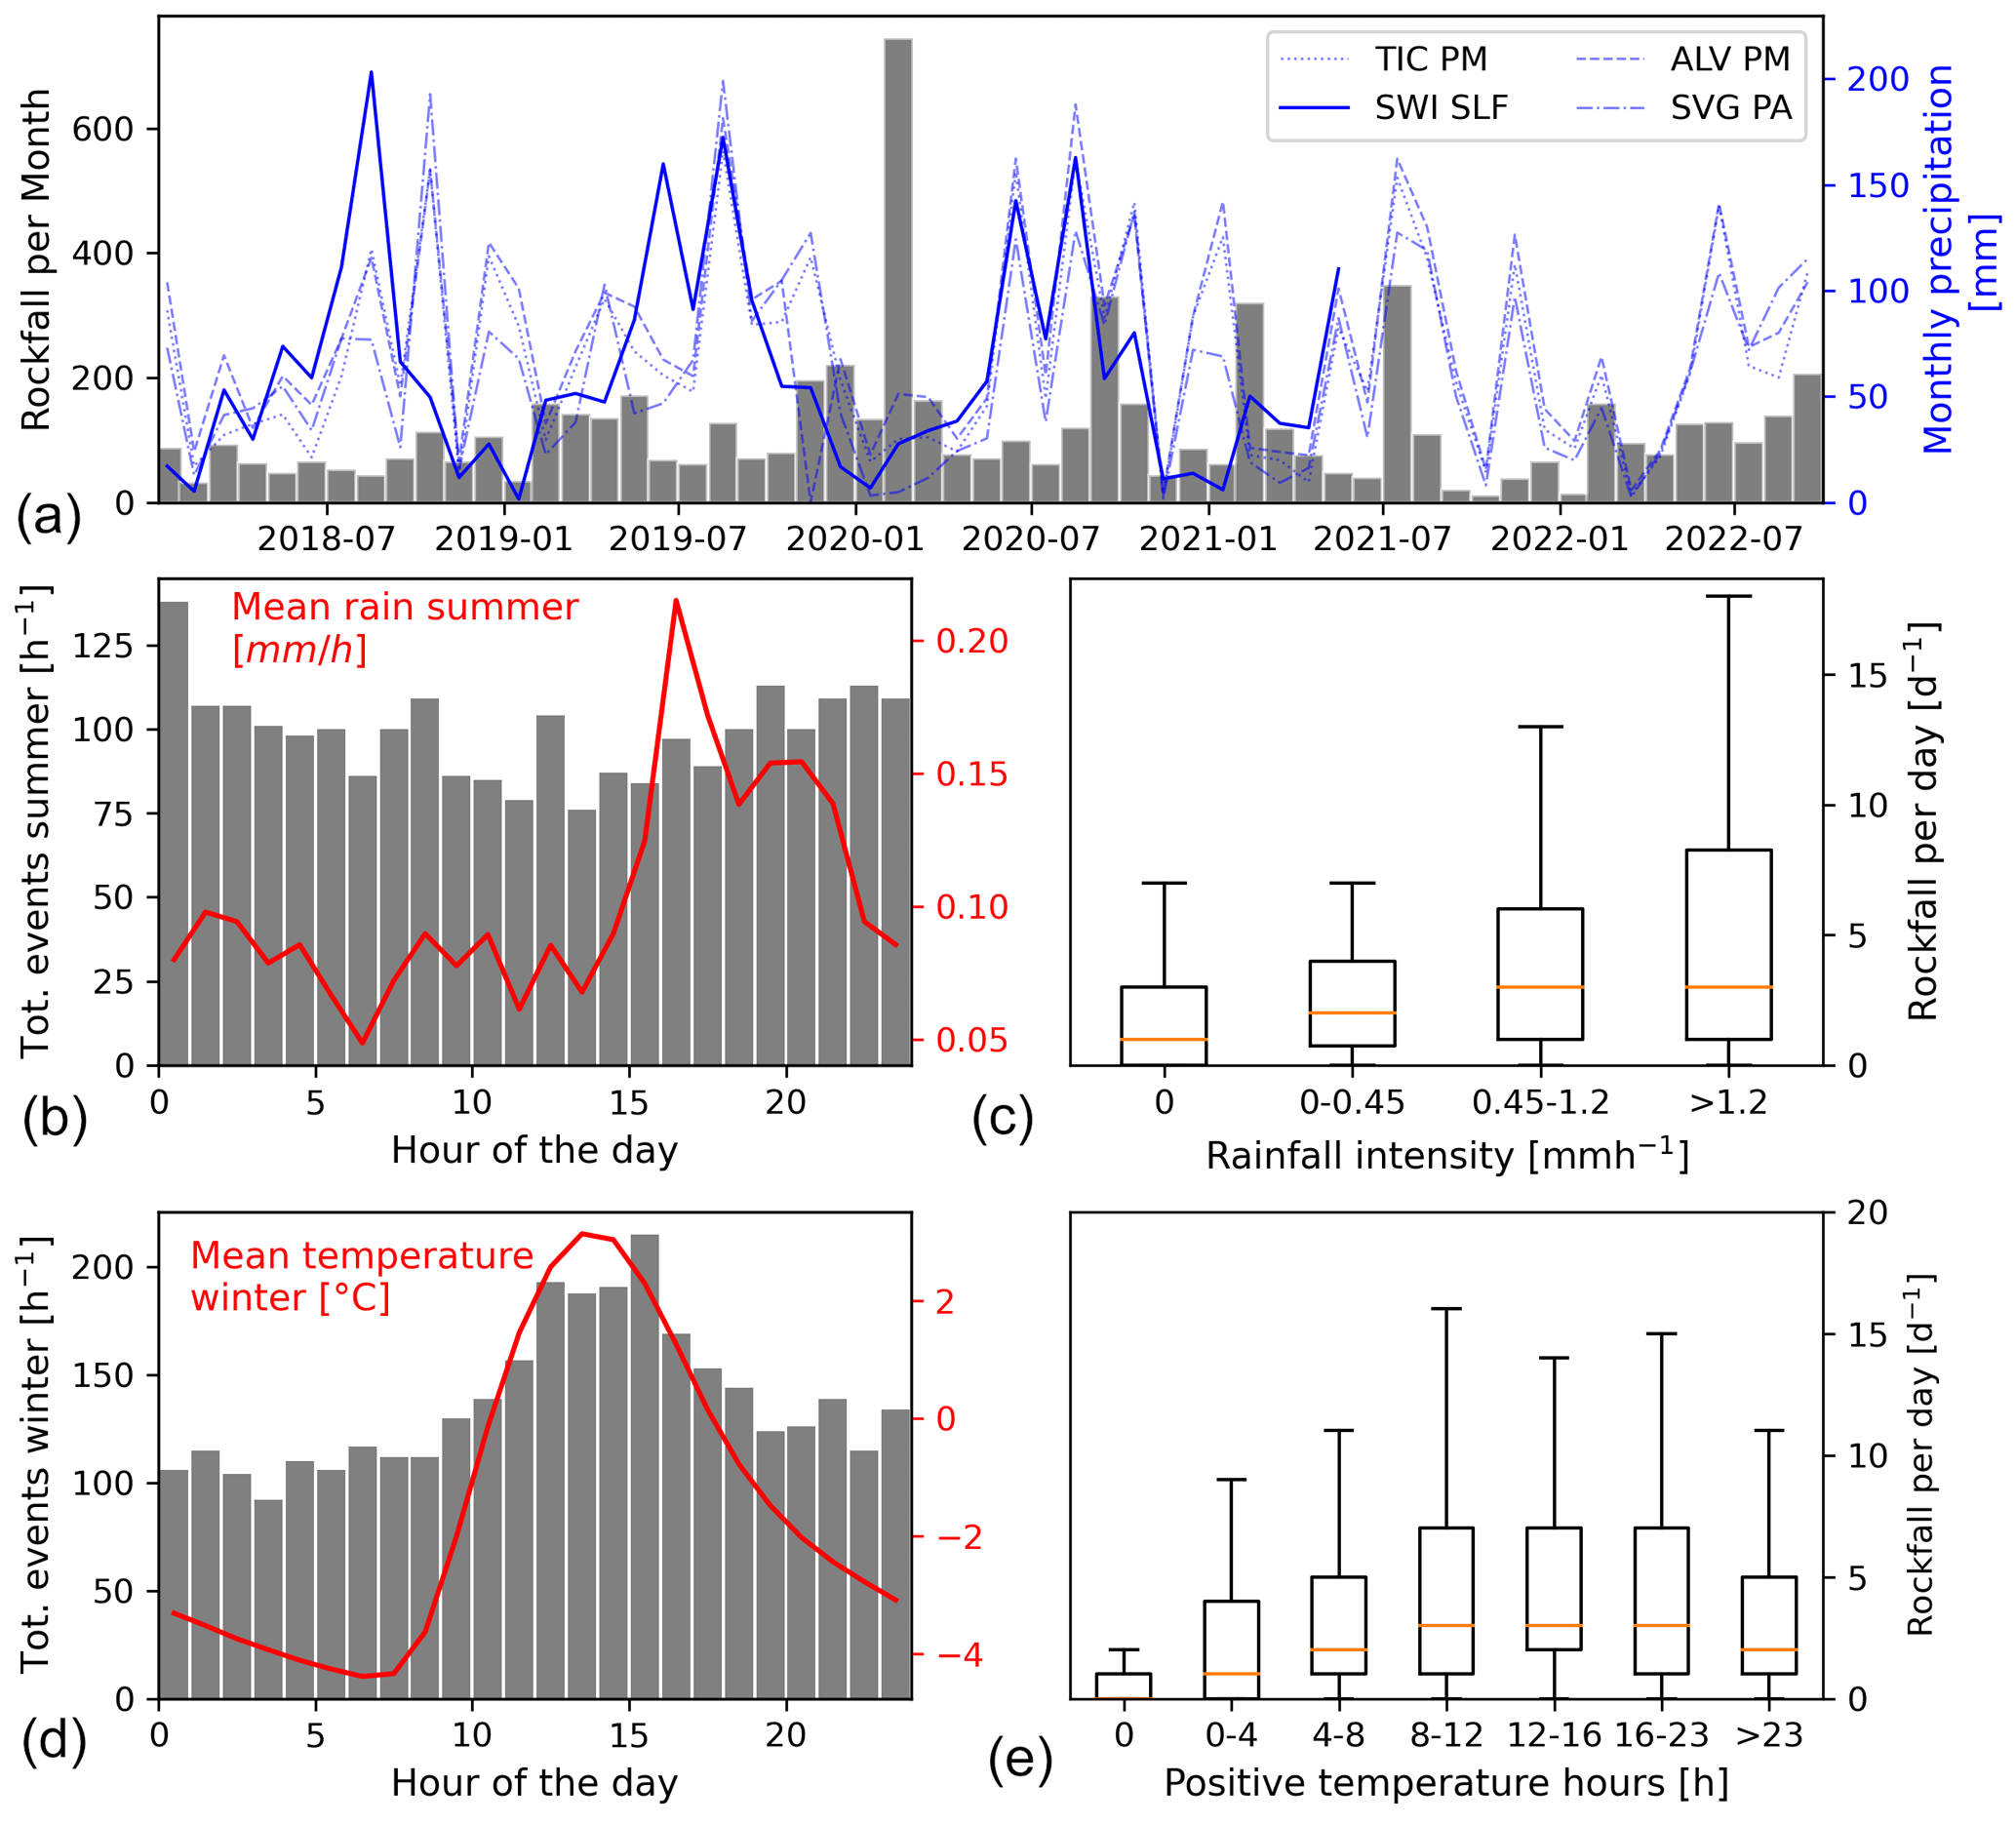
Figure 10(a) Monthly rockfall and precipitation from the Tiefencastel, Savognin, and Alvaneu stations. The wider blue line shows the SWI from SLF (2022). (b) Number of rockfalls for each hour of the day and in red the hourly mean rainfall during summer (station SVG PA). (c) Daily rockfalls as a factor of rainfall intensity (station SVG PA). (d) Number of rockfalls for each hour and in red the hourly mean temperature during the winter months. Temperature from the local station BRINZ. (e) Daily rockfalls as a factor of the duration of positive temperature during winter. Temperature also from the local station BRINZ.
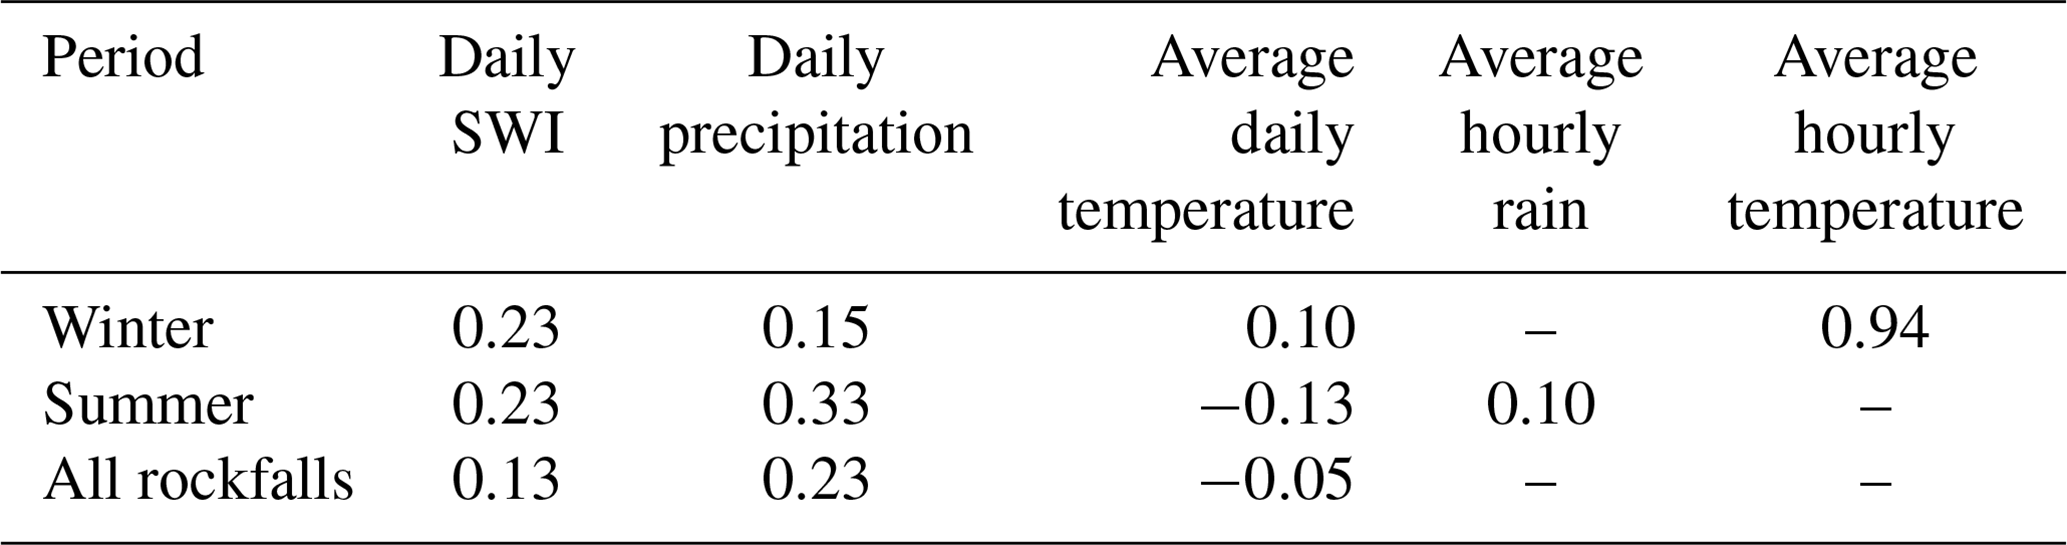
Figure 10a shows monthly rockfall together with precipitation from the Savognin, Alvaneu and Tiefencastel stations and the modeled SWI from SLF (2022). The Pearson correlation, measured on a daily scale, is generally low for both daily surface water input and temperature (Table 2). It is assumed that only rain is precipitating during summer. The correlation analysis highlights a Pearson correlation coefficient of 0.33 between daily rockfall and rainfall during summer, while the correlation between daily water input and rockfall is lower in winter. The effect of temperature on rockfall activity was also investigated using daily mean temperatures. We find a low positive correlation in the winter months and a low negative correlation with mean/maximum temperatures in summer (Table 2).
Table 2Pearson's correlation coefficients between daily rockfall activity and daily weather variables on the left side and seasonal hourly correlation coefficients on the right side. Precipitation data are from Tiefencastel, and temperature is from BRINZ and SWI from SLF (2022).
Meteorological parameters can have a stronger impact on the rockfall activity at an hourly timescale, as depicted in Fig. 10. First, we examine the relationship between rockfall and precipitation during the summer season, shown in Fig. 10b and c. Since snow can be neglected during summer, we assume that all precipitation falls as rain. Summer rainfall often occurs in the late afternoon–early evening (see Fig. 10b), but most rockfall events take place during the night (Fig. 10b), statistically corresponding to times with the most ground wetness. In addition, Fig. 10c exhibits a positive correlation between the median hourly rainfall intensity (average per day) and the number of rockfall events in a day, suggesting that rockfall activity increases during days with intense rainfall.
In Fig 10d and e, we investigate short-term climatic triggers in winter. We find that both the rockfall activity and air temperature have a daily cyclicity, with most rockfall events occurring in the daytime and fewer at night and in the early morning hours. Similarly, the air temperature reaches its maximum in the early afternoon and its minimum in the morning. Thus, the temperature curve follows the rockfall activity, with a Pearson correlation coefficient of 0.94 (Table 2). The time with positive temperature per day is compared with the rockfall activity (Fig. 10e) in winter and shows that the rockfall activity is higher on days with potential freeze–thaw cycles and lower on days with only negative or only positive temperatures.
To further investigate the influence of freeze–thaw cycles, we calculated the freezing potential as defined by D'Amato et al. (2016) from daily mean temperatures measured at the local weather station. We observe that rockfall activity is lower and even partially absent during negative cooling phases (Fig. 11), with a mean of 3.6 events per day. During negative warming, rockfall activity increases slightly compared to the previous negative cooling phase, but still only 3.7 events per day happen on average. In contrast, thawing phases lead to a clear increase in rockfall activity, with a mean of 6.0 events per day. The increase in rockfall activity takes place mainly during the early phase of thawing.
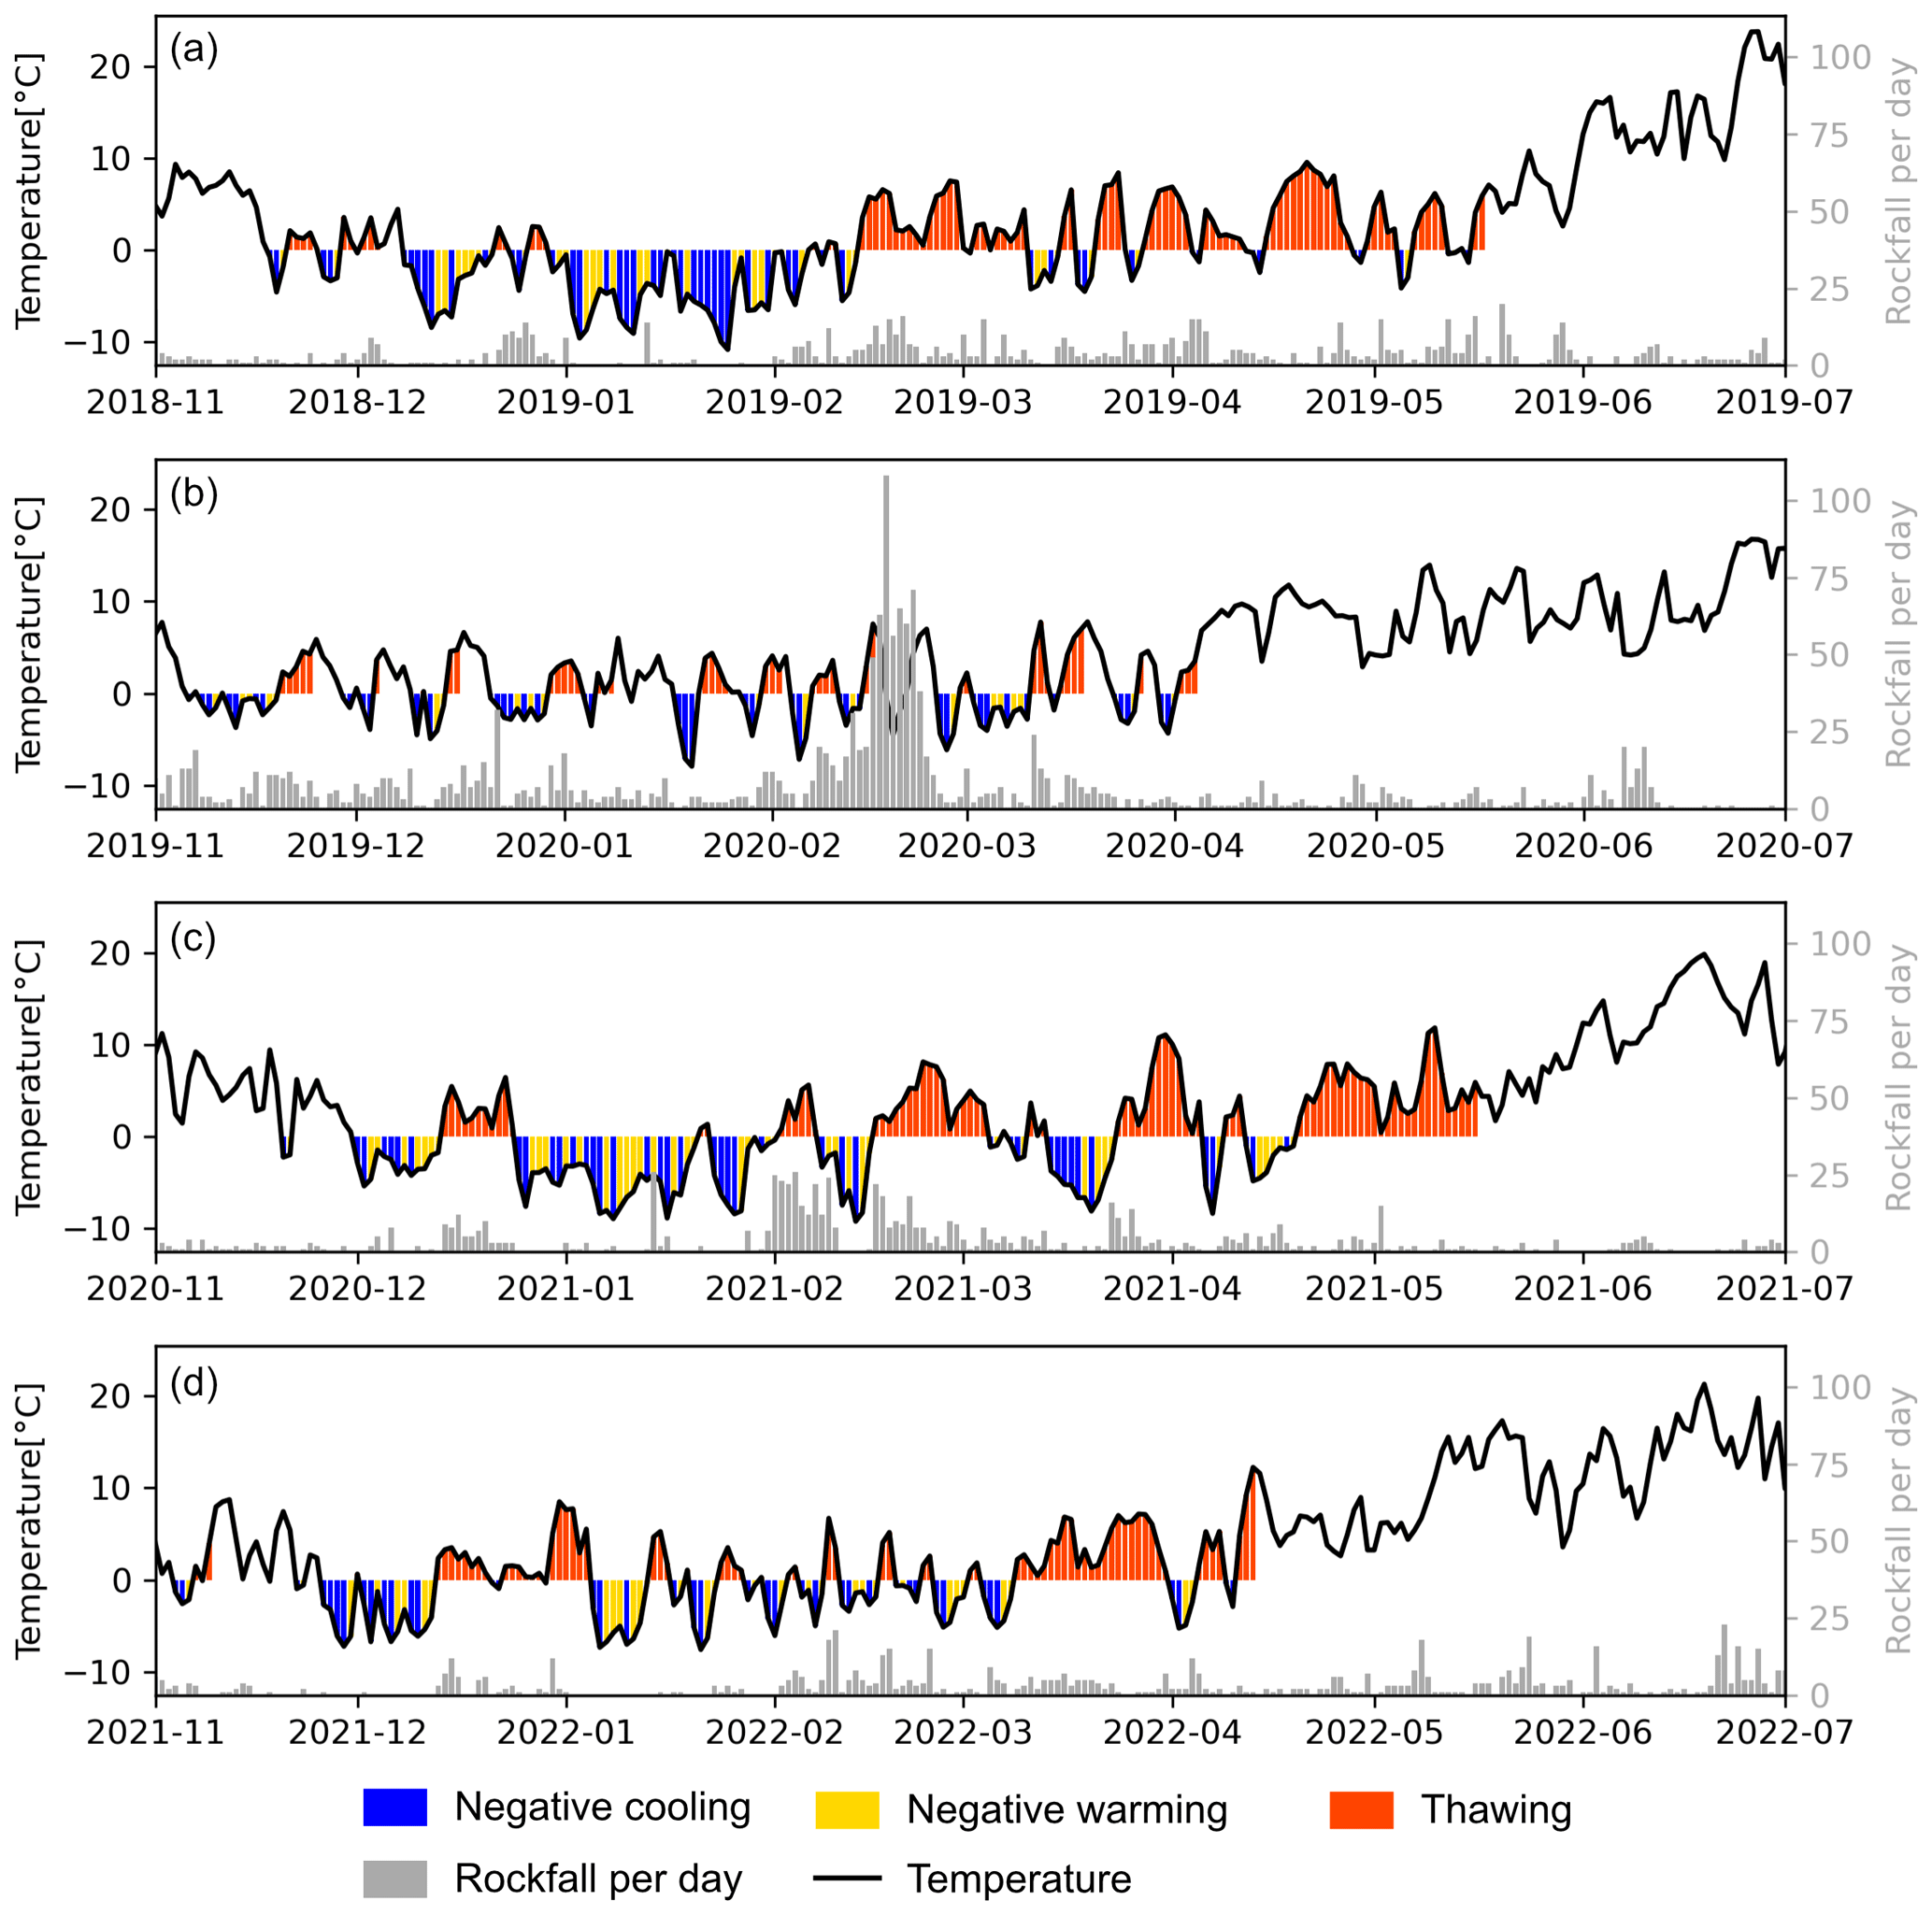
Figure 11Temperature (black line) and rockfall activity (gray bars) in Brienz/Brinzauls for each freezing season from 2018 to 2022 (a–d). Temperature is colored by the corresponding freezing potential phase. Blue indicates negative cooling, yellow for negative warming and red for thawing, as defined by D'Amato et al. (2016).
5.1 Rockfall drivers and triggers
Compared to classical methods such as periodic measurements of deposited mass, cliff monitoring with laser scanners or structure-from-motion photogrammetry, Doppler radar monitoring technology offers a unique advantage: it provides a remarkably high and reliable temporal resolution of rockfall activity. In fact, the methodology we have applied represents the first truly continuous survey, allowing for better insights into rockfall causal factors. Here, we use the definitions for rockfall causal factors described in Popescu (1994) and Loew et al. (2022): preparatory causal factors are ground conditions and processes that reduce the stability of potentially unstable rock compartments until failure occurs. When the time of failure can be associated with an acting process, we call this a triggering causal factor. In past studies (D'Amato et al., 2016) about 50 % of all rockfall events could not be related to a trigger. Most processes can be both preparatory and triggering causal factors.
In our rockfall release area, active rock sliding and rock toppling within a larger mountain slope deformation control high displacement rates and are suggested to be the main preparatory causal factor. This is based on the following arguments: (1) rockfall release areas correspond with the locations of increased slope velocity as derived from terrestrial radar interferometry. Since the beginning of the terrestrial monitoring (starting in April 2019), different extraordinary active sub-compartments occurred within the Insel compartment and always correlated with areas of increased rockfall activity. This is also the main cause of the long-term motion of rockfall activity seen in Fig. 6. (2) Temporary clustered rockfall events over periods of several weeks have not been observed in stable rock slopes (e.g., D'Amato et al., 2016) and can clearly be correlated with unstable compartments. This significantly impacts the short-term prediction of rockfall frequency and rockfall hazard management, which for stable slopes can be correlated with daily weather conditions. The occurrence of clustered rockfall events is mainly driven by local rock mass damage and block rotation in unstable compartments and less by short-term climatic events (Fig. 7).
We observed that during the larger rock mass failure in February 2020, where 7500 m3 of rock was released in several hundreds of individual rockfalls (Loew et al., 2022), rockfall activity increased exponentially until a peak was reached on 18 February (Fig. 8). The following decrease in activity is in line with the deceleration of the remaining rock mass. We observed that most rockfalls during this time period originated in the area of the destabilized block (Fig. 9) and were more scattered later. Such an increase in rockfall activity prior to a larger mass failure is known as precursory rockfall and is well described by Rosser et al. (2007) in the Jurassic shale and sandstone cliffs of the coast of the North York Moors National Park, UK. They assume that slope displacements lead to increased strain and fracturing of the rock, preparing slope sectors for rockfalls. Increased rockfall activity during the acceleration of unstable rockslides has been observed at other locations in crystalline and sedimentary rocks (Sartori et al., 2003; Oppikofer et al., 2008; Gschwind and Loew, 2018). All of these sites are located at different altitudes and exposed to different climatic conditions but still show the same pattern of rockfall activity prior to rock mass failure as in Brienz/Brinzauls. Therefore, local rock slope displacement and acceleration can be seen as a major rockfall preparatory factors (Fig. 8). This insight is only possible thanks to the spatial InSAR observation, as the single, nearby monitoring points (Fig. 3) and rockfall frequency (Fig. 6) have no linear correlation.
Related to this causal factor, the spatio-temporal rockfall frequency in our study area is very high. The spatio-temporal frequency of rockfalls bigger than a volume V0 can be expressed as a power-law function of A(V−V0), where A is the frequency of rockfalls with a volume bigger than V0 (an activity parameter), and the exponent B of A(V−V0) reflects the decrease of the frequency when the volume increases (e.g., Loew et al., 2022). V0 is the minimal value of the considered volume range or a minimal volume of interest, which depends on the context of the analysis. Assuming that the majority of recorded events have a volume of a few cubic meters, we can estimate the activity parameter A for the total release area of about 100 000 m2 as ranging between 78 and 190 yr−1 hm−2. This is 2 orders of magnitude bigger than the reported activity parameters from stable slopes in continental cliffs (Hantz et al., 2020).
Weather-related factors such as precipitation and temperature typically play an important role as rockfall triggers in stable slopes (e.g., Loew et al., 2022). At Brienz/Brinzauls, a simple correlation between rockfall and SWI is not evident. SWI and temperature both have annual cycles, leading to seasonal rockfall patterns. Stronger seasonality in rockfall activity was recorded from 2020, starting with the February 2020 event cluster (Fig. 6), until 2021, and the seasonality was weaker in 2018, 2019 and 2022. Such changes in patterns are not uncommon and are observed at other sites as well (Luckman, 1976; Gardner, 1971).
During summer, we found that rockfall activity per day is increased on days with higher rainfall intensity (Fig. 10c). At other sites, similar findings were presented by Krautblatter and Moser (2009), where rockfall activity increased non-linearly with rainfall intensity. It must be noted that thunderstorms may lead to a very local rainout and, therefore, to an underestimation or overestimation of the actual effect on rockfall activity. Furthermore, the influence of precipitation on rockfall activity could also depend on the source area location.
During winter, rockfall is most frequent at midday, which is in line with the hourly mean temperature (Fig. 8d). Ice can act as a cohesive force for rock blocks, and increased rockfall activity is mainly observed during melting or thermal ice expansion periods above −5 ∘C (D'Amato et al., 2016). This could explain why fewer rockfalls are observed at night and on days with temperatures constantly below or above the freezing point (Figs. 10d, e and 11). In addition, meltwater infiltration may lead to an increase in rockfall activity, as observed by Mourey et al. (2022) in the Mt. Blanc region. During the melting hours, rockfall frequency in our study area increases by a factor of about 2, with no observed time lag. Therefore, the loss of cohesion from melting ice infills in fractures is assumed to be the main cause of rockfall frequency increase during thawing periods.
Although the thawing phase can generate meltwater infiltration, distributed fluid pressure increase in the shallow rockfall release areas is very unlikely due to the high permeability and very low groundwater table of the rock mass. On the other hand, snowmelt and presumably meltwater infiltration in spring correlate with rapid accelerations of the Insel rockslide compartment.
5.2 Rockfall transport in the shadow area
Assuming that a single block can be correlated with a Doppler radar event, about 3 % of all events reach the shadow area of Brienz/Brinzauls. The shadow angle which has developed in the last 20 years of increased rockfall activity is estimated to be approximately 27∘ (Fig. 1d). Evans and Hungr (1993) evaluated the shadow angle of 16 rockfall talus profiles and found that 27.5∘ is a commonly observed shadow angle. The occurrence of a lower shadow angle, and hence an increased reaching distance, was only observed in specific conditions, such as smooth substrates covered with grass or snow. The underlying mechanism of rockfall transport in the shadow area is mainly rolling blocks, and the extent of rolling is mainly controlled by the rolling friction angle, which is influenced not only by the block sizes on the talus cone but also by the substrate in the shadow area and the properties of the human-made rockfall dam. The rockfall activity in Brienz/Brinzauls has led to the dam reaching its maximum capacity, as indicated in Fig. 2f. Over the course of our investigations, we also revealed that, compared to the years prior to 2020, an increased number of smaller blocks reach the shadow area directly (Fig. 2e). This increase is likely related to the flattening of the dam, as well as accompanying changes in the type of terrain. This hypothesis is based on visual observations between 2018 and 2022, which have to be examined in further studies.
Excavating the dam under the current very high activity rates is practically impossible and potentially life-threatening. As a result, it is expected that the frequency of rockfall events reaching the shadow area will increase, and smaller shadow angles could develop. Based on the literature values, these could become as small as 24 to 25∘ (e.g., Evans and Hungr, 1993) but are not expected to endanger the houses in close proximity to the shadow area.
5.3 Strength and limitations of a Doppler radar rockfall monitoring system
Rockfall monitoring methods have seen big technological advances in recent years, mainly related to developing high-resolution structure-from-motion photogrammetry, digital image correlation and lidar investigations. These technologies can be applied from the ground, drones and piloted aircraft. Most investigations have been periodic, and processing is not fully automated. In addition, optical methods only work under cloud-free and illuminated conditions. The Doppler radar offers continuous rockfall recording, also at night and under bad weather conditions (when many rockfalls are released). The time lapse of events recorded at Brienz/Brinzauls is in the range of up to a few minutes, as every larger rockfall event leads to automatic road closure and reopening. A higher recording frequency would technically be feasible. This high frequency and reliability under all weather and illumination conditions result in a unique time series of rockfall events above the critical size thresholds described in Sect. 3.2. Such rockfall time series can be used to unravel short-term triggers in great detail. Additional and more detailed investigations of triggering processes using local climatic sensors and high-resolution cameras are underway.
The main objective of the Doppler radar at Brienz/Brinzauls is the automatic closure of the main road by a traffic light within a few seconds of the detection of a rockfall event. After regular events where the blocks are deposited on the talus cone, the road is automatically reopened after a few minutes. For large or clustered events reaching over the retaining dam into the shadow area, the responsible risk management experts receive an automatic alarm via cellular network, and the road is automatically reopened after data consultation on the data portal. Still, a yellow flashing light at the traffic lights will signal to the road users that they must expect obstacles on the road. The experts then consult the radar data and optical images of the event taken at an interval of 3 s, enabling the operators to check the road for damage and depositions quickly. After this check the traffic light is reinstated (Susanne Wahlen, personal communication, 22 January 2023). It is, therefore, essential that the system operates quickly and with a very low false negative rate to ensure the safety of road users. During the entire period of operation, the system worked very reliably, and no injuries were reported in this section of the road due to rockfall. The system allows the main road to Brienz/Brinzauls to stay at its current location despite the very frequent events and high rockfall hazard.
For scientific data acquisition and transport process investigations, detailed and accurate spatial information is also required, including about release, transport, fragmentation and deposition. We found that the transport path and runout distance are not well represented by the radar records, which is why the time-lapse optical images must be consulted for detailed information. The calculated intensity maps supplied by the Doppler radar are very blurred. The horizontal and vertical error is estimated to be at about 10 m and 2 to 3∘, respectively. This makes a start-point calculation difficult. Furthermore, we observed that events in the eastern region of the rockfall slope exhibit minimal variations among themselves, regardless of their size or trajectory. Obtaining a sufficiently accurate volume estimation from the radar image is not possible with the current state of technology. Such information would be valuable to determine the maximum block sizes that could potentially enter the zone of the road and village. The Doppler radar is, therefore, more suitable for analyzing rockfall events in time than their volume and detailed spatial extent.
We have investigated a new rockfall data set recorded by a Doppler radar at the active landslide complex of Brienz/Brinzauls in the Swiss Alps. This is the first complete rockfall time series recorded during 4 years for events of about 1 m3 in size and larger. The rockfall release areas are mainly located in a south-viewing dolomite cliff of a very active landslide compartment (1500 to 1700 m a.s.l.), moving with more than 10 m yr−1 in a downslope direction. We show that, under these active landsliding conditions, rockfall frequency defined by the activity parameter is 2 orders of magnitude higher than in stable continental cliffs. While rockfall events are also reliably recorded during nights and bad weather conditions, the monitoring of transport pathways is less complete than other investigation methods. Nevertheless, the rockfall radar at Brienz has been used as a reliable automatic early warning system since 2018, closing an important main road crossing a rockfall shadow area which experienced 166 hits during the study period. By assuming that a single block can be attributed to a Doppler radar event, about 3 % of all events reach the shadow area. The shadow angle which has developed in the last 20 years of increased rockfall activity is estimated to be approximately 27∘. We observe a frequency increase of rockfall events reaching the shadow area, which can be attributed to the filling of a rockfall dam.
In our study area, rockfalls occur in clusters lasting several days to weeks. These clustered events show very low correlations with daily weather conditions, considering rainfall, snowmelt, temperature and freeze–thaw cycles. On the other hand, the clustered rockfall events clearly correlate with the velocity of landslide activity hotspots in the highly fractured sliding and toppling rock masses. These hotspots can be reliably detected and monitored by continuous ground-based radar interferometry and serve as a better early warning indicator than weather data. On an hourly timescale, the daily temperature maxima correlate with the highest rockfall frequencies in winter. They indicate that warming and thawing periods of freezing ground are important short-term rockfall drivers during winter. Additionally, rockfall activity during the thawing periods is about twice as high as average. Due to the short instantaneous reaction of the rockfall activity, a direct connection to local rock mass acceleration due to meltwater infiltration is assumed.
The daily rockfall count, spatial rockfall and freezing potential data sets are available after publication at https://doi.org/10.3929/ethz-b-000605062 (Schneider et al., 2023).
All authors contributed to the study's conception and design. Data analysis was performed by all authors. The first draft of the paper was written by MS and NO, and SL edited the document. TE provided the key raw data for this work. All authors commented on the previous versions of the paper and read and approved the final paper.
The contact author has declared that none of the authors has any competing interests.
Publisher's note: Copernicus Publications remains neutral with regard to jurisdictional claims made in the text, published maps, institutional affiliations, or any other geographical representation in this paper. While Copernicus Publications makes every effort to include appropriate place names, the final responsibility lies with the authors.
The authors would like to acknowledge the valuable contribution of the rockfall data set from Geopraevent AG (Tobias Schoch, Susanne Wahlen, Johannes Gassner), the landslide velocity data provided by CSD Ingenieure AG (Stefan Schneider) and the advanced surface water input model data by SLF Davos (Rebecca Mott-Grünewald). Further, we would like to thank the Swiss Seismological Service, SED, for providing the local weather data. We would also like to acknowledge the great help and support received from Amt für Wald und Naturgefahren Graubünden (Andreas Huwiler and Andri Largiadèr), Tiefbauamt Graubünden (Christoph Nänni) and BTG Büro für Technische Geologie (Reto Thöny), who have provided reports, guidance and encouragement throughout the research.
This paper was edited by Yves Bühler and reviewed by Michel Jaboyedoff and one anonymous referee.
Abadi, M., Agarwal, A., Barham, P., Brevdo, E., Chen, Z., Citro, C., Corrado, G. S., Davis, A., Dean, J., Devin, M., Ghemawat, S., Goodfellow, I., Harp, A., Irving, G., Isard, M., Jia, Y., Jozefowicz, R., Kaiser, L., Kudlur, M., Levenberg, J., Mané, D., Monga, R., Moore, S., Murray, D., Olah, C., Schuster, M., Shlens, J., Steiner, B., Sutskever, I., Talwar, K., Tucker, P., Vanhoucke, V., Vasudevan, V., Viégas, F., Vinyals, O., Warden, P., Wattenberg, M., Wicke, M., Yu, Y., and Zheng, X.: TensorFlow: Large-Scale Machine Learning on Heterogeneous Systems, https://www.tensorflow.org/ (last access: 21 October 2023), 2015. a
AWN: Kurzbericht der Expertengruppe zu den Ereignissen Cengalo/Bondo für die Medienkonferenz, Tech. rep., Amt für Wald und Naturgefahren, Chur, https://www.gr.ch/DE/institutionen/verwaltung/diem/awn/dokumentenliste_afw/20170828_Kurzbericht_Expertengruppe_20171215_dt.pdf (last access: 21 October 2023), 2017. a
AWN: Naturgefahren – Ereigniskarte, https://geo.gr.ch/karten/katalog (last access: 26 September 2022), 2022. a, b
Brantut, N., Heap, M., Meredith, P., and Baud, P.: Time-dependent cracking and brittle creep in crustal rocks: A review, J. Struct. Geol., 52, 17–43, https://doi.org/10.1016/j.jsg.2013.03.007, 2013. a
Brauchli, R.: Geologie der Lenzerhorngruppe, Beiträge zur geologischen Karte der Schweiz Lfg. , Lfg. 49, Abt. 2, A. Francke, 1921. a
BTG: Geologische Detailuntersuchungen 2018 bis 2021 Strukturgeologie - Bericht 5897-15, Tech. rep., BTG Büro für Technische Geologie AG, Sargans, for Amt für Wald und Naturgefahren Graubünden, Chur, unpublished, 2022a. a, b, c
BTG: Geologischer Synthesebericht – Bericht 5897-19, Tech. rep., BTG Büro für Technische Geologie AG, Sargans, for Amt für Wald und Naturgefahren Graubünden, Chur, unpublished, 2022b. a, b
Cavell, G. C.: National Association of Broadcasters Engineering Handbook, in: 11th Edn., Taylor and Francis, https://doi.org/10.4324/9781315680149, 2017. a
Chau, K. T., Wong, R., Liu, J., and Lee, C.: Rockfall hazard analysis for Hong Kong based on rockfall inventory, Rock Mech. Rock Eng., 36, 383–408, https://doi.org/10.1007/s00603-002-0035-z, 2003. a, b
Collins, B. D. and Stock, G. M.: Rockfall triggering by cyclic thermal stressing of exfoliation fractures, Nat. Geosci., 9, 395–400, https://doi.org/10.1038/NGEO2686, 2016. a
Copons, R., Vilaplana, J., and Linares, R.: Rockfall travel distance analysis by using empirical models (Solà d'Andorra la Vella, Central Pyrenees), Nat. Hazards Earth Syst. Sci., 9, 2107–2118, https://doi.org/10.5194/nhess-9-2107-2009, 2009. a
Cruden, D.: A theory of brittle creep in rock under uniaxial compression, J. Geophys. Res.,, 75, 3431–3442, https://doi.org/10.1029/JB075i017p03431, 1970. a
D'Amato, J., Hantz, D., Guerin, A., Jaboyedoff, M., Baillet, L., and Mariscal, A.: Influence of meteorological factors on rockfall occurrence in a middle mountain limestone cliff, Nat. Hazards Earth Sysst. Sci., 16, 719–735, https://doi.org/10.5194/nhess-16-719-2016, 2016. a, b, c, d, e, f, g, h, i, j
Doppler, C.: Ueber das farbige Licht der Doppelsterne und einiger anderer Gestirne des Himmels: Versuch einer das Bradley'sche Aberrations-Theorem als integrirenden Theil in sich schliessenden allgemeineren Theorie, K. Böhm Gesellschaft der Wissenschaften, 1903. a
Dussauge-Peisser, C., Helmstetter, A., Grasso, J.-R., Hantz, D., Desvarreux, P., Jeannin, M., and Giraud, A.: Probabilistic approach to rock fall hazard assessment: potential of historical data analysis, Nat. Hazards Earth Syst. Sci., 2, 15–26, https://doi.org/10.5194/nhess-2-15-2002, 2002. a
Evans, S. G. and Hungr, O.: The assessment of rockfall hazard at the base of talus slopes, Can. Geotech. J., 30, 620–636, https://doi.org/10.1139/t93-054, 1993. a, b, c, d
Frayssines, M. and Hantz, D.: Failure mechanisms and triggering factors in calcareous cliffs of the Subalpine Ranges (French Alps), Eng. Geol., 86, 256–270, https://doi.org/10.1016/j.enggeo.2006.05.009, 2006. a, b, c, d
Gardner, J. S.: A note on rockfalls and north faces in the Lake Louise area, Am. Alp. J., 17, 317–318, 1971. a
Gassner, J., Wahlen, S., and Meier, L.: Radarüberwachung von Massenbewegungen, Schweiz. Z. Forstwes., 173, 124–129, https://doi.org/10.3188/szf.2022.0124, 2022. a, b
Geopraevent: Monitoring systems for gravitative natural hazards, Tech. rep., Geopraevent, Zurich, https://www.geopraevent.ch/wp-content/uploads/2022/09/Technology_Guide_Geopraevent_2022_EN-1.pdf (last access: 21 October 2023), 2022. a, b
Gschwind, S. and Loew, S.: Reconstruction of the long-term evolution of a catastrophic slope failure at the Preonzo rock slope instability complex (TI, Switzerland), in: Landslides and Engineered Slopes. Experience, Theory and Practice, CRC Press, 1027–1034, https://doi.org/10.1201/9781315375007-112, 2018. a, b
Gunzburger, Y., Merrien-Soukatchoff, V., and Guglielmi, Y.: Influence of daily surface temperature fluctuations on rock slope stability: case study of the Rochers de Valabres slope (France), Int. J. Rock. Mech. Min., 42, 331–349, https://doi.org/10.1016/j.ijrmms.2004.11.003, 2005. a
Hantz, D., Colas, B., Dewez, T., Lévy, C., Rossetti, J.-P., Guerin, A., and Jaboyedoff, M.: Quantitative assessment of rockfall release frequency, Revue Francaise de Geotechnique, 163, 2, https://doi.org/10.1051/geotech/2020011, 2020. a
Holfuy: Technical info Holufy weather stations, https://holfuy.com/de/about (last access: 21 October 2023), 2023. a
Hungr, O., Evans, S., and Hazzard, J.: Magnitude and frequency of rock falls and rock slides along the main transportation corridors of southwestern British Columbia, Can. Geotech. J., 36, 224–238, https://doi.org/10.1139/t98-106, 1999. a, b
Hungr, O., Leroueil, S., and Picarelli, L.: The Varnes classification of landslide types, an update, Landslides, 11, 167–194, https://doi.org/10.1007/s10346-013-0436-y, 2014. a
Krähenbühl, R. and Nänni, C.: Ist das Dorf Brienz-Brinzauls Bergsturz gefährdet?, Swiss Bull. Angew. Geol., 22/2, 33–47, https://doi.org/10.5169/seals-738126, 2017. a
Krautblatter, M. and Moser, M.: A nonlinear model coupling rockfall and rainfall intensity based on a four year measurement in a high Alpine rock wall (Reintal, German Alps), Nat. Hazards Earth Syst. Sci., 9, 1425–1432, https://doi.org/10.5194/nhess-9-1425-2009, 2009. a, b, c, d
Loew, S.: Grosshangbewegung von Brienz (GR): Beurteilung der Gefährdungsszenarien – Stand Januar 2022, Expert Report for Amt für Wald und Naturgefahren Graubünden, Chur, unpublished, 2022. a
Loew, S., Hantz, D., and Gerber, W.: 5.09 - Rockfall Causes and Transport Mechanisms - A Review, in: Treatise on Geomorphology, 2nd Edn., edited by: Shroder, J. J. F., Academic Press, Oxford, 137–168, https://doi.org/10.1016/B978-0-12-818234-5.00066-3, 2022. a, b, c, d, e, f, g
Luckman, B. H.: Rockfalls and rockfall inventory data: Some observations from surprise valley, Jasper National Park, Canada, Earth Surf. Process., 1, 287–298, https://doi.org/10.1002/esp.3290010309, 1976. a
Macciotta, R., Martin, C. D., Edwards, T., Cruden, D. M., and Keegan, T.: Quantifying weather conditions for rock fall hazard management, Georisk, 9, 171–186, https://doi.org/10.1080/17499518.2015.1061673, 2015. a, b, c
Macciotta, R., Hendry, M., Cruden, D. M., Blais-Stevens, A., and Edwards, T.: Quantifying rock fall probabilities and their temporal distribution associated with weather seasonality, Landslides, 14, 2025–2039, https://doi.org/10.1007/s10346-017-0834-7, 2017. a, b, c
Matsuoka, N.: Diurnal freeze–thaw depth in rockwalls: Field measurements and theoretical considerations, Earth Surf. Proc. Land., 19, 423–435, https://doi.org/10.1002/esp.3290190504, 1994. a
Matsuoka, N. and Sakai, H.: Rockfall activity from an alpine cliff during thawing periods, Geomorphology, 28, 309–328, https://doi.org/10.1016/S0169-555X(98)00116-0, 1999. a, b, c
Meier, L., Jacquemart, M., Wahlen, S., and Blattmann, B.: Real-time rockfall detection with doppler radars, in: Proc. 6th Interdisciplinary Workshop on Rockfall Protection, 22 to 24 May 2023, Barcelona, 75–78, ISBN 978-84-946909-4-5, 2017. a
Mourey, J., Lacroix, P., Duvillard, P.-A., Marsy, G., Marcer, M., Malet, E., and Ravanel, L.: Multi-method monitoring of rockfall activity along the classic route up Mont Blanc (4809 m a.s.l.) to encourage adaptation by mountaineers, Nat. Hazards Earth Syst. Sci., 22, 445–460, https://doi.org/10.5194/nhess-22-445-2022, 2022. a
Oppikofer, T., Jaboyedoff, M., and Keusen, H.-R.: Collapse at the eastern Eiger flank in the Swiss Alps, Nat. Geosci., 1, 531–535, https://doi.org/10.1038/ngeo258, 2008. a
Peckover, F. and Kerr, J.: Treatment and maintenance of rock slopes on transportation routes, Can. Geotech. J., 14, 487–507, https://doi.org/10.1139/t77-051, 1977. a, b, c
Popescu, M. E.: A suggested method for reporting landslide causes, Bulletin of the International Association of Engineering Geology – Bulletin de l'Association Internationale de Géologie de l'Ingénieur, 50, 71–74, https://doi.org/10.1007/BF02594958, 1994. a
Rabatel, A., Deline, P., Jaillet, S., and Ravanel, L.: Rock falls in high-alpine rock walls quantified by terrestrial lidar measurements: A case study in the Mont Blanc area, Geophys. Res. Lett., 35, L10502, https://doi.org/10.1029/2008GL033424, 2008. a
Renotte, N.: ImageClassification, GitHub [code], https://github.com/nicknochnack/ImageClassification (last access: 21 October 2023), 2022. a
Rosser, N., Lim, M., Petley, D., Dunning, S., and Allison, R.: Patterns of precursory rockfall prior to slope failure, J. Geophys. Res.-Earth, 112, F04014, https://doi.org/10.1029/2006JF000642, 2007. a
Sartori, M., Baillifard, F., Jaboyedoff, M., and Rouiller, J.-D.: Kinematics of the 1991 Randa rockslides (Valais, Switzerland), Nat. Hazards Earth Syst. Sci., 3, 423–433, https://doi.org/10.5194/nhess-3-423-2003, 2003. a
Sartorius, O., Schneider, S., and Wurster, D.: Frühwarndienst und Beurteilung der aktuellen Lage, Schweiz. Z. Forstwes., 173, 144–146, https://doi.org/10.3188/szf.2022.0144, 2022. a
Sass, O.: Temporal Variability of Rockfall in the Bavarian Alps, Germany, Arct. Antarct. Alp. Res., 37, 564–573, https://doi.org/10.1657/1523-0430(2005)037[0564:TVORIT]2.0.CO;2, 2005. a
Schneider, M., Loew, S., and Oestreicher, N. K.: Rockfall monitoring with a Doppler radar on an active rock slide complex in Brienz/Brinzauls (Switzerland), Reseach Collection [data set], https://doi.org/10.3929/ethz-b-000605062, 2023. a
SLF: Abschätzung des Schneeschmelzeintrags im Gebiet der Grosshangbewegung von Brienz/Brinzauls mit Hilfe prozessorientierter Modellierungen, Report from WSL-Institut für Schnee und Lawinenforschung SLF for Büro für Technische Geologie BTG, Sargans, Amt für Wald und Naturgefahren Graubünden, Chur, unpublished, 2022. a, b, c, d, e, f
Stoffel, M. and Bollschweiler, M.: Tree-ring analysis in natural hazards research – an overview, Nat. Hazards Earth Syst. Sci., 8, 187–202, https://doi.org/10.5194/nhess-8-187-2008, 2008. a
Wyllie, D. C.: Rock Fall Engineering, in: 1st Edn., CRC Press, Boca Raton, https://doi.org/10.1201/b17470, 2015. a