the Creative Commons Attribution 4.0 License.
the Creative Commons Attribution 4.0 License.
 | 12 Oct 2023
Assessment of building damage and risk under extreme flood scenarios in Shanghai
Jiachang Tu
Jiahong Wen
Andrea Reimuth
Stephen S. Young
Min Zhang
Luyang Wang
Matthias Garschagen
This article presents a flood risk assessment for Shanghai, which provides an indication of what buildings (including residential, commercial, office, and industrial) will be exposed to flooding and its damage. Specifically, this assessment provides a risk assessment that buildings may face after construction. To achieve the flood risk assessment on buildings, we developed an integrated flood model and collected data on building shape and number of floors, land use, and construction costs for different building types in Shanghai. The extreme compound flood scenarios (-, -, -, and -year floods) and building metadata were aggregated using a risk analysis chain. According to the damage for different flood scenarios, the average annual loss (AAL) can be calculated and is referred to as building flood risk. The AAL of residential, commercial, office, and industrial buildings is USD 12.3, 2.5, 3.7, and 3.4 million, respectively. Among the 15 (non-island) districts in Shanghai, Pudong has the highest AAL. The risk analysis chain developed in this study can be reproduced for other megacities. The results provide a clear picture for future building flood risks which links directly to disaster risk management, which implies the extent of flood risk in building types, sub-districts, and districts related to the Shanghai Master Plan. This assessment takes into consideration future climate change scenarios, information for scenario-based decision making, and a cost–benefit analysis for extreme flood risk management in Shanghai. We also discussed different potential adaptation options for flood risk management.
- Article
(6328 KB) - Full-text XML
- BibTeX
- EndNote


Risk, in the context of climate change impacts as outlined in the latest IPCC report, refers to the result of dynamic interactions between climate-related hazards with the exposure and vulnerability of the affected human or ecological system to the hazards (IPCC, 2022). To be more specific, coastal cities have historically suffered and will continue to be heavily impacted by the increasing risks and effects of rising floods (Woetzel et al., 2020a; Nguyen et al., 2021; Chan et al., 2021). By 2050, over 570 low-lying coastal cities and their 800 million inhabitants will face risks from the impacts of floods and rising sea levels, causing economic losses of up to USD 1 trillion (C40Cities, 2018). Although many coastal cities are facing increasing flood risks (Liang and Ding, 2017), some will be more seriously affected than others due to local climate change impacts, high exposure, or limited adaptation capacities. One of the hot spots, which is facing high flood risks already, is Shanghai.
Compared to other coastal cities, like Dhaka, Manila, and Rotterdam, Shanghai is the most vulnerable city to flooding (Balica et al., 2012). Coupled with factors of human (population exposure and property exposure) and environmental (low-lying land, land subsidence issues, the threat of sea-level rise, frequent typhoons, and extreme precipitation) relationships, Shanghai is ranked as one of the top 20 cities for flooding in the world (Hallegatte et al., 2013; Wu et al., 2019). As an answer to this, Shanghai, the most developed financial center in China, should apply a flood risk assessment to simulate multi-flooding scenarios with integrated flood models that derive damage based on the damage of tangible economic sectors, such as architectural structures.
For Shanghai, it is necessary to consider extreme flood events, which cause dike overtopping and hinterland storage, in the flood models. Since the 1950s, hard measures like seawalls (along the Yangtze River estuary and Hangzhou Bay) and levees (along the Huangpu River) have been constructed in Shanghai (Zhou et al., 2017). However, these seawalls and levees can easily be destroyed due to their poor structures because of lower standards during the various stages of construction (Zhou et al., 2017). Only 23 % of Shanghai's seawalls can withstand a -year flooding scenario, 58 % can withstand a -year flooding scenario, while the rest can withstand less than a -year flooding scenario (Wang et al., 2012). The present protection level of the levees along the Huangpu River for the lowest sections is a -year flooding scenario (Ke et al., 2018). Meanwhile, the historical crest heights in the Huangpu River reveal a significant growing trend from 1950 to 2000, with the existing levees failing several times and leading to extensive damage (Ke et al., 2018), posing a greater threat to Shanghai. Overall, to protect Shanghai from a future failure of floodwalls and levees, extreme flood scenarios and their consequences should be taken as the first step of an integrative risk assessment.
Reviewing the current literature shows that various flood modeling techniques and flood scenarios have been developed for estimating flood risks in Shanghai. Coastal floods (storm surges from Shanghai's coast) and fluvial floods (river flooding from the Huangpu River) are the two types of floods that have been the focus of Shanghai. Coastal flood scenarios from Shanghai's coast have been forecasted for 2030 and 2050 by Yin et al. (2011), as well as 2030, 2050, and 2100 by Wang et al. (2012). These scenarios have examined the effects of factors like sea-level rise and storm surge (Yin et al., 2011) or integrated effects like sea-level rise, land subsidence, and storm surge (Wang et al., 2012). In addition to examining the effects on the Shanghai coast, Yin et al. (2013) looked at how sea-level rise and subsidence combined with storm-tide-induced river flooding in the Huangpu River floodplain for 2030 and 2050. Yin et al. (2015) used a 2D hydrodynamic model to estimate -, -, and -year flood scenarios in the Huangpu River floodplain in Shanghai based on historical floodplain data. The flood scenarios produced in most existing studies tend to focus on the possible future flood scenario changes rather than extreme events, e.g., floods over a -year return period (Yin et al., 2011; Wang et al., 2012; Yin et al., 2013, 2015). At the same time, according to the IPCC report, extreme sea-level-rise events are projected from once per century to once per year (IPCC, 2019), which could increase the frequency of future extreme flood events for coastal cities, such as Shanghai. Therefore, Shanghai demands multiple extreme compound flood scenarios that combine fluvial and coastal flooding.
The previous studies focus on simulating floods or flooding in Shanghai instead of concentrating on the overall risks. The consequences of flooding (i.e., construction damage), however, should be taken into consideration. Flood damage to buildings is noticeably a large part of total flood losses in cities (Chmutina et al., 2014; Park and Won, 2019), in addition to the often devastating human costs (Woetzel et al., 2020a). In 1997, Typhoon Winnie caused large-scale flooding in Shanghai and affected more than 5000 households (Du et al., 2020). In 2008, floods damaged 160 streets and 13 000 residential buildings in Shanghai. Therefore, local communities and government departments are increasingly calling for holistic analyses of possible building damage under extreme flood scenarios to accurately understand and assess potential flood impacts (Kelman and Spence, 2004). To estimate building stock and its value at risk under a -year extreme flood scenario, Wu et al. (2019) integrated census-level building floor-area data and geo-coded building asset value data. Shan et al. (2019) further assessed the flood losses of residential buildings and household properties in Shanghai based on a stage–damage function, building footprints, and housing prices. Deeper investigations into the uncertainties (e.g., asset values, damage rate, and flood process), with reliance on flood risks and damage to buildings (e.g., residential, commercial, office, and industrial), are urgently needed to better support decision making, which enhances the overall flood resiliency of the city.
To address these questions, we adopted the extreme flood scenarios with return periods of , , , and years representing a low-probability, high-impact scenario. The four extreme flood scenarios are assumed as combined effects of several flood-triggering factors, such as typhoon-induced storm surge, precipitation, and fluvial flooding in combination with a high astronomical tide, to reflect low-probability, high-impact flood situations in Shanghai. The objective of this paper is to assess flood risk and its pattern of damage to residential, commercial, office, and industrial buildings under extreme flood scenarios in Shanghai. To achieve this objective, we modeled building inundations at four extreme flood scenarios with return periods of , , , and years, respectively. Combining the inundation maps with the stage–damage functions, the study evaluated and identified the spatial distribution of damage for the specific types of buildings in Shanghai. Section 2 of the paper introduces Shanghai, the study area. Section 3 describes the details of the materials and methods, and Sect. 4 presents the data analysis and major results of the study. Section 5 discusses future flood scenarios and proper adaptation strategies for building a flood-resilient Shanghai. The conclusions are described in Sect. 6.
Shanghai is the largest coastal city in China in terms of population (24.3 million in 2019) and is the major trading and financial hub of China. The city has an area of 6340.5 km2 that lies in the Yangtze River Delta along the northern edge of Hangzhou Bay (Fig. 1). Shanghai is prone to flooding because of its flat low-lying terrain, as well as its location on the path of frequent typhoons from the northwest Pacific (Balica et al., 2012). Moreover, the city has experienced an average land subsidence of 1.97 m from 1921 to 2007, and the trend is continuing (Gong and Yang, 2008), additionally driving flood risks (Quan, 2014).
Concerning the built environment, according to the Shanghai Statistical Yearbook, USD 29.1 billion (CNY 183.4 billion) has been invested in architectural construction in Shanghai which includes residential buildings (USD 15.3 billion), office buildings (USD 4 billion), commercial buildings (USD 4 billion), and others (USD 5.8 billion) in 2019 (SMBS, 2020).
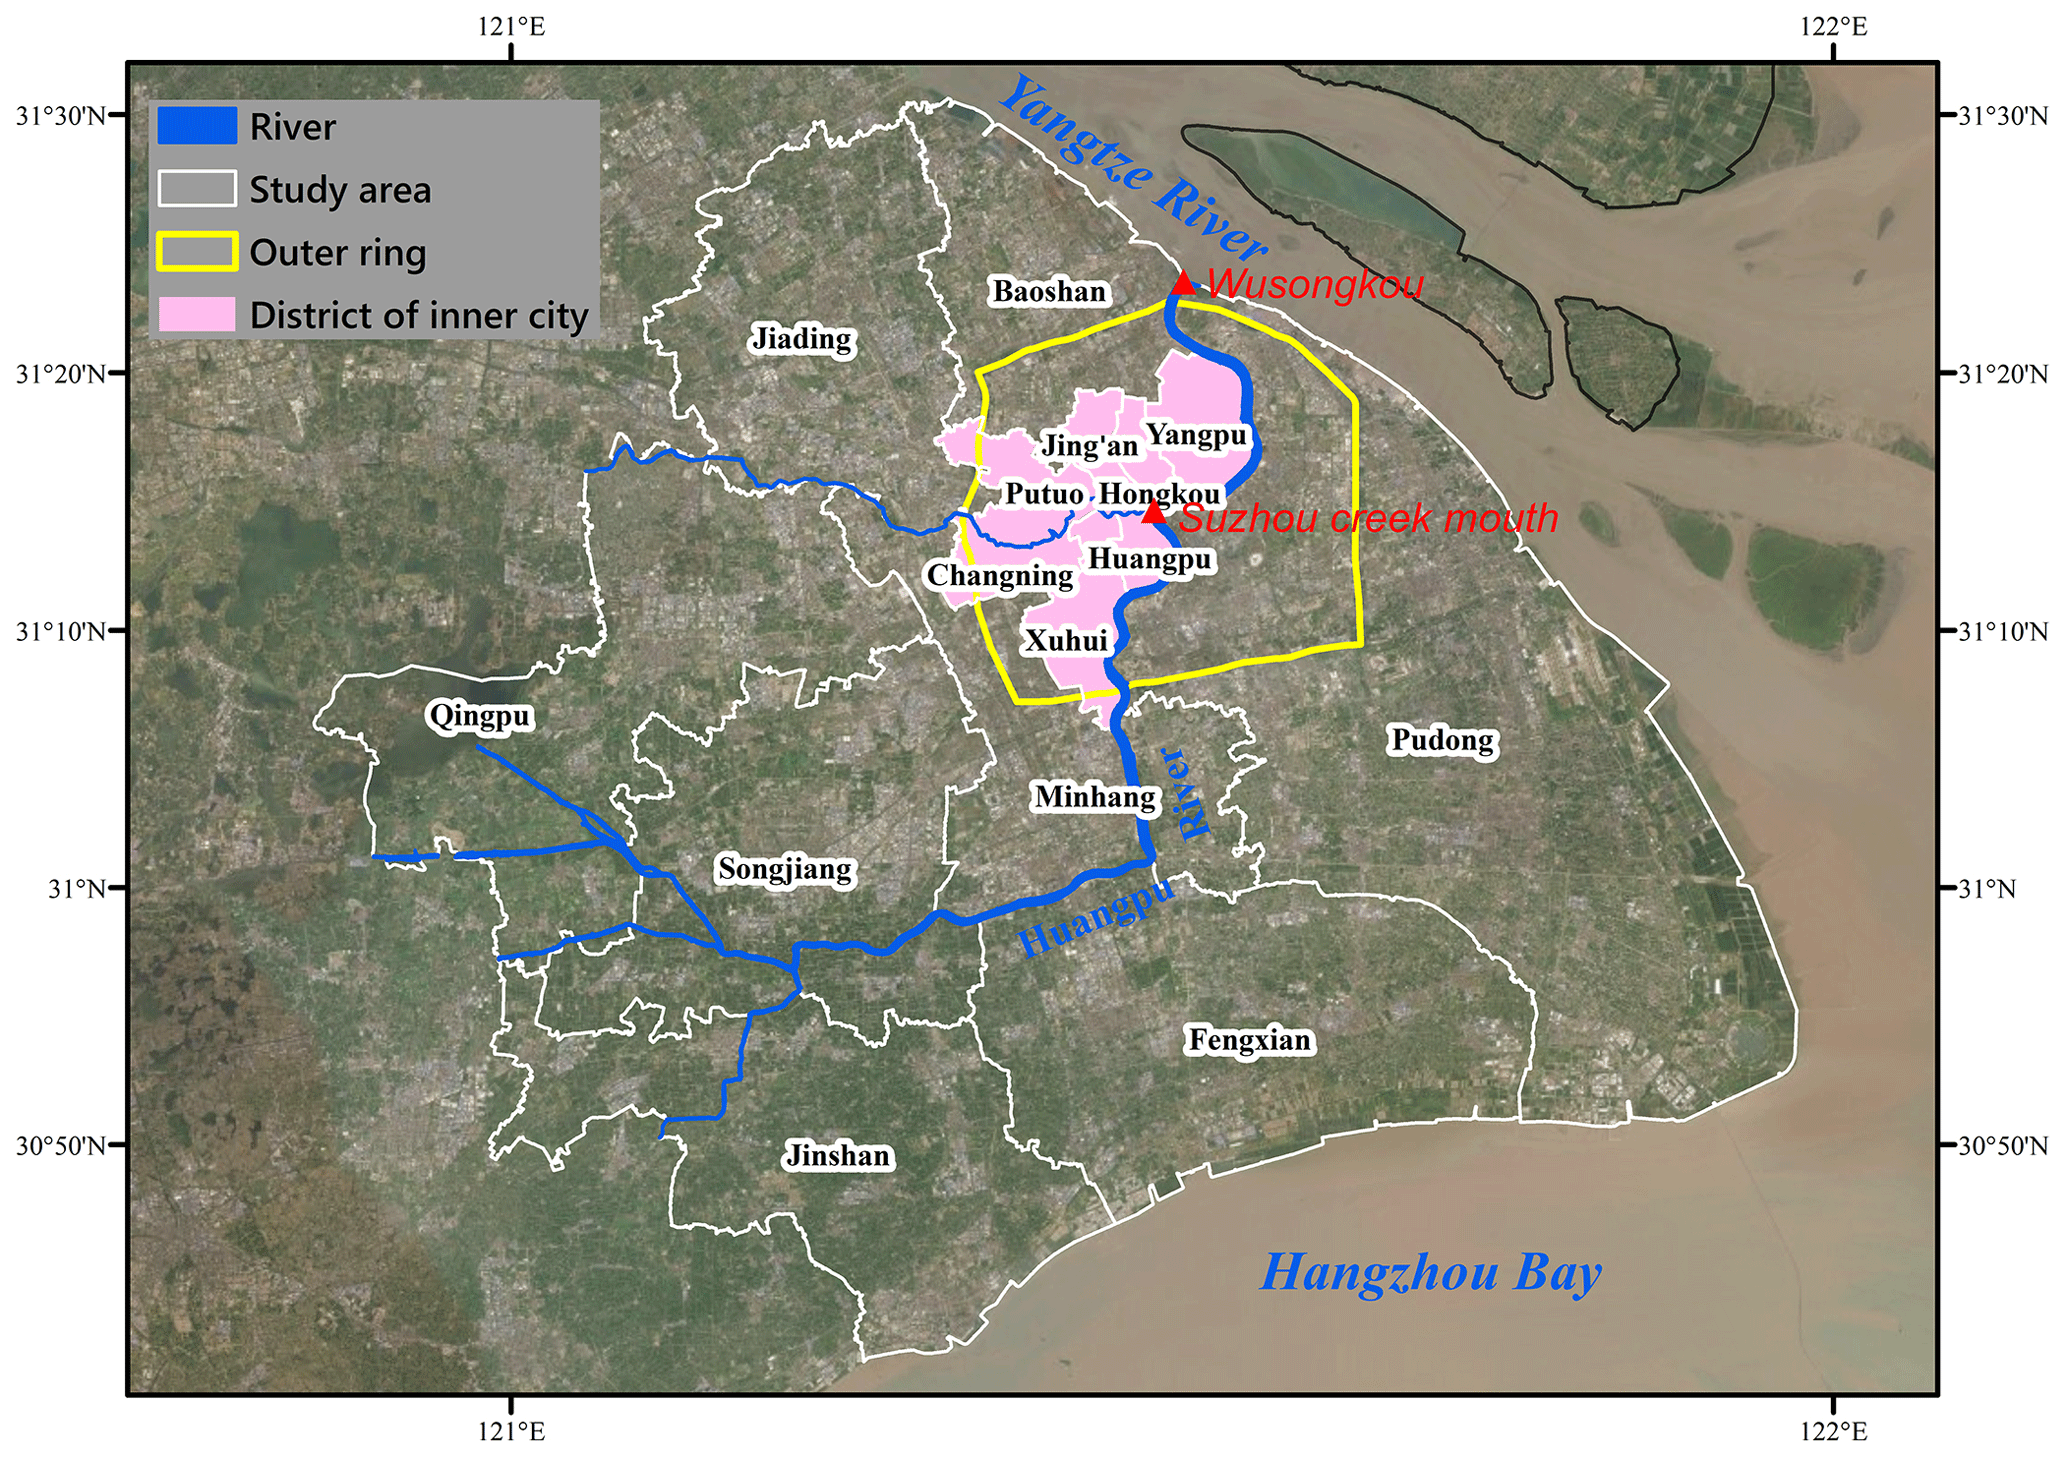
Figure 1Satellite-image-based map of the study area (Shanghai's 15 districts, excluding the city's islands) (the satellite image background is from Esri).
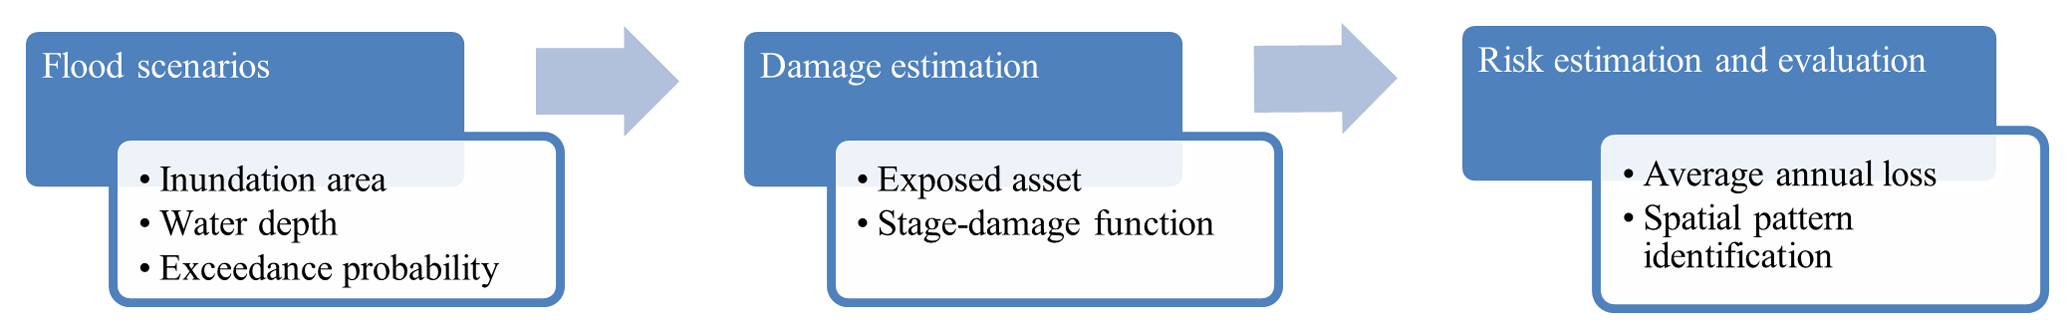
In our study, the flood risks in Shanghai are estimated using three different steps (Fig. 2). First, extreme flood scenarios with a return period of , , , and years are simulated by an integrated flood model. This was done in a previous work by Wang et al. (2019). Second, our study builds upon these results and estimates the damage based on the obtained flood hazard scenarios. Third, the overall flood risk and its spatial pattern for buildings in Shanghai is described as the estimated average annual loss (AAL). More details of the assessment are introduced in the following Sect. 3.1 to 3.3.
3.1 Flood scenarios
The flood scenarios build on the results of Wang et al. (2019), who used an integrated flood model to simulate compound flooding in Shanghai that included fluvial and coastal flooding. Four scenarios with return periods of , , , and years were simulated considering atmospheric conditions, oceanic/coastal environments, and river discharge.
For this purpose, the integrated model has applied and coupled several models in three stages. In the first stage, the Fujita model provides the atmospheric conditions on the northwestern Pacific Ocean (from 100–180∘ E longitude, 0–60∘ N latitude). The Fujita model computed and simulated Typhoon Winnie's wind direction, speed, press, and boundary layer. Typhoon Winnie was a typical turning-track typhoon, bringing the highest recorded water level of 5.72 m in Shanghai since 1900 (Dong et al., 2022). Typhoon Winnie wind data came from the European Centre for Medium-Range Weather Forecasts (ECMWF). In the second stage, atmospheric conditions were integrated with the TELEMAC model, which provides the oceanic/coastal environment on the Yangtze River Delta (from 120–124.5∘ E longitude, 28–34∘ N latitude). The TELEMAC model simulates the hydrodynamic and morphodynamical processes in oceanic/coastal environments including shallow water horizontal flows and waves from the Pacific Ocean (Hashemi et al., 2015). The first two stages prepare the parameters for the coastal flooding from Shanghai's coast. In the third and last stage, the atmospheric and the oceanic/coastal condition are integrated with the MIKE model, which simulates the river discharge in the study area. Rainfall and river discharge measurement data from Typhoon Winnie were implemented in the MIKE model. The MIKE model is applicable to the simulation of hydraulics for fluvial flooding from the Huangpu River (MIKE, 2017).
Our model offers Shanghai extreme compound flood scenarios with an inundation area and depth at a resolution of 60 m. These extreme compound flood scenarios are being shown for the first time in Shanghai with -, -, -, and -year return periods.
3.2 Damage estimation
3.2.1 Asset value of buildings
From Baidu Maps (Baidu Maps, 2018), the data for Shanghai's buildings were acquired using a Python-based web crawler and then processed with ArcGIS software. Baidu Maps provide various map services, such as satellite images, street maps, and route planners in China. The shapefile data for Shanghai's buildings include information on building type, building ground-based area, height, and the number of floors for each building. The data on Shanghai's buildings are combined with land-use data to further cluster the buildings into four different types including residential, commercial, office, and industrial.
The land-use data of 2013 from the Shanghai Planning and Land Bureau were categorized hierarchically into 3 sectors, 15 subcategories, and 73 subclasses of land-use types using ArcGIS 10.6.1. The reclassification of the land use was conducted according to the National Standard of China “GB/T 2010-2017” (CSP, 2017) and covers the residential area, commercial area, office area, and industrial area. The land-use type of residential area covers apartments, mixed apartments, rural housing, and empty housing. Office areas include land for medical care and health, charity, education, culture, government, research, market, and insurance.
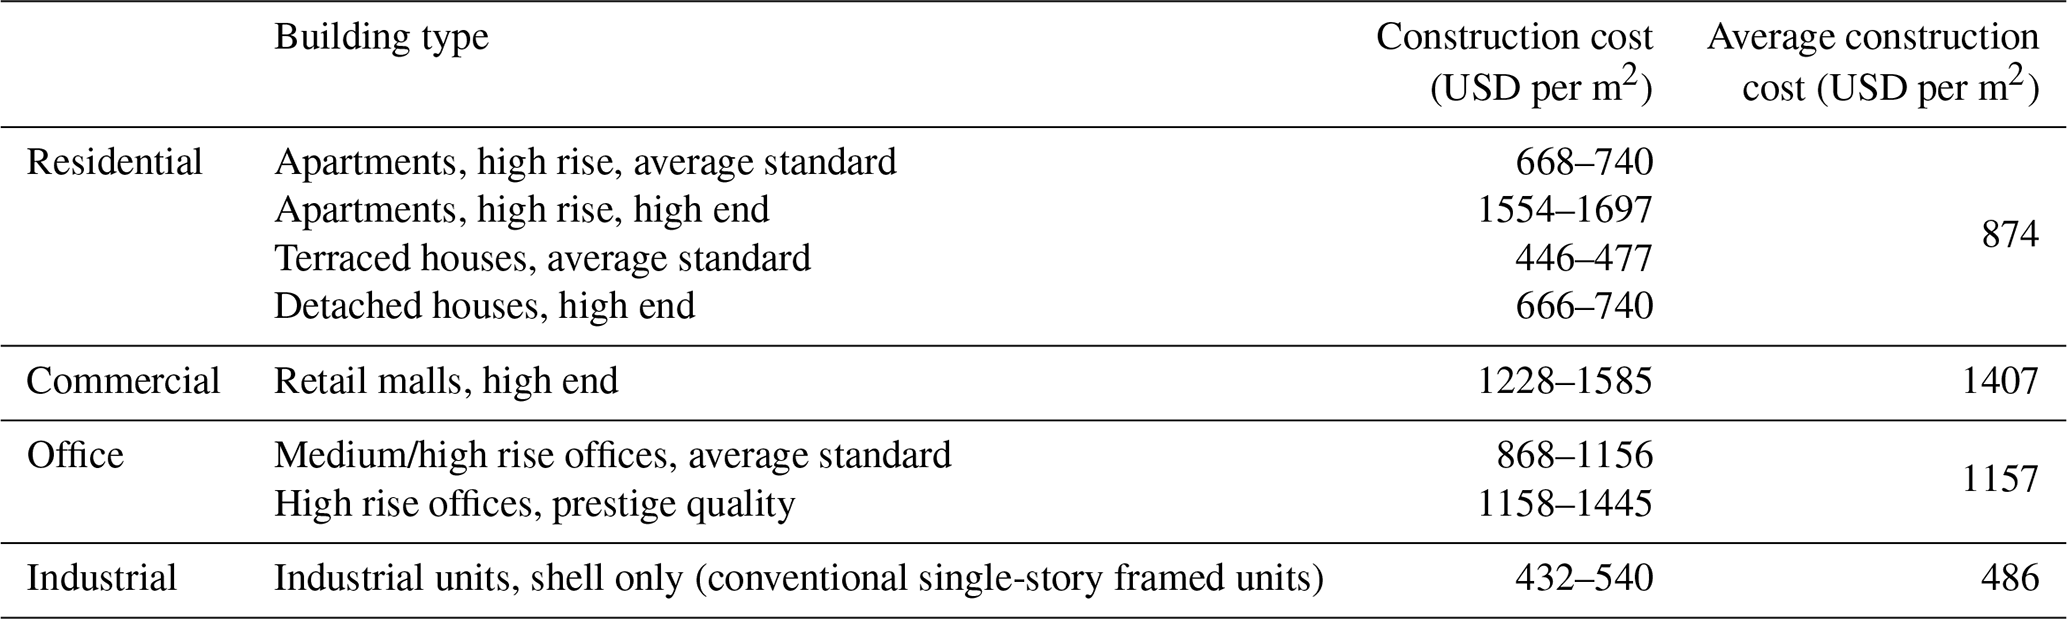
The cost data of building construction used in this study are derived from the 2019 annual report provided by the consulting company Arcadis in Shanghai. The dataset depicts five different building types (domestic, office/commercial, hotels, industrial, and other), which are further divided into 19 subsectors (Arcadis, 2020). Due to the lack of details about the architectural construction, the construction costs of various buildings are equally weighted (Table 1). The average construction cost is derived from the average number of construction costs in the four different building types.
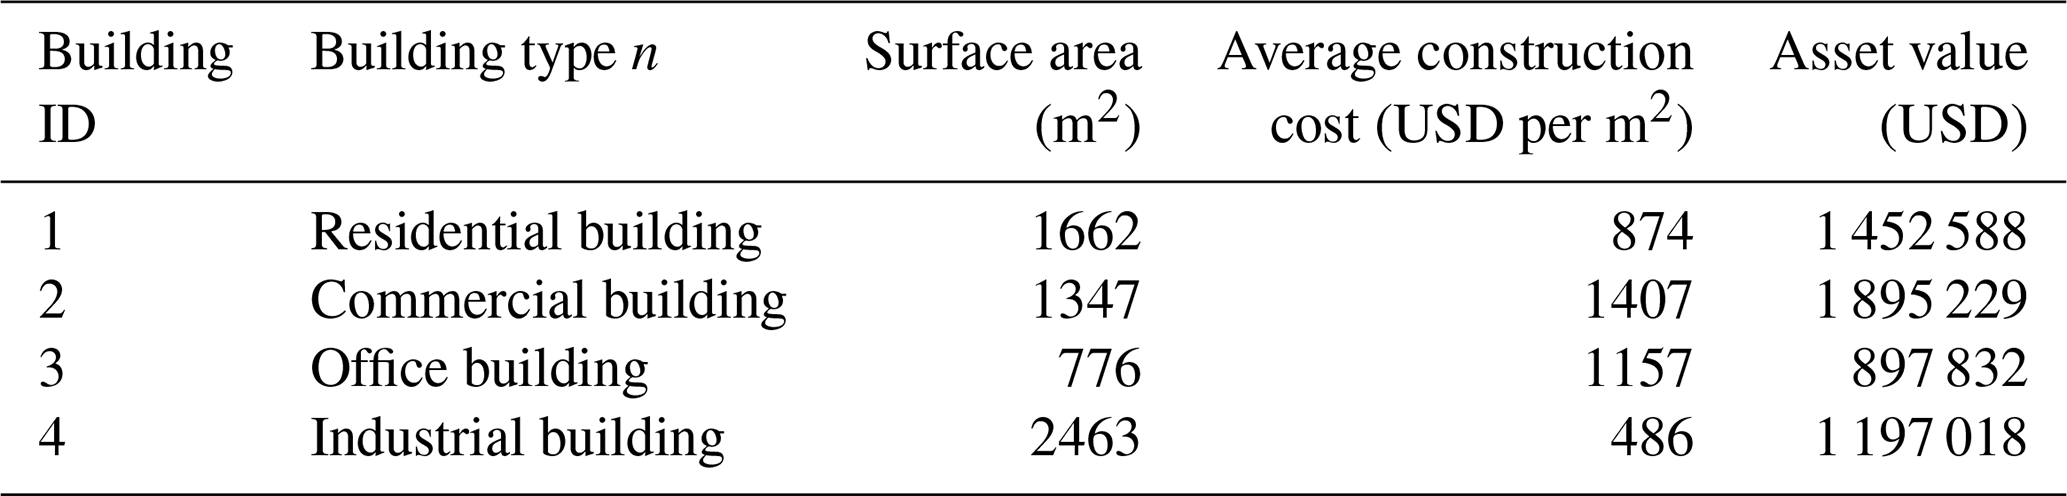
Different methods exist in the determination of building values. According to the Chinese National Standard (GB/T 50291-2015) and previous studies, there are four main approaches to evaluating the asset value of buildings: method of the sales comparison, method of the income capitalization, method of the construction cost, and method of the hypothetical development (CSP, 2015). The application of different methods depends on the aims of a specific study and the availability of building-specific data. Sale comparison is often used when the evaluation of a similar type of building is available, whereas income capitalization is suitable for buildings that yield profits like rent. If a building is newly constructed or (to be) reconstructed after damage, the method of construction cost would be suitable for the evaluation. The method of hypothetical development is applicable to the evaluation of real estate with investment development or redevelopment potential. Since the present study aims to assess flood damage to buildings, the construction cost method is used with consideration of the building surface area. Then, the asset value of one building can be approximated by the following function:
where Wn (USD) is the asset value for one building which belongs to the building type n, Sn is the surface area of building n, and Pn is the average construction cost (USD per m2) for the specific type of building n. The surface area is the whole construction area (including wall area and floor area).
Table 2Examples of building asset value for the four selected building types.
3.2.2 Evaluation of building damage in flood
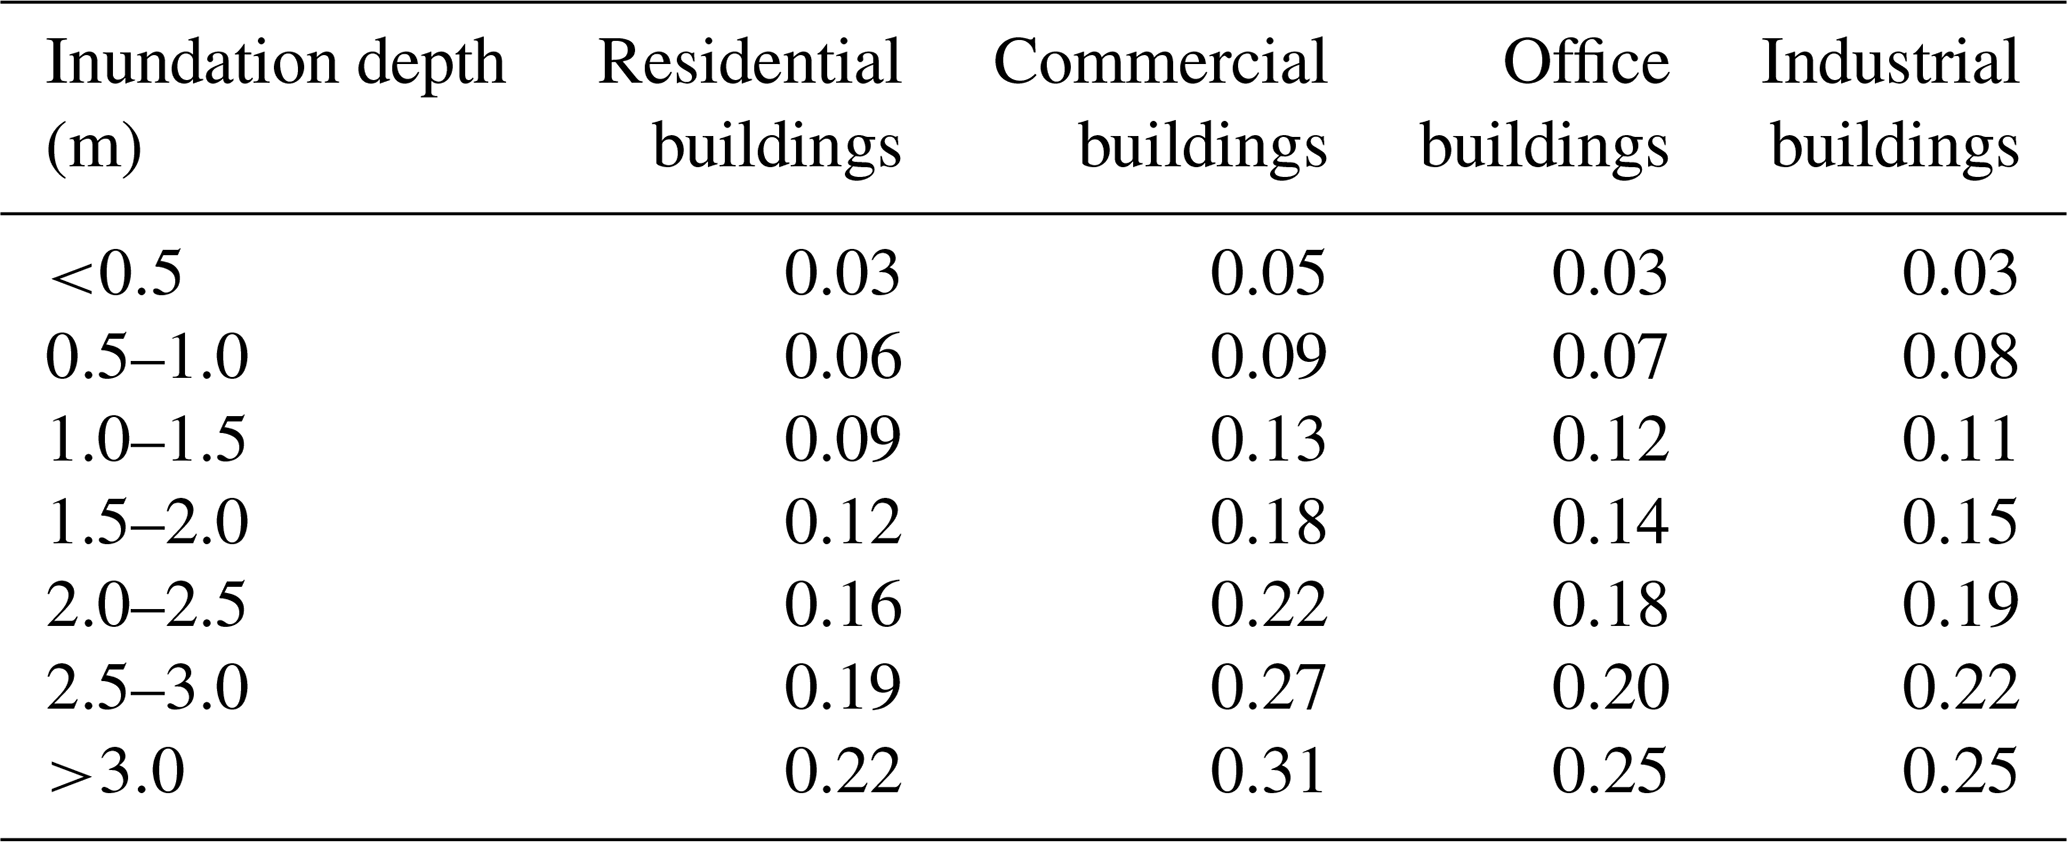
The relationship between flood inundation depth and the flood damage of a building or other property is depicted by a stage–damage function (Garrote et al., 2016; McGrath et al., 2019). In this study, the stage–damage functions are adapted from existing studies on the relationship of various building damage rates with water-level depth in Shanghai (Ke, 2014). Based on actual building damage data from past flood hazard events and previous empirical stage–damage functions in Shanghai (Yu et al., 2012; Wang, 2001), Ke (2014) developed updated stage–damage functions for specific buildings in Shanghai. The stage–damage function is used to evaluate the damage values of residential, commercial, office, and industrial buildings with the probability of -, -, -, and -year extreme flood scenarios, respectively. As shown in Table 3, the stage–damage functions represent the average damage in dependency of the inundation depth for the four adopted building types. If the building is flooded at a depth of more than 3 m, we assume that the exposed area covers two floors instead of one.
Table 3Selected stage–damage functions for the study area (adapted from Ke, 2014).
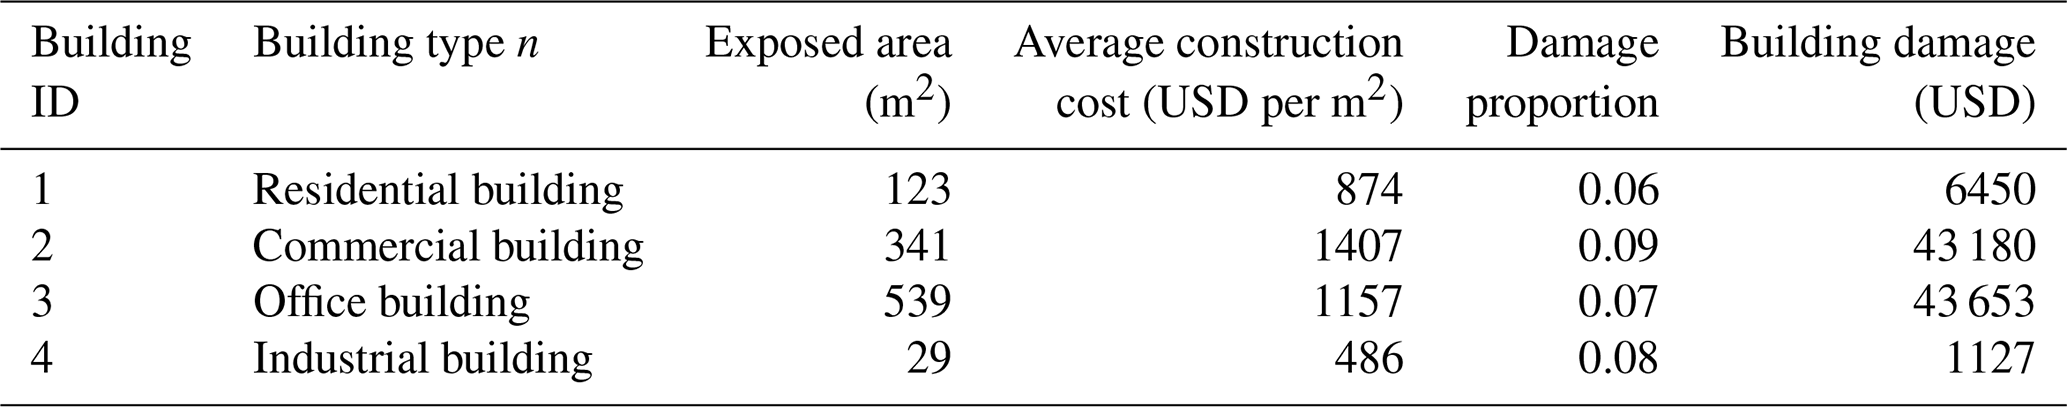
The damage values of one building can be expressed by the following function:
where Dn represents building damage for building type n, En represents the exposed area of buildings for building type n, Pn represents the construction cost (USD per m2) for the specific type of building n, and Tn represents the damage proportion from stage–damage function for the building n under different water-level depths.
Table 4Examples of damage values for the four building types at an inundation level of 0.5–1 m.
3.3 Risk determination and evaluation
When expressing city-scale flood damage for different flood scenarios, we use the already well-established economic AAL (Hallegatte et al., 2013). The AAL is the sum of the probabilities of floods for each return period, while considering the approximate areas under the associated risk curve (Ward et al., 2011). In the present study, we considered only the damage value of buildings as a major part of the AAL. Particularly, the AAL represents the integrative building damage for all types of buildings in all the considered flood scenarios in Shanghai. Hence, we get the AAL values for different exceedance probabilities (extreme flood scenarios) as the sum of
where x is the return period of the flood scenario, and f(x) is the damage value of a single type of building.
The AAL of all sub-districts and their neighbors were compared with the AAL by Getis-Ord Gi* in ArcMap 10.6. The Getis-Ord Gi*, also known as “the hot-spot analysis”, measures the strength of spatial autocorrelation and tests the assumption of independence between surrounded features (Manepalli et al., 2011). According to the Getis-Ord Gi*, when a feature has a positive value and intense clustering of high values, the feature corresponds to a hot-spot cluster, and when a feature has a negative value and intense clustering of low values, the feature corresponds to a cold-spot cluster. The results contain a larger range of high values (hot spots) and low values (cold spots). In our study, hot spots mean that the flood risk of a sub-district has a high AAL value, is surrounded by other sub-districts with high values, and has a higher risk for extreme flooding. Cold spots indicate an opposite situation.
4.1 Mapping the flood scenarios
The four extreme flood scenarios provide a comparison of the spatial distribution of inundation areas (Fig. 3). The inundation areas increase generally, but non-linearly, along with increasing return periods. As shown in Fig. 3, the inundation areas mainly concentrate in regions around the Wusongkou (the mouth of Huangpu River), the Suzhou creek mouth (central Shanghai), the Songjiang–Qingpu low-lying area, and the north bank of Hangzhou Bay. The inundation areas expand to inland areas from the coastal region and the rivers as the flood scenario becomes more extreme. For the -year flood scenario, 9 % (488 km2) of Shanghai is flooded, mainly along the north bank of Hangzhou Bay. The flooded area of Shanghai increased to 16 % (868 km2) and 24 % (1302 km2) in the -year and -year flood scenarios, respectively. The flooded area extends significantly to 49 % (2659 km2) of Shanghai in the -year flood scenario. More specifically, in this exceptionally extreme scenario, 32 % of the city would be flooded with a water depth of 0–0.5 m, 11 % with a 0.5–1.0 m depth of water, and 5 % with a water depth of more than 1 m (Fig. 3).
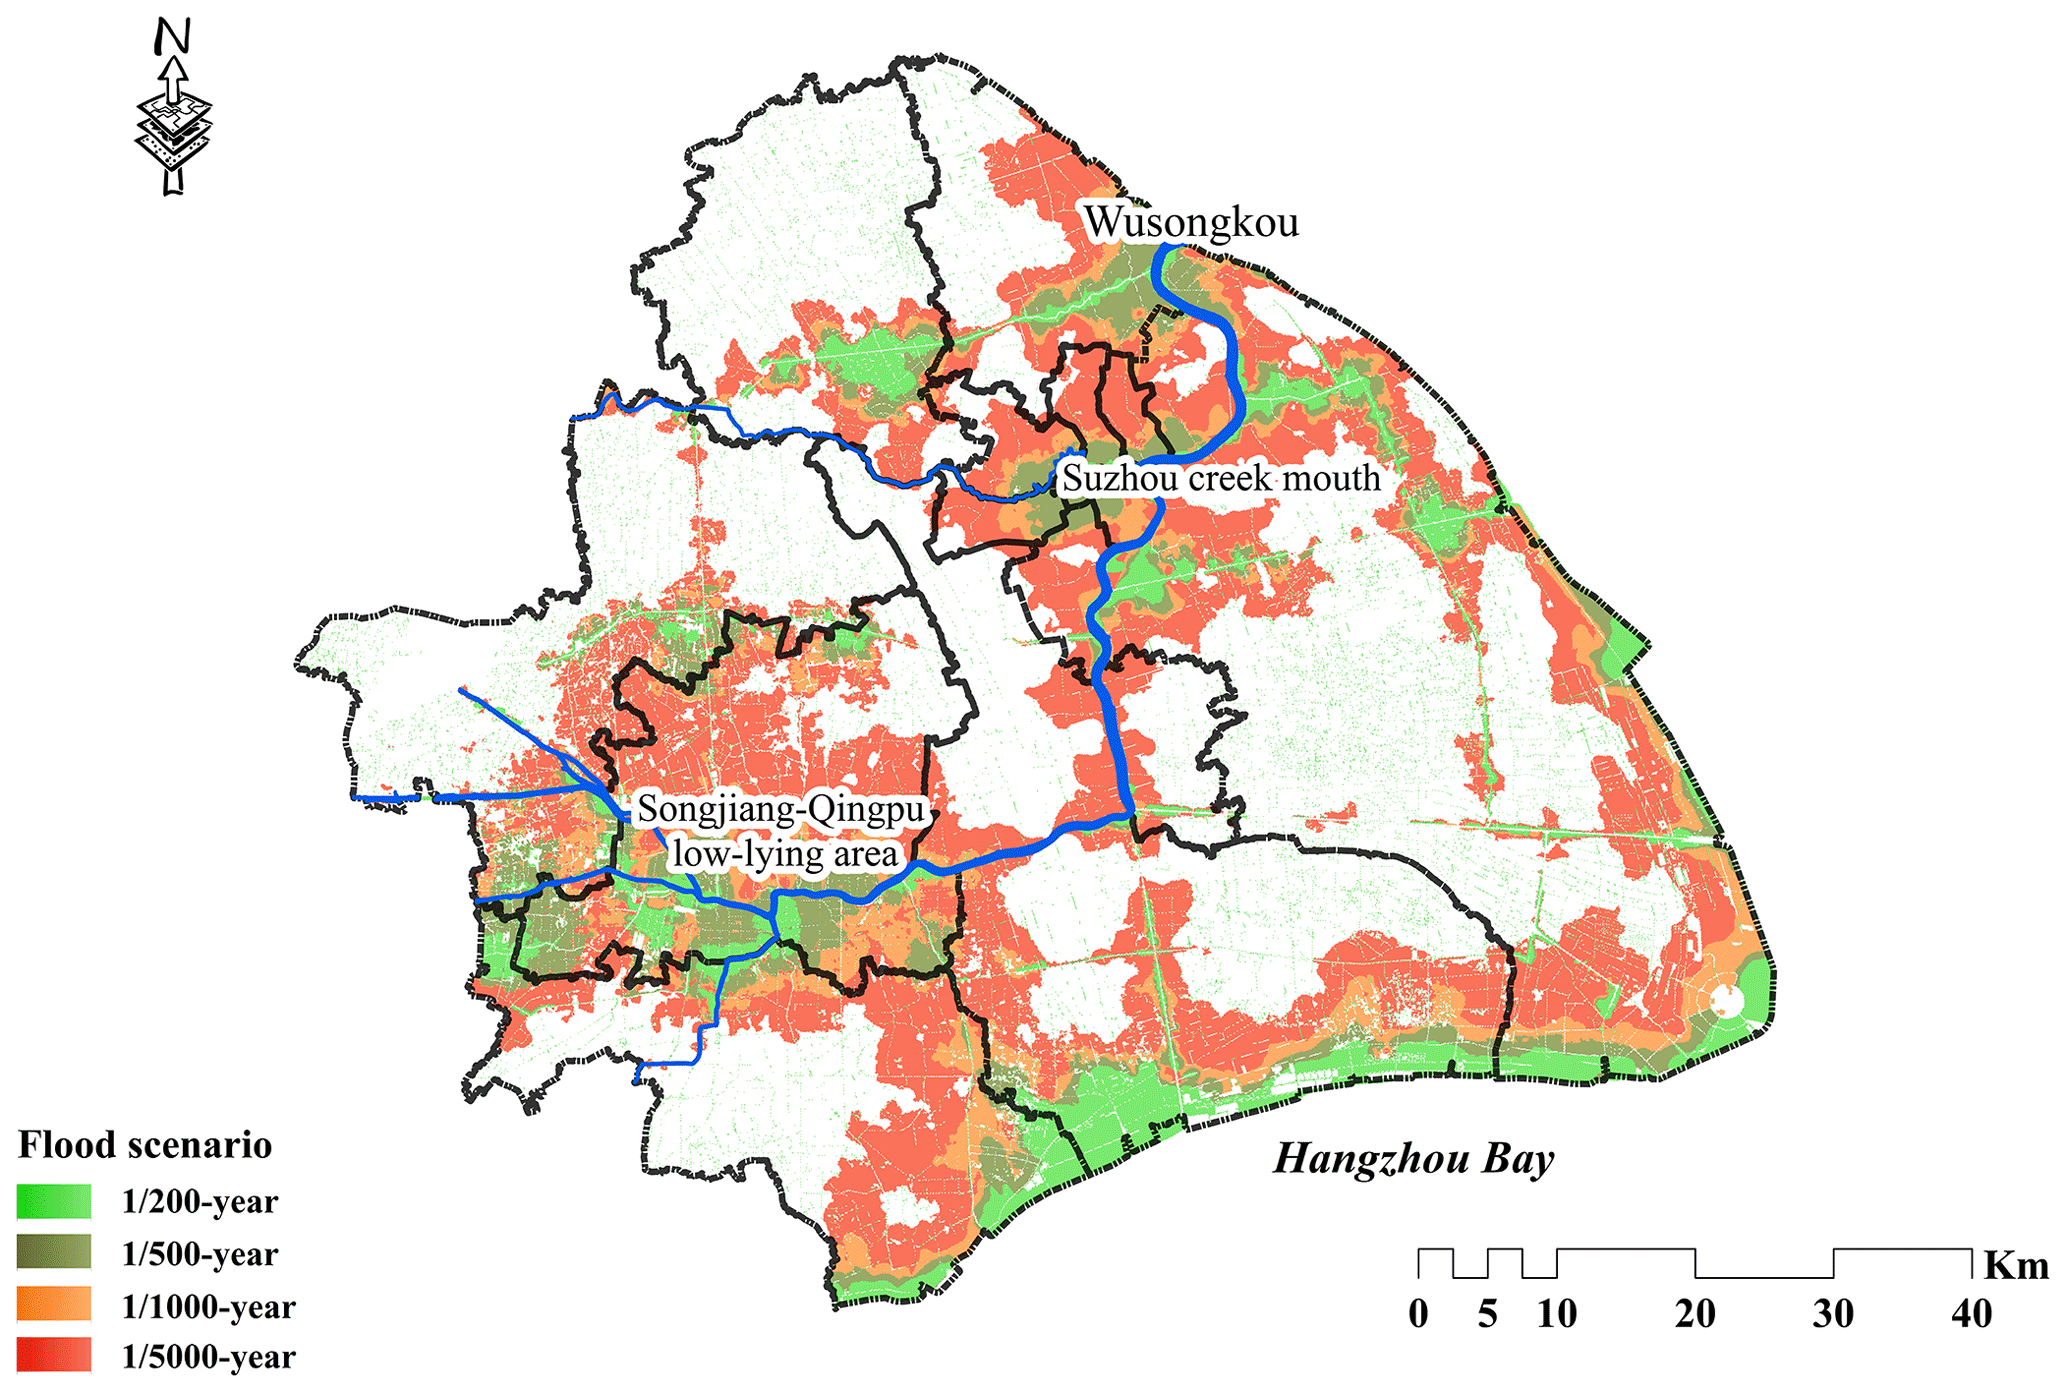
Figure 3Inundation areas for the four flood return periods in Shanghai (excluding the area of the islands).
4.2 Estimating the building damage
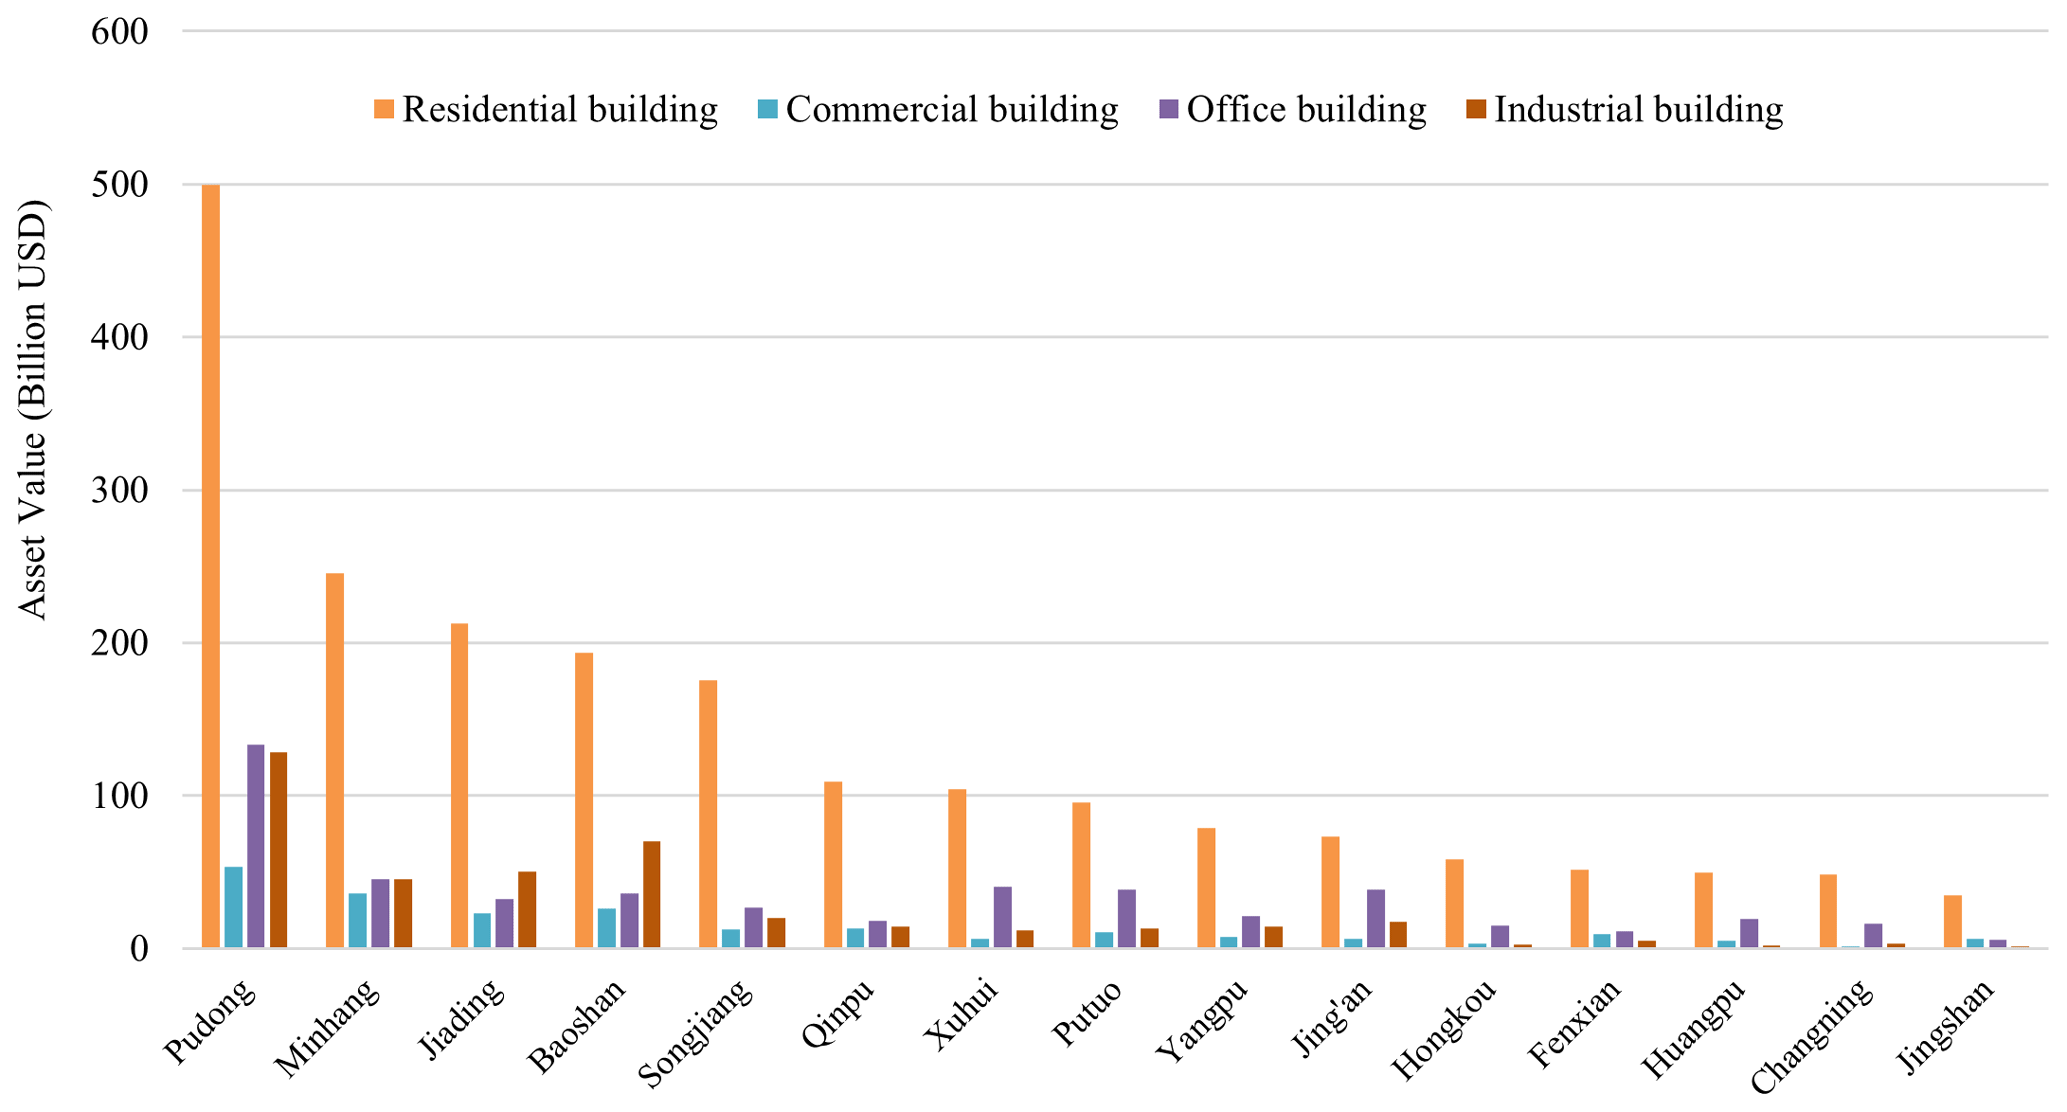
This study identified the building surface area of each type of building in 2017, which amounts to 2323, 157, 430, and 824 km2, respectively, for the residential, commercial, office, and industrial buildings. This is a conservative estimate, as the actual present values of the buildings are certainly higher due to new developments in recent years. Every single building's asset value has been computed using Eq. (1), allowing us to obtain the building asset values in residential, commercial, office, and industrial buildings. According to Eq. (1), the building asset values in Shanghai are USD 2030, 221, 497, and 401 billion considering the average construction cost (see Table 1) of each building type in 2019. The relative numbers show that residential buildings have the highest asset value, followed by office, industrial, and commercial buildings. While comparing the building asset values in the 15 districts, the Pudong district has the highest asset value (Fig. 4), as it is the largest district in Shanghai. Our estimate for the building assets underpins the importance of quantifying the value of architectural construction in Shanghai, along with the value of damaged architectural construction.
The quantitative assessment provides maps of flood damage to different buildings under the four extreme scenarios (Table 5). The total building damage in the -year flood scenario is USD 15 billion, which is more than 13 times the -year flood scenario (USD 1.18 billion). Again, residential buildings are the most damaged in all four scenarios, with a damage value of up to USD 8.2 billion in the -year scenario. Damage of industrial buildings, office buildings, and commercial buildings would reach USD 2.6, 2.8, and 1.6 billion, respectively, under the -year flood scenario.
Table 5Damage statistics for residential, commercial, office, and industrial buildings exposed to extreme flooding under the four return period scenarios in Shanghai's 15 (non-island) districts (unit: billion USD).
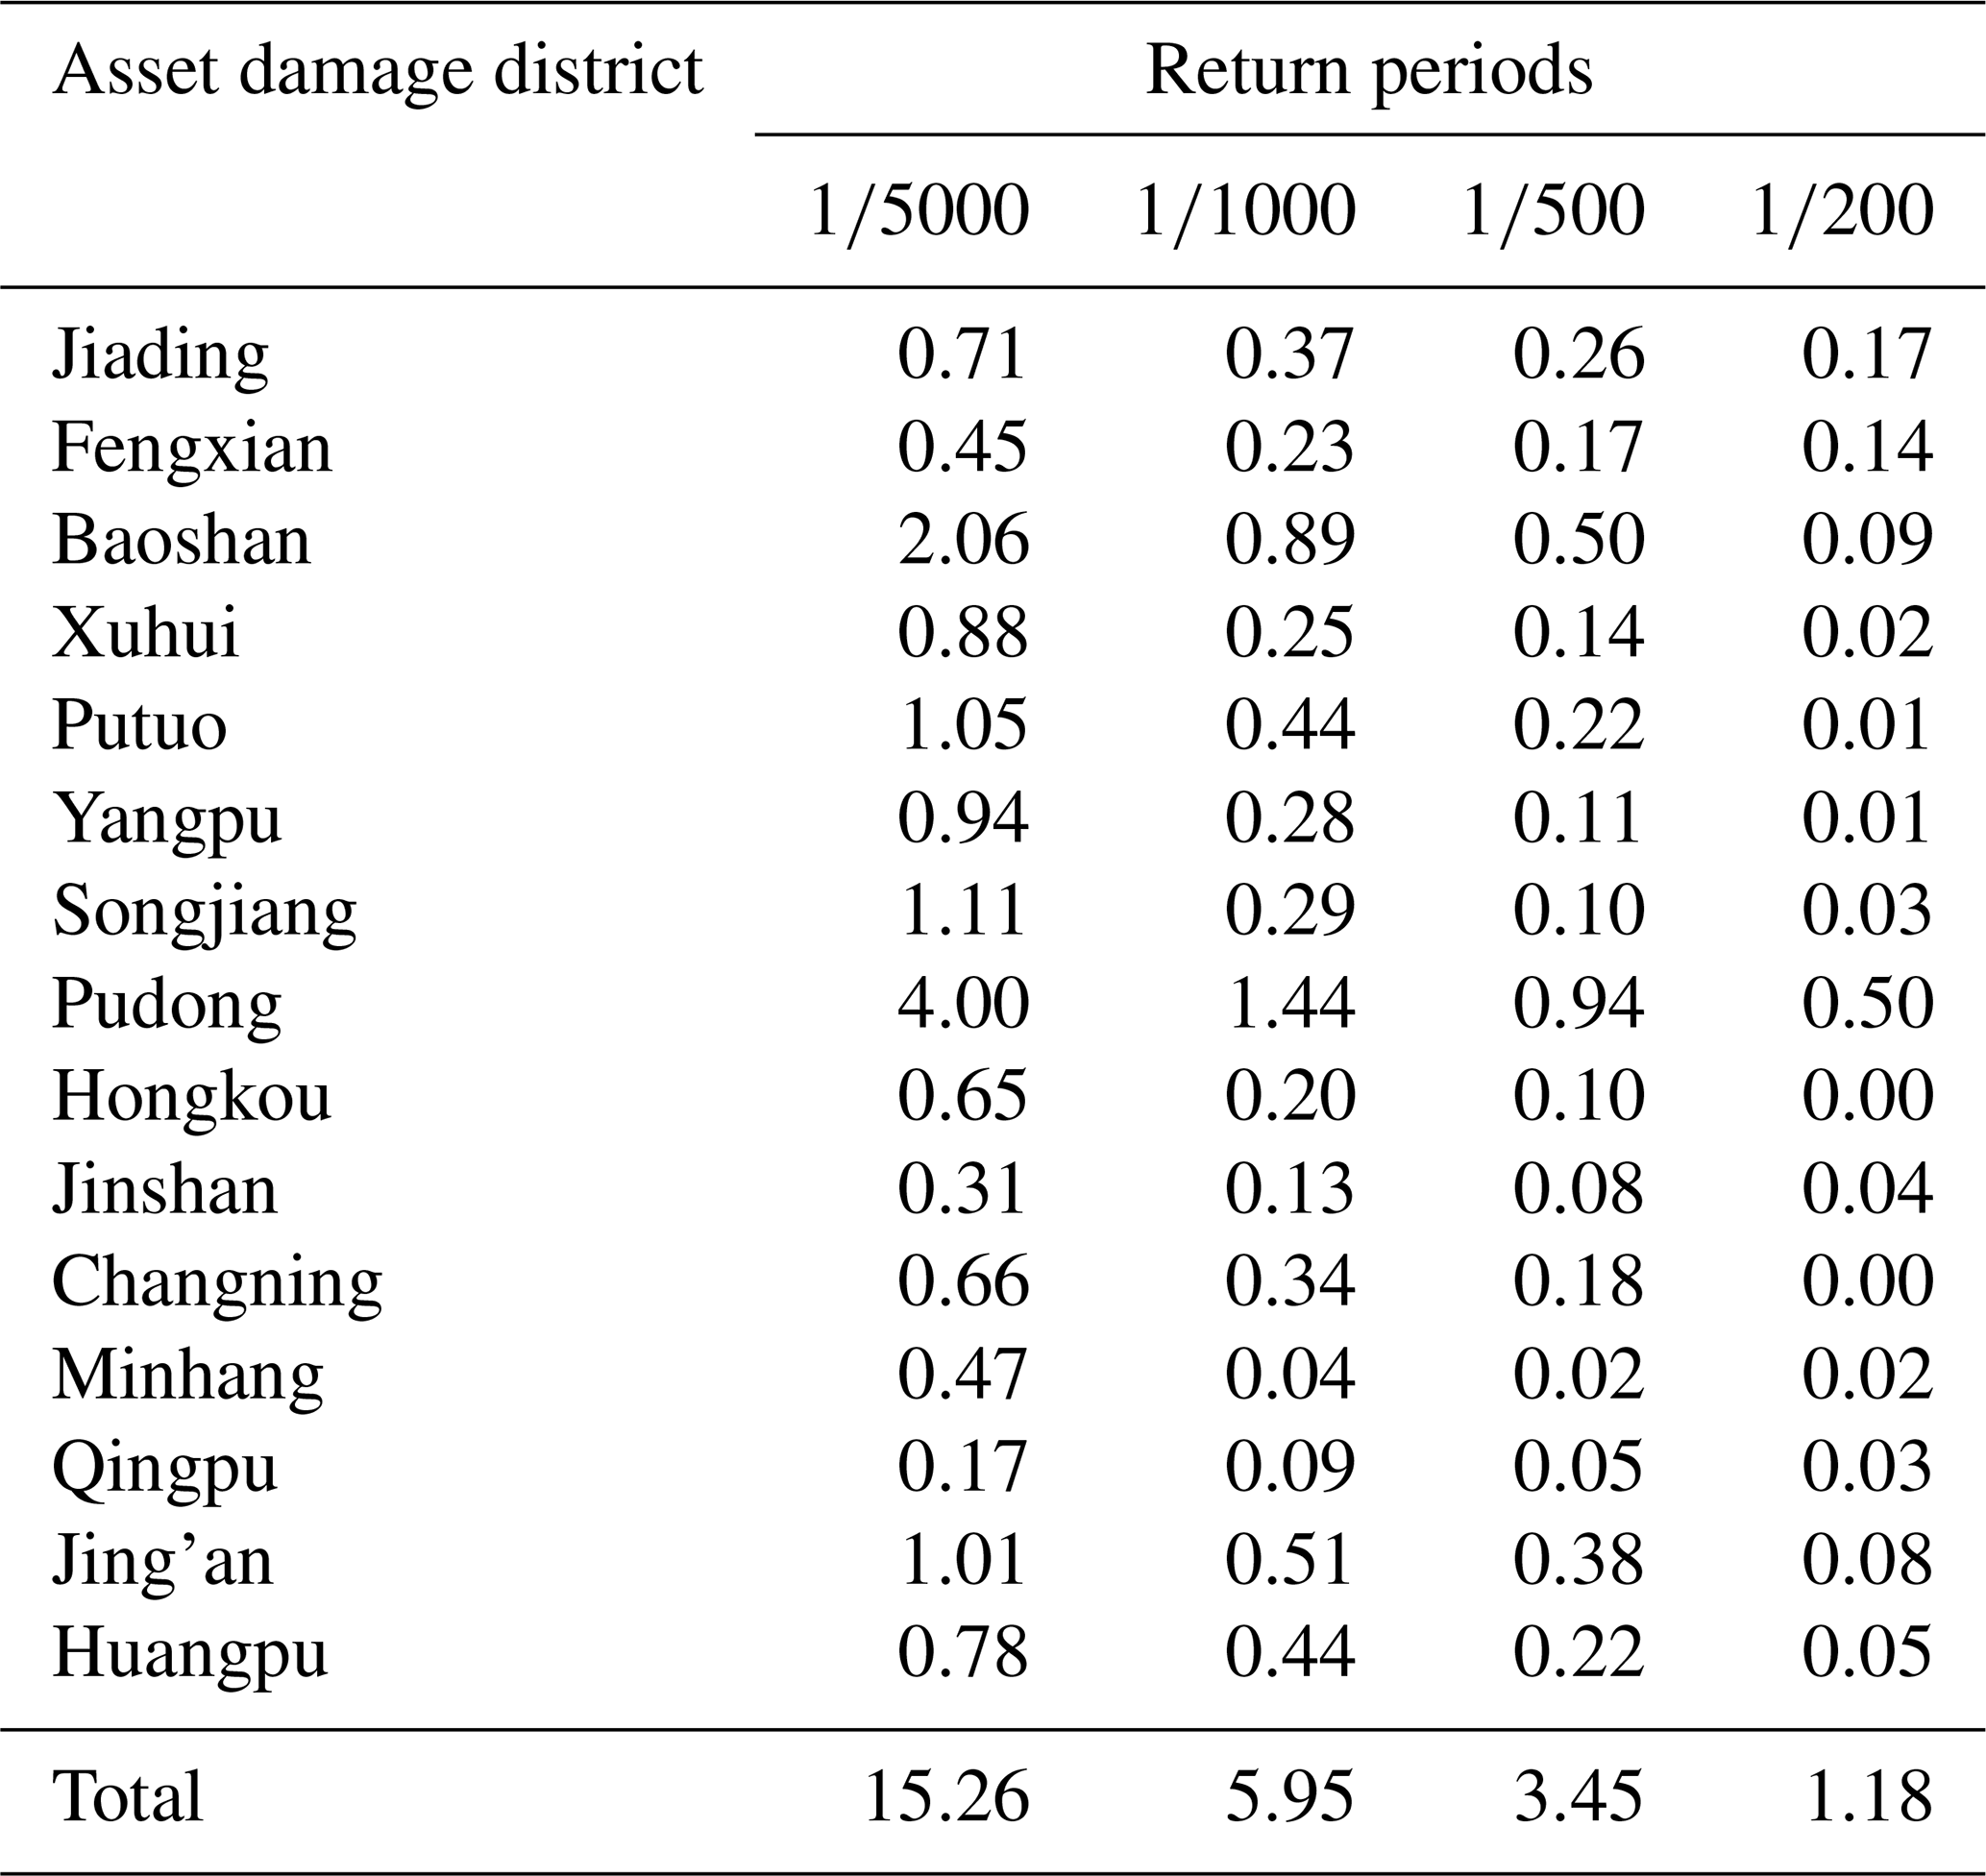
The damage analysis of different districts shows that Pudong has the highest overall damage in all scenarios (Table 5). However, the rankings of the proportion of damage are different. For the -year scenario, Fengxian has the highest proportion of asset damage. Jing'an has the highest damage proportion in the -year scenario, while for the - and -year scenarios, Huangpu is the district with highest proportion of asset damage (Fig. 5).
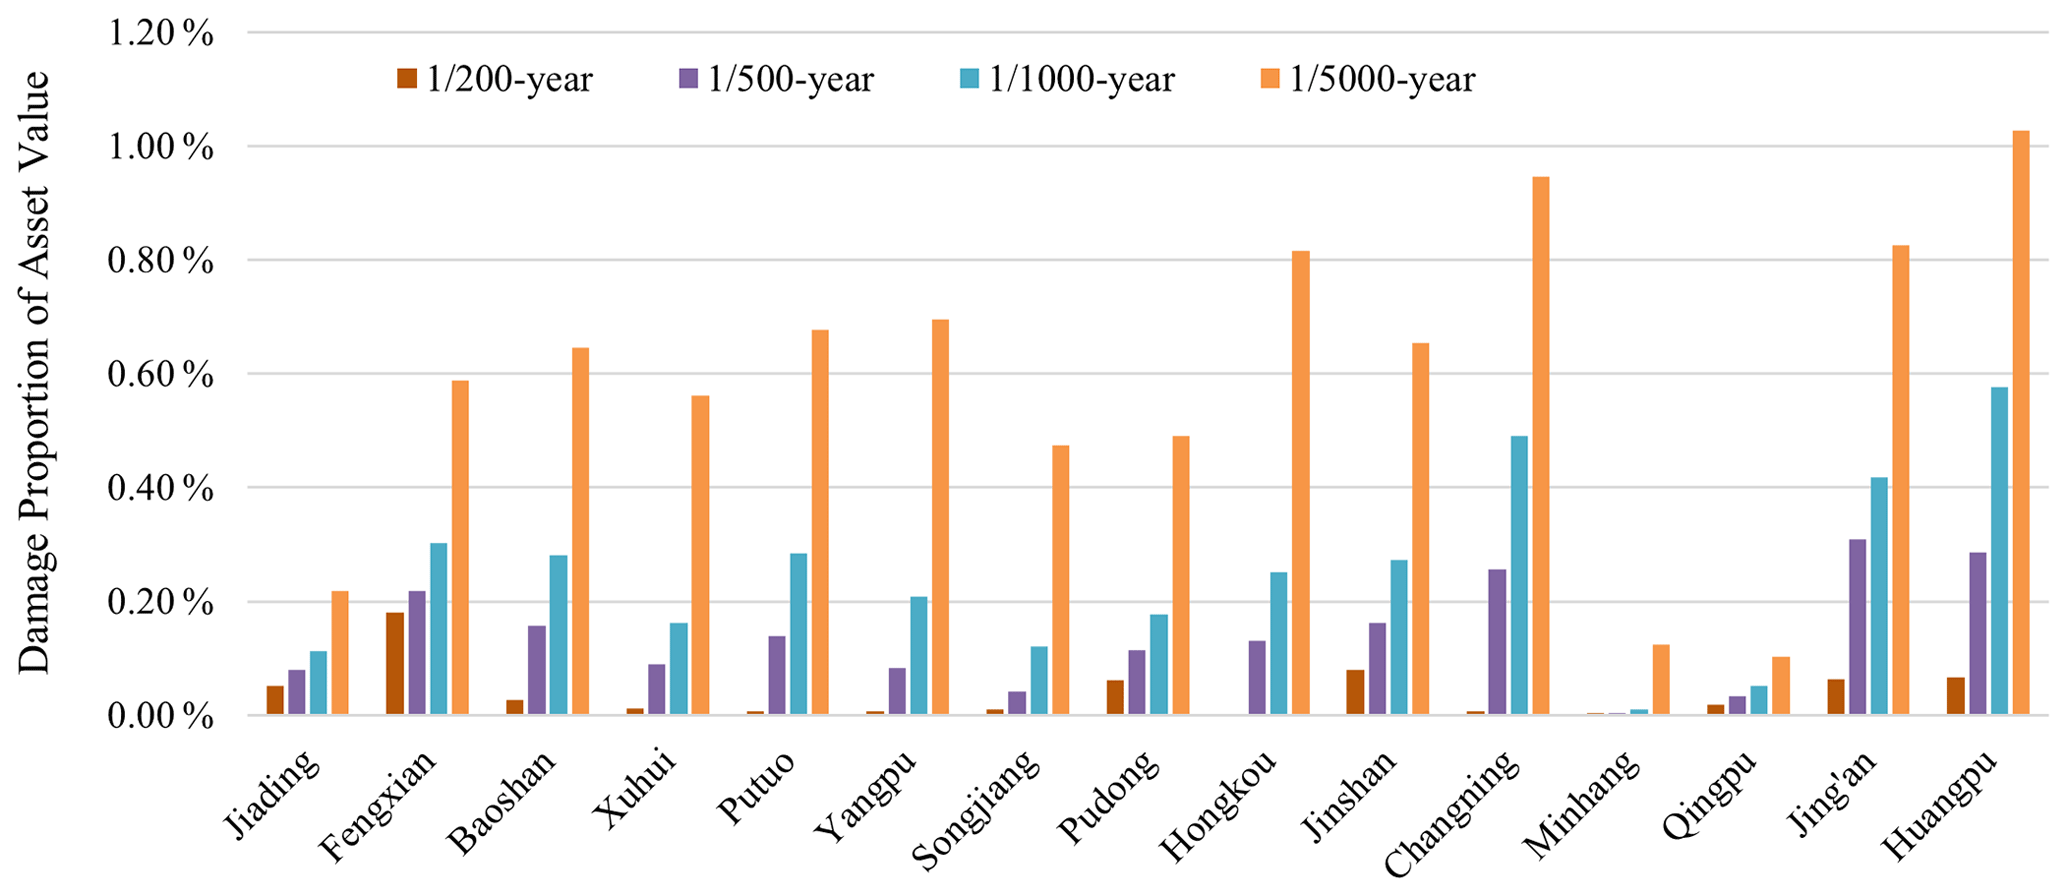
Figure 5Damage percentages of residential, commercial, office, and industrial buildings to extreme flooding under the four return period scenarios in each district.
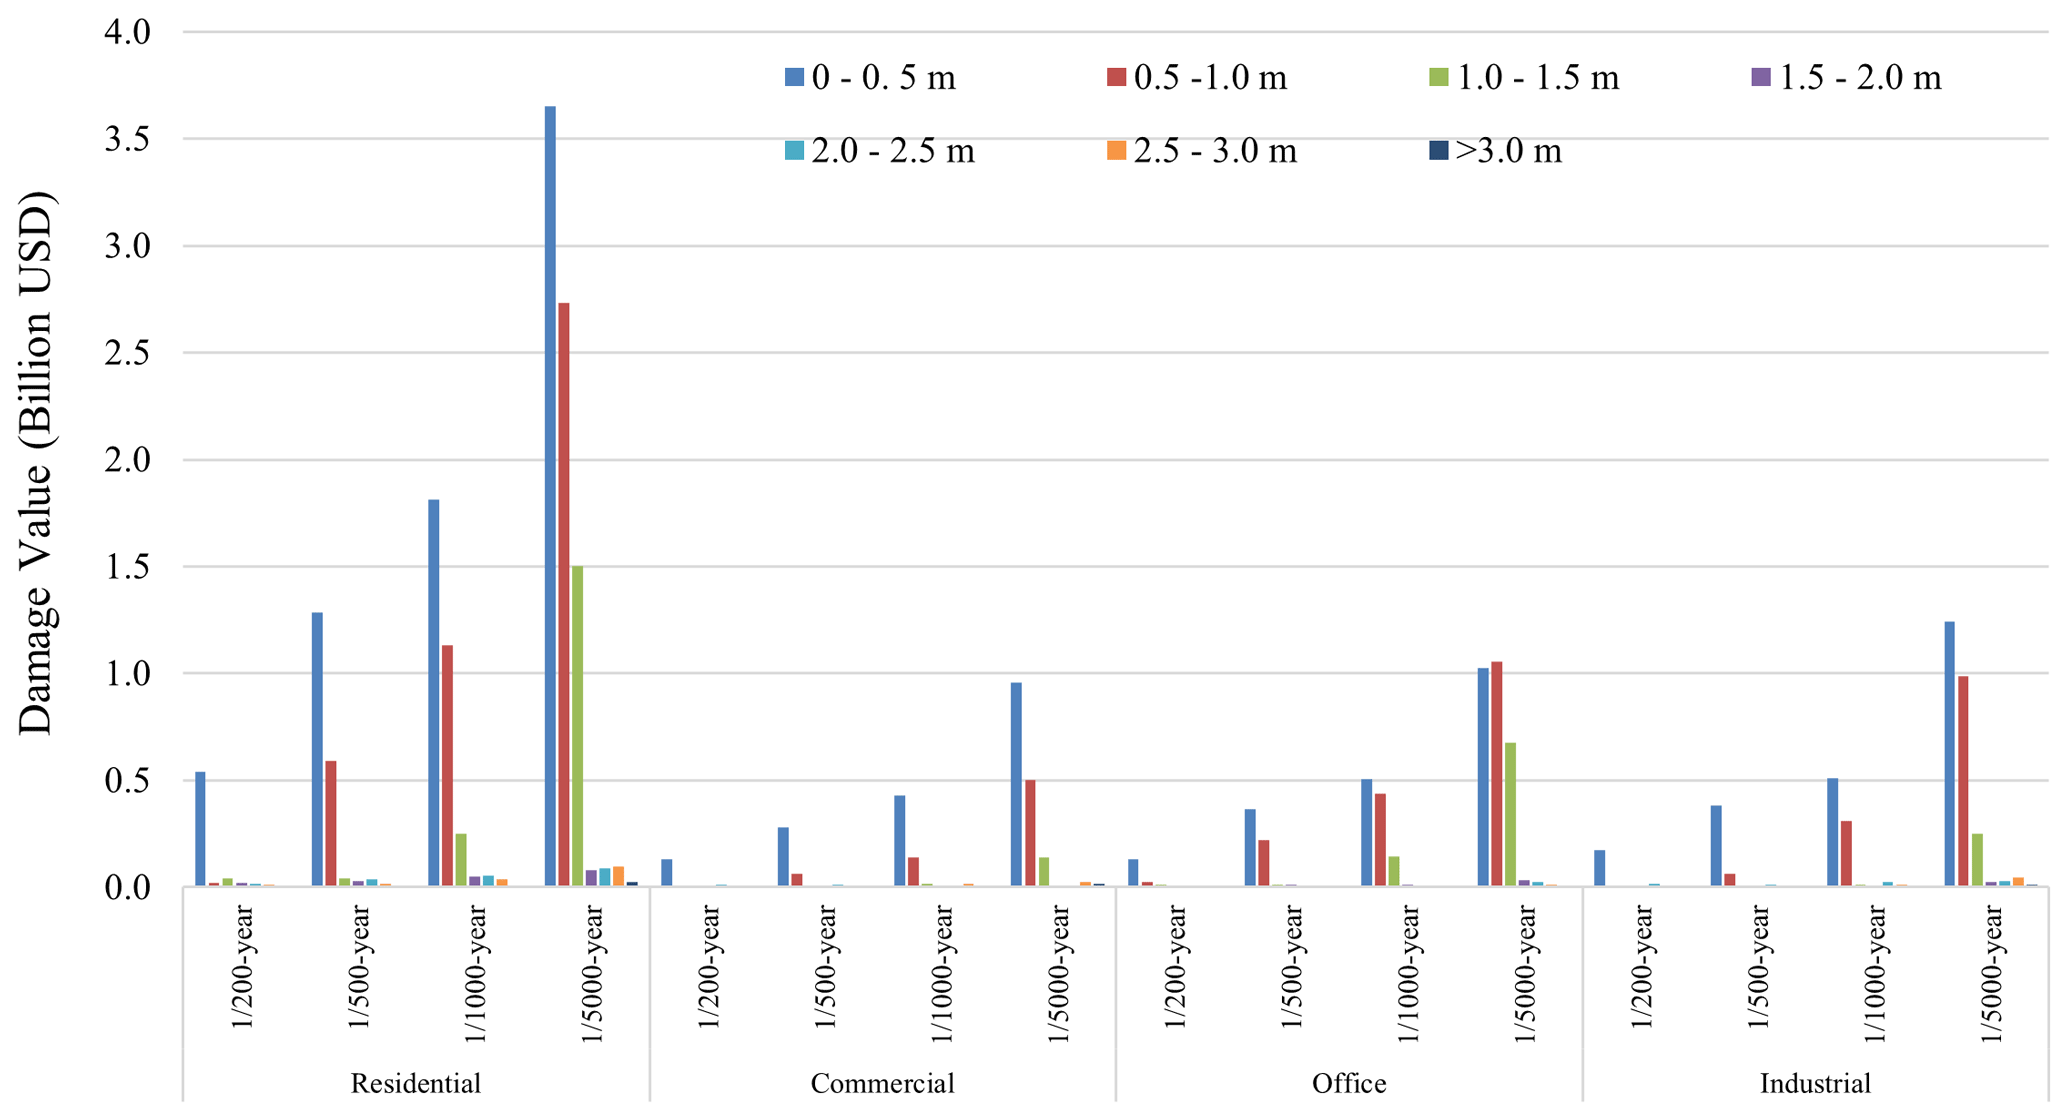
In terms of damage due to water depths in different flood scenarios, water depths of 0–0.5 m caused 83 % of building damage in the -year flood scenario. Under -, -, and -year flood scenarios, the proportions are 67 %, 55 %, and 45 %, respectively. With deeper water depths causing less damage, for instance, 33 % of buildings are damaged in water depths of 0.5–1 m under the -year flood scenario, and 18 % of the damage occur in water depths of 1–1.5 m (Fig. 6).
4.3 Risk estimate of buildings and its pattern
By integrating the extreme flood scenarios and associated building damage for the four types of buildings, we plotted four average annual probability–damage curves (Fig. 7). The AALs of residential, commercial, office, and industrial buildings are USD 12.3, 2.5, 3.7, and 3.4 million, respectively. It shows that residential buildings would suffer the highest risk value among the four types of buildings.
By using the Getis-Ord Gi* statistic tool in ArcMap 10.6, the results reveal the distribution of high and low building risks for different types of buildings at the sub-district level in Shanghai (Fig. 8). Apparently, the distribution of hot spots and cold spots for different types of buildings are quite different. For residential buildings, there are six hot-spot areas and five cold-spot areas. Most of the hot-spot areas concentrate in the city center, except for one along the north coast of Hangzhou Bay. Further analysis of the commercial buildings indicates a significant hot spot south of the Suzhou Creek mouth. Figure 8 shows five hot-spot areas and two cold-spot areas for office buildings, with three hot spots located in coastal areas. Four hot spots of industrial buildings concentrate mainly in the north, while the city center is the main cold-spot area because there are few industrial buildings located there.
Overall, the city center is the hot-spot area of flood risk for the residential, commercial, and office buildings (Fig. 8a, b, and c). But in contrast, the city center is the cold-spot area for the industrial buildings (Fig. 8d). Wusongkou is affected by flooding with an expanding inundation area under increasing return periods. One reason for this is that the density of buildings in Wusongkou is higher than in other areas.
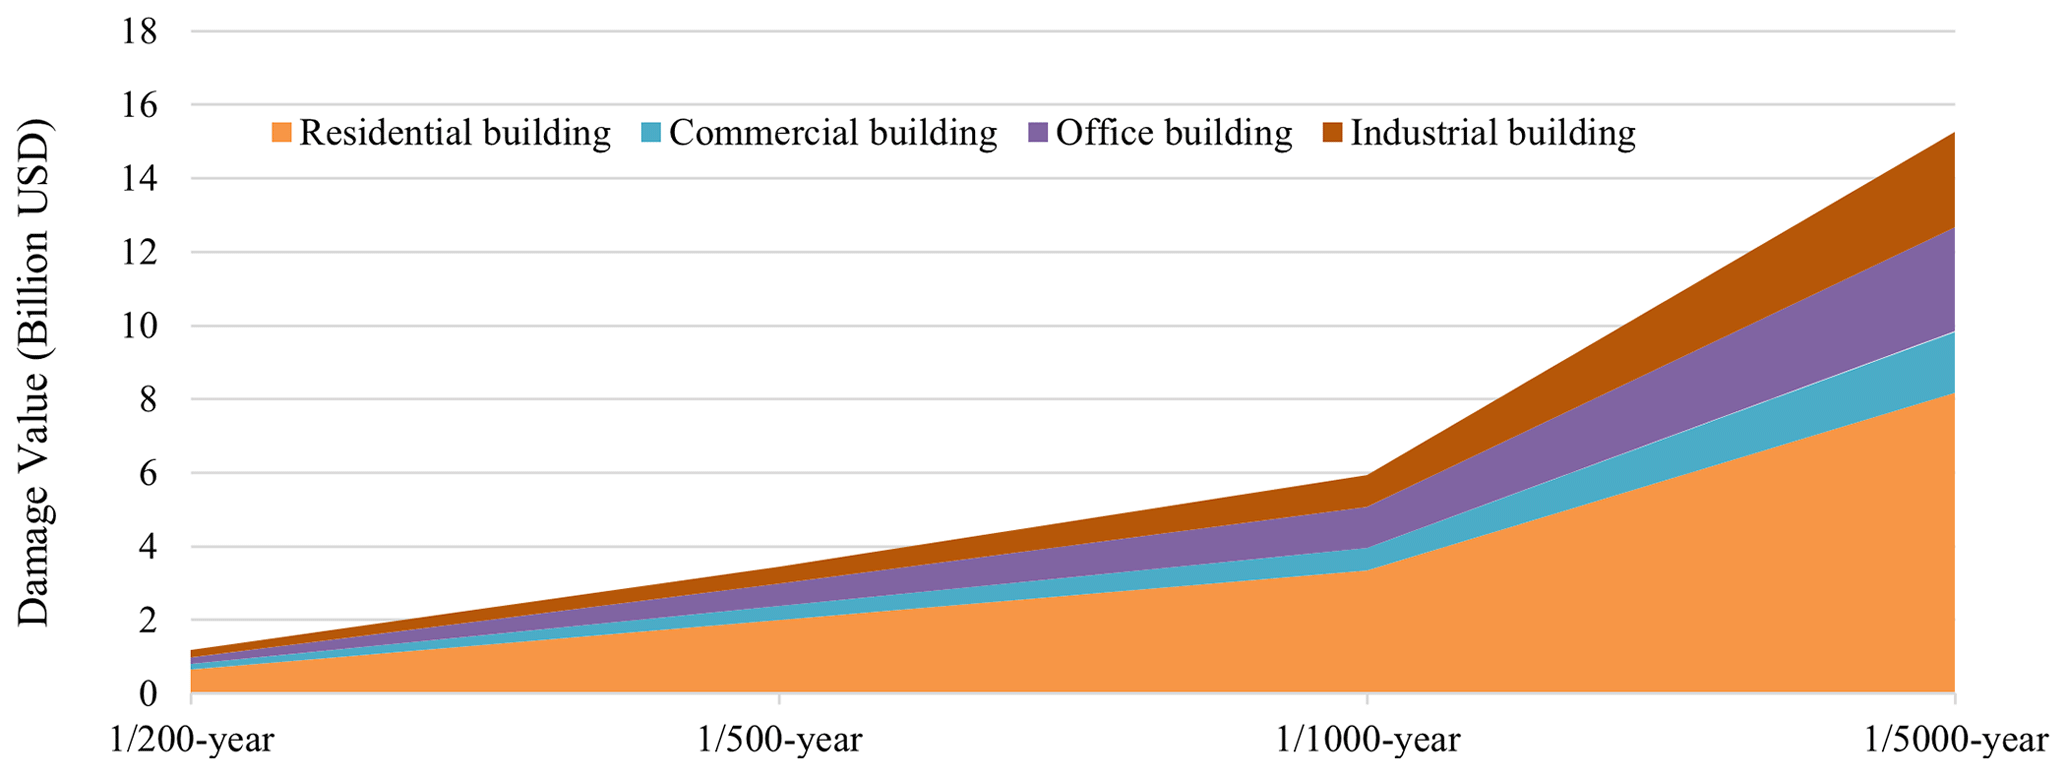
Figure 7Probability–damage curve of extreme flooding for residential, commercial, office, and industrial buildings.
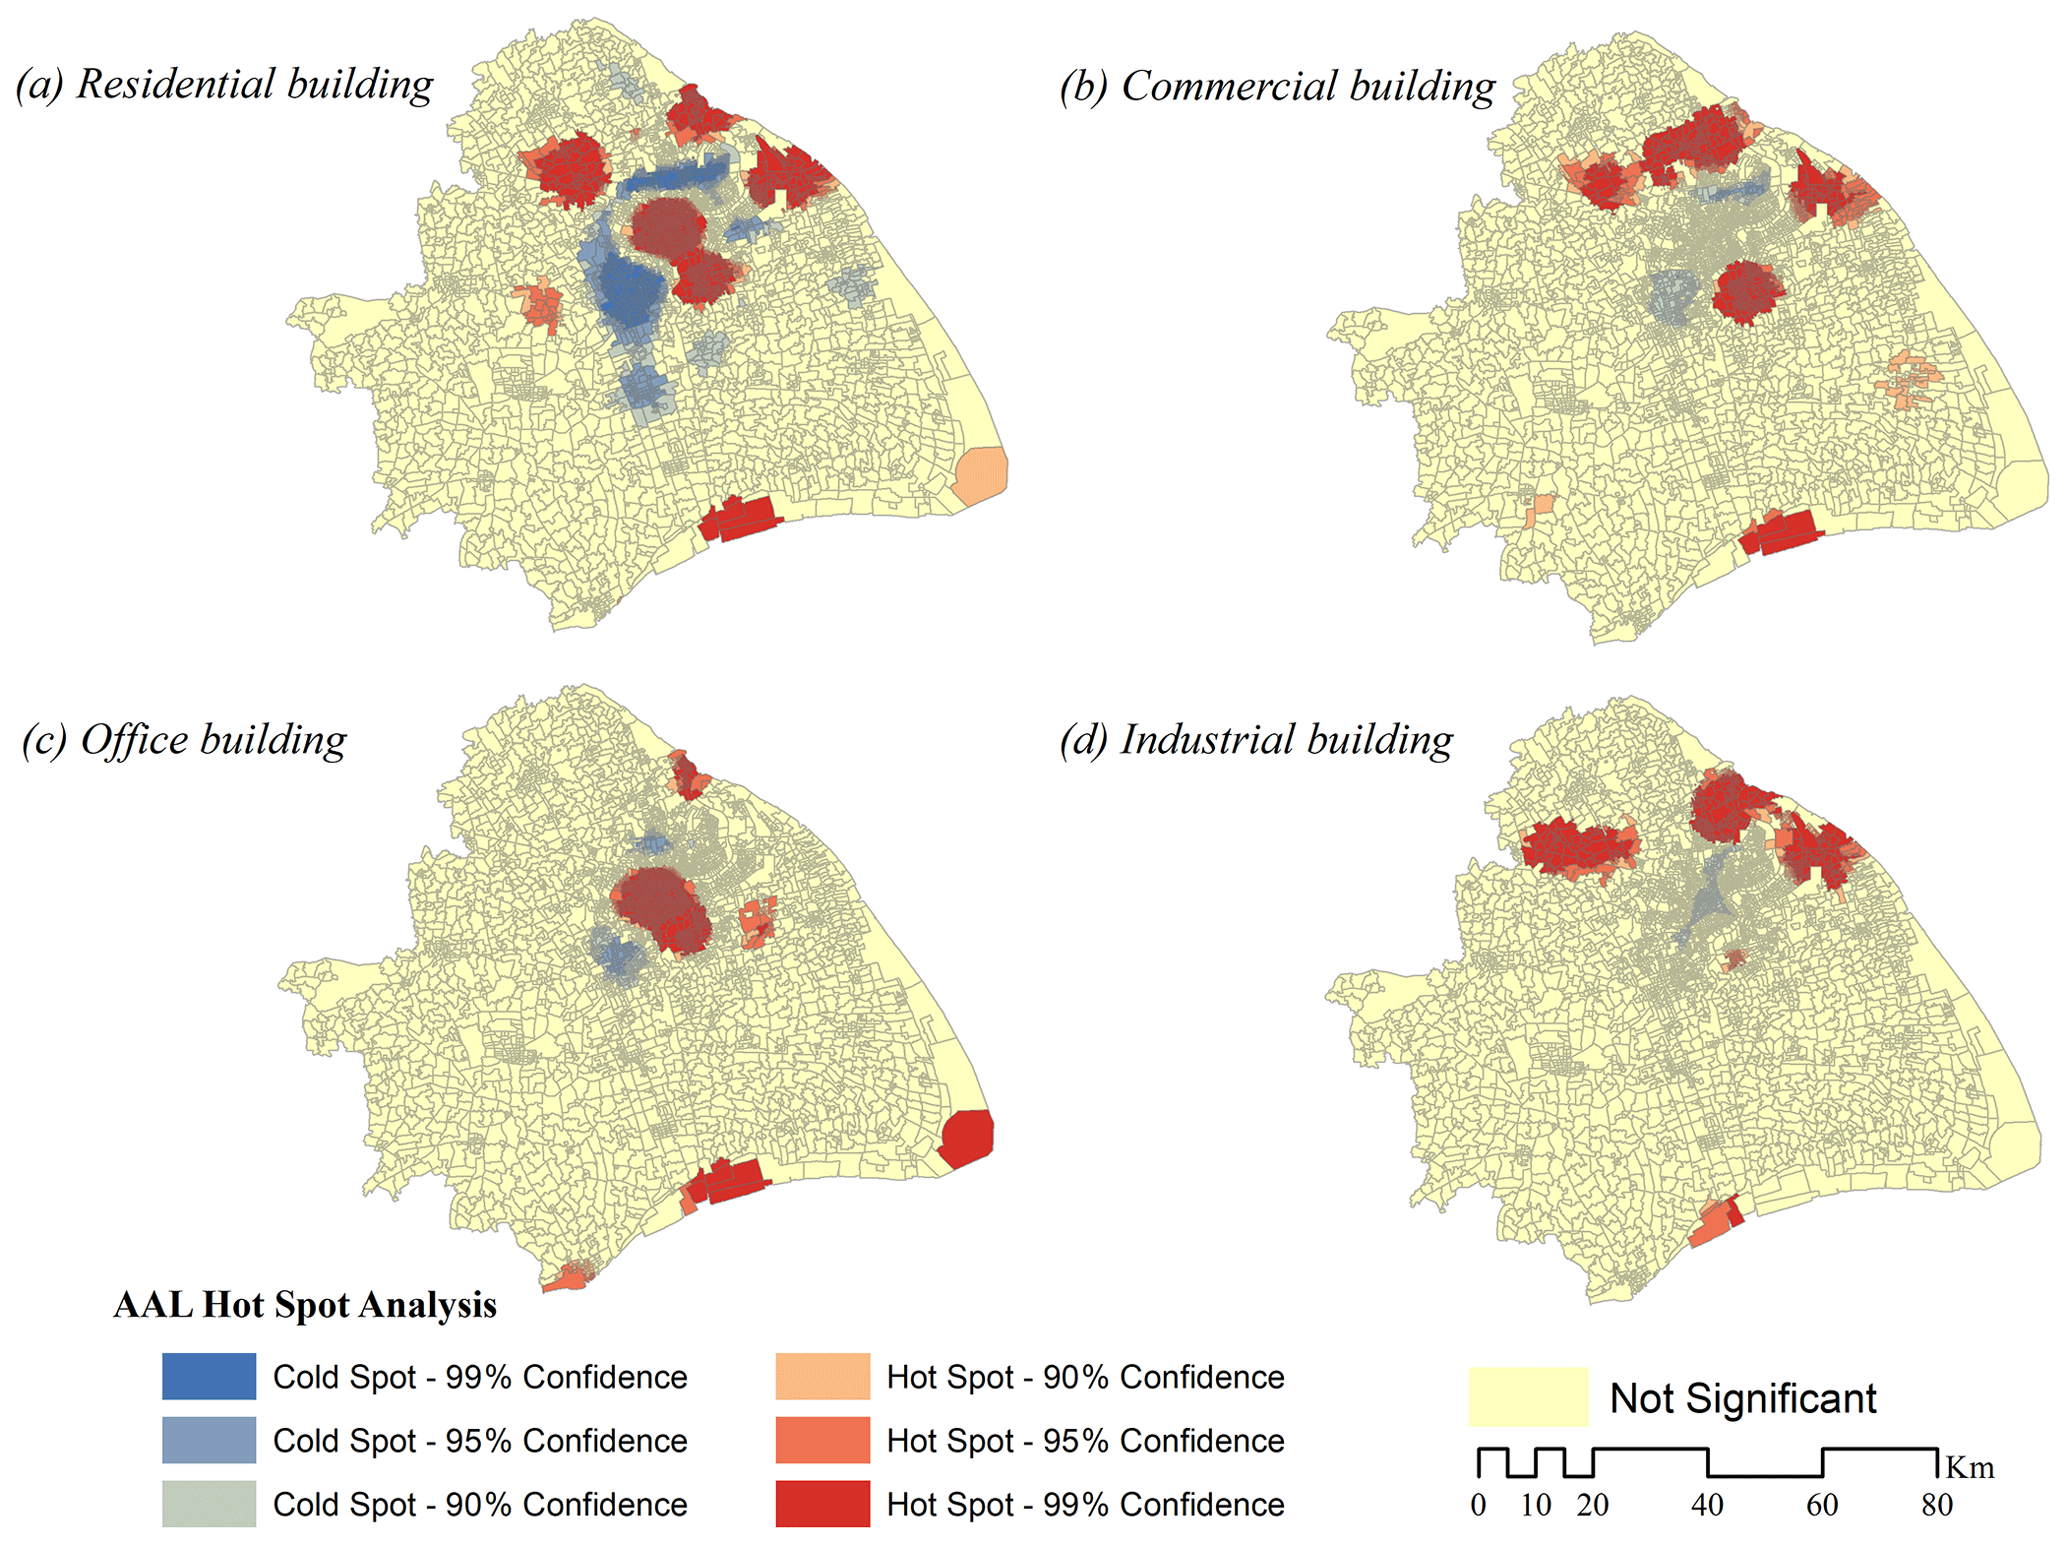
Figure 8The hot-spot analysis of the AAL for buildings at the sub-district level in Shanghai.
5.1 Uncertainties and limitations
Our study shows that the damage to buildings in Shanghai grows exponentially with the decreasing likelihood of extreme flood scenarios. For instance, the resulting flood damage to residential, commercial, office, and industrial buildings under the -year flooding scenario is more than 10 times higher than the resulting damage for a -year flooding scenario. As shown in Sect. 4.1, the areas along the Yangtze River estuary, Hangzhou Bay, and Huangpu River are broadly flooded under the -, -, -, and -year flooding scenarios. The results of the study show the importance of assessing the risk to extreme events on a regional scale at a high spatial resolution considering the differences in the exposed assets. The hot-spot clusters are distributed over many different areas in the city and vary from building type to building type. In some areas, the damage is driven mainly by high inundation depths (e.g., the hot spots in the south), whereas other areas face a high risk due to the high vulnerability of the asset values. This emphasizes the importance of assessing the different drivers of risk on the local scale for the selection and dimensioning of adequate protection measures against extreme events.
Apart from our study, there have been two other similar flood risk assessments conducted in Shanghai. In the study by Wu et al. (2019), the hazard was defined as a -year fluvial flood scenario (river flood from the Huangpu River), whereas we use several hazard scenarios to cover a broader range of low-probability, high-impact flood scenarios. For exposure, the building asset value in Shanghai was calculated based on the building floor area, which was obtained from the building floor area per district, and the population density per sub-district. Wu et al. (2019) estimated the exposed building asset value in Shanghai to be roughly USD 304.1 billion, with a total damage of approximately USD 32.2 billion for a -year flood event. In another study by Shan et al. (2019), which focused on the same flood scenarios, damage estimation was determined by considering residential buildings and household properties, using the market price of residential buildings. This research estimated the loss of the residential buildings to be USD 27.1 billion using house price data under a -year flood event in Shanghai. It is important to acknowledge that the subject of risk plays an important role in the risk assessment process. Hazards, exposure, and vulnerability in the context of risk, as described in the latest IPCC report on climate change impacts, may each be subject to uncertainty in terms of the magnitude and likelihood of occurrence and may each change over time and space due to socio-economic changes and human decision making (IPCC, 2022). Both our study and the previous studies address the three subjects (hazards, exposure, and vulnerability) with extreme flood scenarios, building exposure, and the stage function of buildings. However, due to the different subjects assessed, the resulting risk estimates differ. This disparity observed in the risk assessment conducted in Shanghai can also occur in assessments of other cities.
The integrative analysis of geospatial building asset maps, flood scenarios, and the stage–damage functions in the study makes it possible to assess the flood damage of buildings in the megacity Shanghai with a high spatial resolution. However, the accuracy of building asset values could still be improved. First, the adopted building data of location, footprint area, height, and floors did not consider the construction materials used and years built. Also, the data from 2017 are not recent enough, considering the fast development of Shanghai. Second, the classification of different types of buildings is quite straightforward based on the land-use/land-cover data. However, many buildings with multiple functions (e.g., shopping malls and offices) were identified as a single building type, which causes uncertainty of the building's value. Third, existing studies' stage–damage functions for specific types of buildings are used to create the asset building damage map for the flood risk assessment. The functions could be updated and tailored to more current and specific building conditions, particularly when estimating flood damage in the future (Ke, 2014). These constraints could be overcome by the inclusion of additional information about age, structures, and utilizations of the buildings. Also, the methodology of the four extreme flood scenarios for Shanghai was taken from published models that are generated by the current physical environment (Wang et al., 2019). However, sea level and heavy precipitation are driven by climate change so that current flood hazard maps for Shanghai may be outdated in the next few decades. This means that a -year event may have a much higher probability in the future and emphasizes the need for proactive adaptation measures. Therefore, climate change scenarios (e.g., sea-level rise, heavy precipitation) should be considered in future flood risk studies. Furthermore, we have access to a rich dataset and extensive research on hazard, exposure, and vulnerability, allowing us to undertake a risk analysis chain in Shanghai. This availability of resources can pose a challenge for other cities that may have limited data and research in conducting their own risk assessments.
5.2 Future challenges and adaptation strategies
Future challenges, like extreme flooding events, will become more common in Shanghai. The historical data show how Shanghai's extreme precipitation events have increased dramatically over time (Wang and Zhou, 2005; Liang and Ding, 2017), which increases the possibility of seawall and levee failures. One -year return period flood occurred in Shanghai in 2013, for instance, breaking the highest crest record at the Wusongkou Datum and causing levees to break down (Ke et al., 2018). Due to climate change, the frequency and/or severity of climate-change-related hazards will also increase the flood risks in Shanghai in the future (Woetzel et al., 2020b).
Reviewing these findings from our risk assessment, we highlight the following two points, which in our opinion might help advance the flood risk assessment in the future for Shanghai, or even more broadly for China. First, the parameters (such as flood hazard maps, damage models, exposure data, etc.) to help perform the flood risk assessment in Shanghai, which are available to the public, are inconsistent and scarce. Flood hazard maps can be an example. Under the current physical environment, coastal flood scenarios with combined effects (sea-level rise, land subsidence, and storm surges) in 2030, 2050, and 2100 that inundate 1.5 %, 37 %, and 50 % of Shanghai, respectively (Wang et al., 2012), have been simulated using a 2D hydrodynamic model (MIKE 21 Flow Model). On the other hand, fluvial floods from the Huangpu River show the different inundation areas that reach 0, 111.30, 124.73, 143.74, 177.96, and 195.77 km2 under -, -, -, -, -, and -year flood events in Shanghai under the present physical environment (Yin et al., 2013). In our study, the inundation area is 9 %, 16 %, 24 %, and 49 % of Shanghai under -, -, -, and -year events, respectively. Although we are doing academic research work, it is still important to translate academic findings into everyday language so that inhabitants, stakeholders, and policymakers can improve their capacity for coping with flooding and adapting to it.
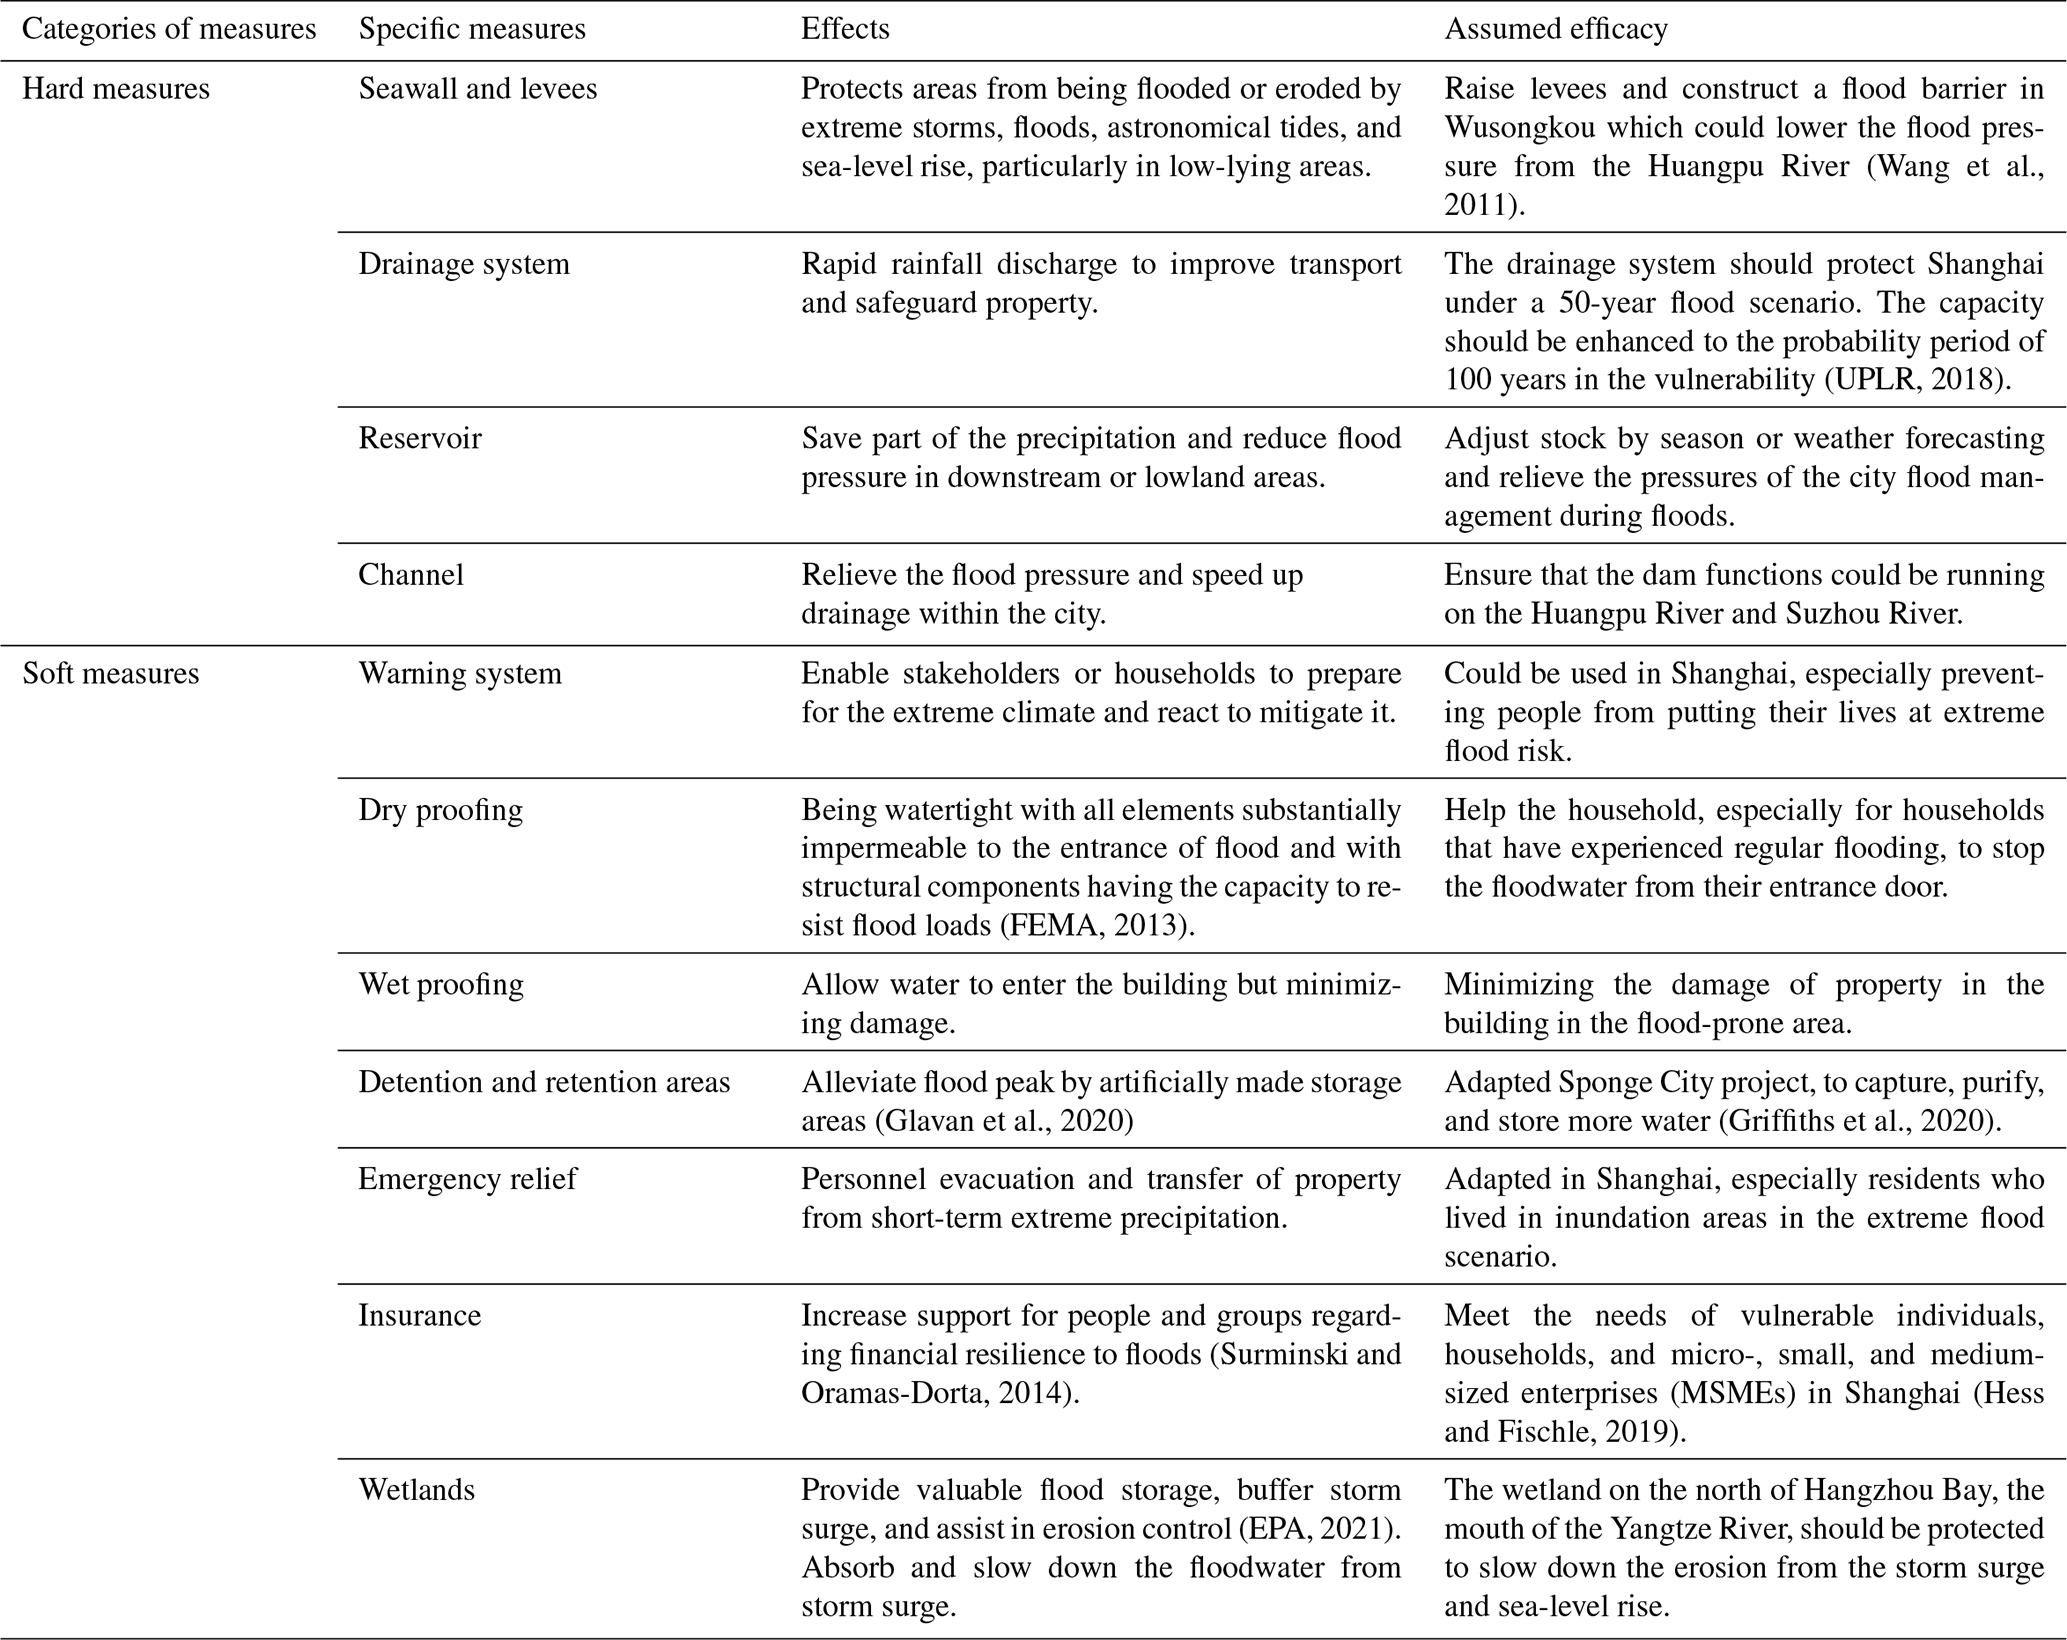
Second, effective adaptation to increasing flood risks requires an integrated climate response strategy, which shall include a broad scope of intervention measures such as urban planning, structural flood management measures, early warning systems, nature-based solutions, flood awareness, and risk financing instruments (Yang et al., 2015; Jongman, 2018; UN, 2020). In Table 6, we list potential hard, soft, and hybrid implementation measures and their assumed efficacy in Shanghai. On the other hand, urbanization as a confirmed trend in the fast-developing coastal city may increase asset exposure to floods but can also offer opportunities for improving flood risk management (Garschagen and Romero-Lankao, 2015). A top-down urban master plan, including land-use planning, control of runoff, access to data and information, etc., should be updated by the Shanghai Municipal Government to involve advanced risk management measures (Zhou et al., 2017). For instance, in its Master Plan 2017–2035, Shanghai is going to further develop its five new district centers at Jiading, Songjiang, Qingpu (Songjiang–Qingpu low-lying area), Fengxian, and Nanhui. These five district centers are planned to be nodal areas in Shanghai and provide more public services for the growing population. However, based on our findings, the Songjiang–Qingpu low-lying area protected by levees with a -year flooding scenario along the Huangpu River is a hot spot for flood damage. In recognition of this vulnerability, local stakeholders have acknowledged the necessity of implementing levee enhancements in the Songjiang–Qingpu low-lying area. Therefore, future flood protections in these locations, particularly the drainage system and the building structures, must be designed to a higher standard.
This study presents an integrated impact model of flood damage to buildings based on extreme flooding scenarios in Shanghai. The results show that the inundation area is significantly larger in the low-probability, high-impact flood scenarios. In all the four considered scenarios, the areas near the Huangpu River and along the coastal areas are always affected by building damage. The central downtown areas of Shanghai have a high risk of being exposed to and affected by extreme floods, partly because of its high building density. Besides that, the Songjiang–Qingpu low-lying area in western Shanghai has been recognized as a noticeable area to be flooded under a -year flood scenario. This calls for special concerns in the near future because the Songjiang–Qingpu area is planned to become an important sub-center node.
The total asset value for the four building types is USD 3149 billion, while the total AAL is USD 21.9 million. Meanwhile, residential buildings face the highest damage rates of the four types of buildings, accounting for 56 % of the total AAL, followed by office, industrial, and commercial buildings, respectively. In comparison to other types of buildings, the results show that the residential buildings are substantially vulnerable in all flooding scenarios, which requires attention because residential buildings are a big part of people's daily life.
The presented method offers a possible process to estimate the damage values for residential, commercial, office, and industrial buildings in Shanghai under extreme flooding. The integrated flood model, damage estimation, and risk evaluation are all methodological components that could be implemented in other cities to analyze building damage under extreme flood events. It increases the accuracy and details of flood damage estimates for different types of buildings by considering the direct damage of buildings. The dynamic linkage between the extreme flooding scenarios and the distribution of asset values of the four different types of buildings allows for the evaluation of the spatial distribution of flood damage, which would be valuable for individual real estate managers and for the city government.
The data used in this study are available from the first author upon request.
JT analyzed the data, conceived the paper, and wrote the paper; JW and LEY conceived and co-wrote the paper; AR, MG, and SSY reviewed and improved the analysis and paper; and MZ and LW provided the simulation results of the extreme flood scenarios.
The contact author has declared that none of the authors has any competing interests.
Publisher's note: Copernicus Publications remains neutral with regard to jurisdictional claims in published maps and institutional affiliations.
This article is part of the special issue “Future risk and adaptation in coastal cities”. It is not associated with a conference.
This research has been supported by the National Natural Science Foundation of China (grant nos. 42171080, 41771540, and 41871200) and the National Key Research and Development Program of China (grant no. 2017YFC1503001).
This paper was edited by Javier Revilla Diez and reviewed by three anonymous referees.
Arcaids: Construction Cost Handbook 2019 China & Hang Kong, https://www.arcadis.com/en/knowledge-hub/perspectives/asia/research-and-publications/construction-cost-handbook, last access: 20 May 2020.
Baidu Maps: https://map.baidu.com/, last access: 15 May 2018.
Balica, S. F., Wright, N. G., and van der Meulen, F.: A flood vulnerability index for coastal cities and its use in assessing climate change impacts, Nat. Hazards, 64, 73–105, https://doi.org/10.1007/s11069-012-0234-1, 2012.
C40Cities: Sea level rise and coastal flooding, https://www.c40.org/what-we-do/scaling-up-climate-action/adaptation-water/the-future-we-dont-want/sea-level-rise/ (last access: 30 September 2023), 2018.
Chan, F. K. S., Yang, L. E., Scheffran, J., Mitchell, G., Adekola, O., Griffiths, J., Chen, Y. B., Li, G., Lu, X. H., Qi, Y. F., Li, L., Zheng, H., and McDonald, A.: Urban flood risks and emerging challenges in a Chinese delta: The case of the Pearl River Delta, Environ. Sci. Policy, 122, 101–115, https://doi.org/10.1016/j.envsci.2021.04.009, 2021.
China Standard Press (CSP): The People's Republic of China Code for Real Estate Appraisal (GB/T 50291-2015), Ministry of Housing and Urban-Rural Development, PCR, 112 pp., 2015.
China Standard Press (CSP): The People's Republic of China Current Land Use Classification (GB/T 21010-2017), Ministry of Land and Resource, PCR, 14 pp., 2017.
Chmutina, K., Ganor, T., and Bosher, L.: Role of urban design and planning in disaster risk reduction, Proc. Inst. Civ. Eng.-Urban Des. Plan., 167, 125–135, https://doi.org/10.1680/udap.13.00011, 2014.
Dong, S., Stephenson, W. J., Wakes, S., Chen, Z., and Ge, J.: Mesoscale simulation of typhoon-generated storm surge: methodology and Shanghai case study, Nat. Hazards Earth Syst. Sci., 22, 931–945, https://doi.org/10.5194/nhess-22-931-2022, 2022.
Du, S. Q., Scussolini, P., Ward, P. J., Zhang, M., Wen, J. H., Wang, L. Y., Koks, E., Diaz-Loaiza, A., Gao, J., Ke, Q., and Aerts, J.: Hard or soft flood adaptation? Advantages of a hybrid strategy for Shanghai, Global Environmental Change, 61, 102037, https://doi.org/10.1016/j.gloenvcha.2020.102037, 2020.
Environmental Protection Agency (EPA): Climate Adaptation and Wetland Protection, https://www.epa.gov/arc-x/climate-adaptation-and-wetland-protection, last access: 10 August 2021.
Federal Emergency Management Agency (FEMA): FEMA P-936 Floodproofing non-residential buildings, Federal Emergency Management Agency, USA, 184 pp., 2013.
Garrote, J., Alvarenga, F., and Díez-Herrero, A.: Quantification of flash flood economic risk using ultra-detailed stage–damage functions and 2-D hydraulic models, J. Hydrol., 541, 611–625, https://doi.org/10.1016/j.jhydrol.2016.02.006, 2016.
Garschagen, M. and Romero-Lankao, P.: Exploring the relationships between urbanization trends and climate change vulnerability, Climatic Change, 133, 37–52, https://doi.org/10.1007/s10584-013-0812-6, 2015.
Glavan, M., Cvejic, R., Zupanc, V., Knapic, M., and Pintar, M.: Agricultural production and flood control dry detention reservoirs: Example from Lower Savinja Valley, Slovenia, Environ. Sci. Policy, 114, 394–402, https://doi.org/10.1016/j.envsci.2020.09.012, 2020.
Gong, S. L. and Yang, S. L.: Effect of Land Subsidence on Urban Flood Prevention Engineering in Shanghai, Scientia Geographic Sinica, 28, 543–547, 2008.
Griffiths, J., Chan, F. K. S., Shao, M., Zhu, F. F., and Higgitt, D. L.: Interpretation and application of Sponge City guidelines in China, Philos. T. Roy. Soc. A, 378, 20190222, https://doi.org/10.1098/rsta.2019.0222, 2020.
Hallegatte, S., Green, C., Nicholls, R. J., and Corfee-Morlot, J.: Future flood losses in major coastal cities, Nat. Clim. Change, 3, 802–806, https://doi.org/10.1038/nclimate1979, 2013.
Hashemi, M. R., Neill, S. P., Robins, P. E., Davies, A. G., and Lewis, M. J.: Effect of waves on the tidal energy resource at a planned tidal stream array, Renew. Energ., 75, 626–639, https://doi.org/10.1016/j.renene.2014.10.029, 2015.
Hess, U. and Fischle, R.: Managing Climate Risk with Extreme Weather Insurance, German Society for International Cooperation (GIZ), Germany, 6 pp., https://www.giz.de/expertise/downloads/giz2019-en-factsheet_insurance_climate.pdf (last access: 4 October 2023), 2019.
Intergovernmental Panel on Climate Change (IPCC): Summary for Policymakers in: IPCC Special Report on the Ocean and Cryosphere in a Changing Climate, Cambridge University Press, Cambridge, UK and New York, NY, USA, 3–36, https://doi.org/10.1017/9781009157964.001, 2019.
Intergovernmental Panel on Climate Change (IPCC): Point of Departure and Key Concepts in Climate Change 2022: Impacts, Adaptation and Vulnerability, Cambridge University Press, Cambridge, UK and New York, NY, USA, 121–196, https://doi.org/10.1017/9781009325844.003, 2022.
Jongman, B.: Effective adaptation to rising flood risk, Nat. Commun., 9, 1986, https://doi.org/10.1038/s41467-018-04396-1, 2018.
Ke, Q.: Flood risk analysis for metropolitan areas – a case study for Shanghai, Hydraulic Engineering, Delft University of Technology, 193 pp., https://doi.org/10.4233/uuid:61986b2d-72de-45e7-8f2a-bd61c725325d, 2014.
Ke, Q., Jonkman, S. N., van Gelder, P., and Bricker, J. D.: Frequency Analysis of Storm-Surge-Induced Flooding for the Huangpu River in Shanghai, China, Journal of Marine Science and Engineering, 6, 70, https://doi.org/10.3390/jmse6020070, 2018.
Kelman, I. and Spence, R.: An overview of flood actions on buildings, Eng. Geol., 73, 297–309, https://doi.org/10.1016/j.enggeo.2004.01.010, 2004.
Liang, P. and Ding, Y. H.: The Long-term Variation of Extreme Heavy Precipitation and Its Link to Urbanization Effects in Shanghai during 1916–2014, Adv. Atmos. Sci., 34, 321–334, https://doi.org/10.1007/s00376-016-6120-0, 2017.
Manepalli, U. R., Bham, G. H., and Kandada, S.: Evaluation of hotspots identification using kernel density estimation (K) and Getis-Ord (Gi*) on I-630, in: 3rd International Conference on Road Safety and Simulation, Indianapolis Indiana, United States, 14 September 2011, 14–16, http://onlinepubs.trb.org/onlinepubs/conferences/2011/RSS/2/Manepalli,UR.pdf (last access: 4 October 2023), 2011.
McGrath, H., El Ezz, A. A., and Nastev, M. J. N. H.: Probabilistic depth–damage curves for assessment of flood-induced building losses, 97, 1–14, https://doi.org/10.1007/s11069-019-03622-3, 2019.
MIKE: MIKE 21 flow model-hydrodynamic module user guide, 154 pp., https://manuals.mikepoweredbydhi.help/2019/Coast_and_Sea/MIKE_FM_HD_2D.pdf (last access: 4 October 2023), 2017.
Nguyen, M. T., Sebesvari, Z., Souvignet, M., Bachofer, F., Braun, A., Garschagen, M., Schinkel, U., Yang, L. E., Nguyen, L. H. K., Hochschild, V., Assmann, A., and Hagenlocher, M.: Understanding and assessing flood risk in Vietnam: Current status, persisting gaps, and future directions, J. Flood Risk Manag., 14, e12689, https://doi.org/10.1111/jfr3.12689, 2021.
Park, K. and Won, J. H.: Analysis on distribution characteristics of building use with risk zone classification based on urban flood risk assessment, Int. J. Disast. Risk Re., 38, 101192, https://doi.org/10.1016/j.ijdrr.2019.101192, 2019.
Quan, R. S.: Risk assessment of flood disaster in Shanghai based on spatial-temporal characteristics analysis from 251 to 2000, Environ. Earth Sci., 72, 4627–4638, https://doi.org/10.1007/s12665-014-3360-0, 2014.
Shan, X. M., Wen, J. H., Zhang, M., Wang, L. Y., Ke, Q., Li, W. J., Du, S. Q., Shi, Y., Chen, K., Liao, B. G., Li, X. D., and Xu, H.: Scenario-Based Extreme Flood Risk of Residential Buildings and Household Properties in Shanghai, Sustainability, 11, 3202, https://doi.org/10.3390/su11113202, 2019.
SMBS: Shanghai Statistical Yearbook-2020, Shanghai Municipal Bureau of Statistics and the National Bureau of Statistics Survey Office, Shanghai, PCR, 2020.
Surminski, S. and Oramas-Dorta, D.: Flood insurance schemes and climate adaptation in developing countries, Int. J. Disast. Risk Re., 7, 154–164, https://doi.org/10.1016/j.ijdrr.2013.10.005, 2014.
United Nations (UN): United Nations World Water Development Report 2020: Water and Climate Change, UNESCO, Paris, 219 pp., ISBN 978-92-3-100371-4, https://unesdoc.unesco.org/in/rest/annotationSVC/DownloadWatermarkedAttachment/attach_import_d4573ca6-3763-42be-93c0-619ea879933f?_=372985eng.pdf&to=235&from=1 (last access: 4 October 2023), 2020.
UPLR: Shanghai Master Plan 2017–2035, Shanghai Urban Planning and Land Resource Administration Bureau (UPLR), Shanghai, PCR, 186 pp., https://www.shanghai.gov.cn/newshanghai/xxgkfj/2035001.pdf (last access: 4 October 2023), 2018.
Wang, J., Xu, S. Y., Ye, M. W., and Huang, J.: The MIKE Model Application to Overtopping Risk Assessment of Seawalls and Levees in Shanghai, Int. J. Disast. Risk Sc., 2, 32–42, https://doi.org/10.1007/s13753-011-0018-3, 2011.
Wang, J., Gao, W., Xu, S. Y., and Yu, L. Z.: Evaluation of the combined risk of sea level rise, land subsidence, and storm surges on the coastal areas of Shanghai, China, Climatic Change, 115, 537–558, https://doi.org/10.1007/s10584-012-0468-7, 2012.
Wang, L., Zhang, M., Wen, J., Chong, Z., Ye, Q., and Ke, Q.: Simulation of extreme compound coastal flooding in Shanghai, Advances in Water Science, 30, 546–555, 2019.
Wang, Y.: Technical Report: Flood damage assessment in Shanghai city. Flood risk map of Shanghai, IWRH, Beijing, 2001.
Wang, Y. Q. and Zhou, L.: Observed trends in extreme precipitation events in China during 1961–2001 and the associated changes in large-scale circulation, Geophys. Res. Lett., 32, L09707, https://doi.org/10.1029/2005GL022574, 2005.
Ward, P. J., de Moel, H., and Aerts, J. C. J. H.: How are flood risk estimates affected by the choice of return-periods?, Nat. Hazards Earth Syst. Sci., 11, 3181–3195, https://doi.org/10.5194/nhess-11-3181-2011, 2011.
Woetzel, J., Pinner, D., Samandari, H., Engel, H., Krishnan, M., Boland, B., and Cooper, P.: Can coastal cities turn the tide on rising flood risk?, McKinsey Global Institute, 30 pp., https://www.mckinsey.com/~/media/mckinsey/business functions/sustainability/our insights/can coastal cities turn the tide on rising flood risk/mgi-can-coastal-cities-turn-the-tide-on-rising-flood-risk.pdf (last access: 4 October 2023), 2020a.
Woetzel, J., Pinner, D., Samandari, H., Engel, H., Krishnan, M., Boland, B., and Powis, C.: Climate risk and response: Physical hazards and socioeconomic impacts, McKinsey Global Institute, 164 pp., https://www.mckinsey.com/~/media/mckinsey/business functions/sustainability/our insights/climate risk and response physical hazards and socioeconomic impacts/mgi-climate-risk-and-response-full-report-vf.pdf (last access: 4 October 2023), 2020b.
Wu, J. D., Ye, M. Q., Wang, X., and Koks, E.: Building Asset Value Mapping in Support of Flood Risk Assessments: A Case Study of Shanghai, China, Sustainability, 11, 971, https://doi.org/10.3390/su11040971, 2019.
Yang, L., Scheffran, J., Qin, H. P., and You, Q. L.: Climate-related flood risks and urban responses in the Pearl River Delta, China, Reg. Environ. Change, 15, 379–391, https://doi.org/10.1007/s10113-014-0651-7, 2015.
Yin, J., Yin, Z. E., Hu, X. M., Xu, S. Y., Wang, J., Li, Z. H., Zhong, H. D., and Gan, F. B.: Multiple scenario analyses forecasting the confounding impacts of sea level rise and tides from storm induced coastal flooding in the city of Shanghai, China, Environ. Earth Sci., 63, 407–414, https://doi.org/10.1007/s12665-010-0787-9, 2011.
Yin, J., Yu, D. P., Yin, Z. N., Wang, J., and Xu, S. Y.: Modelling the combined impacts of sea-level rise and land subsidence on storm tides induced flooding of the Huangpu River in Shanghai, China, Climatic Change, 119, 919–932, https://doi.org/10.1007/s10584-013-0749-9, 2013.
Yin, J., Yu, D. P., Yin, Z. N., Wang, J., and Xu, S. Y.: Modelling the anthropogenic impacts on fluvial flood risks in a coastal mega-city: A scenario-based case study in Shanghai, China, Landscape Urban Plan., 136, 144–155, https://doi.org/10.1016/j.landurbplan.2014.12.009, 2015.
Yu, C., Cheng, X., Hall, J., Evans, E. P., Wang, Y., Hu, C., Wu, H., Wicks, J., Scott, M., and Sun, H.: A GIS-supported impact assessment of the hierarchical flood-defense systems on the plain areas of the Taihu Basin, China, Int. J. Geogr. Inf. Sci., 26, 643–665, 2012.
Zhou, Z. Z., Liu, S. G., Zhong, G. H., and Cai, Y.: Flood Disaster and Flood Control Measurements in Shanghai, Nat. Hazards Rev., 18, B5016001, https://doi.org/10.1061/(asce)nh.1527-6996.0000213, 2017.