the Creative Commons Attribution 4.0 License.
the Creative Commons Attribution 4.0 License.
 | 10 Oct 2023
Three decades of coastal subsidence in the slow-moving Nice Côte d'Azur Airport area (France) revealed by InSAR (interferometric synthetic-aperture radar): insights into the deformation mechanism
Frédéric Cappa
Béatrice Pinel-Puysségur
Coastal areas can be tremendously biodiverse and host a substantial part of the world's population and critical infrastructure. However, there are often fragile environments that face various hazards such as flooding, coastal erosion, land salinization or pollution, earthquake-induced land motion, or anthropogenic processes. In this article, we investigate the stability of the Nice Côte d'Azur Airport, which has been built on reclaimed land in the Var River delta (French Riviera, France). This infrastructure, as well as the ongoing subsidence of the airport runways, has been a permanent concern since the partial collapse of the platform in 1979. Here, we used the full archive of ESA SAR (synthetic-aperture radar) images from 1992 to 2020 to comprehensively monitor the dynamics of the airport subsidence. We found that the maximum downward motion rate has been slowing down from 16 mm yr−1 in the 1990s to 8 mm yr−1 today. However, sediment compaction is still active, and an acceleration phase of the continuous creep leading to a potential failure of a part of the platform cannot be excluded. Our study demonstrates the importance of remotely monitoring of the platform to better understand the motion of coastal land, which will ultimately help evaluate and reduce associated hazards.
- Article
(3189 KB) - Full-text XML
- BibTeX
- EndNote


Global warming due to greenhouse gas emitted into the atmosphere is triggering a climate crisis, the impacts of which can already be felt in current times with more frequent extreme weather events such as flooding, heatwaves, or wildfires. Another consequence of global warming is the rise in the sea level, as well as the impact on the stability of coastal urban areas, where a substantial part of the world's population lives. Actually, as Earth's atmosphere gets warmer, solid water (glaciers and ice sheets) melts and increases the quantity of seawater, which also occupies more volume because of thermal expansion (Wigley and Raper, 1987; Frederikse et al., 2020). Those two combined processes are inducing sea level rise (SLR), the amplitude of which will depend on which Representative Concentration Pathway (RCP) emission scenario is followed. SLR is thus estimated for the year 2100 at between 0.29 and 0.59 m for a low-emission scenario (RCP2.6) or at between 0.6 and 1.1 m for a high-emission scenario (RCP8.5) (Oppenheimer et al., 2019). Even if the mean Earth temperature increase is kept below 2 ∘C (compared to the pre-industrial period) within the next decades, sea level will continue to rise for several centuries or more due to the system inertia (Schaeffer et al., 2012). This estimation is worrying as the UN (United Nations) reports that 40 % of the world's population lives within 100 km of the coast (more than 600 million people live in coastal areas that are less than 10 m a.s.l. (above sea level) and 8 of the 10 world's largest cities are near a coast).
However, sea rise is just one factor of the relative sea level changes, and vertical ground motion can significantly amplify or reduce the effect of the global SLR. Indeed, sinking ground along the shoreline greatly magnifies the effects of sea level rise because both processes work together to worsen the situation (Milliman and Haq, 1996; Wöppelmann and Marcos, 2016; Wu et al., 2022). Indeed, uplift and subsidence along the coast are generated either by natural phenomena (sediment compaction, Cahoon et al., 1995; global isostatic adjustment, Farrell and Clark, 1976; Kendall et al., 2005; Peltier, 2004; tectonics, Atwater, 1987) or by human activities (groundwater, Galloway and Burbey, 2011; hydrocarbon extraction, Métois et al., 2020; land reclamation, Cavalié et al., 2015). This last one becomes more and more frequent due to population growth in coastal areas. Subsidence due to human activities is often very localized and difficult to model. It is thus often not very well known, and the underlying processes remain unclear. One of the most effective methods to reveal it is to measure Earth surface displacements with InSAR (interferometric synthetic-aperture radar) (Bürgmann et al., 2000; Cavalié and Trouvé, 2022). Actually, the spatial sampling of the radar allows for finely mapping the location and the amplitude of these surface deformations. And the more InSAR studies there are, the more coastal subsidence is revealed (Wu et al., 2022).
In the last few years, several studies on deformation measurements by InSAR over reclaimed land have been published, showing the raising attention of the community for this subject. For example, Xiong et al. (2022) and Li et al. (2022) used Sentinel-1 data, covering 5 years, to observe subsidence over several reclaimed areas in China. Other studies processed several datasets from different sensors in order to cover a longer observation period. However, due to the lifespan of the different SAR sensors, these datasets do not overlap in time and have temporal gaps. For example, the subsidence of the city of Urayasu (Japan) has been measured thanks to the ERS-1 and ERS-2 (1993–2006; European Remote Sensing), ALOS (2006–2010; Advanced Land Observing Satellite), and ALOS-2 (2014–2017) InSAR time series (Aimaiti et al., 2018), leading to a gap between 2010 and 2014. In this case, the temporal profile of the deformation was too irregular to enable any modelling that could connect the measurements across the temporal gap. However, in two other studies, the temporal profile of deformation was regular enough to be modelled and thus to recover a deformation spanning the whole observation time lapse: on the one hand, Park and Hong (2021) used a hyperbolic model to connect two InSAR time series measured by ALOS (2007–2012) and Sentinel-1 (2014–2019) on Busan reclaimed lands (South Korea); on the other hand, a settlement model (Plant et al., 1998) established during the preparation of Hong Kong International Airport was used to connect time series acquired over this site by ERS-2 (1998–2000), Envisat ASAR (2003–2010; Advanced Synthetic Aperture Radar), COSMO-SkyMed (2013–2017; COnstellation of small Satellites for the Mediterranean basin Observation), and Sentinel-1 (2015–2018) (Wu et al., 2020). Several models for subsidence measurements are compared in Xiong et al. (2022), namely hyperbolic, Poisson, and exponential models. However, in all the previously cited studies, the deformation modelling is limited to a mathematical function fit without a theoretical mechanical framework and real physical parameters for soils and rocks.
In this study, we process 28 years of SAR data to obtain high-quality surface deformation time series covering the Nice Côte d'Azur Airport (NCA), located in the French Riviera (southeastern France) (Fig. 1a). This critical economical infrastructure (it hosted 14.485 million passengers in 2019 before the pandemic) was built in the late 1970s on reclaimed land over a narrow coastal shelf (1–2 km wide). Tragically, in October 1979, during the building phase, part of the airport extension collapsed in the sea, triggering a local tsunami that caused the death of 11 people (Fig. 1b). Then, part of the project was cancelled (mainly the construction of a commercial port attached to the airport), but the airport platform, which had already been completed, was used to build the two main runways that are currently in use (Fig. 1e).
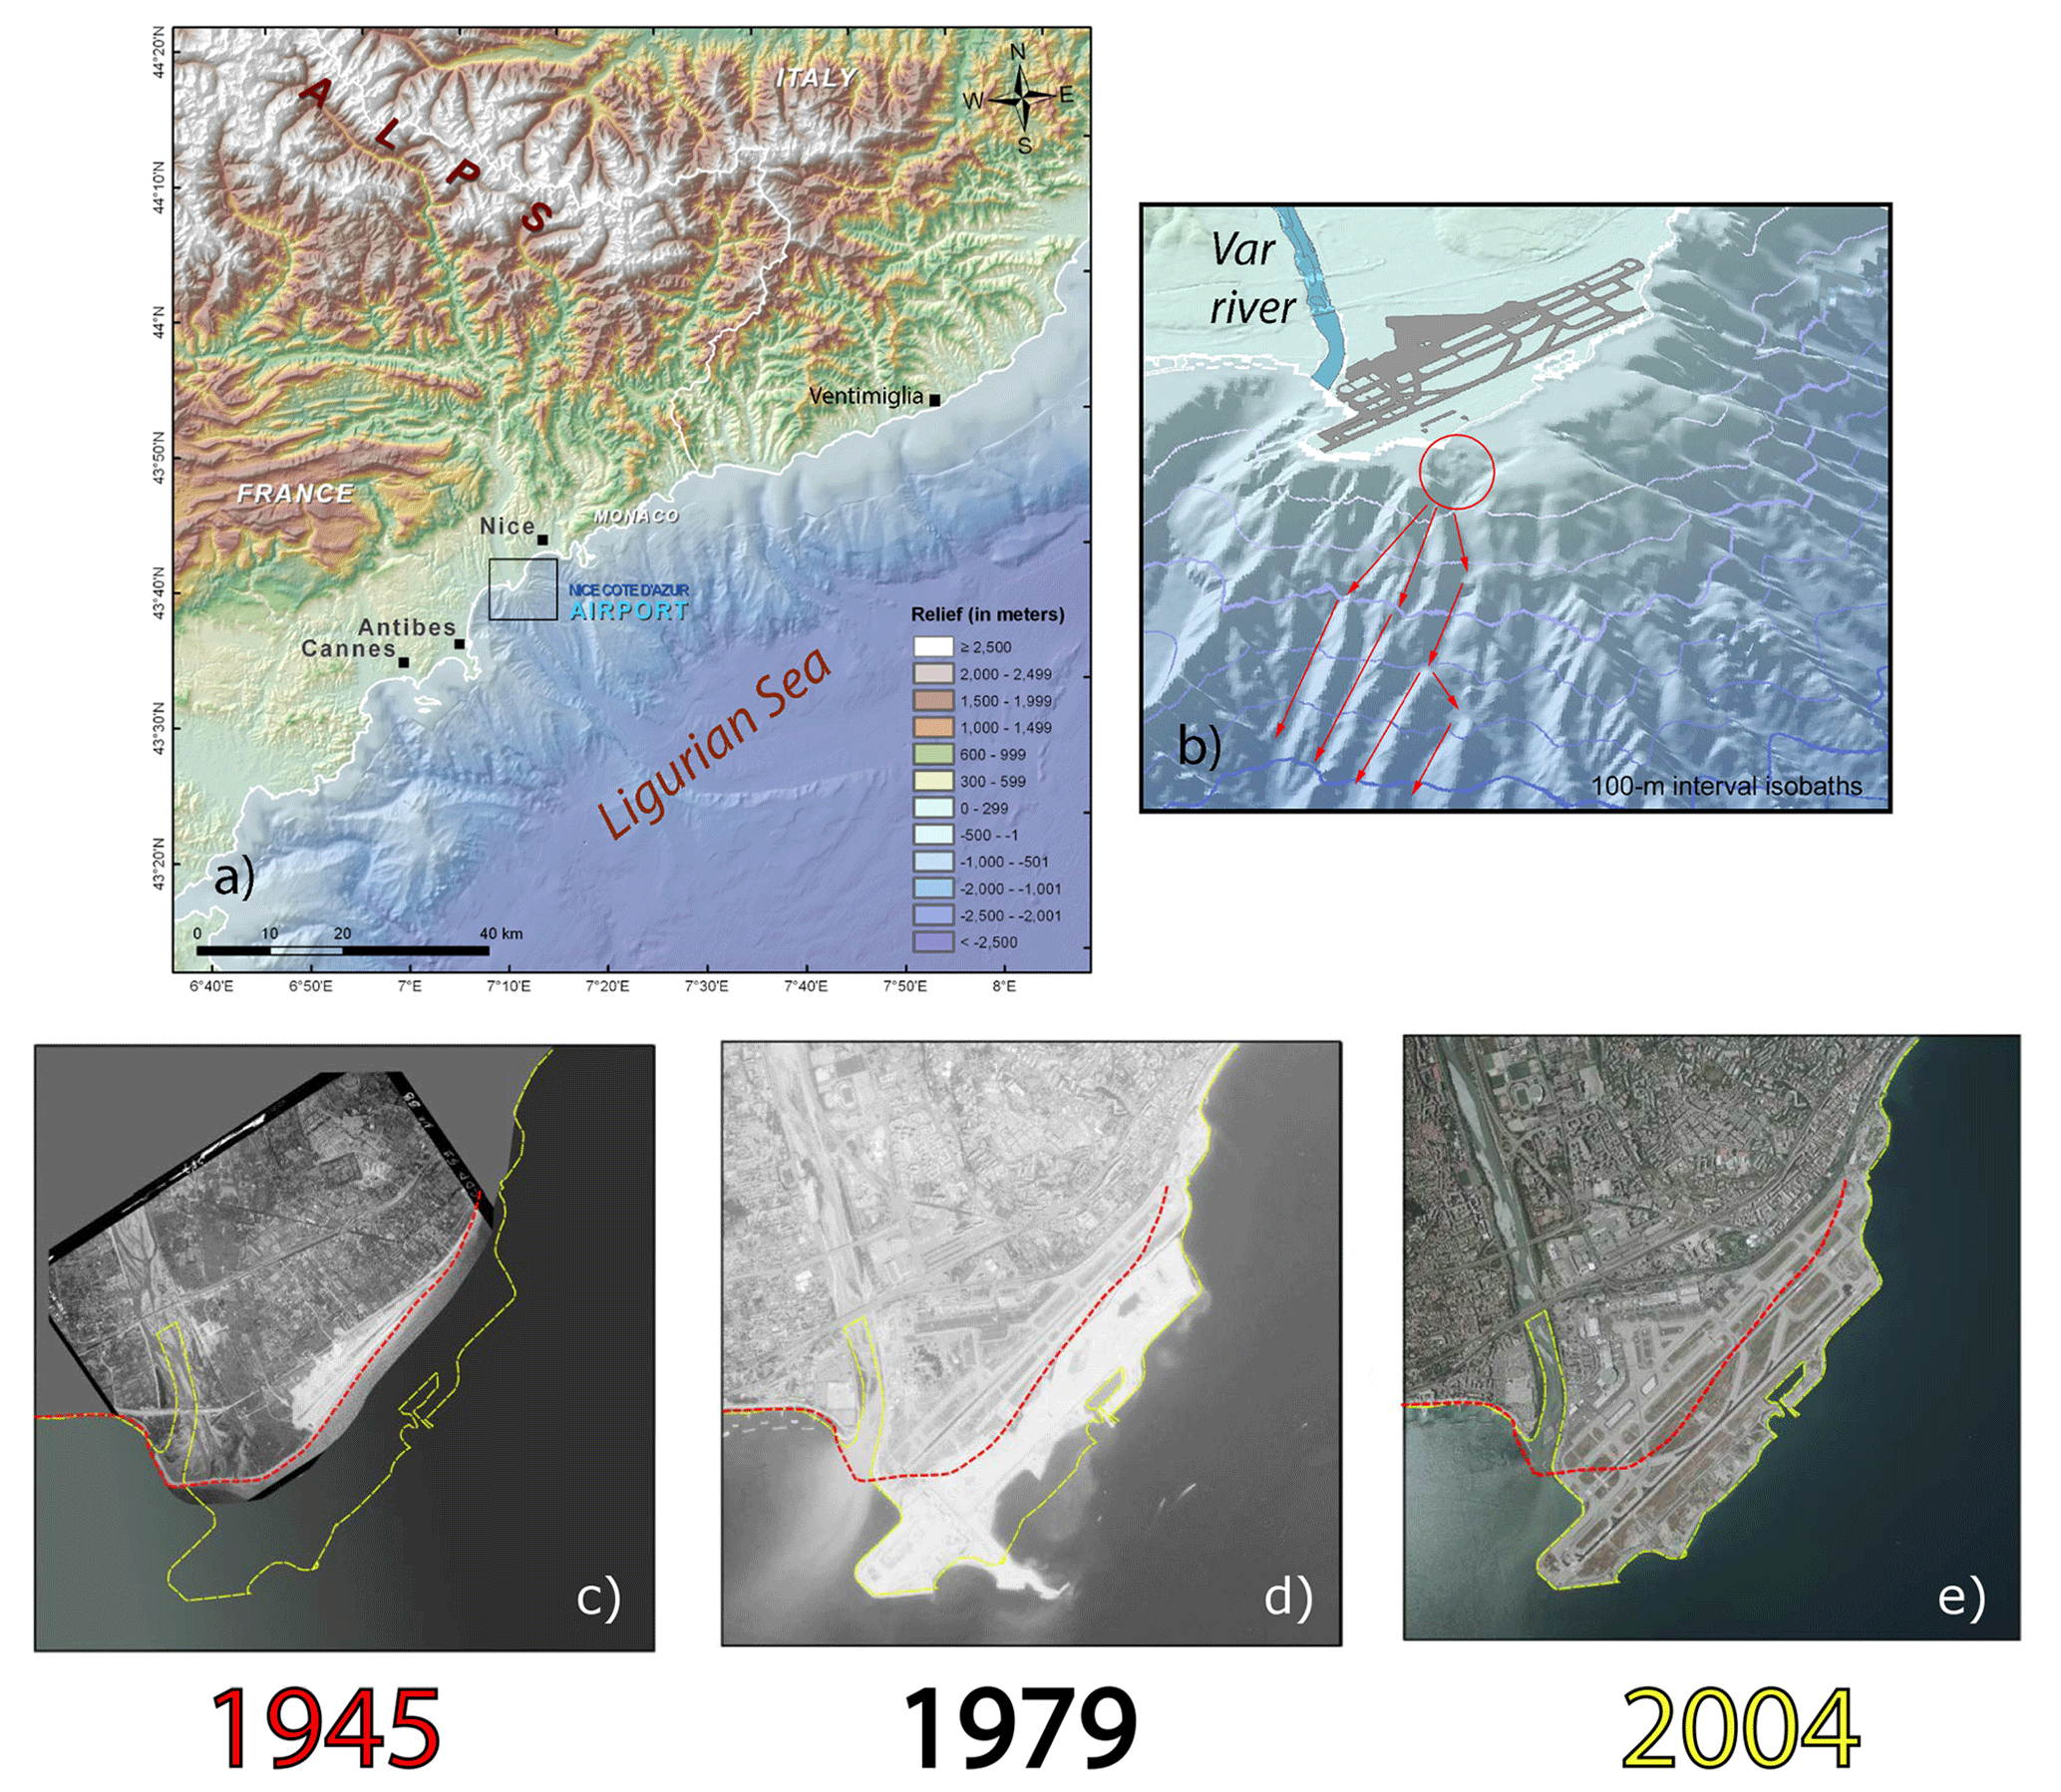
Figure 1(a) Topographic map of the French Riviera showing the large gradient between the southern Alps and the offshore margin of the Ligurian Sea (elevation drop of more than 4000 m over 40 km). The black square indicates the close-up footprint shown in (b). (b) Zoom on the Nice Côte d'Azur Airport with a 3D perspective. The red circle shows the airport extension area which collapsed in 1979. The paths of the landslide are indicated with red arrows. (c–e) Three aerial photographs showing the evolution of the Nice Côte d'Azur Airport with the first tar runway in 1945, the maximum extension of the platform including the dyke that collapsed in October 1979, and the final shape of the airport in 2004 (it has not changed since then). On each photograph, the red and yellow dashed lines represent the coastline as it was in 1945 and 2004, respectively. Photo credit: aerial photographs are archived by IGN (Institut national de l’information géographique et forestière) and can be found at https://remonterletemps.ign.fr (last access: 23 September 2023).
Cavalié et al. (2015) published an initial study showing that between 2003 and 2011 (the acquisition period of Envisat) the Var River delta, as well as the airport that is located at its mouth, is subsiding. The spatial extent of this subsidence is strictly limited to the Quaternary alluvium deposits of the delta and bed of the Var River (Fig. 4 in Cavalié et al., 2015). Actually, on both sides of the riverbed, the subsidence rate quickly drops to 0 where the transition from alluvium to conglomerate occurs. Moreover, the downward displacement rate increases toward the sea as the sediment layers get thicker and more recent (Fig. 6 in Cavalié et al., 2015). Indeed, it ranges from less than 1 mm yr−1 in the Var valley to a maximum rate of 10 mm yr−1 on the airport platform, where sediments were brought in the 1970s to build the runways.
During the 2003–2011 period, InSAR data show essentially a steady subsidence. Here, we extended the time series in order to observe the behaviour of the airport platform over a longer period (1992–2020). This long observation period provides an opportunity to investigate new mechanisms driving vertical land motion in coastal areas. Actually, no physical process could explain a constant subsidence rate over several years. We thus processed the data from the ERS satellites between 1992 and 2001 and the data acquired by Sentinel-1 for the period 2014–2020. Then we discussed and modelled the information brought by these new datasets. In particular, we investigated whether a model of creep compaction of the airport platform can explain the data. Unlike previous studies, this model is not a simple mathematical function fit but rather uses a geomechanical framework for slow creep to estimate the physical parameters of the slope materials. Through our investigations, we measured a deceleration of the maximum subsidence rates of the platform from 16 mm yr−1 (1992–2001) to 9.5 mm yr−1 (2003–2011) to 8 mm yr−1 (2014–2020) over the study area. The uncertainty in subsidence rates has been carefully estimated by two different methods, both leading to estimates of about 0.3 mm yr−1 for the three periods, more than an order of magnitude below the measured rates. We find that the non-linear surface displacement can be explained by a transient creep mechanism that fits the whole temporal evolution of observations. These results are useful for future physics-based forecasting models of the coastal slope evolution.
In the following sections, we shortly recount the history of NCA. Then, we present the InSAR measurement of the airport platform deformation, including a noise analysis of the generated dataset. This latest point is rarely discussed in the subsidence studies, although it is crucial to accurately assess the hazard due to the subsiding area. Finally, we model the InSAR observation to better understand the underlying physical process of the platform subsidence and discuss the potential consequences of such vertical displacements.
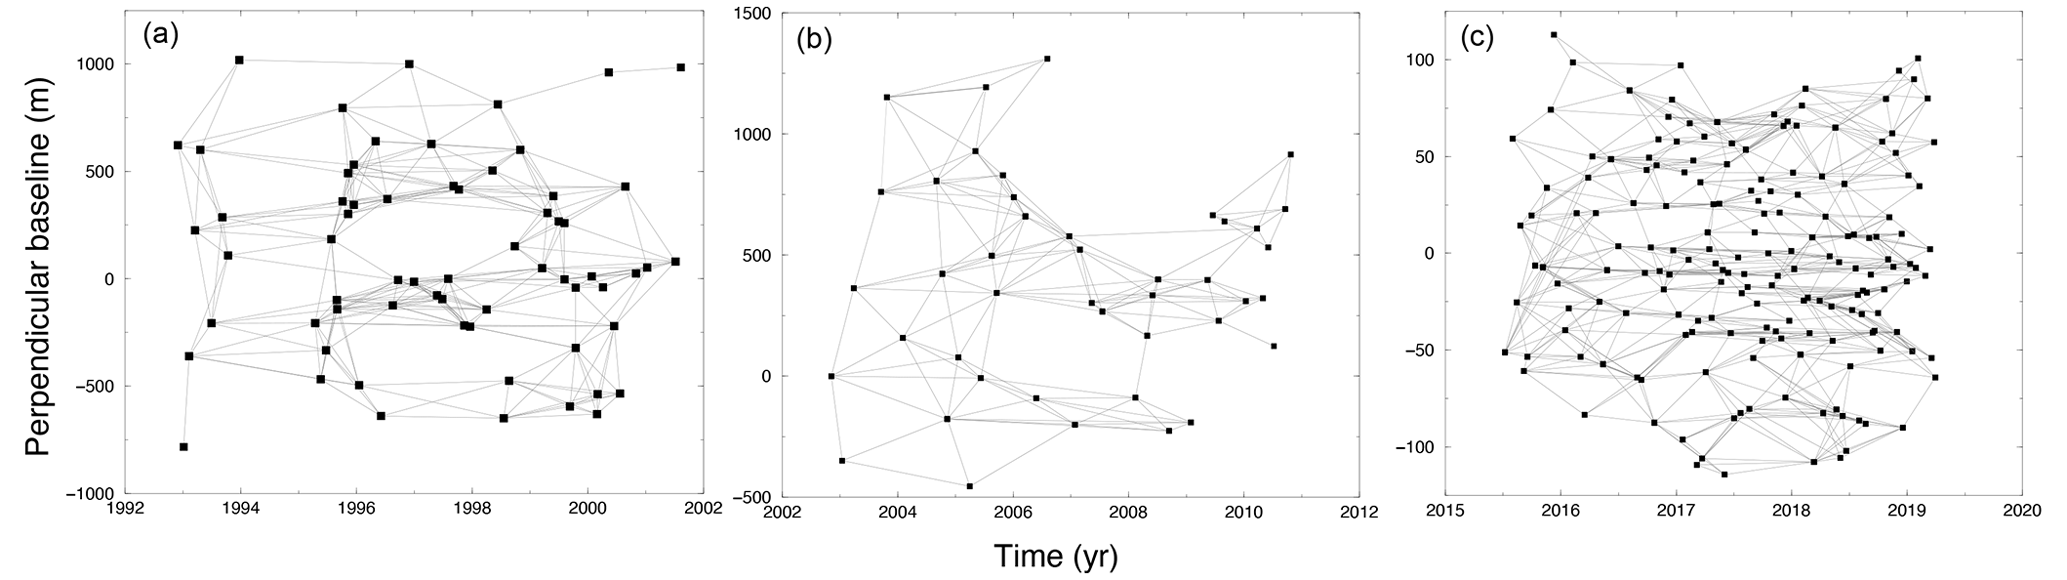
Figure 2Relative position of orbits plotted as a function of image acquisition date for (a) descending ERS track 22, (b) descending Envisat track 22, and (c) descending Sentinel-1 track 139. Grey lines show image pairs processed into interferograms that are included in the time series analysis.
For the first half of the 20th century, Nice only hosted an aerodrome made of a single dirt track. The history of the Nice Côte d'Azur Airport really started in 1944 when the Allies set up a logistics base in Nice and thus built the first tar runway (Fig. 1c). In the following years, a few limited inland extensions (several hectares) of the airport platform have been done to welcome bigger planes. However, the airport is stuck between the sea and city of Nice, which prevents any development inland. As air traffic increased, it was decided to extend the airport southward, on reclaimed land over sea, in order to build a second runway. More than 100 studies have been done as it is a real challenge to build there, notably because the continental shelf is very narrow (less than 2 km wide) and is bounded by very steep and deep slopes. The structural work of the platform was performed between 1975 and 1978 when 30 000 000 t of material were brought from a neighbouring hill (Ollié, 1982). The sediments were then dynamically compacted (with a 130 kg of mass falling from 23 m high). Meanwhile a 3 km long seawall has been built to protect the platform from the sea storms. In July 1978, the structural work of the airport platform was finished, while construction work was continued to build a dyke where a commercial port would take place. Unfortunately, on 16 October 1979, an undersea landslide triggered the collapse of this dyke (Fig. 1b, d, and e). As a result, the port project was dropped, and the next 3 years were dedicated to consolidate the airport platform. In 1982, the last stage of the work including the construction of the pavement was achieved. The Nice Côte d'Azur Airport was then inaugurated in 1983 (de la Tullaye, 1989). Since then, only minor changes were added, and Fig. 1e shows the shape of the airport platform as it is today.
3.1 Data and method
In order to extend the temporal observation window of Cavalié et al. (2015) (that spans the period 2003–2011), we processed data acquired previously by the ERS satellites and recent data acquired by the ongoing Sentinel-1 mission. The 2015 study gives important information about the deformation detected on the airport platform. In particular, it shows that the displacement is almost purely vertical (i.e. no horizontal motion stands out of the noise). So, as it is 1D motion, one can process only one track and then project the line-of-sight (LOS) InSAR displacement into the vertical direction (, where Dvert is the vertical displacement, DLOS the line of sight displacement, and α the incidence angle at each pixel location). For the ERS mission, the European Space Agency (ESA) clearly favoured acquisitions on descending orbits for this area. We, thus, selected track 22, where 65 images were acquired between November 1992 and September 2001 (while only 26 images are available for the ascending track over the same period). Envisat data have been already processed in Cavalié et al. (2015). For Sentinel-1 data, we processed the descending track 139. We took advantage that Sentinel-1 SAR images are made of multiple bursts in order to select only those that cover the airport. As the airport is a kilometric object, only two bursts of the first subswath need to be processed.
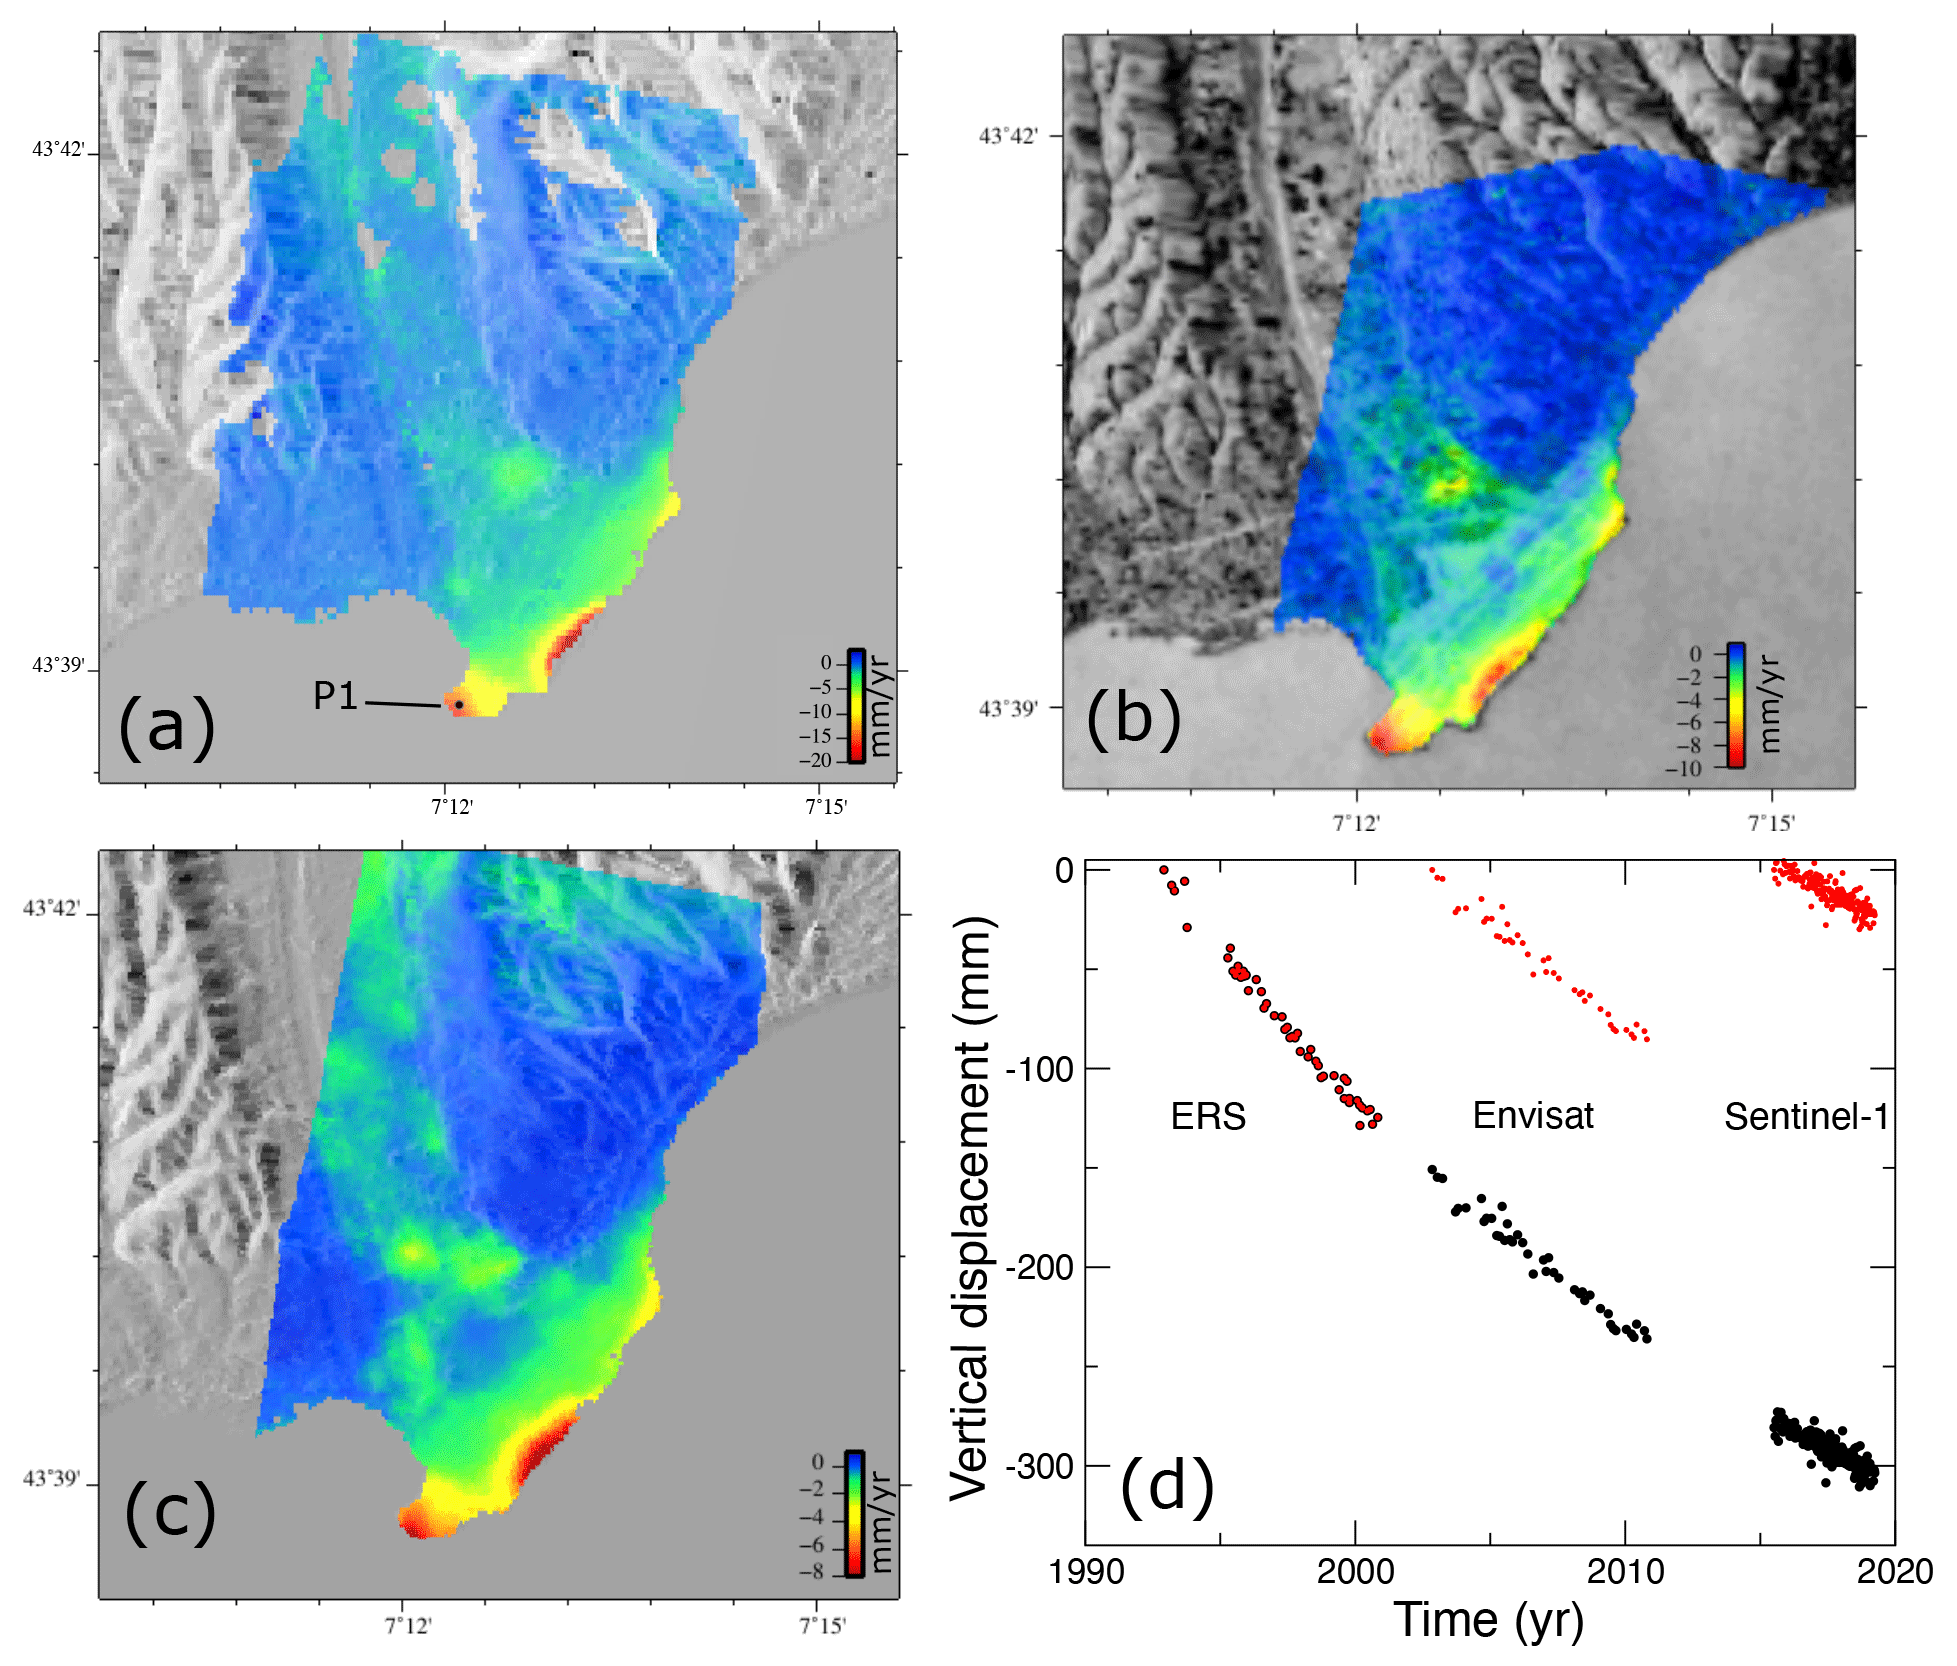
Figure 3Projected vertical ground velocity (mm yr−1) measured from (a) ERS (1992–2001), (b) Envisat (2003–2011), and (c) Sentinel-1 (2015–2020) data. Note that the colour scale changes and is adapted to show the persistent patterns of deformation over time. Black dot in (a) shows the location of pixel P1. (d) Time series of P1 vertical displacement. Red dots correspond to the three time series computed independently. Black circles represent the reconstructed time series by constraining the displacement as a logarithmic function.
We mostly followed the same methodology as in Cavalié et al. (2015). Ground displacement time series are generated from interferograms using the NSBAS (new small baseline subset) processing chain (Doin et al., 2012). As with all small baseline processing chains, the main idea consists in limiting both the temporal and spatial baseline between the images that will be combined to compute the interferograms in order to optimize the interferometric phase coherence and thus keep the highest possible number of pixels for the deformation analysis. Figure 2 shows the network of interferograms based on the image acquisition configuration for ERS, Envisat, and Sentinel-1 data. However, for ERS data, this strategy was not sufficient to reduce phase noise, and we used MuLSAR (Multi-Link SAR) software (Pinel-Puysségur et al., 2012) in order to further improve the phase stability. The principle of this software is to combine different redundant paths between acquisition dates in order to reduce the phase noise level on the wrapped interferograms. In the case of ERS data, as many interferograms are very noisy, it is necessary to filter the wrapped interferograms with a dedicated filter. Indeed, the unwrapping process is a very tricky step, and large parts of interferograms may be lost if they are not properly filtered before unwrapping. Thus, the MuLSAR filter which proved efficient for the filtering of very noisy interferograms (Grandin et al., 2012) has been applied.
ERS and Envisat interferograms are corrected for orbital and topographic components using Doris (Doppler Orbitography by Radio-positioning Integrated by Satellite) and the ALOS DEM, respectively. The ALOS DEM is also used to correct Sentinel-1 interferograms. To help with the phase unwrapping, interferograms are filtered and slightly downsampled by pixel multilooking with 2 looks in range and 2×5 looks in azimuth for ERS and Envisat interferograms and 2 looks in azimuth and 2×4 looks in range for Sentinel-1 data. The resulting pixel spacing is ∼40 m × 40 m. Interferograms are properly referenced using areas around the airport that has been proven to be stable (Cavalié et al., 2015). Finally, we used a constrained least-squares inversion (Doin et al., 2012) in order to derive the surface displacement rates from the interferograms. A temporal smoothing operator is applied to limit phase variations due to turbulent atmospheric delays (although atmospheric delays are limited as InSAR is a relative measurement and we work at small scale). Surface velocity maps shown in Fig. 3 are derived from the linear component of the time series for each pixel.
3.2 Surface displacements observed from 1992 to 2020
Figure 3a–c shows the averaged vertical ground velocity for the ERS (1992–2001), Envisat (2003–2011), and Sentinel-1 (2014–2020) periods. Note that the colour scale changes to match the maximum velocity value. This representation allows for seeing that the spatial displacement pattern is steady through the whole observation window, although the amplitude decreases in time. This is a major update compared to the 2015 study (Cavalié et al., 2015), where the time window was too short to reliably measure any slowdown of the surface displacement. Thus, with this new dataset, we have the opportunity to measure subsidence rate variations over a 28-year-long period of time.
To better observe the temporal variations in the airport platform subsidence, Fig. 3d shows the displacement evolution of pixel P1 that is located in the maximum subsidence area (Fig. 3a). As the changes in the carrier frequency between each generation of satellites prohibit cross-interferogram (Envisat–Sentinel-1 for instance), the time series is discontinued. Thus, Fig. 3d shows the three trends for each satellite period (red dots). A simple linear regression reveals that, for P1, subsidence rates were on average 16, 9.5, and 8 mm yr−1 for the periods 1992–2001, 2003–2011, and 2014–2020, respectively. We thus observe a deceleration of 50 % of the subsidence rates over 28 years. To better visualize the evolution of the pixel displacement through the full period, one can make the assumption that no sharp motion took place between the three measured periods and that the shape of the motion follows a logarithmic function (with Heaviside step functions to take into account the discontinuities):
where t is the time; H1 and H2 are two Heaviside step functions; and a, b, c, d, and e are some constants. By inversion, one can determine them and thus reconstruct the time series (Fig. 3d).
3.3 Noise analysis and discussion
Our InSAR processing strategy turns out to be very effective and shows very nice results both in time (Fig. 3d) and in space (Fig. 3a–c). Actually, on maps, land subsidence is clearly localized in the riverbed (we are able to detect velocity slower than 1 mm yr−1) and then over the airport platform where the downward velocity increases. Qualitatively, we observe little noise in the data, and unlike many studies about subsidence, we do not see any areas with artificial uplift due to atmospheric delays. Indeed, velocity drops sharply to 0 over the consolidated conglomerate located on each side of the riverbed. However, it is important to quantify the error bars on the data as these are often an important parameter for modelling the deformation.
Estimating the noise level is both very important and tricky in InSAR, and thus it is often ignored in the published InSAR studies, or the theoretical values are given. Moreover, in several studies, the noise level is estimated only on displacement measurements by computing the root mean square error between measured and modelled displacements. Even if the measurement of interest is actually velocity, uncertainty in this physical quantity is not derived (Li et al., 2022; Park and Hong, 2021; Xiong et al., 2022). In this study, uncertainties in deformation velocity are computed by two different methods and give similar estimates.
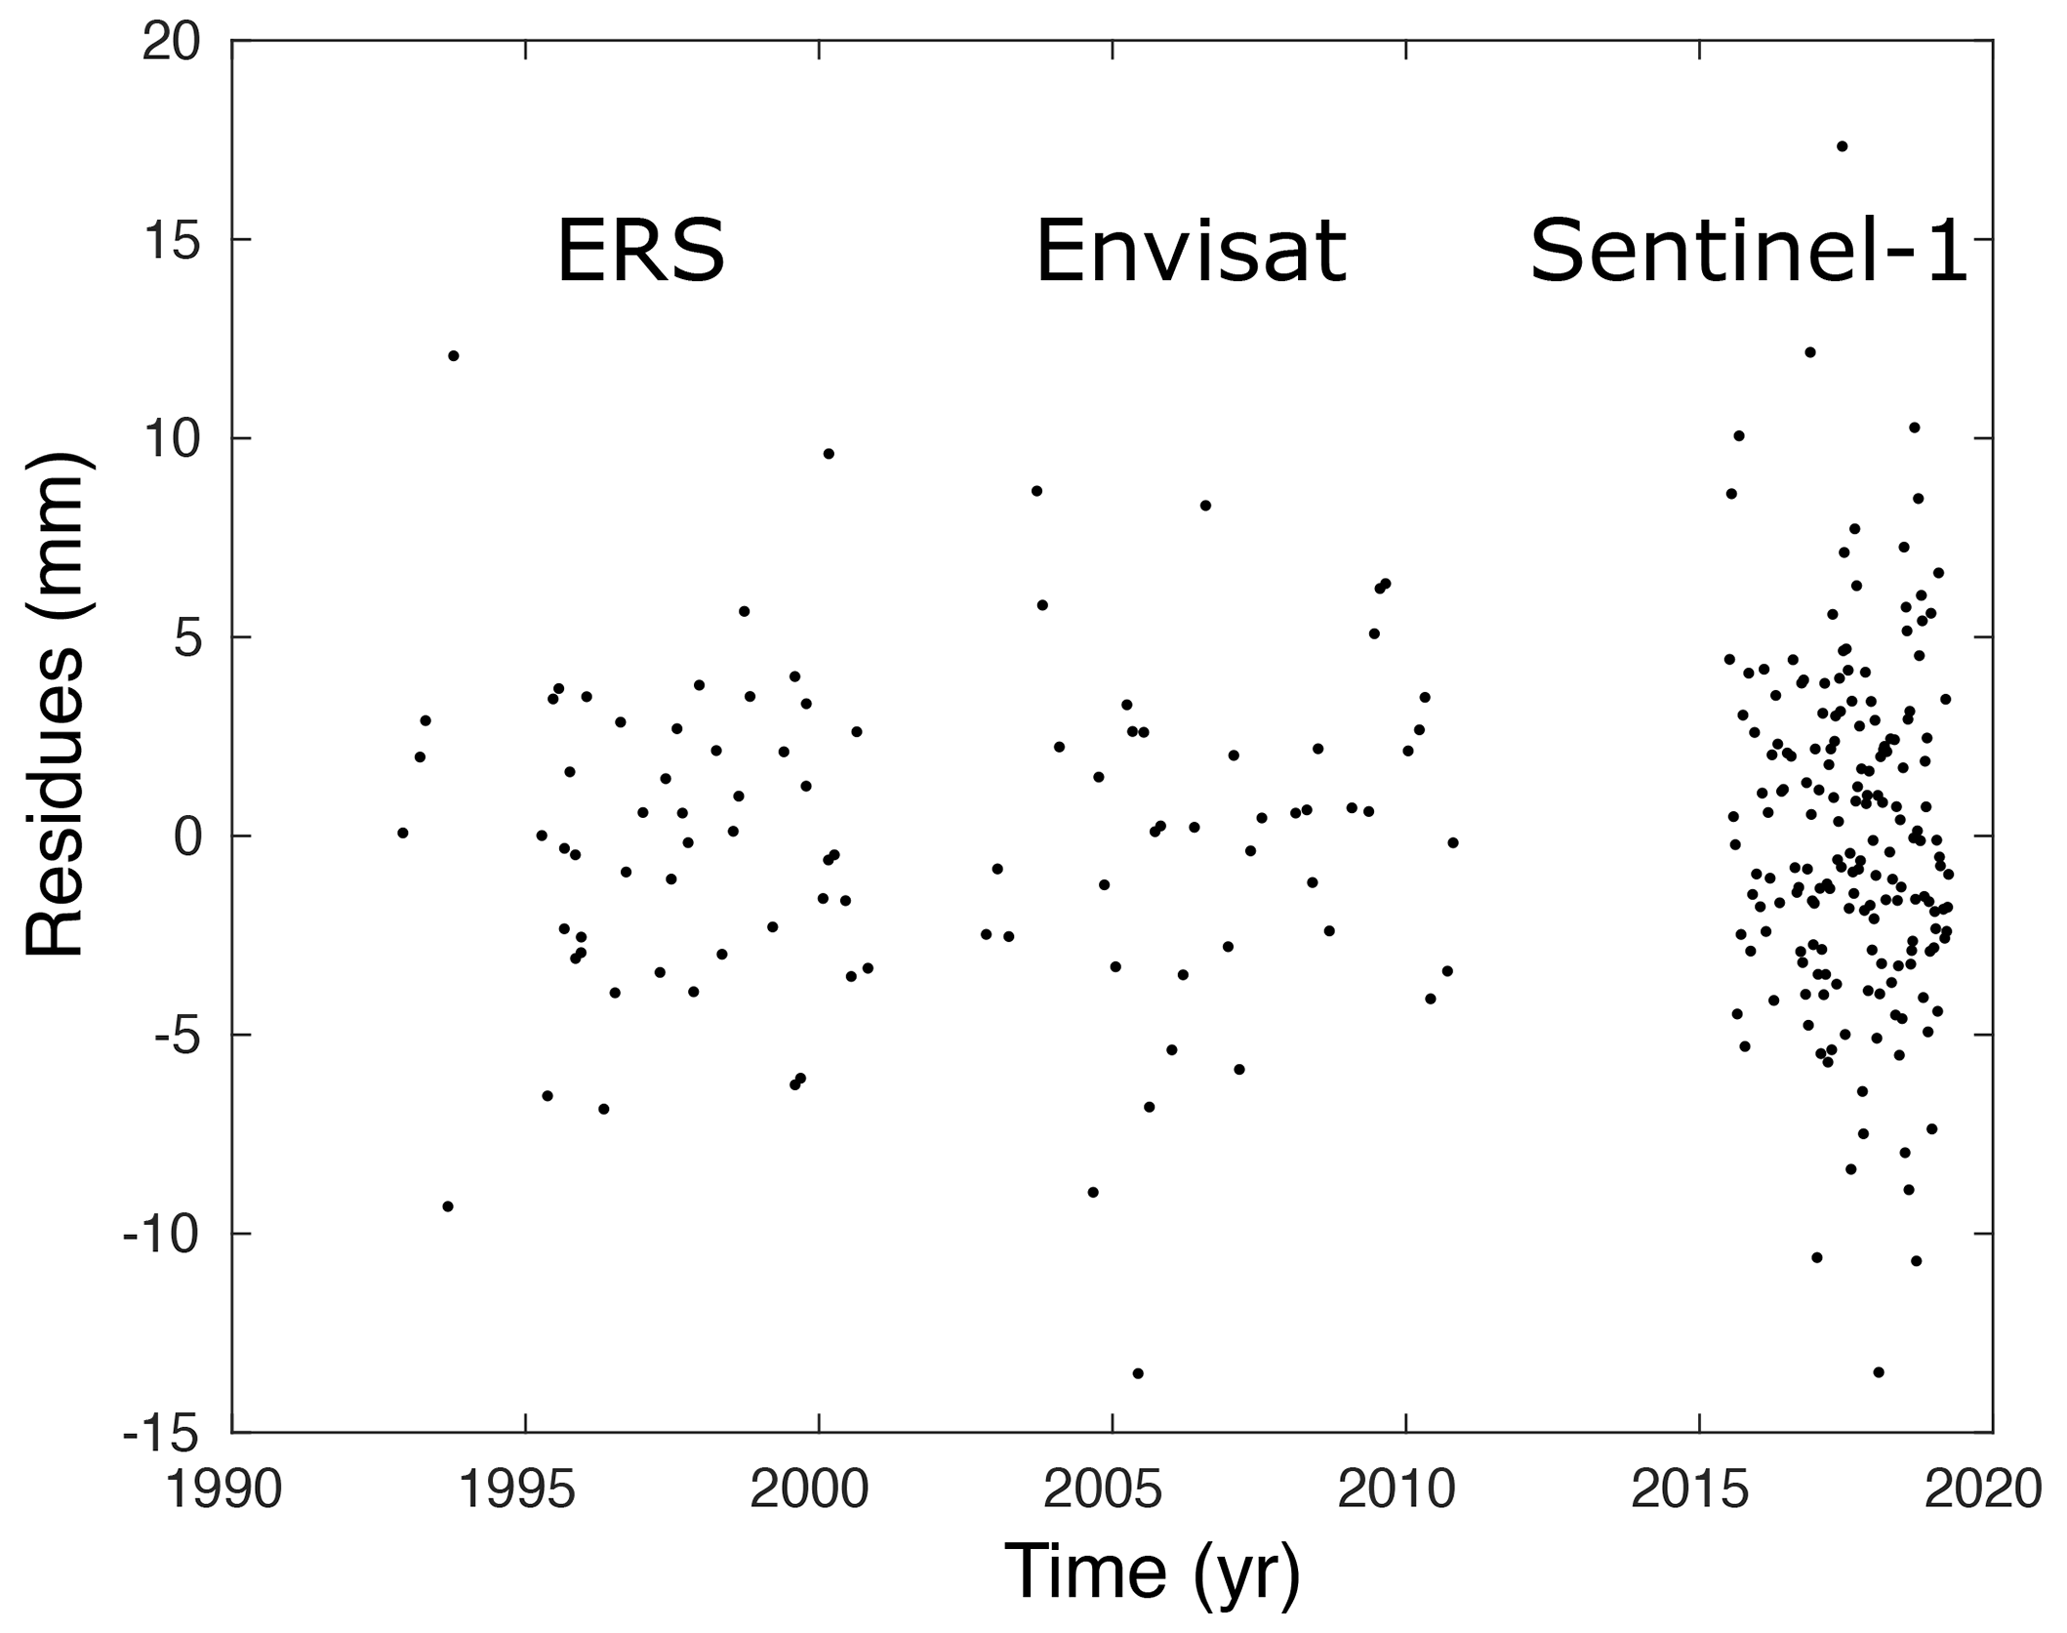
Figure 4Displacement residues for P1 (InSAR time series minus the fit function estimated with Eq. 1). Residue dispersion is ∼4.2 mm.
Several methods have been developed to estimate the noise correlation, notably to compute the InSAR data covariance matrix that is used in the inversion to retrieve parameters of the underlying geophysical phenomena (Sudhaus and Sigurjón, 2009). In the previous study (Cavalié et al., 2015), authors evaluated the uncertainties in the velocity maps by looking at the dispersion of surface velocity measurements in a nearby location where no surface displacement is expected. As a result, all velocity variations observed in the InSAR data are due to noise. Assuming that the noise level is similar in the nearby deformed area, a 1σ error can be computed. With this method, Cavalié et al. (2015) estimated a 1σ error of 0.25 mm yr−1 for the mean subsidence rate that occurred between 2003 and 2011. Similarly, using the time series, one can estimate the temporal dispersion of a pixel located in a stable area. Moreover, if the temporal evolution of the surface displacement is simple enough (as it is the case for NCA), one can remove a deformation model and then observe the residue dispersion. The advantage is that the 1σ error is computed directly in the subsiding area (and not for a pixel located nearby that can be affected by other local sources of noise). Figure 4 displays the InSAR signal residue (after removing the logarithmic function estimated from Eq. 1) for pixel P1 (shown in Fig. 3a). Overall the standard deviation in displacement σd is ∼4.2 mm. Interestingly, we see that data dispersion is very similar for the ERS, Envisat, and Sentinel-1 time series (that have been processed independently). As in Fattahi and Amelung (2015), if we assume that the residue is a Gaussian white noise, the uncertainty in the deformation velocity σv can be estimated for each time series as
where ti is the acquisition dates, is the mean acquisition date, and N is the number of acquisitions. σv is estimated to be 0.27 mm yr−1 for the ERS dataset, 0.28 mm yr−1 for the Envisat dataset, and 0.32 mm yr−1 for the Sentinel-1 dataset. Interestingly, the estimate for the Envisat dataset is very close to the abovementioned 1σ error of 0.25 mm yr−1 estimated by a different method. Deformation velocity derived by InSAR using SBAS (small baseline subset) type techniques (Berardino et al., 2002) may be biased due to phase misclosure (De Zan et al., 2015). Recent studies suggest that this phenomenon is due to the temporal change in scattering mechanism (Ansari et al., 2021): it occurs either on vegetated areas where the scatterers vary in time due to growth or decay of the vegetation or on bare soils where the moisture level changes according to precipitation events. However, our study is focused on an urbanized area that should not be prone to this bias.
4.1 Geological, hydrogeological, and geomechanical context
The time series of surface displacement data estimated from InSAR analysis shows a non-linear transient evolution over 28 years (1992 to 2020) (Fig. 3d). This reflects a progressive and long-term deformation of the subsurface layers. Actually, soils and rocks can exhibit creep behaviour, which is the development of time-dependent strains at a state of constant effective stress (Bland, 1960; Findley et al., 1976; Jaeger and Cook, 2007). Creep behaviour influences the long-term stability of grounds and movement of slopes. This time-dependent material behaviour exhibits viscoelastic or viscoplastic characteristics that can be reproduced with different creep models of increasing complexity depending on the type of material and loading conditions (Jaeger and Cook, 2007).
Previous studies of the submarine slope stability in the area of the Nice Côte d'Azur Airport indicated that the geological formations below the airport deform with a slow-creep process (Dan et al., 2007; Stegmann et al., 2011). Since the 1979 major landslide, an increasing collection of geological, geomechanical, and geophysical data have been acquired in this area, showing it is prone to failure (Kopf et al., 2016; Sultan et al., 2020). Rohmer et al. (2020) showed that the sediment thickness is more than 100 m under the airport area. Based on a combination of field geological observations, borehole data collected down to 100 m depth, and geophysical imaging, a number of studies have characterized the sedimentary system with (1) a basal Jurassic karstic limestones overcome by (2) Pliocene deltaic conglomerates and (3) Early Pleistocene marls and then covered on top by (4) a series of Holocene alluvium composed of silty and clayey lenses, sand, and gravels (Stegmann et al., 2011; Sultan et al., 2020; Courboulex et al., 2020). This succession of sedimentary layers constitutes three overlapping aquifers with different permeabilities and fluid pathways (Du et al., 2019; Sultan et al., 2020). In this hydrogeological system, pore pressure fluctuations (a few tens of kilopascals) are sensitive to long smooth seasonal variations (Sultan et al., 2020). Importantly, a clay layer is suspected to be the creeping section of the continental slope below the sea level and a potential contributor to the origin of submarine landslide (Leynaud and Sultan, 2010; Sultan et al., 2020). This weak clay layer, situated between 30 and 45 m b.s.l. (below sea level), was detected from in situ piezocone measurements (i.e. CPTU, cone penetration testing) and sediment cores (Dan et al., 2007). The softening of this sensitive layer may affect the global strength of the sedimentary system below the airport area. Consequently, it is important to investigate the creep process to explain the slope deformation and failure. In addition, the time series of surface displacement measured from 1992 to 2020 indicates that the displacement is mainly vertical and the horizontal component is negligible. This behaviour suggests that a creep compaction is probably at play.
4.2 Modelling of long-term slow-creep processes
Several models have been developed to describe creep and failure in rocks (Jaeger and Cook, 2007). Creep represents strain increase with time. A typical creep curve indicates three different regions: primary, secondary, and tertiary creep (Fig. 5a). Once the material experiences an instantaneous strain, as a result of sudden loading, the region of primary creep begins and has a decreasing strain rate with time. This behaviour continues until the secondary stage starts with a constant strain rate. The strain rate in the secondary stage is the minimum strain rate of creep deformation. The last stage of creep deformation is the regime of tertiary creep characterized by a very high strain rate and eventually failure.
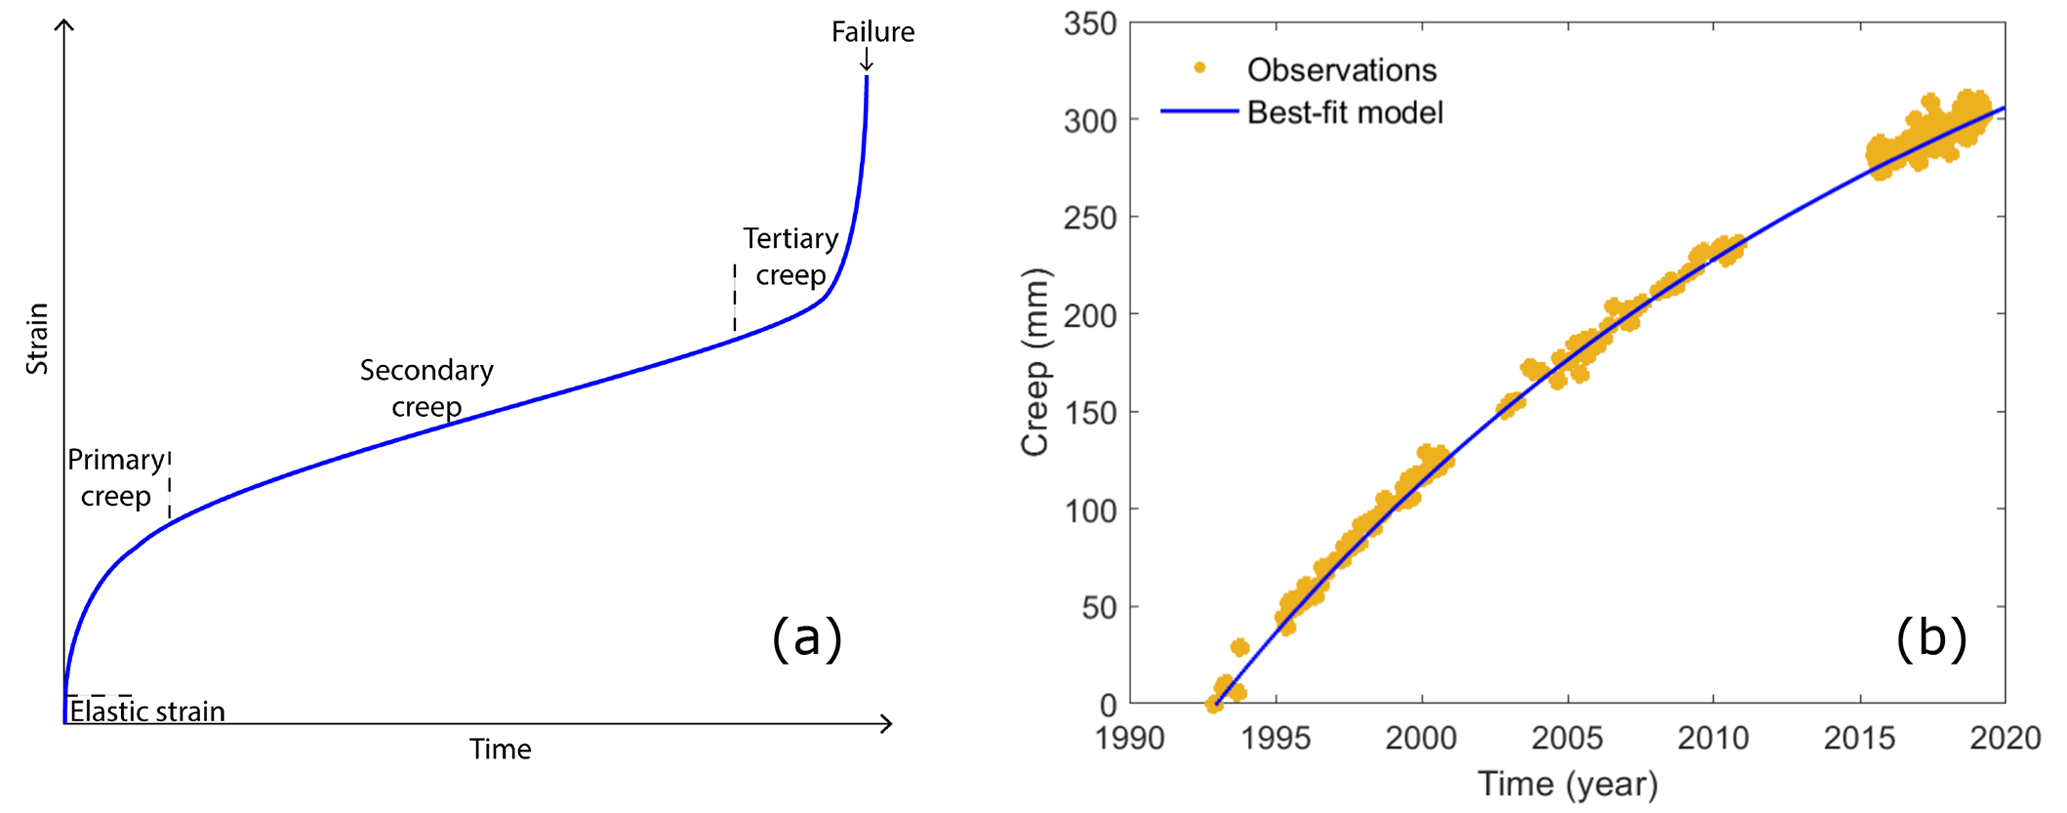
Figure 5(a) Strain–time plot for a conventional creep experiment. On this typical creep curve, the three creep phases (primary, secondary, and tertiary) are labelled. (b) Time series of the measured displacement and the best-fit numerical solution using the extended viscoelastic Burgers model. The model adjusts the data with χ2=0.18957. Note that to better compare the airport platform deformation to the conventional creep curve, we took the absolute values of the ground displacements.
The shape of the observed displacement at the surface of the airport is similar to the shape of the stages of primary and secondary creep of the theoretical creep curve. A viscoelastic Burgers model can effectively reflect the stages of primary and secondary creep of rock creep process; however, it cannot describe the acceleration phase of tertiary creep. Here, we use an extended Burgers creep model made up of a series of Maxwell and Kelvin bodies (Jiang and Wang, 2022) to reproduce the InSAR observations. Such a viscoelastic model was previously employed to model soil deformation (Yao et al., 2021), fault relaxation after earthquakes (Sun and Wang, 2015), and landslide creep (Zou et al., 2013; Liao et al., 2022) and is often used in geology to illustrate the effects of both strain and stress relaxation. The transient creep (δ) with time (t) is analytically calculated as follows:
where EM, , and are the elastic moduli of the Maxwell body, first Kelvin body, and second Kelvin body, respectively; ηM, , and are the viscosity of the Maxwell body, first Kelvin body, and second Kelvin body, respectively; and σ0 is a constant uniaxial load. The transient Kelvin component of the rheology is considered to be dominant at short timescales, while the Maxwell component dominates at long timescales (Jaeger and Cook, 2007). With this 1D model, seven parameters need to be adjusted. We used an adaptive grid search method to invert the parameters. We set up the search range of each parameter to explore a large number of possible solutions, which is about 2.3 million solutions. For the goodness of fit of the best-fit solution, the misfit between the observed (obsi) and model-predicted (predi) displacement is estimated with the reduced χ2, defined as
where N is the number of observations, m is the number of model parameters, and σi is the uncertainties (4.2 mm here).
Figure 5b shows the best-fit numerical solution to the measured displacement over time. The model provides a satisfying fit of observations and adjusts the data with a reduced χ2 of 0.18957 and leads to σ0=0.099 MPa, EM=32.1 MPa, MPa, MPa, ηM=42.63 MPa yr−1, MPa yr−1, and MPa yr−1. These values are consistent with the range of values obtained in laboratory experiments conducted on clays under the triaxial compression condition (Xue et al., 2020). The difference between the observed and modelled displacements mostly reflects the data dispersion as we find a very similar standard deviation, 4.1 mm, for the residues (data minus model). Thus, this result suggests that a transient creep mechanism properly models our observations of the vertical displacement associated with a long-term compaction of materials. Based on this assumption, the airport deformation is still in the primary stage of the creep process.
Although the data are well reproduced with an extended Burgers creep model, which allows for investigating a transient rheology for viscous compaction, an extension to a creep damage model in a 3D stress state would be adapted to explore the full non-linear viscoelastoplastic behaviour with potential damage accumulation and accelerated creep (stage of tertiary creep in Fig. 3d) toward dramatic failure. However, the 1D viscoelastic creep model used here is well adapted to explain the data with a satisfying fit over the 28 years of observation.
Land use is particularly disputed in coastal areas as they are often highly populated. The intense human activities lead to an increase in various hazards including vertical land motion due to superficial soil compaction. These latest phenomena can be caused by either natural or anthropogenic phenomena and can lead to further coastal erosion, flooding, or land salinization in the case of groundwater pumping. Actually, most of the subsidence affecting the coastline near big cities is related to groundwater pumping (especially in Southeast Asia, like in Jakarta for example), but subsidence is a natural common feature of large river deltas (Nile, Mississippi, or Po rivers, for instance) and is due to compaction of the Holocene sediment strata. In the Var River delta (French Riviera, France), we observe the interaction between the natural compaction of the unconsolidated Holocene sediments in the Var River delta with the construction of artificial infrastructure (NCA) that brought an additional superficial load on top of the sediment. This extra load leads to a drastic amplification of the subsidence rate as observed in Cavalié et al. (2015). In the case of the Var River delta, hazard is also amplified by the fact that the overload of sediment has been used to reclaim land over sea in a place where the continental shelf is narrow and the undersea topography quickly drops to −2500 m (Fig. 1). Understanding the mechanism and thus the evolution of sediment compaction is essential to evaluate the danger caused by the coastal subsidence.
Therefore, we use SAR interferometry to measure and analyse the temporal evolution of the ground displacement on the Nice Côte d'Azur Airport platform over a long period of 28 years. Extending the observation window to study the long-term subsidence leads to substantial improvements in the understanding of the ongoing mechanisms along this coastal area. Indeed, the previous study (Cavalié et al., 2015) measured the airport platform subsidence using only the Envisat data that span the 2003–2011 period. This relatively short period of observation impeded the accurate detection of non-linearity in the surface displacement and its change rate. By adding the ERS and Sentinel-1 data, the observation window more than tripled (1992–2020), and time series of the surface displacement clearly reveal a transient non-linear deformation with a decelerating subsidence rate over time, which is expected for ground layer compaction. Then, we used a simple analytical Burgers creep model to constrain the mechanisms and rheology at play. The data are properly explained by the phases of primary and secondary creep, highlighting a slow viscoelastic deformation at multiyear timescales. The best-fit solution allows for retrieving reasonable mechanical values of the airport sediments that have been brought to build the platform extension. Our study thus proves that the long-term InSAR data can improve our understanding of the surface processes and the subsurface material properties.
Although the subsidence rate decelerates, at least for 28 years, our results show that the compaction of the sediment is still active and its future evolution is uncertain and still at stake. Indeed, if compaction bands are developing under the airport platform, creep processes could potentially lead accumulated material damage to failure. Thus, through our investigations, the data indicate that the stability of the airport platform should be monitored continuously with additional high-quality space and land observations together with submarine instrumentation on the continental slope right below the airport. Indeed, the anticipation of potential future slope failures is a challenging question, especially with the current available data and without understanding the sensitivity of creeping rates in the sediments. The clay sediments can creep at varying rates due to different stress factors, such as airport platform loading and potential fluid pressure increases from precipitation. Earthquake shaking in this seismic area could also accelerate creep rates. When subjected to high deviatoric load, significant creep may occur, leading to a decrease in sediment resistance and potential slope failure. Moreover, an increase in fluid pressure can reduce effective stress and expedite sediment creeping to slope failure. Presently, it is clear that the airport platform is slowly creeping, and multiple triggering processes are possible. To gain a comprehensive understanding of the creep characteristics of clay sediments, conducting controlled laboratory experiments under varying disturbance amplitudes and frequencies would be highly beneficial. These experiments would allow us to examine the specific influence of different factors on the creep deformation at each stage of the process. Finally, even if the airport platform were absent, the slope would likely still experience creep due to the clay layer, although at a much slower rate and different evolutionary stage. To gain a clearer understanding of the slope's stability under slow, long-term, and fast dynamic loading, it would be beneficial to gather high-resolution geotechnical, hydrogeological, and seismic data across the Var River delta platform and slope. Combined with geomechanical modelling, such data could help to validate the assumptions regarding the slope's stability and provide valuable insights into potential future slope failure scenarios.
In an era in which climate change and sea level rise pose unprecedented threats to coastal ecosystems and urbanization (Shirzaei and Bürgmann, 2018; Shirzaei et al., 2021), the long-term observations of ground motion from space are essential to monitor the stability of coastal environments and will inform managers and policymakers in identifying zones with exposure to hazards.
Raw data used in this study are freely available online. Sentinel-1 SAR images are from the PEPS (Plateforme d’Exploitation des Produits Sentinels) platform (https://peps.cnes.fr/rocket/#/search, CNES, 2023). ERS and Envisat SAR data were obtained free of charge through an ESA Category-1 project (https://earth.esa.int/eogateway/catalog/ers-1-2-sar-im-l0-sar_im__0p-, ESA, 2023a and https://earth.esa.int/eogateway/catalog/envisat-asar-im-l0-asa_im__0p- ESA, 2023b, respectively). The digital elevation model is freely available from JAXA (Japan Aerospace Exploration Agency) (https://www.eorc.jaxa.jp/ALOS/en/index_e.htm, JAXA, 2023). ERA5 global reanalyses of atmospheric data are distributed by the ECMWF (https://www.ecmwf.int/en/forecasts/dataset/ecmwf-reanalysis-v5, ECMWF, 2023). Velocity maps shown in Fig. 3 are archived on Zenodo (https://doi.org/10.5281/zenodo.7038263, Cavalié, 2022).
OC initiated the project and processed the InSAR data with the help of BPP. FC analysed the deformation in terms of the mechanical process and modelled the InSAR data. All authors were involved in the writing process of the article.
The contact author has declared that none of the authors has any competing interests.
Publisher's note: Copernicus Publications remains neutral with regard to jurisdictional claims in published maps and institutional affiliations.
This work was supported by CNES (Centre National d'Études Spatiales) and focused on data provided by the European Space Agency (ERS, Envisat, and Sentinel-1 missions). We thank the three anonymous reviewers and the editor for their careful reading and comments that improved the original version of the paper.
This research has been supported by CNES through the “Var-risque” project.
This paper was edited by Margreth Keiler and reviewed by three anonymous referees.
Aimaiti, Y., Yamazaki, F., and Liu, W.: Multi-Sensor InSAR Analysis of Progressive Land Subsidence over the Coastal City of Urayasu, Japan, Remote Sens., 10, 1304, https://doi.org/10.3390/rs10081304, 2018. a
Ansari, H., De Zan, F., and Parizzi, A.: Study of Systematic Bias in Measuring Surface Deformation With SAR Interferometry, IEEE T. Geosci. Remote, 59, 1285–1301, https://doi.org/10.1109/TGRS.2020.3003421, 2021. a
Atwater, B. F.: Evidence for great Holocene earthquakes along the outer coast of Washington State, Science, 236, 942–944, 1987. a
Berardino, P., Fornaro, G., Lanari, R., and Sansosti, E.: A new algorithm for surface deformation monitoring based on small baseline differential SAR interferograms, IEEE T. Geosci. Remote, 40, 2375–2383, https://doi.org/10.1109/TGRS.2002.803792, 2002. a
Bland, D. R.: The Theory of Linear Viscoelasticity, Pergamon Press, New York, ISBN 9780486462691, 1960. a
Bürgmann, R., Rosen, P. A., and Fielding, E. J.: Synthetic Aperture Radar interferometry to measure Earth's surface topography and its deformation, Annu. Rev. Earth. Planet. Sci., 28, 169–209, 2000. a
Cahoon, D. R., Reed, D. J., and Day Jr., J. W.: Estimating shallow subsidence in microtidal salt marshes of the southeastern United States: Kaye and Barghoorn revisited, Mar. Geol., 128, 1–9, 1995. a
Cavalié, O.: Vertical velocity maps for the Nice Côte d'Azur airport measured by InSAR, Zenodo [data set], https://doi.org/10.5281/zenodo.7038263, 2022. a
Cavalié, O. and Trouvé, E. (Eds.): Surface Displacement Measurement from Remote Sensing Images, ISTE – Wiley, ISBN 978-1-78945-083-5, 2022. a
Cavalié, O., Sladen, A., and Kelner, M.: Detailed quantification of delta subsidence, compaction and interaction with man-made structures : the case of the NCA airport, France, Nat. Hazards Earth Syst. Sci., 15, 1–12, https://doi.org/10.5194/nhess-15-1-2015, 2015. a, b, c, d, e, f, g, h, i, j, k, l, m
CNES – Centre National d'Etudes Spatiales: PEPS – Operating platform Sentinel products”, https://peps.cnes.fr/rocket/#/search (last access: 23 September 2023), 2023. a
Courboulex, F., Mercerat, E. D., Deschamps, A., Migeon, S., Baques, M., Larroque, C., Rivet, D., and Hello, Y.: Strong Site Effect Revealed by a New Broadband Seismometer on the Continental Shelf Offshore Nice Airport (Southeastern France), Pure Appl. Geophys., 177, 3205–3224, https://doi.org/10.1007/s00024-019-02408-9, 2020. a
Dan, G., Sultan, N., and Savoye, B.: The 1979 Nice harbour catastrophe revisited: Trigger mechanism inferred from geotechnical measurements and numerical modelling, Mar. Geol., 245, 40–64, 2007. a, b
de la Tullaye, M.: Nice-Côte d'Azur, un aéroport gagné sur la mer, Revue XYZ, 38, 43–45, 1989. a
De Zan, F., Zonno, M., and López-Dekker, P.: Phase Inconsistencies and Multiple Scattering in SAR Interferometry, IEEE T. Geosci. Remote, 53, 6608–6616, https://doi.org/10.1109/TGRS.2015.2444431, 2015. a
Doin, M.-P., Lodge, F., Guillaso, S., Jolivet, R., Lasserre, C., Ducret, G., Grandin, R., Pathier, E., and Pinel, V.: Presentation of the small baseline NSBAS processing chain on a case example: the Etna deformation monitoring from 2003 to 2010 using Envisat data, in: Proc. of FRINGE 2011 Workshop, 19–23 September 2011, Frascati, Italy, https://earth.esa.int/eogateway/documents/20142/37627/Presentation_small_baseline_NSBAS_Etna_deformation_Envisat.pdf (last access: 25 September 2023), 2012. a, b
Du, M., Fouché, O., Zavattero, E., Ma, Q., Delestre, O., and Gourbesville, P.: Water planning in a mixed land use Mediterranean area: point-source abstraction and pollution scenarios by a numerical model of varying stream-aquifer regime, Environ. Sci. Pollut. Res., 26, 2145–2166, https://doi.org/10.1007/s11356-018-1437-0, 2019. a
ECMWF: ECMWF Reanalysis v5 (ERA5), https://www.ecmwf.int/en/forecasts/dataset/ecmwf-reanalysis-v5 (last access: 23 September 2023), 2023. a
ESA: ERS-1/2 SAR IM L0 [SAR_IM__0P], ESA [data set], https://earth.esa.int/eogateway/catalog/ers-1-2-sar-im-l0-sar_im__0p-, (last access: 23 September 2023), 2023a. a
ESA: Envisat ASAR IM L0 [ASA_IM__0P], ESA [data set], https://earth.esa.int/eogateway/catalog/envisat-asar-im-l0-asa_im__0p- (last access: 23 September 2023), 2023a. a
Farrell, W. and Clark, J.: On Postglacial Sea Level, Geophys. JR Astron. Soc., 46, 647–667, 1976. a
Fattahi, H. and Amelung, F.: InSAR bias and uncertainty due to the systematic and stochastic tropospheric delay, J. Geophys. Res.-Solid, 120, 8758–8773, https://doi.org/10.1002/2015JB012419, 2015. a
Findley, W. N., Lai, J. S., and Onaran, K.: Creep and Relaxation of Nonlinear Viscoelastic Materials, North-Holland Publishing Company, New York, ISBN 0-486-66016-8, 1976. a
Frederikse, T., Landerer, F., Caron, L., Adhikari, S., Parkes, D., Humphrey, V. W., Dangendorf, S., Hogarth, P., Zanna, L., Cheng, L., and Wu, Y.-H.: The causes of sea-level rise since 1900, Nature, 584, 393–397, 2020. a
Galloway, D. L. and Burbey, T. J.: Regional land subsidence accompanying groundwater extraction, Hydrogeol. J., 19, 1459–1486, 2011. a
Grandin, R., Doin, M.-P., Bollinger, L., Pinel-Puysségur, B., Ducret, G., Jolivet, R., and Sapkota, S. N.: Long-term growth of the Himalaya inferred from interseismic InSAR measurement, Geology, 40, 1059–1062, https://doi.org/10.1130/G33154.1, 2012. a
Jaeger, J. C. and Cook, N. G.: Fundamentals of Rock Mechanics, in: 4th Edn., edited by: Jaeger, J. C., Cook, N. G. W., and Zimmerman, R., Wiley-Blackwell, 488 pp., ISBN 978-0-632-05759-7, 2007. a, b, c, d
JAXA: ALOS Advanced Land Obseving Satellite, https://www.eorc.jaxa.jp/ALOS/en/index_e.htm (last access: 23 September 2023), 2023. a
Jiang, Z. and Wang, H.: Study on Shear Creep Characteristics and Creep Model of Soil-Rock Mixture Considering the Influence of Water Content, Front. Phys., 10, https://doi.org/10.3389/fphy.2022.819709, 2022. a
Kendall, R. A., Mitrovica, J. X., and Milne, G. A.: On post-glacial sea level – II. Numerical formulation and comparative results on spherically symmetric models, Geophys. J. Int., 161, 679–706, 2005. a
Kopf, A. J., Stegmann, S., Garziglia, S., Henry, P., Dennielou, B., Haas, S., and Weber, K.-C.: Soft sediment deformation in the shallow submarine slope off Nice (France) as a result of a variably charged Pliocene aquifer and mass wasting processes, Sediment. Geol., 344, 290–309, https://doi.org/10.1016/j.sedgeo.2016.05.014, 2016. a
Leynaud, D. and Sultan, N.: 3-D slope stability analysis: A probability approach applied to the nice slope (SE France), Mar. Geol., 269, 89–106, 2010. a
Li, G., Zhao, C., Wang, B., Liu, X., and Chen, H.: Land Subsidence Monitoring and Dynamic Prediction of Reclaimed Islands with Multi-Temporal InSAR Techniques in Xiamen and Zhangzhou Cities, China, Remote Sens., 14, 2930, https://doi.org/10.3390/rs14122930, 2022. a, b
Liao, M., Cui, D., Bao, X., Qiao, Z., and Zhao, C.: Creep Characteristics of Soil in the Sliding Zone of Huangtupo Landslide, Appl. Sci., 12, 12439, https://doi.org/10.3390/app122312439, 2022. a
Métois, M., Benjelloun, M., Lasserre, C., Grandin, R., Barrier, L., Dushi, E., and Koçi, R.: Subsidence associated with oil extraction, measured from time series analysis of Sentinel-1 data: case study of the Patos-Marinza oil field, Albania, Solid Earth, 11, 363–378, https://doi.org/10.5194/se-11-363-2020, 2020. a
Milliman, J. D. and Haq, B. U.: Sea-level rise and coastal subsidence: Causes, consequences, and strategies, in: vol. 2, Springer Science & Business Media, ISBN 0-7923-3933-9, 1996. a
Ollié, J.-P.: L'extension sud de l'aéroport international de Nice Côte d'Azur, Le point sur les travaux, Rev. Gen. Routes Aerodr., 588, 4–17, 1982. a
Oppenheimer, M., Glavovic, B. C., Hinkel, J., van de Wal, R., Magnan, A. K., Abd-Elgawad, A., Cai, R., Cifuentes-Jara, M., DeConto, R. M., Ghosh, T., Hay, J., Isla, F., Marzeion, B., Meyssignac, B., and Sebesvari, Z.: 2019: Sea Level Rise and Implications for Low-Lying Islands, Coasts and Communities, in: IPCC Special Report on the Ocean and Cryosphere in a Changing Climate edited by: Pörtner, H.-O., Roberts, D. C., Masson-Delmotte, V., Zhai, P., Tignor, M., Poloczanska, E., Mintenbeck, K., Alegría, A., Nicolai, M., Okem, A., Petzold, J., Rama, B., and Weyer, N. M., Cambridge University Press, Cambridge, UK and New York, NY, USA, 321–445, https://doi.org/10.1017/9781009157964.006, 2019. a
Park, S.-W. and Hong, S.-H.: Nonlinear Modeling of Subsidence From a Decade of InSAR Time Series, Geophys. Res. Lett., 48, e2020GL090970, https://doi.org/10.1029/2020GL090970, 2021. a, b
Peltier, W. R.: Global glacial isostasy and the surface of the ice-age Earth: the ICE-5G (VM2) model and GRACE, Annu. Rev. Earth Planet. Sci., 32, 111–149, https://doi.org/10.1146/annurev.earth.32.082503.144359, 2004. a
Pinel-Puysségur, B., Michel, R., and Avouac, J.-P.: Multi-Link InSAR Time Series: Enhancement of a Wrapped Interferometric Database, IEEE J. Select. Top. Appl. Earth Obs. Remote Sens., 5, 784–794, https://doi.org/10.1109/JSTARS.2012.2196758, 2012. a
Plant, G. W., Covil, C. S., and Hughes, R. A.: Site preparation for the new Hong Kong International Airport, Thomas Telford Publishing, https://doi.org/10.1680/spftnhkia.26964, 1998. a
Rohmer, O., Bertrand, E., Mercerat, E., Régnier, J., Pernoud, M., Langlaude, P., and Alvarez, M.: Combining borehole log-stratigraphies and ambient vibration data to build a 3D Model of the Lower Var Valley, Nice (France), Eng. Geol., 270, 105588, https://doi.org/10.1016/j.enggeo.2020.105588, 2020. a
Schaeffer, M., Hare, W., Rahmstorf, S., and Vermeer, M.: Long-term sea-level rise implied by 1.5 ∘C and 2 ∘C warming levels, Nat. Clim. Change, 2, 867–870, https://doi.org/10.1038/nclimate1584, 2012. a
Shirzaei, M. and Bürgmann, R.: Global climate change and local land subsidence exacerbate inundation risk to the San Francisco Bay Area, Sci. Adv., 4, eaap9234, https://doi.org/10.1126/sciadv.aap9234, 2018. a
Shirzaei, M., Freymueller, J., Törnqvist, T. E., Galloway, D. L., Dura, T., and Minderhoud, P. S. J.: Measuring, modelling and projecting coastal land subsidence, Nat. Rev. Earth Environ., 2, 40–58, https://doi.org/10.1038/s43017-020-00115-x, 2021. a
Stegmann, S., Sultan, N., Kopf, A., Apprioual, R., and Pelleau, P.: Hydrogeology and its effect on slope stability along the coastal aquifer of Nice, France, Mar. Geol., 280, 168–181, 2011. a, b
Sudhaus, H. and Sigurjón, J.: Improved source modelling through combined use of InSAR and GPS under consideration of correlated data errors: application to the June 2000 Kleifarvatn earthquake, Iceland, Geophys. J. Int., 176, 389–404, https://doi.org/10.1111/j.1365-246X.2008.03989.x, 2009. a
Sultan, N., Garziglia, S., Bompais, X., Woerther, P., Witt, C., Kopf, A., and Migeon, S.: Transient Groundwater Flow Through a Coastal Confined Aquifer and Its Impact on Nearshore Submarine Slope Instability, J. Geophys. Res.-Earth, 125, e2020JF005654, https://doi.org/10.1029/2020JF005654, 2020. a, b, c, d, e
Sun, T. and Wang, K.: Viscoelastic relaxation following subduction earthquakes and its effects on afterslip determination, J. Geophys. Res., 120, 1329–1344, https://doi.org/10.1002/2014JB011707, 2015. a
Wigley, T. M. L. and Raper, S. C. B.: Thermal expansion of sea water associated with global warming, Nature, 330, 127–131, https://doi.org/10.1038/330127a0, 1987. a
Wöppelmann, G. and Marcos, M.: Vertical land motion as a key to understanding sea level change and variability, Rev. Geophys., 54, 64–92, https://doi.org/10.1002/2015RG000502, 2016. a
Wu, P.-C., Wei, M., and D'Hondt, S.: Subsidence in Coastal Cities Throughout the World Observed by InSAR, Geophys. Res. Lett., 49, e2022GL098477, https://doi.org/10.1029/2022GL098477, 2022. a, b
Wu, S., Yang, Z., Ding, X., Zhang, B., Zhang, L., and Lu, Z.: Two decades of settlement of Hong Kong International Airport measured with multi-temporal InSAR, Remote Sens. Environ., 248, 111976, https://doi.org/10.1016/j.rse.2020.111976, 2020. a
Xiong, Z., Deng, K., Feng, G., Miao, L., Li, K., He, C., and He, Y.: Settlement Prediction of Reclaimed Coastal Airports with InSAR Observation: A Case Study of the Xiamen Xiang'an International Airport, China, Remote Sens., 14, 3081, https://doi.org/10.3390/rs14133081, 2022. a, b, c
Xue, K., Wang, S., Hu, Y., and Li, M.: Creep Behavior of Red-Clay Under Triaxial Compression Condition, Front. Earth Sci., 7, 345, https://doi.org/10.3389/feart.2019.00345, 2020. a
Yao, Y., Cheng, H., Lin, J., and Ji, J.: Optimization of Burgers creep damage model of frozen silty clay based on fuzzy random particle swarm algorithm, Sci. Rep., 11, 18974, https://doi.org/10.1038/s41598-021-98374-1, 2021. a
Zou, L., Wang, S., and Lai, X.: Creep model for unsaturated soils in sliding zone of Qianjiangping landslide, J. Rock Mech. Geotech. Eng., 5, 162–167, https://doi.org/10.1016/j.jrmge.2013.03.001, 2013. a