the Creative Commons Attribution 4.0 License.
the Creative Commons Attribution 4.0 License.
 | 05 Oct 2023
The seismic hazard from the Lembang Fault, Indonesia, derived from InSAR and GNSS data
Endra Gunawan
Nuraini Rahma Hanifa
Qori'atu Zahro
A growing number of large cities are located near poorly understood faults that have not generated a significant earthquake in recent history. The Lembang Fault is one such fault located near the city of Bandung in West Java, Indonesia. The slip rate on this fault is debated, with estimates ranging from 6 to 1.95–3.45 mm yr−1, derived from a GNSS (global navigation satellite system) campaign and geological measurements respectively. In this paper we measure the surface deformation across the Bandung region and resolve the slip rate across the Lembang Fault using radar interferometry (InSAR – interferometric synthetic aperture radar) analysis of 6 years of Sentinel-1 satellite data and continuous GNSS measurements across the fault. Our slip rate estimate for the fault is 4.7 mm yr−1, with the shallow portions of the fault creeping at 2.2 mm yr−1. Previous studies estimated the return period of large earthquakes on the fault to be between 170–670 years. Assuming simplified fault geometries and a reasonable estimate of the seismogenic depth we derive an estimated moment deficit equivalent to magnitude 6.6–7.0 earthquakes, indicating that the fault poses a very real hazard to the local population. Using the Global Earthquake Model OpenQuake engine we calculate ground motions for these two earthquake scenarios and estimate that 1.9–2.7 million people within the Bandung metropolitan region would be exposed to ground shaking greater than 0.3 g. This study highlights the importance of identifying active faults, understanding their past activity, and measuring the current strain rates of smaller crustal active faults located near large cities in seismic zones.
- Article
(11513 KB) - Full-text XML
- BibTeX
- EndNote


More than half of all people in the world now live in increasingly dense urban centres (Ritchie and Roser, 2018). This transition to a more urbanised world has enabled the social and economic development of millions of people, particularly in low–middle-income nations. However, many of these cities are located near active faults that have not generated a significant earthquake in recent history, raising the risk of losing hard-earned progress through a devastating future earthquake (Amey et al., 2021, 2022; Elliott, 2020; Hussain et al., 2020).
With a population of 8.4 million (2021 estimates) Bandung, the capital of West Java, Indonesia, is one such city. The centre of the city lies less than 10 km south of the Lembang Fault (Fig. 1), a major crustal fault in West Java. Although there are no documented records of large historical earthquakes, the Lembang Fault shows geomorphic evidence of recent activity (Daryono et al., 2019).
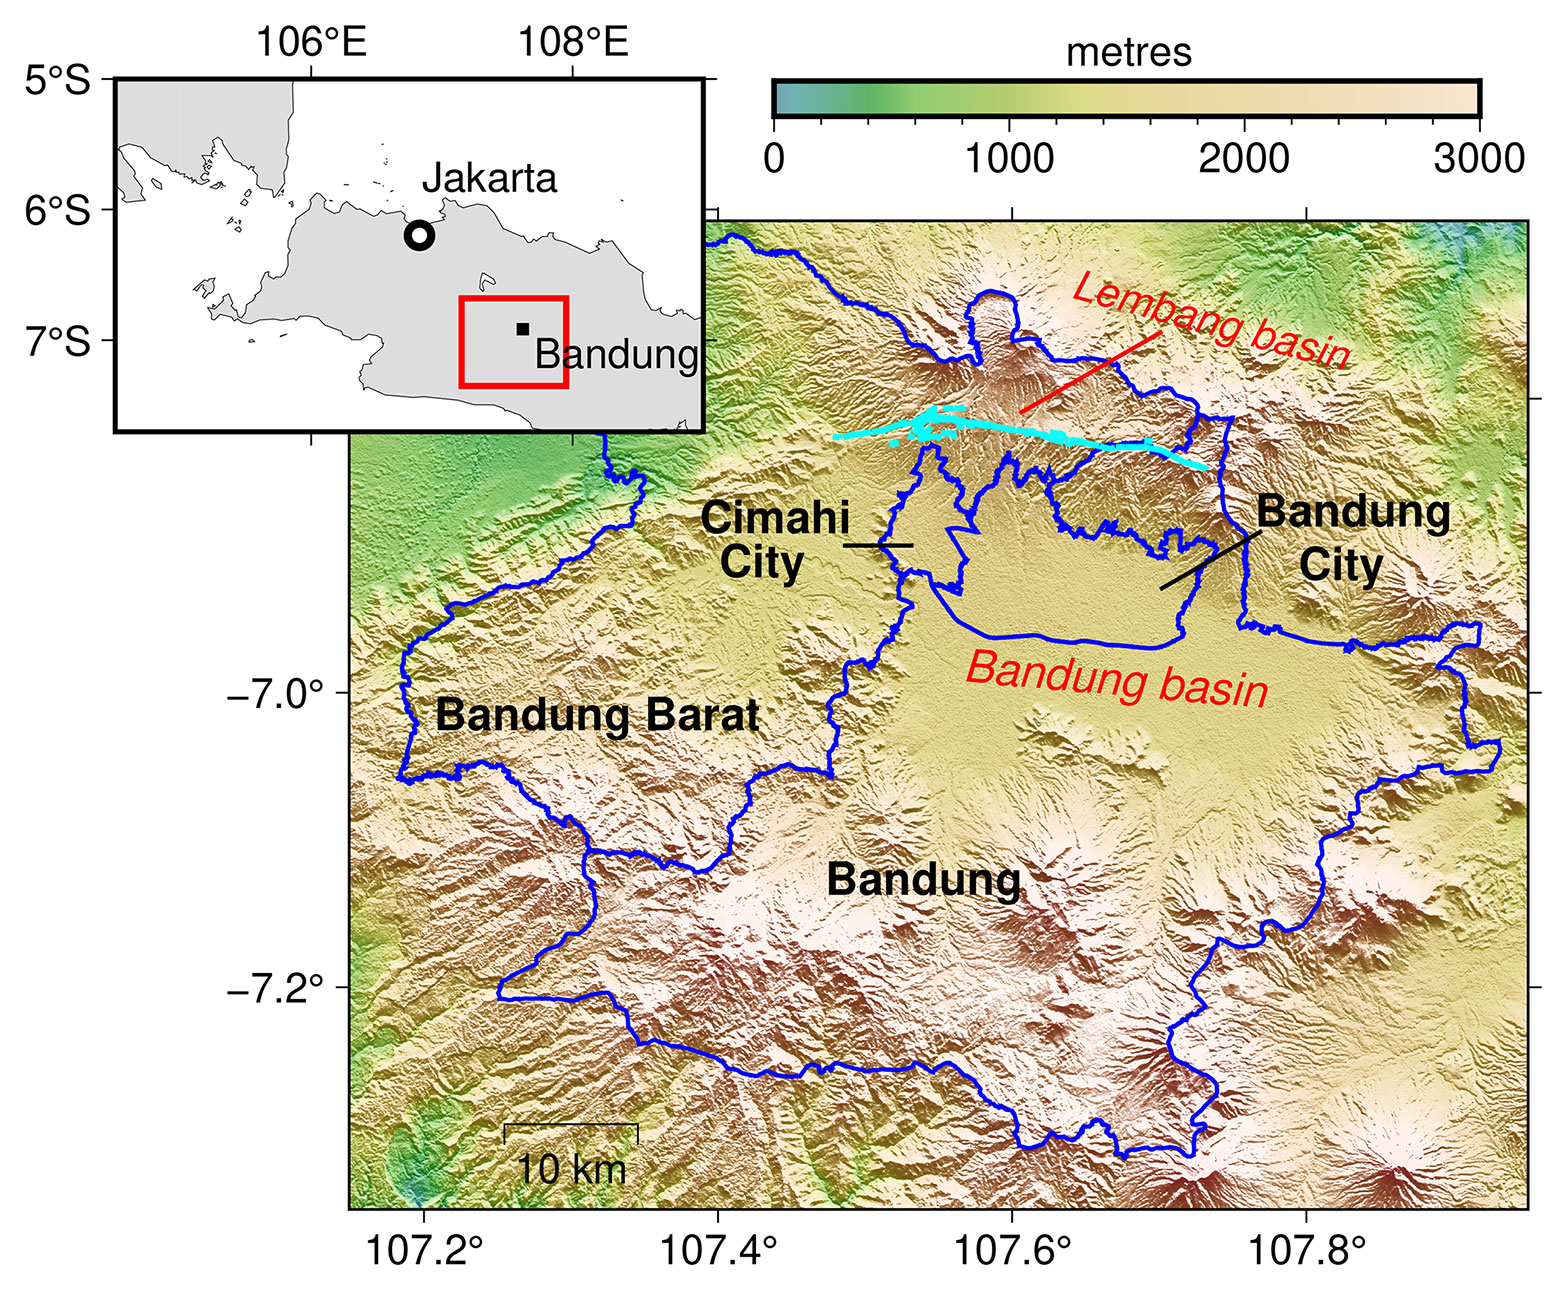
Figure 1The Bandung metropolitan region in West Java, Indonesia. The majority of the population in the region live in the cities of Bandung and Cimahi, which sits in the Bandung basin. The basin is bounded by mountains on all four sides with the Lembang Fault (in cyan) to the north.
The fault dips to the north by about 75∘ and is a prominent landmark of slope breaks between a series of east–west-trending linear ridges that separate the north Bandung highland from the wide and flat Lembang basin to the north (Daryono et al., 2019). Large-scale geomorphic mapping and dating of offset volcanic material indicate that the fault is separated into two parts: an older eastern section and the younger western part (Dam et al., 1996). The eastern Lembang Fault is thought to have originally formed from a large-scale sector collapse of the Sunda volcano at 126–135 ka due to the rapid depressurisation of the magma chamber (Van Bemmelen, 1949; Dam et al., 1996), while the western Lembang Fault is thought to have been active since around 24 ka (Dam et al., 1996). Fault segmentation is also seen in the topographic expression of the fault because the eastern part has a much larger topographic relief across the fault (200–400 m), while the western part has a smaller offset (10–150 m) but is still steep and prominent.
While there have been no records of major events on the fault, small earthquakes have been detected in recent times with near-field instruments. Moment tensors from two magnitude 3.4 earthquakes in 2011 and magnitude 2.8 and 2.9 events in 2017 reveal left-lateral motion across the fault (Sulaeman and Hidayati, 2011; Sanny, 2017; Daryono et al., 2019; Nugraha et al., 2019). Daryono et al. (2019) mapped the surface expression of the fault to determine its length to be 29 km long. During trenching investigations they found evidence of at least three large earthquakes in the 15th century, 2300–60 BCE, and 19 620–19 140 BP, with the displacement across the 2300–60 BCE event equivalent to a Mw 6.5 earthquake. By measuring and dating geomorphic offsets of river basins across the fault they estimate a long-term left-lateral fault slip rate of 1.95–3.45 mm yr−1. Overall they estimate that the fault could produce a Mw 6.5–7 earthquake with a recurrence time of 170–670 years.
However Meilano et al. (2012), used GPS measurements between 2006 and 2011 to determine a geodetic left-lateral fault slip rate equivalent to 6 mm yr−1, nearly twice that determined by geological measurements. Meilano et al. (2012) also estimate shallow creep on the fault at the same rate, implying that the shallow portion of the fault (< 3 km) is not accumulating any seismic strain.
In this paper we will measure the surface deformation and resolve the slip rate across the Lembang Fault using radar interferometry (InSAR – interferometric synthetic aperture radar) analysis of freely available radar data from the European Space Agency's Sentinel-1 satellite constellation and unpublished continuous GPS data in the region. We will resolve the slip rate and creep rate of the fault. Using this rate we will estimate the potential size of an earthquake given 170–670-year return periods and calculate the potential shaking to the Bandung metropolitan region.
For the InSAR processing we used Sentinel-1 Single Look Complex images over the Bandung metropolitan region (longitude, latitude: 107.62∘, −6.93∘). In total we downloaded 146 images from ascending track 98 spanning 4 January 2015 and 27 December 2020 and 154 images from descending track 149 spanning 7 January 2015 and 30 December 2020. We performed initial InSAR processing using the Interferometric SAR (synthetic aperture radar) Scientific Computing Environment (ISCE) software (Rosen et al., 2012; ISCE2, 2021), which resulted in 432 and 450 small baseline interferograms respectively for ascending track 98 and descending track 149. To improve the signal-to-noise ratio we multi-looked each interferogram by 2 pixels in azimuth and 6 pixels in range, giving pixel sizes of approximately 30 m.
For the time series analysis, we processed each interferogram stack independently using the Miami INsar Time-series software in PYthon (MintPy) (Yunjun et al., 2019, 2020). The small baseline interferogram networks are shown in Fig. 2. We removed interferograms with an average spatial coherence less than 0.35. This resulted in 18 and 15 interferograms being removed from the ascending and descending tracks respectively, which are represented by dashed lines in Fig. 2. We used the SRTM 30 m digital elevation model (Farr et al., 2007) to estimate and correct the topographic error. We also estimated and removed the atmospheric contribution to the phase in each interferogram using the GACOS weather model reanalysis product (Yu et al., 2018). Additionally, we removed a bilinear ramp from each interferogram to reduce any remaining long wavelength trends. We detect and correct unwrapping errors in the interferograms using the phase closure functionality in MintPy (Yunjun et al., 2019).
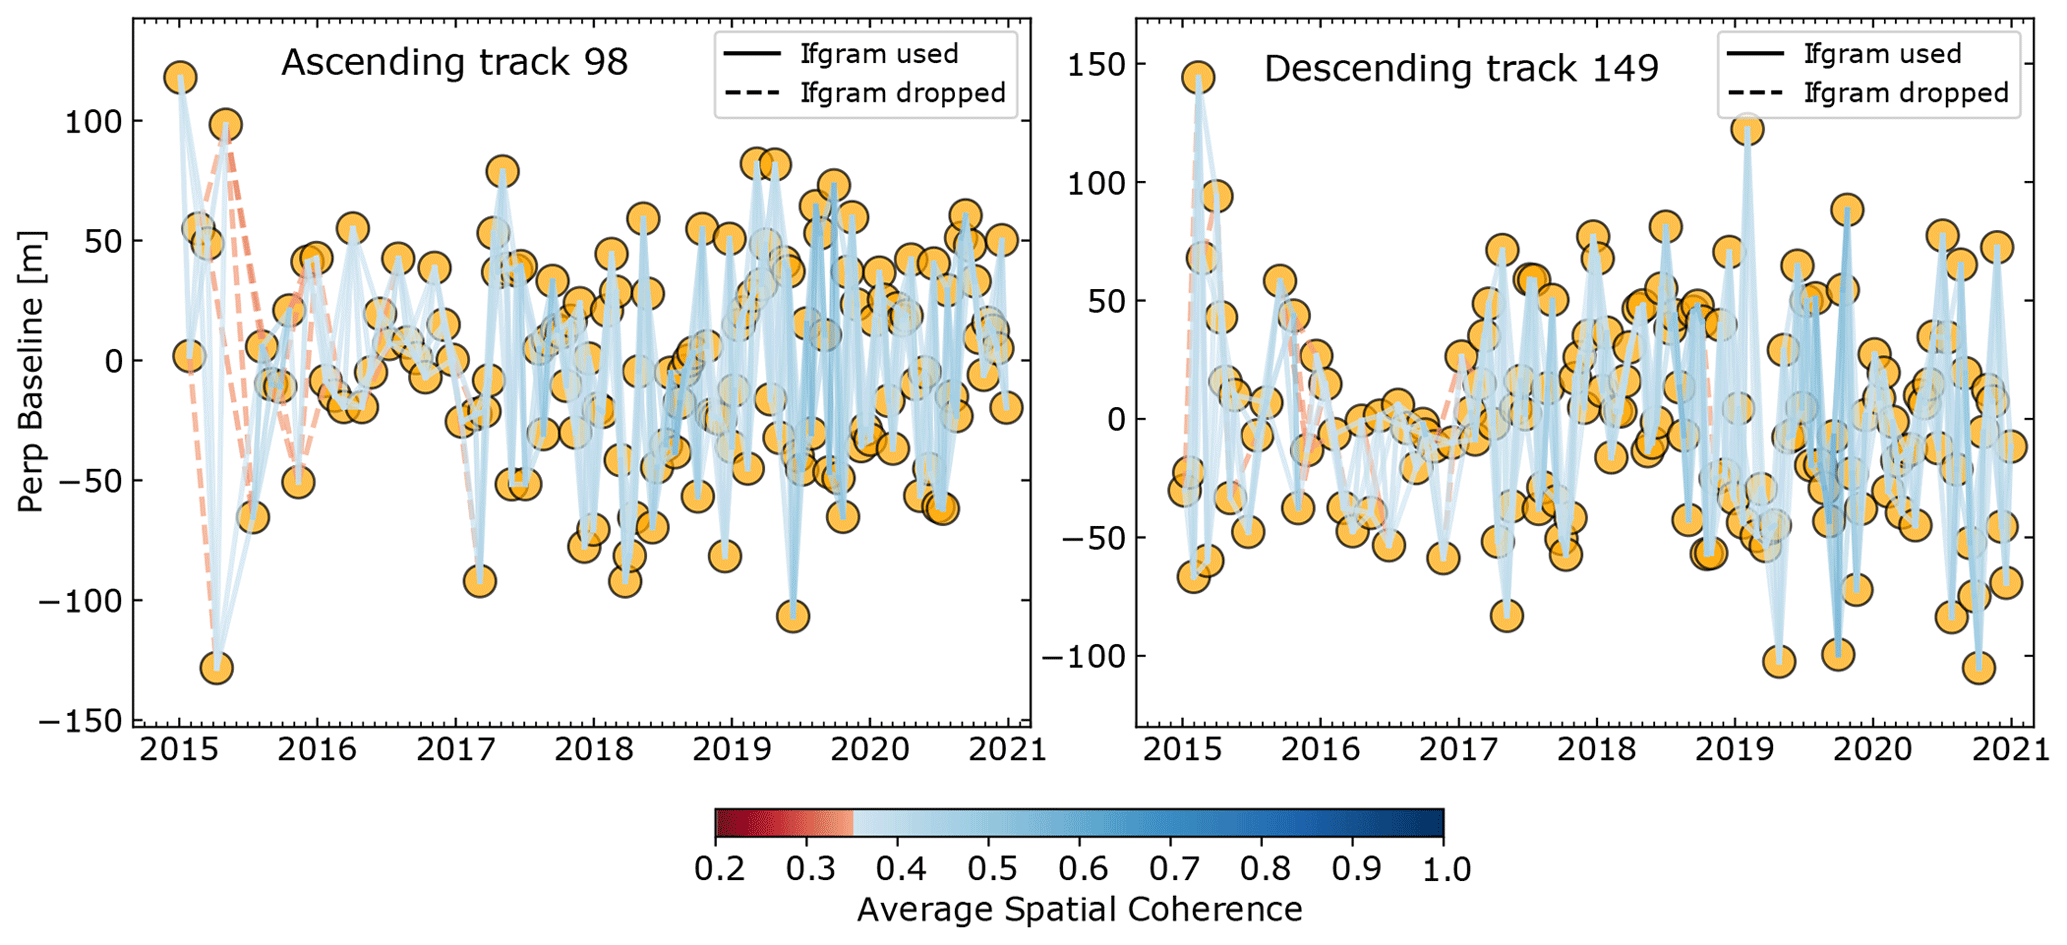
Figure 2The small baseline interferogram network. The yellow circles represent the satellite acquisition with the lines representing the interferograms colour coded by the average spatial coherence. The dashed lines are interferograms dropped due to poor coherence.
The average line-of-sight (LOS) velocities for the descending and ascending tracks are shown in Fig. 3a and b, where blue colours represent motion away from the satellite. The black square is the spatial reference. Using the method described by Wright et al. (2004) we exploit the different viewing geometries of the same location to deconvolve the ascending and descending velocities into east–west and vertical. This requires the assumption that the relative north motion is negligible, which is a common assumption in InSAR analysis, as polar orbiting Sentinel-1 satellites are less sensitive to motion in that direction. The deconvolved velocities are given in Fig. 3c and d.
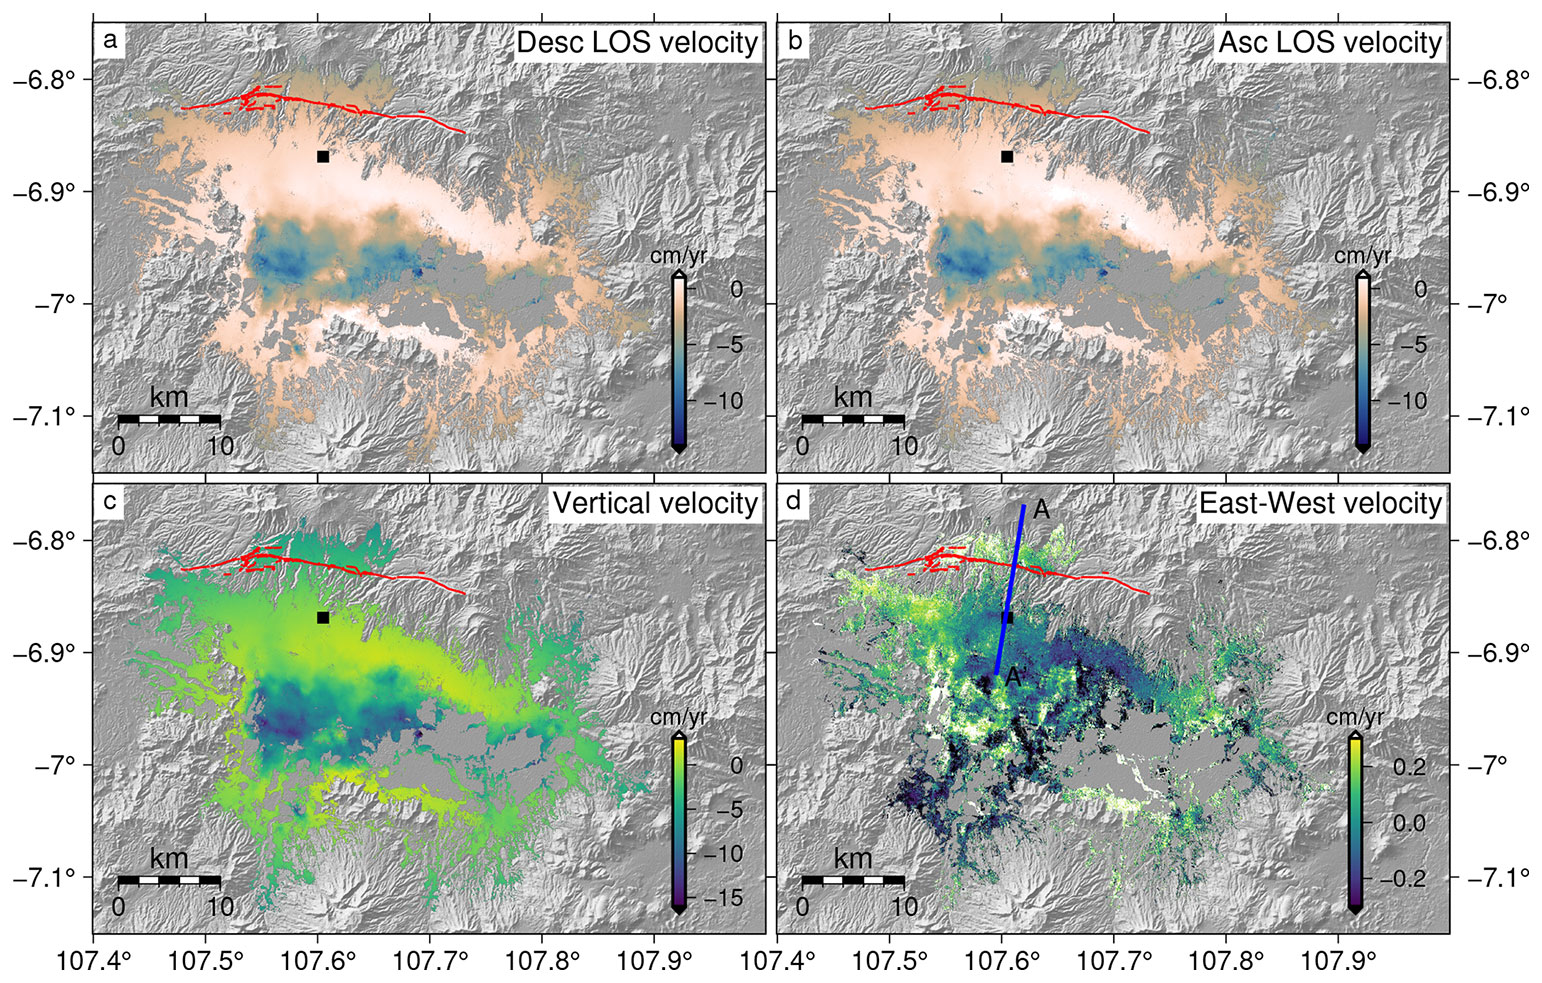
Figure 3The average descending and ascending line-of-sight velocities (a, b respectively). Blue colours represent motion away from the satellite. The black square is the spatial reference for each map. Panels (c) and (d) are the deconvolved vertical and east–west components of ground motion, assuming the relative north component is negligible. Blue colours represent subsidence in the vertical and motion to the west in the east–west velocities. The red lines are the Lembang Fault segments mapped by Daryono et al. (2019). Contains modified Copernicus Sentinel data.
While the focus of this paper is the horizontal velocities (Fig. 3d), it is worth noting that the deconvolved velocities also show a pattern of vertical deformation within the Bandung basin (Fig. 3c). The average rates of subsidence (with respect to our reference point) are of the order of 8 cm yr−1 with the maximum exceeding 16 cm yr−1. This is a well-known signal in the basin and is generally thought to be subsidence due to groundwater extraction (e.g. Abidin et al., 2008; Ge et al., 2014; Du et al., 2018).
A continuous GNSS (global navigation satellite system) network, consisting of three continuous stations, was installed on 7 September 2019 using dual frequency Trimble GPS receivers. These GNSS stations, named LMB1 in the south, LMB2 in the centre, and LMB3 to the north of the Lembang Fault, are an addition to the existing GNSS station of the Indonesian Geospatial Information Agency, CLBG (Gunawan and Widiyantoro, 2019; Gunawan, 2021). Concerning the stability of the GNSS network, we installed the GNSS antenna on top of a concrete building. We use electricity to power up the receiver, which is located inside a storage box. In total, this study used four GNSS stations available perpendicular to the Lembang Fault (Fig. 4).
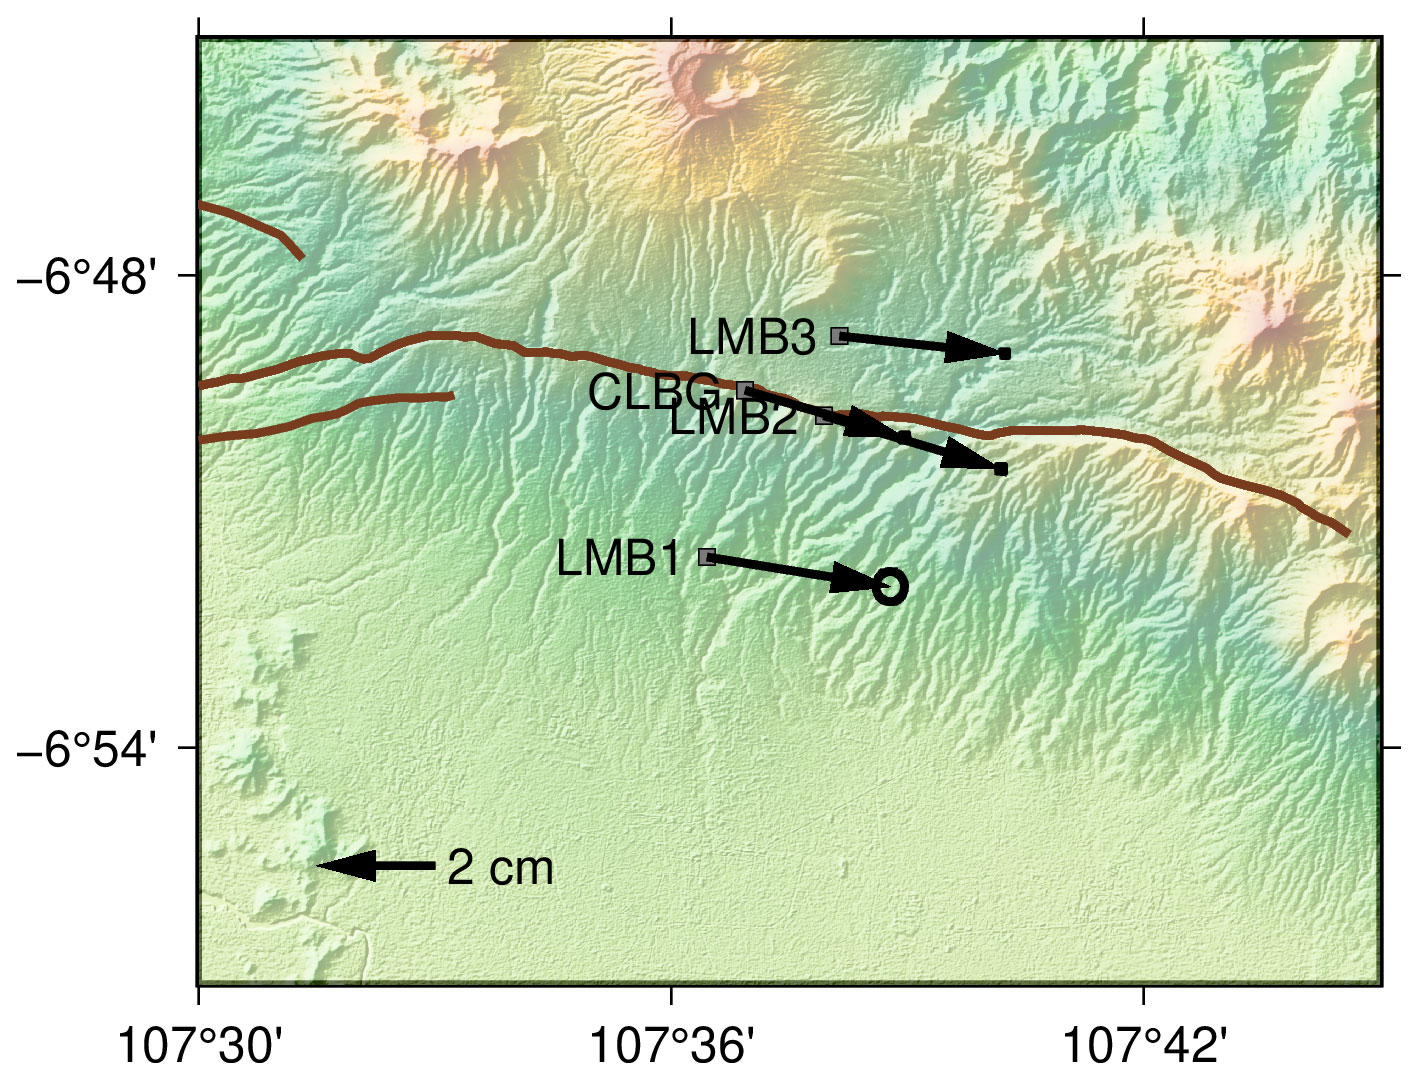
Figure 4Horizontal velocities at GNSS stations in the ITRF2014 reference frame. Brown lines mark the delineation of the Lembang Fault.
In this network, GNSS data were recorded with a 30 s sampling interval. The 30 s Receiver Independent Exchange Format (RINEX) data were processed using the GipsyX software, which was developed by the Jet Propulsion Laboratory (JPL) (Bertiger et al., 2020). We conduct static estimation using precise point positioning implemented in the software by selecting fiducial-free with five iterations. Additional files, such as final orbits, clocks, and other products, are from the JPL. All of those products are based on the JPL’s reanalysis final set of the International GNSS Service IGS14 of the ITRF14 reference frame (Altamimi et al., 2016). We also used the GOT4.8 model to correct for ocean tidal loading, which is calculated from the website of the Onsala Space Observatory (http://holt.oso.chalmers.se/loading, last access: 1 January 2022). In each of our RINEX data, we set an elevation angle cutoff at 15∘. Using the time series data obtained from the analysis, we computed the velocity for each GNSS station at the millimetre level. Horizontal velocities for each GNSS station are shown in Fig. 4.
To investigate the change in velocity, and therefore the strain accumulation, across the Lembang Fault we projected the east–west velocities across the fault onto a single fault-perpendicular profile (A–A' in Fig. 3d), including all points 5 km on either side of the profile. The results (grey points in Fig. 5) reveal a change in velocity across the Lembang Fault consistent with left-lateral motion.
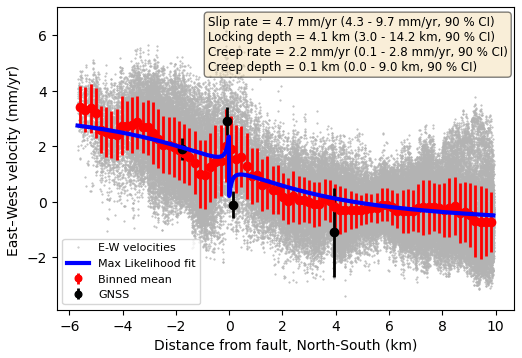
Figure 5The east–west component of the InSAR (grey) and GNSS velocities (black) across the Lembang Fault along profile A–A' in Fig. 3d. Positive velocities are motion to the west. The red points are the mean and 1 standard deviation of the InSAR velocities in 200 m bins along the profile. The maximum likelihood solution of the MCMC model is shown in blue with the best fit parameters in the text box. The 90 % confidence interval (CI) for each parameter is given in the parentheses.
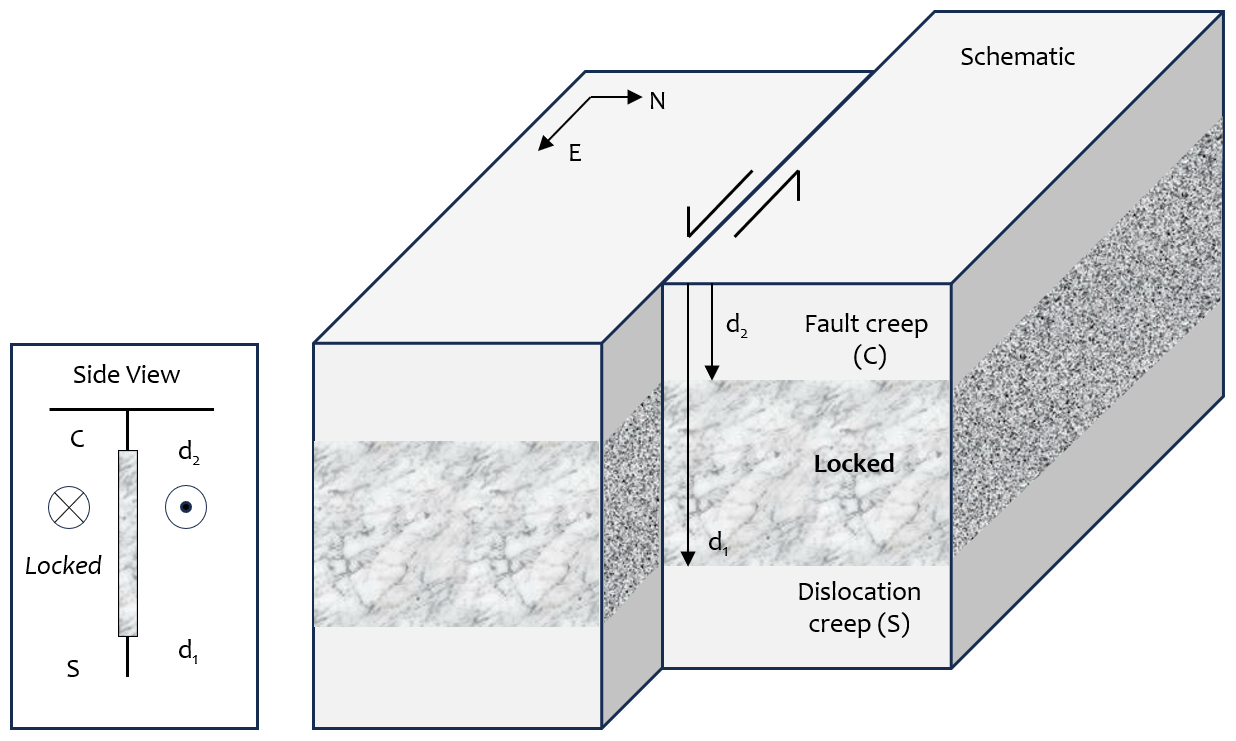
To better reflect this velocity and the uncertainty in the data we binned the values in 200 m windows along the profile. These are shown in red with error bars representing the 1σ standard deviation. The GNSS velocities are also shown in black. To estimate the fault-parallel slip rate (S) and creep rate (C) from the velocity profile (vx) we fit the 1-D screw dislocation model of Hussain et al. (2016), adapted from Savage and Burford (1973):
where x is the perpendicular distance from the fault, d1 is the interseismic locking depth, d2 is the creep depth, ℋ(x) is the Heaviside function, and a is a static offset (Fig. 6).
We find best fit values for each model parameter (S, d1, C, d2, and a) using the Foreman-Mackey et al. (2013) implementation (known as emcee) of the Goodman and Weare (2010) affine-invariant ensemble Markov chain Monte Carlo (MCMC) sampler.
Our MCMC sampler explores the parameter space constrained by 0<S (mm yr−1) (km) (mm yr−1) (km) (mm yr−1) <10, assuming a uniform prior distribution over each range. We ensure that the shallow creep depth does not exceed the deep creep (d2≤d1) and the shallow creep rate does not exceed the fault slip rate (C≤S).
We run the model for 500 000 steps, allowing 300 for burn, and thin the results in steps of 20. This produces 177 435 random samples from which we estimate both the maximum likelihood solution for each parameter and its uncertainties.
The maximum likelihood solution is shown by the blue line in Fig. 5, which corresponds to a slip rate of 4.7 mm yr−1, a locking depth of 4.1 km, and a shallow surface creep rate of 2.2 mm yr−1.
The full distribution of MCMC samples is shown in Fig. 7 with the maximum likelihood estimate for each parameter shown by the blue square. The sampled marginal probability distribution for the slip rate has a constrained lower bound with an unconstrained upper tail, while the distributions for the locking depth and creep rate are approximately normal. The creep depth has a peak around zero with a poorly constrained upper bound. As is commonly seen in elastic dislocation models there is a trade-off between the fault slip rate and the locking depth (e.g. Wright et al., 2013; Hussain et al., 2016), where a slower slip rate can be compensated for by a shallower locking depth.
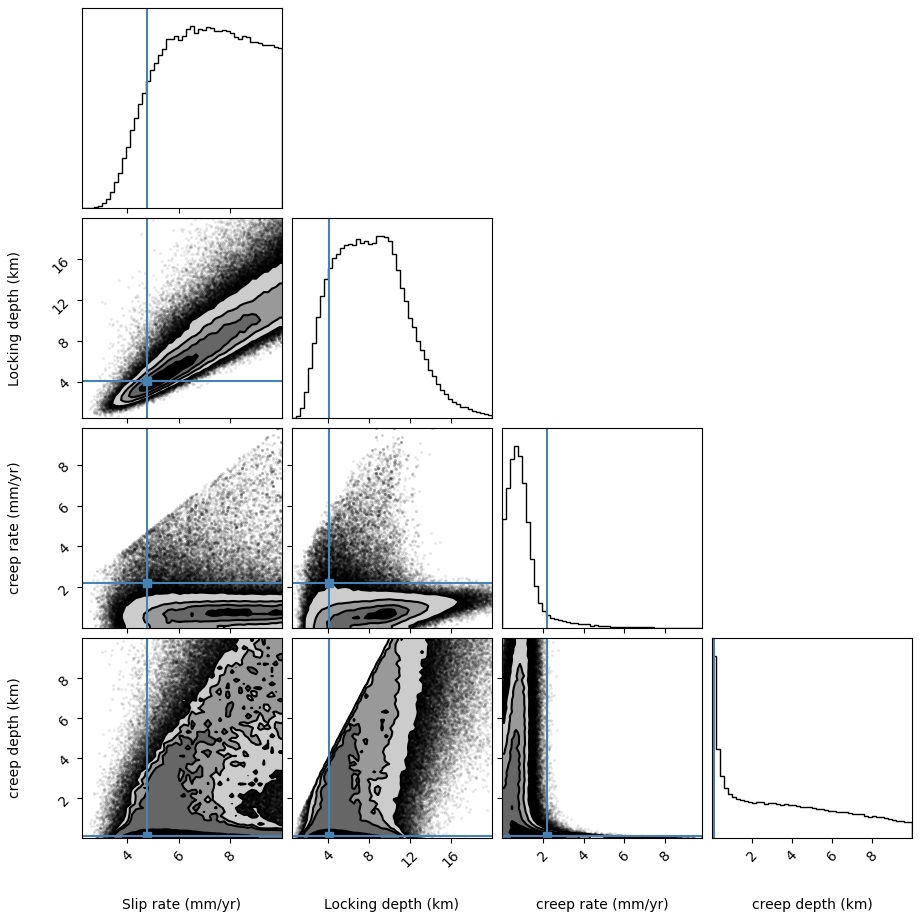
Figure 7The full distribution of MCMC samples. The black dots are the results from all our MCMC simulations. The contours show the densest regions of the plot covering 86 % of the data points. The blue square marks the maximum likelihood estimate, which corresponds to a fault slip rate of 4.7 mm yr−1, a locking depth of 4.1 km, a shallow creep rate of 2.2 mm yr−1, and a creep locking depth of 0.1 km.
The Lembang Fault has not recorded a large earthquake (> Mw 5) during the modern instrumental period. However there is geomorphological evidence of significantly sized earthquakes in the Quaternary period. Based on measurements of offset rivers and palaeoseismic trenching Daryono et al. (2019) estimate that the fault could produce a large-magnitude earthquake with a recurrence time of 170–670 years.
We can now use the magnitude scaling relationship of Hanks and Kanamori (1979) – with M0=μAST, where μ is the rigidity (30 GPa), A the fault area, S the slip rate, and T the return period – to estimate the potential size of earthquakes on the fault. Assuming our estimated fault slip rate of 4.7 mm yr−1 remains constant over time, a fault length of 29 km (Daryono et al., 2019), constant fault dip of 75∘, and a seismogenic depth of 15 km based on microseismicity relocation depths (Supendi et al., 2018) gives an estimated moment deficit of a magnitude 6.6–7.0 earthquake for return periods between 170–670 years, indicating that the fault poses a very real hazard to the local population. Note that we account for the strain release due to shallow creep (2.2 mm yr−1 at 0.1 km depth), which is equivalent to a release of ∼ 0.3 % of the accumulated moment and so makes negligible difference to the estimated locked moment magnitude.
To explore the potential exposed population in the Bandung metropolitan region to high levels of ground shaking resulting from an earthquake on the Lembang Fault, we used the Global Earthquake Model OpenQuake engine v3.14 (Pagani et al., 2014; GEM, 2022) to calculate the ground motion fields for two potential Lembang Fault scenarios: a magnitude 6.6 and a magnitude 7.0 earthquake. We modelled the Lembang Fault as two rectangular slip planes (total length of 29 km) to account for the changes in geometry along the strike (brown line in Fig. 8). Both planes dip at 75∘ to the north (Daryono et al., 2019) from the surface down to 15 km.
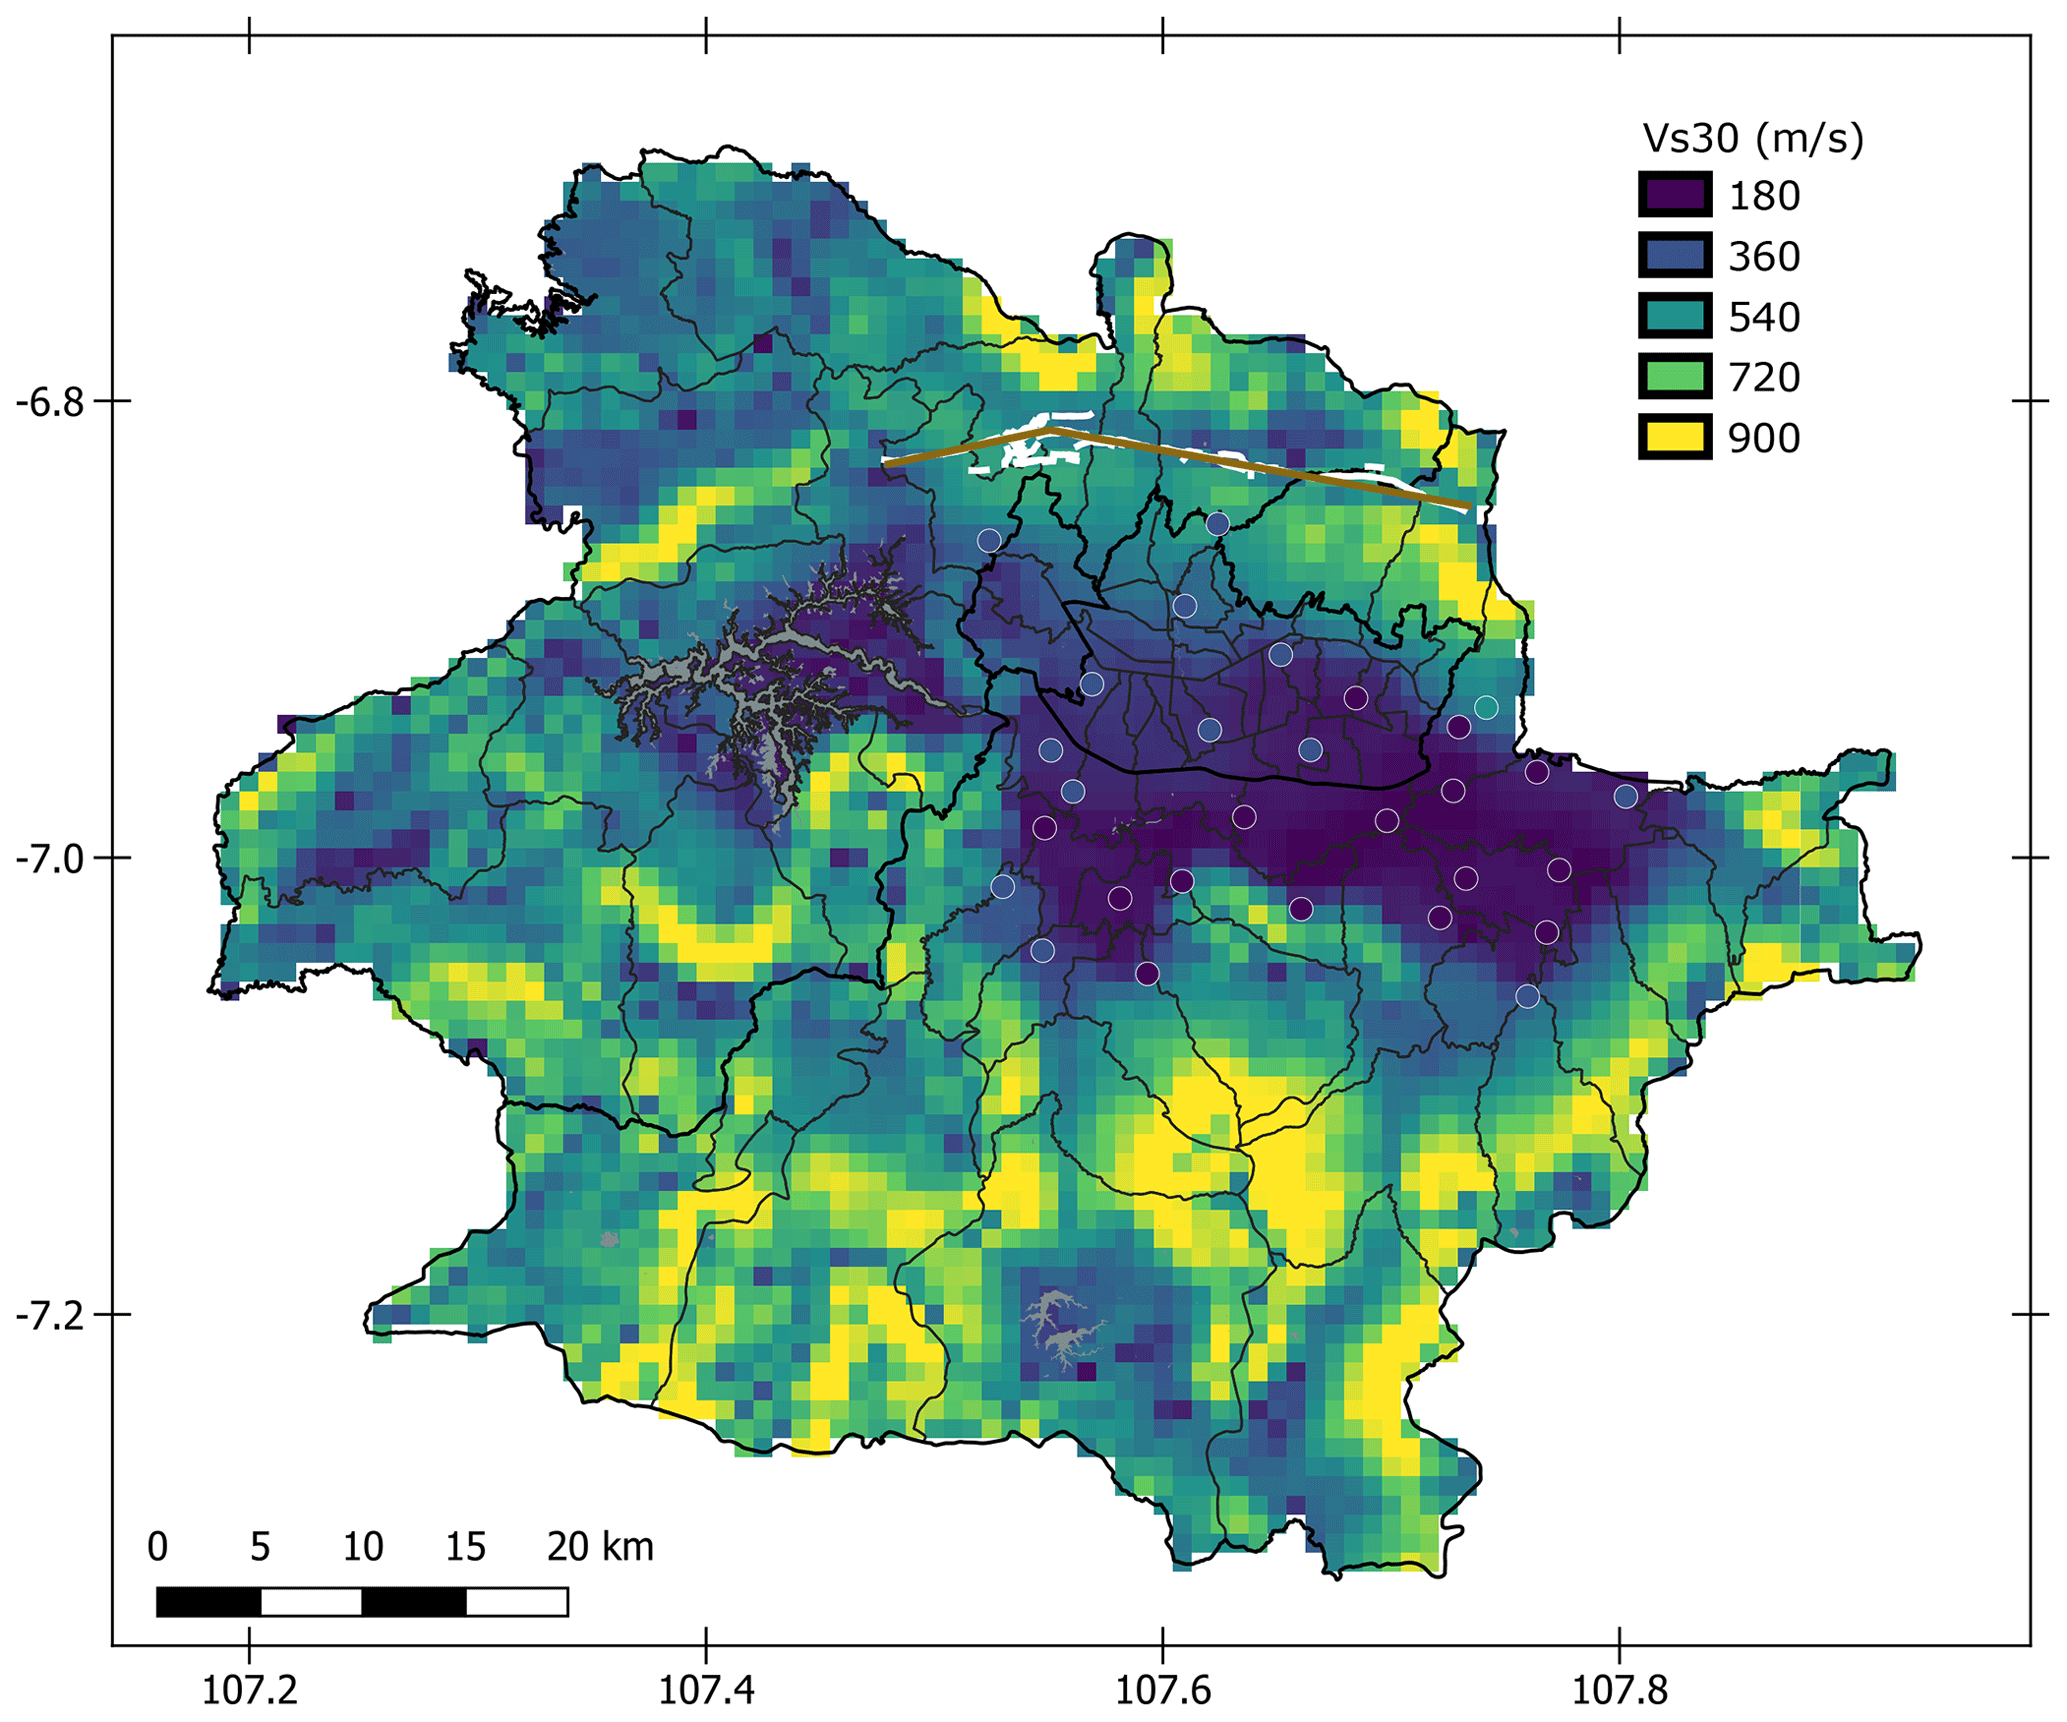
Figure 8Vs30 velocities – the shear wave velocity in the top 30 m of soil for the Bandung metropolitan region from the USGS Global Vs30 Map Server (Wald and Allen, 2007; Allen and Wald, 2009). Velocities are estimated using topographic slope as a proxy, assuming stiffer materials with faster Vs30 values are more likely to maintain a steep slope, and flat sedimentary basins are characterised by a lower velocity. The white-bordered circles are the point measurements of Vs30 velocities from a microtremor survey by Pramatadie et al. (2017). The white lines are the mapped Lembang Fault trace by Daryono et al. (2019). The brown lines are the simplified fault model used in our seismic hazard calculations.
The hazard calculation involves determining the spatial pattern of peak ground acceleration (PGA) for each scenario event by using a ground motion prediction equation (GMPE). There are many GMPEs available in the literature (see Douglas and Edwards, 2016, for a review and https://www.gmpe.org.uk, last access: 1 January 2022, for an updated compendium managed by John Douglas). In our model we used three equally weighted equations for active shallow crustal earthquakes: Abrahamson et al. (2014), Campbell and Bozorgnia (2014), and Chiou and Youngs (2014). Averaging several GMPEs helps to partially propagate the epistemic uncertainty of the distribution of shaking arising from an imperfect knowledge of ground motion.
For each magnitude scenario we assume the entire fault ruptures in the earthquake and produce 1000 realisations of the ground motion to account for aleatory variability. We also account for the spatial correlation of ground shaking during the generation of each ground motion field to ensure assets located close to each other will have similar ground motion levels, according to the methods described by Jayaram and Baker (2009).
The majority of the population of the Bandung metropolitan region lives in the Bandung basin, which is a large 2300 km2 sedimentary basin bounded on all four sides by mountains (Fig. 1). Deposits in the basin are comprised of coarse volcaniclastics, fluvial sediments, and notably a thick series of lacustrine deposits (Van der Kaars and Dam, 1995).
Deep sedimentary basins increase the amplitude and duration of earthquake ground motions from seismic waves, increasing the seismic hazard for cities sited on such basins (e.g. Bard and Bouchon, 1985; Bard et al., 1988; Rial, 1989; Bielak et al., 1999; Wirth et al., 2019). We attempt to account for basin amplification in our ground motion model by using the Vs30 velocities – the shear wave velocity in the top 30 m of soil. Pramatadie et al. (2017) conducted a microtremor survey of the Bandung basin and calculated the shallow shear wave velocity for 29 sites across the basin. We supplemented these point measurements with estimated Vs30 velocities from the USGS Global Vs30 Map Server (Wald and Allen, 2007; Allen and Wald, 2009). This method derives maps of seismic site conditions using topographic slope as a proxy. This assumes that maintaining a steep topographic slope requires stiffer materials (higher Vs30 values), while deep basin sediments are deposited mainly in environments characterised by a lower velocity. Note that we recognise that this will probably be an underestimate of the full basin effects, which would require detailed models of the 3-D geometry and sediment type to fully account for them (Joyner, 2000). Figure 8 shows that the Pramatadie et al. (2017) point measurements of Vs30 velocities match the USGS Global Vs30 estimates very well.
The estimated ground motions for the two earthquake scenarios are shown in Fig. 9, where darker colours represent higher expected peak ground acceleration (PGA), given as a fraction of gravitational acceleration (g). The maps show high accelerations to the north of the fault, which is expected because the fault dips to the north, meaning points north of the fault are closer to the rupture plane and therefore likely to experience faster accelerations than points to the south.
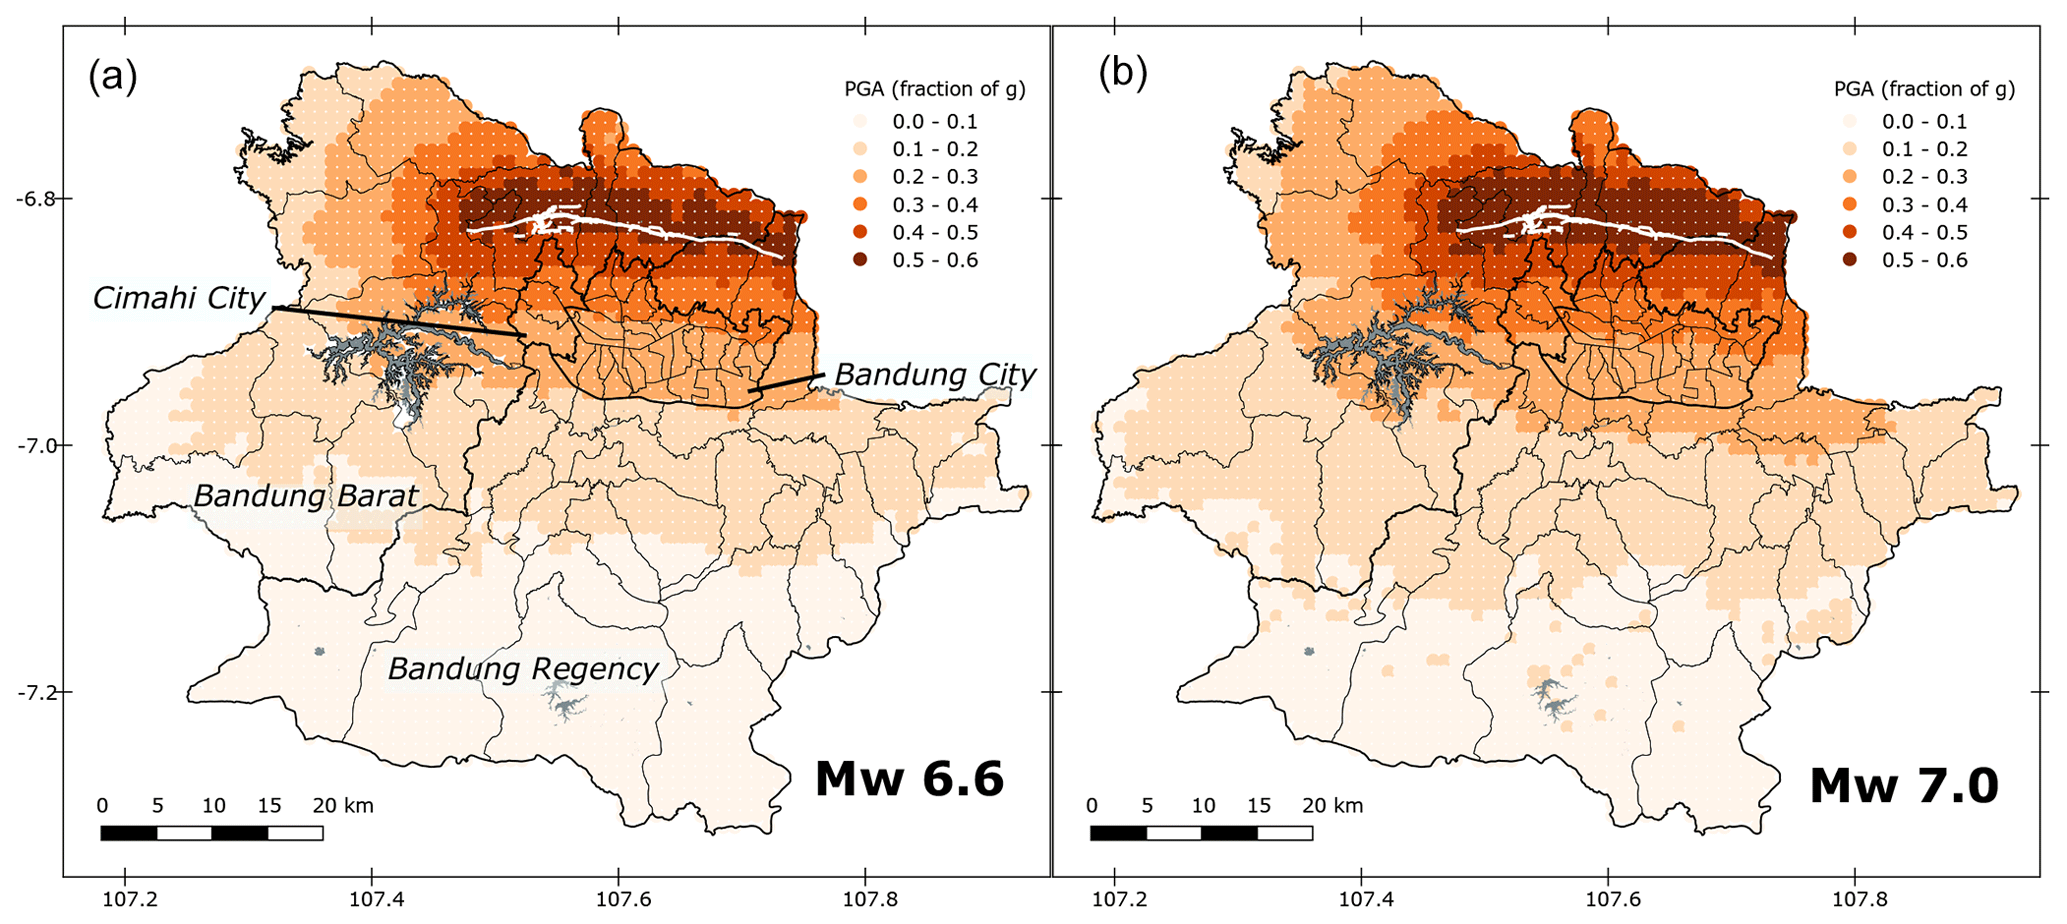
Figure 9Median ground motion fields for a moment magnitude 6.6 (a) and a magnitude 7.0 (b) earthquake on the Lembang Fault (white lines). Peak ground accelerations (PGAs) are shown as a fraction of gravitational acceleration (g). As expected, the highest shaking is focused to the north of the Lembang Fault over the hanging wall.
5.1 Exposed population
The Bandung metropolitan region is comprised of four administrative areas with a high variation in population. Population secondary data are taken from the Central Bureau of Statistics and the Civil Registry Office, where the population for each district is updated regularly. However, during the COVID-19 pandemic some regions did not update their population; in this case the number of residents was calculated by projection and estimation.
The population projection was prepared using the linear arithmetic growth model, assuming that population in the future will increase linearly with the following formula:
where Pt is the current year population, P0 is the base year population, r is the growth rate, and t is the time interval.
By overlapping the predicted ground motion fields shown in Fig. 9 with the population map (Fig. 10), we find that 1.9 million people would be potentially exposed to high levels of ground shaking (> 0.3 g) in the event of a Mw 6.6 earthquake on the Lembang Fault. This increases to 2.7 million people for a magnitude 7.0 earthquake.
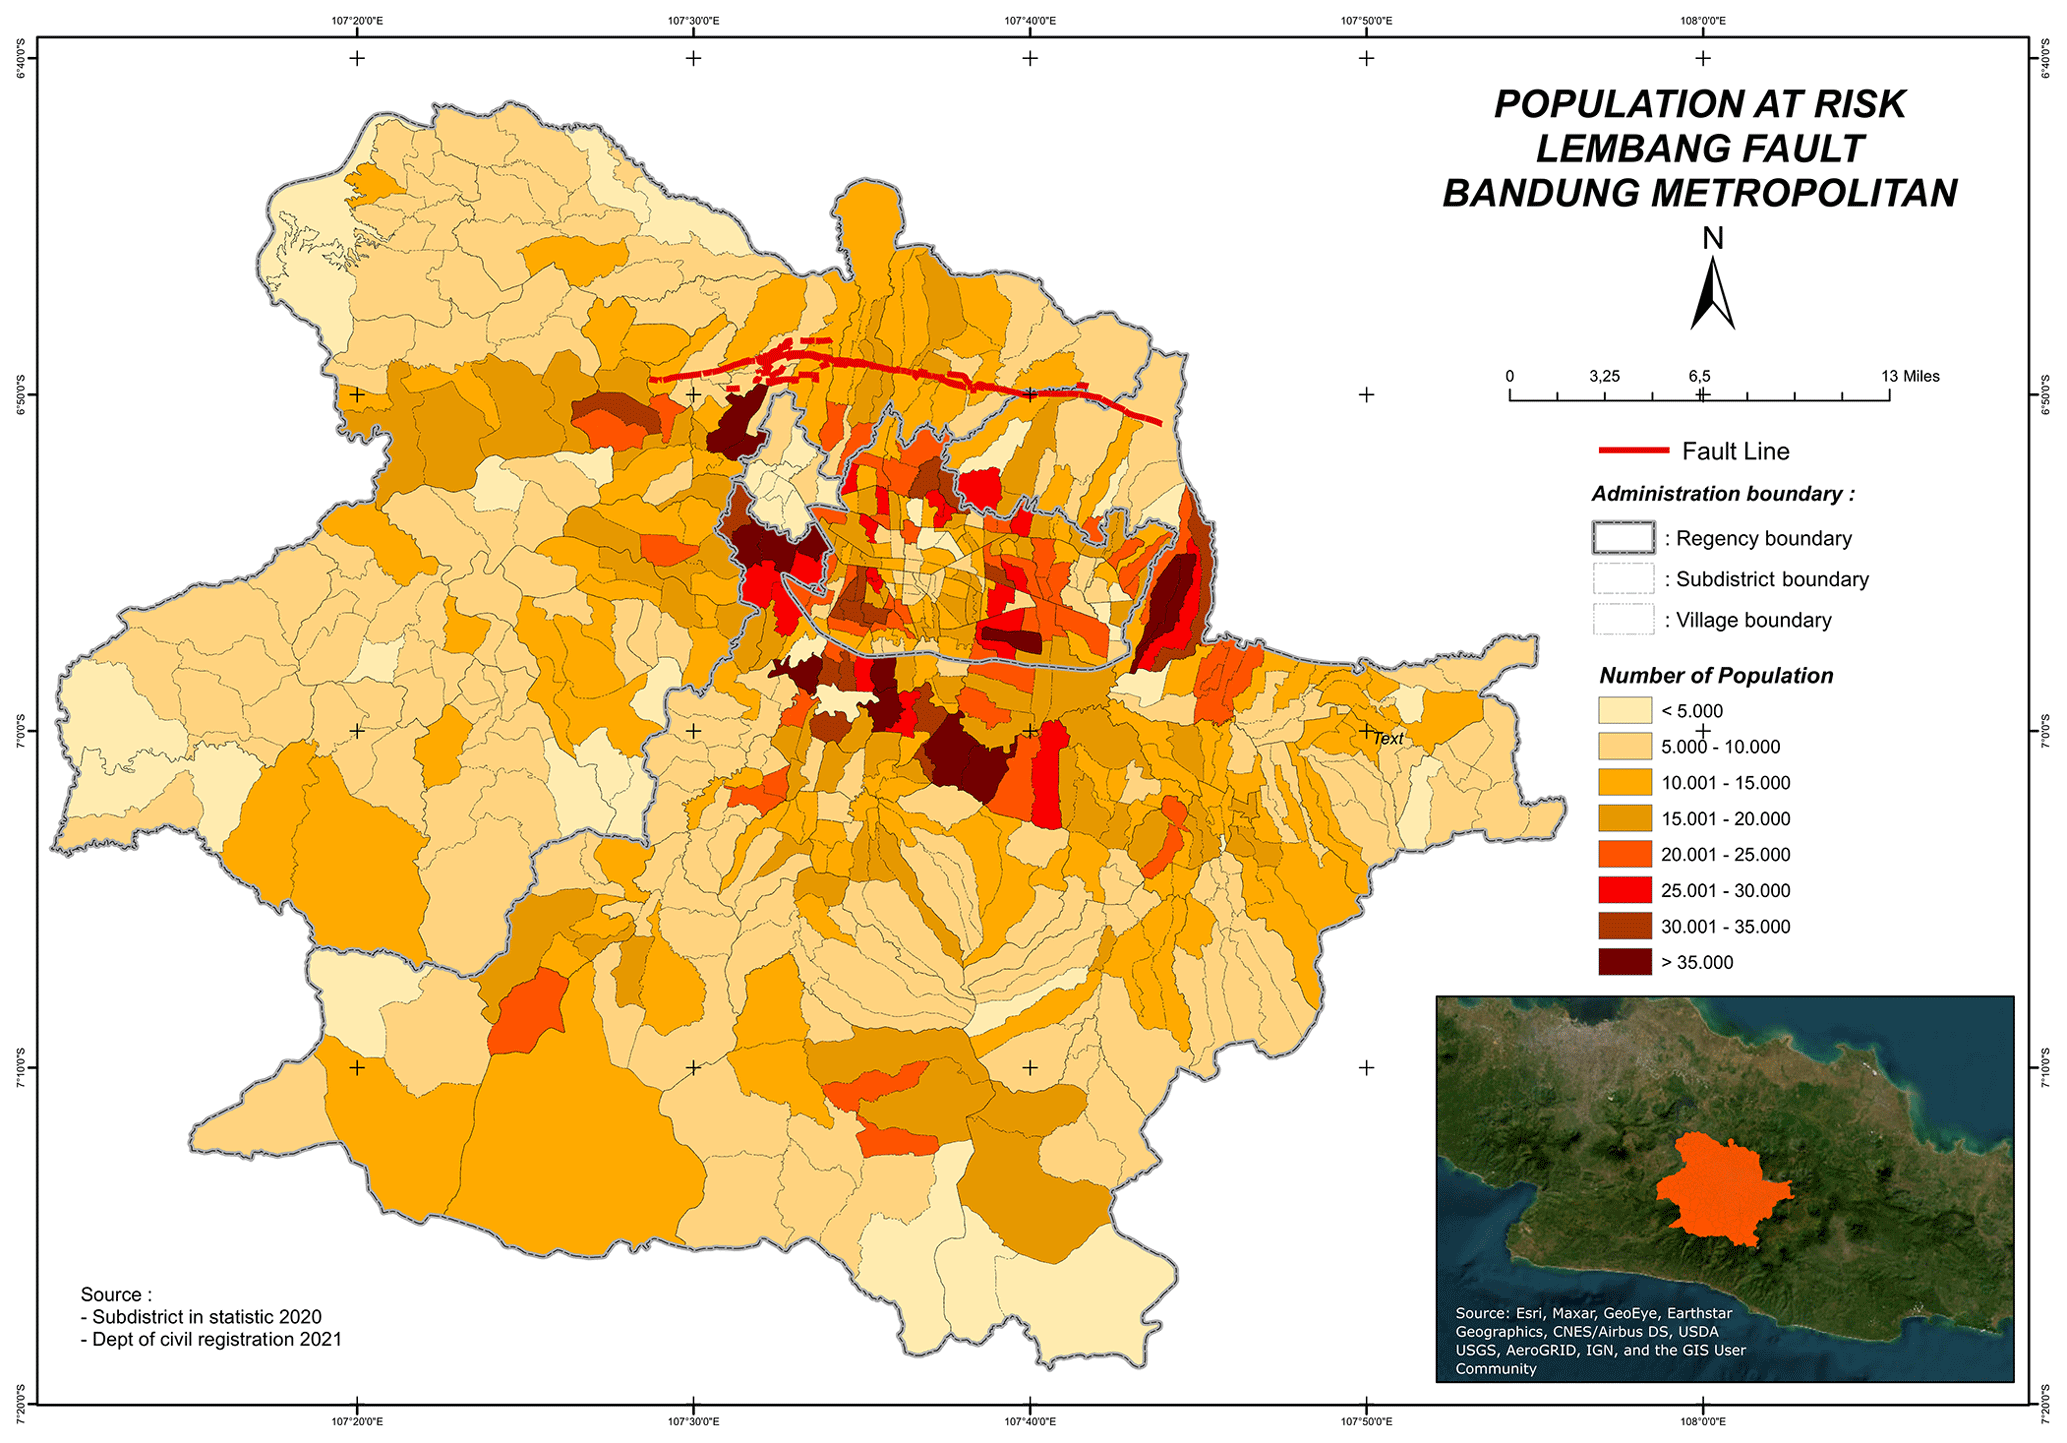
Figure 10The population distribution in the Bandung metropolitan region. Data source: subdistrict in statistic 2020, Department of Civil Registration 2021. The red line is the Lembang Fault trace. The inset panel shows the geographic location of the Bandung metropolitan region. Background image source: Esri, Maxar, GeoEye, Earthstar Geographics, CNES/Airbus DS, USDA USGS, AeroGRID, IGN, and the GIS User Community.
Note that such simple overlaps are insufficient to establish the true risk of earthquake shaking. Most fatalities in non-coastal earthquakes occur due to building collapse (Coburn et al., 1992; Ambraseys and Bilham, 2011). Therefore a thorough assessment of the fragility of buildings when exposed to certain levels of ground shaking will be needed to assess the risk. Since this would need to be done for all possible building types in the metro region, it is beyond the scope of this study.
6.1 Lembang Fault parameters
The maximum likelihood estimate for the geodetic slip rate on the Lembang Fault from our analysis using a combination of InSAR and GNSS data is 4.7 mm yr−1, which falls between the 1.95–3.45 mm yr−1 estimated by Daryono et al. (2019) using geomorphic offsets and palaeoseismic trenching and the 6 mm yr−1 estimated by Meilano et al. (2012) using GNSS measurements. While the 90 % confidence interval for our slip rate (4.3–9.7 mm yr−1) encompasses the estimate by Meilano et al. (2012), it is still higher than even the upper bound of the geological measurements by Daryono et al. (2019). This discrepancy between the geological and geodetic slip rate could be due to the uncertainties associated with the measurement and dating of geomorphic offsets. Fluvial channels and other geomorphic features in tectonically active regions constantly change, as degradation can begin immediately after formation. The longer-lived and larger the offset feature, the greater the uncertainty becomes, making slip estimates more difficult to interpret (Arrowsmith et al., 2012; Scharer et al., 2014).
Our maximum likelihood estimate for the locking depth is 4.1 km. This is almost certainly an underestimate of the true locking depth on the fault. However, the 90 % confidence bound on the locking depth is 3.0–14.2 km, showing that there is significant uncertainty in our estimate.
A difference in slip rate between 4.3–9.7 mm yr−1 results in a moment magnitude difference of 0.2. However, the return period difference between 170–670 years results in a moment magnitude range of 0.4. A locking depth range between 3–14.2 km, at the maximum likelihood slip rate (4.7 mm yr−1), accounting for shallow creep, would give a moment magnitude deficit difference of 0.4. The return period difference between 170–670 years also results in a moment magnitude range of 0.4. Therefore, most of the uncertainty in our estimates of the potential size of the earthquake is in the locking depth and return period. However, the upper bound of our locking depth range is closer to the seismologic depth for this region (Supendi et al., 2018). Additionally, small earthquakes on or around the fault show that there is strain accumulation and release at depth. For example, a magnitude 3.4 earthquake in July 2011 had a focal depth of ∼ 6 km (Sulaeman and Hidayati, 2011), and magnitude 2.8 and 2.9 earthquakes in 2017 occurred at depths of ∼ 5 km (Nugraha et al., 2019).
Meilano et al. (2012) in their study suggested that the Lembang Fault is creeping at shallow depths (down to 3 km) at 6 mm yr−1, at the same rate as the fault slip rate. If this is true then it means that there is no tectonic strain accumulation on the shallow portions of the fault. However our maximum likelihood creep rate on the fault is 2.2 mm yr−1, which is significantly less than the estimate of Meilano et al. (2012) and less than half the full fault slip rate (4.7 mm yr−1), meaning that there is still strain accumulation even on the creeping segment of the fault. It is unclear how Meilano et al. (2012) determined the depth extent of their creep estimate. It is possible that the 3 km depth was a prescribed number in their model. Figure 7 shows a significant uncertainty in the creep depth, with the upper bound completely unconstrained by the model. However, the peak corresponds to 0.1 km, implying that the creep is most likely confined to shallow depths.
6.2 Multi-segment ruptures with the Cimandiri Fault zone
The Cimandiri Fault zone is a ∼ 100 km long east-northeast-striking fault located to the west of the Lembang Fault and continuing to Pelabuhan Ratu Bay (Marliyani et al., 2016) (Fig. 11). The fault zone is expressed in the bedrock by numerous northeast-, west-, and northwest-trending thrust and strike-slip faults and folds. The predominant sense of motion is left-lateral on the eastern segments with more thrust-dominant motion at the western end (Marliyani et al., 2016; Supendi et al., 2018).
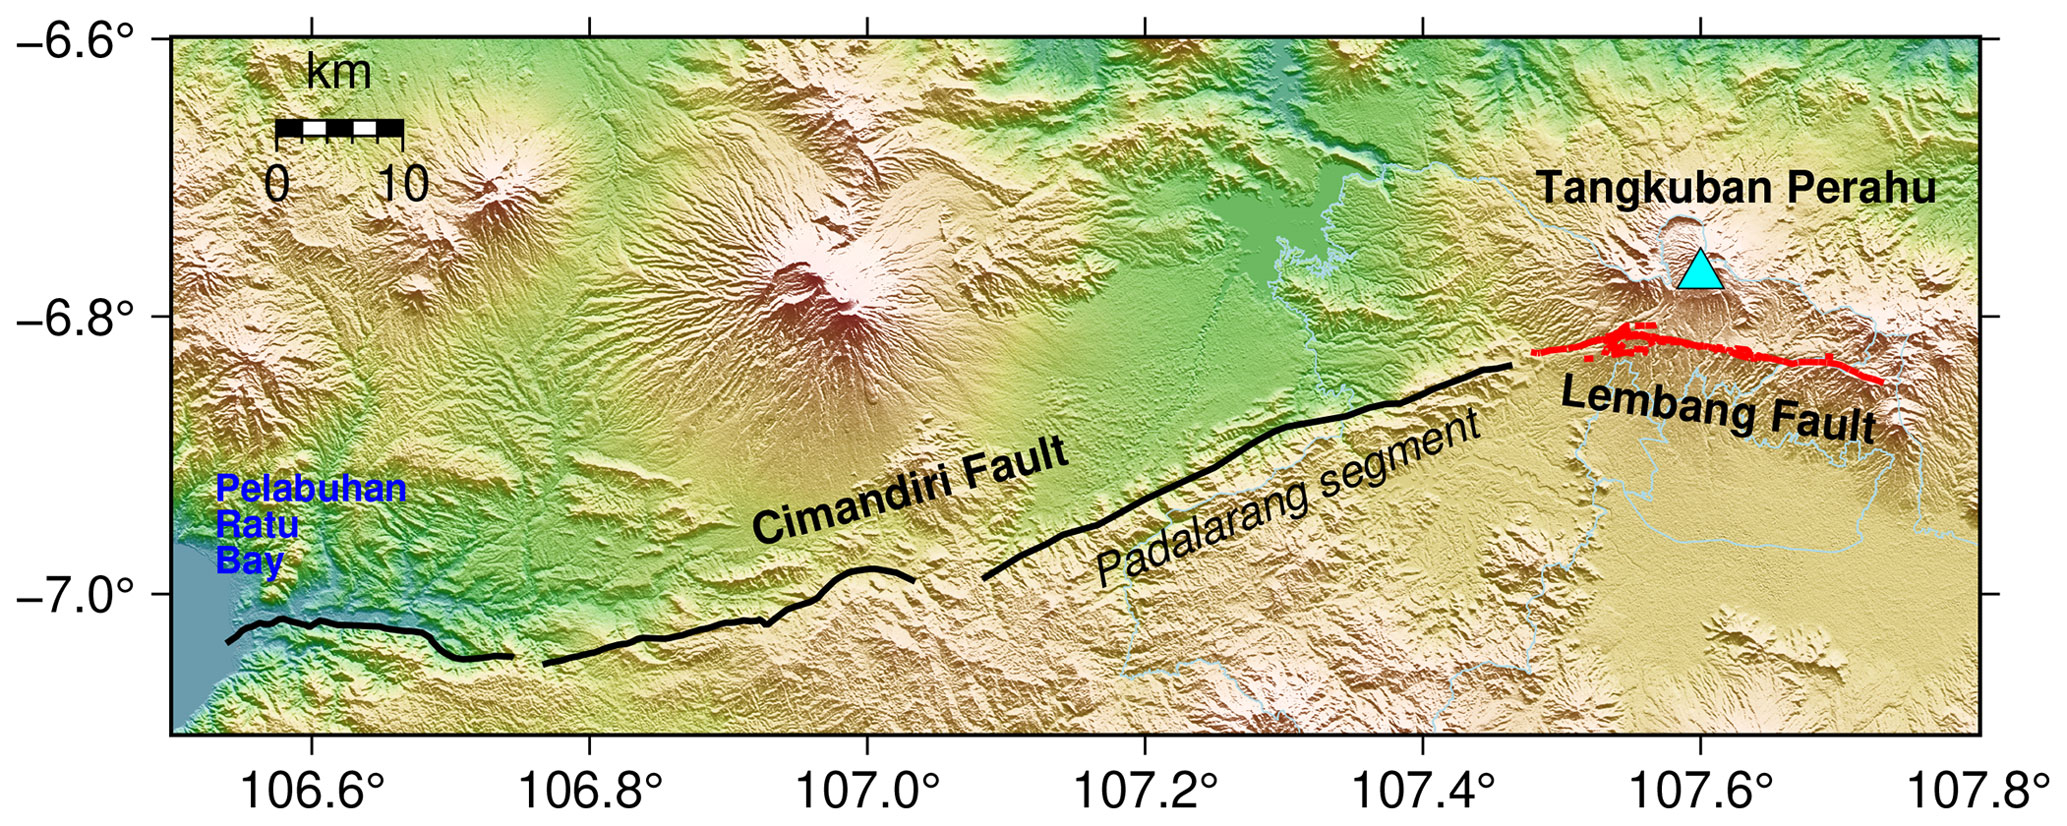
Figure 11The Cimandiri Fault is a ∼ 100 km long multi-segment fault located to the west of the Lembang Fault (Marliyani et al., 2016).
The separation between the surface trace of the western end of the Lembang Fault and the eastern end of the Cimandiri Fault is less than ∼ 5 km. While some authors suggest that the two faults are not connected at depth (Mahya and Sanny, 2017), most agree that the broader strain pattern is consistent across the two faults (e.g. Abidin et al., 2009; Kopp, 2011; Marliyani et al., 2016; Daryono et al., 2019). Marliyani et al. (2016) used dislocation and geometric models to show that the segmentation of the Cimandiri Fault zone could act as a barrier to earthquakes along the zone, thereby limiting the overall size of potential earthquakes. Nevertheless, large earthquakes have been known to jump across larger segment distances, most notably 50 km in the 1997 Pakistan earthquake (Nissen et al., 2016).
Additionally an earthquake on the Lembang Fault or the eastern portion of the Cimandiri Fault (the Padalarang segment; Fig. 11) could change the stress state of the neighbouring fault, thereby raising the possibility of a triggered event or progressive failure of the adjacent fault, particularly if the faults are late in their earthquake cycle and critically stressed (e.g. Stein et al., 1997; Kilb et al., 2002; Nissen et al., 2016; Mildon et al., 2019). There are no records of historical earthquakes along the Padalarang segment with a magnitude greater than 6; but with continuing strain accumulation (Marliyani et al., 2016), a triggered event remains a distinct possibility and therefore an additional source of potential seismic hazard to the Bandung metropolitan region.
In the absence of measured slip rates Marliyani et al. (2016) used simple length–width scaling relationships (Stirling et al., 2008) to estimate that the Padalarang segment of the Cimandiri Fault could be responsible for a magnitude 6.9 earthquake. Assuming a 670-year return period, our analysis shows that the Lembang Fault could accommodate a magnitude 7.0 earthquake. A combined Padalarang–Lembang rupture could therefore result in a potential magnitude 7.2 earthquake.
6.3 Caveats and limitations
The 1-D screw dislocation model (Hussain et al., 2016) used to calculate the fault slip rate and locking depth was originally designed for an infinitely long strike-slip fault with vertical dip (Savage and Burford, 1973). The Lembang Fault is neither infinitely long nor dipping at 90∘. The length issue is only a problem at the ends of the fault, which we avoid by taking a profile through the centre. We agree that a more realistic model of the fault would take into account the dip. However, at 75∘, the fault is near vertical, and so the simple vertical screw dislocation model captures the main aspects of the fault behaviour we are looking for, namely the fault slip rate and locking depth.
A major source of uncertainty in seismic hazard calculations is in the choice of the ground motion prediction equations (GMPEs). To partly mitigate this effect and in order to capture some of the epistemic uncertainty in median ground motion estimates, we used several equally weighted GMPEs tailored to shallow crustal-tectonic settings (Abrahamson et al., 2014; Campbell and Bozorgnia, 2014; Chiou and Youngs, 2014). Additionally, to capture the aleatory variability within each GMPE we allow for a 3σ variability within each model. Nevertheless there remains significant uncertainty in these calculations.
The aim of this paper has been to investigate the directly exposed populations to high levels of ground shaking from potential earthquakes by overlapping the population count with the predicted ground shaking. However, this simplifies the true exposure of people who at any one point could be inside a building of variable type and therefore fragility or who are out on the streets or in open spaces such as parks and therefore less vulnerable to injury. Additionally the timing of the earthquake also matters. An earthquake at night will mean more people are exposed to shaking in their homes, while in the day the exposure is highest at places of work or in transit (Freire and Aubrecht, 2012).
It is also important to remember the geographical and geological context of the study area. The majority of the population in the Banding metropolitan region lives in the Bandung basin, which is a sedimentary basin bounded by volcanic highlands. A large earthquake on the Lembang Fault could result in multiple secondary hazards such as liquefaction, landslides, and blocked waterways leading to floods, fires, etc. Additionally, recent studies have shown that large tectonic earthquakes are capable of triggering volcanic eruptions (e.g. Bedón et al., 2022; Jenkins et al., 2022; Sinaga et al., 2022), meaning that a Lembang Fault earthquake could potentially trigger an eruption at the Tangkuban Perahu stratovolcano located 30 km north of Bandung (Fig. 11). Such hazard cascades can lead to dynamic changes to exposure and vulnerability and potentially increased losses in terms of lives and livelihoods (Gill and Malamud, 2014; de Ruiter and Van Loon, 2022).
In this study we used 6 years of Sentinel-1 radar data to produce deformation maps for the Bandung metropolitan region. By combining the ascending and descending velocities we calculate the east–west velocities across the region and show that there is a strain concentration on the Lembang Fault. We model the velocity profile across the fault using a simple screw dislocation model allowing for shallow creep and find that the slip rate across the fault is 4.7 mm yr−1 with the shallow portions of the fault creeping at 2.2 mm yr−1, less than half the full slip rate, implying that strain is still accumulating at shallow depths. Assuming reasonable fault geometries and estimated return periods of 170–670 years we derive an estimated moment deficit on the fault equivalent to earthquakes of magnitude 6.6–7.0. We estimate the expected ground shaking from these two earthquakes using the Global Earthquake Model OpenQuake engine, taking into account the effect of basin amplification using a combination of measured and estimated Vs30 velocities. Our results show that 1.9–2.7 million people within the Bandung metropolitan region would be exposed to high levels of ground shaking (greater than 0.3 g) given these respective earthquake scenarios. In subduction zone settings the megathrust is often the main focus of research for seismic hazard analysis. Our work here highlights the importance of not forgetting local crustal faults located near large urban centres, which also pose a high hazard to communities.
The Sentinel-1 SAR data are available for free from the Copernicus open-access web portal (https://scihub.copernicus.eu/dhus/#/home, ESA, 2023). The ISCE2 InSAR processing software is available on GitHub (https://github.com/isce-framework/isce2, ISCE2, 2021). The MintPy InSAR time series processor is available on GitHub (https://github.com/insarlab/MintPy, Yunjun et al., 2020). The Global Earthquake Model OpenQuake engine can be downloaded from GitHub (https://github.com/gem/oq-engine, GEM, 2022).
EH and NRH conceived the research framework and developed the methodology. EH was responsible for the InSAR data analysis and graphic visualisation. EG was responsible for the GNSS data collection and processing. QZ was responsible for the population exposure estimates. EH, NRH, and EG wrote the first draft. All the authors discussed the results and contributed to the final version of the paper.
The contact author has declared that none of the authors has any competing interests.
Publisher's note: Copernicus Publications remains neutral with regard to jurisdictional claims in published maps and institutional affiliations.
The authors would like to thank Gavin Sullivan for initiating the Indonesia Seismic Cities project that enabled this collaboration. This research was funded by the BGS-NERC ODA grant “Geoscience for Sustainable Futures” and the BGS–NERC International National Capability programme “Geoscience to tackle Global Environmental Challenges”. The Indonesian counterparts were funded by the Rumah Program Kebencanaan 2022 research grant managed by the National Research and Innovation Agency of Indonesia's (BRIN) Research Organization for Earth Sciences and Maritime, the 2023 Research and Innovation for Advanced Indonesia supported by BRIN and LPDP, and the Overseas Research Grant 2022 of the Asahi Glass Foundation. The paper is published by permission of the director of the British Geological Survey.
This research has been supported by UK Research and Innovation and the Natural Environment Research Council (grant nos. NE/R000069/1 and NE/X006255/1).
This paper was edited by Amy Donovan and reviewed by two anonymous referees.
Abidin, H., Andreas, H., Gamal, M., Wirakusumah, A., Darmawan, D., Deguchi, T., and Maruyama, Y.: Land subsidence characteristics of the Bandung Basin, Indonesia, as estimated from GPS and InSAR, Journal of Applied Geodesy, 2, 167–177, https://doi.org/10.1515/JAG.2008.019, 2008. a
Abidin, H. Z., Andreas, H., Kato, T., Ito, T., Meilano, I., Kimata, F., Natawidjaya, D. H., and Harjono, H.: Crustal deformation studies in Java (Indonesia) using GPS, J. Earthq. Tsunami, 3, 77–88, 2009. a
Abrahamson, N. A., Silva, W. J., and Kamai, R.: Summary of the ASK14 ground motion relation for active crustal regions, Earthq. Spectra, 30, 1025–1055, 2014. a, b
Allen, T. I. and Wald, D. J.: On the use of high-resolution topographic data as a proxy for seismic site conditions (VS30), B. Seismol. Soc. Am., 99, 935–943, 2009. a, b
Altamimi, Z., Rebischung, P., Métivier, L., and Collilieux, X.: ITRF2014: A new release of the International Terrestrial Reference Frame modeling nonlinear station motions, J. Geophys. Res.-Sol. Ea., 121, 6109–6131, 2016. a
Ambraseys, N. and Bilham, R.: Corruption kills, Nature, 469, 153–155, 2011. a
Amey, R. M., Elliott, J. R., Hussain, E., Walker, R., Pagani, M., Silva, V., Abdrakhmatov, K. E., and Watson, C. S.: Significant Seismic Risk Potential From Buried Faults Beneath Almaty City, Kazakhstan, Revealed From High-Resolution Satellite DEMs, Earth and Space Science, 8, e2021EA001664, https://doi.org/10.1029/2021EA001664, 2021. a
Amey, R. M., Elliott, J. R., Watson, C. S., Walker, R., Pagani, M., Silva, V., Hussain, E., Abdrakhmatov, K. E., Baikulov, S., and Tilek Kyzy, G.: Improving urban seismic risk estimates for Bishkek, Kyrgyzstan, through incorporating recently gained geological knowledge of hazards, Nat. Hazards, 116, 365–399, https://doi.org/10.1007/s11069-022-05678-0, 2023. a
Arrowsmith, J. R., Rockwell, T. K., Madugo, K. S., and Zielke, O.: Repeatability, accuracy, and precision of surface slip measurements from high-resolution topographic data: Collaborative research with Arizona State University and San Diego State University, Final Technical Report US Geological Survey National Earthquake Hazards Reduction External Research Program, https://earthquake.usgs.gov/cfusion/external_grants/reports/G11AP20029.pdf (last access: 18 Septemebr 2023), 2012. a
Bard, P.-Y. and Bouchon, M.: The two-dimensional resonance of sediment-filled valleys, B. Seismol. Soc. Am., 75, 519–541, 1985. a
Bard, P. Y., Campillo, M., Chavez-Garcia, F., and Sanchez-Sesma, F.: The Mexico earthquake of September 19, 1985 A theoretical investigation of large-and small-scale amplification effects in the Mexico City Valley, Earthq. Spectra, 4, 609–633, 1988. a
Bedón, P. E., Audin, L., Doin, M.-P., Pinel, V., Pathier, E., Mothes, P., Garcia, A., Samaniego, P., and Pacheco, D.: Unrest at Cayambe Volcano revealed by SAR imagery and seismic activity after the Pedernales subduction earthquake, Ecuador (2016), J. Volcanol. Geoth. Res., 428, 107577, https://doi.org/10.1016/j.jvolgeores.2022.107577, 2022. a
Bertiger, W., Bar-Sever, Y., Dorsey, A., Haines, B., Harvey, N., Hemberger, D., Heflin, M., Lu, W., Miller, M., Moore, A. W., Murphy, D., Ries, P., Romans, L., Sibois, A., Sibthorpe, A., Szilagyi, B., Vallisneri, M., and Willis, P.: GipsyX/RTGx, a new tool set for space geodetic operations and research, Adv. Space Res., 66, 469–489, 2020. a
Bielak, J., Xu, J., and Ghattas, O.: Earthquake ground motion and structural response in alluvial valleys, J. Geotech. Geoenviron., 125, 413–423, 1999. a
Campbell, K. W. and Bozorgnia, Y.: NGA-West2 ground motion model for the average horizontal components of PGA, PGV, and 5 % damped linear acceleration response spectra, Earthq. Spectra, 30, 1087–1115, 2014. a, b
Chiou, B. S.-J. and Youngs, R. R.: Update of the Chiou and Youngs NGA model for the average horizontal component of peak ground motion and response spectra, Earthq. Spectra, 30, 1117–1153, 2014. a, b
Coburn, A. W., Spence, R. J. S., and Pomonis, A.: Factors determining human casualty levels in earthquakes: Mortality prediction in building collapse, in: Proceedings of the tenth world conference on earthquake engineering, Vol. 10, Balkema Rotterdam, 5989–5994, http://www.iitk.ac.in/nicee/wcee/article/10_vol10_5989.pdf (last access: 1 June 2022), 1992. a
Dam, M., Suparan, P., Nossin, J. J., and Voskuil, R.: A chronology for geomorphological developments in the greater Bandung area, West-Java, Indonesia, J. Southe. Asian Earth, 14, 101–115, 1996. a, b, c
Daryono, M. R., Natawidjaja, D. H., Sapiie, B., and Cummins, P.: Earthquake geology of the Lembang Fault, West Java, Indonesia, Tectonophysics, 751, 180–191, 2019. a, b, c, d, e, f, g, h, i, j, k, l
de Ruiter, M. C. and Van Loon, A. F.: The challenges of dynamic vulnerability and how to assess it, Science, 25, 104720, https://doi.org/10.1016/j.isci.2022.104720, 2022. a
Douglas, J. and Edwards, B.: Recent and future developments in earthquake ground motion estimation, Earth-Sci. Rev., 160, 203–219, 2016. a
Du, Z., Ge, L., Ng, A. H.-M., Zhu, Q., Yang, X., and Li, L.: Correlating the subsidence pattern and land use in Bandung, Indonesia with both Sentinel-1/2 and ALOS-2 satellite images, Int. J. Appl. Earth Obs., 67, 54–68, 2018. a
Elliott, J. R.: Earth Observation for the assessment of earthquake hazard, risk and disaster management, Surv. Geophys., 41, 1323–1354, 2020. a
ESA: Copernicus Open Access Hub, ESA [data set], https://scihub.copernicus.eu/dhus/#/home, last access: 21 September 2023.
Farr, T. G., Rosen, P. A., Caro, E., Crippen, R., Duren, R., Hensley, S., Kobrick, M., Paller, M., Rodriguez, E., Roth, L., Seal, D., Shaffer, S., Shimada, J., Umland, J., Werner, M., Oskin, M., Burbank, D., and Alsdorf, D.: The shuttle radar topography mission, Rev. Geophys., 45, RG2004, https://doi.org/10.1029/2005RG000183, 2007. a
Foreman-Mackey, D., Hogg, D. W., Lang, D., and Goodman, J.: emcee: The MCMC Hammer, Publ. Astron. Soc. Pac., 125, 306–312, https://doi.org/10.1086/670067, 2013. a
Freire, S. and Aubrecht, C.: Integrating population dynamics into mapping human exposure to seismic hazard, Nat. Hazards Earth Syst. Sci., 12, 3533–3543, https://doi.org/10.5194/nhess-12-3533-2012, 2012. a
Ge, L., Ng, A. H.-M., Li, X., Abidin, H. Z., and Gumilar, I.: Land subsidence characteristics of Bandung Basin as revealed by ENVISAT ASAR and ALOS PALSAR interferometry, Remote Sens.-Basel, 154, 46–60, 2014. a
GEM: The OpenQuake-engine User Manual. Global Earthquake Model (GEM) OpenQuake Manual for Engine version 3.14.0, GitHub [code] https://github.com/gem/oq-engine (last access: 1 November 2022), 2022. a
Gill, J. C. and Malamud, B. D.: Reviewing and visualizing the interactions of Nat Hazards, Rev. Geophys., 52, 680–722, 2014. a
Goodman, J. and Weare, J.: Ensemble samplers with affine invariance, Comm. App. Math. Com. Sc., 5, 65–80, 2010. a
Gunawan, E.: An assessment of earthquake scaling relationships for crustal earthquakes in Indonesia, Seismological Society of America, 92, 2490–2497, 2021. a
Gunawan, E. and Widiyantoro, S.: Active tectonic deformation in Java, Indonesia inferred from a GPS-derived strain rate, J. Geodyn., 123, 49–54, 2019. a
Hanks, T. C. and Kanamori, H.: A moment magnitude scale, J. Geophys. Res.-Sol. Ea., 84, 2348–2350, 1979. a
Hussain, E., Wright, T. J., Walters, R. J., Bekaert, D. P. S., Hooper, A., and Houseman, G. A.: Geodetic observations of postseismic creep in the decade after the 1999 Izmit earthquake, Turkey: Implications for a shallow slip deficit, J. Geophys. Res.-Sol. Ea., 121, 2980–3001, 2016. a, b, c
Hussain, E., Elliott, J. R., Silva, V., Vilar-Vega, M., and Kane, D.: Contrasting seismic risk for Santiago, Chile, from near-field and distant earthquake sources, Nat. Hazards Earth Syst. Sci., 20, 1533–1555, https://doi.org/10.5194/nhess-20-1533-2020, 2020. a
ISCE2: Interferometric synthetic aperture radar Scientific Computing Environment (ISCE), v2, GitHub [code], https://github.com/isce-framework/isce2 (last access: 1 June 2021), 2021. a
Jayaram, N. and Baker, J. W.: Correlation model for spatially distributed ground-motion intensities, Earthq. Eng. Struct. D, 38, 1687–1708, 2009. a
Jenkins, A., Rust, A., and Biggs, J.: A global statistical study on the triggering of volcanic eruptions by large tectonic earthquakes, EGU General Assembly 2022, Vienna, Austria, 23–27 May 2022, EGU22-8020, https://doi.org/10.5194/egusphere-egu22-8020, 2022. a
Joyner, W. B.: Strong motion from surface waves in deep sedimentary basins, B. Seismol. Soc. Am., 90, S95–S112, 2000. a
Kilb, D., Gomberg, J., and Bodin, P.: Aftershock triggering by complete Coulomb stress changes, J. Geophys. Res.-Sol. Ea., 107, ESE 2-1–ESE 2-14, https://doi.org/10.1029/2001JB000202, 2002. a
Kopp, H.: The Java convergent margin: structure, seismogenesis and subduction processes, Geol. Soc. Sp., 355, 111–137, 2011. a
Mahya, M. and Sanny, T.: Two-Dimensional Boundary Element Method Application for Surface Deformation Modeling around Lembang and Cimandiri Fault, West Java, Inst. Phys. Conf. Ser., 62, 012009, https://doi.org/10.1088/1755-1315/62/1/012009, 2017. a
Marliyani, G. I., Arrowsmith, J. R., and Whipple, K. X.: Characterization of slow slip rate faults in humid areas: Cimandiri fault zone, Indonesia, J. Geophys. Res.-Sol. Ea., 121, 2287–2308, 2016. a, b, c, d, e, f, g
Meilano, I., Abidin, H. Z., Andreas, H., Gumilar, I., Sarsito, D., Hanifa, R., Harjono, H., Kato, T., Kimata, F., and Fukuda, Y.: Slip rate estimation of the Lembang Fault West Java from geodetic observation, J. Dis. Res., 7, 12–18, 2012. a, b, c, d, e, f, g
Mildon, Z., Roberts, G. P., Faure Walker, J., and Toda, S.: Coulomb pre-stress and fault bends are ignored yet vital factors for earthquake triggering and hazard, Nat. Commun., 10, 1–9, 2019. a
Nissen, E., Elliott, J. R., Sloan, R. A., Craig, T. J., Funning, G. J., Hutko, A., Parsons, B. E., and Wright, T. J.: Limitations of rupture forecasting exposed by instantaneously triggered earthquake doublet, Nat. Geosci., 9, 330–336, 2016. a, b
Nugraha, A., Supendi, P., Prabowo, B., Rosalia, S., Husni, Y., Widiyantoro, S., Puspito, N., and Priyono, A.: The Recent Small Earthquakes around Lembang Fault, West Java, Bandung, Indonesia, J. Phys. Conf. Ser., 1204, 012083, https://doi.org/10.1088/1742-6596/1204/1/012083, 2019. a, b
Pagani, M., Monelli, D., Weatherill, G., Danciu, L., Crowley, H., Silva, V., Henshaw, P., Butler, L., Nastasi, M., Panzeri, L., Simionato, M., and Vigano, D.: OpenQuake engine: An open hazard (and risk) software for the global earthquake model, Seismol. Res. Lett., 85, 692–702, https://doi.org/10.1785/0220130087, 2014. a
Pramatadie, A. M., Yamanaka, H., Chimoto, K., Afnimar, Koketsu, K., Sakaue, M., Miyake, H., Sengara, I. W., and Sadisun, I. A.: Microtremor exploration for shallow S-wave velocity structure in Bandung Basin, Indonesia, Explor. Geophys., 48, 401–412, 2017. a, b, c
Rial, J.: Seismic wave resonances in 3-D sedimentary basins, Geophys. J. Int., 99, 81–90, 1989. a
Ritchie, H. and Roser, M.: Urbanization, Our World in Data, https://ourworldindata.org/urbanization (last access: 1 January 2022), 2018. a
Rosen, P. A., Gurrola, E., Sacco, G. F., and Zebker, H.: The InSAR scientific computing environment, in: EUSAR 2012; 9th European Conference on Synthetic Aperture Radar, Nuremberg, Germany, VDE, 730–733, https://ieeexplore.ieee.org/abstract/document/6217174 (last access: 1 November 2022), 2012. a
Sanny, T. A.: Identification of Lembang fault, West-Java Indonesia by using controlled source audio-magnetotelluric (CSAMT), AIP Conf. Proc., 1861, 030002, https://doi.org/10.1063/1.4990889, 2017. a
Savage, J. C. and Burford, R. O.: Geodetic determination of relative plate motion in central California, J. Geophys. Res., 78, 832–845, 1973. a, b
Scharer, K. M., Salisbury, J. B., Arrowsmith, J. R., and Rockwell, T. K.: Southern San Andreas fault evaluation field activity: Approaches to measuring small geomorphic offsets Challenges and recommendations for active fault studies, Seismol. Res. Lett., 85, 68–76, 2014. a
Sinaga, G. H. D., Silaban, W., and Simanullang, A. F.: Analysis of Coulomb Stress of Sumatera Earthquake Against Pyroclastic Flow of Mount Sinabung as Data Prone Volcano Disaster, World J. Adv. Res. Rev., 13, 793–803, 2022. a
Stein, R. S., Barka, A. A., and Dieterich, J. H.: Progressive failure on the North Anatolian Fault since 1939 by earthquake stress triggering, Geophys. J. Int., 128, 594–604, 1997. a
Stirling, M., Gerstenberger, M., Litchfield, N., McVerry, G., Smith, W., Pettinga, J., and Barnes, P.: Seismic hazard of the Canterbury region, New Zealand: New earthquake source model and methodology, B. NZ Soc. Earthq. Eng., 41, 51–67, 2008. a
Sulaeman, C. and Hidayati, S.: Gempa bumi Bandung 22 Juli 2011, J. Ling. Benc. Geol., 2, 185–190, 2011. a, b
Supendi, P., Nugraha, A. D., Puspito, N. T., Widiyantoro, S., and Daryono, D.: Identification of active faults in West Java, Indonesia, based on earthquake hypocenter determination, relocation, and focal mechanism analysis, Geoscience Letters, 5, 1–10, 2018. a, b, c
Van Bemmelen, R.: The geology of Indonesia, Vol. 1A, Gov Print Off, The Hague: Government Printing Office, Vol. 1B, 65 pp., https://cir.nii.ac.jp/crid/1130282271847390592 (last access: 1 June 2022), 1949. a
Van der Kaars, W. and Dam, M.: A 135,000-year record of vegetational and climatic change from the Bandung area, West-Java, Indonesia, Palaeogeogr. Palaeocl., 117, 55–72, 1995. a
Wald, D. J. and Allen, T. I.: Topographic slope as a proxy for seismic site conditions and amplification, B. Seismol. Soc. Am., 97, 1379–1395, 2007. a, b
Wirth, E. A., Vidale, J. E., Frankel, A. D., Pratt, T. L., Marafi, N. A., Thompson, M., and Stephenson, W. J.: Source-dependent amplification of earthquake ground motions in deep sedimentary basins, Geophys. Res. Lett., 46, 6443–6450, 2019. a
Wright, T. J., Parsons, B. E., and Lu, Z.: Toward mapping surface deformation in three dimensions using InSAR, Geophys. Res. Lett., 31, L01607, https://doi.org/10.1029/2003GL018827, 2004. a
Wright, T. J., Elliott, J. R., Wang, H., and Ryder, I.: Earthquake cycle deformation and the Moho: Implications for the rheology of continental lithosphere, Tectonophysics, 609, 504–523, 2013. a
Yu, C., Li, Z., Penna, N. T., and Crippa, P.: Generic atmospheric correction model for interferometric synthetic aperture radar observations, J. Geophys. Res.-Sol. Ea., 123, 9202–9222, 2018. a
Yunjun, Z., Fattahi, H., and Amelung, F.: Small baseline InSAR time series analysis: Unwrapping error correction and noise reduction, Comput. Geosci., 133, 104331, https://doi.org/10.1016/j.cageo.2019.104331, 2019. a, b
Yunjun, Z., Fattahi, H., and Amelung, F.: The Miami INsar Time-series software in PYthon (MintPy), v1.2.2, GitHub [code], https://github.com/insarlab/MintPy (last access: 1 June 2020), 2020. a