the Creative Commons Attribution 4.0 License.
the Creative Commons Attribution 4.0 License.
 | 08 Sep 2023
Rapid estimation of seismic intensities by analyzing early aftershock sequences using the robust locally weighted regression program (LOWESS)
Huaiqun Zhao
Wenkai Chen
Can Zhang
Dengjie Kang
Accurate and rapid assessment of seismic intensity after a destructive earthquake is essential for efficient early emergency response. We proposed an improved method, AL-SM99, to assess seismic intensity by analyzing aftershock sequences that occur within 2 h of mainshocks. The implementation effect and application conditions of this method were illustrated using 27 earthquakes with Mw 6.5–8.3 that occurred globally between 2000 and 2023. When the fault system in the seismic region is clear and simple, the robust LOWESS-fitted (locally weighted regression program) curves could be used to estimate the location and length of the fault rupture. LOWESS results can indicate the overall rupture trend and make reliable rupture-scale judgments even when the fault system is complex. When Mw ≥ 7.0 and the number of aftershocks exceeds 40, the AL-SM99 intensity evaluation results may be more reliable. Using aftershock catalogues obtained by conventional means allows for a stable assessment of seismic intensities within 1.5 h of the mainshock. When the number of aftershocks is sufficiently large, the intensity assessment time can be greatly reduced. With early accessible aftershocks, we can quickly determine the rupture fault planes and have a better estimate of the seismic intensities. The results of the intensity assessment provide a useful guide for determining the extent of the hardest-hit areas. By expanding the data sources for seismic intensity assessment, the early accessible data are utilized adequately. This study provides a valuable reference point for investigating the relationship between early aftershock events and fault rupture.
- Article
(13590 KB) - Full-text XML
- BibTeX
- EndNote


Seismic intensity reflects the strength of ground motion caused by an earthquake and its influence at a certain location. Rapid and accurate assessment of seismic intensity facilitates the development of emergency measures in the aftermath of a destructive earthquake, thereby reducing the number of fatalities and property damage (Erdik et al., 2011; Poggi et al., 2021). Therefore, it is necessary to develop methods for the rapid assessment of seismic intensity and the effective utilization of disaster data in the early post-earthquake period.
Various methods have been employed to evaluate seismic intensities. In regions, such as Japan, with a dense distribution of seismic monitoring stations, the density of intensity meters and stations is sufficient to support the assessment of intensities (Nishimae, 2004). The ShakeMap system of the US Geological Survey (USGS) combines predicted ground motion values with station observations to determine the seismic intensity of a region and publishes the results online in near real time (Worden et al., 2020). Empirical models, particularly elliptical attenuation models, are widely utilized in China, where the relevant authorities conduct on-site investigations during a certain period after an earthquake to draw and publish macroseismic intensity maps (Wang et al., 2013; Xu et al., 2020). Furthermore, deep-learning-based real-time seismic intensity prediction has emerged as a current research focus (Otake et al., 2020; Chen et al., 2022). Internet data, remote sensing and radar data are widely utilized in earthquake damage assessment (Dell'acqua and Gamba, 2012; Hao et al., 2012; Xu et al., 2013; Yao et al., 2021).
The time between the occurrence of an earthquake and the first acquisition of disaster data from the seismogenic region, typically within 2–3 h of the mainshock, is defined as the black-box period for earthquake emergency response (Nie and An, 2013). In general, little information regarding a disaster has been reported from the disaster area during this period, despite the fact that decision-makers require reasonably reliable data to initiate emergency response efforts. Seismic monitoring networks and the internet are the main sources of data (Nie et al., 2012; Xia et al., 2019). Consequently, ground motion assessment maps are typically generated using data from dense intensity meters, empirical models or internet-based seismic intensity assessment systems, and they serve as the foundation for early emergency command and decision-making (Wald et al., 1999; Atkinson and Wald, 2007; Sokolov et al., 2010). Back projection could image the fault geometry of large earthquakes at high resolution and is frequently used to trace surface rupture processes and source durations (Ishii et al., 2005; Wan et al., 2022). The combination of back-projection results and P-wave amplitudes could be used to quickly estimate the source length and magnitude of large earthquakes (Wang et al., 2017). Using the back-projection technique and ground motion prediction equation (GMPE), Chen et al. (2022a) developed a new algorithm for quickly obtaining the intensity maps of destructive earthquakes. The algorithm was validated during the emergency response phase of the 2021 Maduo Mw 7.3 and 2021 Yangbi Mw 6.1 earthquakes in China and was confirmed to be suitable for intensity assessment in regions with sparse observation networks (Chen et al., 2022b).
The spatial distribution of aftershock sequences after large earthquakes reflects surface rupture information. Aftershock sequences are widely utilized in studies to investigate the structure and nature of causative faults and the process of earthquake nucleation (Umino et al., 2002; Bachura and Fischer, 2016). Artificial intelligence (AI) can extract valuable information and patterns from massive amounts of data, and it is frequently used in seismology to improve phase detection sensitivity while processing massive amounts of real-time monitoring data (Jiao and Alavi, 2020). The use of machine learning enables more sensitive identification of shake events and increases the number of detected earthquakes compared to routine methods (Liu et al., 2020). Relocated aftershock sequences have become one of the most important tools for studying the rapid determination of causative faults after an earthquake (Fuis et al., 2003; Wang et al., 2021). The spatial distribution of aftershocks may reflect the continuation of sliding at the edge of the area of maximum co-seismic displacement or the activation of subsidiary faults at the rupture boundary of the mainshock (Mendoza and Hartzell, 1988); dynamic stresses could remotely trigger seismic activity and may have the same effect in near-fault regions (Kilb et al., 2000). The early aftershocks of the 2008 Wenchuan Mw 7.9 earthquake were located below or around the mainshock slip patch boundaries, and the geometry of the fault limited the occurrence of early aftershocks within the first 24 h (Yin et al., 2018). Aftershock sequences that occur shortly after the mainshock could outline the basic characteristics of the mainshock rupture surface (Kisslinger, 1996). The area of the aftershock zone is a good first-order approximation of the mainshock rupture area, as the aftershocks tend to concentrate near the boundary of the mainshock rupture (Neo et al., 2021). Mainshock and aftershock sequence simulations in geometrically complex fault zones have shown that early aftershocks are good indicators of the extent of mainshock rupture; it is reasonable to estimate the length of the fault plane based on well-constrained aftershock locations, and most aftershocks are distributed within 1–1.5 km of the mainshock rupture (Yukutake and Iio, 2017; Yabe and Ide, 2018; Ozawa and Ando, 2021).
As mentioned previously, it is possible to extract fault rupture information from early aftershock data. The seismic intensities assessed by Zhao et al. (2022b) using aftershocks within 2 h of the 2022 Menyuan Mw 6.6 earthquake and GMPE based on fault rupture agreed with the on-site investigation results. Although the seismic intensity assessed by this method was useful for identifying the hardest-hit areas, no in-depth analysis of the selection and application of aftershock data was conducted. In this study, we propose a method for rapidly assessing the seismic intensity following an earthquake by analyzing the spatial distribution of aftershock sequences using the locally weighted regression program (LOWESS). The interquartile range (IQR) was utilized to exclude aftershocks with abnormal geographic coordinates from the aftershock sequence that occurred within 2 h of the mainshock. The geographic coordinates of the processed aftershocks are then fitted with LOWESS, and the results of the fitting are used in the GMPE calculation. Finally, the ground motion calculation results are converted to seismic intensity using the seismic intensity scale. The implementation of the new method and the effect of intensity assessment are demonstrated for specific earthquake cases, and its applicability is discussed.
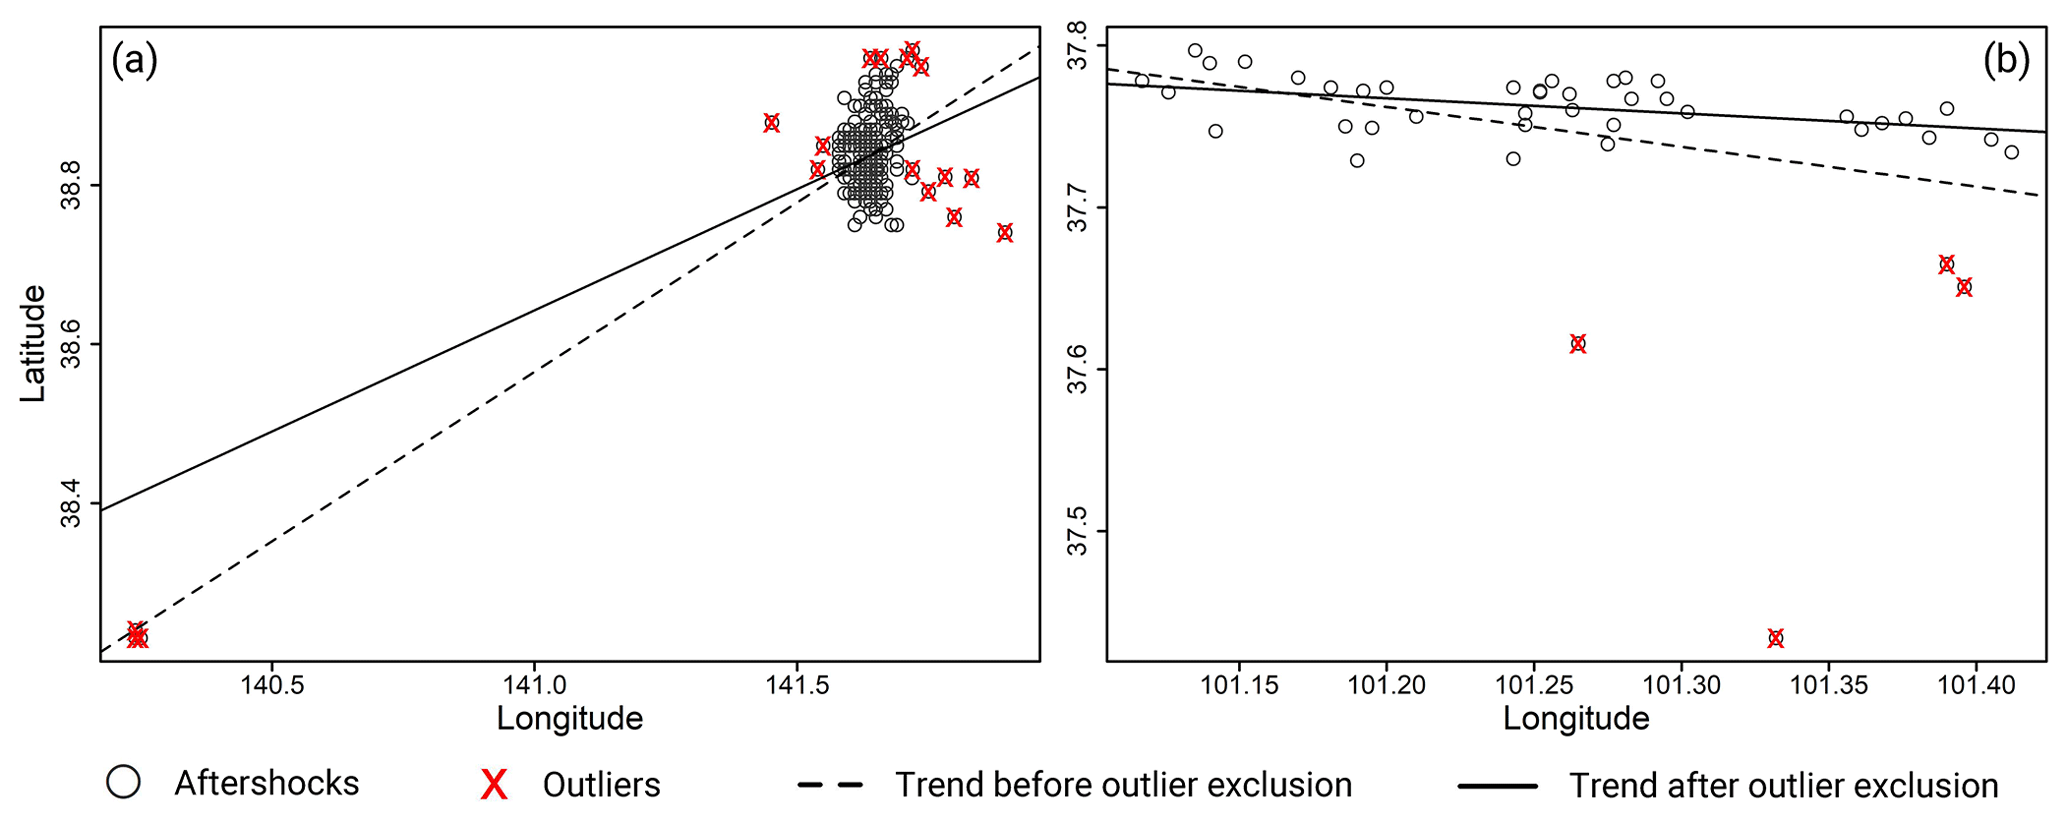
Figure 1Aftershock sequence spatial distribution before and after deleting outliers. The (a) 2003 Miyagi-Oki Mw 7.0 and (b) 2022 Menyuan Mw 6.6 earthquakes.
2.1 Data
The earthquakes chosen for this study had a magnitude (Mw) greater than or equal to 6.5 and were shallow (hypocenter depth less than 70 km). When the Modified Mercalli Intensity (MMI) is VII, ShakeMap uses the terms “very strong” and “moderate damage” to describe the levels of impact on a region (Worden et al., 2020). Similar descriptions of intensity VII exist in the Chinese Seismic Intensity (CSI) scale. For the intensity range of VII–VIII, human perception of shaking began to be saturated, and it may be difficult to distinguish seismic intensities above VII based on the individual descriptions of the felt shaking alone (Dengler and Dewey, 1998; Worden et al., 2020). To ensure that the cases included in the study caused significant effects within the seismogenic region and conveniently compare our results with those assessed by ShakeMap, it was specified that the maximum intensity of the ShakeMap evaluation for the cases used in this study could not be less than VII. The more aftershocks that occur within a 2 h period, the more probable that the length, direction and other aspects of the surface rupture are outlined. The events chosen in this study had a minimum of 15 aftershocks within 2 h of the mainshock. A total of 27 earthquakes between 2000 and 2023 that met the aforementioned criteria were chosen, and their seismic station data and isoseismal lines were downloaded in shapefile format from ShakeMap (https://earthquake.usgs.gov/data/shakemap/, last access: 3 September 2023).
Except for earthquakes occurring in China and two earthquakes in Türkiye in February 2023 with Mw exceeding 7.0, the aftershock sequences for all earthquakes were obtained from the International Seismological Centre (ISC). As the ISC only recorded a small number of the aftershocks that occur within 2 h of Chinese earthquakes, we chose to download aftershock data from the earthquake catalogue repository of the Earthquake Science Knowledge Service System in China. For the earthquakes that occurred in China, we digitized the intensity map drawn by the on-site investigation published by the China Earthquake Administration (CEA) using ArcGIS. The global VS30 was downloaded from the US Geological Survey website, and the earthquake occurrence time used was coordinated universal time.
2.2 Methods
2.2.1 Outlier selection and deletion
In the raw aftershock sequence data, there may be isolated aftershocks far from the aftershock cluster area. These aftershocks are regarded as outliers, affecting the judgment of the distribution trend of aftershocks and causing the LOWESS result to deviate. IQR is a straightforward method in descriptive statistical data analysis that is frequently employed to identify outliers in a variety of fields (Rojas-Martinez et al., 2007; Spitzer et al., 2014). It is expressed as the difference between the third (Q3) and first (Q1) quartiles, i.e., IQR = Q3 − Q1. The quartile range [Q1 − kIQR, Q3 + kIQR] is utilized as the criterion for identifying outliers (Perez and Tah, 2020). If the aftershock longitude or latitude value fell outside this range, it was deemed an outlier and deleted; the default value for k in R software is 1.5. In this study, outliers were selected and eliminated using the R programming language.
Table 1Number of aftershocks and identified outliers for the selected earthquakes.
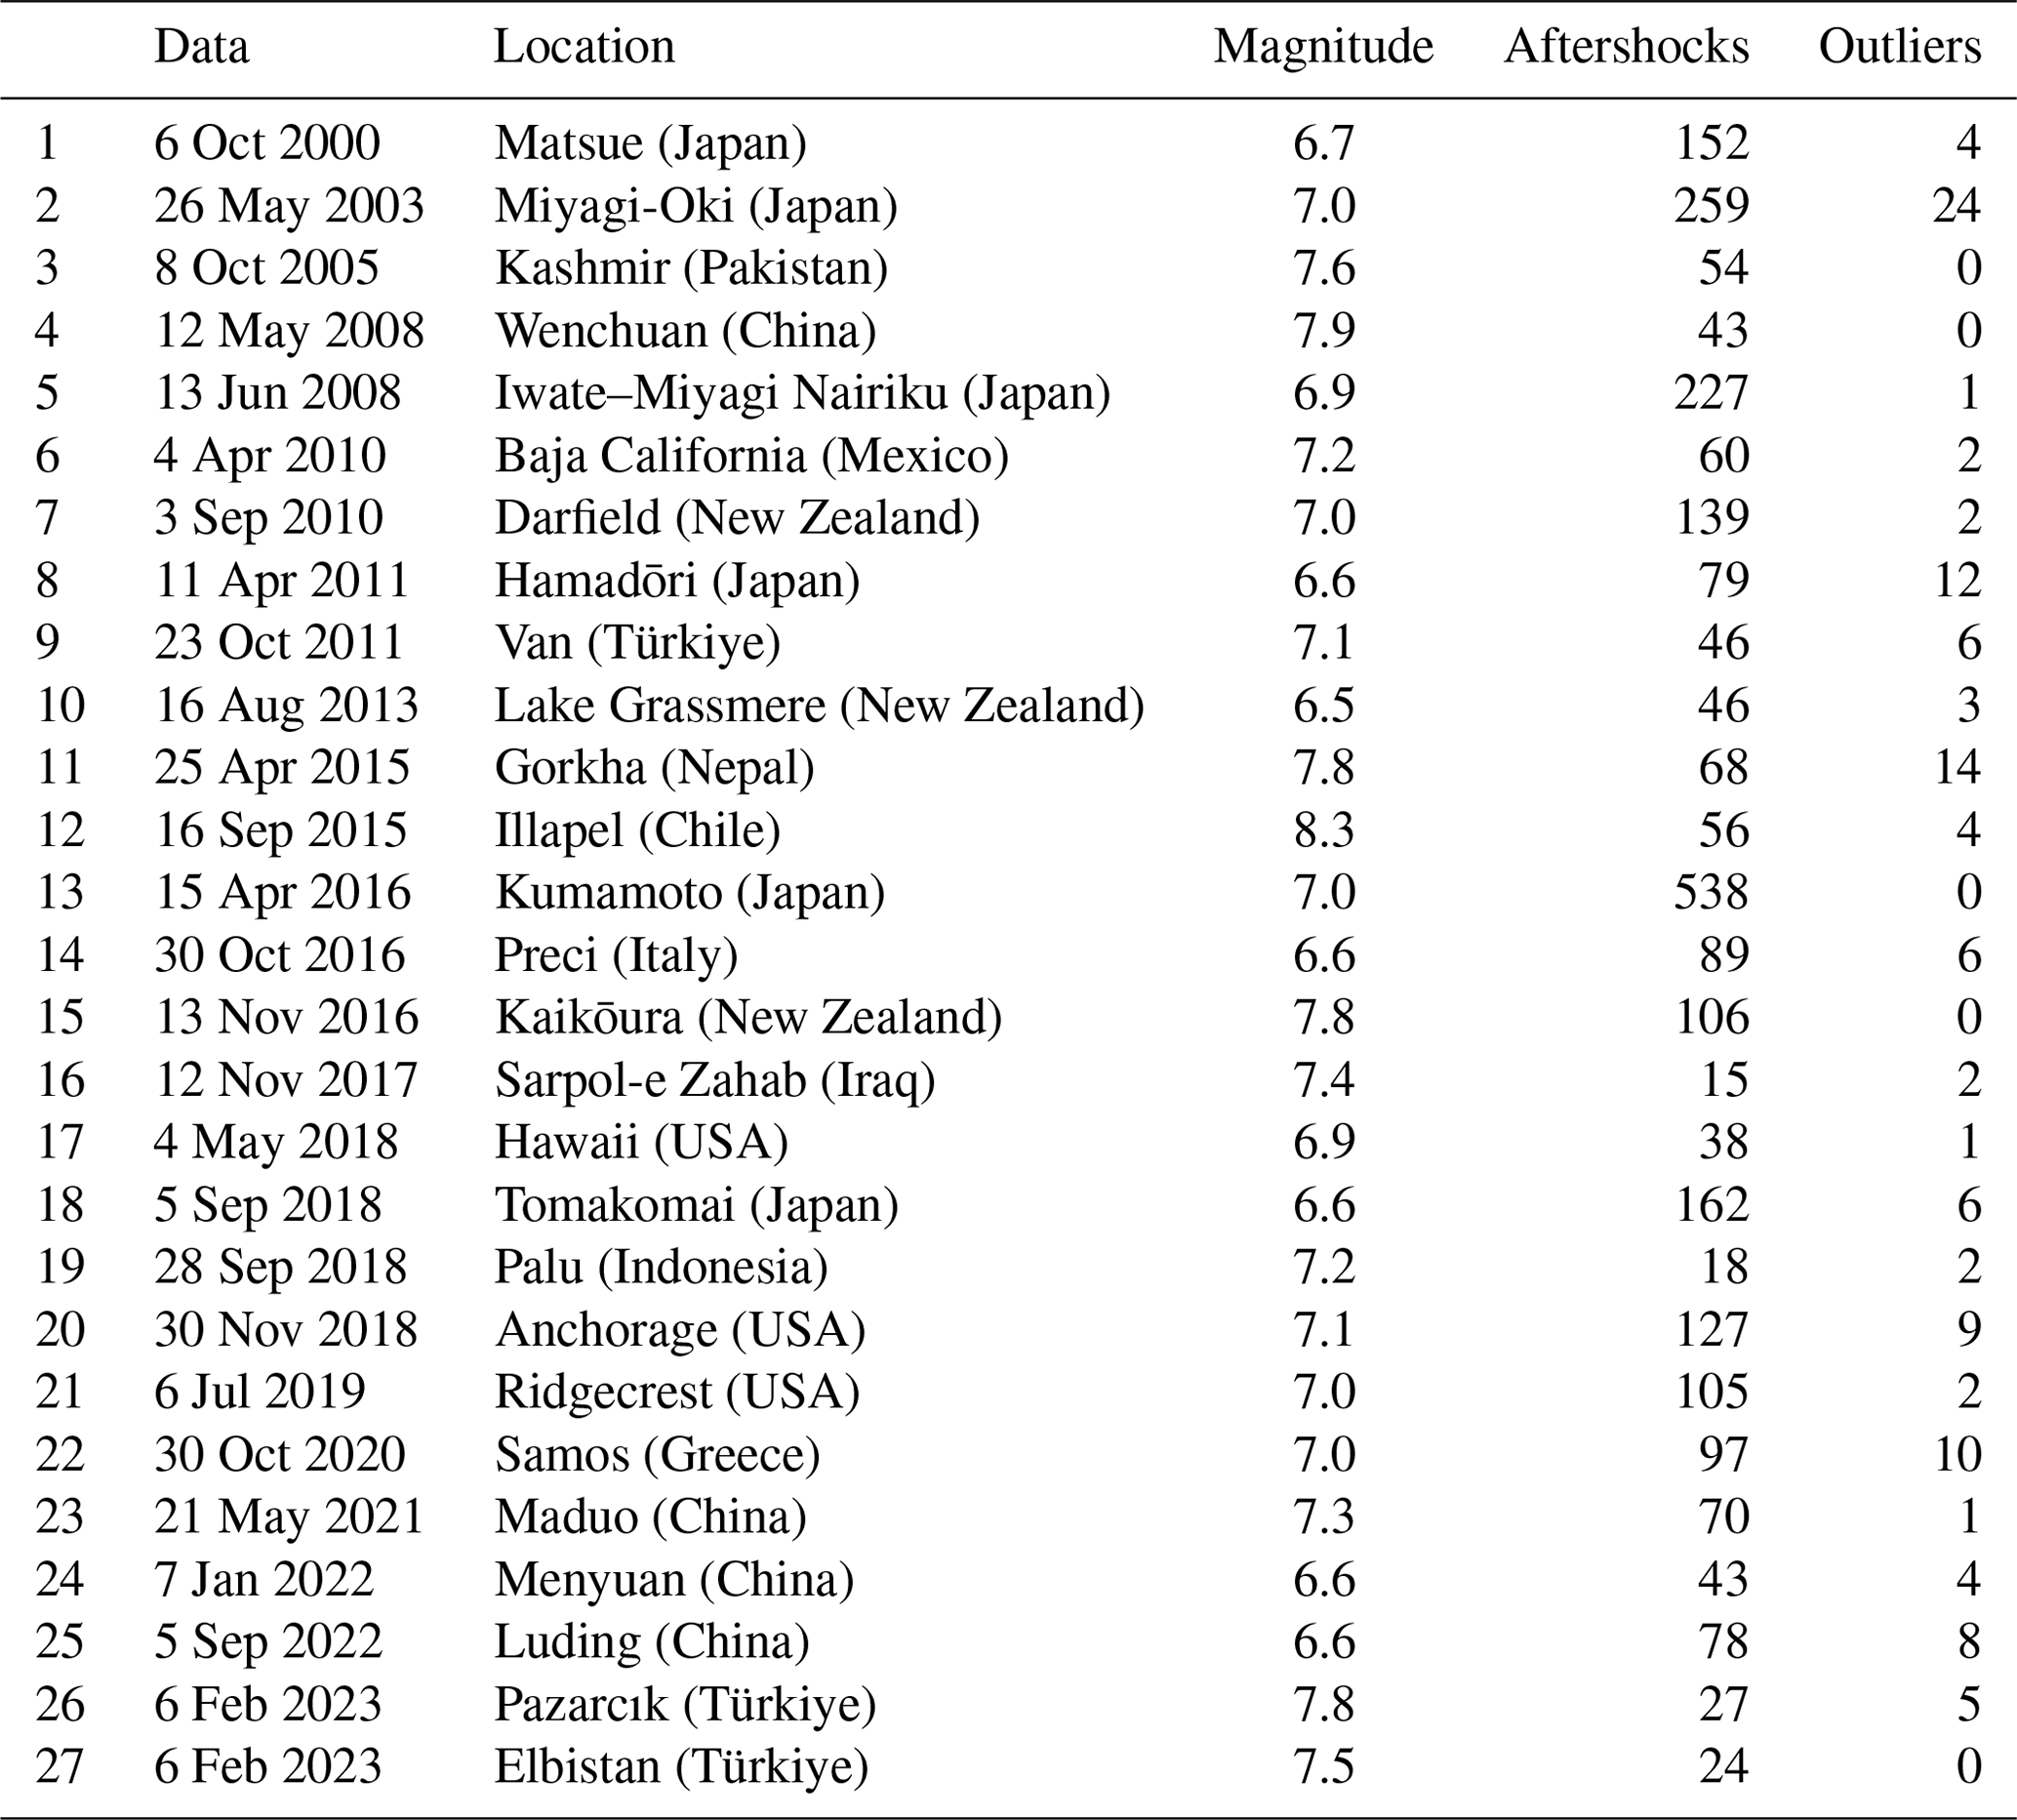
If the raw data contain outliers, the fitting line will be biased toward sporadic aftershocks. After removing these events, the new trend line is more consistent with the spatial distribution of the aftershock sequence (Fig. 1). The preserved aftershocks contain useful information concerning surface rupture. If there are no outliers in the original data, it can be used directly for LOWESS. IQR checking revealed no outliers in the aftershocks that occurred within 2 h of the 2008 Wenchuan Mw 7.9 and 2016 Kaikōura Mw 7.8 earthquakes (Table 1).
2.2.2 Application of LOWESS
Fitting methods are frequently used to visualize trends in scatterplots and predict the future development of the research object. Since the introduction of local fitting for processing time series data into the general situation of regression analysis, local regression methods have developed continuously (Macaulay, 1931; Watson, 1964; Stone, 1977). Cleveland (1979, 1981) proposed a single-variable local smoothing method, a robust locally weighted regression program (LOWESS) for using this method to smooth scatterplots. Later, a multivariate smoothing model called LOESS was also introduced (Cleveland and Devlin, 1988). LOWESS has been utilized to visualize trends in scatterplot distributions in a variety of natural and social sciences (Quackenbush, 2002; Tetlock, 2007; Grimmer and Stewart, 2013; Law et al., 2014). LOWESS improves visualization of geophysical and high-frequency financial data trends and is simple to implement (Mariani and Basu, 2014).
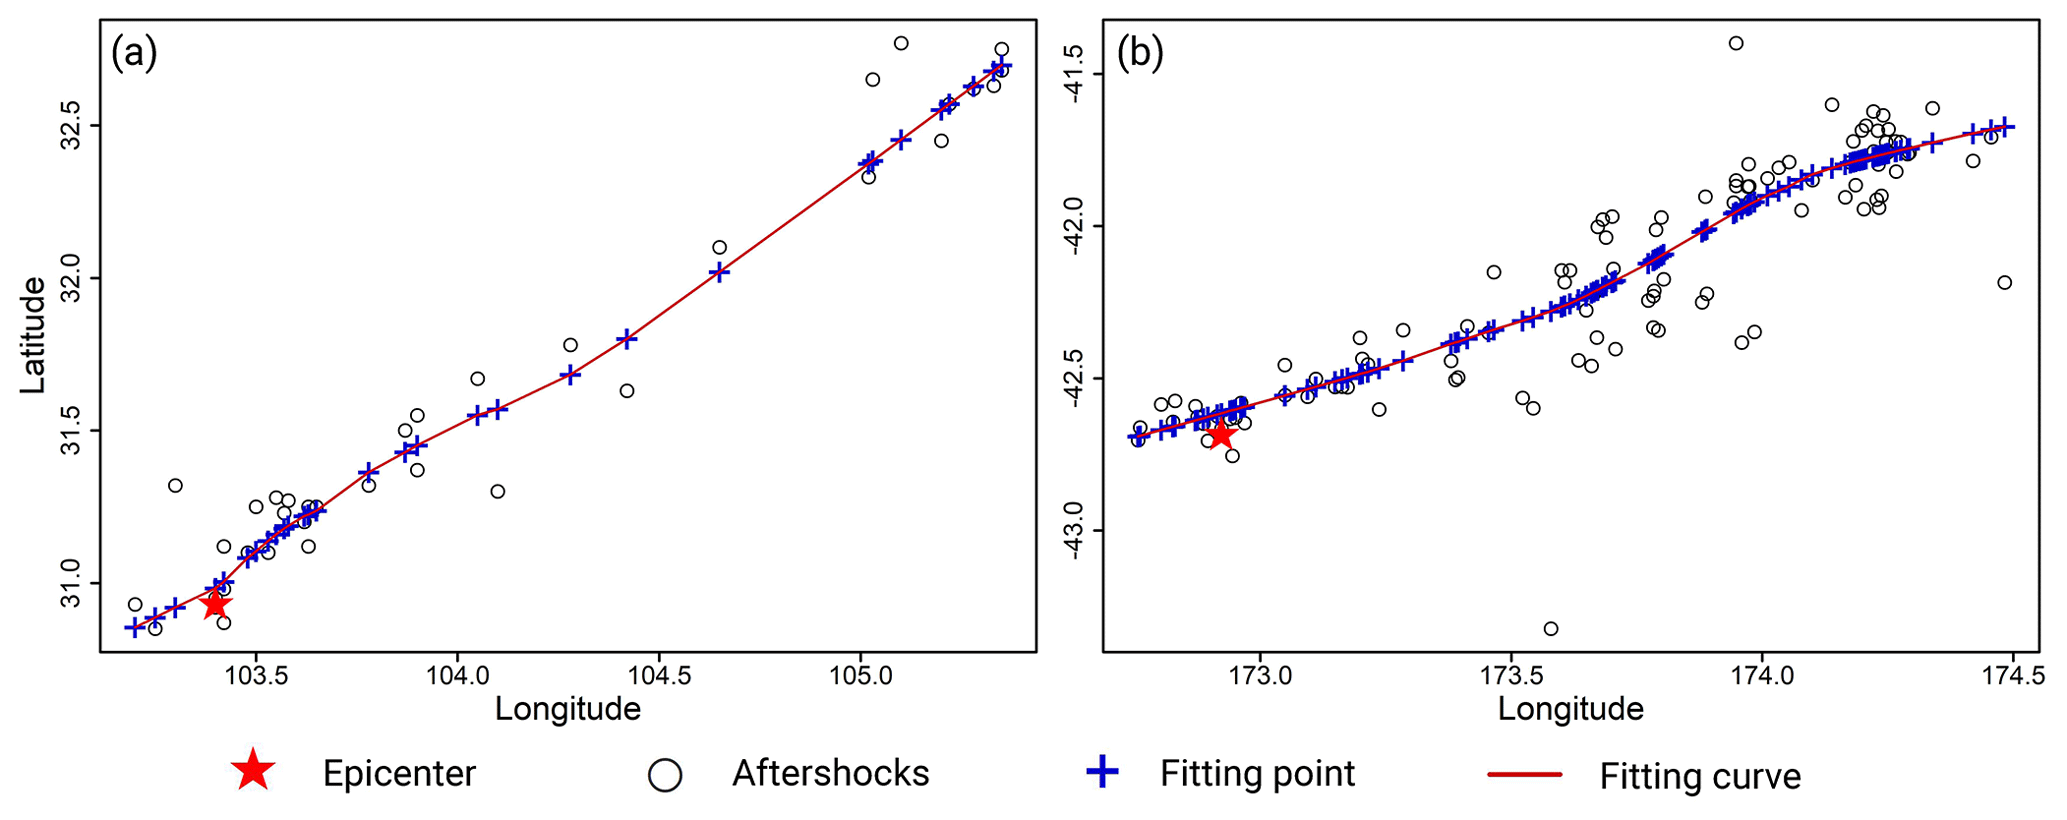
Figure 2LOWESS-fitting results for aftershocks that occurred within 2 h of the (a) 2008 Wenchuan Mw 7.9 and (b) 2016 Kaikōura Mw 7.8 earthquakes.
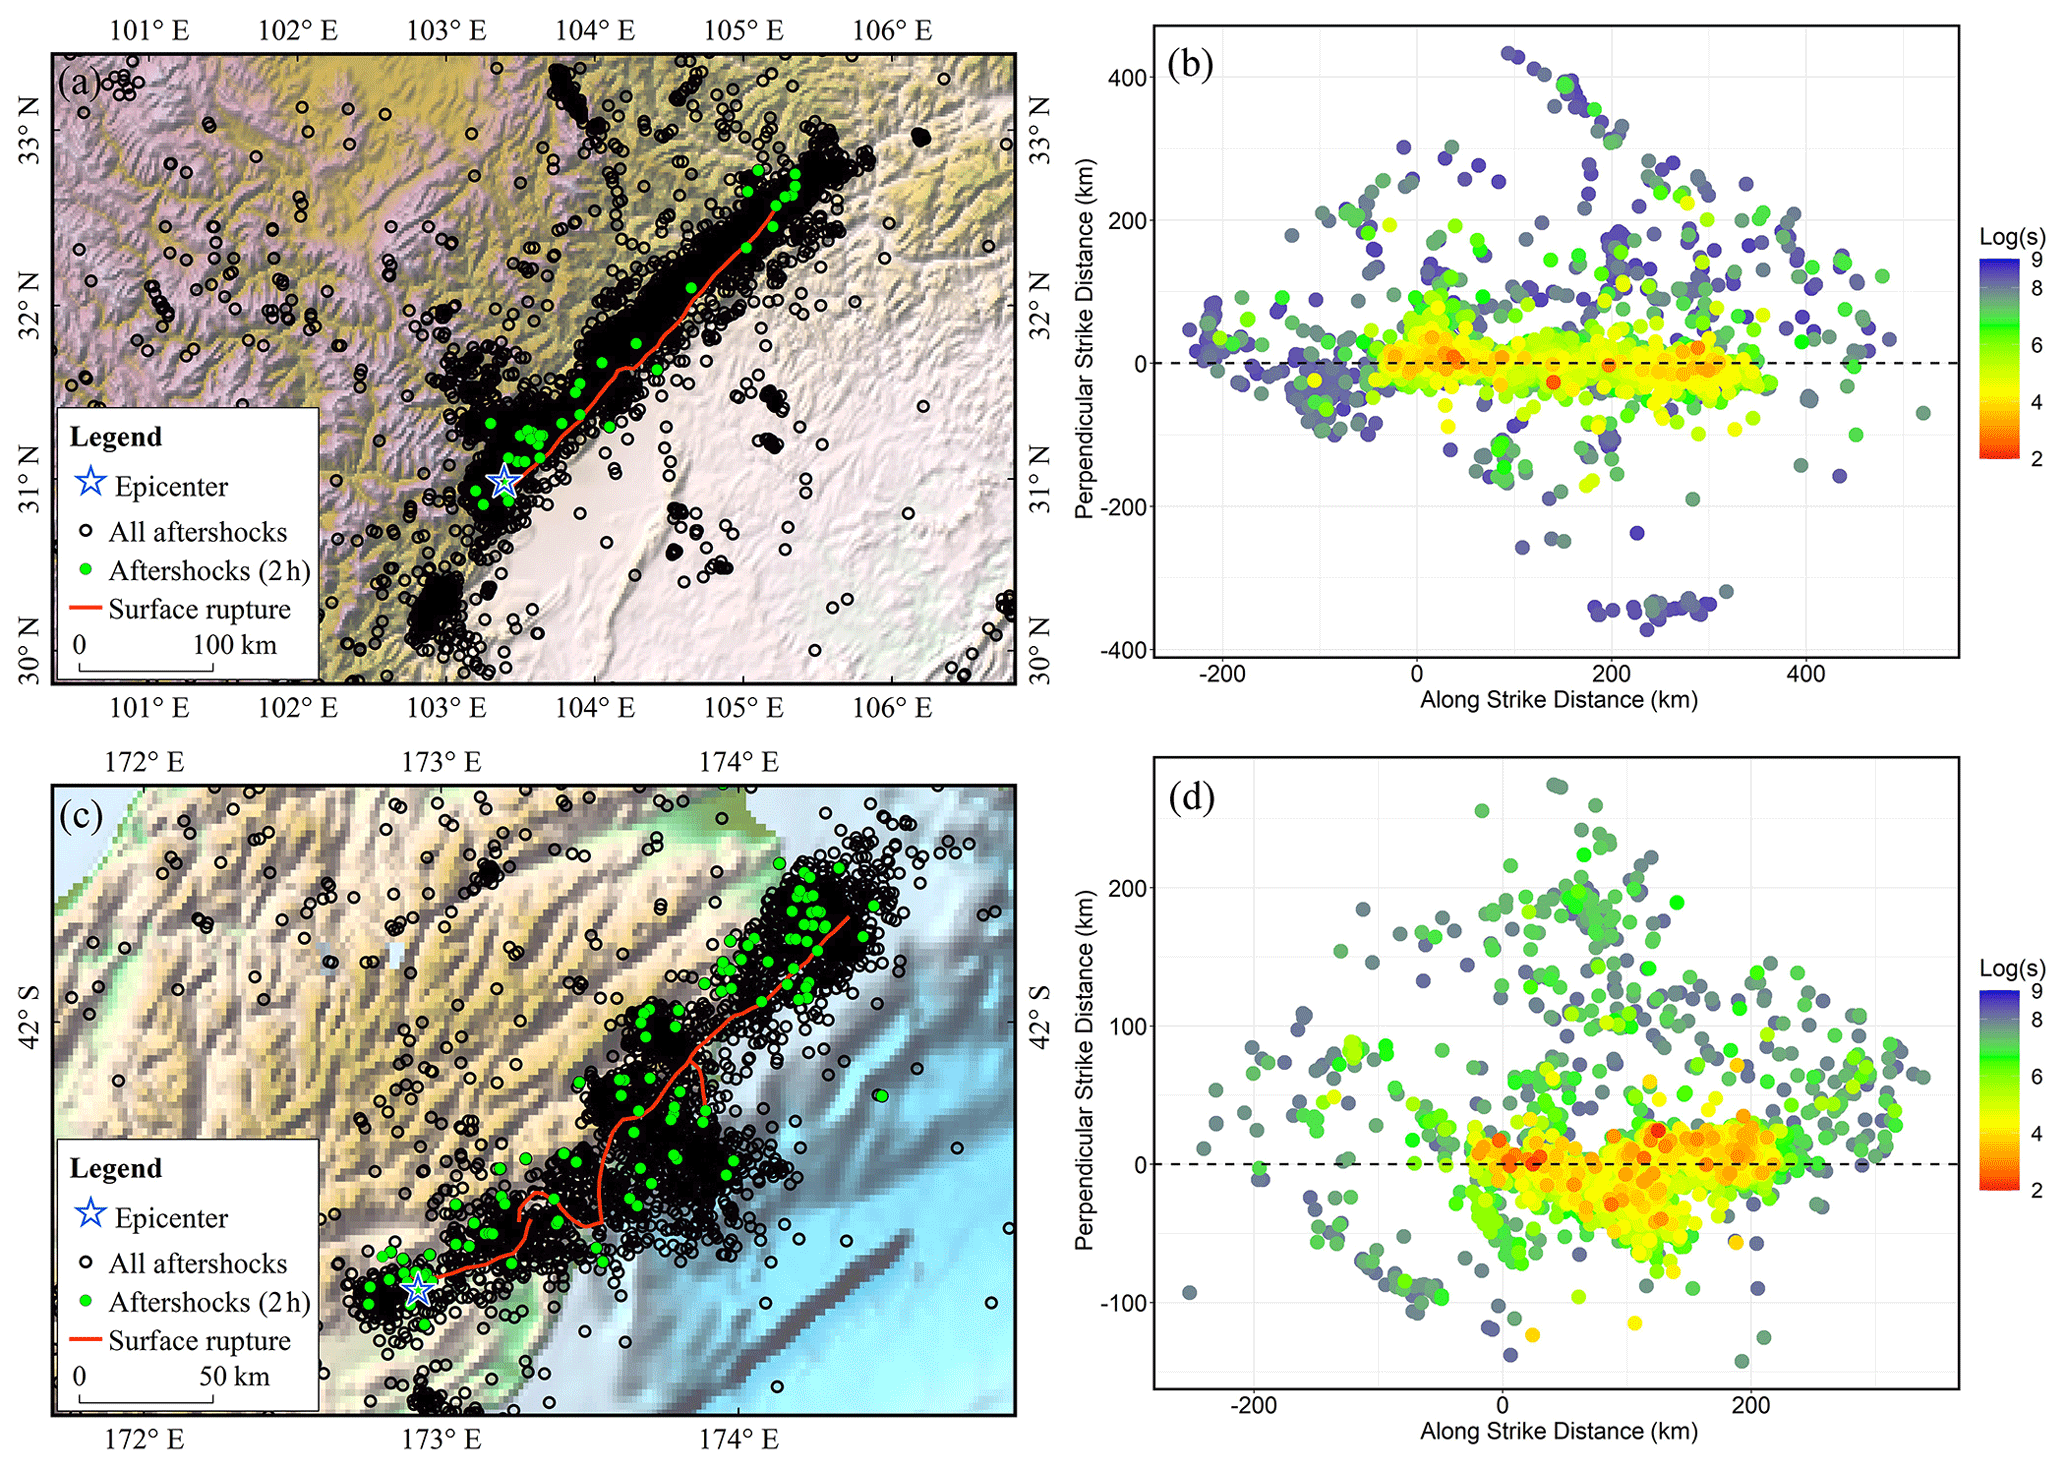
Figure 3Spatiotemporal distribution of early aftershock sequences after the mainshock. (a, c) Spatial distribution of aftershocks of the 2008 Wenchuan Mw 7.9 and 2016 Kaikōura Mw 7.8 earthquakes. (b, d) Temporal distribution of aftershocks from the Wenchuan and Kaikōura earthquakes. The s in Log(s) denotes the time in seconds between the aftershock and mainshock.
Figure 2 shows the LOWESS-fitting results for aftershocks that occurred within 2 h of the 2008 Wenchuan Mw 7.9 and the 2016 Kaikōura Mw 7.8 earthquakes. The early aftershocks of these two events were distributed along the surface rupture zone and within a certain range on both sides of the zone, based on the spatiotemporal distribution of the aftershock sequences (Fig. 3). The early aftershocks of the Wenchuan earthquake occurred within 300 km of the epicenter and were concentrated along the main rupture direction, and those of the Kaikōura earthquake were distributed within 200 km of the epicenter and relatively dispersed along the main rupture strike, which was primarily caused by the complex fault system (Wallace et al., 2018). Early aftershocks in both cases ruptured in a single direction. Based on this, we believe that the fitting results in Fig. 2 can depict the length and direction of the earthquake rupture.
2.2.3 SM99
Si and Midorikawa (1999) obtained the GMPE, which we call SM99, by fitting 21 records of strong shocks that occurred in Japan between 1968 and 1997. This equation exploits the shortest fault distances and calculates ground motion using the geometry of the imaged faults, has been validated by historical examples and actual seismic emergencies, and has been found to be applicable in western China in addition to Japan (Kamigaichi et al., 2009; Si et al., 2010; Zhao et al., 2022a). A rapid seismic intensity assessment has been accomplished using fault data or back-projection techniques based on this GMPE, providing a powerful guarantee for earthquake emergency response (Zhang et al., 2021; Chen et al., 2022b). In this method, the accurate inversion of the source rupture process and selection of GMPEs with good applicability remain the focus of research. We calculated the ground motion value by substituting the fault data with the LOWESS result of aftershock sequences obtained within 2 h of the mainshocks. The GMPE is not modified, and the equations can be referred to in the relevant literature (Si and Midorikawa, 1999; Chen et al., 2022).
As previously mentioned, the improved method consists of three essential components: aftershocks, LOWESS and SM99. It rapidly assesses the seismic intensity using two main steps: fitting the trend of spatial distribution of aftershocks using LOWESS and then calculating the ground motion utilizing SM99. We named the method AL-SM99.
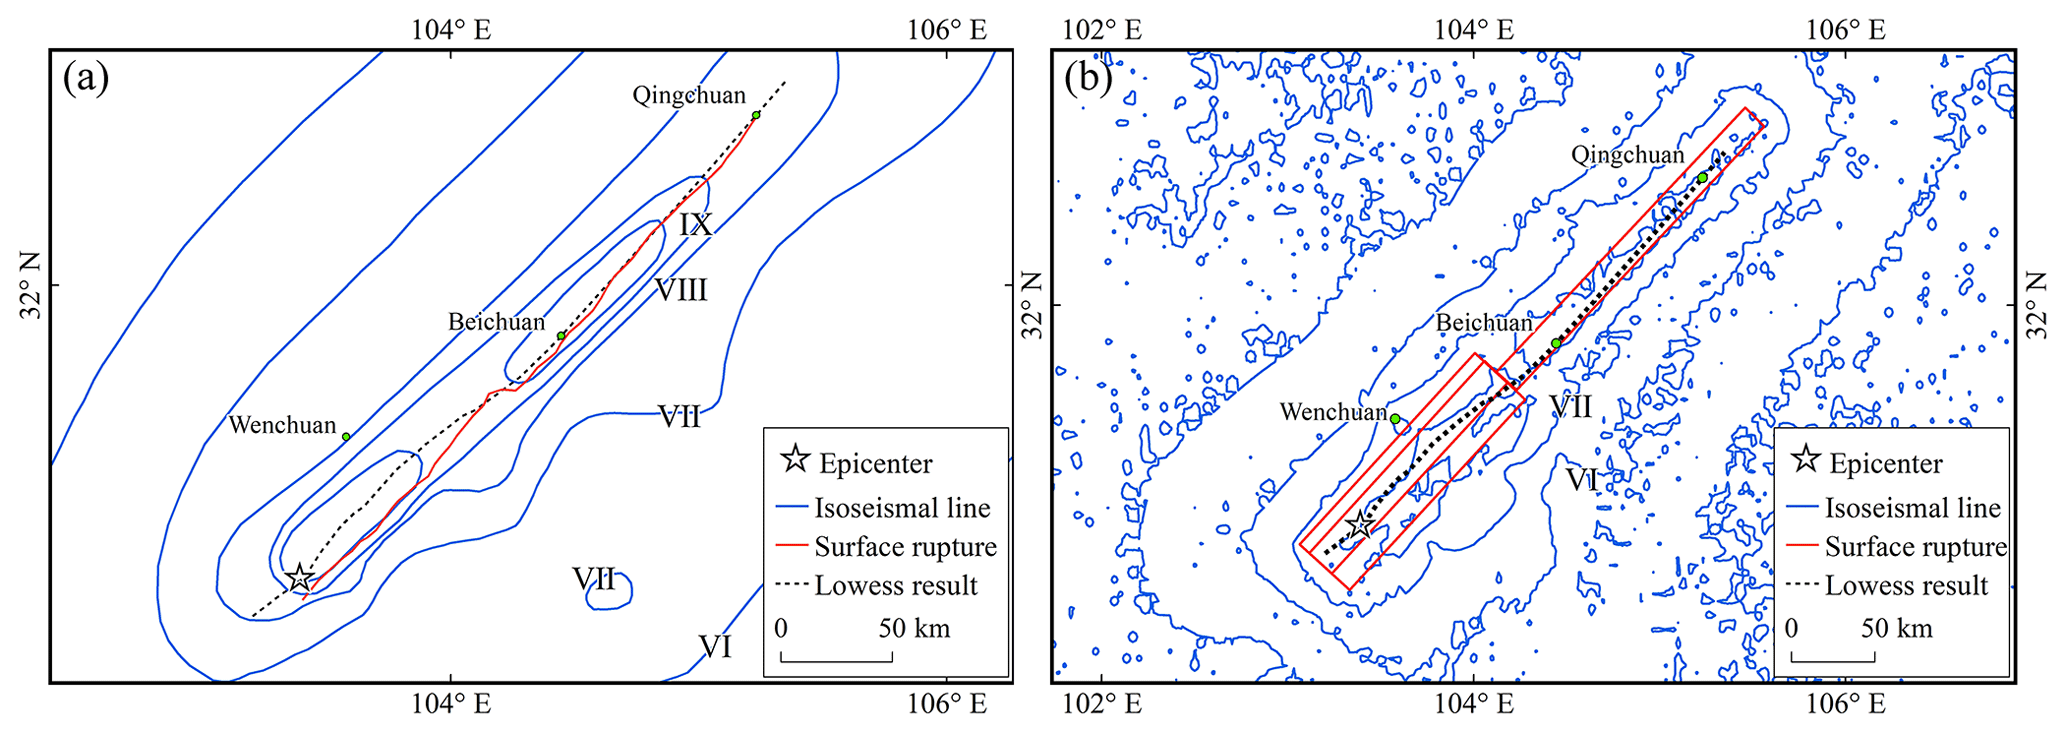
Figure 4Spatial distribution of the 2008 Wenchuan Mw 7.9 earthquake aftershocks fitted using LOWESS. Comparison with (a) actual surface rupture and (b) ShakeMap fault planes.
3.1 AL-SM99 application results
3.1.1 The 2008 Wenchuan Mw 7.9 earthquake in China
The 2008 Wenchuan Mw 7.9 earthquake was one of the most devastating seismic events in China in recent years (Chen et al., 2018). AL-SM99 was used to calculate the peak ground velocity (PGV) and site-corrected PGV values (we called PGVvs30) for this earthquake. The ground motion value was then converted to seismic intensity using CSI and the ground motion–intensity conversion equation (GMICE; Worden et al., 2012, 2020), respectively.
The curve obtained by LOWESS smoothing for the aftershocks that occurred within 2 h of the mainshock exhibited reasonable agreement with the length and direction of the actual surface rupture, particularly from Beichuan to Qingchuan, where it almost coincided with the actual surface rupture and lay entirely within the ShakeMap-published planar distribution of faults (Fig. 4). The seismic intensities evaluated from the raw aftershock data, whose geographical coordinates were directly utilized in the SM99 calculation, can roughly infer the extent of the hardest-hit area, and the intensity zone boundaries in the direction of the causative fault were found to agree with both the CEA and ShakeMap intensity maps. The spatial dispersion of aftershocks results in an excessively broad assessment range of intensity VIII when compared to those of ShakeMap and CEA. This was particularly evident between Wenchuan and Beichuan, where intensity estimates were approximately one intensity level higher than those derived from ShakeMap. However, the boundaries between intensity regions were extremely consistent with those determined by ShakeMap (Fig. 5).
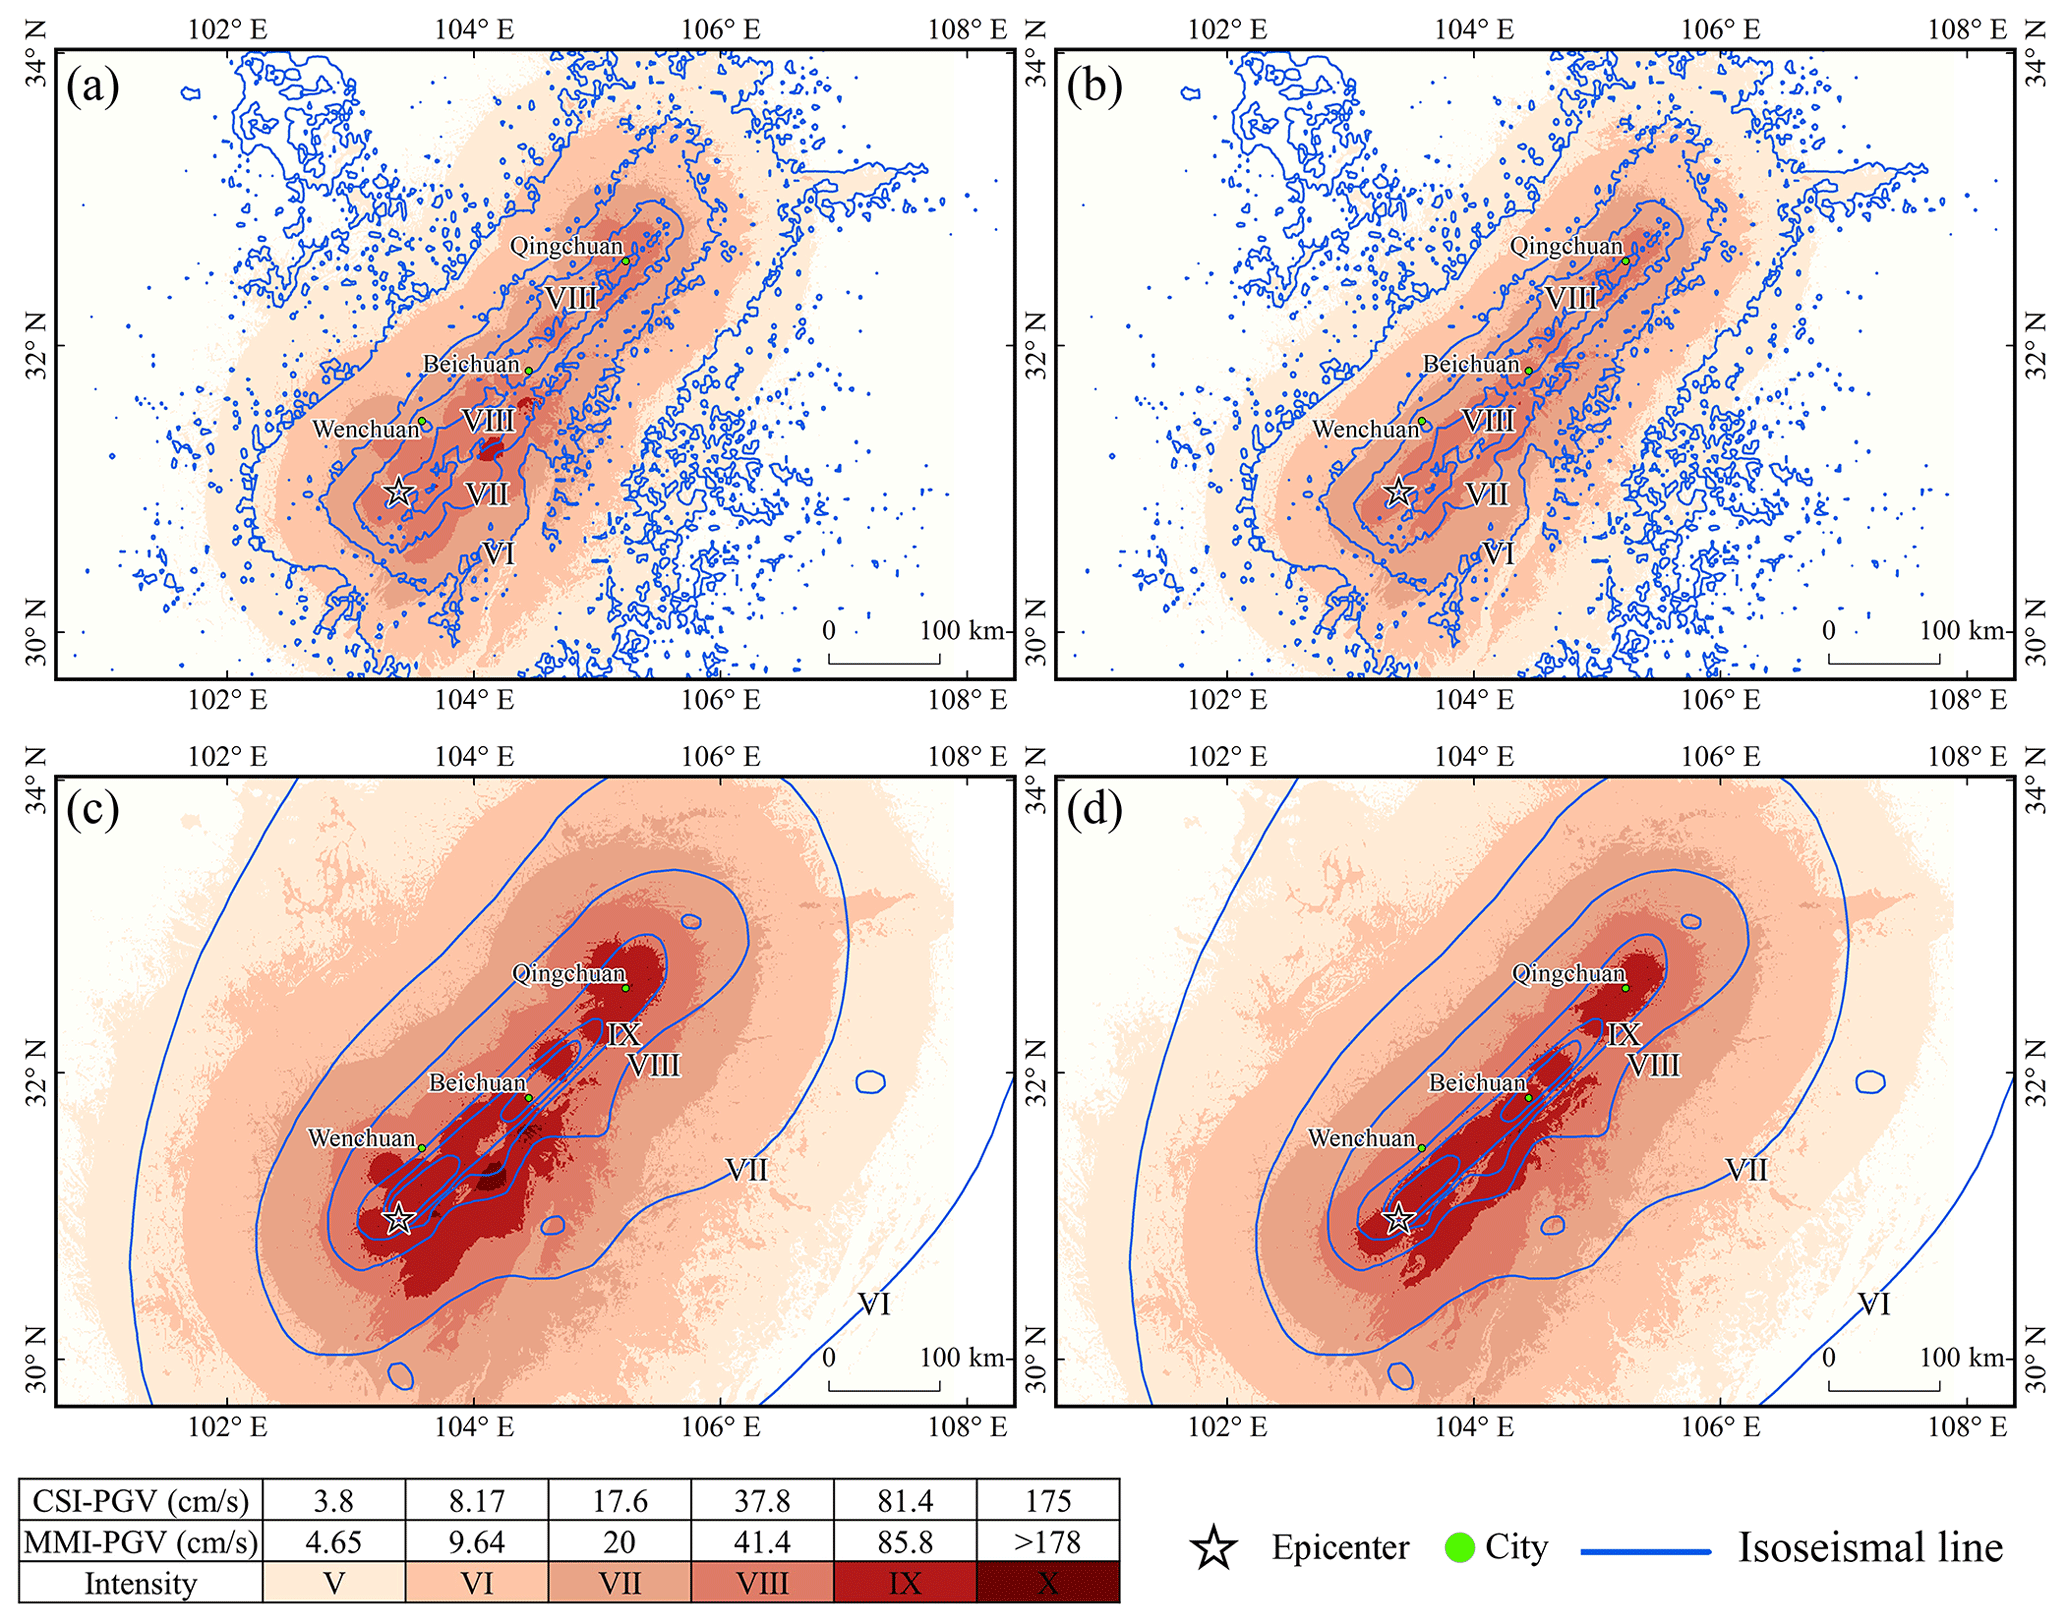
Figure 5Assessment of the 2008 Wenchuan Mw 7.9 earthquake intensity. Comparison of seismic intensities from (a) unprocessed aftershocks and (b) LOWESS results with those obtained from ShakeMap. Comparison of intensities from (c) unprocessed aftershocks and (d) LOWESS results with macro-earthquake intensities obtained from the CEA. The MMI–PGV values in the legend match the values in the ShakeMap instrumental-intensity-scale legend (Worden et al., 2020).
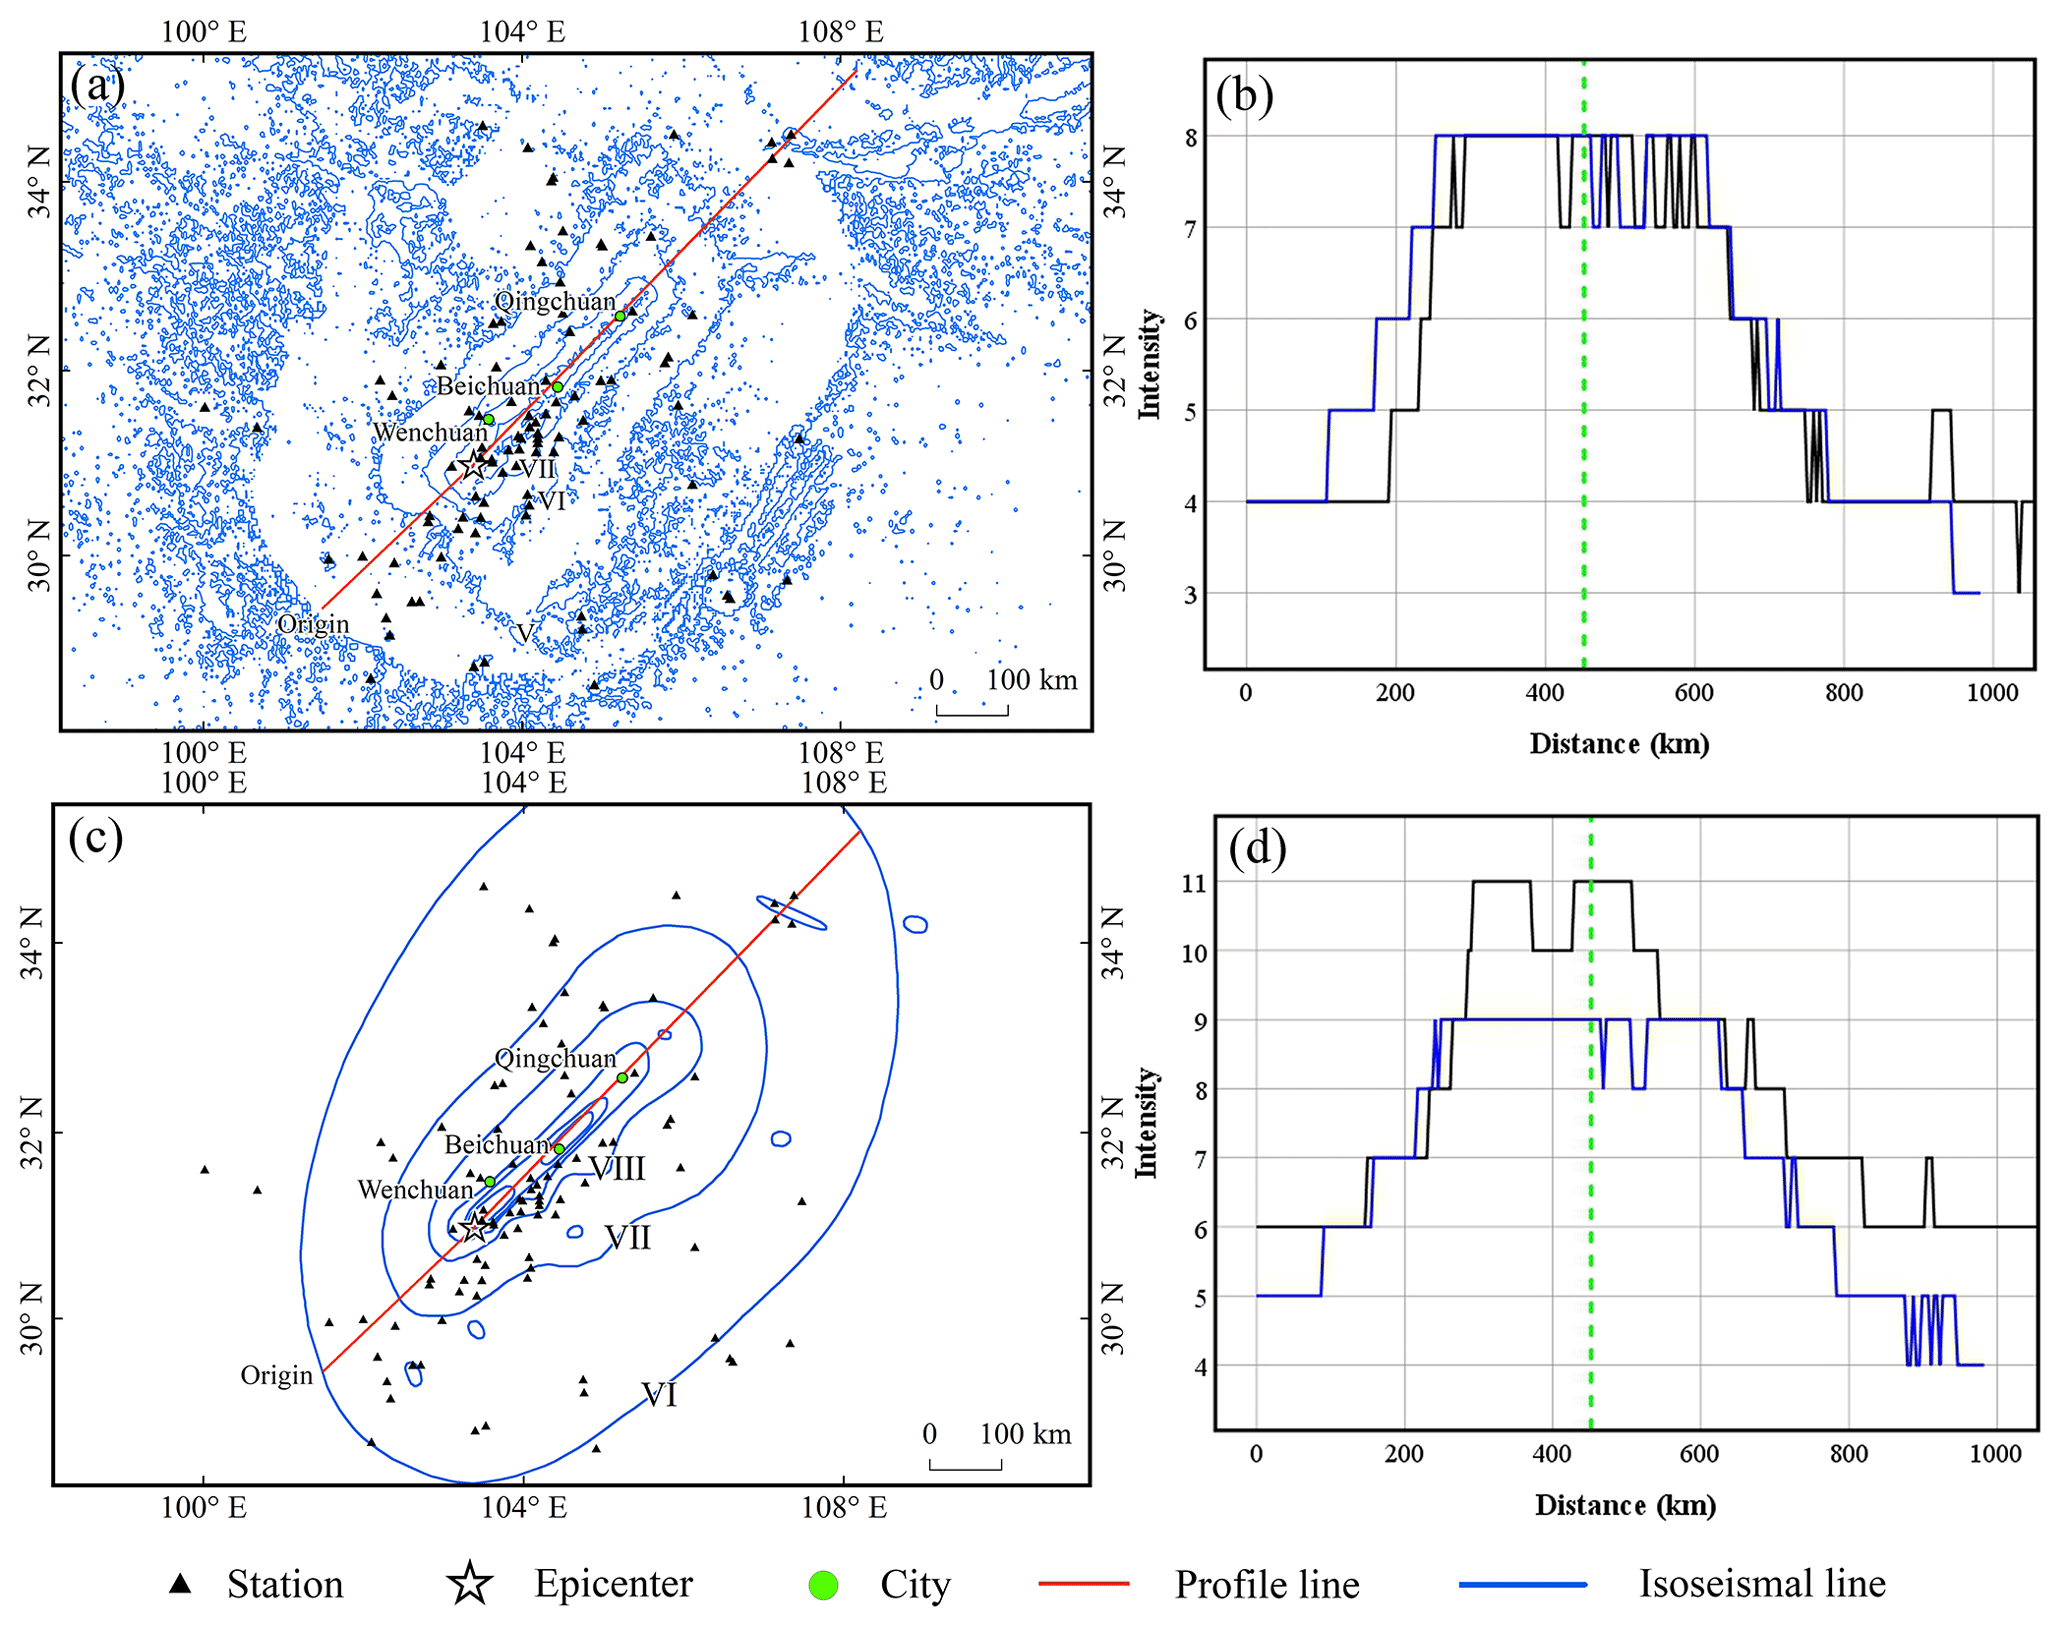
Figure 6Profiles of seismic intensity assessed using LOWESS results. Profiles are drawn along the red lines in panels (a) and (c). (b) Comparison with profiles of seismic intensities obtained from ShakeMap and (d) comparison with profiles of seismic intensities obtained from the CEA. The dashed green line in the profile line is the location of Beichuan, the blue profile line represents the seismic intensity from this study and the black line represents those from ShakeMap or CEA.
Figure 6 shows the profiles of different seismic intensity assessments. The maximum MMI values based on the PGVvs30 assessment are consistent with the ShakeMap results, with a significant match in the range of intensity zones from Beichuan to Qingchuan. The highest intensity assessed on the CSI scale was X, which was one intensity level less than the published macro intensity value from the CEA. Both results have roughly the same amount of intensity in the IX region, and macroseismic intensities X–XI are also situated within this range. In addition, the intensity assessment results from Beichuan to Qingchuan were approximately one intensity level lower than the CEA results. However, the boundary locations of the various intensity regions are remarkably similar. For example, the boundaries of intensity regions VII and VI determined by our method roughly overlapped those of intensity regions VIII and VII determined by the CEA, respectively. As previously mentioned, it is difficult for people to accurately assess the effects of VII and higher intensities based solely on perception. That is, the ground motion values calculated using GMPE are instrumental intensities, reflecting a high level of strong shaking and unaffected by factors such as population and buildings (Worden et al., 2020). Therefore, we consider this result to be normal. The AL-SM99 result was highly consistent with published intensity ranges from the CEA for the southwestern region of Beichuan.
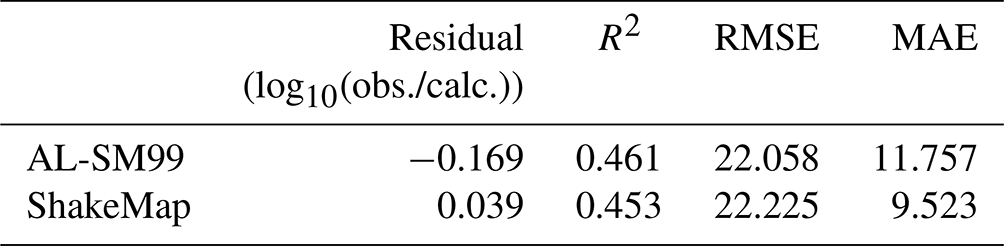
Table 2 demonstrates that the PGVvs30 values calculated by AL-SM99 were remarkably similar to those calculated by ShakeMap. Notably, ShakeMap considers station records of high quality when calculating ground motion, whereas the results of this study were not corrected using station data. The hardest-hit areas assessed by the LOWESS-smoothed data were more convergent and had a clearer extent compared to the unprocessed aftershock sequences, and the length along the causative fault direction was not significantly altered. This demonstrates the potential of AL-SM99 for applications where the fault system in the seismogenic region is straightforward and the rupture scale of the source is evident. Aftershocks recorded in the first 2 h following an earthquake can be used to portray more accurate information concerning the rupture direction and length using the LOWESS curves. The assessment results are crucial in identifying disaster regions and prioritizing the deployment of rescue forces.
Table 2Effect of AL-SM99 in predicting the PGV of the Wenchuan earthquake within the assessment region for ShakeMap intensity greater than or equal to V.
3.1.2 The 2016 Kaikōura Mw 7.8 earthquake in New Zealand
On 13 November 2016, a Mw 7.8 earthquake struck the Kaikōura region of New Zealand. It ruptured on the surface of approximately 20 faults and exhibited a highly complex form that exceeded the traditional perception of multi-fault ruptures (Litchfield et al., 2018; Wallace et al., 2018). The relocated aftershock sequence of this earthquake was almost entirely concentrated in the shallow crust of the upper plate, and few aftershocks occurred at the subduction interface (Lanza et al., 2019).
Fitting the aftershock sequence obtained within 2 h of the mainshock yielded a southwest–northeast curve (Fig. 7), which was consistent with the overall directional distribution of the surface rupture (Kaiser et al., 2017). The length of the curve was slightly longer than the actual surface rupture, and during the early post-earthquake period, the basic pattern of surface rupture could be tentatively determined. The GMICE was used to convert the predicted PGVvs30 values to MMI and generate intensity assessment maps (Fig. 8). Although no outliers were identified during the pre-processing phase, the range of assessed earthquake intensities based on the raw aftershock sequence was excessively broad. Nearly the entire estimated area of intensity VIII falls within the range of ShakeMap intensity VII. In addition, individual aftershocks were spatially dispersed but were not deemed to be outliers, resulting in zones of anomalous intensity (Fig. 8a). This outcome impedes the accurate determination of areas with varying degrees of damage. Figure 8b exhibits the seismic intensity as assessed by AL-SM99. The AL-SM99 results effectively constrain the size of each intensity region. Along both sides of the rupture, the extent of each intensity region is nearly identical to that from ShakeMap. This method effectively mitigates the effects of aftershock anomalies that are not identified during the pre-processing phase. Owing to the influence of aftershocks distributed at the far reaches of the fault, the fitted LOWESS curve is slightly longer than the actual rupture, resulting in the assessed intensity range being slightly longer along the fault strike. However, the overall assessment outcome is acceptable. Although it is impossible to precisely depict the rupture of a complex fault system, we were still able to determine the extent of the affected region within a few hours of the earthquake based on the results of a good fit to the overall strike and length of the fault rupture.
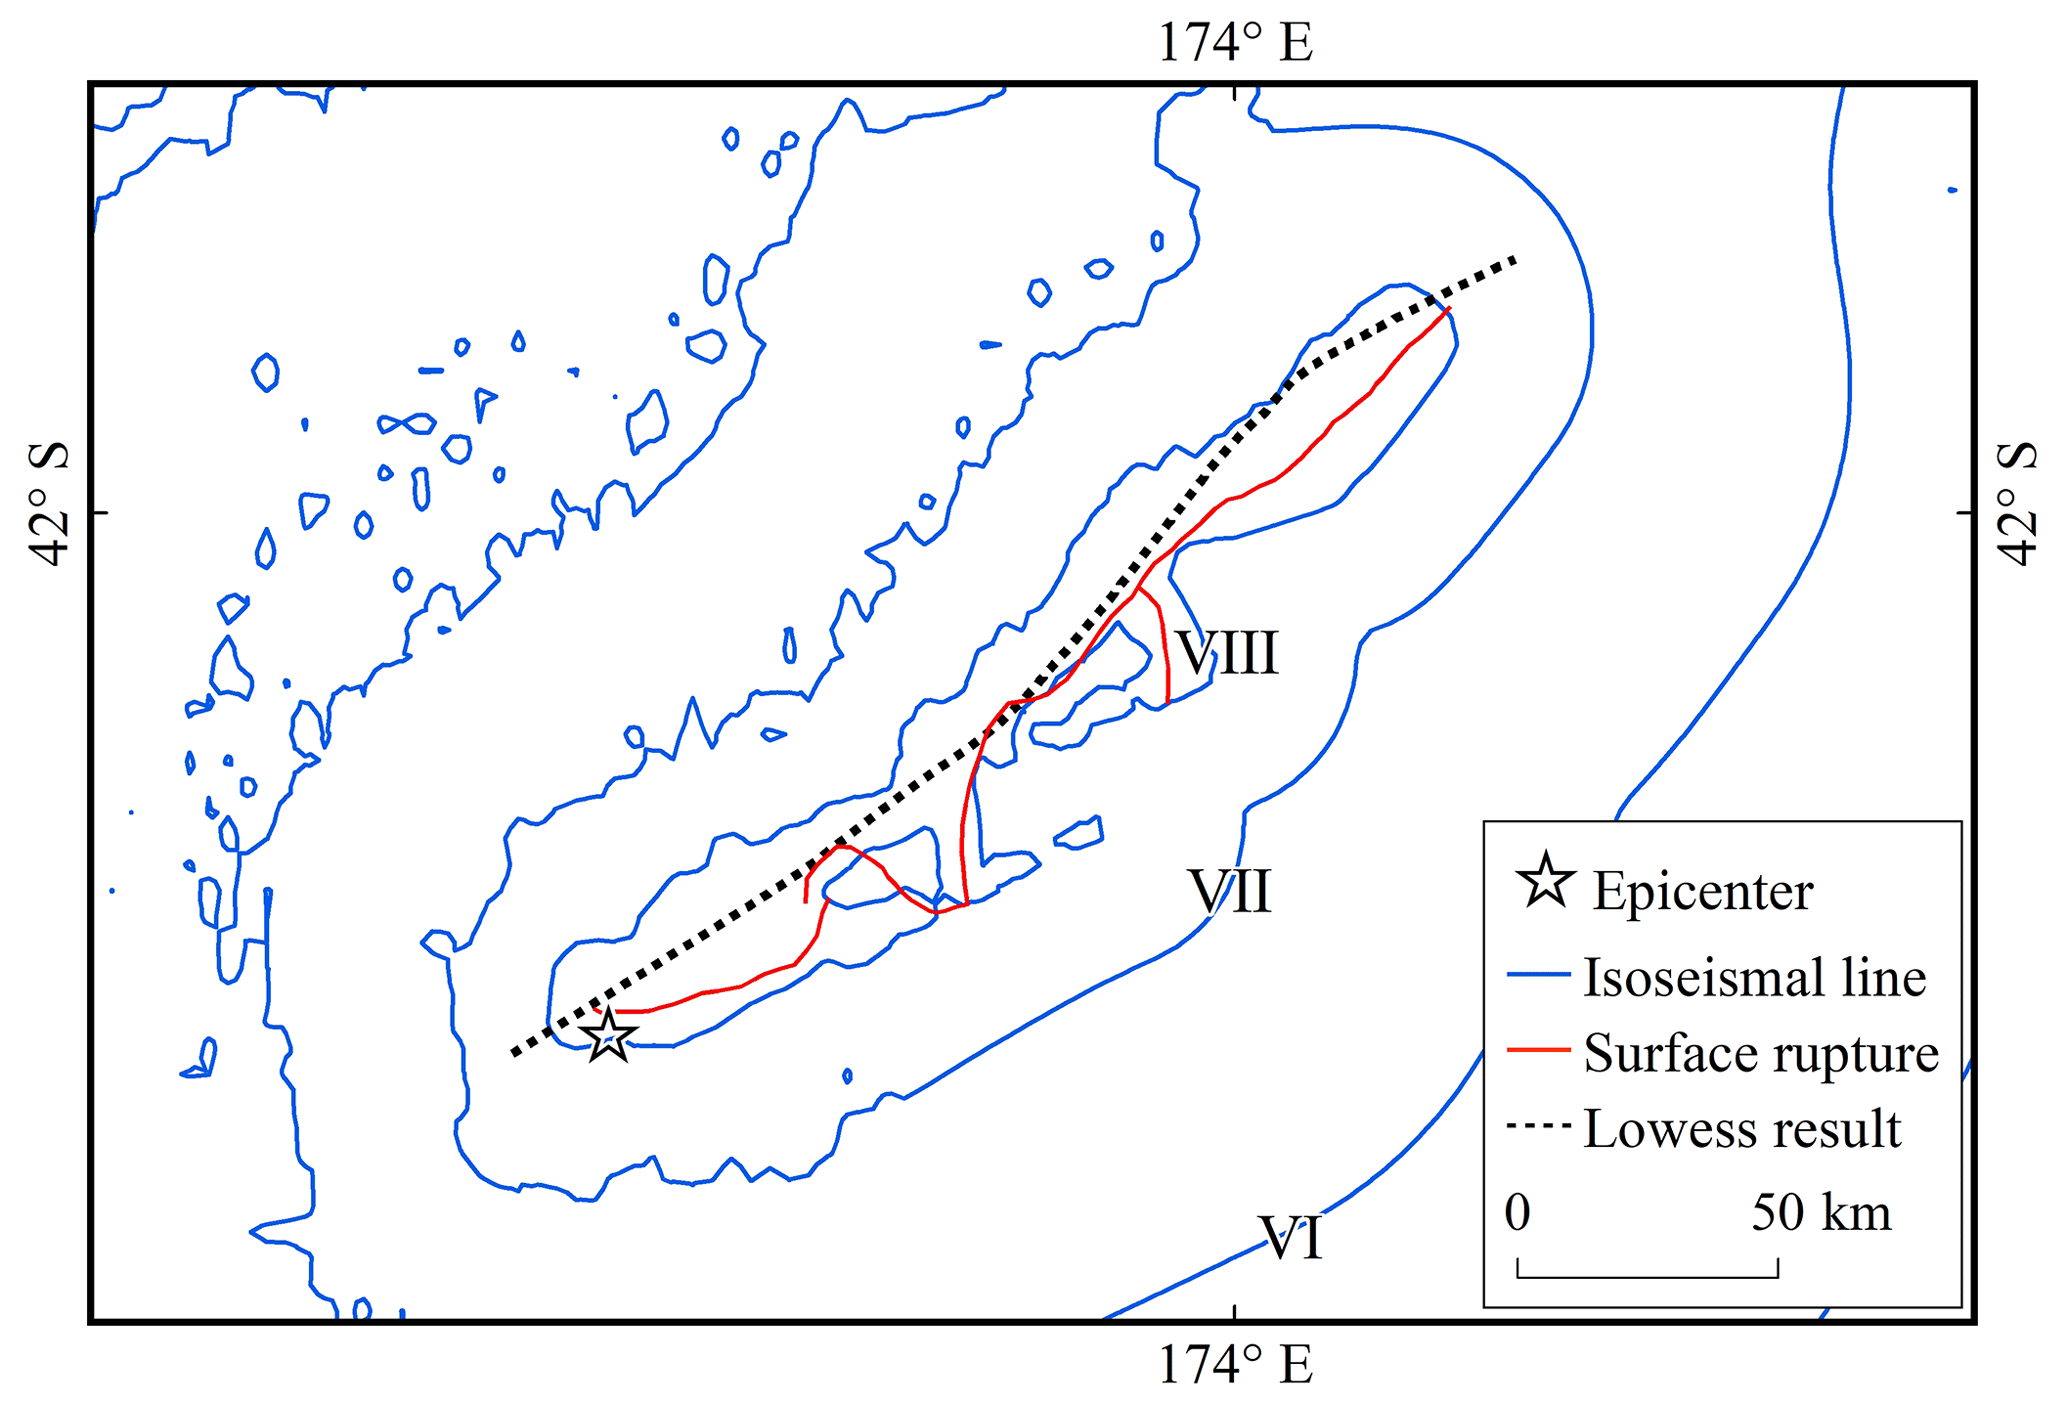
Figure 7Comparison between the LOWESS-fitting curve and actual surface rupture of the 2016 Kaikōura Mw 7.8 earthquake.
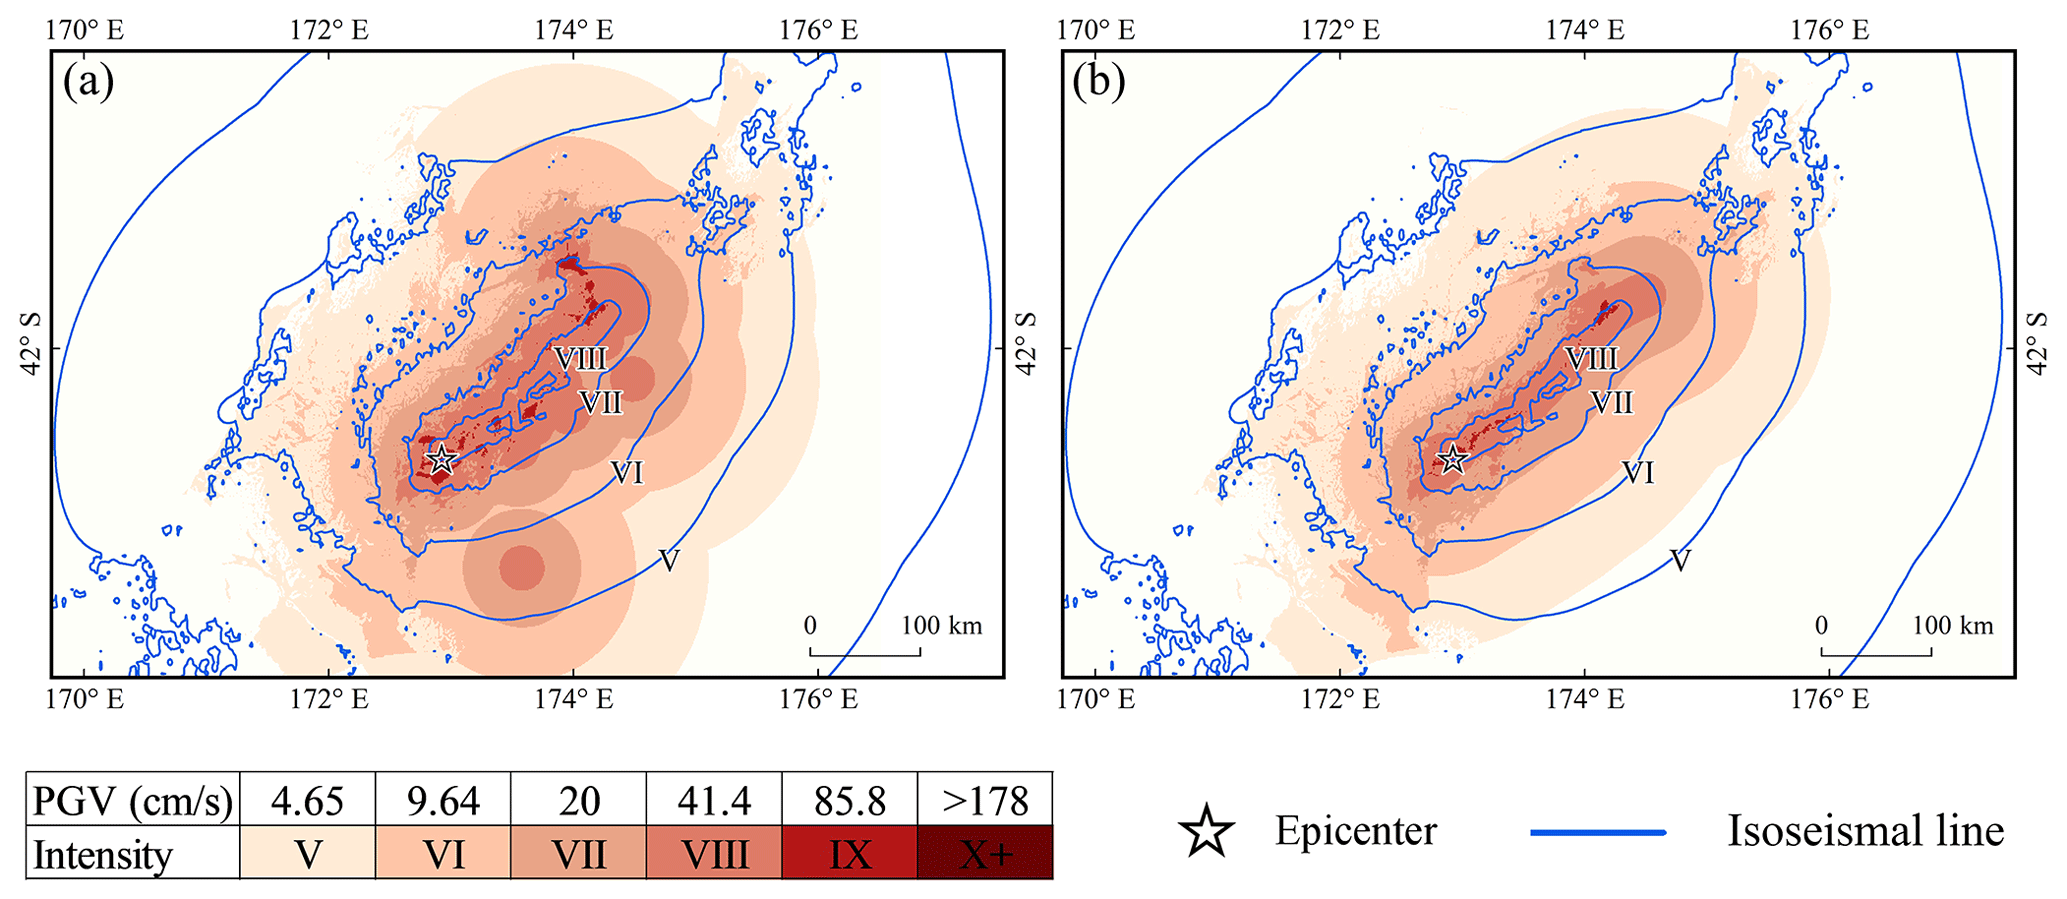
Figure 8Intensity assessment of the 2016 Kaikōura Mw 7.8 earthquake using (a) pre-processed aftershocks and (b) LOWESS results.
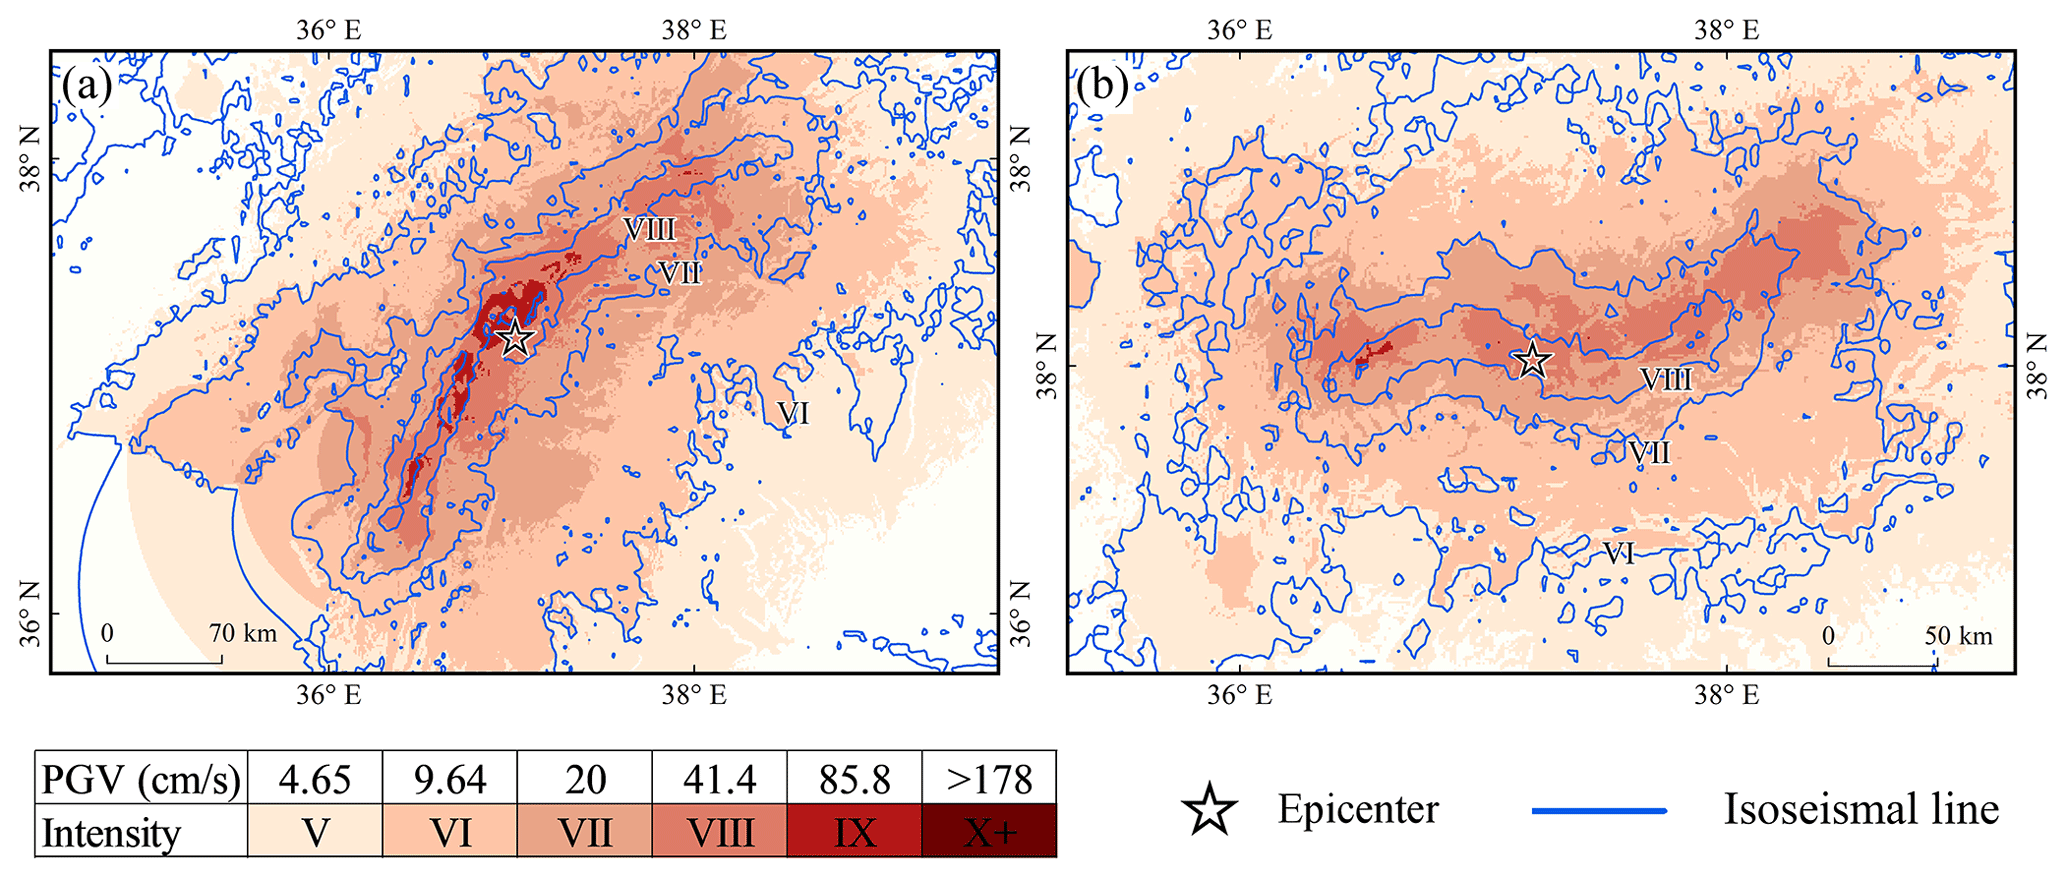
Figure 9Seismic intensity assessment results of the (a) 2023 Pazarcık (Kahramanmaraş) Mw 7.8 earthquake and (b) 2023 Elbistan (Kahramanmaraş) Mw 7.5 earthquake. The isoseismal lines used for comparison are the outcomes of an evaluation of ShakeMap versions 15 and 9, respectively.
3.1.3 AL-SM99 latest application cases
According to the USGS report, Mw 7.8 and Mw 7.5 earthquakes struck on 6 February 2023 in the Kahramanmaraş region of Türkiye. The death toll had reached 52 700 people in Türkiye and Syria as of 5 March 2023, and it caused an estimated USD 89.2 billion in property damage in both countries, making it the deadliest natural disaster in modern Turkish history (Wikipedia, 2023). The causative fault for the Mw 7.8 earthquake is located along the N60 striking East Anatolian Fault and continues toward the Dead Sea Fault and the N25 striking Karasu Fault; the causative fault for the Mw 7.5 earthquake is located north of the previous one, along the N100 striking Sürgü-Çartak Fault (Provost et al., 2023). We conducted an intensity assessment immediately following the earthquake by collecting aftershock sequences from the Regional Earthquake-Tsunami Monitoring Center (http://www.koeri.boun.edu.tr/sismo/2/tr/, last access: 3 September 2023) within 2 h of both earthquakes, assessing the intensity of both earthquakes using AL-SM99 (Fig. 9). The intensity assessments of both events were consistent with the ShakeMap intensity maxima at level IX. The results of the LOWESS fit to the aftershock sequence revealed a bilateral rupture pattern for both earthquakes, providing a reference for examining the rupture of the source using physical inversion. In particular, the seismic intensity of the Mw 7.8 earthquake estimated using the LOWESS results is highly consistent with that estimated using the inverse projection results (Chen et al., 2023). The extent of the affected region as determined by AL-SM99 is nearly identical to that of the recently updated intensity version of ShakeMap, accurately identifying a portion of the intensity anomalies. The shape of the intensity VIII–IX region reflects the shape characteristics of the two causative faults; however, the intensity of the Mw 7.5 earthquake in the northwest is overestimated. Owing to the close proximity of the two earthquakes, we speculate that the fault and secondary faults in the region were activated by the superposition of the two earthquakes and produced more aftershocks, which were included in the intensity assessment of the second earthquake and were not judged as outliers, resulting in an overestimation of the intensity. In general, however, the intensity assessment results of the two earthquakes can provide reasonable early estimates of the extent of the disaster area, and the output of fine ground motion grid data can provide support for estimating casualties, property damage, etc. The application of AL-SM99 to these two earthquakes further demonstrates the applicability and dependability of the results.
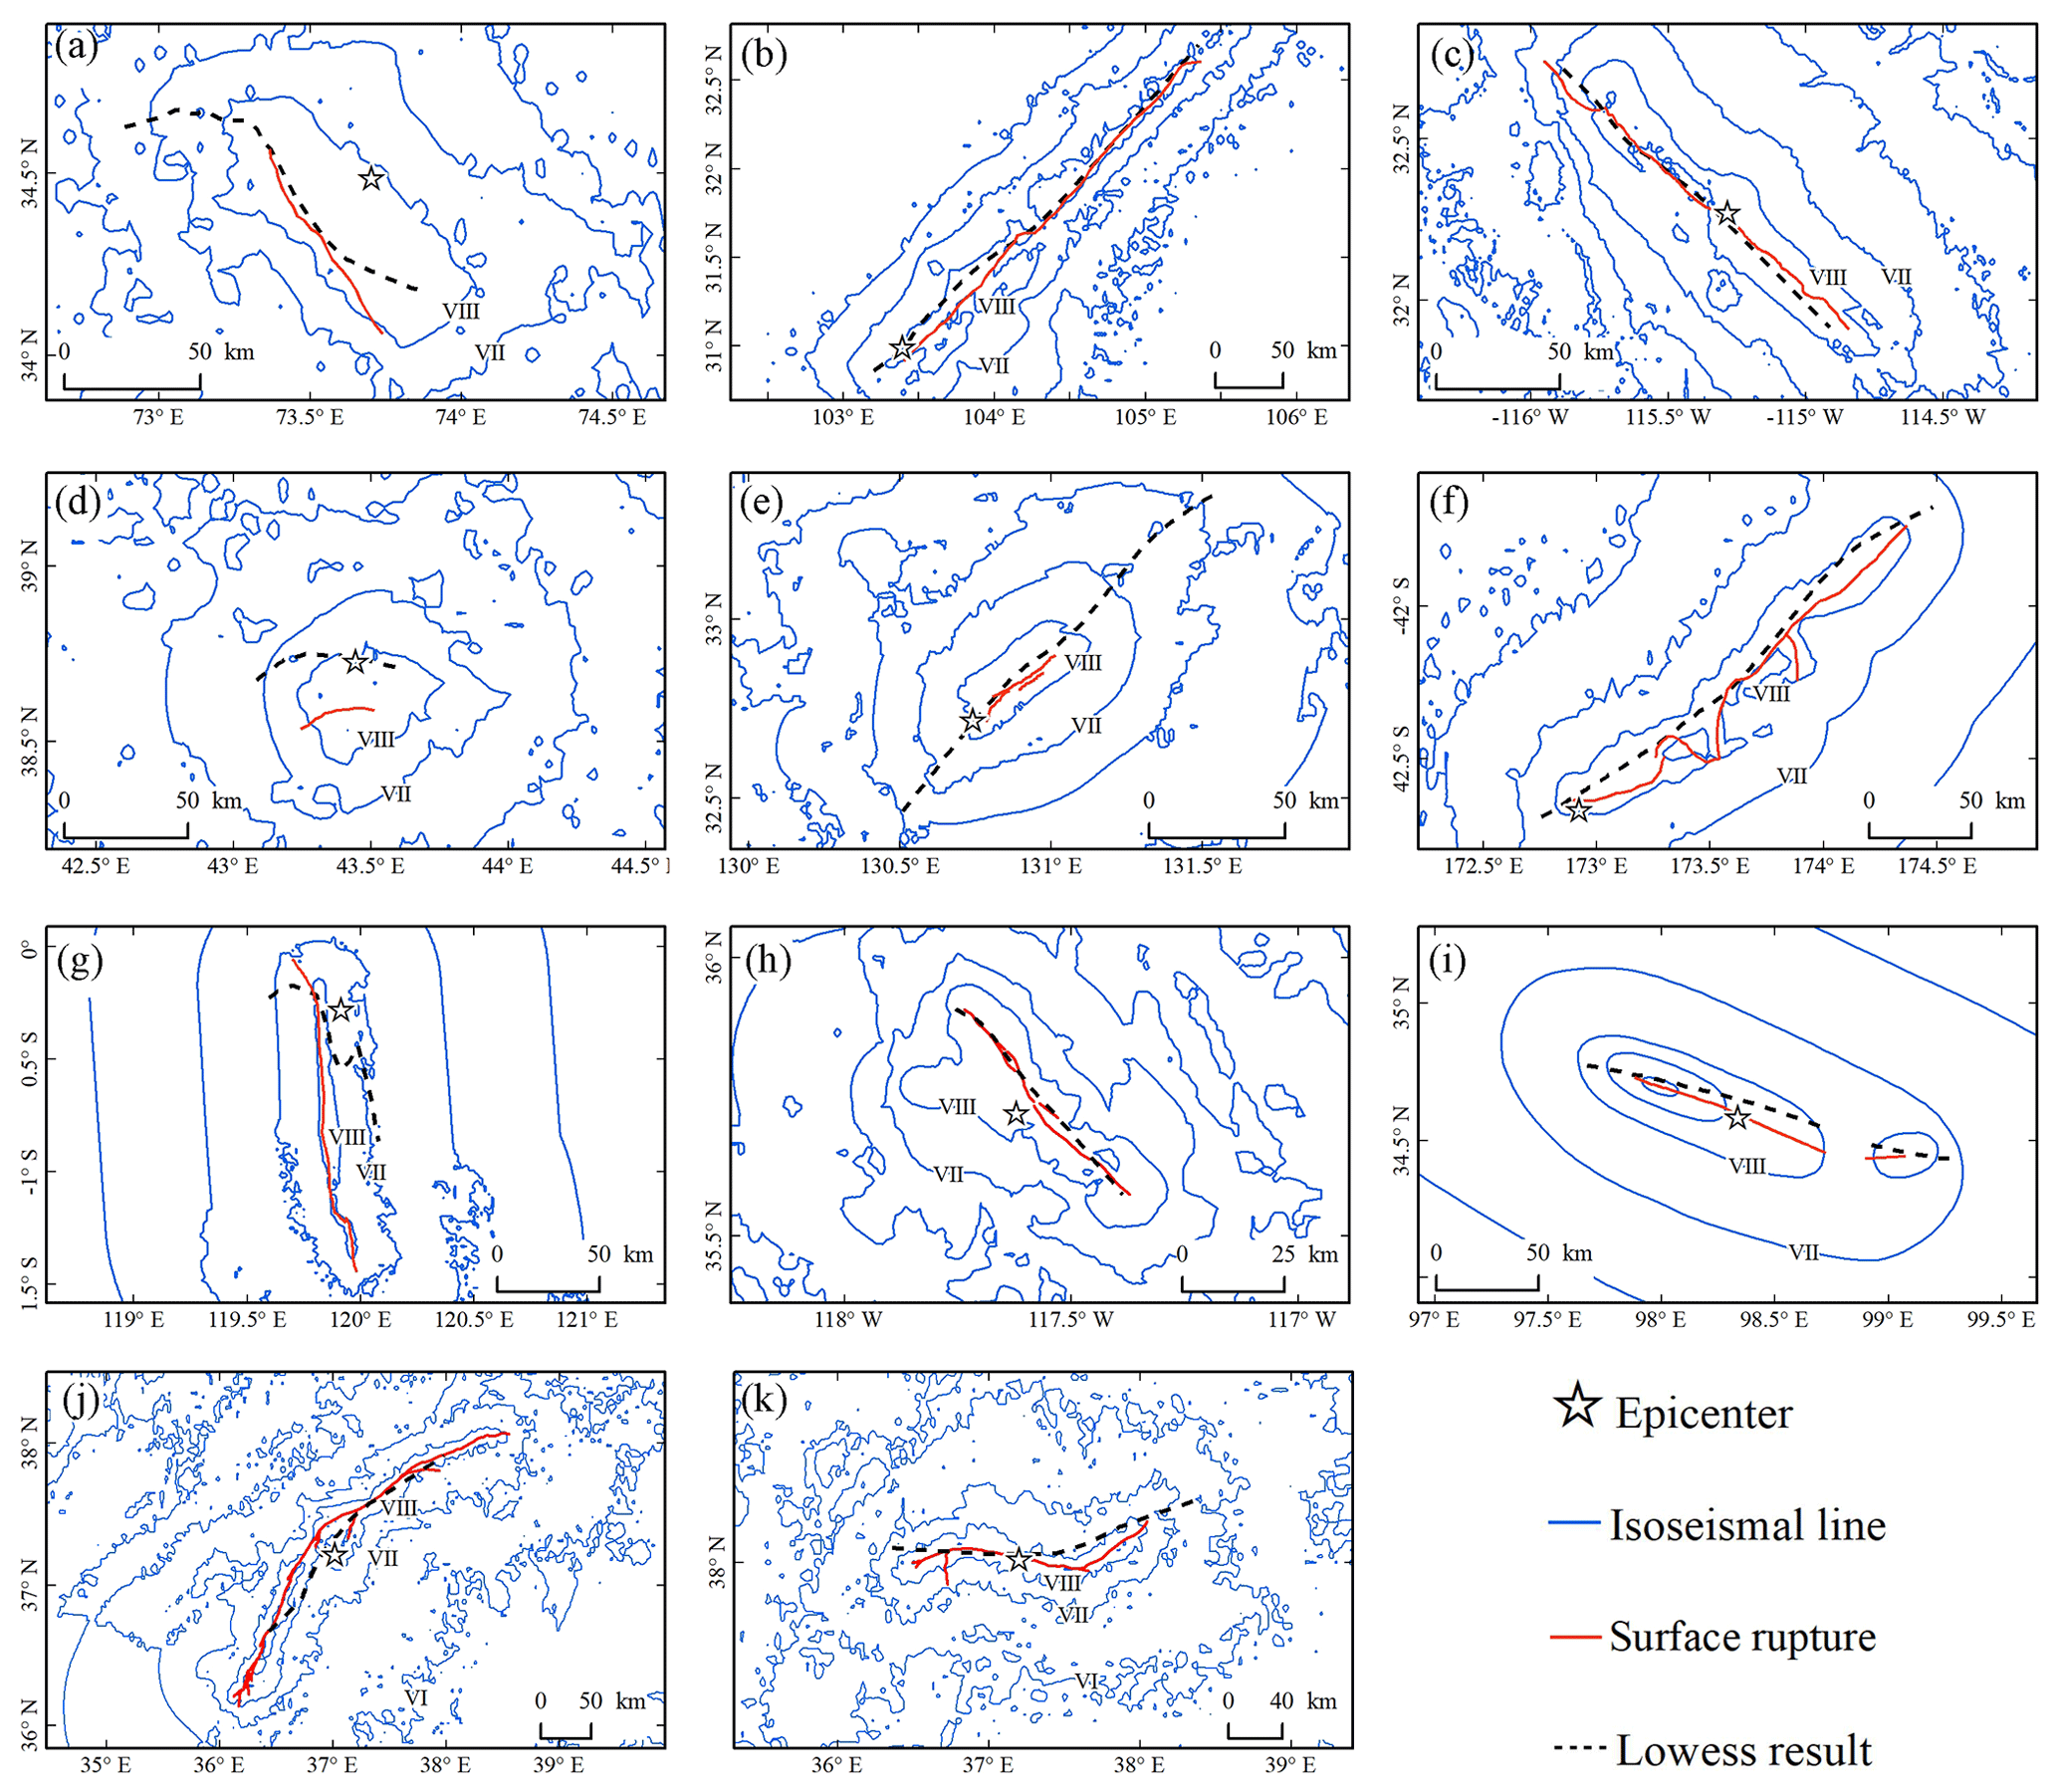
Figure 10Comparison of LOWESS-fitted curves with actual surface rupture for the (a) 2005 Kashmir Mw 7.6, (b) 2008 Wenchuan Mw 7.9, (c) 2010 Baja California Mw 7.2, (d) 2011 Van Mw 7.1, (e) 2016 Kumamoto Mw 7.0, (f) 2016 Kaikōura Mw 7.8, (g) 2018 Palu Mw 7.5, (h) 2019 Ridgecrest Mw 7.1, (i) 2021 Maduo Mw 7.3, (j) 2023 Pazarcık Mw 7.8 and (k) 2023 Elbistan Mw 7.5 earthquakes. Fault rupture traces were extracted from relevant literature or downloaded from ShakeMap and then digitized in ArcGIS (Kaneda et al., 2008; Li et al., 2008; Fletcher et al., 2014; Liu et al., 2015; Toda et al., 2016; Shi et al., 2019; Zhang et al., 2021; Reitman et al., 2023).
Table 3Comparison of LOWESS-fit results for 11 earthquakes with actual surface rupture and results from the Wells empirical model. The fitting length and linear directional mean were measured using ArcGIS.
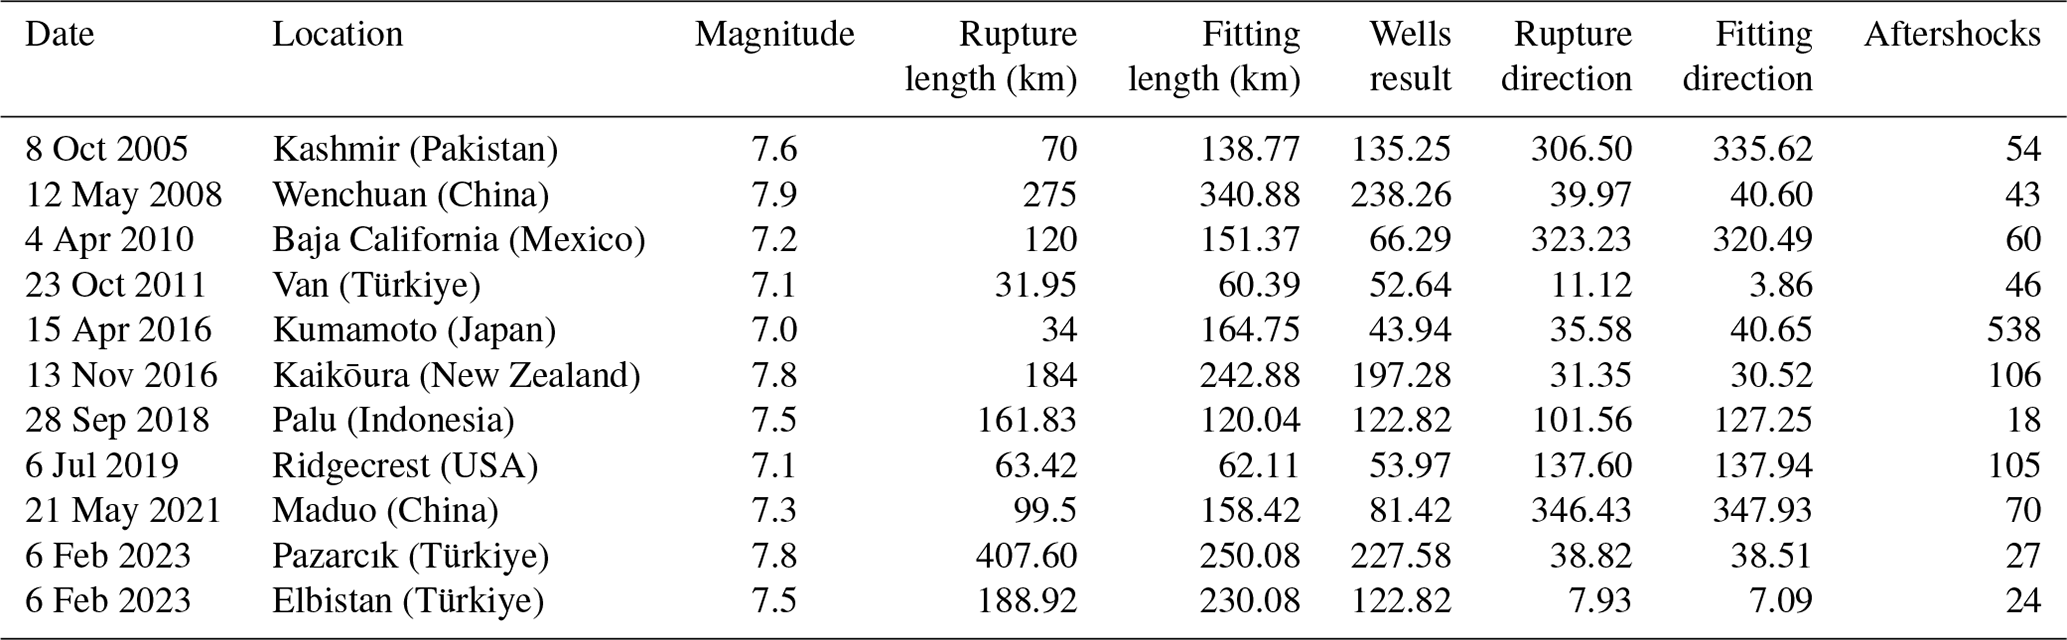
3.2 LOWESS-fit results and fault rupture
Shortly after the mainshock, the aftershock sequence could outline the fundamental characteristics of the mainshock rupture surface (Kisslinger, 1996). We focused on the length and direction of the fault rupture in this study. Figure 10 exhibits the spatial distribution of the rupture trajectories and LOWESS-fit curves. Table 3 compares the lengths and orientations of the fault rupture and fitted curves, and empirical rupture lengths are estimated using the Wells rupture formula (Wells and Coppersmith, 1994). The linear directional mean is a tool for measuring the direction or orientation of a set of lines; it determines the direction based solely on the starting and ending points of the lines (Mitchell, 2005). It was used in this study to determine the average orientation of the main rupture tracks.
In the Wenchuan, Baja California, Kaikōura, Ridgecrest, Maduo, Pazarcık and Elbistan earthquakes, the LOWESS-fitted curves matched the actual fault rupture well in terms of linear directional mean and could accurately depict the orientation of the main rupture. Overall, the length of the LOWESS-fitted curve is longer than the actual rupture. For certain earthquakes, the lengths of the fitted curves are closer to the lengths calculated by the empirical equations than to the actual ruptures. Because aftershocks are densely distributed at the tips of the fault (Hu et al., 2013), and the linear directional mean is only governed by the starting and ending points of the curve, the fitted curve has good similarity with the linear average direction of the actual rupture. The aftershocks that occurred at the tips of the fault exist at a certain distance from the causative fault (Ozawa and Ando, 2021), causing the fitted curve to be longer than the surface rupture.
The quality of the aftershock catalogue has a major impact on the fitting results. The data source used to pick the aftershock events, the aftershock event location method and the aftershock sequence selection method are all directly related to the spatial location of the aftershock sequence employed in AL-SM99, which further influences the length and direction of the fitted curve (Liao et al., 2021; Zhao et al., 2022b). To ensure the accuracy of the fitted curves and enhance the temporal efficiency of assessing seismic intensities, the number of aftershocks is important. Although we cannot currently provide an exact minimum standard for the number of aftershocks required for AL-SM99, it may be difficult to obtain significant results for fewer than 20 aftershocks, as in the case of the 2018 Palu earthquake. Moreover, the complexity of the fault system in the seismogenic region, such as its fractal dimension, has an effect on the outcomes (Nanjo and Nagahama, 2000; Baranov et al., 2022). When the fault strike near the mainshock is known to be relatively clear and the fault system is simple, LOWESS is a more appropriate method for analyzing aftershock events.
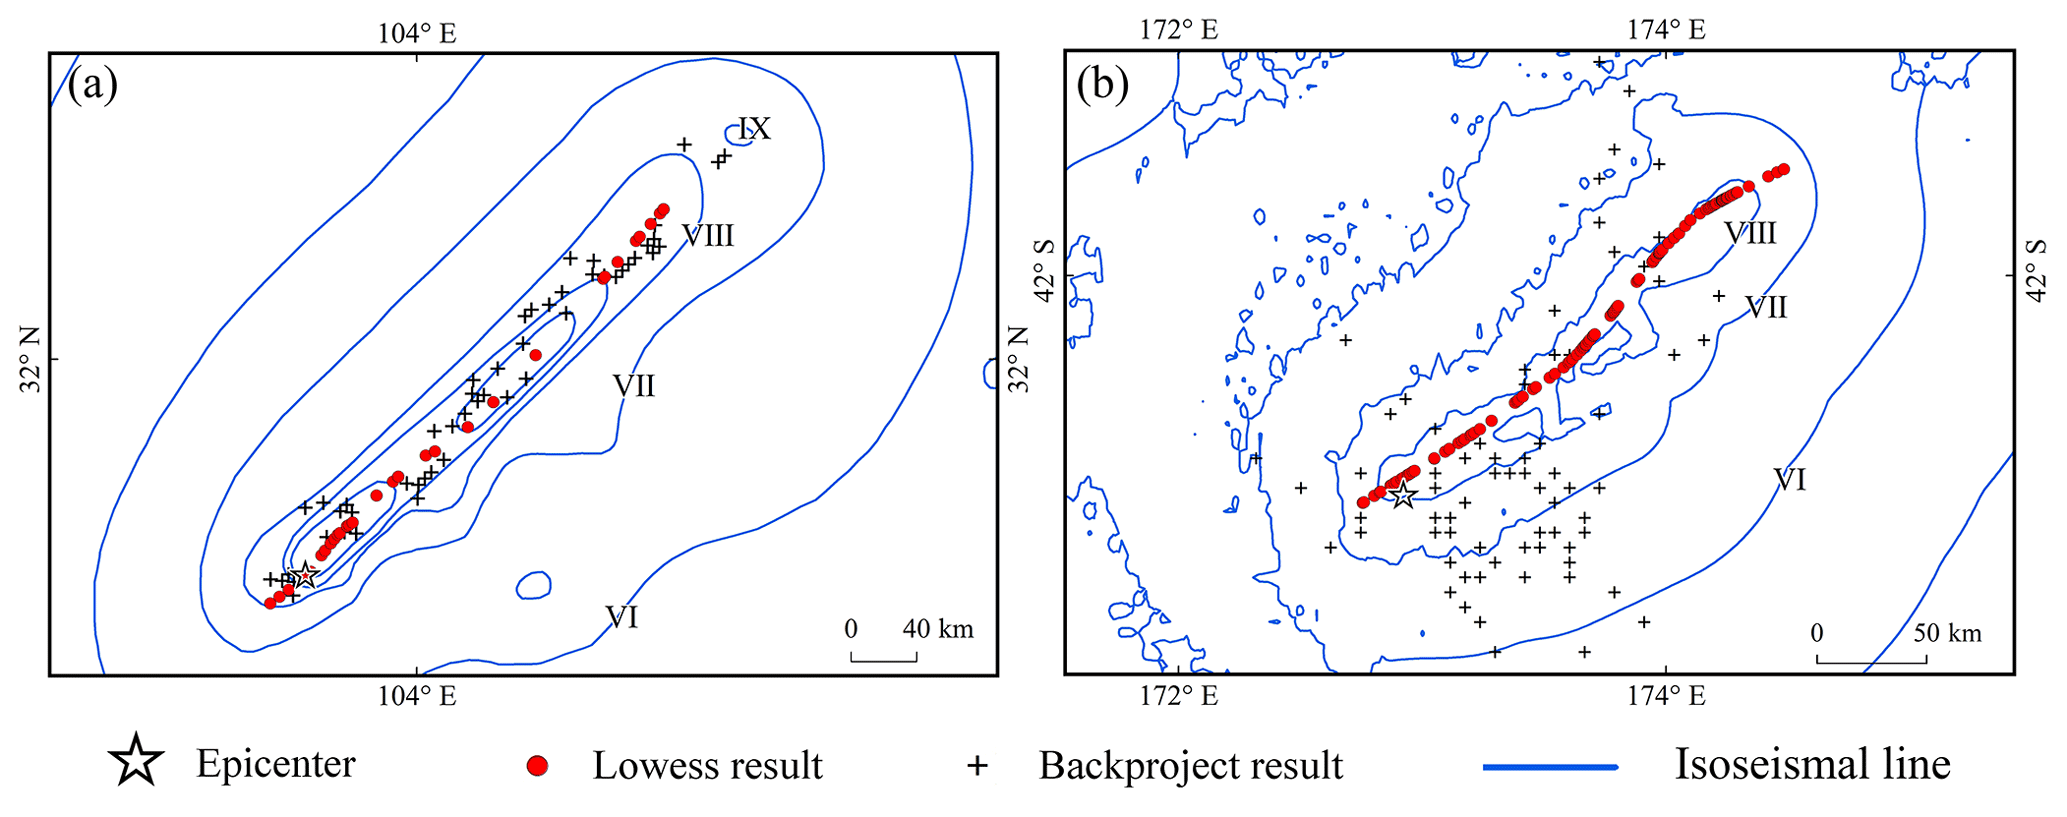
Figure 11Comparison of surface rupture results obtained using the LOWESS and back-projection methods for the (a) 2008 Wenchuan Mw 7.9 and (b) 2016 Kaikōura Mw 7.8 earthquakes.
We gathered data on the estimated source rupture of the back-projection algorithm for the Wenchuan earthquake (Chen et al., 2022a). Using the same technique, a set of results reflecting the surface rupture of the 2016 Kaikura Mw 7.8 earthquake was calculated using waveform data from the high-sensitivity seismograph network in Japan. Both the LOWESS and back-projection results show rupture directions similar to those indicated by the long axis of the isoseismal line in the area with intensity VIII of the Wenchuan earthquake, but the former estimates a longer rupture length (Fig. 11a). Furthermore, the back-projection results reveal more details concerning the rupture. For example, they indicate a possible fracture near the IX-degree intensity anomaly in the long-axis direction. This method has also demonstrated benefits in determining the intensity anomaly area for the 2022 Maduo Mw7.3 earthquake (Chen et al., 2022b). As a nonparametric method, the points fitted by LOWESS are clearly distributed along a curve. However, when the fault system in the seismogenic region is complex, the dominant orientation of the rupture traced using the back-projection method may be problematic (Fig. 11b). A clear guide to array data selection may be required when using the back-projection method, and we recognize that the results of array data calculations are more accurate when the appropriate region is chosen (Wang and Hutko, 2018). Aftershocks that have been relocated can be used to determine rupture fault trajectories, and their combination with inverse projection techniques has been applied to determine transient shear ruptures (Li et al., 2019; Cheng et al., 2023). These two methods could be cross-referenced in application for more accurate intensity evaluation results overall.
4.1 Stability of AL-SM99
In essence, we have explored the possibility of exploiting early aftershock data through LOWESS and found that this method achieved fairly accurate earthquake intensity assessment results. The quality of aftershock data (number of aftershocks, accuracy of aftershock localization and magnitude of aftershocks) controls the robustness of the method to a certain extent. The aftershock data observed by conventional stations are sufficient for our method (Zhao et al., 2022a, b); however, good data quality could produce more accurate assessment results. In addition, we used a robust version of LOWESS, whose parameter f controls the degree of smoothing and is the only one that needs to be adjusted based on the data properties during the implementation of this algorithm. The criterion for determining f is to choose a value that is as large as possible to minimize the variability in the smoothed points without damaging the data pattern. The larger the setting of parameter f, the smoother the fitting result is; its recommended value ranges from 0.2 to 0.8. Without knowing the data characteristics, it is reasonable to take 0.5 as the starting value (Cleveland, 1979). The value of f determines the size of the local range over which the weighted linear regression is performed. When f is reduced to a small value, fewer aftershocks are used to determine the fitted values in that range, causing the fitted curve to shift toward aftershocks that are more spatially dispersed. The fitted curve deviates significantly from the position of the fault rupture track. Therefore, the accuracy of our intensity assessment is more controlled by smoothness f.
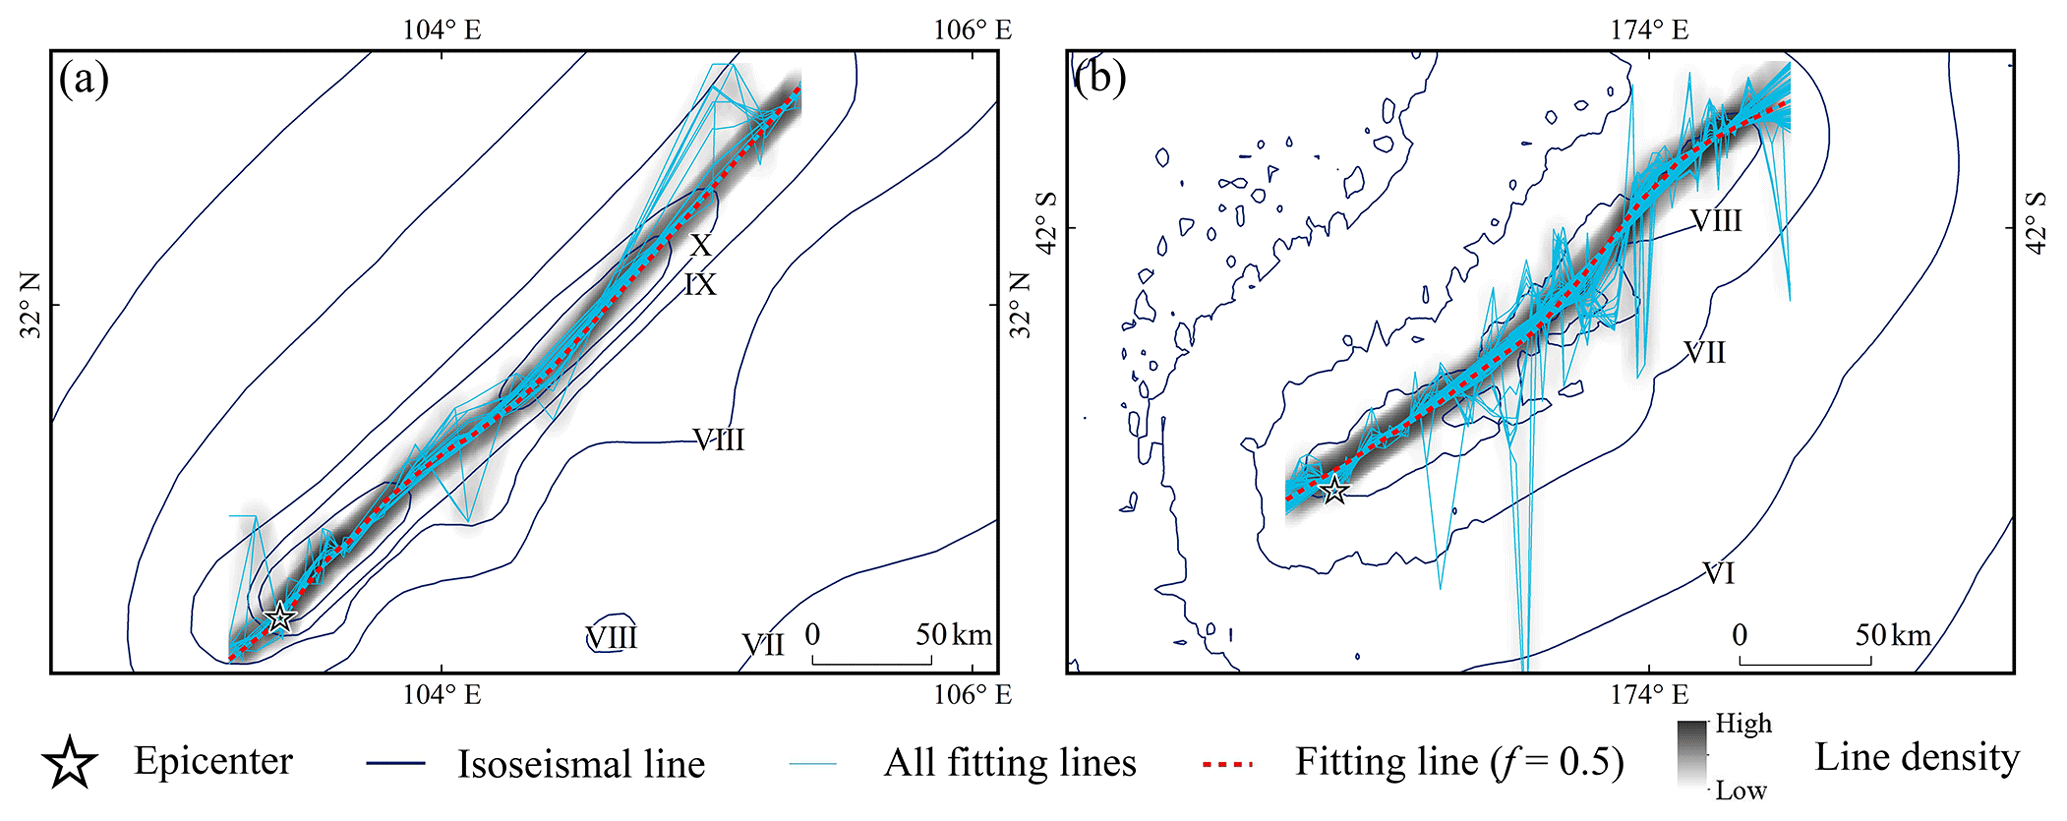
Figure 12LOWESS-fitted curves and line densities for different values of smoothness f for the (a) 2008 Wenchuan Mw 7.9 and (b) 2016 Kaikōura Mw 7.8 earthquakes. A total of 99 curves were fitted using LOWESS in steps of 0.01 from 0.01 to 0.99.
Taking the 2008 Wenchuan Mw 7.9 and 2016 Kaikōura Mw 7.8 earthquakes as examples, when f is set to a lower value, the fitting results are more affected by the local data; in particular, the aftershocks that were spatially distributed at a significant distance could interfere with the calculation of GMPE and affect the accuracy of earthquake intensity assessment (Fig. 12). When f exceeds a certain value, the fitted curve becomes smoother and more concentrated in a specific region. The influence of aftershocks with abnormal spatial location on the fitting effect gradually decreases; this stable result reflects the spatial characteristics of the mainshock rupture and can be used in the calculation of SM99. For f = 0.5, the fitted curve is in the stable region. The number and spatial distribution of aftershocks have a significant impact on the value of parameter f. In a real-world seismic emergency, the parameters can be adjusted based on the characteristics of the acquired data as well as expert experience to produce a curve that is more consistent with the rupture characteristics.
4.2 Conditions for the application of AL-SM99
Previous studies have utilized known fault geological data and far-field array back-projection results for SM99 calculations (Zhang et al., 2021; Chen et al., 2022). Our research increases the number of data sources used for such calculations. As AL-SM99 requires a certain number of aftershocks for accuracy, the earthquake to which the method is applied must be accompanied by a certain size aftershock or be a swarm-type earthquake.
Table 4Average residuals of PGVvs30 predictions within 100 km for 23 earthquakes; this PGV result was obtained using AL-SM99. The dominant slip types were identified based on the moment tensor results obtained from the ShakeMap website.
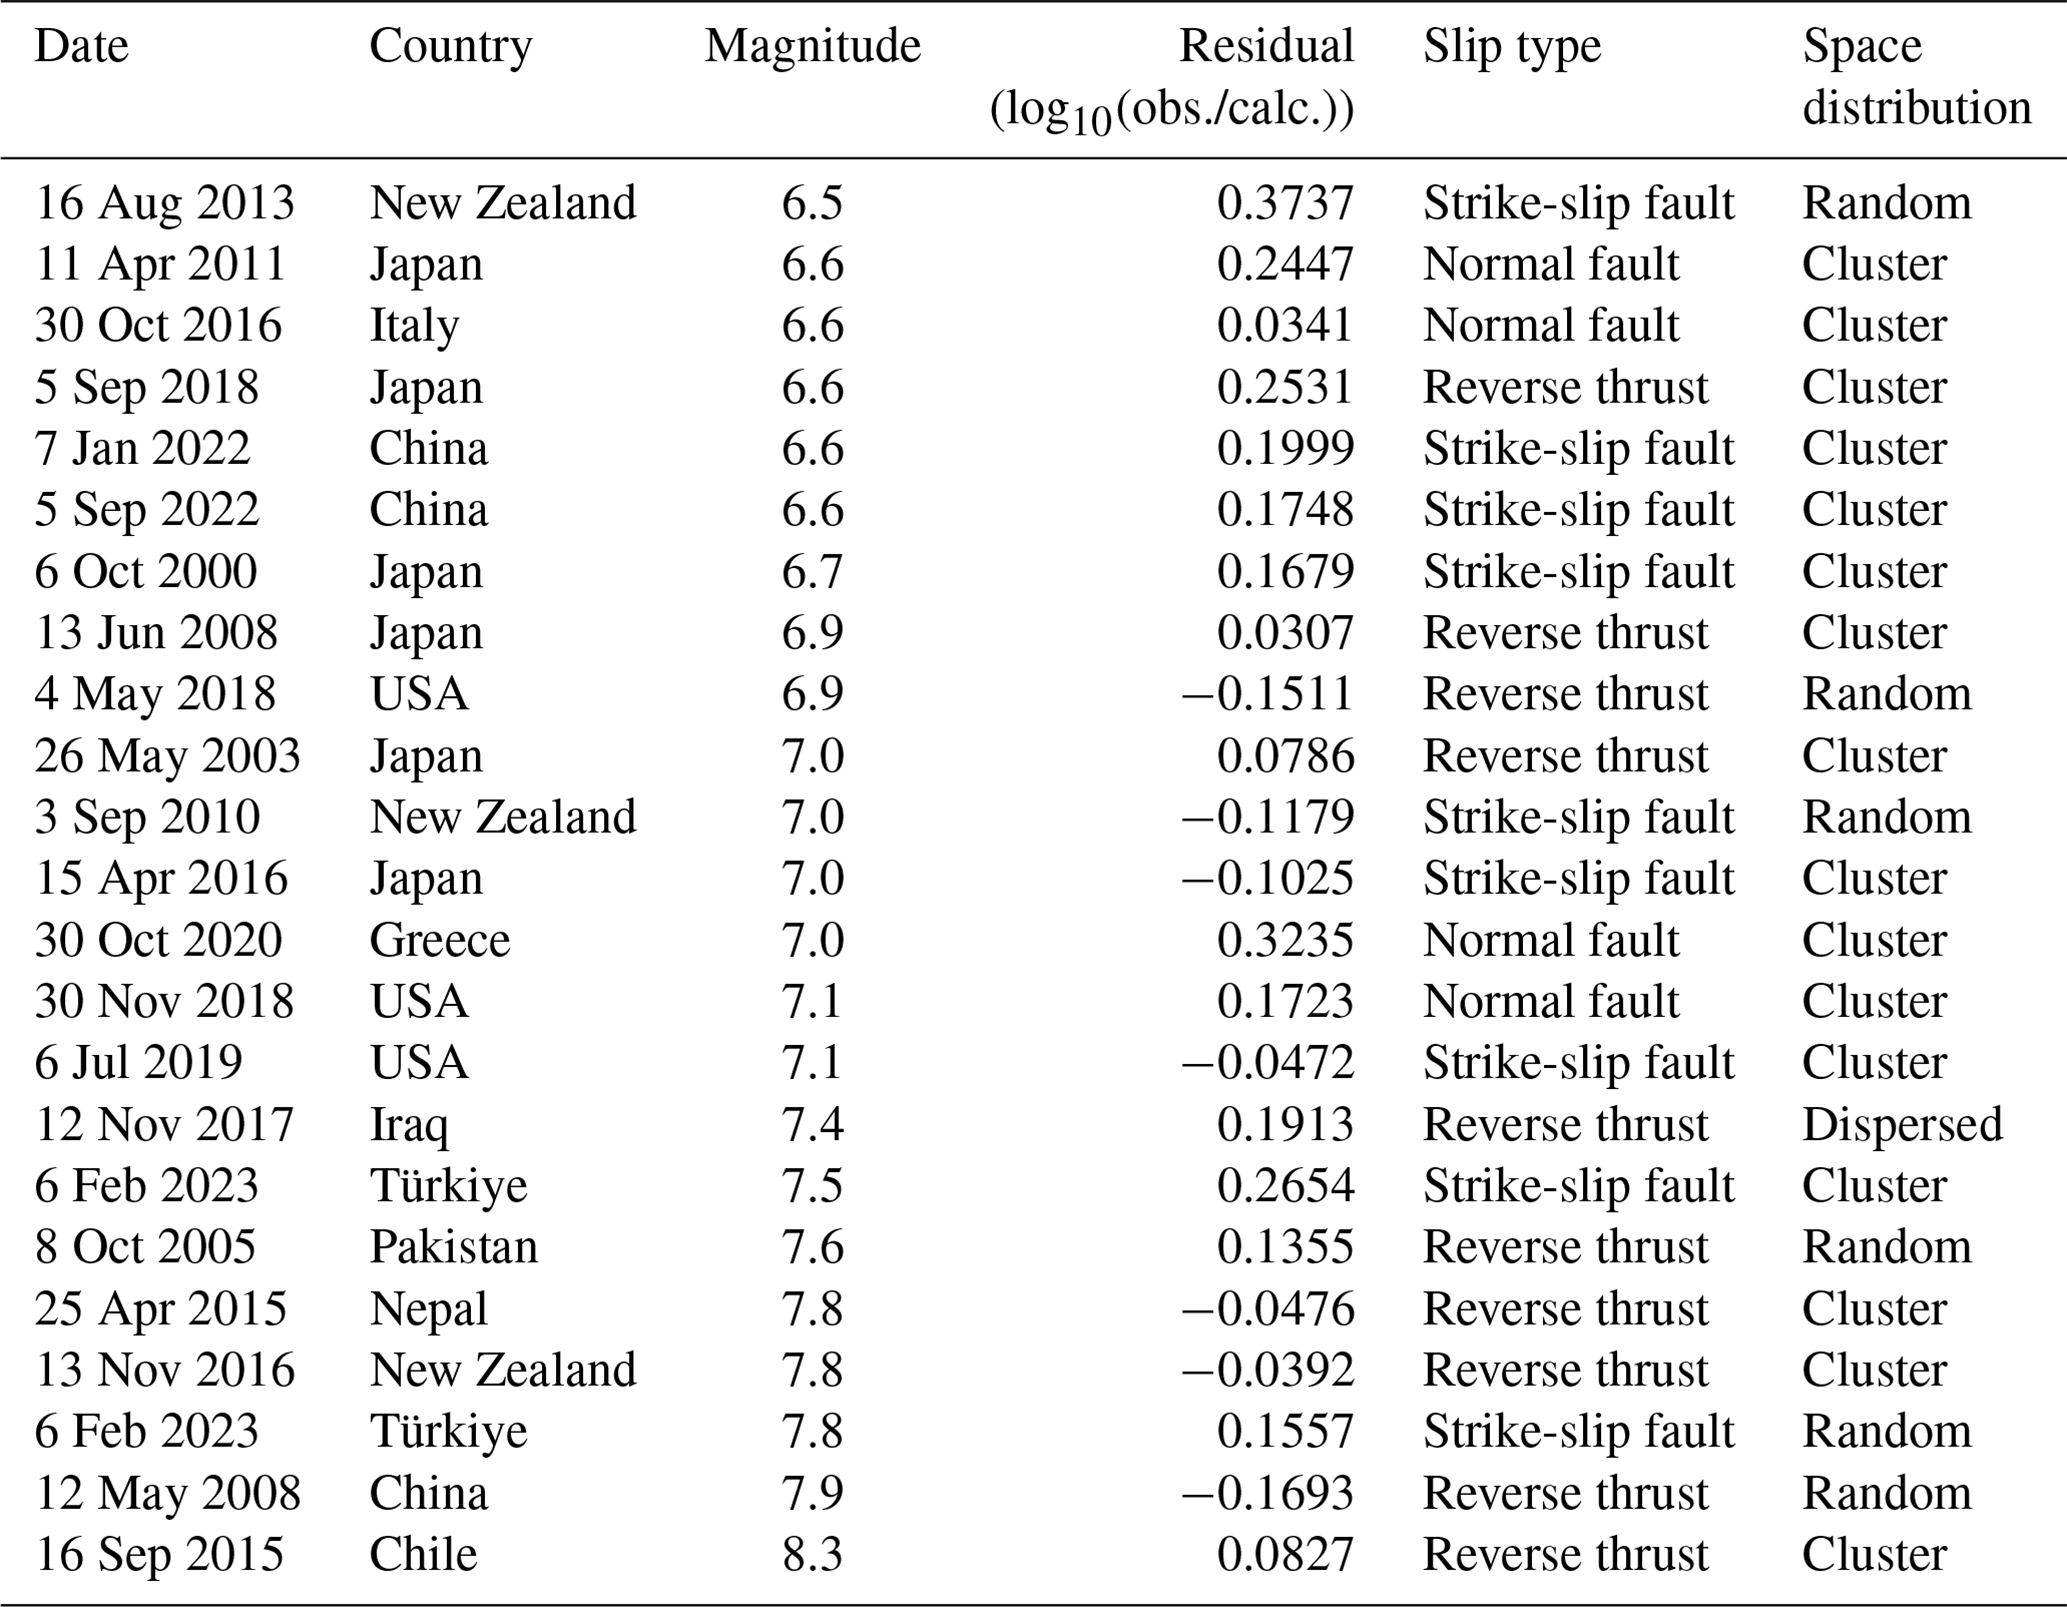
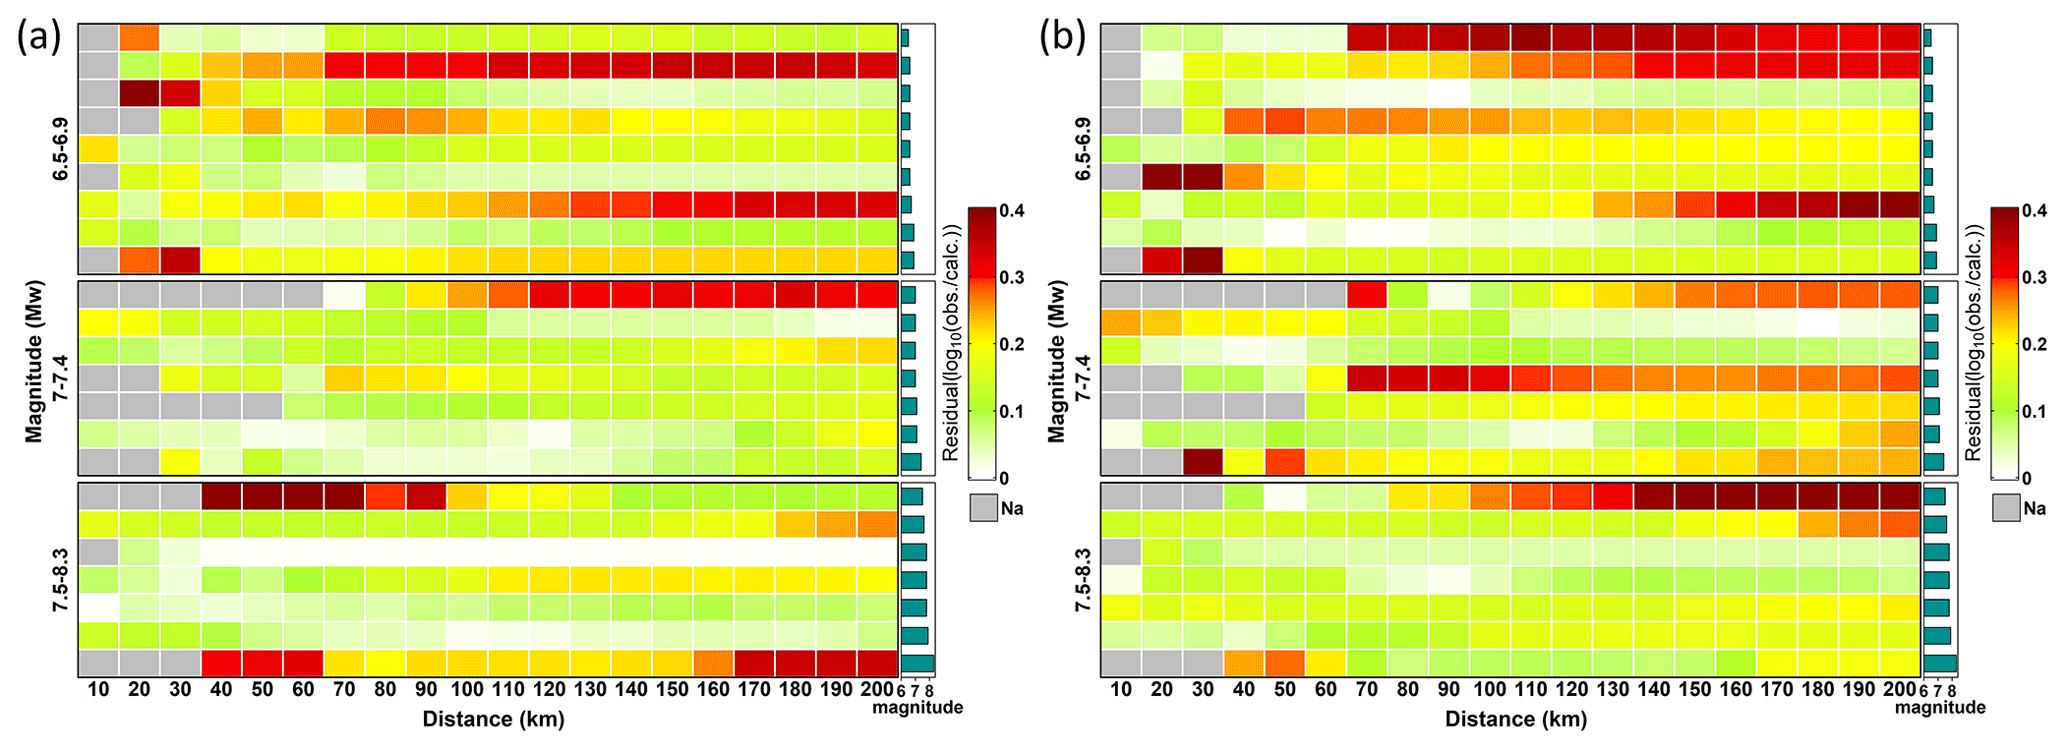
Figure 13Heat map of the average residuals of predicted (a) peak ground acceleration (PGA) and (b) PGVvs30 values for 23 earthquakes, which have good station records. A residual value is calculated for every 10 km increase in the range of 200 km from the epicenter, and the corresponding color is assigned to the corresponding position in the graph. The magnitudes were divided into three groups. Each row represents an earthquake, and the histogram on the left displays the associated magnitude.
According to the empirical relationship, large earthquakes are frequently accompanied by significant surface rupture (Bonilla et al., 1984; Wells and Coppersmith, 1994). In this study, the PGVvs30 calculated using the LOWESS-fit results and VS30 data for earthquakes with Mw ≥ 7.0 was superior to that calculated for earthquakes with Mw 6.5–6.9 (Table 4). The b value describes the number of small earthquakes that occur following every large earthquake. A significant increase in the b value was also discovered for earthquakes with Mw ≥ 7.0 in a study of the effect of mainshocks on the aftershock size distribution (Gulia et al., 2018; Van Der Elst, 2021). There was no significant correlation between this method and the fault slip types or the degree of spatial aggregation of aftershocks, and the type of source mechanism appeared to have no significant effect on the results (Kagan, 2002). When the magnitude is small, we can directly use SM99 to calculate PGV and PGA after excluding outliers, or we can add a buffer a certain distance from the fitted curve to select the aftershock data for calculation (Ozawa and Ando, 2021; Zhao et al., 2023). If necessary, aftershocks that are not deemed outliers can be manually removed with expert experience. GMPEs also influence the calculation of small-magnitude earthquakes to a certain degree (Chen et al., 2022a).
Aftershocks accumulate after an earthquake, and the probability of an aftershock occurs in a hyperbolic relationship with time (Omori, 1894; Utsu, 1961; Guglielmi and Zavyalov, 2018). As previously mentioned, the number of aftershocks has a significant impact on the LOWESS-fitting results. In this study, the first quartile, median and third quartile of the aftershock number were 43, 70 and 116.5, respectively. Conservatively, using more than 40 aftershocks for the assessment is likely to yield more reliable results. Even foreshocks may be the result of the earthquake nucleation process (Dodge et al., 1996). Therefore, foreshocks can be considered for inclusion in the raw data to increase the amount available.
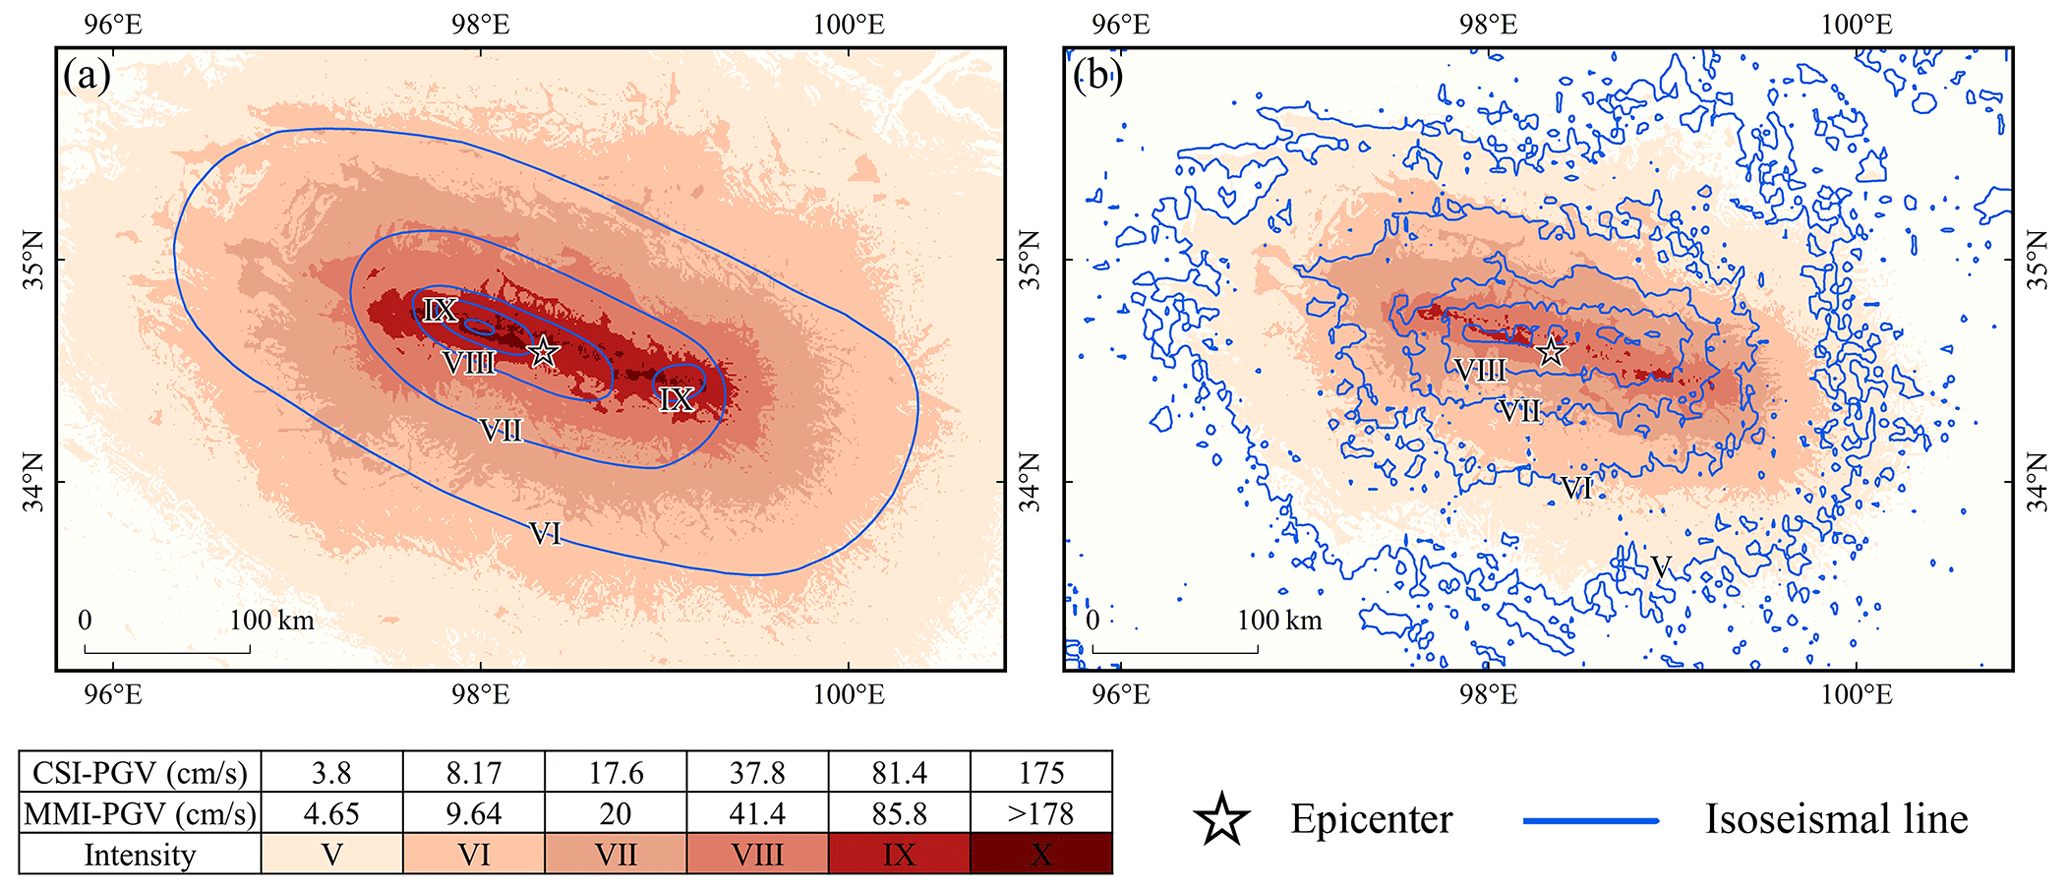
Figure 14Intensity assessment of the 2021 Maduo Mw 7.3 earthquake. Comparison of the seismic intensities determined by LOWESS with those determined by (a) CEA and (b) ShakeMap.
The model prediction results are credible if the aftershocks accurately reflect the information of the causative faults as the input data of SM99. The average residuals of the PGVvs30- and PGA-predicted values for the 23 earthquakes were between −0.4 and 0.4 (Fig. 13). With increasing magnitude, the residuals of ground motion prediction decrease significantly. The residuals of ground motion predictions for earthquakes with magnitudes of 7.5–8.3 are superior to those of the other two subgroups, whereas the residuals of Mw 6.0–6.5 are higher. This implies that the method is more applicable in large-magnitude earthquakes. For many earthquakes shown in Fig. 13, the residuals of the ground motion prediction results increase with distance, indicating the advantage in determining the extent of the hardest-hit areas.
ShakeMap has established itself as the authoritative global platform for distributing and sharing earthquake information and has played a critical role in documenting many major earthquakes and geological disasters (Worden et al., 2020). However, in certain regions, particularly those with limited access to station monitoring data, the seismic intensity estimated by ShakeMap may differ significantly from the actual situation. For example, the 2021 Maduo Mw 7.3 earthquake shown in Fig. 14 produced a northwest–southeast-oriented surface rupture and an intensity anomaly zone southeast of the epicenter (Zhang et al., 2021; Chen et al., 2022b). The estimated direction of the ShakeMap high-intensity regions in Fig. 14b was close to the west–east distribution, and the range of intensity VIII was significantly different from the actual intensity. Aftershock fitting results recorded within 2 h of the mainshock can be used to determine the causative fault and provide a reference for examining the results of finite fault and back projection. GMPEs possess a strong regional identity. The selection of appropriate GMPEs within a seismogenic region allows for a more precise estimation of earthquake intensity.
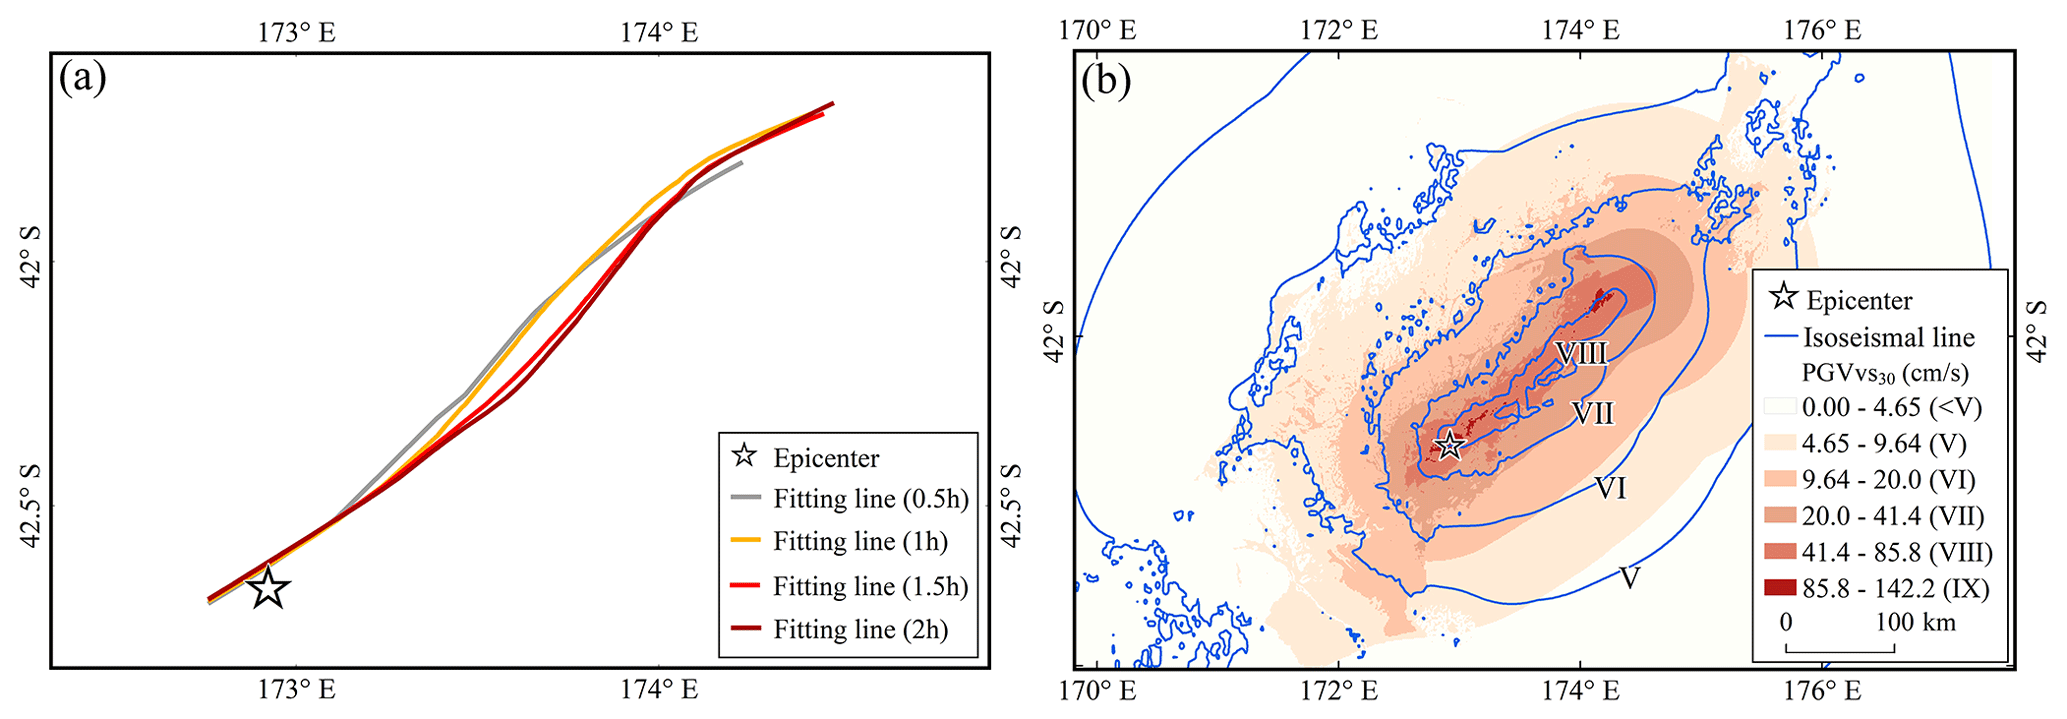
Figure 15LOWESS split-time fitting results of the 2016 Kaikōura Mw 7.8 earthquake. (a) LOWESS-fitting curves plotted at 0.5 h intervals and (b) assessment of seismic intensity using aftershocks within 1.5 h of the earthquake.
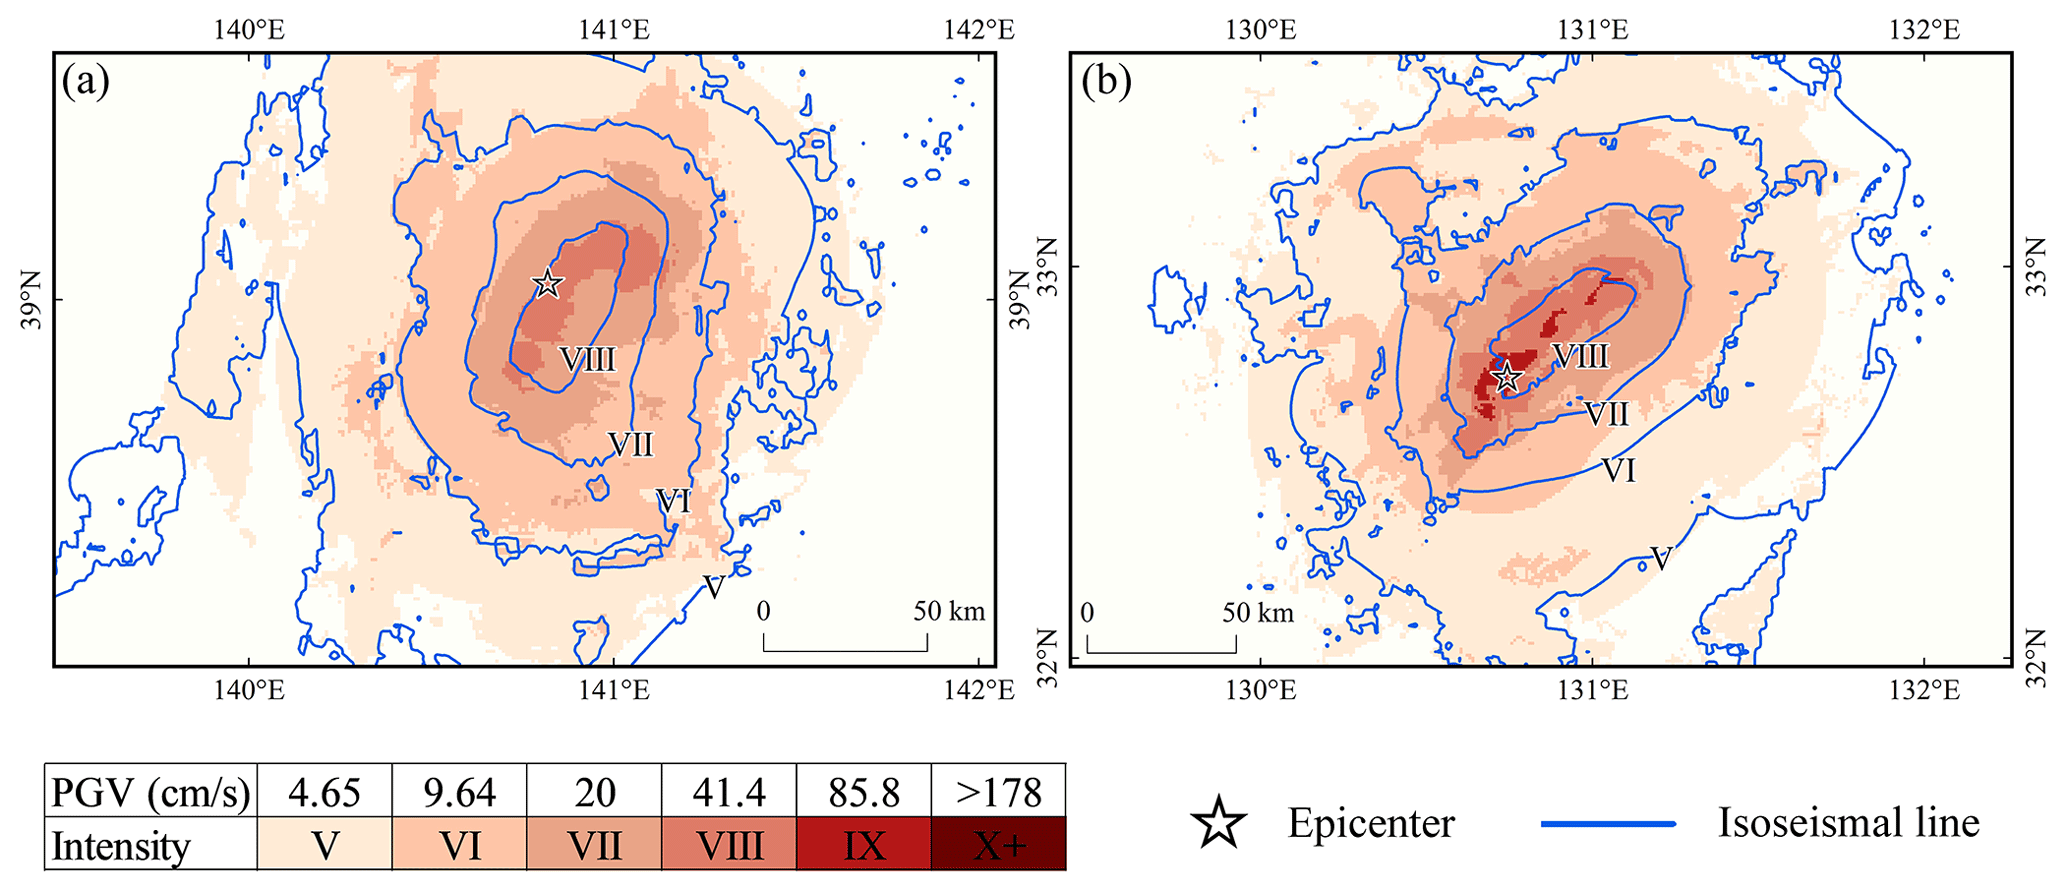
Figure 16Results of a rapid assessment of seismic intensities. The seismic intensities of the (a) 2008 Iwate–Miyagi Nairiku Mw 6.9 and (b) 2016 Kumamoto Mw 7 earthquakes were evaluated using aftershocks that occurred within 10 min. For the latter, distant aftershocks that were not identified as outliers were manually removed.
4.3 Time efficiency
The primary goal in developing this method was to provide information services to response workers during the black-box period of an earthquake emergency. We learned the following from the calculations of all the cases in this study and from actual earthquakes emergency work (Zhao et al., 2022b, 2023). If seismic stations in the seismogenic region are as sparse and uneven as those in western China, once the earthquake is determined to be suitable for use with AL-SM99, a reliable seismic intensity assessment map can be produced within 1–1.5 h of the mainshock. The majority of the time required to produce the results is spent acquiring aftershock data, while processing the aftershock data requires only a few seconds, and the calculation and output of the maps require approximately 5 min. Taking the 2016 Kaikōura Mw 7.8 earthquake as an example, the fitted curve gradually lengthened with an increase in time, and the direction indicated by the beginning and end of the curve in different periods did not change significantly, although the curve changed locally in a more obvious manner (Fig. 15). This indicates that the curve fitted by LOWESS is constantly and dynamically corrected as the number of aftershocks increases and that the use of aftershock sequences approximately 1.5 h after the earthquake can sufficiently assess the seismic intensity distribution. This is consistent with the experience mentioned above.
In areas with dense monitoring stations or those using artificial intelligence aftershock pickup methods, a large number of aftershock data can often be obtained in a short time. For example, in Japan, a large number of good aftershock records can significantly shorten the intensity assessment time (Fig. 16). Good data quality can shorten the intensity assessment results to within 30 min and greatly increase the efficiency of the intensity assessment. Chen et al. (2022a) proposed a rapid assessment method that can generate intensity assessment maps within 30 min. The spatial location of the rupture trajectories obtained from the inversion of rupture processes for small-magnitude earthquakes may be less satisfactory (Honda et al., 2011; Yao et al., 2019); however, for these earthquakes, the seismic intensities assessed using aftershock data may be more accurate (Kang et al., 2023). The AL-SM99-fitted curves of the spatial distribution of aftershocks can be used as a cross-reference for the correction of the above inversion results, increasing the speed of the operation using both methods. For global earthquakes, when the magnitude reaches the trigger threshold of the ShakeMap system, the first version of the assessment results is generated through the original solution built into the system within minutes of the mainshock and is continuously updated as data are aggregated and accumulated (Worden et al., 2020). Thus, we have considered combining AL-SM99 with aftershock monitoring to dynamically present intensity assessment results, because for earthquakes with small rupture scales, relying on the epicenter coordinate or a small number of aftershocks can provide useful shaking distribution estimates.
In this study, we developed a method for evaluating seismic intensities based on aftershock data gathered within 2 h of the mainshock. Aftershock sequences are treated as scatterplots, with LOWESS fitting applied to their longitude and latitude coordinate values. The result of the fit is used to roughly describe the fault rupture trend, and the SM99 was used to calculate ground motion data. The PGV values were then converted to seismic intensity. The main conclusions are as follows.
The length and direction of the surface rupture can be roughly outlined by the early aftershock sequence following the mainshock. The fitted curves from LOWESS are helpful for pinpointing the location of causative faults and rupture scales. When the fault system in the seismic region is clear and simple, the LOWESS-fitted curves can be used to accurately determine the location and length of the fault rupture. When the fault system is complex, LOWESS results can still indicate the overall rupture trend and make reliable rupture-scale judgments.
LOWESS is suited for aftershock sequences of large-magnitude earthquakes (Mw ≥ 7.0). The fitted curves are always slightly longer than the actual surface rupture, indicating that aftershocks occurred at a certain distance from the tips of the fault shortly after the mainshock (Ozawa and Ando, 2021). This method broadens the scope of application for early post-earthquake aftershock data.
Aftershocks frequently cause secondary damage to buildings in the affected region, resulting in greater economic losses or fatalities. The seismic intensity map based on the spatial distribution trend assessment of aftershock sequences could reflect the extent of the hardest-hit areas and regions where property damage and fatalities may occur.
When the listed conditions are met, the seismic intensities assessed using AL-SM99 can serve as a useful reference for early earthquake emergency response efforts. The outcomes of intensity assessment may also provide a basis for different perspectives in studying the radiative energy of earthquakes and locating causative faults. Obviously, selecting the appropriate GMPEs can produce more accurate intensity assessment results.
Notably, only the coordinate positions of the aftershocks are used when fitting the aftershock sequence with LOWESS. A discrepancy remains between the fitted curve length, the local trend and the actual surface rupture. In future research, the type of the causative faults and geological context of the seismogenic regions will be considered, and empirical formulas such as the Wells surface rupture formula will be used for correction. It is beneficial to study the aftershock sequence relocation methods and the relationship between the spatial distribution of early aftershock sequences and causative faults. The application of LOWESS to smoothing the spatial distribution trends of aftershock sequences over extended time periods is also of interest. AL-SM99 can dynamically generate intensity assessment results in conjunction with aftershock monitoring networks. Although the viability of aftershock prediction remains debatable, it is possible to combine aftershock predictions and achieve rapid seismic intensity prediction (DeVries et al., 2018; Mignan and Broccardo, 2019).
Aftershock data for earthquakes outside of China were downloaded from http://www.isc.ac.uk/iscbulletin/search/catalogue/ (Bondár and Storchak, 2011).
WC conceptualized the project, acquired funding and supervised the project. HZ performed the investigation, deployed the software and code, and edited the paper. WC and HZ developed the methodology and revised the paper. CZ and DK provided input and assistance in the improvement of the methodology.
The contact author has declared that none of the authors has any competing interests.
Publisher's note: Copernicus Publications remains neutral with regard to jurisdictional claims in published maps and institutional affiliations.
The procedures for screening and deleting outliers, LOWESS smoothing, and calculation of residuals and other indicators were carried out in R. The seismic intensity maps and the effect maps of the fitted curves were carried out in ArcGIS software.
This research was supported by the Major Science and Technology Projects of Gansu Province (grant no. 21ZD4FA011) and the National Key Research and Development Program of China (grant no. 2017YFB0504104).
This paper was edited by Oded Katz and reviewed by two anonymous referees.
Atkinson, G. M. and Wald, D. J.: “Did You Feel It?” intensity data: A surprisingly good measure of earthquake ground motion, Seismol. Res. Lett., 78, 362–368, https://doi.org/10.1785/gssrl.78.3.362, 2007
Bachura, M. and Fischer, T.: Detailed velocity ratio mapping during the aftershock sequence as a tool to monitor the fluid activity within the fault plane, Earth Planet. Sc. Lett., 453, 215–222, https://doi.org/10.1016/j.epsl.2016.08.017, 2016.
Baranov, S., Narteau, C., and Shebalin, P.: Modeling and prediction of aftershock activity, Surv. Geophys., 43, 437–481, https://doi.org/10.1007/s10712-022-09698-0, 2022.
Bondár, I. and Storchak, D. A.: Improved location procedures at the International Seismological Centre, Geophys. J. Int., 186, 1220–1244, https://doi.org/10.1111/j.1365-246X.2011.05107.x, 2011 (data are available at http://www.isc.ac.uk/iscbulletin/search/catalogue/, last access: 3 September 2023).
Bonilla, M. G., Mark, R. K., and Lienkaemper, J.: Statistical relations among earthquake magnitude, surface rupture length, and surface fault displacement, B. Seismol. Soc. Am., 74, 2379–2411, https://doi.org/10.1785/BSSA0740062379, 1984.
Chen, J., Tang, H., Chen, W. K., and Yang, N. S.: A prediction method of ground motion for regions without available observation data (LGB-FS) and its application to both Yangbi and Maduo earthquakes in 2021, J. Earth Sci., 33, 869–884, https://doi.org/10.1007/s12583-021-1560-6, 2022.
Chen, W. K., Wang, D., Si, H. J., and Zhang, C.: Rapid estimation of seismic intensities using a new algorithm that incorporates array technologies and ground-motion prediction equations (GMPEs), B. Seismol. Soc. Am., 112, 1647–1661, https://doi.org/10.1785/0120210207, 2022a.
Chen, W. K, Wang, D., Zhang, C., Yao, Q., and Si, H. J.: Estimating seismic intensity maps of the 2021 Mw 7.3 Madoi, Qinghai and Mw 6.1 Yangbi, Yunnan, China earthquakes, J. Earth Sci., 33, 839–846, https://doi.org/10.1007/s12583-021-1586-9, 2022b.
Chen, W. K., Rao, G., Kang, D. J., Wan, Z. F., and Wang, D.: Early Report of the Source Characteristics, Ground Motions, and Casualty Estimates of the 2023 Mw 7.8 and 7.5 Turkey Earthquakes, J. Earth Sci., 34, 297–303, https://doi.org/10.1007/s12583-023-1316-6, in press, 2023.
Chen, Y., Hu, J., and Peng, F.: Seismological challenges in earthquake hazard reductions: Reflections on the 2008 Wenchuan earthquake, Sci. Bull., 63, 1159–1166, https://doi.org/10.1016/j.scib.2018.06.015, 2018.
Cheng, C., Wang, D., Yao, Q., Fang, L. H., Xu, S. Q., Huang, Z. H., Liu, T. H., Wang, Z. F., and Huang, X. L.: The 2021 Mw 7.3 Madoi, China Earthquake: Transient Supershear Ruptures On a Presumed Immature Strike-slip Fault, J. Geophys. Res.-Sol. Ea., 128, e2022JB024641, https://doi.org/10.1029/2022JB024641, 2023.
Cleveland, W. S.: Robust locally weighted regression and smoothing scatterplots, J. Am. Stat. Assoc., 74, 829–836, https://doi.org/10.1080/01621459.1979.10481038, 1979.
Cleveland, W. S.: LOWESS: A program for smoothing scatterplots by robust locally weighted regression, Am. Stat., 35, 54, https://doi.org/10.2307/2683591, 1981.
Cleveland, W. S. and Devlin, S. J.: Locally weighted regression: An approach to regression analysis by local fitting, J. Am. Stat. Assoc., 83, 596–610, https://doi.org/10.1080/01621459.1988.10478639, 1988.
Dell'Acqua, F. and Gamba, P.: Remote sensing and earthquake damage assessment: Experiences, limits, and perspectives, Proc. IEEE, 100, 2876–2890, https://doi.org/10.1109/JPROC.2012.2196404, 2012.
Dengler, L. A. and Dewey, J. W.: An intensity survey of households affected by the Northridge, California, earthquake of 17 January 1994. B. Seismol. Soc. Am., 88, 441–462, https://doi.org/10.1785/BSSA0880020441, 1998.
DeVries, P. M., Viégas, F., Wattenberg, M., and Meade, B. J.: Deep learning of aftershock patterns following large earthquakes, Nature, 560, 632–634, https://doi.org/10.1038/s41586-018-0438-y, 2018.
Dodge, D. A., Beroza, G. C., and Ellsworth, W. L.: Detailed observations of California foreshock sequences: Implications for the earthquake initiation process, J. Geophys. Res.-Sol. Ea., 101, 22371–22392, https://doi.org/10.1029/96JB02269, 1996.
Erdik, M., Şeşetyan, K., Demircioğlu, M. B., Hancılar, U., and Zülfikar, C.: Rapid earthquake loss assessment after damaging earthquakes, Soil Dyn. Earthq. Eng., 31, 247–266, https://doi.org/10.1016/j.soildyn.2010.03.009, 2011.
Fletcher, J. M., Teran, O. J., Rockwell, T. K., Oskin, M. E., Hudnut, K. W., Mueller, K. J., Spelz, R. M., Akciz, S. O., Masana, E., Faneros, G., Fielding, E. J., Leprince, S., Morelan, A. E., Stock, J., Lynch, D. K., Elliott, A. J., Gold, P., Zeng, J. L., González-Ortega, A., Hinojosa-Corona, A., and González-García, J.: Assembly of a large earthquake from a complex fault system: Surface rupture kinematics of the 4 April 2010 El Mayor–Cucapah (Mexico) Mw 7.2 earthquake, Geosphere, 10, 797–827, https://doi.org/10.1130/GES00933.1, 2014.
Fuis, G. S., Clayton, R. W., Davis, P. M., Ryberg, T., Lutter, W. J., Okaya, D. A., Hauksson, E., Prodehl, C., Murphy, J. M., Benthien, M. L., Baher, S. A., Kohler, M. D., Thygesen, K., Simila, G., and Randy Keller, G.: Fault systems of the 1971 San Fernando and 1994 Northridge earthquakes, southern California: Relocated aftershocks and seismic images from LARSE II, Geology, 31, 171–174, https://doi.org/10.1130/0091-7613(2003)031<0171:FSOTSF>2.0.CO;2, 2003.
Grimmer, J. and Stewart, B. M.: Text as data: The promise and pitfalls of automatic content analysis methods for political texts, Polit. Anal., 21, 267–297, https://doi.org/10.1093/pan/mps028, 2013.
Guglielmi, A. V. and Zavyalov, A. D.: The Omori law: The 150-year birthday jubilee of Fusakichi Omori, J. Volcanol. Seismol.+, 12, 353–358, https://doi.org/10.1134/S0742046318050044, 2018.
Gulia, L., Rinaldi, A. P., Tormann, T., Vannucci, G., Enescu, B., and Wiemer, S.: The effect of a mainshock on the size distribution of the aftershocks, Geophys. Res. Lett., 45, 277–213,287, https://doi.org/10.1029/2018GL080619, 2018.
Hao, K. X., Kobayashi, T., and Fujiwara, H.: Rapid assessment of high seismic intensity areas of the 2008 Mw 7.9 Wenchuan earthquake using satellite SAR data, Seismol. Res. Lett., 83, 658–665, https://doi.org/10.1785/0220110117, 2012.
Honda, R., Yukutake, Y., Ito, H., Harada, M., Aketagawa, T., Yoshida, A., Sakai, S. I., Nakagawa, S., Hirata, N., and Obara, K.: A complex rupture image of the 2011 off the pacific coast of Tohoku earthquake revealed by the meso-net, Earth Planets Space, 63, 583–588, https://doi.org/10.5047/eps.2011.05.034, 2011.
Hu, C., Cai, Y., Liu, M., and Wang, Z.: Aftershocks due to property variations in the fault zone: A mechanical model, Tectonophysics, 588, 179–188, https://doi.org/10.1016/j.tecto.2012.12.013, 2013.
Ishii, M., Shearer, P. M., Houston, H., and Vidale, J. E.: Extent, duration and speed of the 2004 Sumatra–Andaman earthquake imaged by the Hi-Net array, Nature, 435, 933–936, https://doi.org/10.1038/nature03675, 2005.
Jiao, P. and Alavi, A. H.: Artificial intelligence in seismology: advent, performance and future trends, Geosci. Front., 11, 739–744, https://doi.org/10.1016/j.gsf.2019.10.004, 2020.
Kagan, Y. Y.: Aftershock zone scaling, B. Seismol. Soc. Am., 92, 641–655, https://doi.org/10.1785/0120010172, 2002.
Kaiser, A., Balfour, N., Fry, B., Holden, C., Litchfield, N., Gerstenberger, M., D'anastasio, E., Horspool, N., McVerry, G., Ristau, J., Bannister, S., Christophersen, A., Clark, K., Power, W., Rhoades, D., Massey, C., Hamling, I., Wallace, L., Mountjoy, J., Kaneko, Y., Benites, R., Van Houtte, C., Dellow, S., Wotherspoon, L., Elwood, K., and Gledhill, K.: The 2016 Kaikōura, New Zealand, earthquake: Preliminary seismological report, Seismol. Res. Lett., 88, 727–739, https://doi.org/10.1785/0220170018, 2017.
Kamigaichi, O., Saito, M., Doi, K., Matsumori, T., Tsukada, S. Y., Takeda, K., Shimoyama, T., Nakamura, K., Kiyomoto, M., and Watanabe, Y.: Earthquake early warning in Japan: Warning the general public and future prospects, Seismol. Res. Lett., 80, 717–726, https://doi.org/10.1785/gssrl.80.5.717, 2009.
Kaneda, H., Nakata, T., Tsutsumi, H., Kondo, H., Sugito, N., Awata, Y., Akhtar, S. S., Majid, A., Khattak, W., Awan, A. A., Yeats, R. S., Hussain, A., Ashraf, M., Wesnousky, S. G., and Kausar, A. B.: Surface rupture of the 2005 Kashmir, Pakistan, earthquake and its active tectonic implications, B. Seismol. Soc. Am., 98, 521–557, https://doi.org/10.1785/0120070073, 2008.
Kang, D. J., Chen, W. K., Zhao, H. Q., and Wang, D.: Rapid Assessment of the September 5, 2022 Ms 6.8 Luding Earthquake in Sichuan, China, Earthquake Research Advances, 100214, https://doi.org/10.1016/j.eqrea.2023.100214, 2023.
Kilb, D., Gomberg, J., and Bodin, P.: Triggering of earthquake aftershocks by dynamic stresses, Nature, 408, 570–574, https://doi.org/10.1038/35046046, 2000.
Kisslinger, C.: Aftershocks and fault-zone properties, Adv. Geophys., 38, 1–36, https://doi.org/10.1016/S0065-2687(08)60019-9, 1996.
Lanza, F., Chamberlain, C. J., Jacobs, K., Warren-Smith, E., Godfrey, H. J., Kortink, M., Thurber, C. H., Savage, M. K., Townend, J., Roecker, S., and Eberhart-Phillips, D.: Crustal fault connectivity of the Mw 7.8 2016 Kaikōura earthquake constrained by aftershock relocations, Geophys. Res. Lett., 46, 6487–6496, https://doi.org/10.1029/2019GL082780, 2019.
Law, C. W., Chen, Y., Shi, W., and Smyth, G. K.: voom: Precision weights unlock linear model analysis tools for RNA-seq read counts, Genome Biol., 15, R29, https://doi.org/10.1186/gb-2014-15-2-r29, 2014.
Li, H. B., Fu, X. F., Jérôme, V., Si J. L., Wang, Z. X., Hou, L. W., Qiu, Z. L., Li, N., Wu, F. Y., Xu, Z. Q., and Paul, T.: Co-seisimic Surface Rupture and Dextral-slip Oblique Thrusting of the Ms 8.0 Wenchuan Earthquake, Acta Geologica Sinica, 82, 1623–1643, 2008.
Li, Y., Wang, D., Xu, S., Fang, L., Cheng, Y., Luo, G., Yan, B., Bogdan, E., and Mori, J.: Thrust and Conjugate Strike-Slip Faults in the 17 June 2018 MJMA 6.1 (Mw 5.5) Osaka, Japan, Earthquake Sequence. Seismol. Res. Lett., 90, 2132–2141, https://doi.org/10.1785/0220190122, 2019.
Liao, S., Zhang, H., Fan, L., Li, P., Huang, L., Fang, L., and Qin, M.: Development of a real time intelligent seismie processing system and its application in the 2021 Yunnan Yangbi Ms 6.4 Earthquake, Chin. J. Geophys., 64, 3632–3645, 2021.
Litchfield, N. J., Villamor, P., Dissen, R. J. V., Nicol, A., Barnes, P. M., A. Barrell, D. J., Pettinga, J. R., Langridge, R. M., Little, T. A., Mountjoy, J. J., Ries, W. F., Rowland, J., Fenton, C., Stirling, M. W., Kearse, J., Berryman, K. R., Cochran, U. A., Clark, K. J., Hemphill-Haley, M., Khajavi, N., Jones, K. E., Archibald, G., Upton, P., Asher, C., Benson, A., Cox, S. C., Gasston, C., Hale, D., Hall, B., Hatem, A. E., Heron, D. W., Howarth, J., Kane, T. J., Lamarche, G., Lawson, S., Lukovic, B., McColl, S. T., Madugo, C., Manousakis, J., Noble, D., Pedley, K., Sauer, K., Stahl, T., Strong, D. T., Townsend, D. B., Toy, V., Williams, J., Woelz, S., and Zinke, R.: Surface rupture of multiple crustal faults in the 2016 Mw 7.8 Kaikōura, New Zealand, Earthquake, B. Seismol. Soc. Am., 108, 1496–1520, https://doi.org/10.1785/0120170300, 2018.
Liu, C., Zheng, Y., Xiong, X., and Wang, R.: Rupture process of the 23 October 2011 Mw 7.1 Van earthquake in eastern Turkey by joint inversion of teleseismic, GPS and strong-motion data, Pure Appl. Geophys., 172, 1383–1396, https://doi.org/10.1007/s00024-014-0994-5, 2015.
Liu, M., Zhang, M., Zhu, W., Ellsworth, W. L., and Li, H.: Rapid characterization of the July 2019 Ridgecrest, California, earthquake sequence from raw seismic data using machine-learning phase picker, Geophys. Res. Lett., 47, e2019GL086189, https://doi.org/10.1029/2019GL086189, 2020.
Macaulay, F. R.: The Smoothing Of Time Series, National Bureau of Economic Research, New York, 1931.
Mariani, M. C. and Basu, K.: Local regression type methods applied to the study of geophysics and high frequency financial data, Physica A, 410, 609–622, https://doi.org/10.1016/j.physa.2014.05.070, 2014.
Mendoza, C. and Hartzell, S. H.: Aftershock patterns and main shock faulting, B. Seismol. Soc. Am., 78, 1438–1449, https://doi.org/10.1785/BSSA0780041438, 1988.
Mignan, A. and Broccardo, M.: One neuron versus deep learning in aftershock prediction, Nature, 574, E1–E3, https://doi.org/10.1038/s41586-019-1582-8, 2019.
Mitchell, A.: The Esri guide to GIS analysis, Vol. 2, Spatial measurements and statistics (second),Esri Press, https://www.esri.com/en-us/esri-press/ (last access: 4 September 2023), 2005.
Nanjo, K. and Nagahama, H.: Spatial distribution of aftershocks and the fractal structure of active fault systems, Pure Appl. Geophys., 157, 575–588, https://doi.org/10.1007/PL00001108, 2000.
Neo, J. C., Huang, Y., Yao, D., and Wei, S.: Is the aftershock zone area a Good Proxy for the mainshock Rupture Area?, B. Seismol. Soc. Am., 111, 424–438, https://doi.org/10.1785/0120190200, 2021.
Nie, G. Z. and An, J.: Basic theoretical model of earthquake emergency response, Urban Disaster Reduct., 3, 25–29. 2013 (in Chinese).
Nie, G. Z., An, J., and Deng, Y.: Advance in earthquake emergency disaster services, Seismol. Geol., 34, 782–791, https://doi.org/10.3969/j.issn, 2012 (in Chinese).
Nishimae, Y.: Observation of seismic intensity and strong ground motion by Japan Meteorological Agency and local goverments in Japan, Journal of Japan Association for Earthquake Engineering, 4, 75–78, https://doi.org/10.5610/jaee.4.3_75, 2004.
Omori, F.: On the After-Shocks of Earthquakes, J. College of Science Imperial University of Tokyo, 7, 111–200, 1894.
Otake, R., Kurima, J., Goto, H., and Sawada, S.: Deep learning model for spatial interpolation of real-time seismic intensity, Seismological Research Letters, Seismological Society of America, 91, 3433–3443, https://doi.org/10.1785/0220200006, 2020.
Ozawa, S. and Ando, R.: Mainshock and aftershock sequence simulation in geometrically complex fault zones, J. Geophys. Res.-Sol. Ea., 126, e2020, https://doi.org/10.1029/2020JB020865, 2021.
Perez, H. and Tah, J. H. M.: Improving the accuracy of convolutional neural networks by identifying and removing outlier images in datasets using t-SNE, Mathematics, 8, 662, https://doi.org/10.3390/math8050662, 2020.
Poggi, V., Scaini, C., Moratto, L., Peressi, G., Comelli, P., Bragato, P. L., and Parolai, S.: Rapid damage scenario assessment for earthquake emergency management, Seismol Res. Lett., 92, 2513–2530, https://doi.org/10.1785/0220200245, 2021.
Provost, F., Van der Woerd, J., Malet, J.-P., Maggi, A., Klinger, Y., Michéa, D., Pointal, E., and Pacini, F.: Mapping the ruptures of the Mw 7.8 and Mw 7.7 Turkey-Syria Earthquakes using optical offset tracking with Sentinel-2 images, EGU General Assembly 2023, Vienna, Austria, 24–28 Apr 2023, EGU23-17612, https://doi.org/10.5194/egusphere-egu23-17612, 2023.
Quackenbush, J.: Microarray data normalization and transformation, Nat. Genet., 32 Supplement, 496–501, https://doi.org/10.1038/ng1032, 2002.
Reitman, Nadine G., Briggs, R. W., Barnhart, W. D., Jobe, J. A. T., DuRoss, C. B., Hatem, A. E., Gold, R. D., Mejstrik, J. D., and Akçiz, S.: Preliminary fault rupture mapping of the 2023 M 7.8 and M 7.5 Türkiye Earthquakes, United States Geological Survey website, https://usgs.maps.arcgis.com/apps/ (last access: 4 September 2023), https://doi.org/10.5066/P985I7U2, 2023.
Rojas-Martinez, R., Perez-Padilla, R., Olaiz-Fernandez, G., Mendoza-Alvarado, L., Moreno-Macias, H., Fortoul, T., McDonnell, W., Loomis, D., and Romieu, I.: Lung function growth in children with long-term exposure to air pollutants in Mexico City, Am. J. Resp. Crit. Care, 176, 377–384, https://doi.org/10.1164/rccm.200510-1678OC, 2007.
Shi, X., Tapponnier, P., Wang, T., Wei, S., Wang, Y., Wang, X., and Jiao, L.: Triple junction kinematics accounts for the 2016 Mw 7.8 Kaikoura earthquake rupture complexity, P. Natl. Acad. Sci. USA, 116, 26367–26375, https://doi.org/10.1073/pnas.1916770116, 2019.
Si, H. J. and Midorikawa, S.: New attenuation relationships for peak ground acceleration and velocity considering effects of fault type and site condition, J. Struct. Constr., 64, 63–70, https://doi.org/10.3130/aijs.64.63_2, 1999.
Si, H. J., Hao, K. X., Xu, Y., Senna, S., Fujiwara, H., Yamada, H., Tsutsumi, H., Wu, C., Midorikawa, S., and Irikura, K.: Attenuation characteristics of peak ground motions during the Mw 7.9 Wenchuan earthquake, China, in: 7th International Conference on Urban Earthquake Engineering & 5th International Conference on Earthquake Engineering, 3–5 March, Tokyo Institute of Technology, Tokyo, Japan, 103–106, 2010.
Sokolov, V., Furumura, T., and Wenzel, F.: On the use of JMA intensity in earthquake early warning systems, B. Earthq. Eng., 8, 767–786, https://doi.org/10.1007/s10518-010-9178-6, 2010.
Spitzer, M., Wildenhain, J., Rappsilber, J., and Tyers, M.: BoxPlotR: A web tool for generation of box plots, Nat. Methods, 11, 121–122, https://doi.org/10.1038/nmeth.2811, 2014.
Stone, C. J.: Consistent nonparametric regression, Ann. Stat., 5, 595–620, https://doi.org/10.1214/aos/1176343886, 1977.
Tetlock, P. C.: Giving content to investor sentiment: The role of media in the stock market, J. Financ., 62, 1139–1168, https://doi.org/10.1111/j.1540-6261.2007.01232.x, 2007.
Toda, S., Kaneda, H., Okada, S., Ishimura, D., and Mildon, Z. K.: Slip-partitioned surface ruptures for the Mw 7.0 16 April 2016 Kumamoto, Japan, earthquake, Earth Planets Space, 68, 188, https://doi.org/10.1186/s40623-016-0560-8, 2016.
Umino, N., Okada, T., and Hasegawa, A.: Foreshock and aftershock sequence of the 1998 M 5.0 Sendai, northeastern Japan, earthquake and its implications for earthquake nucleation. B. Seismol. Soc. Am., 92, 2465–2477, https://doi.org/10.1785/0120010140, 2002.
Utsu, T.: A statistical study on the occurrence of aftershocks, Geophys. Mag., 30, 521–605, 1961.
van der Elst, N. J.: B-positive: A robust estimator of aftershock magnitude distribution in transiently incomplete catalogs, J. Geophys. Res.-Sol. Ea., 126, e2020, https://doi.org/10.1029/2020JB021027, 2021.
Wald, D. J., Quitoriano, V., Heaton, T. H., Kanamori, H., Scrivner, C. W., and Worden, C. B.: TriNet “ShakeMaps”: Rapid generation of peak ground motion and intensity maps for earthquakes in southern California, Earthq. Spectra, 15, 537–555, https://doi.org/10.1193/1.1586057, 1999.
Wallace, L. M., Hreinsdóttir, S., Ellis, S., Hamling, I., D'Anastasio, E., and Denys, P.: Triggered slow slip and afterslip on the southern Hikurangi subduction zone following the Kaikōura earthquake, Geophys. Res. Lett., 45, 4710–4718, https://doi.org/10.1002/2018GL077385, 2018.
Wan, Z. F., Wang, D., Zhang, J. F., Li, Q., Zhao, L. F., Cheng, Y. F., Mori, J., Chen, F., and Peng, Y. Y.: Two-Staged Rupture of the 19 October 2020 Mw 7.6 Strike-Slip Earthquake Illuminated the Boundary of Coupling Variation in the Shumagin Islands, Alaska, Seismol. Res. Lett., 94, 52–65, https://doi.org/10.1785/0220220203, 2022.
Wang, D. and Hutko, A. R.: Relative relocations of the North Korean nuclear tests from 2006 to 2017 using the Hi-Net array in Japan, Geophys. Res. Lett., 45, 7481–7487, https://doi.org/10.1029/2018GL078653, 2018.
Wang, D., Ni, S., and Li, J.: Research statues of rapid assessment on seismic intensity, Prog. Geophys., 28, 1772–1784, https://doi.org/10.6038/pg20130418, 2013 (in Chinese).
Wang, D., Kawakatsu, H., Zhuang, J. C., Mori, J., Maeda, T., Tsuruoka, H., and Zhao, X.: Automated determination of magnitude and source length of large earthquakes using backprojection and P wave amplitudes, Geophys. Res. Lett., 44, 5447–5456, https://doi.org/10.1002/2017GL073801, 2017.
Wang, W., Fang, L., Wu, J., Tu, H., Chen, L., Lai, G., and Zhang, L.: Aftershock sequence relocation of the 2021 Ms7. 4 Maduo earthquake, Qinghai, China, Sci. China Earth Sci., 64, 1371–1380, https://doi.org/10.1007/s11430-021-9803-3, 2021.
Watson, G. S.: Smooth regression analysis, Sankhyā: The Indian J. Stat. S. A, 359–372, 1964.
Wells, D. L. and Coppersmith, K. J.: New empirical relationships among magnitude, rupture length, rupture width, rupture area, and surface displacement, B. Seismol. Soc. Am., 84, 974–1002, https://doi.org/10.1785/BSSA0840040974, 1994.
Wikipedia: 2023 Turkey – Syria earthquake, https://en.m.wikipedia.org/wiki/2023_Turkey%E2%80%93Syria_earthquake (last access: 5 March 2023), 2023.
Worden, C. B., Gerstenberger, M. C., Rhoades, D. A., and Wald, D. J.: Probabilistic relationships between ground-motion parameters and modified Mercalli intensity in California, B. Seismol. Soc. Am., 102, 204–221, https://doi.org/10.1785/0120110156, 2012.
Worden, C. B., Thompson, E. M., Hearne, M., and Wald D. J.: ShakeMap manual Online: technical manual, user's guide, and software guide, U. S. Geol. Surv., https://doi.org/10.5066/F7D21VPQ, 2020.
Xia, C. X., Nie, G. Z., Fan, X. W., Zhou, J. X., and Pang, X. K.: Research on the application of mobile phone location signal data in earthquake emergency work: A case study of Jiuzhaigou earthquake, PLOS ONE, 14, e0215361, https://doi.org/10.1371/journal.pone.0215361, 2019.
Xu, C., Xu, X., Zhou, B., and Yu, G.: Revisions of the M 8.0 Wenchuan earthquake seismic intensity map based on co-seismic landslide abundance, Nat. Hazards, 69, 1459–1476, https://doi.org/10.1007/s11069-013-0757-0, 2013.
Xu, J., Zhou, H., Nie, G., and An, J.: Plotting earthquake emergency maps based on audience theory, Int. J. Disast. Risk Re., 47, 101554, https://doi.org/10.1016/j.ijdrr.2020.101554, 2020.
Yabe, S. and Ide, S.: Why do aftershocks occur within the rupture area of a large earthquake?, Geophys. Res. Lett., 45, 4780–4787, https://doi.org/10.1029/2018GL077843, 2018.
Yao, Q., Wang, D., Fang, L. H., and Mori, J.: Rapid estimation of magnitudes of large damaging earthquakes in and around Japan using dense seismic stations in China, B. Seismol. Soc. Am. 109, 2545–2555, https://doi.org/10.1785/0120190107, 2019.
Yao, K., Yang, S., and Tang, J.: Rapid assessment of seismic intensity based on Sina Weibo—A case study of the Changning earthquake in Sichuan Province, China, Int. J. Disast. Risk Re., 58, 102217, https://doi.org/10.1016/j.ijdrr.2021.102217, 2021.
Yin, X. Z., Chen, J. H., Peng, Z., Meng, X., Liu, Q. Y., Guo, B., and Li, S. C.: Evolution and distribution of the early aftershocks following the 2008 MW 7.9 Wenchuan earthquake in Sichuan, China, J. Geophys. Res.-Sol. Ea., 123, 7775–7790, https://doi.org/10.1029/2018JB015575, 2018.
Yukutake, Y. and Iio, Y.: Why do aftershocks occur? Relationship between mainshock rupture and aftershock sequence based on highly resolved hypocenter and focal mechanism distributions, Earth Planets Space, 69, 1–15, https://doi.org/10.1186/s40623-017-0650-2, 2017.
Zhang, C., Chen, W. K., Si, H. J., and Zhao, H. Q.: Intensity rapid evaluation of Maduo M7.4 earthquake in Qinghai Province, 2021, China Earthquake Eng. J., 43, 876–882, https://doi.org/10.3969/j.issn.1000-0844.2021.04.876, 2021.
Zhao, H. Q., Chen, W. K., Zhang, C., and Kang, D. J.: Study on the new method for estimating the intensity of historical large earthquakes, J. Catastrophology, 37, 212–217, https://doi.org/10.3969/j.issn.1000-811X.2022.02.033, 2022a.
Zhao, H. Q., He, S. L., Chen, W. K., Si, H. J., Yin, X. X., and Zhang, C.: A rapid evaluation method of earthquake intensity based on the aftershock sequence: A case study of Menyuan M6.9 Earthquake in Qinghai Province, China Earthquake Eng. J., 44, 432–439, https://doi.org/10.20000/j.1000-0844.20220128002, 2022b.
Zhao, H. Q., Jia, Y. J., Chen, W. K., Kang, D. J., and Zhang, C.: Rapid mapping of seismic intensity assessment using ground motion data calculated from early aftershocks selected by GIS spatial analysis, Geomat. Nat. Haz. Risk, 14, 1–21, https://doi.org/10.1080/19475705.2022.2160663, 2023.