the Creative Commons Attribution 4.0 License.
the Creative Commons Attribution 4.0 License.
 | 26 Jan 2023
Temporal evolution of crack propagation characteristics in a weak snowpack layer: conditions of crack arrest and sustained propagation
Alec van Herwijnen
Grégoire Bobillier
Philipp L. Rosendahl
Philipp Weißgraeber
Valentin Adam
Jürg Dual
Jürg Schweizer
For a slab avalanche to release, we need sustained crack propagation in a weak snow layer beneath a cohesive snow slab – a process we call dynamic crack propagation. Field measurements on crack propagation are very scarce. We therefore performed a series of crack propagation experiments, up to 9 m long, over a period of 10 weeks and analysed these using digital image correlation techniques. We derived the elastic modulus of the slab (0.5 to 50 MPa), the elastic modulus of the weak layer (50 kPa to 1 MPa) and the specific fracture energy of the weak layer (0.1 to 1.5 J m−2) with a homogeneous and a layered-slab model. During crack propagation, we measured crack speed, touchdown distance, and the energy dissipation due to compaction and dynamic fracture (5 mJ m−2 to 0.43 J m−2). Crack speeds were highest for experiments resulting in full propagation, and crack arrest lengths were always shorter than touchdown lengths. Based on these findings, an index for self-sustained crack propagation is proposed. Our data set provides unique insight and valuable data to validate models.
- Article
(3979 KB) - Full-text XML
- BibTeX
- EndNote


To better estimate avalanche release probability, we need to understand how the snow cover fails when a slab avalanche forms. Slab avalanche release is currently understood as resulting from a sequence of fracture processes. First, failure initiation and crack growth to a critical size occurs before rapid crack propagation starts (onset of crack propagation). In the subsequent dynamic crack propagation phase, the crack self-propagates across the slope without the need of additional load. Avalanche release then occurs if the gravitational pull on the slab is great enough to overcome frictional resistance to sliding and to cause cracks at the crown, flank and stauchwall of the forming avalanche (Schweizer et al., 2003).
Avalanche size is a key component to predict the avalanche danger level (Meister, 1995; Statham et al., 2018; Techel et al., 2020). There are essentially two processes that can limit avalanche release size: either (1) dynamic crack propagation stops (crack arrest) and the snow slab releases over the area where the weak layer is cracked or (2) dynamic crack propagation continues into flatter slope regions where subsequently the slab-bed friction prevents slipping of the detached slab (van Herwijnen and Heierli, 2009). In this case, the spatial extent of the avalanche is smaller than that of crack propagation. Spatial confinement of slopes and friction as limiting factors for avalanche size are quite intuitive, whereas reasons for crack arrest in unconfined slopes can be manifold. Unconfined slopes do not abut rock walls or dense forest, and slab thickness does not taper to less than half the mean thickness (Jamieson and Johnston, 1992). Hence, changes in the snowpack are gradual, suggesting an intricate relation between fracture arrest and changes in snowpack properties. Simenhois and Birkeland (2014) investigated crowns and flanks of slab avalanches and suggested five controlling mechanisms for fracture arrest related to snowpack properties. Regarding the weak layer, they proposed fracture resistance and collapse height during fracture to be decisive. For the slab, load (slab thickness and density), elastic modulus and tensile strength were considered crucial. The latter is closely linked to slab tensile failure (slab fracture), an often-stated mechanism causing fracture arrest in the weak layer. Gaume et al. (2015) extended the mechanically based probabilistic model of Gaume et al. (2012, 2014) to analyse which snowpack properties influence slab fracture propensity. They concluded that stiff and thick snow slabs (high tensile strength) are less prone to slab fracture and therefore release larger avalanches, in line with field observations (van Herwijnen and Jamieson, 2007). In addition to the tensile strength of the slab, an experimental and numerical study suggested that elastic modulus and density are relevant for crack arrest (Schweizer et al., 2014). More recently, Bobillier et al. (2023) performed discrete-element simulations and reported elastic moduli of the slab and weak layer and weak-layer shear strength influencing crack propagation propensity and crack speed. Furthermore, Simenhois and Birkeland (2014) encountered avalanches where they did not observe changes in snowpack properties at their boundaries and concluded that there may be other mechanisms they did not identify.
In general, rapid crack propagation occurs when the instantaneous dynamic energy release rate G equals the dynamic fracture energy of the weak layer (Freund, 1990). However, both quantities can be altered by the speed of the propagating crack. Thus, the speed of propagating cracks affects (Lee and Prakash, 1998) and is therefore a decisive parameter for crack arrest problems (Freund, 1990). For avalanches, this suggests that if the dynamically released energy of the slab falls below the dynamic weak-layer specific fracture energy, crack propagation will halt and the size of the slab avalanche is determined.
Despite the importance of crack speed in weak snowpack layers, there are not many substantiated crack speed values to be found in the literature. The first crack speed measurement in snow was reported by Johnson et al. (2004). They triggered a crack in flat terrain, measured snow surface velocity with seismic sensors and determined a mean propagation speed of 20 ± 2 m s−1 over a propagation distance of ∼ 8 m. Since then, many studies have estimated crack speeds from propagation saw tests (PSTs), a standard fracture mechanical field experiment for snow (Gauthier and Jamieson, 2006; Sigrist and Schweizer, 2007). These studies used particle-tracking velocimetry to measure slab displacement, from which crack speed was derived. In PSTs, crack speeds ranged from 10 to 50 m s−1 (van Herwijnen and Jamieson, 2005; Birkeland et al., 2014; van Herwijnen et al., 2016). However, the typically 2–3 m long PST experiments are rather small tests, possibly not representative of slope scale crack propagation in avalanches. While the one-dimensionality of crack propagation along PST columns seems not be altering crack propagation speed (Bergfeld et al., 2022), crack propagation in PSTs of typical size is affected by edge effects (Bergfeld et al., 2021; Bair et al., 2014).
At the slope scale, van Herwijnen and Schweizer (2011) derived a speed of 42 ± 4 m s−1 over a distance of 60 m using seismic sensors deployed in an avalanche starting zone. To estimate crack speed, they determined the time difference between the first arrival of the signal generated by weak-layer fracture and the signal from the actual release of the avalanche and assumed the propagation distance to be the width of the avalanche. Based on videos of avalanches, Hamre et al. (2014) reported widely varying crack speed estimates ranging from 18 to 428 m s−1. Bergfeld et al. (2022) improved the methodology and estimated crack speeds by evaluating 14 crack paths in an avalanche video recording, resulting in crack speeds between 23 and 44 m s−1 (mean: 36 ± 6 m s−1) covering distances from 26 to 440 m. In addition to these experimental studies, Trottet et al. (2022) performed numerical simulations based on the material point method (Gaume et al., 2018b) and reported the existence of a transition from sub-Rayleigh anticrack to supershear crack propagation. While sub-Rayleigh anticrack propagation can explain crack speeds below 100 m s−1, the transition to supershear crack propagation (a crack propagating faster than the shear wave speed in the slab) potentially also explains the high crack speeds reported by Hamre et al. (2014).
While these studies are valuable contributions, a better understanding of the condition when the snowpack supports self-sustained crack propagation in the weak layer requires measuring crack speed and crack propagation distance in combination with detailed snowpack properties. However, a data set with crack propagation speeds on scales larger than the typical 2 m long PSTs together with in situ measured mechanical properties of the snowpack is not yet available. Furthermore, the assumption that crack speed is related to the propensity of a snowpack to promote self-sustained crack propagation stems from theoretical considerations, but experimental evidence is lacking.
The objective of this work is, first, to relate the crack speed in weak snowpack layers to the propensity of the snowpack to promote self-sustained crack propagation and, second, to provide an index for evaluating the propensity for self-sustained dynamic crack propagation that can be derived from manual and simulated snowpack profiles.
Therefore, we conducted a series of very long PST experiments (up to 10 m long) over the entire life cycle of a weak layer, involving very different states of the snowpack. High-speed videos of these experiments were analysed with image correlation techniques to estimate crack propagation characteristics, such as crack speed and crack propagation distance. In addition, mechanical properties of the weak layer and slab, as well as specific fracture energy of the weak layer, were estimated using two mechanical models. Furthermore, we suggest an estimate of dynamic fracture energy, which we call the dissipation of dynamic fracture, by separating the work done in the weak layer ahead of and behind the crack tip. In the end, our data set provides insight into which snowpacks promote self-sustained crack propagation and how propagation propensity can be estimated from measured or simulated snowpack profiles.
2.1 Field site and snowpack measurements
From 4 January to 19 March 2019, we performed 24 propagation saw tests (PST, column width: 30 cm) on 22 field days on a flat and uniform site near Davos, Switzerland (Fig. 1a), located on the roof of a building in a forest opening, protected from wind. The nearby creek, together with the cold concrete roof (snow–concrete interface usually colder than −5 ∘C), foster the growth of surface hoar. In addition, direct sunlight does not reach the field site until the end of February. These factors make the site an ideal outdoor laboratory for crack propagation experiments under relatively controlled snowpack conditions. In all PSTs, we tested the same weak layer, consisting of surface hoar (g, 10–15 mm, crystal size and weak-layer thickness) that had formed during multiple days at the end of December 2018 (Fig. 1b, red area). This layer of surface hoar was buried by consecutive snowfalls at the beginning of January 2019. Slab thickness increased over the measurement period (Fig. 1b, blue line), and slab layers mainly consisted of fresh snow (+), decomposing and fragmented precipitation particles (), and rounded grains (•). On every field day, we characterized the snowpack with a manual snow profile following Fierz et al. (2009). To measure snow density, we used a 100 cm3 cylindrical density cutter (38 mm diameter). To assess snowpack variations along the PSTs, we performed snow micro-penetrometer (SMP) measurements approximately every 50 cm. Generally, variations in penetration resistance along the PST column were small.
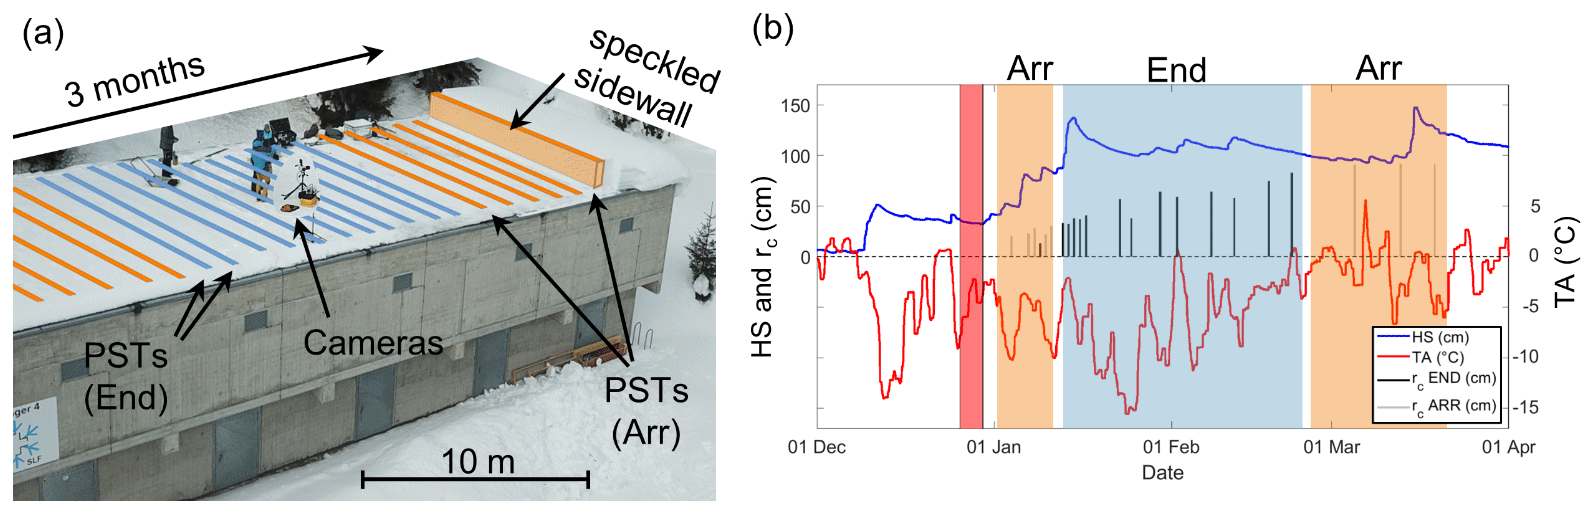
Figure 1(a) Field site where we performed numerous propagation saw tests (PSTs) resulting in either full propagation (“End”, blue) or crack arrest (“Arr”, orange). (b) Temporal evolution of snow height (HS), air temperature (TA) and critical cut length (rc). The tested weak layer consisted of surface hoar which had formed at the end of December (red region). After burial, PSTs initially resulted in crack arrest (orange background) before cracks propagated to the very end (blue background). In late February, air temperature (red line) increased above zero and PSTs resulted in cracks arrest again (orange). During the 3-month period, snow height (blue curve) increased and critical cut lengths (black and grey vertical lines) increased as well.
2.2 PST experiments
One sidewall of each PST experiment was recorded with two cameras. We used a high-speed camera (Phantom, VEO710, horizontal resolution: 1280 pixels) to investigate crack propagation across the PST, and we used a second camera (Sony RX100 V, 1920 × 1080 pixel2, 50 fps; frames per second) to capture slab deformation prior to crack propagation, when we cut the weak layer with a 2 mm thick snow saw. The side wall of the PST was speckled with black ink (Indian ink, Lefranc & Bourgeois) to enhance the contrast for digital image correlation (DIC) analysis. Both cameras were aligned perpendicular to the centre point of the PST beam. Camera distortion correction, DIC analysis and pre-processing (pixel-to-metre conversion, identifying slab, weak layer and substratum) were done as described in Bergfeld et al. (2021). Camera settings (Table A1) and settings for the DIC analysis (Table A2) are given in Appendix A.
The DIC analysis of the recorded high-speed videos provided us with the vertical (wexp) and horizontal (uexp) displacement fields of the PST sidewall with time. Time resolution is given by the frame rate of the recordings (3000–22 000 for the high-speed camera; see Table A1). Spatial measurement resolution (6–27 mm) is given by the step size of the subsets used for DIC analysis (see Table A2) and the pixel-to-metre conversion factor (see Table A1). In a further pre-processing step, we calculated time derivatives from high-speed displacement fields to obtain velocity (, ) and acceleration (, ) of the slab.
2.3 Location of the snow saw
Prior to crack propagation, the location of the snow saw indicates the crack length which is required to determine the energy release rate. Hence, crack length is a crucial parameter required for all frames. To accurately determine the position of the snow saw, we therefore mounted a black dot onto the tip of the saw. In a post-processing step, we then went through all frames to manually pick the location of the dot, since automated picking proved to be unreliable.
In a PST, it is difficult to keep the snow saw perfectly perpendicular to the direction of the sawing and to saw at a continuous pace. The saw often rotates horizontally, causing an offset between the dot on the saw tip and the actual location of the crack tip. When rotating the saw back to perpendicular, the dot on the saw tip rapidly accelerates, while the crack tip almost remains. We corrected the estimated saw locations for this error by first keeping the cut length constant at times the dot moved backward, and we also smoothed the crack length r(t) to avoid unnatural sharp kinks introduced from rotating the saw back to perpendicular.
2.4 Elastic modulus and specific fracture energy
When cutting the weak layer in a PST, the unsupported slab behind the snow saw bends downwards due to its own weight. Beam models can describe this bending behaviour when elastic parameters of slab and weak layer are known. Inversely, as done by Bergfeld et al. (2021), the elastic parameters can be estimated by comparing experimentally measured horizontal (uexp) and vertical (wexp) displacement fields with predictions of a mechanical model (umod, wmod; Timoshenko beam resting on a Winkler foundation; Rosendahl and Weißgraeber, 2020a). This is done by minimizing the residual ε between both fields:
where the sum is over all DIC subsets (N, measurement points) in the slab.
Here, we followed the same approach but used a more recent model which accounts for slab layering and bending–extension coupling through the weak layer (Weißgraeber and Rosendahl, 2022). Applying the concepts of mechanics of layered composites (Jones, 1999), the constitutive equations of a deforming beam are given by
and link the stiffness quantities of the layered slab A11, B11, D11 and kA55 to the section forces of a free body cut of a differential element of the layered slab. Here N is the normal force, Q is the shear force and M is the bending moment. The shear correction parameter k is . The stiffness quantities are the extensional stiffness A11, the bending stiffness D11, the shear stiffness kA55 and the coupling stiffness B11 which incorporates the bending–extension coupling of an asymmetrically layered slab. These stiffness quantities are obtained using Young's modulus Ei, the shear modulus Gi, Poisson's ratio νi, the thickness Hi and the vertical position in the slab zi for each layer (subscript i).
Data from a manual snow profile provide the thickness and position of each layer, yet Ei, Gi and νi remain unknown. For a typical snow profile, this could easily result in 10 to 50 unknowns. We therefore reduced the degrees of freedom by regarding each layer as isotropic () and setting Poisson's ratio to a constant value of νi = ν = 0.2. Since the elastic modulus strongly correlates with snow density (Shapiro et al., 1997), we used the manually measured densities of each layer ρi to derive Ei using the parameterization suggested by Gerling et al. (2017):
Here, we fixed the factor C0 to the literature value of 6.5 × 10³ MPa (Eq. 6, Gerling et al., 2017). The exponent C1 was made dimensionless with the density of ice (ρice=917 kg m−3) and kept as the free nondimensional fitting parameter to minimize the residual ε (Eq. 1) and estimate the ideal set of input parameters C1 and Ewl. Hence, we accounted for slab layering while limiting the number of degrees of freedom in the optimization. In the following we will call the layered-slab model the LS model.
For comparison, we also treated the entire slab as homogeneous and isotropic. Then Young's modulus E and Poisson's ratio ν of the slab determine the laminate stiffness quantities of
and B11=0 vanishes. We again used a fixed value for Poisson's ratio of ν = 0.25. For the uniform slab, Eq. (1) is used again to estimate the slab and weak-layer Young's moduli Esl and Ewl, respectively. The model assuming a uniform slab we will call the HS model.
With the elastic modulus of the weak layer and the stress field for the critical cut length rc determined, the weak-layer fracture energy wf was obtained by
with
and
where GI and GII are the contributions from mode I and mode II, respectively; h is the thickness of the weak layer; and σwl(r=rc) and τwl(r=rc) are the compressive and shear stress in the weak layer at the crack tip, respectively.
We directly followed the methodology of Bergfeld et al. (2021) but used the above, more recent mechanical model which allows for slab layering and also overcomes a limitation of the model applied by Bergfeld et al. (2021). Their model conceptualized the weak layer as a set of smeared springs which are attached to the mid-surface of a homogeneous slab. That, however, forced the mode II energy release rate GII in our flat-field PSTs to be zero as also the horizontal displacement at the crack tip umod (x=rc, z=zwl) is zero.
2.5 Crack speed
To compute crack speed during propagation, we followed the method suggested by Bergfeld et al. (2021). They applied a threshold of 5 times the standard deviation of the noise in z displacement before crack propagation to the z displacement of the slab to locate the crack tip at each time step (video frame). Having crack tip location and time, crack speed was estimated as the first derivative of linear fits of crack tip location with time in overlapping beam sections. A detailed description of the applied methodology, including uncertainty estimates, is given in Bergfeld et al. (2021). Computing the mean crack speed of a PST was done by manually defining a range which excludes edge effects (Fig. 2, length of the black dashed lines in the grey area). Edge effects were mainly found at the sawing and the far end of the column for PSTs resulting in full propagation or near the crack arrest point within the column for PSTs resulting in crack arrest.
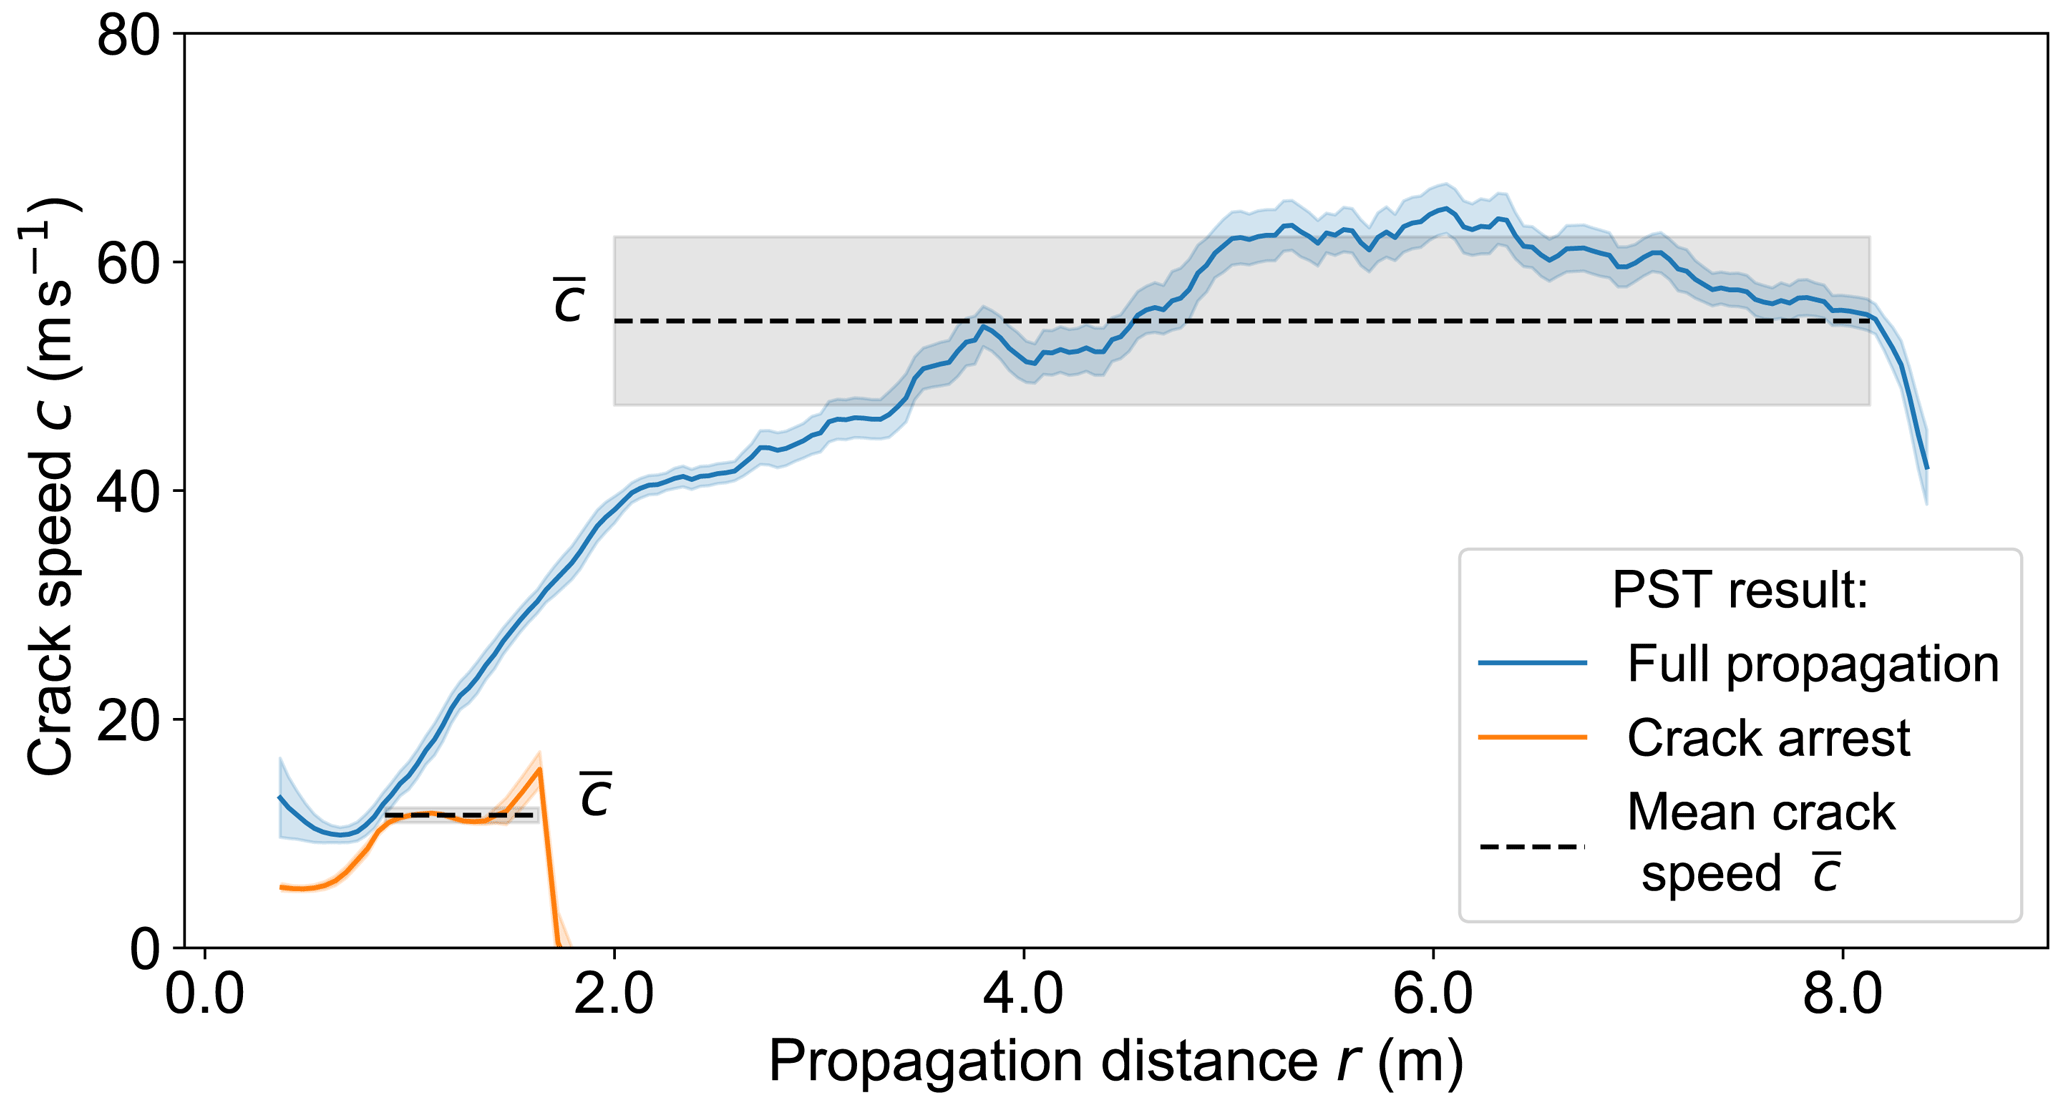
Figure 2Crack speed in two exemplary PST experiments: one PST with full propagation (blue) and the other with an arresting crack (orange). The transparent regions indicate the uncertainty. For each PST a range was manually defined in which crack speed was not influenced by edge effects (length of the black dashed lines in the grey area). Within this range, the mean (value of the dashed black line) and standard deviation (transparent region) were computed.
2.6 Touchdown distance and crack arrest length
For PSTs resulting in full propagation, the touchdown distance λ was defined as the distance between the part of the slab which is still at rest (ahead of the crack tip) and the part which is again at rest after weak-layer collapse. To estimate λ, we followed Bergfeld et al. (2021) by applying a threshold to the downward velocities of the slab to approximate the distance in which the slab subsides during crack propagation. For each PST resulting in full propagation, the touchdown distance was estimated in every time step. To derive an average touchdown distance of the experiment, we computed the arithmetic mean and used the corresponding standard deviation as the uncertainty.
For PSTs resulting in crack arrest, the length of crack propagation was determined by applying a threshold (the standard deviation of vertical displacements along the PST beam at t=0) to the final vertical displacement. We also used a threshold 3 times larger than the initial one, and the difference to the initial estimate served as uncertainty.
2.7 Crack propagation model
The speed and touchdown distance of propagating cracks in flat terrain were analytically described by Heierli (2005). In principle, Heierli (2005) followed Johnson et al. (2004), who measured a crack propagation speed in flat terrain and described their measurements as a flexural wave in the slab. Hence, Heierli (2005) modelled weak-layer cracking as a localized disturbance zone (touchdown distance) propagating as a flexural wave with constant speed cfw and touchdown distance λfw:
where g is the gravitational acceleration, wmax is the collapse height, D11 is the flexural stiffness (see Eq. 6), ρ is the mean slab density, H is the slab thickness, ν is Poisson's ratio (0.25 ± 0.05) and γ ≈ 2.331 is a factor between touchdown distance and wavelength of the “solitary fracture wave” (Eq. 7b in Heierli, 2005). Uncertainties for modelled crack speed and touchdown distances stem from uncertainties of the required snowpack parameters which we propagated through Eqs. (9) and (10).
2.8 Dissipation of dynamic fracture and compaction
The process of a propagating closing crack (also called anticrack) can be seen as illustrated in Fig. 3. Ahead of the crack tip, in undisturbed parts of the slab (region I in Fig. 3) a beam section (exemplified in Fig. 3) is fully supported by the weak layer. The slab–weak-layer system is in a static configuration (Figs. 3 and 4a, region I). From a microstructural perspective, the weak-layer support comes from “load chains”, e.g. single ice structures carrying small portions of the overall static load of the beam section. As the crack tip approaches, load chains in the weak layer, below a beam section, consecutively fail. The beam section starts to displace downward (Figs. 3 and 4a, region II). Subsequently, the advancing downward movement further breaks weak-layer bonds, but with closer packing it also builds up an increasing number of new bonds in the weak layer (Figs. 3 and 4a, region III). Hence, during this compaction phase the supporting force of the weak layer increases and brings the beam section back to rest (Figs. 3 and 4a, region IV).
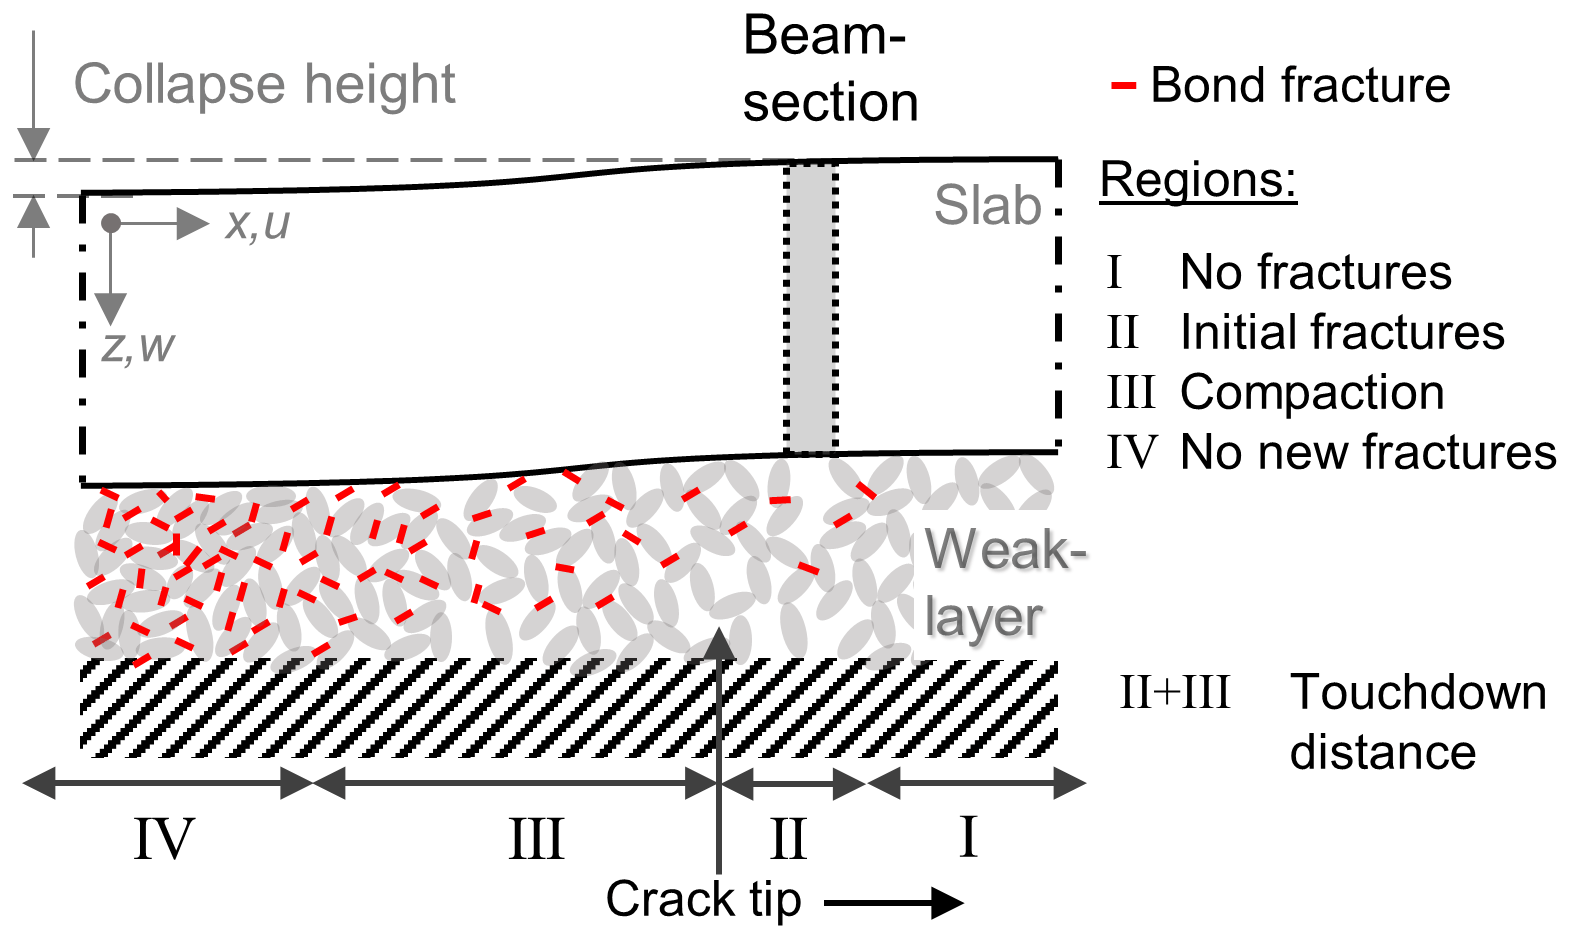
Figure 3Schematic representation of a running crack in our flat-field PST experiments. The crack tip propagates from left to right. In region I, weak-layer bonds are not yet fractured, while in region IV all weak-layer bonds are broken (red lines). Region II is the fracture process zone, extending from the first bond fractures to the crack tip. In region III, the slab further subsides, causing the weak-layer structure to fracture multiple times before closer packing of the weak layer is achieved and the slab comes to rest again.
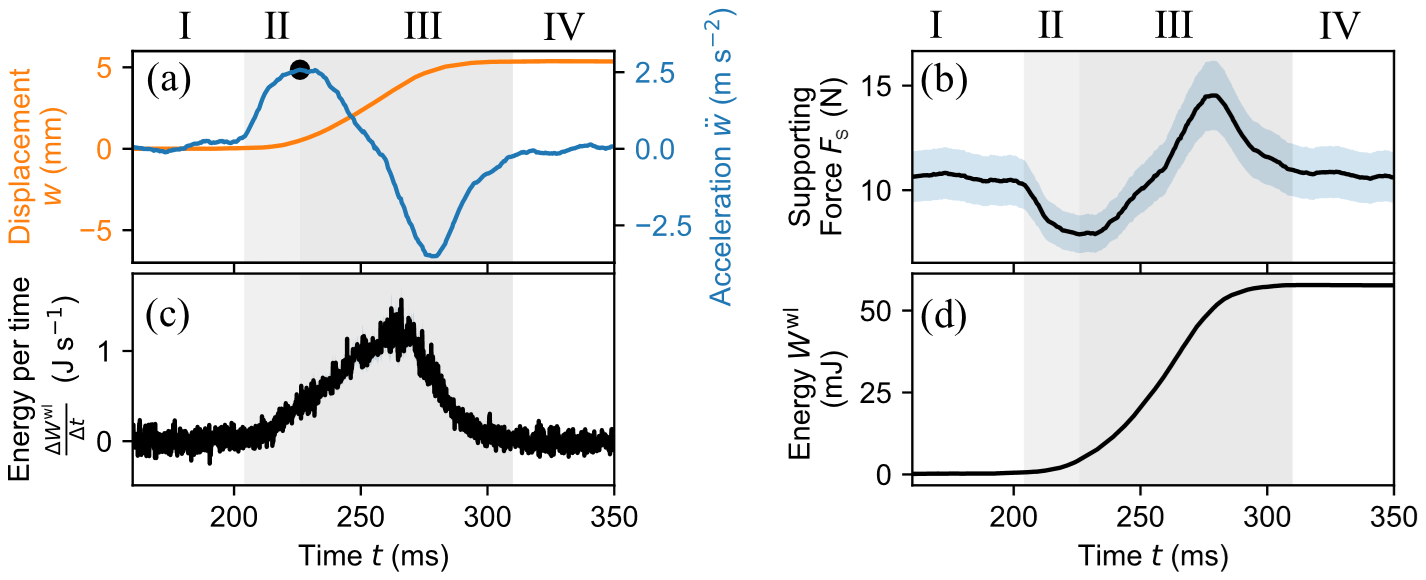
Figure 4(a) Vertical displacement w (orange) and acceleration (blue) with time for a beam section in a PST experiment. (b) Supporting force Fs with time. (c) The power which destroys the weak layer as the beam section displaces. (d) The total work Wwl(t) done to fracture (region II) and compact (region III) the weak layer. The grey-shaded backgrounds separate regions I to IV defined in Fig. 3.
Comparing this schematic process of a closing crack with an opening crack (e.g. normal mode I crack), the energy needed to fracture the weak layer in region II seems to be analogous to the specific dynamic fracture energy of opening cracks. For opening cracks, energy dissipation in the weak layer originates only from crack growth and associated physical processes such as surface creation and localized plastic deformation. A closing crack, however, dissipates additional energy behind the crack tip due to secondary fractures and friction during the compaction phase (region III). That is, there are two sources of energy dissipation. The latter we call the dissipation of compaction. The energy required to form the crack in the fracture process zone (region II) is the dissipation of dynamic fracture.
Assuming that the slab and substratum are in the same stress state before and after crack propagation, the slab and substratum contain the same amount of strain energy. This assumption cannot easily be verified, but within the limits of our measurement uncertainty, we did not observe residual strain in the slab and substratum. Hence, it is reasonable to assume that the total energy dissipated in the weak layer (dissipation of dynamic fracture and compaction) equals the released gravitational potential energy of the slab plus the elastic potential energy of the weak layer.
To separate the dissipation of dynamic fracture from the compaction part, we considered small beam sections within the slab of the PST (Fig. 3, grey area in the slab). Every beam section is regarded as behaving like a free body, not attached in the structural compound.
As the crack tip separates the fracture process zone and the compaction zone, an estimate of the location of the crack tip is required. Unlike the crack tip definition in Sect. 2.3, we now follow the schematic process of crack propagation and define the crack tip as the point where all initial load chains failed and there is virtually no support yet of new contacts; it is the point where the downward acceleration of the beam section is highest. It was confirmed by numerical simulations that this crack tip definition is equivalent to other definitions of crack tip (see Appendix C).
We define the time t0 where the peak in the acceleration is reached as the time the crack tip is at the beam section. Everything before t0 is attributed to the initial fracture (dissipation of dynamic fracture), while everything after t0 is part of the compaction phase (dissipation of compaction).
Considering the displacement of the beam section, initially it is at rest with zero displacement (Fig. 4a, t≤205 ms). The supporting force Fs is then equal to the gravitational force Fg, induced by the weight of the beam section. Shortly before the crack tip reaches the beam section (Fig. 4b, region II), the supporting force Fs decreases and equals the difference between the gravitational force and the acceleration force Fa of the beam section:
where m is the mass of the beam section. For t>t0, in region III, the weak layer is compacted and slab support increases. When (Fig. 4b), the slab decelerates before coming to rest again for t>310 ms (Fig. 4a).
In each time step Δt, the beam section displaces by Δw. This means that during Δt the work ΔEwl done to destroy the weak layer along Δw can be computed as
Summing up the increments ΔWwl provides the total work Wwl(t) a beam section did to fracture and compact the weak layer (Fig. 4d).
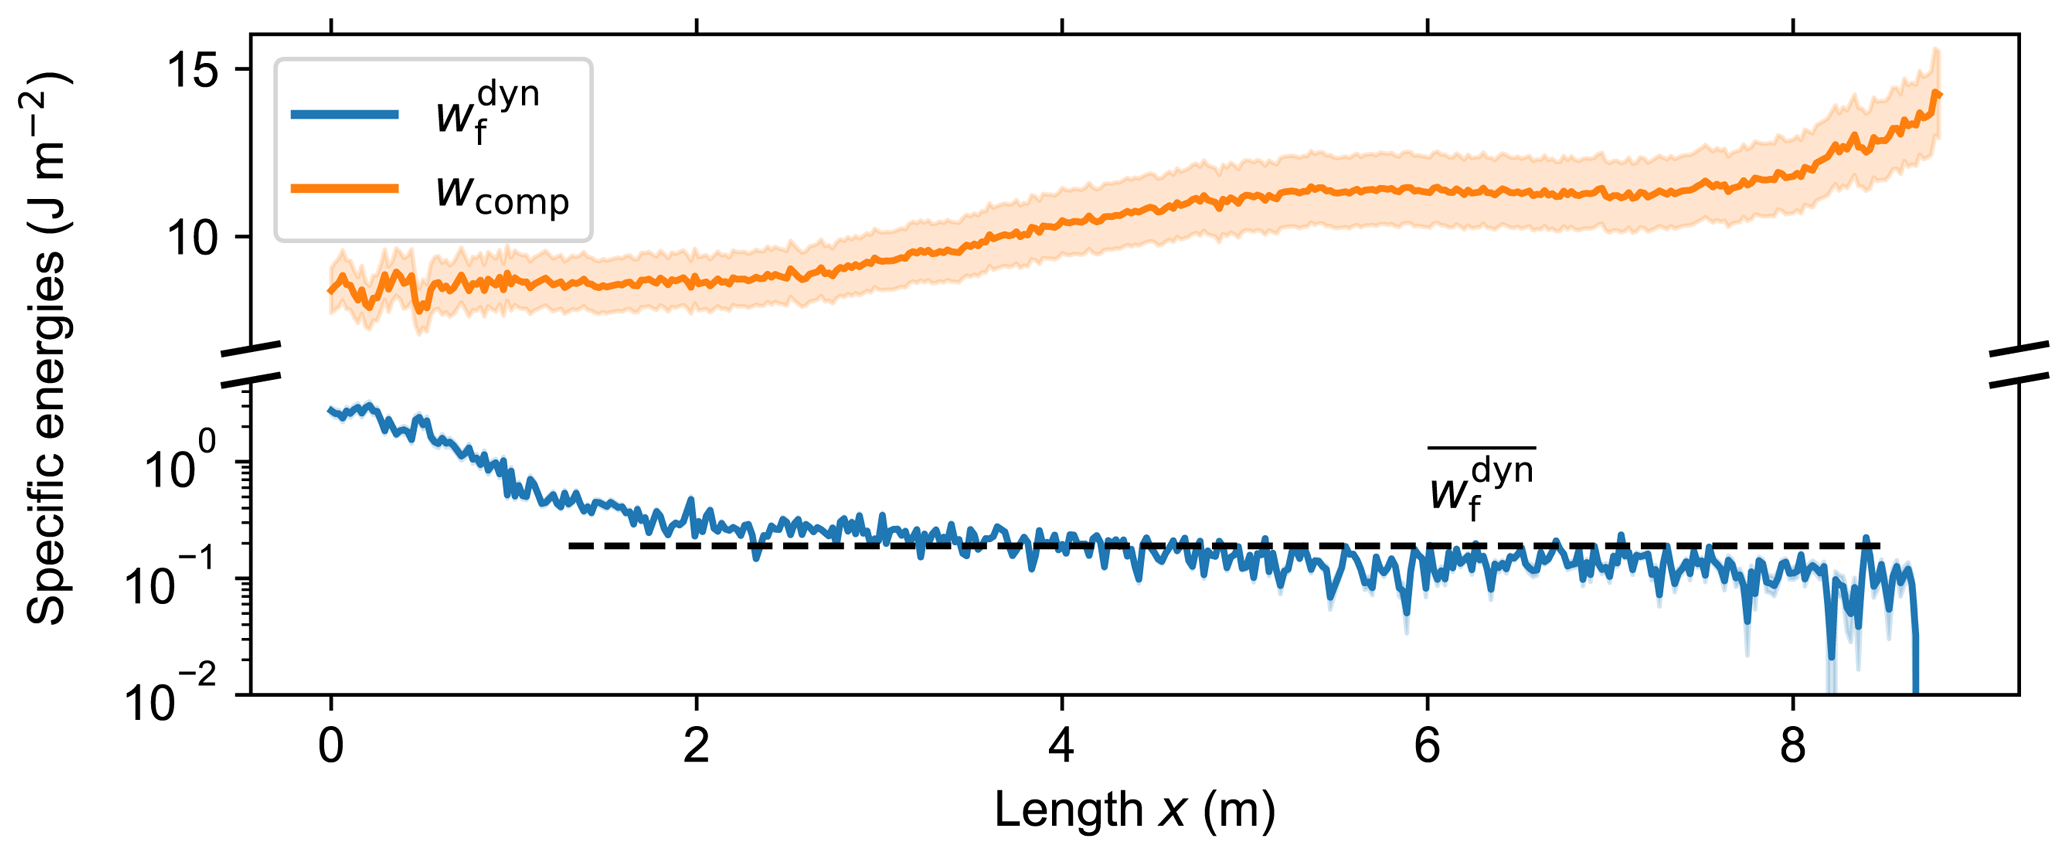
Figure 5Specific dissipation of dynamic fracture (blue) and specific dissipation of compaction (orange) over the entire crack propagation length in a PST experiment.
Separating the work done in region II and III provides the work done to initially fracture the weak layer in the fracture process zone Wfrac(x) from the work done to subsequently compact the weak layer Wcomp(x). Both depend on the x location of the beam section and on the width b and length l of the beam section, where A=b l is the area of the beam section which is in contact with the weak layer. Therefore, we define a specific dissipation of dynamic fracture and a specific dissipation of compaction as (Fig. 5).
To neglect edge effects from both ends of the PST column, we manually picked a distance along the column where the specific dissipation of dynamic fracture was almost constant (Fig. 5, black dashed line) and computed the mean specific dissipation of dynamic fracture for this distance. Uncertainties in displacement and acceleration of beam sections prior to crack propagation were estimated as the standard deviation. The uncertainties were propagated through Eqs. (11) to (13) using Gaussian error propagation.
On 4 January 2019, the slab was shallow and soft, and it broke while cutting the weak layer in the PST. During the next 5 field days, slab thickness and density increased with consecutive snowfalls, and PST results changed from crack arrest to full propagation. This full propagation period lasted around 1 month, from mid-January to mid-February. Subsequently, PSTs resulted in crack arrest again. Within the measurement period, the critical cut length increased from 20 to 90 cm, slab thicknesses ranged between 23 and 109 cm, and mean slab density increased from around 110 to 360 kg m−3 (Table 1).
Table 1Overview of the 24 propagation saw tests (PSTs) performed between 4 January and 19 March 2019. For each test the propagation result, the critical cut length, the PST column length, slab thickness and mean slab density are given. Values in brackets indicate uncertainties.
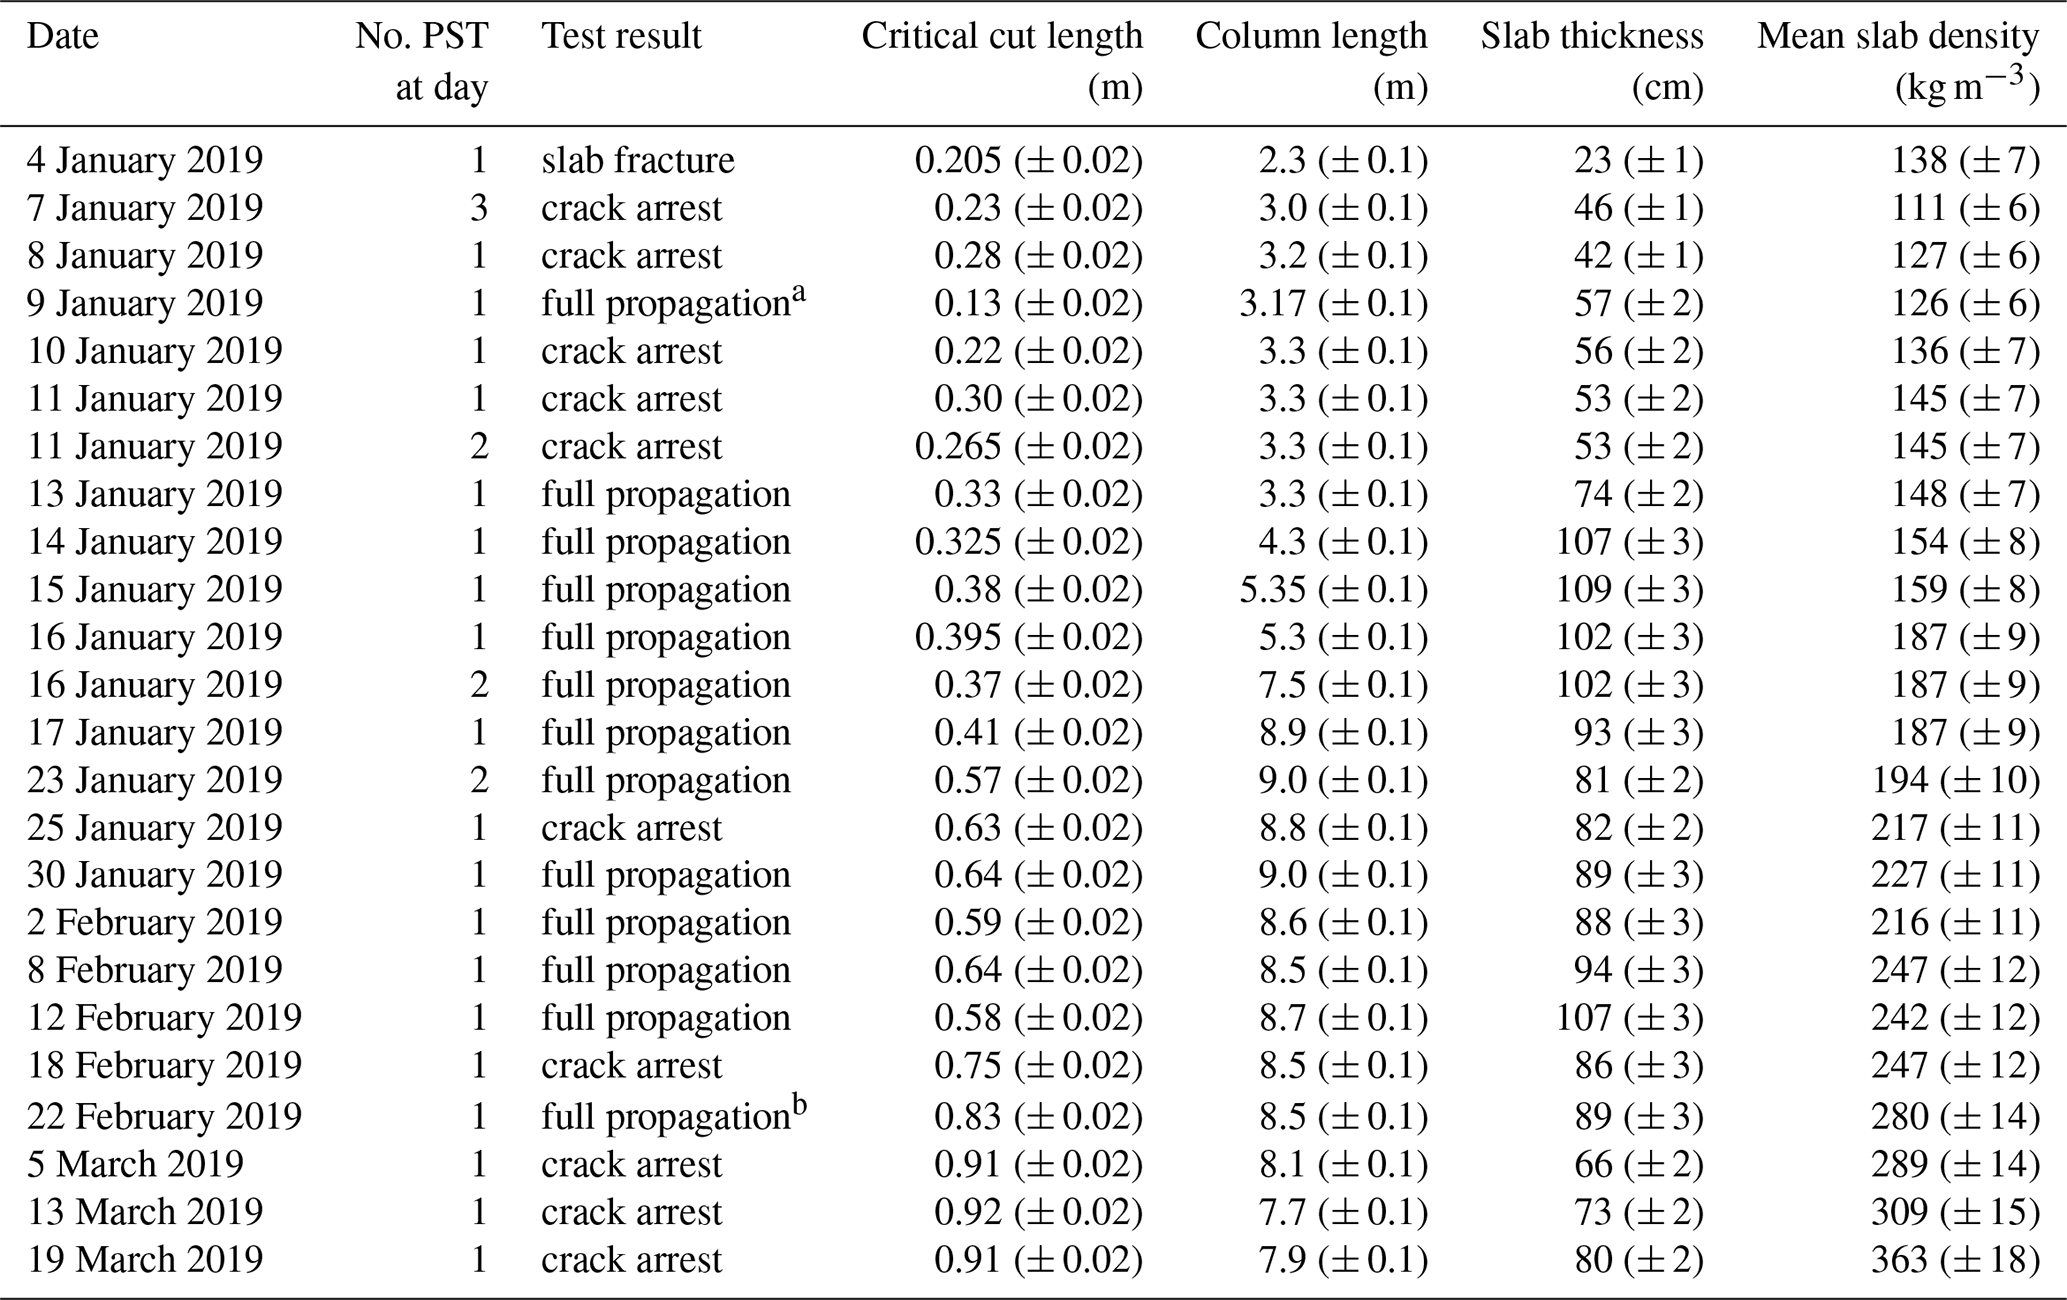
a From the video analysis the test result “full propagation” can be attributed to an insufficient column length. b The PST was excavated in a way that the column width at the height of the weak layer was only about 20 cm (at an x location of 4 m). The analysis of the video revealed that the crack was about to arrest before it started to propagate again at about x = 4 m. We therefore suspect the propagation would have resulted in “arrest” with a more precise cutting of the PST column.
3.1 Elastic modulus and specific fracture energy
Using a beam-bending model (see Sect. 2.2) we estimated the slab elastic properties and weak-layer specific fracture energy in our PST experiments. We used two models, one with a homogeneous slab (HS model) represented with an effective elastic modulus and one that accounted for slab layering (LS model) according to the manual density profile.
Overall, modelled and measured displacement fields matched better when the slab layering was accounted for, although the differences in residuals were not significant (Fig. 6). In the LS model, flexural and tensional stiffness of the slab are coupled. In our flat-field experiments, however, tensile slab loading (horizontal deformation) is much smaller compared to the vertical deformations induced by slab bending. Hence, the optimization of slab elastic properties is dominated by the vertical displacements. For the HS model, we thus mostly estimated a flexural elastic modulus rather than Young's modulus. Most modulus–density parameterizations from the literature stem from experiments with different loading conditions. Since in our experiments the deformation is mostly flexural, the estimated flexural-like elastic modulus is, most likely, a better estimate to describe the slab behaviour than a density parameterization from the literature. In the end, the effect of layering, coming along with tension–bending coupling, gains importance for slope experiments, which are not within the scope of the present work. Furthermore, using the different stiffnesses and coupling parameters of the LS model to estimate crack propagation characteristics (e.g. crack speed, touchdown distance) is not viable since a crack propagation model incorporating a layered slab does not exist yet. Nevertheless, the results of the LS model (stiffnesses and coupling parameters) are provided in Appendix B.
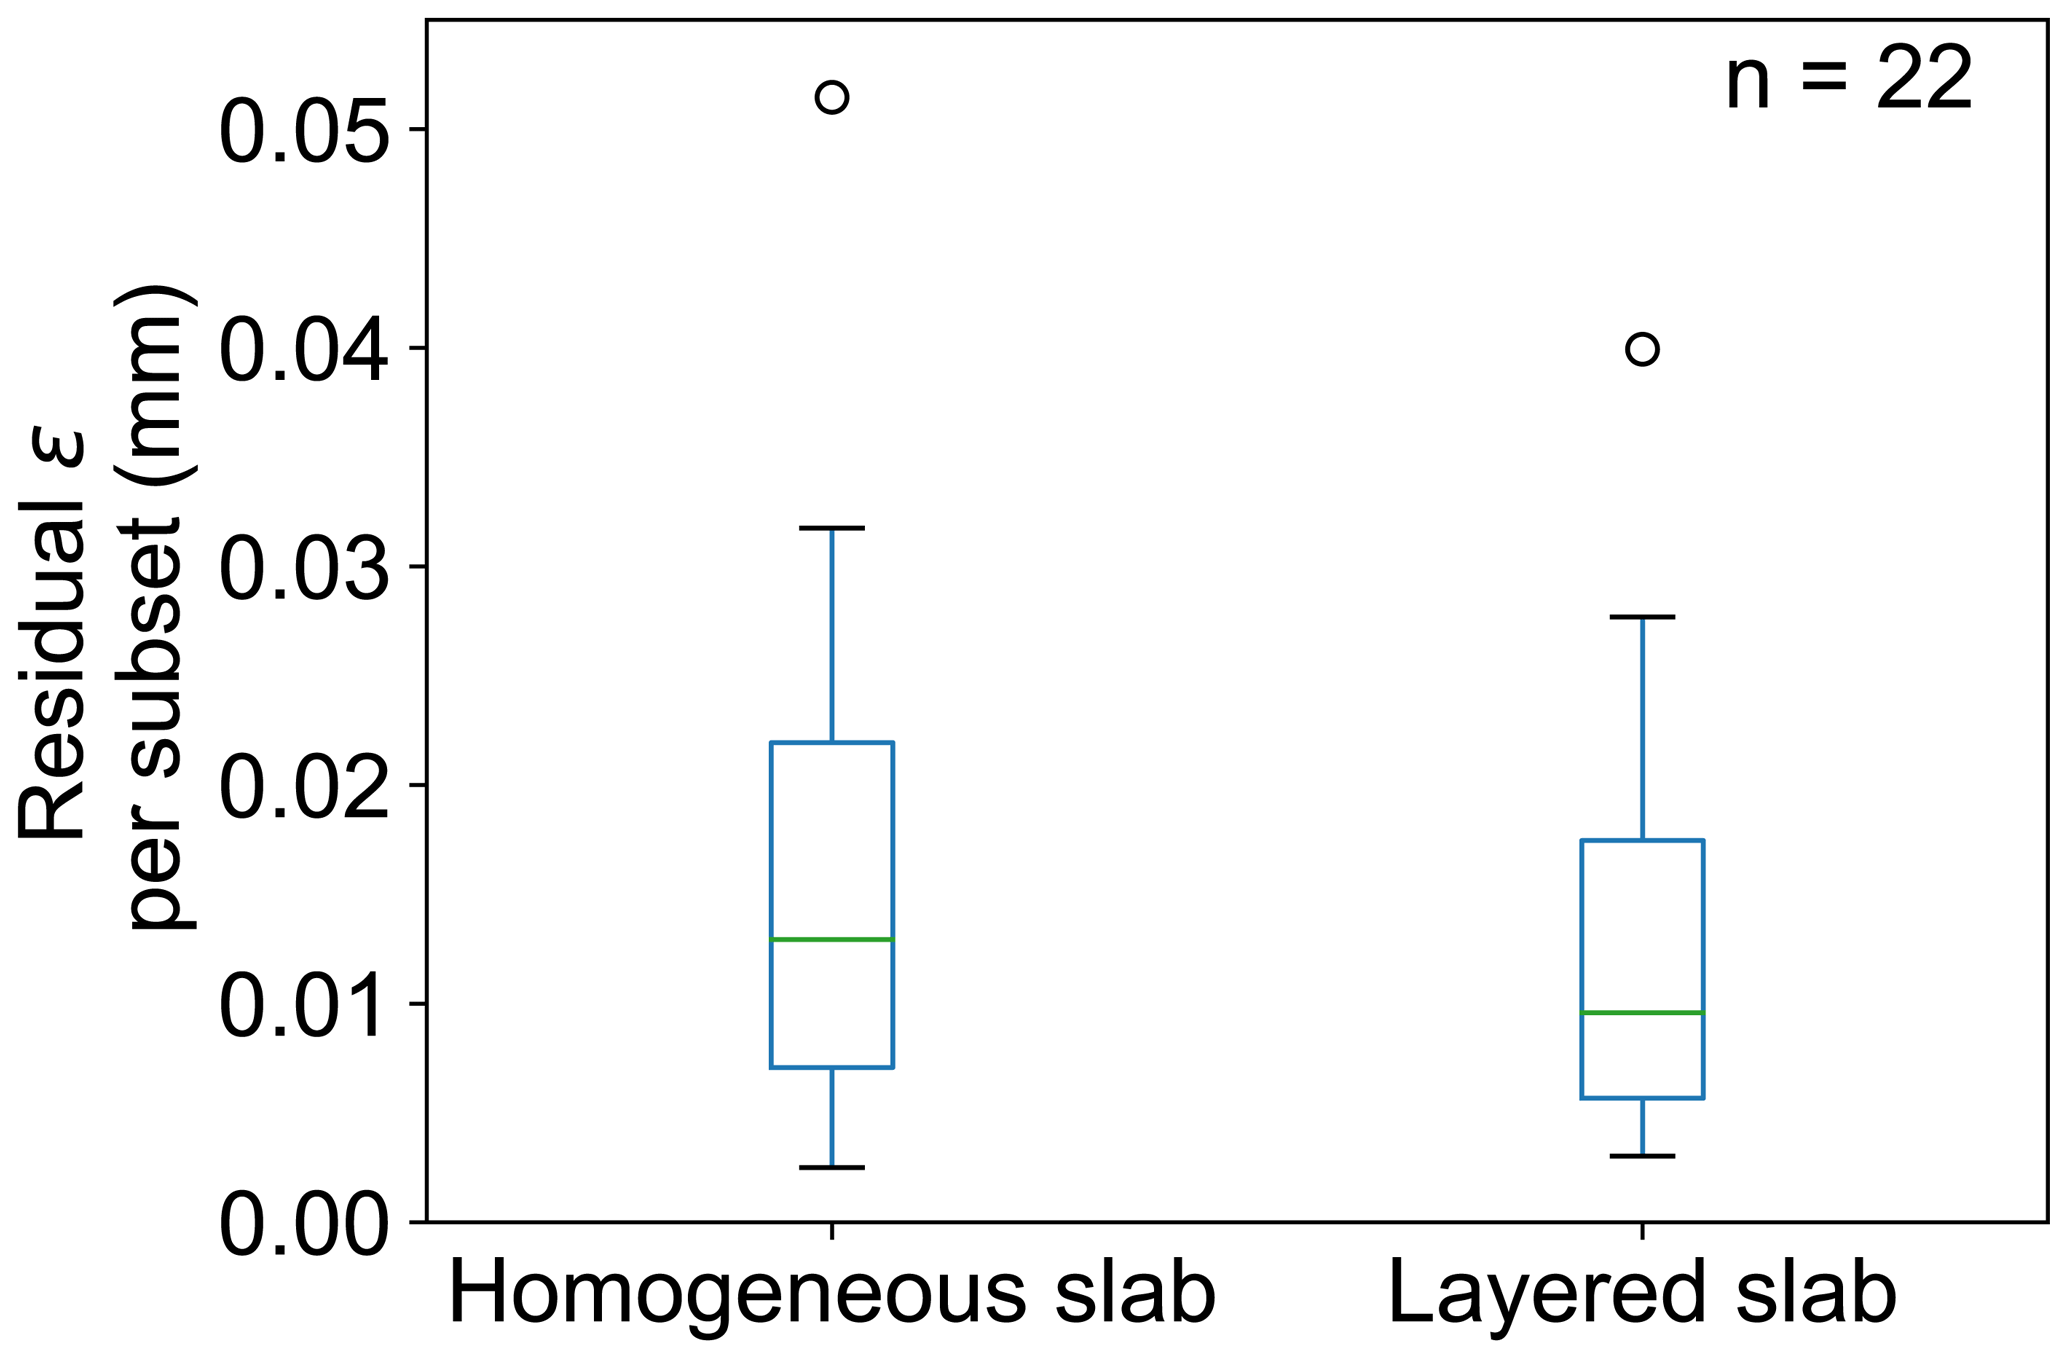
Figure 6Distribution of the residuals between the modelled and measured displacement field at the critical cut. The residual is given as an average over all grid points (DIC subsets). Hence, the residual ε from Eq. (1) was divided by the corresponding number of grid points. The green line indicates the median, and the box represents the interquartile range (first to third quartile).

Figure 7(a) Evolution of effective elastic modulus of the slab Esl (blue dots) and slab thickness (grey line) with time. (b) Elastic modulus of the weak layer Ewl (dots) with time. Blue dots show results for the homogeneous slab model, and brown dots show those for the layered-slab model. Error bars indicate the measurement uncertainty. Solid dots indicate that the elastic modulus of the weak layer Ewl did converge within the boundaries given in the optimization routine. Hence, Ewl was estimated. If Ewl did not converge, it was kept at the upper boundary of 2 MPa.
Using the HS model, in January the effective elastic modulus of the slab Esl rapidly increased by a factor of 20, from 0.5 to 10 MPa. Thereafter, it was rather constant in February and slightly increased towards the end of our measurement period in March (Fig. 7a, blue dots). Increases in Esl corresponded to increases in slab thickness H during this period (Fig. 7a, grey line).
During the consecutive snowfalls in the beginning of January, the elastic modulus of the weak layer Ewl rapidly increased by a factor of 10, from around 50 kPa to 0.5 MPa. Afterwards, the increase was less pronounced and peaked in March at around 1 MPa (Fig. 7b, dots). Using the LS model, the obtained Ewl values were generally about 30 % lower (compare brown and blue dots in Fig. 7b).
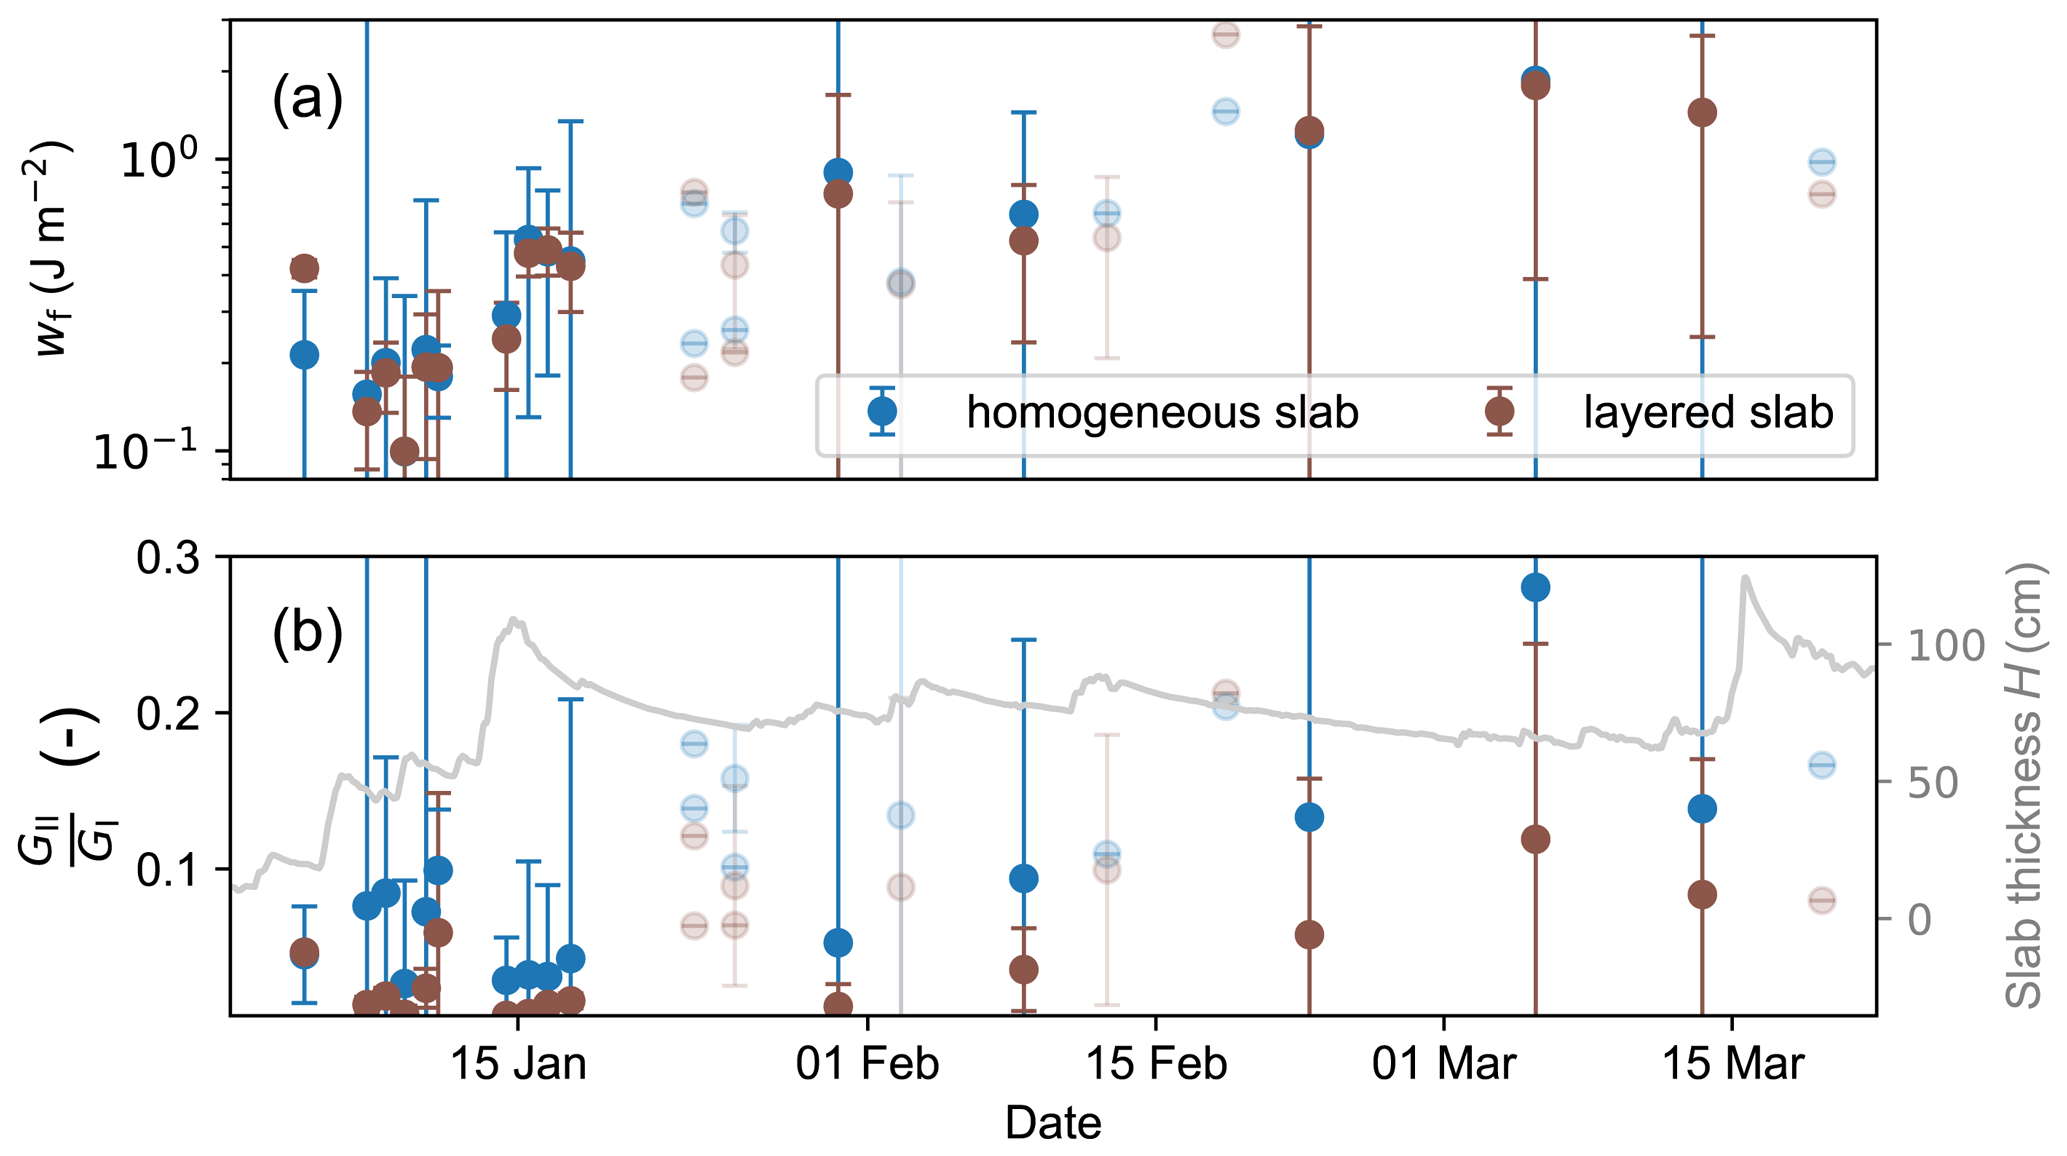
Figure 8(a) Evolution of weak-layer fracture energy wf with time. In general, the layered-slab model (brown dots) provided slightly lower estimates of fracture energy compared to the homogeneous slab model (blue dots). (b) Ratio of mode I to mode II energy release rates with time. Compared to the layered model (brown dots), the homogeneous slab model (blue dots) attributed more fracture energy to the shear mode (GII), resulting in higher ratios (). The layered-slab model (brown dots) was less sensitive to changes in slab thickness (grey line). Again, the transparent dots correspond to experiments in which the elastic modulus of the weak layer Ewl did not converge within the boundaries given in the optimization routine, and error bars indicate uncertainty.
Weak-layer specific fracture energies wf estimated with both models were in the same range (between 0.1 and 1.5 J m−2) and generally exhibited an increasing trend with time (Fig. 8a). The initial increase was stronger. On average, the increase was 0.02 J m−2 per day. Overall, the LS model predicted 22 % lower wf values than the HS model. Larger differences between both models were observed in the mode composition of the fracture energy (Fig. 8b). Throughout the measurement series, the ratio between the shear (GII) and the compressive (GI) component of the fracture energy () was substantially lower with the LS model, on average 51 %.
3.2 Dissipation of dynamic fracture and compaction
On average, the specific dissipation of compaction was 30 times higher than the specific dissipation of dynamic fracture, indicating that the majority of the energy is used for weak-layer crushing and not for advancing the crack in the weak layer (Fig. 9a and b, respectively). The specific dissipation of dynamic fracture generally increased with time. On 7 January it was 5 ± 16 × 10−3 J m−2, and at the end of the measurement series on 19 March it was 0.43 ± 0.19 J m−2 (Fig. 9a). These values were in the same range as the static weak-layer specific fracture energy wf (Fig. 8a). Specific dissipation of dynamic fracture did not depend on the outcome of the PST as values from full propagation and crack arrest aligned well in the temporal trend. The specific dissipation of compaction, on the other hand, was significantly lower for PSTs resulting in crack arrest than for PSTs resulting in full propagation (Fig. 9b), on average 2 ± 0.3 and 10.1 ± 0.4 J m−2, respectively.
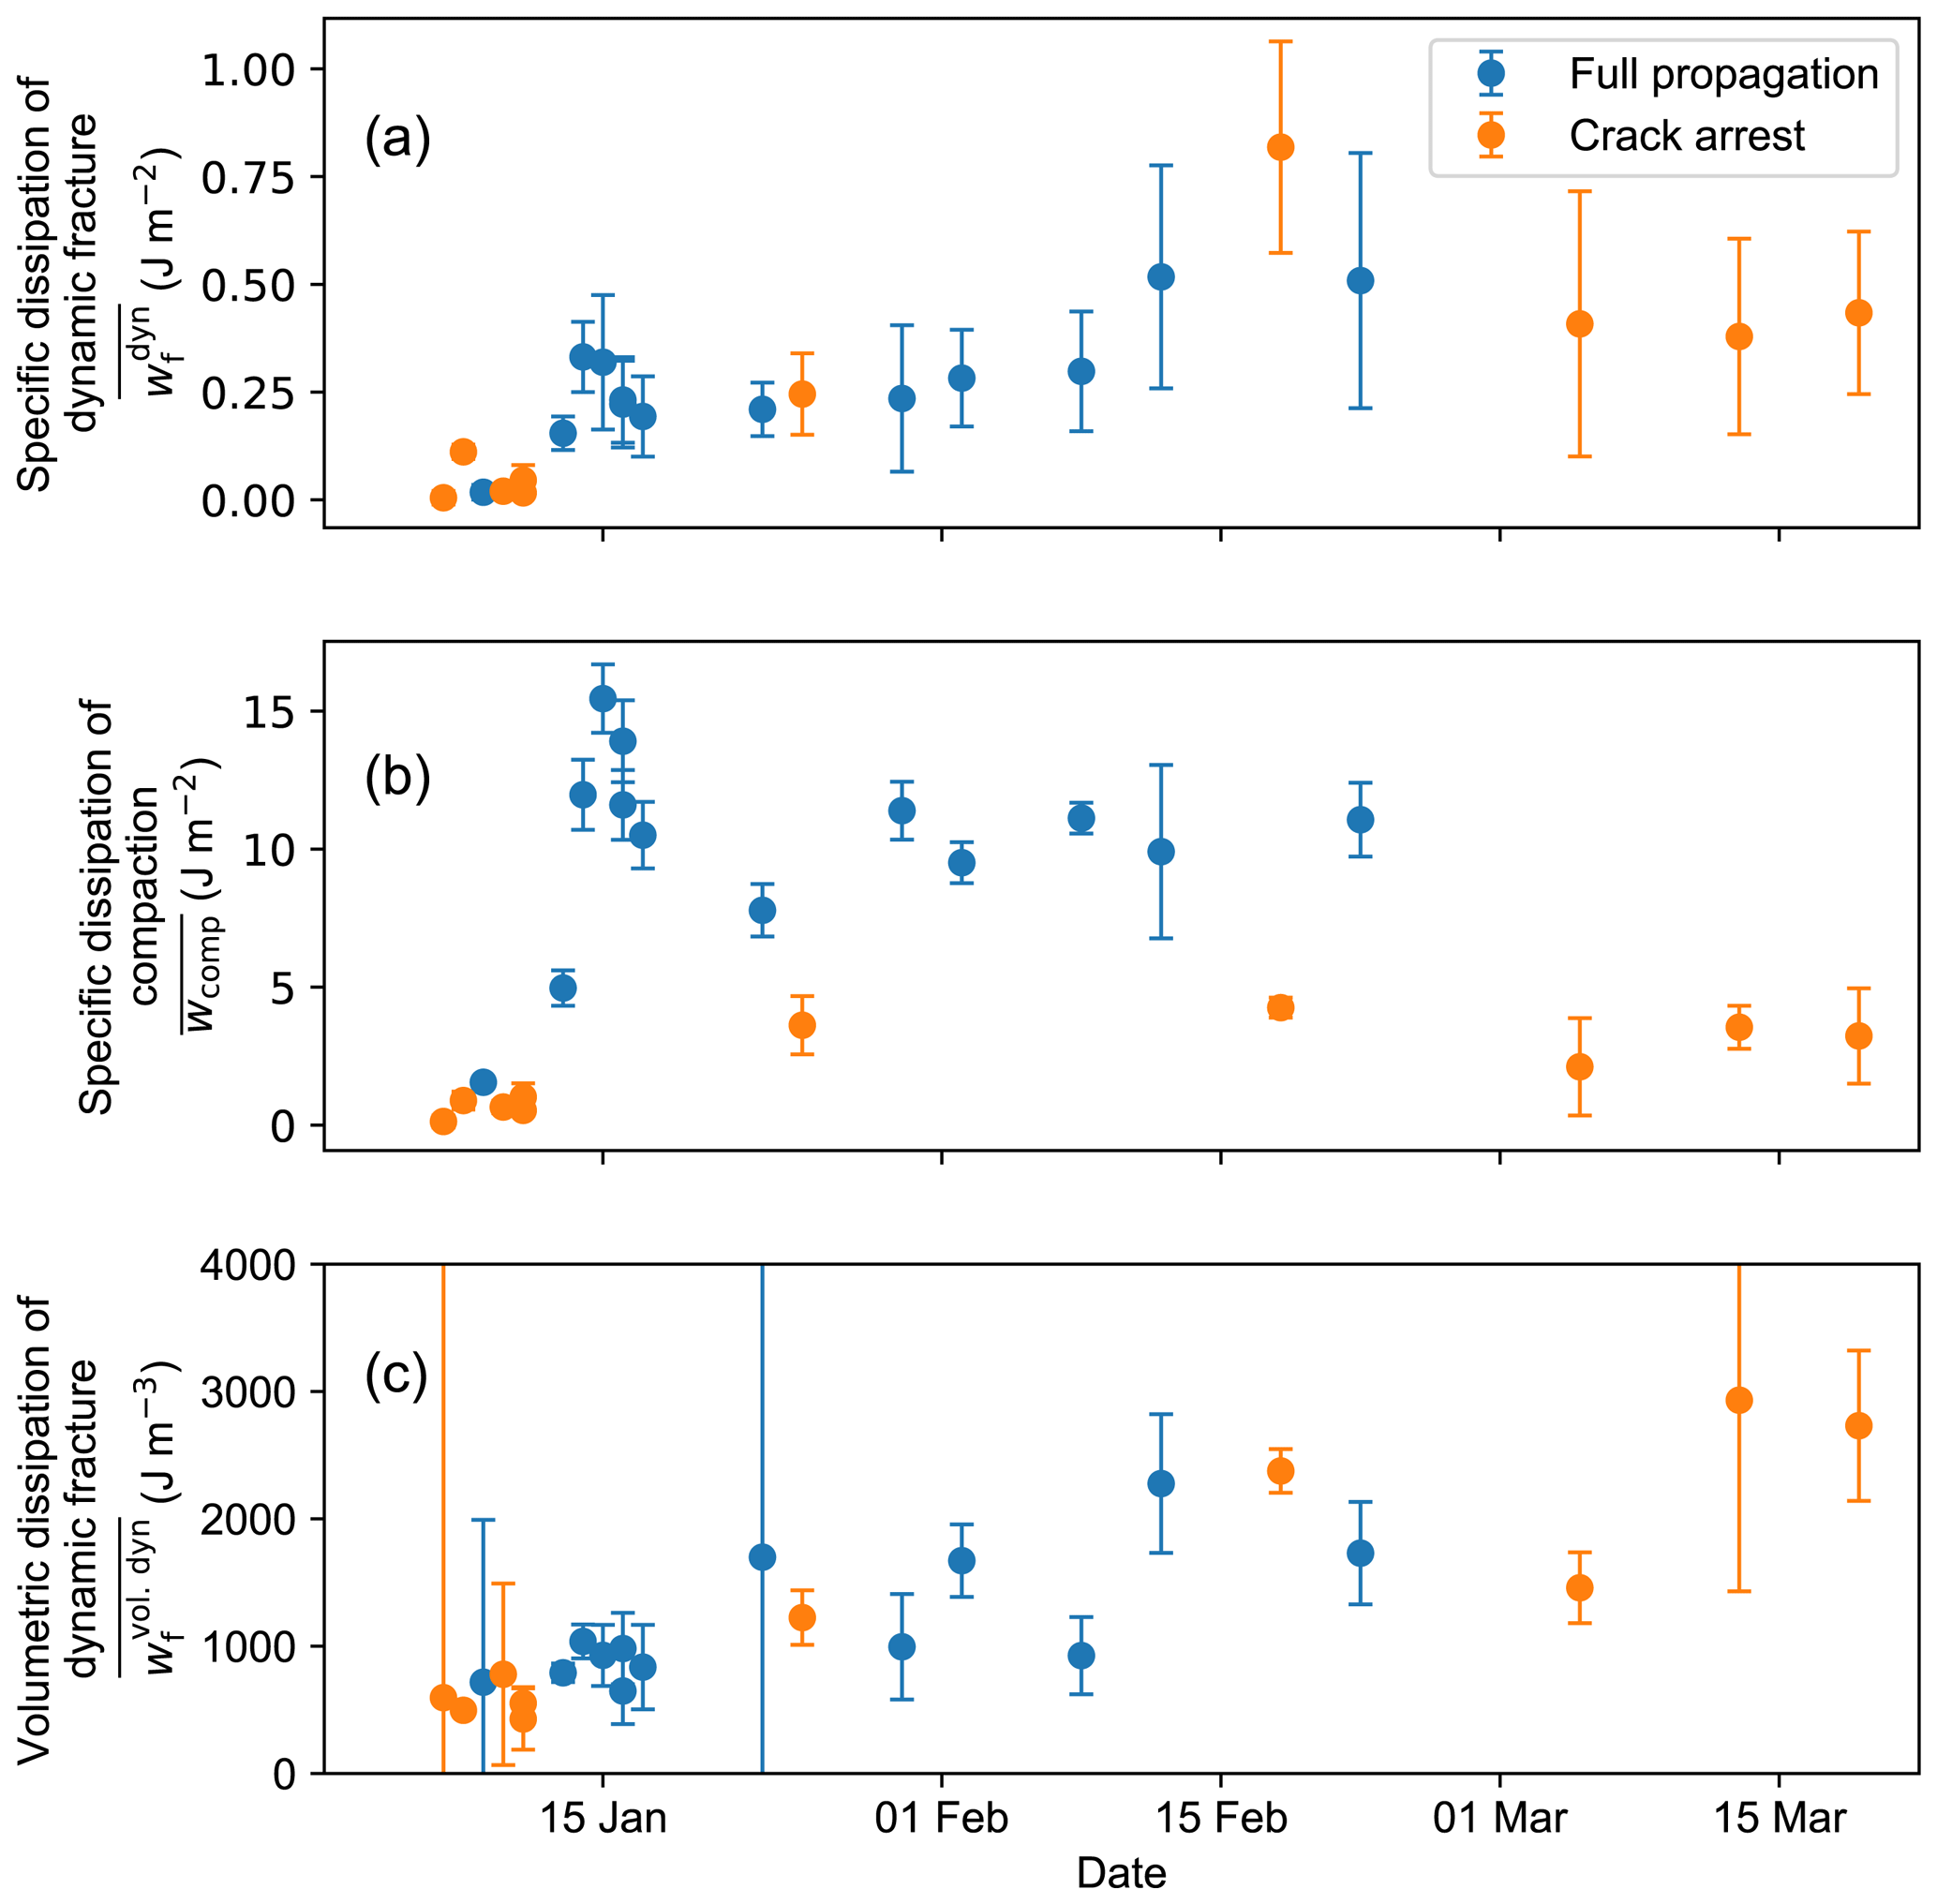
Figure 9(a) Specific dissipation of dynamic fracture with time. (b) Specific dissipation of compaction with time. (c) Volumetric dissipation of dynamic fracture with time. PST results are shown with different colours: full propagation (blue dots) or crack arrest (orange dots). Error bars indicate the measurement uncertainty.
As the dynamic fracture in weak snow layers is always accompanied by a reduction in the volume of the weak layer, a volumetric fracture energy might be more appropriate than the classical energy per area. As an alternative to the specific dissipation of dynamic fracture, expressed as an energy per fractured area, we therefore computed a volumetric fracture dissipation expressed as the energy needed to compact the weak layer (Fig. 9c). To do so, we divided the specific dissipation of dynamic fracture by the settlement of the slab at the crack tip (see Fig. 4):
Overall, the volumetric dissipation of dynamic fracture increased with time from 1 ± 4 to 2.7 ± 0.6 kJ m−3.
3.3 Crack speed
Crack speed increased during the first 9 field days until the highest crack speeds were observed on 16 and 17 January (55 ± 8 and 55 ± 7 m s−1, respectively). Thereafter, crack speed decreased and remained almost constant around 36 ± 4 m s−1 (Fig. 10a). In addition to the measurements obtained from the PSTs, crack speeds were also computed from snowpack parameters (Fig. 10a, grey dots) using Eqs. (9) and (6). For the slab elastic modulus the estimates of the HS model were taken. The modelled speeds were in good agreement, especially during the first 5 field days and after the end of January (average deviation: 7 m s−1). The greatest mismatch was for the days when crack speeds were largest.
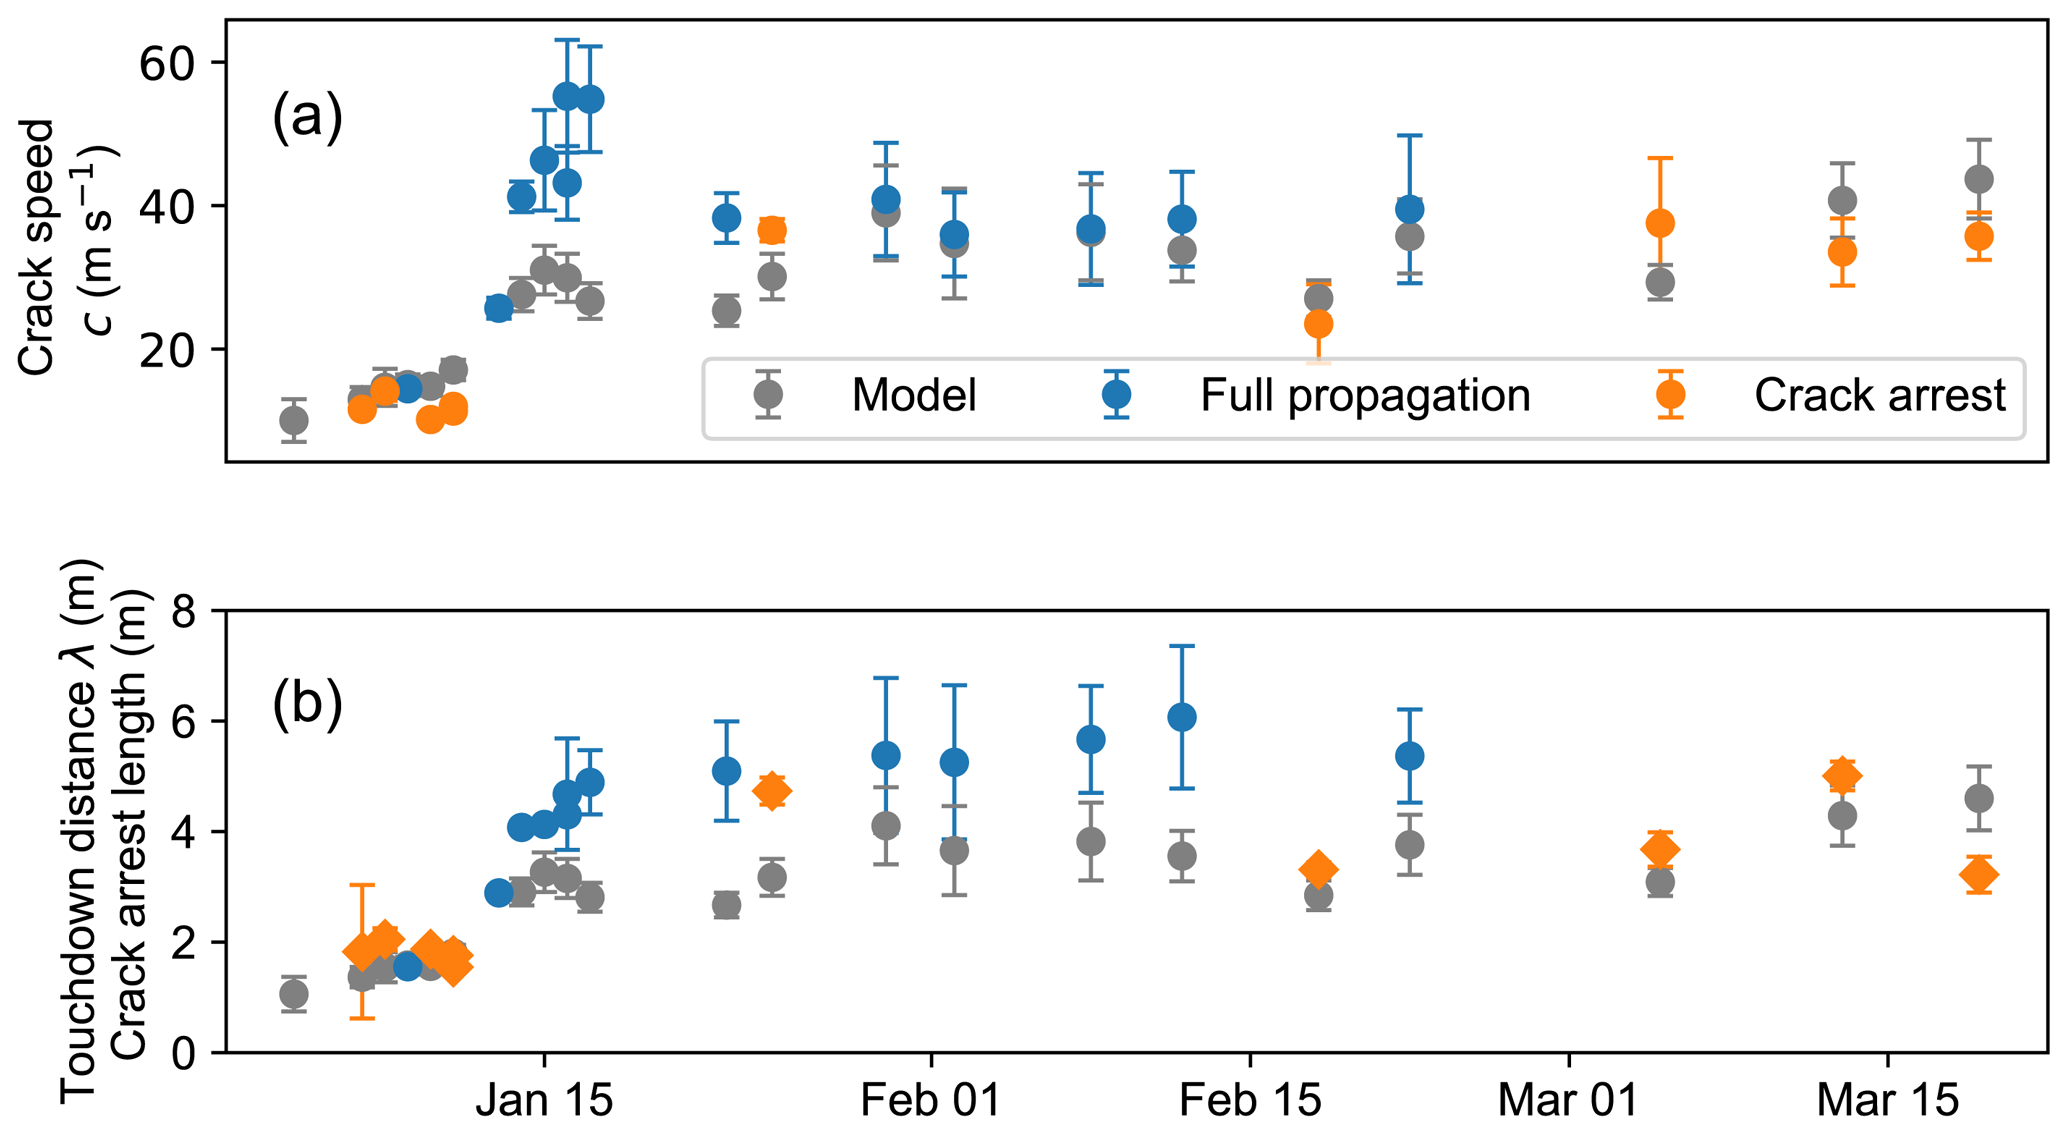
Figure 10(a) Crack propagation speed with time. (b) Touchdown distance and crack arrest distance with time. PSTs resulting in full propagation are shown with blue dots; crack arrest is shown with orange dots. Grey dots indicate (a) modelled crack speed and (b) touchdown distance obtained with snowpack parameters using Eqs. (9) and (10). For PSTs resulting in crack arrest, the crack arrest length was estimated (orange diamonds). Vertical bars indicate the measurement uncertainty.
3.4 Touchdown distance and crack arrest length
For PSTs resulting in full propagation, the touchdown distance can be estimated, given that the column length was larger than the touchdown distance (Fig. 10b, blue). In total, we measured touchdown distances in 13 PSTs from mid-January to the end of February. In this period, the touchdown distance increased from 1.55 ± 0.14 to 6.1 ± 1.3 m. The overall trend is well reproduced with the model (Eq. 10, grey dots in Fig. 10b), although on average the modelled touchdown distances were 38 % lower. For PSTs resulting in crack arrest, the distance to the point of crack arrest was estimated. With the exception of 9 January, crack arrest length was consistently shorter than the touchdown distance measured prior to or following the crack arrest experiment.
4.1 Elastic modulus and specific fracture energy
For all 24 PST experiments, the deformation field of the slab during sawing was derived via image correlation analysis of individual movie frames. The deformation field and the corresponding cut length (location of the snow saw) served as input to estimate the elastic properties of the slab and the specific fracture energy of the weak layer. For that, two mechanical models predicting slab deformation were used. In the HS model the slab was represented as homogeneous with mean density, effective elastic modulus and Poisson's ratio. The LS model accounted for slab layering.
We found that the deformation behaviour of a typical slab in avalanche release cannot accurately be modelled with the HS model coming along solely with two mechanical parameters. The effective elastic modulus estimated with the HS model showed a rather steady increase with time. The consecutive large snowfalls were not individually reflected in the measurement of the effective modulus. But these rapid increases of slab thickness strongly changed the layering and therefore the bending behaviour of the slab (Fig. 7a). The stiffness properties obtained with the LS model showed both an overall increase in stiffness, resulting from densification, sintering and loading, as well as a close relation to the individual snowfall events influencing the layering (Appendix B). Therefore, we deem the LS model to be more precise, even though the LS model did not show a significantly lower residual between the measured and modelled deformation field (Fig. 6).
In fact, many studies employing the finite-element method have shown that slab layering is important for failure initiation as well as the onset of crack propagation (Habermann et al., 2008; Monti et al., 2016; Schweizer et al., 2011; van Herwijnen et al., 2016). In contrast, a homogeneous slab model coming along with an “equivalent modulus” is not able to represent important aspects of the deformation behaviour of a layered slab (e.g. bending–extension coupling, vertical shift of zero bending line). In general, if the stiffness tensor is expressed by two engineering constants (e.g. equivalent modulus and Poisson's ratio) to relate stress and strain, a homogeneous material (not layered and isotropic) is assumed. A layered snow slab does not match this condition, and the corresponding stiffness tensor cannot be expressed with two independent variables, with more parameters being needed. Hence, an “equivalent modulus” may incorporate viscosity and symmetrical layering (around the middle of the slab), but since it is a single elastic property, only if the deformation field is dominated by a single eigenmode such as bending. If more eigenmodes are relevant or the slab is asymmetrically layered, an “equivalent modulus” cannot accurately model the complex deformation field. However, most natural snowpacks are asymmetrically layered and deformation is in general multimodal. The result that our LS model did not show a significantly lower residual can be attributed to our flat-field experiments where the self-induced loading of the slab is perpendicular to the layering. The eigenmode of slab deformation is mainly flexural bending, and downslope pull from the unsupported part of the PST or lateral shear deformation are negligible. The absence of downslope-pull-induced tension makes the tensional stiffness and the bending–extension term less impactful in flat-field PSTs, severely limiting the benefits of the LS model.
Shortcomings of the HS model also affect the estimate of the elastic modulus of the weak layer and thus the estimate of the specific fracture energy. Regarding the elastic modulus of the weak layer, both the HS and LS model did not converge for the same six experiments (Fig. 7b, transparent dots). For the remaining experiments, both models estimated similar trends with time. The consistently lower elastic modulus estimates from the LS model can be attributed to the limitations of the HS model. Indeed, for most natural slabs density and stiffness increase with depth, as was also the case in our measurement series. Due to this asymmetry, the zero-bending line (neutral axis) in the slab shifts downwards, resulting in less horizontal displacement at the bottom of the slab close to the weak layer. This effect cannot adequately be reproduced by the HS model, resulting in a higher weak-layer elastic modulus to account for the small measured horizontal displacement at the bottom of the slab.
This shortcoming of the HS model is also seen in estimates of the weak-layer specific fracture energy and especially its mode decomposition (Fig. 8). On average, the LS model estimated a 22 % lower fracture energy. Regarding the mode contribution, the differences are larger. Again, the horizontal displacements at the crack tip in the HS model are inherently too large. This directly affects the specific fracture energy estimates using Eq. (8). The mode II contribution of specific fracture energy is therefore also too high. This can be nicely seen by comparing the first and second experiment. In the first measurement, the slab consisted of a single 23 cm thick layer; hence, it was rather homogeneous. The HS and LS model predicted the same mode contribution (Fig. 8b, first data point); 3 d later, an additional 35 cm of new snow was added to the slab. The slab was more layered, and the mode contributions were completely different from the two models. Subsequently, slab layering changed but did not vanish; hence differences between both models persisted until the end of the measurement series. Kirchner et al. (2002) and Schweizer et al. (2004) were the first considering the mode contributions in fracture toughness measurements. These studies used notched cantilever beams consisting of snow types which typically form the slab layer (e.g. rounded grains). Up to now, the mode composition of fracture energy for a weak snow layer is not considered in experimental data. Only Bergfeld et al. (2021) discussed the contributions, but they were not able to estimate a mode II contribution since the underlying mechanical model (Rosendahl and Weißgraeber, 2020a) did not allow horizontal displacement at the crack tip for experiments without slope angle. Thus, our measurements are the first to differentiate the components of fracture energy, which is necessary to better understand weak-layer resistance to cracks under different loading conditions (Rosendahl and Weißgraeber, 2020b). Self-induced loading in a PST by the unsupported part of the slab always induces a combination of compressive and shear stresses at the crack tip, even in flat-field tests (Gaume et al., 2018a). Hence PSTs are always mixed-mode fracture tests, and the mode contributions have to be indicated. A weak layer thus exhibits different apparent fracture energies depending on whether it is tested at a 0 or 35∘ slope angle. Similar, the bending behaviour of slabs with different layering resting on the same weak layer can induce different loading conditions at the crack tip, resulting in apparently different fracture energies of the weak layer. Hence, without considering the mode contributions, the derived fracture energies are difficult to interpret, and their use in other studies is hampered. A more comprehensive understanding of crack propagation in weak layers requires fracture energy measurements covering a wide range of loading conditions in mixed-mode crack propagation, from closing mode I (compression) to mode II (shear). An improved understanding of the fracture envelope of weak layers is a prerequisite for reliably modelling crack propagation at different slope angles.
Regarding the temporal evolution of weak-layer specific fracture energy, it increased with time as did the elastic modulus of the slab and weak layer. From 4 to 20 January fracture energy increased by around 1 order of magnitude, from 0.1 to 1.5 J m−2, a similar increase as was observed by Schweizer et al. (2016).
Previous studies (Gaume et al., 2014; Birkeland et al., 2019) assumed a power-law increase of weak-layer fracture energy with time, as is typical of snow sintering (e.g. van Herwijnen and Miller, 2013). Our measurements suggest a linear trend of around 0.02 J m−2 d−1 for the buried surface hoar layer we tested. Jamieson and Schweizer (2000) investigated changes in shear strength of buried surface hoar layers (mean: 56 Pa d−1) and suggested that the strengthening was due to the penetration of the surface hoar crystals into adjacent layers, rather than to sintering. A finding that applies specifically to weak layers consisting of surface hoar. Most likely, strengthening and the increase in fracture energy are due to the same microstructural changes. Therefore, it can be assumed that the trend of fracture energy with time is different for different grain types. Since there are many types of weak layers, besides buried surface hoar, more data are needed to confirm that our findings are generally applicable.
4.2 Dissipation of dynamic fracture and compaction
The specific fracture energy estimated from the onset of crack propagation (static fracture energy) does not necessarily coincide with the required energy during dynamic propagation (Freund, 1990). As the dissipation of dynamic fracture in closing cracks is superimposed with the dissipation of compaction, we suggested separating the two contributions (Sect. 2.6) and computing a volumetric dissipation of dynamic fracture.
Throughout the measurement series, the dissipation of dynamic fracture was lower than the static fracture energy (compare Figs. 8a and 9a), although the values were in the same range. The dissipation of dynamic fracture had two local maxima with time (Fig. 9), with the first around 15 January and second around 18 February. The dissipation of dynamic fracture is not necessarily a material property of the weak layer, as it may also depend on crack propagation characteristics, such as crack speed. The high values of fracture energy around 15 January are well correlated with higher crack speeds (Fig. 10a); hence higher propagation speeds may lead to higher dissipation of dynamic fracture as was also observed in bones (Behiri and Bonfield, 1980) or some engineering plastics (e.g. Fond and Schirrer, 2001). On the other hand, the second maximum on 18 March was not characterized by a high crack speed and this experiment resulted in crack arrest. We therefore attribute the observed fluctuations in the dissipation of dynamic fracture to the method we used to separate dissipation of dynamic fracture from the compaction part. Analogous to opening cracks, we envisioned and estimated dissipation of dynamic fracture as the energy dissipated in the weak layer ahead of the crack tip (uncracked region). For opening cracks, this is close to the total energy dissipated in the weak layer, since there is typically no energy dissipation in the weak layer behind the crack tip (cracked region). In the case of closing cracks, more energy is dissipated in the weak layer behind the crack tip to crush the weak layer, what we call dissipation of compaction. This is not only a material property of the weak layer but also a quantity that likely depends on the entire system of slab, substratum, weak layer and slope angle. Our estimates for the dissipation of dynamic fracture are therefore closely related to our definition of the crack tip and the associated amount of settlement (amount of interpenetration) at the crack tip. We therefore also determined a volumetric dissipation of dynamic fracture by dividing the consumed energy per cracked area (units: J m−2) by the settlement (or vertical displacement) at the crack tip. This volumetric dissipation of dynamic fracture is the energy per destroyed/compacted volume, a measure that seems more intuitive for closing cracks. For the volumetric dissipation of dynamic fracture, the earlier mentioned maxima in January and March disappeared, and there was overall less fluctuation with time (Fig. 9c).
The computed volumetric dissipation of dynamic fracture only accounts for mode I contributions, as we only considered the vertical displacement. In our flat-field experiments, this is likely not problematic as mode II contributions are expected to be small (cf. Fig. 8b). For PST experiments on slopes, the applied methodology will therefore have to be adapted to incorporate the mode II contributions in the volumetric dissipation of dynamic fracture.
The dissipation of compaction separates PSTs resulting in crack arrest and full propagation (Fig. 9b, orange and blue dots, respectively). In PSTs with crack arrest no stable crack propagation occurred, even if the crack propagated several metres. The collapse height decreased steadily towards the crack arrest point. Therefore, it is not surprising that the dissipation of compaction in PSTs resulting in crack arrest was also lower as the overall settlement was much lower (Fig. 9b). This clearly highlights that the dissipation of compaction as defined in our method is not a material property of the weak layer and rather a property of the entire system.
4.3 Crack speed, touchdown distance and crack arrest length
In our measurement series, crack speed values initially increased, peaked around 16 January 2019 and were then rather constant until the end of the measurement period. The peak in crack speed coincided with days of high avalanche danger level and the observation of several large and very large natural avalanches within a few kilometres of our test site. In general, the measured crack speeds are in the same range as crack speeds recently determined in numerical simulations (Bobillier et al., 2023; Trottet et al., 2022). Bobillier et al. (2023) and Trottet et al. (2022) further report a possible transition to much higher crack propagation speeds on slopes. However, since the present PST series were made in the flat, this transition is not expected and has not been observed either.
Measured touchdown distances, only obtained for PSTs resulting in full propagation, were consistently higher than predictions of the crack propagation model (Fig. 10, grey dots). This discrepancy is in part attributed to an incorrect model assumption that the slab is in free-fall motion during weak-layer collapse (Bair et al., 2014; Bergfeld et al., 2021). Other contributing factors are uncertainties in the model inputs, namely thickness, load and elastic modulus of the slab, as well as the collapse height (Eq. 10). With the exception of the elastic modulus, these parameters can readily be measured. For snow the true (high-frequency, small strain) elastic modus should be distinguished from measurements which are likely affected by the viscoplasticity of ice. While the true elastic modulus can just be determined with acoustic wave propagation measurements or with micro-computed tomography-based finite-element calculations (Capelli et al., 2016; Gerling et al., 2017), other measurement techniques and applications act at lower strain rates which incorporate viscous and/or plastic effects. In this regime the elastic modulus is an effective modulus depending on the strain rate. We used the elastic modulus obtained during the sawing phase of the PST. Sawing takes a few seconds during which the slab bends typically less than a millimetre. During crack propagation, the slab undergoes a 10 times larger deformation in around of the time of sawing (around 1 mm in 20 ms). Hence, the strain rate during crack propagation is at least 2 orders of magnitude higher. A higher elastic modulus, measured at higher strain rates, would thus be a more appropriate model input.
Initially, touchdown distance increased rapidly, as did the flexural rigidity of the slab (cf. Eq. 10). After 17 January, touchdown distance values were similar with an average of 5.4 ± 0.3 m. Long touchdown distances indicate that it takes a considerable distance before cracks are no longer influenced by the crack initiation and propagate in a self-sustained state. Hence, information about sustained crack propagation propensity can only be obtained after a propagation distance of at least one touchdown distance. Basically, two factors contribute to edge effects when crack propagation starts. First, energy release rate is an increasing function with crack length but just as long as the slab does not yet come to rest again. After one touchdown distance the energy release rate is bounded. Second, the energy release rate is influenced by the triggering mechanism. In a PST, the saw creates a gap in the weak layer. The slab is free hanging above the saw cut, and no dissipation of compaction is needed during settlement. Hence, the undercut part of the slab releases more energy during settlement than later on during self-sustained crack propagation. Similarly, the additional load induced by typical triggers of slab avalanches (e.g. skier or explosive) leads to initially increased energy release rates. This effect fades with crack propagation distances and is negligible after one touchdown distance. Whether a snowpack can then propagate a crack over long distances is only revealed, after at least one touchdown distance, when self-sustained crack propagation is observed. In other words, to get reliable information about sustained crack propagation propensity, field tests must be much longer than the touchdown distance (Bergfeld et al., 2021).
Our measurements revealed crack arrest after propagation distances of more than 4 m, which is about double the length of normal PST experiments. Crack lengths in PSTs with crack arrest were, however, always shorter than touchdown lengths measured in experiments shortly before or after (Fig. 10b, blue and orange). The only exception was the experiment on 9 January 2019 when we observed a crack that almost arrested. In this experiment, the downward speed of the slab almost decreased to zero when the slab at the sawing end of the experiment came to rest on the substrate; i.e. the crack propagated one touchdown length. This suggests that the energy release rate was no longer sufficient for crack propagation and the crack continued to propagate by consuming the kinetic energy stored in the slab. When the kinetic energy was almost depleted and all velocities of the slab were close to zero, the crack almost arrested. At this point, however, the crack tip was already influenced by the free end of the PST column. The energy release rate increased again, and the crack was able to propagate again for the last 40 cm to the end of the column. In a longer PST experiment, the crack would likely have arrested.
The experiments performed after 17 January had a rather thick slab (∼ 1 m) with an elastic modulus around 10 MPa and a collapse height of the weak layer of less than 10 mm. For other snowpack stratigraphies associated with avalanches, such as thick, dense slabs (high elastic modulus) on a thick layer of depth hoar (large collapse height), we expect touchdown distances to be even longer. Observing self-sustained crack propagation in PSTs will then become very unpractical as it will require even longer experiments.
4.4 Sustained crack propagation index
Typically, the snowpack does not tend to propagate fractures when the slab is soft with a low tensile strength or the load is insufficient. As the slab densifies and/or the load increases, the snowpack then tends to propagate a crack in the weak layer, provided one exists. However, as the slab thickness and density further increase, the slab becomes structurally stiffer, resulting in lower stress concentrations at the crack tip, and a self-propagating crack becomes less likely. Consequently, the probability of self-sustained cracking is a function of time with one or more local maxima. Our measurement series showed this temporal evolution. During the life cycle of the tested weak layer, PSTs initially resulted in slab fractures, followed by crack arrest, full propagation and then crack arrest again.
If instability has to be assessed from layer properties rather than from PST experiments, the critical crack length is typically the metric used to describe the propensity of a snowpack to propagate a crack along the weak layer (Reuter et al., 2015). However, in the absence of load increase, parameterizations of the critical crack length result in a steady increase with time (Gaume et al., 2017; Richter et al., 2019). Thus, they cannot fully represent the actual temporal trend of an instability. Moreover, the critical crack length does not fully reflect the result of a PST, since a PST also provides important information about the type of the propagation, i.e. slab fracture, crack arrest or full propagation.
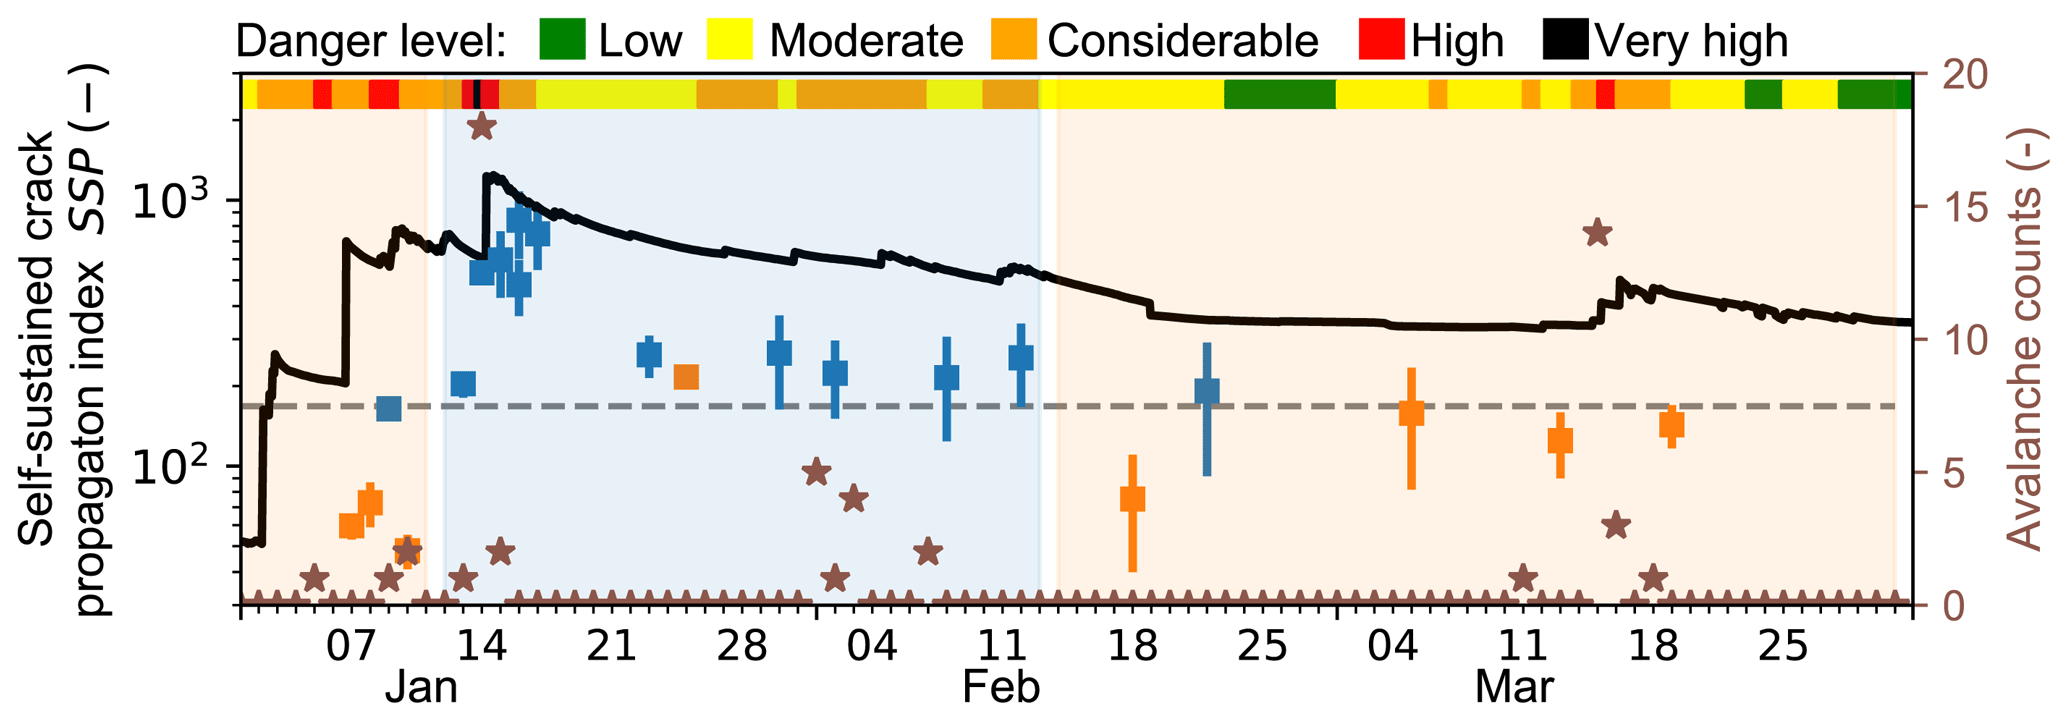
Figure 11Index of self-sustained crack propagation SSP (blue and orange squares for full propagation and crack arrest, respectively) with time. For comparison, regional avalanche activity (brown stars), given as total counts of observed avalanches with size 3 or larger in a 10 km radius around our field site, and the regional avalanche danger forecast (colours on top) are given. The blue and orange background indicate the periods when PSTs mainly resulted in crack arrest and full propagation, respectively. The self-sustained crack propagation index SSP was also modelled for simulated snow stratigraphy (black line) using crack speed and critical cut length parameterizations from Heierli (2005) and Richter et al. (2019), respectively.
While the critical crack length can easily be estimated from measured or simulated snow profiles (Gaume et al., 2017; Richter et al., 2019), the outcome of a PST remains unknown. Reuter and Schweizer (2018) suggested a tensile failure criterion to indicate whether a slab fracture is likely to occur. However, with the exception of the first experiment (4 January), we did not detect a fracture in the slab in any experiment. Hence, in our measurement series the snowpack tended to arrest cracks without slab fractures, before and after the period when cracks propagate to the very end. There is currently no method to assess crack arrest, and an index for the propensity of self-sustained crack propagation is missing. Our results showed that the highest crack speeds (Fig. 10, around 15 January) were observed on days when concurrently avalanche danger was 4-High or 5-Very high (Fig. 11, colours at top) and major avalanche activity (Fig. 11, brown stars, data set described in Schweizer et al., 2021) was observed.
We therefore suggest an index which estimates the propensity of the snowpack to support self-sustained crack propagation (SSP) as the ratio of the square of crack speed c2 and the critical cut length rc:
where g is the gravitational acceleration owing to make the index dimensionless.
We derived the SSP index from PST resulting both in crack arrest and full propagation (Fig. 11, orange and blue squares, respectively). For the period when the experiments showed mainly full propagation (Fig. 11, blue background), the SSP indices derived from the measurements were larger than in the periods with crack arrest (orange background). The five highest SSP indices (between 14 and 17 January) coincided with high avalanche activity and avalanche danger level 5 (very high) (both on 14 January, Fig. 11, brown stars and colours on top of the panel, respectively). To discriminate between the period when the PSTs resulted in full propagation from the periods when the cracks arrested, we suggest a threshold of SSP = 168, for our data set (Fig. 11, grey dashed line).
In addition, we also derived SSP from simulated snow stratigraphy obtained with the numerical snow cover model SNOWPACK (Appendix D) for our field site with an hourly resolution. The SNOWPACK output was used to compute crack propagation speed (Eq. 11; Heierli, 2005; Fig. D1b, grey line) and critical cut length (Richter et al., 2019; Fig. D1b, red line). Elastic properties of the slab were derived from the mean density of the slab using the parameterization suggested by Scapozza (2004). The peak of the model-derived SSP (Fig. 11, black line) coincided with the maximum values of SSP obtained from the measurements (around 15 January). However, discrepancies between the measurement- and model-derived values of SSP are present. The modelled values were generally larger than the ones from the measurements, which suggests also a different, larger threshold (around 500). Additionally, the first two local maxima of the modelled values of SSP (3 and 6 January) overestimated the propensity for self-sustained crack propagation, as the parameterizations likely do not correctly account for the soft and shallow slab, which was present at those days and did not support self-sustained crack propagation.
Therefore, the SSP index represents a first attempt only to estimate the propensity of the snowpack to support self-sustained crack propagation. While it was in line with the results of our PST series, future studies will have to show whether the index is also useful to estimate avalanche size.
We conducted a series of 24 flat-field PST experiments, up to 10 m long, over a 10-week period. All PST experiments were analysed using digital image correlation to derive high-resolution displacement fields. From the displacements we derived snow properties (elastic properties, specific fracture energy) and crack propagation metrics (dynamic energy dissipations, crack speed, touchdown distance, crack length).
To estimate the elastic properties of the slab and weak layer, we used two mechanical models. One considered the slab as homogeneous (HS), and the other accounted for slab layering (LS). From the HS model we derived the effective elastic modulus of the slab and weak layer as well as the specific fracture energy of the weak layer. As PST experiments are characterized by mixed-mode loading, we separated the specific fracture energy into mode I and mode II contributions. With the LS model, we estimated the same properties of the weak layer. With both models we obtained specific fracture energies between 0.1 and 1.5 J m−2. The behaviour of the layered slab was given by stiffness quantities (Appendix A). Comparing both models, the LS model provided displacement fields which were slightly closer to the measured displacements. This superiority would probably be more pronounced for PST experiments on steep slopes. Furthermore, the models differed in the estimates of the weak-layer elastic modulus and the mode contribution of the fracture energies. These differences were attributed to the fact that an effective elastic modulus of the slab cannot represent the asymmetric layering of the slab. As the estimation of the specific fracture energy is based on the displacements at the crack tip, this drawback of an effective elastic modulus also propagated to the estimates of specific fracture energy, in particular in the contributions from mode I and II ( was 50 % lower for the LS model).
In addition to the (static) specific fracture energy at the onset of crack propagation, we also computed a dissipation of dynamic fracture during crack propagation by separating the work done in the weak layer into (i) a dissipation of dynamic fracture which is absorbed in the fracture process zone ahead of the crack tip and (ii) the dissipation of compaction absorbed after the crack tip passed and the slab further bends down and settles. The dissipation of compaction was 30 times higher than the dissipation of dynamic fracture (5 × 10⁻³ to 0.4 J m−2) which was in the same range as the static specific fracture energy of the weak layer. As the dissipation of dynamic fracture and compaction is inherently linked to a certain amount of interpenetration of the weak layer, we alternatively computed a volumetric dissipation of dynamic fracture. The volumetric dissipation of dynamic fracture (1 to 2.7 kJ m−3) exhibited a steadier increase during the measurement series and was therefore deemed to be a useful quantity to express the resistivity of the weak layer against closing cracks.
Before and after the time period when the PSTs resulted in full propagation, PSTs resulted in crack arrest. Crack arrest lengths were more than 5 m and therefore longer than common PSTs column lengths. However, crack arrest lengths were always shorter than touchdown distances, measured in full propagation PSTs conducted before or after the crack arrest experiment. This indicates that self-sustained crack propagation can only be assessed with PSTs if the column length is larger than at least one touchdown distance, i.e. about 8 m. For shorter column length, crack propagation is affected by the artificial crack initiation and not yet in a self-sustained mode.
Our measurement series not only provided valuable insight into self-sustained crack propagation but also motivated us to suggest an index describing the propensity of self-sustained crack propagation. The index is based on the ratio of the square of crack speed and critical cut length. For our measurement series, we found large index values for PSTs resulting in full propagation and low values for arresting cracks. As the index could potentially be used to estimate the likelihood of very large avalanches, we compared it to the number of avalanches (larger than size 3, observed within a 10 km radius around the field site) and the local avalanche danger level. In this comparison, the index derived from the field measurement showed a quantitatively good agreement. In contrast, agreement was lower but still reasonable, when we computed the index from simulated snow stratigraphy. The proposed index may be helpful to estimate avalanche size and thus improve avalanche forecasting once validated with a data set that includes avalanche release size.
The presented data set is valuable for validation of numerical models as we tracked the propagation characteristics of a single weak layer over a 10-week period. Since our data set contains only flat-field experiments, future measurements should be conducted on slopes under different loading angles.
Table A1Settings of the high-speed camera (Phantom, VEO710). The horizontal image resolution was kept constant at 1280 pixels.
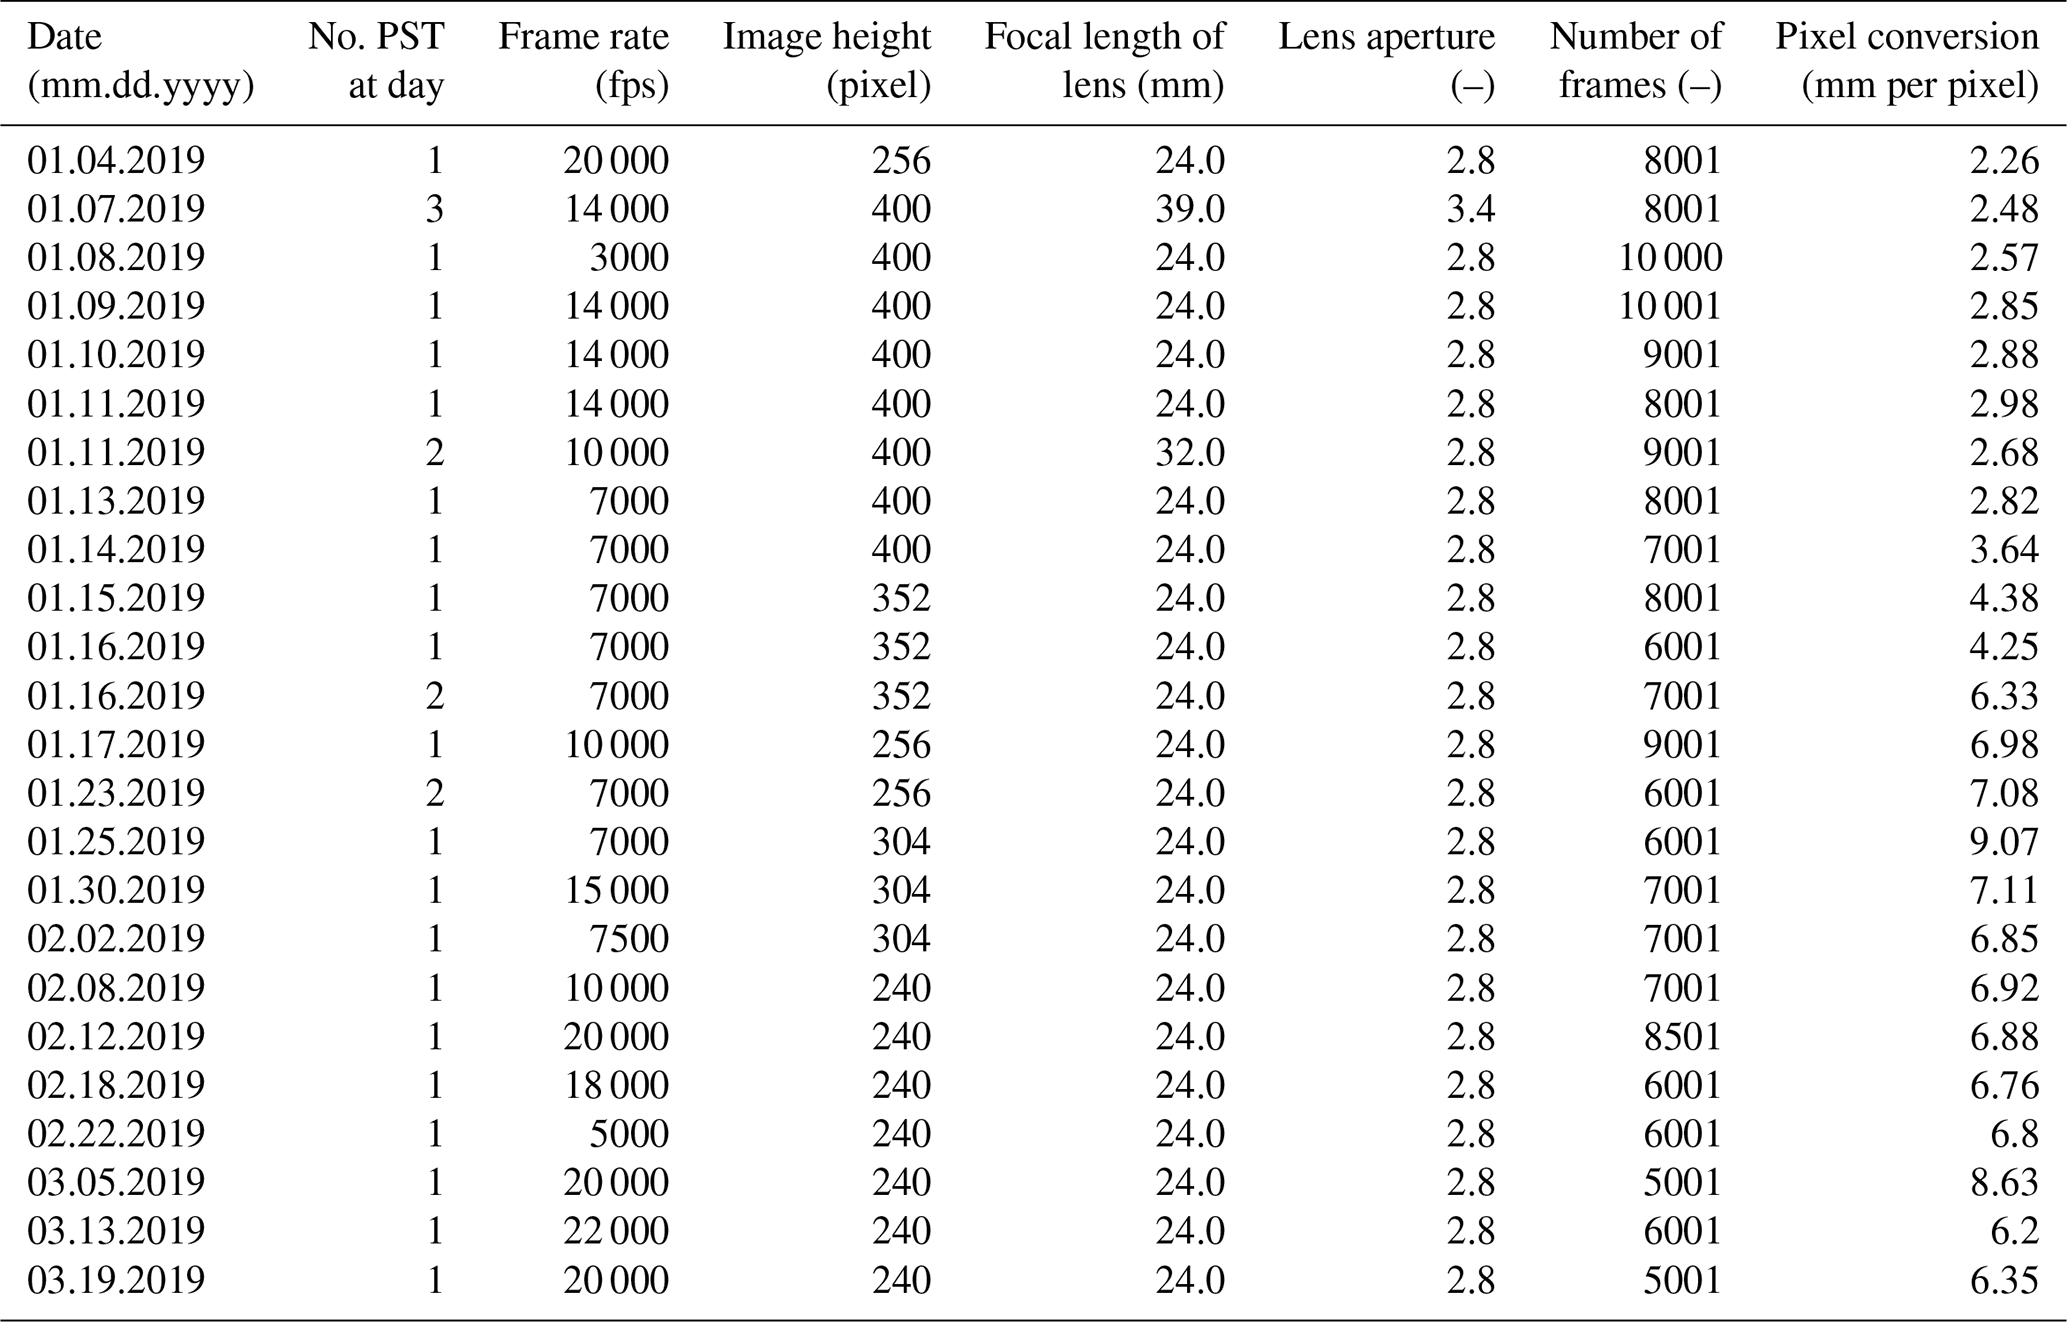
Table A2Settings of the digital image correlation (DIC) analysis of the high-speed recordings. The DIC subsets were allowed to translate, rotate and deform with normal and shear. For the subset initialization, interpolation and optimization method we used the “field_values”, “keys_fourth” and “gradient_based” setting of the DICe (Digital Image Correlation Engine) software.
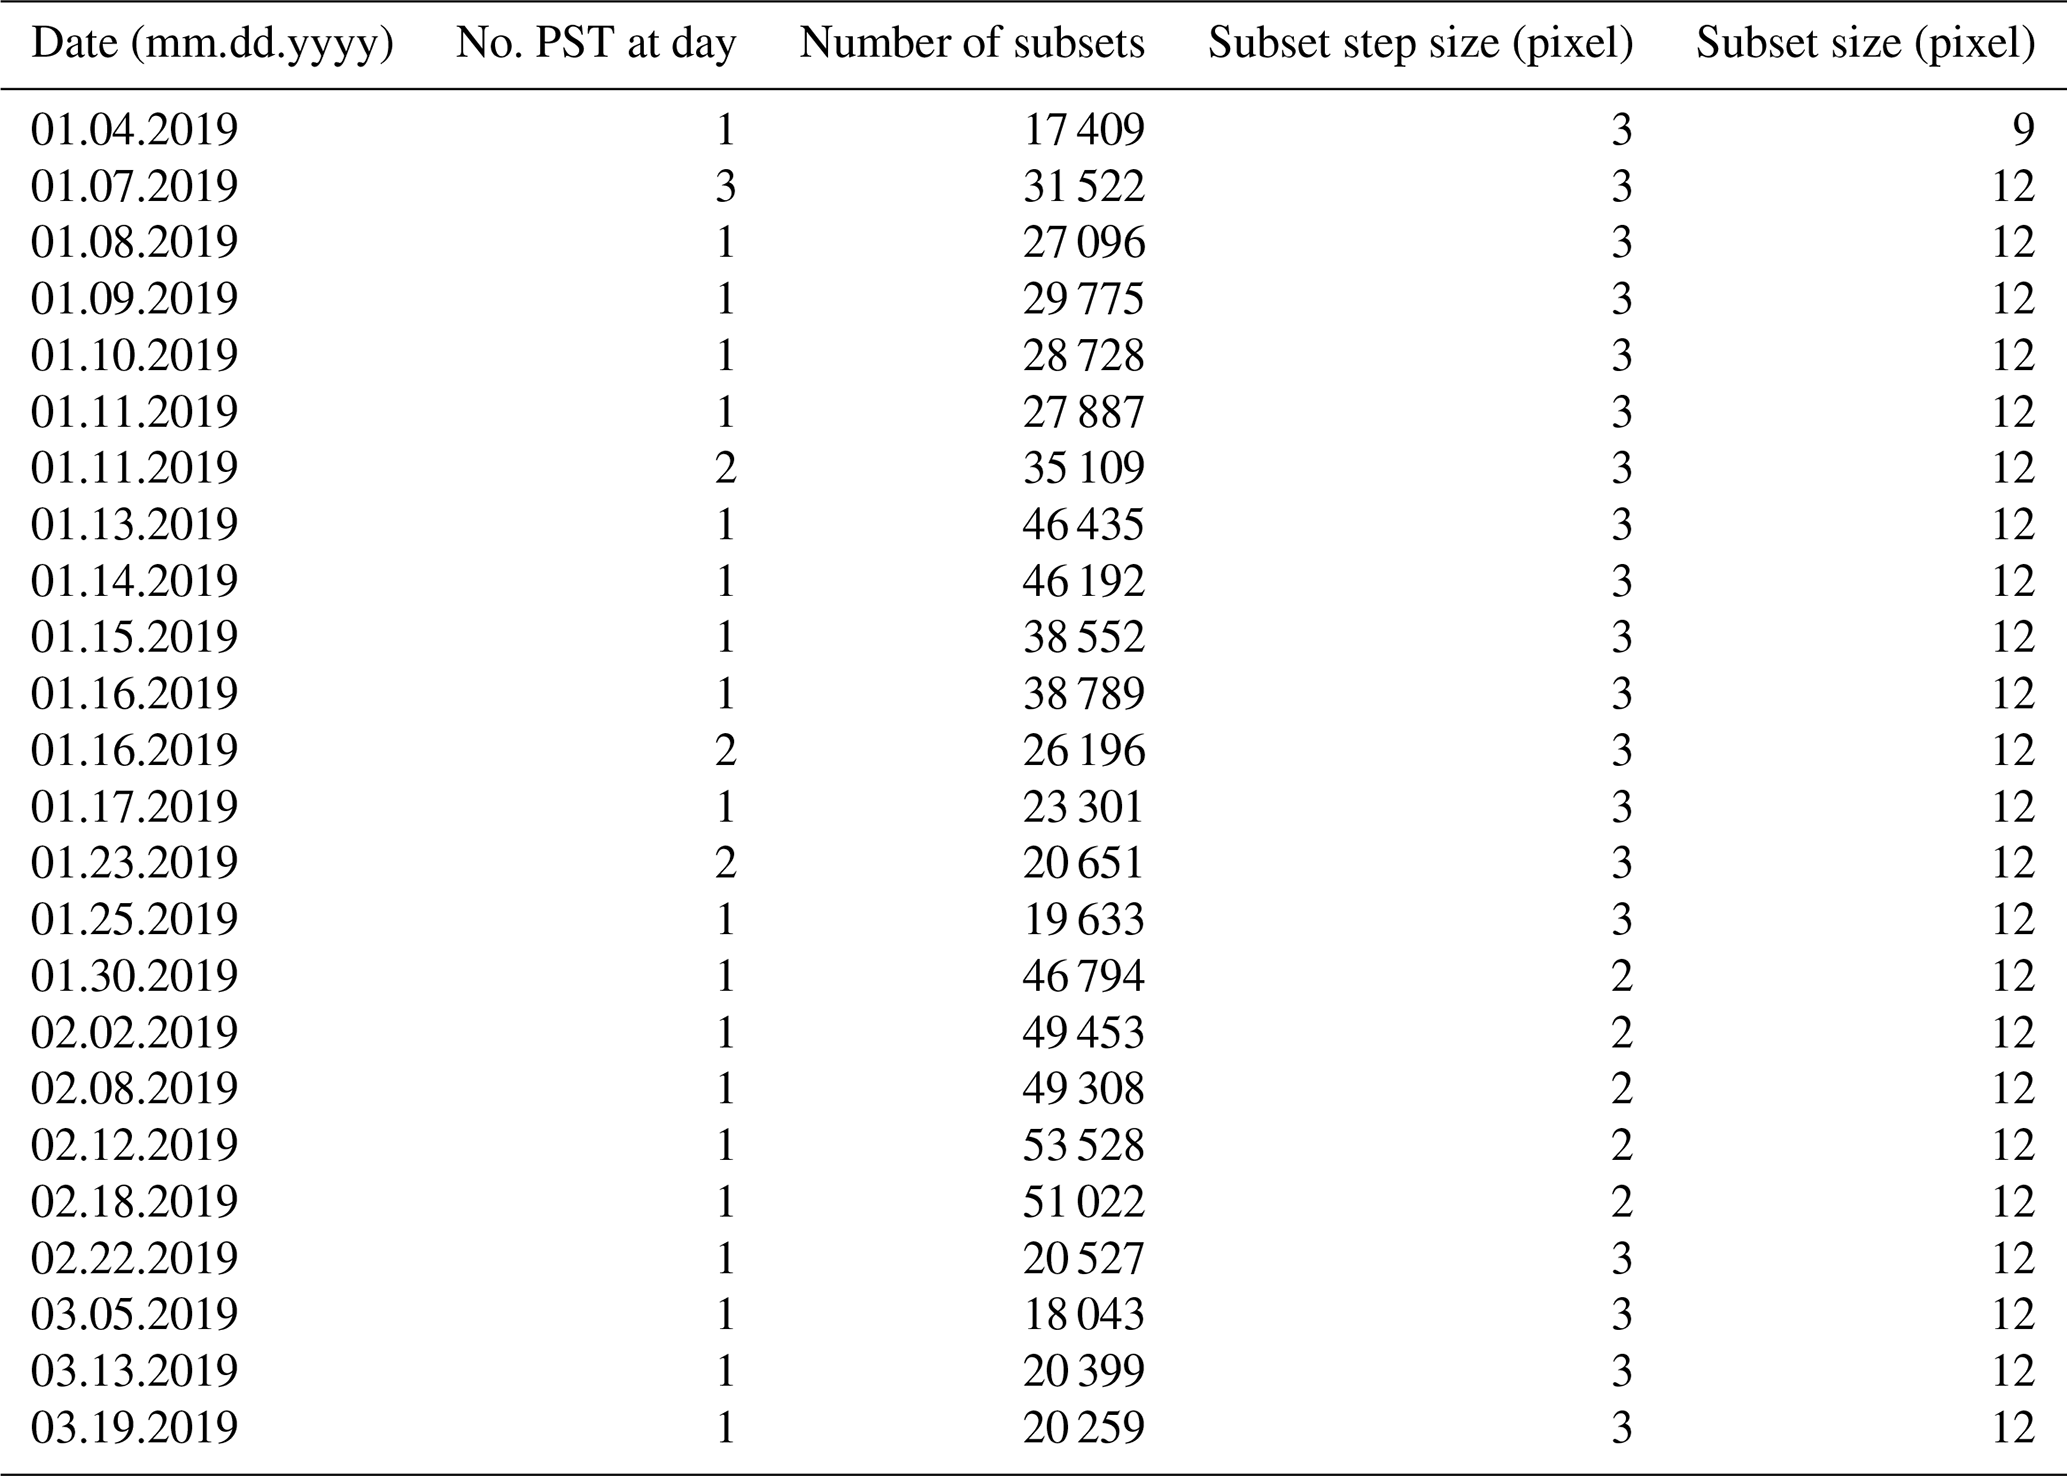
Table A3Camera and digital image correlation (DIC) settings of the Sony camera (RX100 V, 1920 × 1080 pixel2 resolution). The DIC subsets were allowed to translate and rotate. For the subset initialization, interpolation and optimization method we used the “feature_matching”, “keys_fourth” and “gradient_based” setting of the DICe software.

The values of stiffness are derived from the elastic moduli of the individual slab layers obtained through Eq. (4). In our measurement series we derived parameters C1 (see Eq. 4) from 4.0 to 5.0 with a mean of 4.4 ± 0.18.
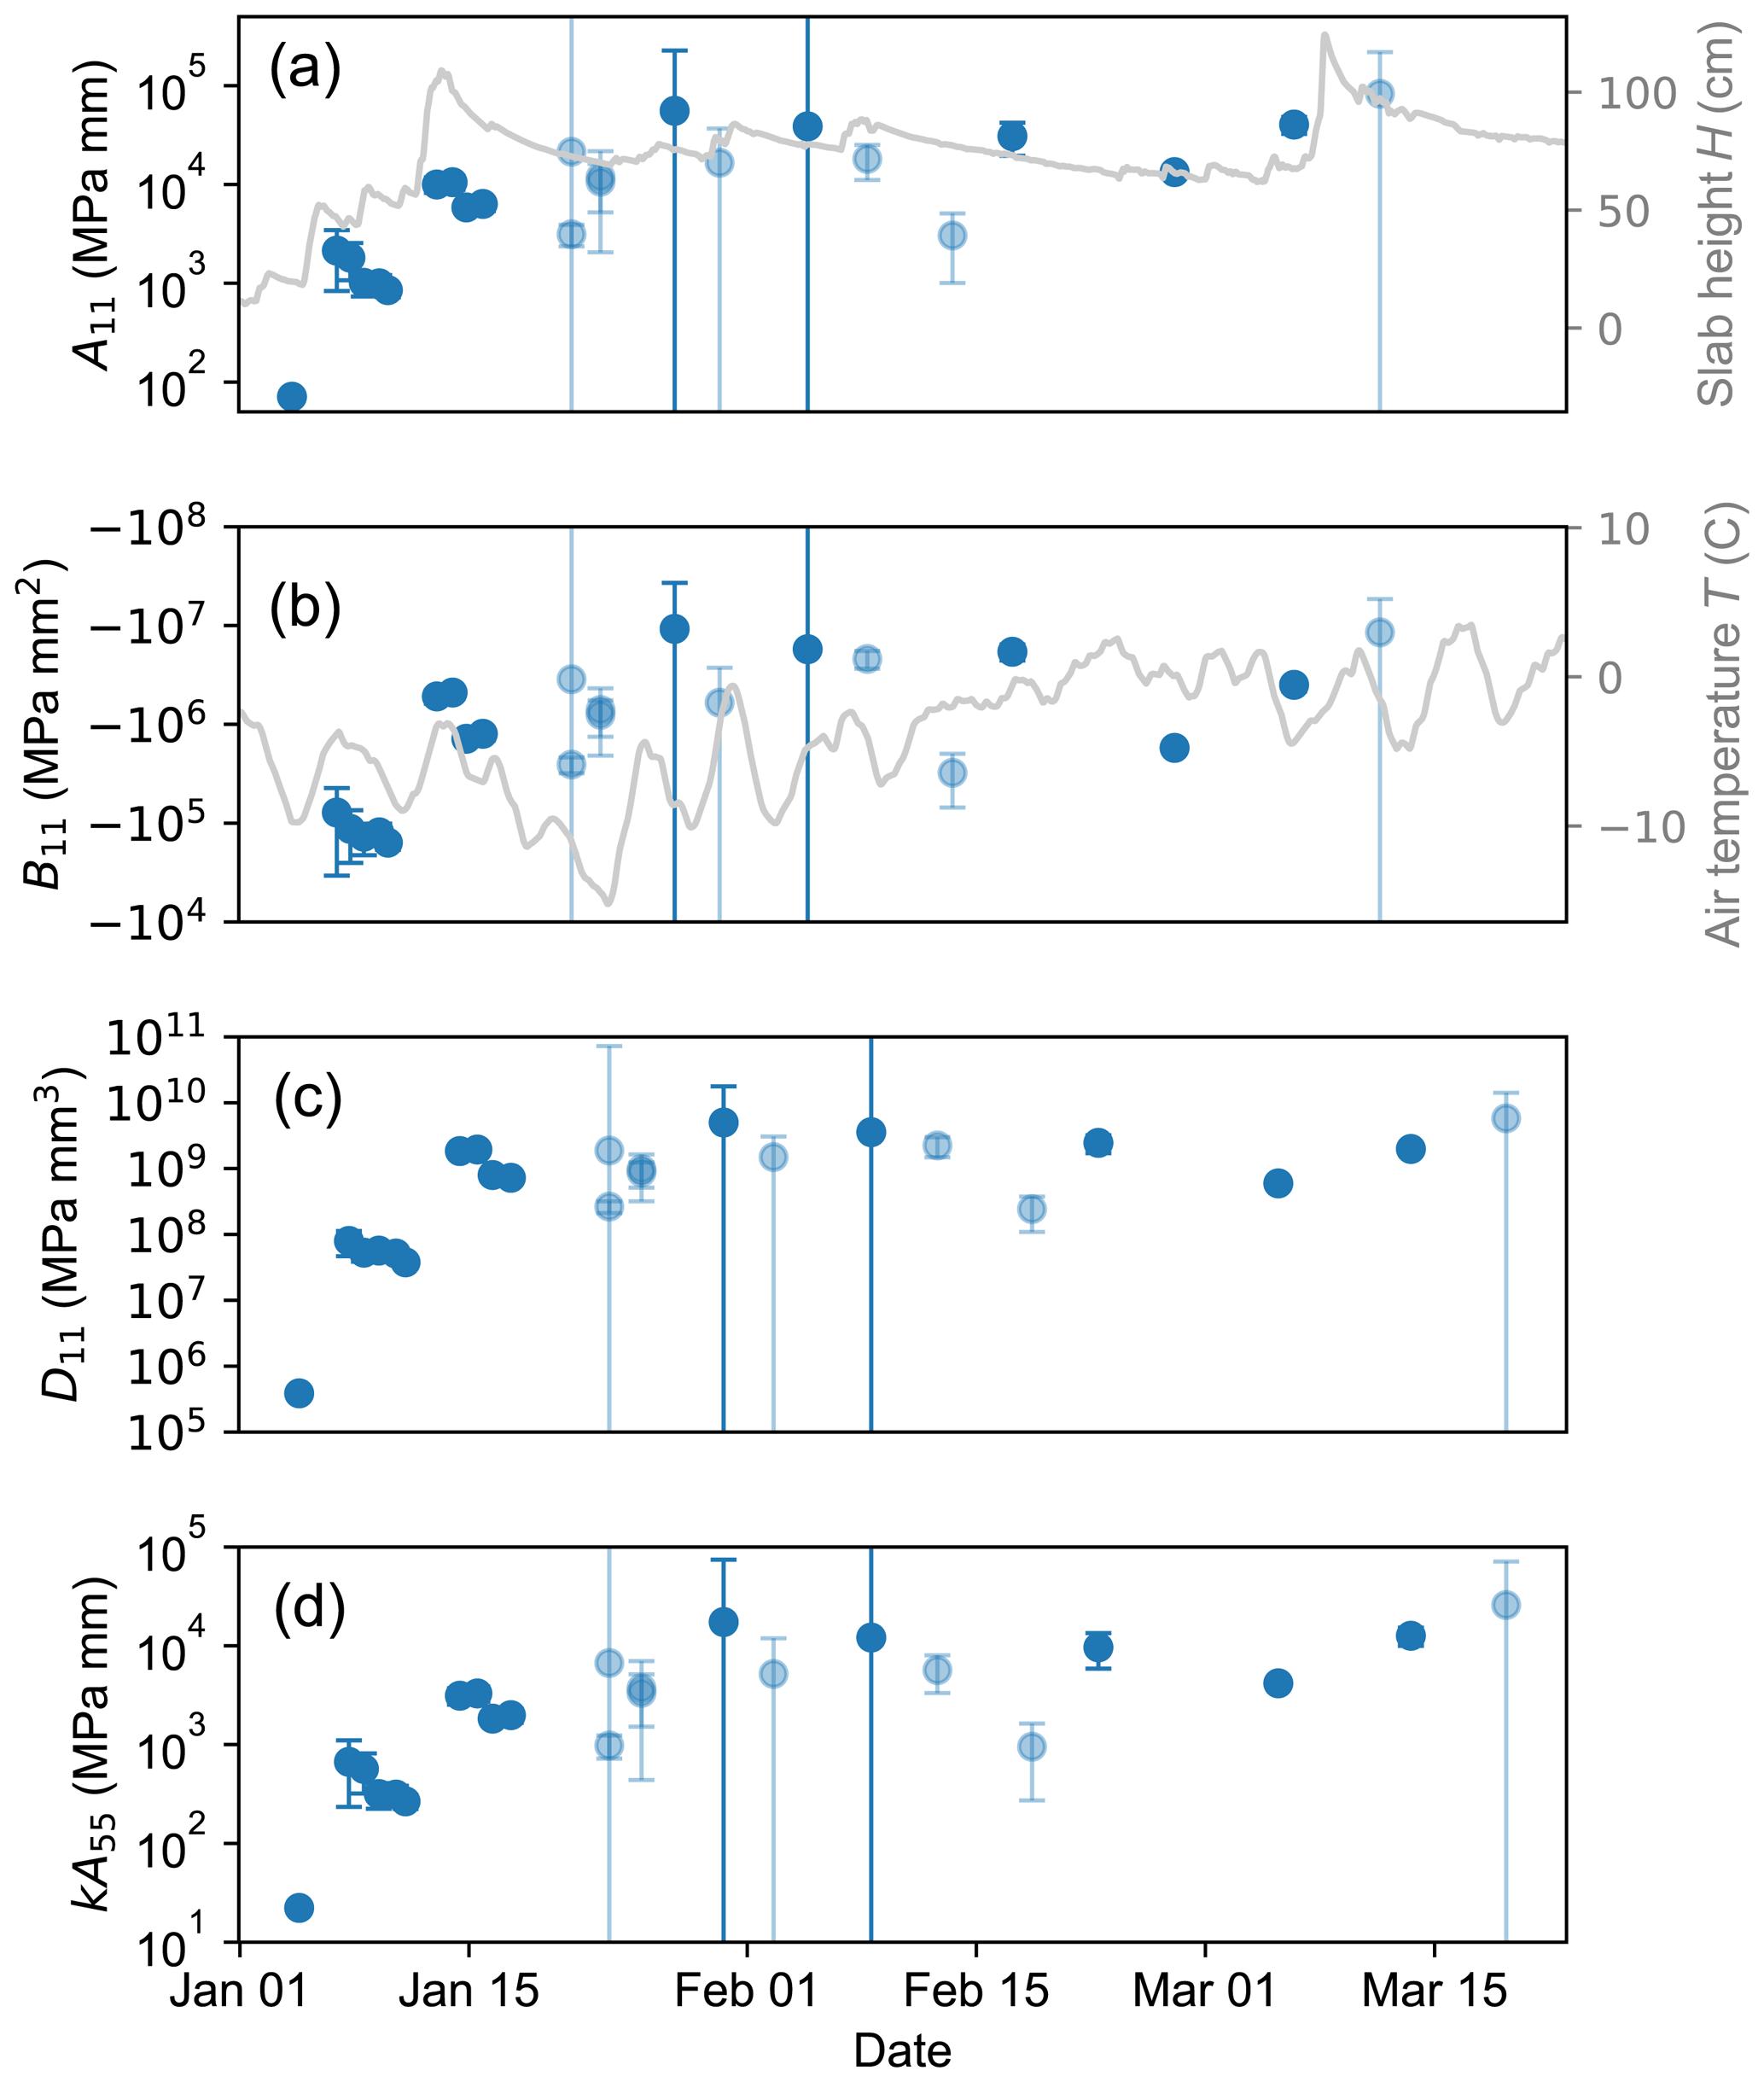
Figure B1Stiffness quantities of the slab derived from the layered model with time. The stiffness quantities are (a) the extensional stiffness A11, (b) the coupling stiffness B11 which incorporates the bending–extension coupling of an asymmetrically layered slab, (c) the bending stiffness D11 and (d) the shear stiffness kA55. Error bars indicate the measurement uncertainty. Transparent dots indicate that the elastic modulus of the weak layer Ewl did not converge within the boundaries given in the optimization routine; instead an upper boundary for Ewl of 2 MPa was used.
Bobillier et al. (2021) reproduced the propagation saw test with a 3-D discrete element method (DEM) simulation. They compared different techniques to locate the crack tip during crack propagation in the weak layer. Their study showed that different crack tip definitions based on displacement threshold (0.2 mm), on maximum stress or on the position of breaking bonds are equivalent. From their simulations we computed the downward acceleration of a beam section in the slab (Fig. C1, top row) at different crack propagation distances (Fig. C1, columns) and compared it to the number of breaking bonds. The maximum of downward acceleration occurred always at the time when the number of breaking bonds strongly increased. Therefore, the maximum of acceleration can be seen as a further equivalent definition of the crack tip.

Figure C1(a–c) Downward acceleration of the slab in a PST experiment with time. (d–f) Cumulated number of broken bonds between the discrete elements in the DEM simulation with time. The initial strong increase in broken bonds corresponds to the crack tip. For all three crack propagation distances, the time of the steep increasing flank of bond breaking is well aligned with the maximum of acceleration. NB: number of broken bonds.
The snow cover model SNOWPACK (version 3.60) was used to simulate the evolving snow stratigraphy at our field site (Lehning et al., 2002) (Fig. D1a). The model was driven with data from an automatic weather station (AWS) which was located 100 m next to the field site. From the weather station we used air temperature, relative humidity, snow surface temperature, wind speed, wind gust speed, wind direction and snow height (10 min averages). Short- and long-wave radiation data were obtained from another AWS, which is 1.7 km from the field site (IMIS station SLF 2; Intercantonal Measurement and Information System). The influence of the surrounding terrain (e.g. shading and reflection) on the short-wave radiation was accounted for using Alpine 3D (version 3.20) (Lehning et al., 2006). The snow cover mass balance was enforced with the increment of measured snow height from the weather station at the field site. The SNOWPACK standard soil profile was modified to better fit our field site on the flat roof of a building (0.5 m concrete above 5 m air), and a constant heat flux of 0.005 W m−2 was chosen. The simulation time step was 1 h. The SNOWPACK initiation file is available on EnviDat: https://doi.org/10.16904/envidat.365 (Bergfeld et al., 2023).
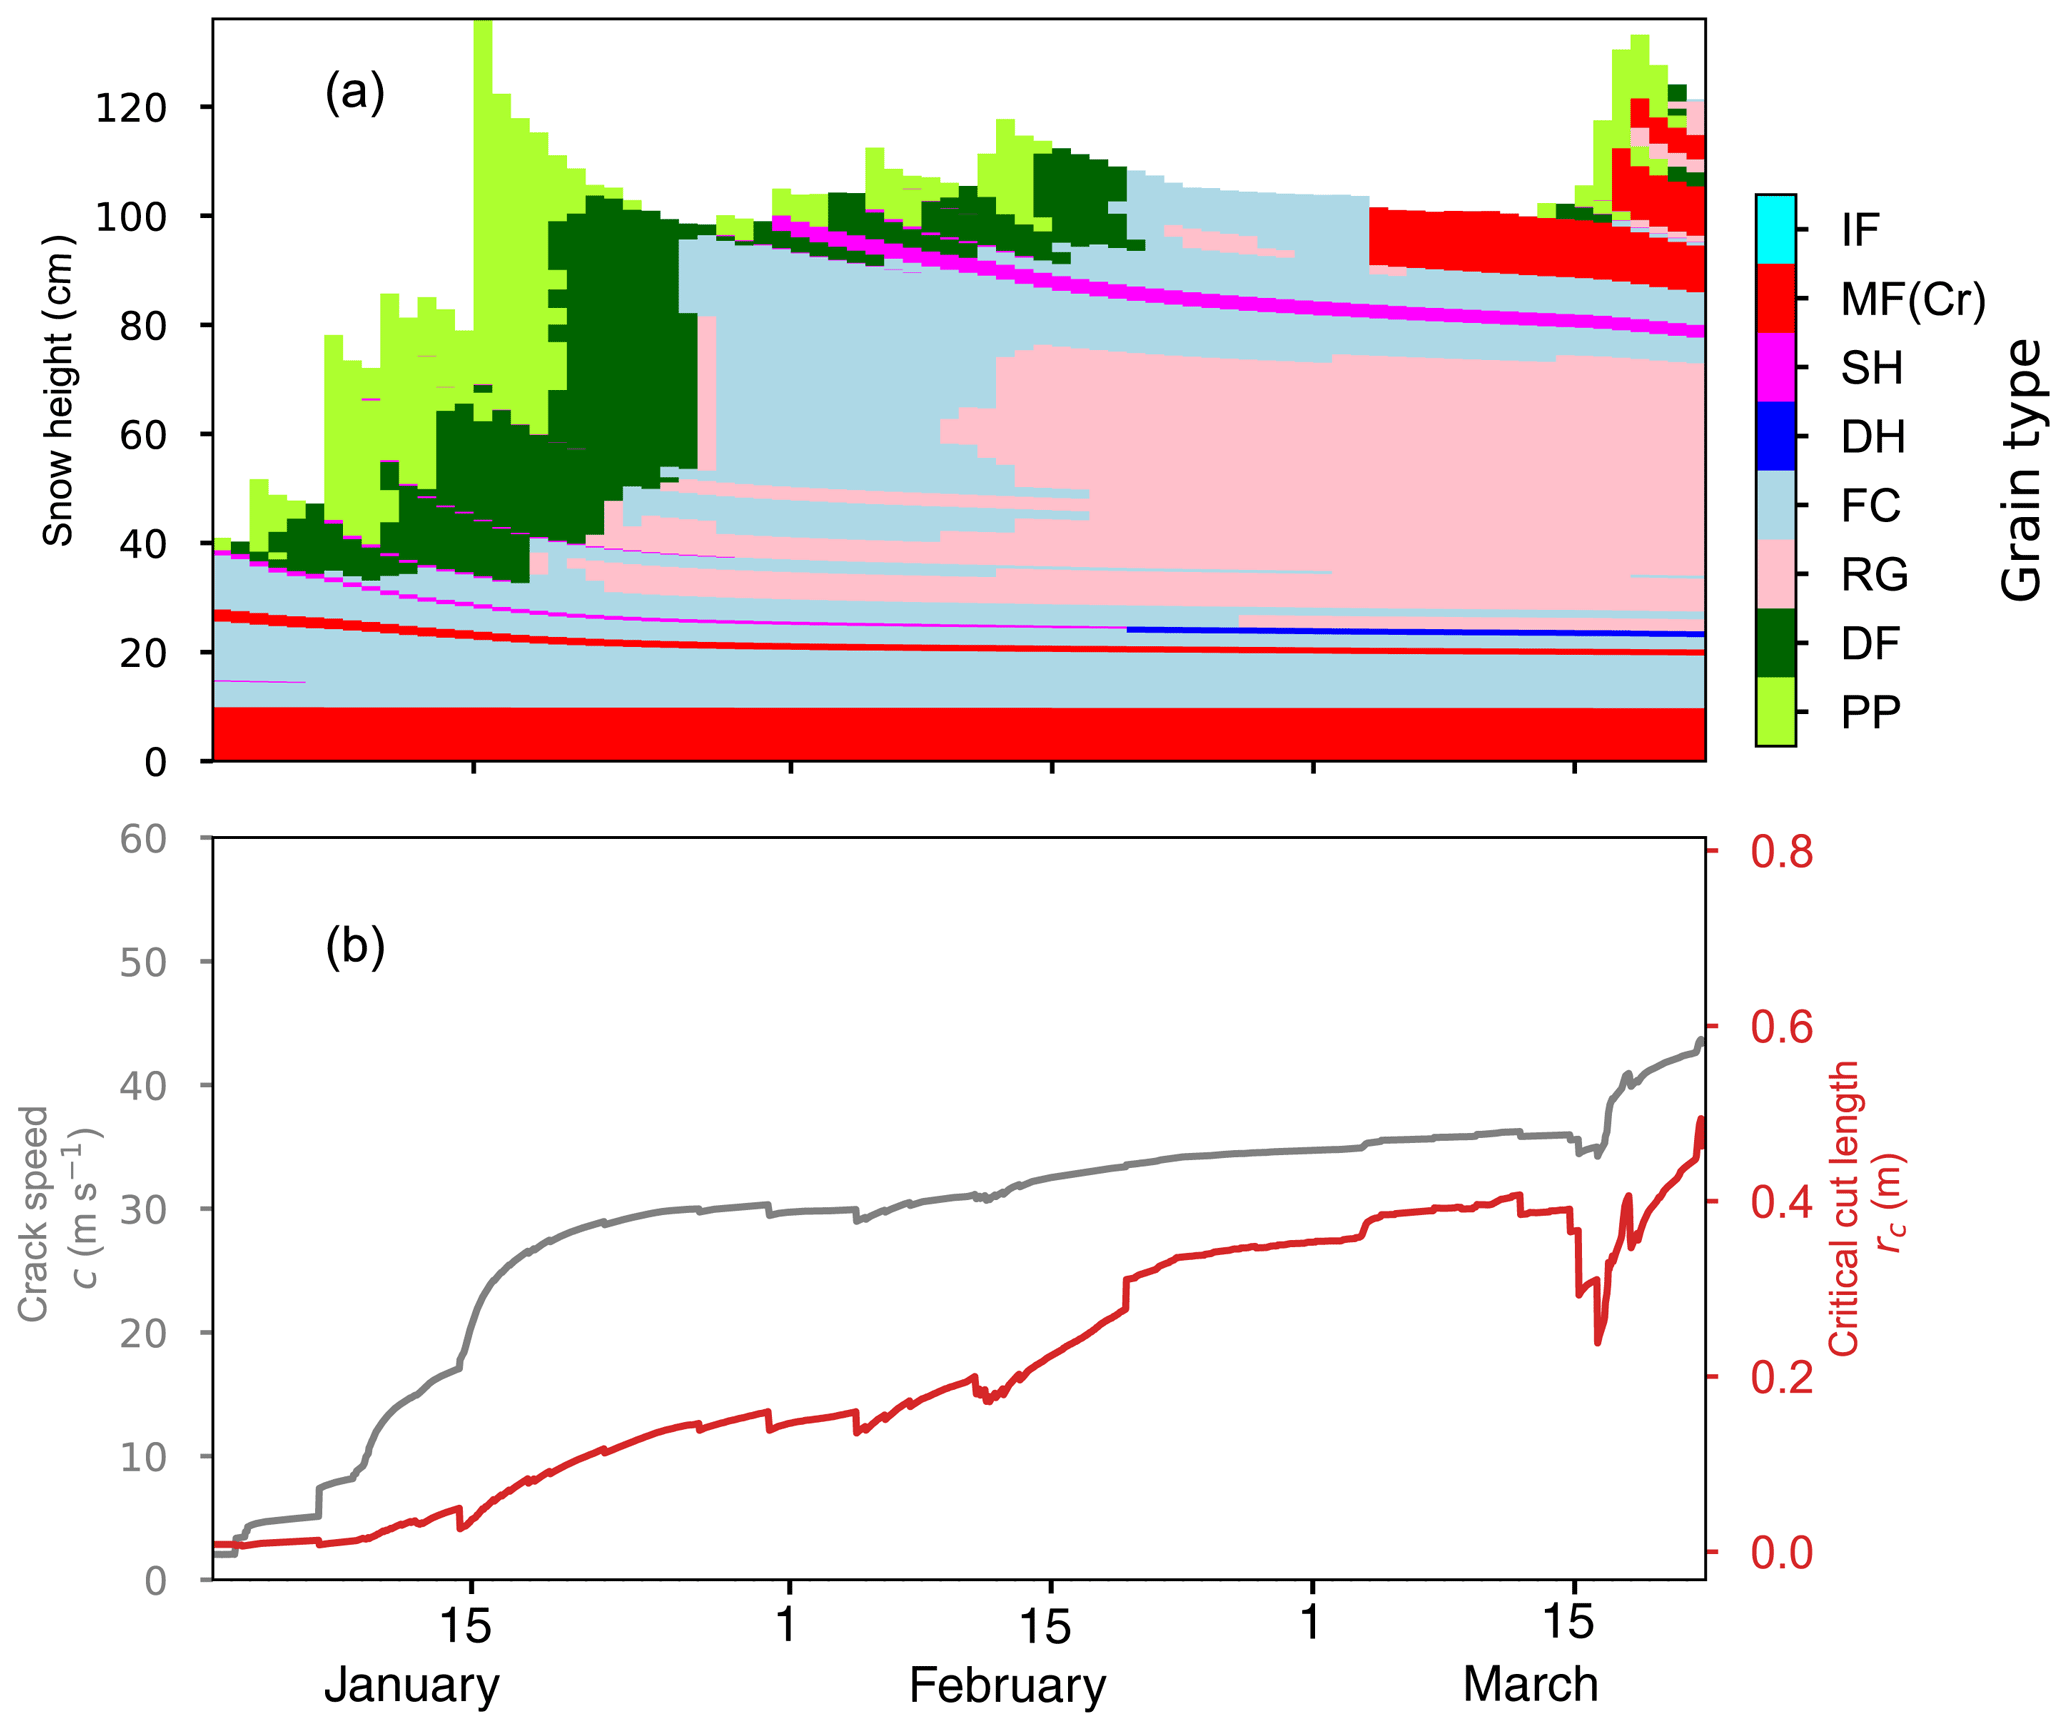
Figure D1(a) Temporal evolution of simulated snow stratigraphy. Colours represent grain types as indicated in the colour bar on the right. (b) Modelled crack speed (grey line) and modelled critical crack length, which were used to calculate SSP in Sect. 4.4. Grain types are coded after Fierz et al. (2009) and are precipitation particle (PP), decomposing and fragmented precipitation particle (DF), rounded grain (RG), faceted crystal (FC), depth hoar (DH), surface hoar (SH), melt form (MF), melt–freeze crust (MFcr), and ice formations (IF).
High-speed recordings and processed data are available on EnviDat: https://doi.org/10.16904/envidat.365 (Bergfeld et al., 2023).
JS and AvH designed the research and together with BB and GB developed the experimental setup. BB and AvH carried out the experimental work. BB processed the high-speed recordings. PLR, PW and VA helped and partly performed the analysis of the mechanical models to assess mechanical properties, and JD contributed to all parts of the project. The manuscript was written by BB with input from all authors.
The contact author has declared that none of the authors has any competing interests.
Publisher’s note: Copernicus Publications remains neutral with regard to jurisdictional claims in published maps and institutional affiliations.
Achille Capelli, Christine Seupel, Colin Lüond, Alexander Hebbe, Simon Caminada, Bettina Richter and Stephanie Mayer assisted with fieldwork. Flavia Mäder helped with the DIC analysis, and Frank Techel provided the avalanche activity data. We thank Edward Bair and an anonymous reviewer for their helpful comments.
This research has been supported by the Swiss National Science Foundation (grant no. 200021_169424).
This paper was edited by Pascal Haegeli and reviewed by Edward Bair and one anonymous referee.
Bair, E. H., Simenhois, R., van Herwijnen, A., and Birkeland, K.: The influence of edge effects on crack propagation in snow stability tests, The Cryosphere, 8, 1407–1418, https://doi.org/10.5194/tc-8-1407-2014, 2014.
Behiri, J. C. and Bonfield, W.: Crack velocity dependence of longitudinal fracture in bone, J. Mater. Sci., 15, 1841–1849, https://doi.org/10.1007/BF00550605, 1980.
Bergfeld, B., van Herwijnen, A., Reuter, B., Bobillier, G., Dual, J., and Schweizer, J.: Dynamic crack propagation in weak snowpack layers: insights from high-resolution, high-speed photography, The Cryosphere, 15, 3539–3553, https://doi.org/10.5194/tc-15-3539-2021, 2021.
Bergfeld, B., van Herwijnen, A., Bobillier, G., Larose, E., Moreau, L., Trottet, B., Gaume, J., Cathomen, J., Dual, J., and Schweizer, J.: Crack propagation speeds in weak snowpack layers, J. Glaciol., 68, 557–570, https://doi.org/10.1017/jog.2021.118, 2022.
Bergfeld, B., van Herwijnen, A., and Schweizer, J.: Time series data on dynamic crack propagation in long propagation saw tests, EnviDat [data set], https://doi.org/10.16904/envidat.365, 2023.
Birkeland, K. W., van Herwijnen, A., Knoff, E., Staples, M., Bair, E. H., and Simenhois, R.: The role of slabs and weak layers in fracture arrest, Proceedings ISSW 2014. International Snow Science Workshop, Banff, Alberta, Canada, 29 September–3 October 2014, 156–168, 2014.
Birkeland, K. W., van Herwijnen, A., Reuter, B., and Bergfeld, B.: Temporal changes in the mechanical properties of snow related to crack propagation after loading, Cold Reg. Sci. Technol., 159, 142–152, https://doi.org/10.1016/j.coldregions.2018.11.007, 2019.
Bobillier, G., Bergfeld, B., Dual, J., Gaume, J., van Herwijnen, A., and Schweizer, J.: Micro-mechanical insights into the dynamics of crack propagation in snow fracture experiments, Sci. Rep., 11, 11711, https://doi.org/10.1038/s41598-021-90910-3, 2021.
Bobillier, G., Bergfeld, B., Dual, J., Gaume, J., van Herwijnen, A., and Schweizer, J.: Numerical investigation of crack propagation regimes in snow fracture experiments, Granul. Matter, in review, 2023.
Capelli, A., Kapil, J. C., Reiweger, I., Or, D., and Schweizer, J.: Speed and attenuation of acoustic waves in snow: laboratory experiments and modelling with Biot's theory, Cold Reg. Sci. Technol., 125, 1–11, https://doi.org/10.1016/j.coldregions.2016.01.004, 2016.
Fierz, C., Armstrong, R. L., Durand, Y., Etchevers, P., Greene, E., McClung, D. M., Nishimura, K., Satyawali, P. K., and Sokratov, S. A.: The International Classification for Seasonal Snow on the Ground, HP-VII Technical Documents in Hydrology, IACS Contribution No. 1, UNESCO-IHP, Paris, France, 90 pp., 2009.
Fond, C. and Schirrer, R.: Influence of crack speed on fracture energy in amorphous and rubber toughened amorphous polymers, Plast. Rubber Compos., 30, 116–124, https://doi.org/10.1179/146580101101541525, 2001.
Freund, L. B.: Dynamic Fracture Mechanics, Cambridge Monographs on Mechanics, Cambridge University Press, Cambridge, 563 pp., https://doi.org/10.1017/CBO9780511546761, 1990.
Gaume, J., Chambon, G., Eckert, N., and Naaim, M.: Relative influence of mechanical and meteorological factors on avalanche release depth distributions: An application to French Alps, Geophys. Res. Lett., 39, L12401, https://doi.org/10.1029/2012gl051917, 2012.
Gaume, J., Schweizer, J., van Herwijnen, A., and Chambon, G.: Why are hard snow slabs more prone to wide-scale crack propagation?, European Geosciences Union General Assembly 2014, 24 April–2 May 2014, Vienna, Austria, Geophysical Research Abstracts, 16, EGU2014-12901, 2014.
Gaume, J., Chambon, G., Eckert, N., Naaim, M., and Schweizer, J.: Influence of weak layer heterogeneity and slab properties on slab tensile failure propensity and avalanche release area, The Cryosphere, 9, 795–804, https://doi.org/10.5194/tc-9-795-2015, 2015.
Gaume, J., van Herwijnen, A., Chambon, G., Wever, N., and Schweizer, J.: Snow fracture in relation to slab avalanche release: critical state for the onset of crack propagation, The Cryosphere, 11, 217–228, https://doi.org/10.5194/tc-11-217-2017, 2017.
Gaume, J., Chambon, G., van Herwijnen, A., and Schweizer, J.: Stress concentrations in weak snowpack layers and conditions for slab avalanche release, Geophys. Res. Lett., 45, 8363–8369, https://doi.org/10.1029/2018GL078900, 2018a.
Gaume, J., Gast, T., Teran, J., van Herwijnen, A., and Jiang, C.: Dynamic anticrack propagation in snow, Nat. Commun., 9, 3047, https://doi.org/10.1038/s41467-018-05181-w, 2018b.
Gauthier, D. and Jamieson, J. B.: Towards a field test for fracture propagation propensity in weak snowpack layers, J. Glaciol., 52, 164–168, https://doi.org/10.3189/172756506781828962, 2006.
Gerling, B., Löwe, H., and van Herwijnen, A.: Measuring the elastic modulus of snow, Geophys. Res. Lett., 44, 11088–11096, https://doi.org/10.1002/2017GL075110, 2017.
Habermann, M., Schweizer, J., and Jamieson, J. B.: Influence of snowpack layering on human-triggered snow slab avalanche release, Cold Reg. Sci. Technol., 54, 176–182, https://doi.org/10.1016/j.coldregions.2008.05.003, 2008.
Hamre, D., Simenhois, R., and Birkeland, K.: Fracture speeds of triggered avalanches, Proceedings ISSW 2014. International Snow Science Workshop, Banff, Alberta, Canada, 29 September–3 October 2014, 174–178, 2014.
Heierli, J.: Solitary fracture waves in metastable snow stratifications, J. Geophys. Res., 110, F02008, https://doi.org/10.1029/2004JF000178, 2005.
Jamieson, J. B. and Johnston, C. D.: A fracture-arrest model for unconfined dry slab avalanches, Can. Geotech. J., 29, 61–66, https://doi.org/10.1139/t92-007, 1992.
Jamieson, J. B. and Schweizer, J.: Texture and strength changes of buried surface hoar layers with implications for dry snow-slab avalanche release, J. Glaciol., 46, 151–160, https://doi.org/10.3189/172756500781833278, 2000.
Johnson, B. C., Jamieson, J. B., and Stewart, R. R.: Seismic measurement of fracture speed in a weak snowpack layer, Cold Reg. Sci. Technol., 40, 41–45, https://doi.org/10.1016/j.coldregions.2004.05.003, 2004.
Jones, R. M.: Mechanics of Composite Materials, 2nd edn., Taylor & Francis, Philadelphia PA, USA, 538 pp., ISBN 9781560327127, 1999.
Kirchner, H. O. K., Michot, G., and Schweizer, J.: Fracture toughness of snow in shear and tension, Scr. Mater., 46, 425–429, https://doi.org/10.1016/S1359-6462(02)00007-6, 2002.
Lee, Y. and Prakash, V.: Dynamic fracture toughness versus crack tip speed relationship at lower than room temperature for high strength 4340VAR structural steel, J. Mech. Phys. Solids, 46, 1943–1968, https://doi.org/10.1016/S0022-5096(98)00031-3, 1998.
Lehning, M., Bartelt, P., Brown, R. L., and Fierz, C.: A physical SNOWPACK model for the Swiss avalanche warning; Part III: meteorological forcing, thin layer formation and evaluation, Cold Reg. Sci. Technol., 35, 169–184, https://doi.org/10.1016/S0165-232X(02)00072-1, 2002.
Lehning, M., Völksch, I., Gustafsson, D., Nguyen, T. A., Stähli, M., and Zappa, M.: ALPINE3D: a detailed model of mountain surface processes and its application to snow hydrology, Hydrol. Process., 20, 2111–2128, https://doi.org/10.1002/hyp.6204, 2006.
Meister, R.: Country-wide avalanche warning in Switzerland, Proceedings ISSW 1994, International Snow Science Workshop, Snowbird, Utah, USA, 30 October–3 November 1994, 58–71, 1995.
Monti, F., Gaume, J., van Herwijnen, A., and Schweizer, J.: Snow instability evaluation: calculating the skier-induced stress in a multi-layered snowpack, Nat. Hazards Earth Syst. Sci., 16, 775–788, https://doi.org/10.5194/nhess-16-775-2016, 2016.
Reuter, B. and Schweizer, J.: Describing snow instability by failure initiation, crack propagation, and slab tensile support, Geophys. Res. Lett., 45, 7019–7027, https://doi.org/10.1029/2018GL078069, 2018.
Reuter, B., Schweizer, J., and van Herwijnen, A.: A process-based approach to estimate point snow instability, The Cryosphere, 9, 837–847, https://doi.org/10.5194/tc-9-837-2015, 2015.
Richter, B., Schweizer, J., Rotach, M. W., and van Herwijnen, A.: Validating modeled critical crack length for crack propagation in the snow cover model SNOWPACK, The Cryosphere, 13, 3353–3366, https://doi.org/10.5194/tc-13-3353-2019, 2019.
Rosendahl, P. L. and Weißgraeber, P.: Modeling snow slab avalanches caused by weak-layer failure – Part 1: Slabs on compliant and collapsible weak layers, The Cryosphere, 14, 115–130, https://doi.org/10.5194/tc-14-115-2020, 2020a.
Rosendahl, P. L. and Weißgraeber, P.: Modeling snow slab avalanches caused by weak-layer failure – Part 2: Coupled mixed-mode criterion for skier-triggered anticracks, The Cryosphere, 14, 131–145, https://doi.org/10.5194/tc-14-131-2020, 2020b.
Scapozza, C.: Entwicklung eines dichte- und temperaturabhängigen Stoffgesetzes zur Beschreibung des visko-elastischen Verhaltens von Schnee, Doctoral thesis, Institut für Geotechnik, ETH Zurich, Zurich, Switzerland, 250 pp., https://doi.org/10.3929/ethz-a-004680249, 2004.
Schweizer, J., Jamieson, J. B., and Schneebeli, M.: Snow avalanche formation, Rev. Geophys., 41, 1016, https://doi.org/10.1029/2002RG000123, 2003.
Schweizer, J., Michot, G., and Kirchner, H. O. K.: On the fracture toughness of snow, Ann. Glaciol., 38, 1–8, https://doi.org/10.3189/172756404781814906, 2004.
Schweizer, J., van Herwijnen, A., and Reuter, B.: Measurements of weak layer fracture energy, Cold Reg. Sci. Technol., 69, 139–144, https://doi.org/10.1016/j.coldregions.2011.06.004, 2011.
Schweizer, J., Reuter, B., van Herwijnen, A., Jamieson, J. B., and Gauthier, D.: On how the tensile strength of the slab affects crack propagation propensity, in: Proceedings ISSW 2014. International Snow Science Workshop, Banff, Alberta, Canada, 29 September–3 October 2014, edited by: Haegeli, P., 164–168, 2014.
Schweizer, J., Reuter, B., van Herwijnen, A., Richter, B., and Gaume, J.: Temporal evolution of crack propagation propensity in snow in relation to slab and weak layer properties, The Cryosphere, 10, 2637–2653, https://doi.org/10.5194/tc-10-2637-2016, 2016.
Schweizer, J., Mitterer, C., Reuter, B., and Techel, F.: Avalanche danger level characteristics from field observations of snow instability, The Cryosphere, 15, 3293–3315, https://doi.org/10.5194/tc-15-3293-2021, 2021.
Shapiro, L. H., Johnson, J. B., Sturm, M., and Blaisdell, G. L.: Snow mechanics – Review of the state of knowledge and applications, US Army Cold Regions Research and Engineering Laboratory, Hanover, NH, USA, CRREL Report 97-3, 43, 1997.
Sigrist, C. and Schweizer, J.: Critical energy release rates of weak snowpack layers determined in field experiments, Geophys. Res. Lett., 34, L03502, https://doi.org/10.1029/2006GL028576, 2007.
Simenhois, R. and Birkeland, K.: Observations of fracture arrest at slab avalanche boundaries, Proceedings ISSW 2014. International Snow Science Workshop, Banff, Alberta, Canada, 29 September–3 October 2014, 179–184, 2014.
Statham, G., Haegeli, P., Greene, E., Birkeland, K., Israelson, C., Tremper, B., Stethem, C., McMahon, B., White, B., and Kelly, J.: A conceptual model of avalanche hazard, Nat. Hazards, 90, 663–691, https://doi.org/10.1007/s11069-017-3070-5, 2018.
Techel, F., Müller, K., and Schweizer, J.: On the importance of snowpack stability, the frequency distribution of snowpack stability, and avalanche size in assessing the avalanche danger level, The Cryosphere, 14, 3503–3521, https://doi.org/10.5194/tc-14-3503-2020, 2020.
Trottet, B., Simenhois, R., Bobillier, G., Bergfeld, B., van Herwijnen, A., Jiang, C. F. F., and Gaume, J.: Transition from sub-Rayleigh anticrack to supershear crack propagation in snow avalanches, Nat. Phys., 18, 1094–1098, https://doi.org/10.1038/s41567-022-01662-4, 2022.
van Herwijnen, A. and Heierli, J.: Measurement of crack-face friction in collapsed weak snow layers, Geophys. Res. Lett., 36, L23502, https://doi.org/10.1029/2009GL040389, 2009.
van Herwijnen, A. and Jamieson, B.: High-speed photography of fractures in weak snowpack layers, Cold Reg. Sci. Technol., 43, 71–82, https://doi.org/10.1016/j.coldregions.2005.05.005, 2005.
van Herwijnen, A. and Jamieson, J. B.: Snowpack properties associated with fracture initiation and propagation resulting in skier-triggered dry snow slab avalanches, Cold Reg. Sci. Technol., 50, 13–22, https://doi.org/10.1016/j.coldregions.2007.02.004, 2007.
van Herwijnen, A. and Miller, D. A.: Experimental and numerical investigation of the sintering rate of snow, J. Glaciol., 59, 269–274, https://doi.org/10.3189/2013JoG12J094, 2013.
van Herwijnen, A. and Schweizer, J.: Seismic sensor array for monitoring an avalanche start zone: design, deployment and preliminary results, J. Glaciol., 57, 267–276, https://doi.org/10.3189/002214311796405933, 2011.
van Herwijnen, A., Gaume, J., Bair, E. H., Reuter, B., Birkeland, K. W., and Schweizer, J.: Estimating the effective elastic modulus and specific fracture energy of snowpack layers from field experiments, J. Glaciol., 62, 997–1007, https://doi.org/10.1017/jog.2016.90, 2016.
Weißgraeber, P. and Rosendahl, P. L.: A closed-form model for layered snow slabs, The Cryosphere Discuss. [preprint], https://doi.org/10.5194/tc-2022-140, in review, 2022.
- Abstract
- Introduction
- Methods
- Results
- Discussion
- Conclusions
- Appendix A: Camera and digital image correlation settings
- Appendix B: Stiffness properties of the slab derived with the layered-slab model
- Appendix C: Crack tip estimation
- Appendix D: Snow cover modelling
- Data availability
- Author contributions
- Competing interests
- Disclaimer
- Acknowledgements
- Financial support
- Review statement
- References