the Creative Commons Attribution 4.0 License.
the Creative Commons Attribution 4.0 License.
 | 18 Aug 2023
Assimilation of Meteosat Third Generation (MTG) Lightning Imager (LI) pseudo-observations in AROME-France – proof of concept
Olivier Caumont
Eric Defer
This study develops a lightning data assimilation (LDA) scheme for the regional, convection-permitting numerical weather prediction (NWP) model AROME-France. The LDA scheme intends to assimilate total lightning, i.e., cloud-to-ground (CG) and inter- and intra-cloud (IC), of the future Meteosat Third Generation (MTG) Lightning Imager (LI; MTG-LI). MTG-LI proxy data are created, and flash extent density (FED) fields are derived. An FED forward observation operator (FFO) is trained based on modeled, column-integrated graupel mass from 24 storm days in 2018. The FFO is successfully verified for 2 independent storm days. With the FFO, the LDA adapts a 1-dimensional Bayesian (1DBay) retrieval followed by a 3-dimensional variational (3DVar) assimilation approach that is currently run operationally in AROME-France for radar reflectivity data. The 1DBay retrieval derives relative humidity profiles from the background by comparing the FED observations to the FED inferred from the background. Retrieved relative humidity profiles are assimilated as sounding data. The evaluation of the LDA comprises different LDA experiments and four case studies. It is found that all LDA experiments can increase the background integrated water vapor (IWV) in regions where the observed FED exceeds the FED inferred from AROME-France outputs. In addition, IWV can be reduced where spurious FED is modeled. A qualitative analysis of 6 h accumulated rainfall fields reveals that the LDA is capable of locating and initiating some local precipitation fields better than a radar data assimilation (RDA) experiment. However, the LDA also leads to rainfall accumulations that are too high at some locations. Fractions skill scores (FSSs) of 6 h accumulated rainfall are overall similar for the developed LDA and RDA experiments. An approach aiming at mitigating effects due to differences in the optical extents of lightning flashes and the area of the corresponding cloud was developed and included in the LDA; however, it does not always improve the FSS.
- Article
(8918 KB) - Full-text XML
- BibTeX
- EndNote


Convective weather phenomena such as thunderstorms threaten society by producing severe weather and related impacts, e.g., flash floods, large hail, tornadoes, and strong winds. Cloud electrification and subsequent lightning discharges are caused by interactions of different ice particles inside convective clouds. The process makes lightning an effective tracer of deep convection. The new type of lightning locating systems (LLSs) on geostationary (GEO) satellites allows for continuous large-scale monitoring of total, i.e., cloud-to-ground (CG) and inter- and intra-cloud (IC), lightning activity. The Geostationary Lightning Mappers (GLMs) on the GOES-R series satellites cover the Americas and the adjacent oceans (Goodman et al., 2013). A similar instrument, the Lightning Imager (LI), was launched in December 2022 on board the first Meteosat Third Generation (MTG; MTG-LI) satellite to monitor lightning over Europe, Africa, and large portions of the Atlantic Ocean, among other regions (Dobber and Grandell, 2014). High-quality GEO data are also available in data-sparse regions with limited access, such as over oceans and mountainous terrain as well as countries without radar networks. GEO lightning data may become important for numerical weather prediction (NWP), potentially improving the initial state of the model and the accuracy of the predicted storm location, timing, and intensity. Lightning data assimilation (LDA) addresses this objective.
However, LDA is not trivial. Operational models, e.g., the Application of Research to Operations at Mesoscale (AROME) model (Brousseau et al., 2016), the regional operational model of Météo-France, do not include any explicit representation of lightning. Other difficulties of lightning data assimilation include the ephemeral nature of lightning relative to the life cycle of thunderstorms, and time–space shifts between observations and the background, which are usual at the storm scale, challenge up-to-date data assimilation systems (zero-spread, zero-gradient problems) (e.g., Janisková and Lopez, 2013). Background errors are not Gaussian, and lightning is more related to lower-impact variables such as hydrometeor content and vertical velocity than to thermodynamic variables. Despite those difficulties, previous studies have shown the benefits of LDA for forecasts of convection and related phenomena.
Early LDA studies used NWP models that parametrize convection. Lightning data controlled the activation of the convective parametrization scheme (CPS). Often nudging techniques were applied to modify the model humidity and wind fields (e.g., Papadopoulos et al., 2005; Mansell et al., 2007; Lagouvardos et al., 2013; Giannaros et al., 2016) or latent heat (e.g., Pessi and Businger, 2009). These studies reported positive effects of LDA on the score of precipitation forecasts, especially for the location and quantity of heavy rain.
When NWP models resolve convection (< 3 km horizontal resolution), so-called lightning proxies can be used to relate NWP output to lightning observations. Some previous studies suggested and tested cloud top height, cloud top pressure, and cold cloud depth as predictors to estimate the lightning density (e.g., Price and Rind, 1992, 1993; Allen and Pickering, 2002; Wong et al., 2013; Giannaros et al., 2015; Karagiannidis et al., 2019).
Recent developments corroborate the use of cloud dynamics or ice hydrometeors, e.g., graupel, for reliable lightning proxies. Indeed, field campaigns like those reported by Deierling et al. (2008) found a strong correlation between lightning activity and ice mass fluxes. Deierling and Petersen (2008) showed a robust relationship between total lightning rate and updraft characteristics, especially the updraft volume. Buiat et al. (2017) analyzed CloudSat Cloud Profiling Radar (CPR) to relate cloud ice water content (IWC) and effective radius (ER) to LINET (Betz et al., 2009) lightning strokes. They found that high IWC and high ER are favorable to CG strokes. Graupel contributes to both high IWC and high ER. Strong on-going updrafts can cause high IWC. Hence, the findings agree with the studies of Deierling et al. (2008) and Deierling and Petersen (2008).
Various lightning proxies have been tested in NWP studies. McCaul et al. (2009) related domain-wide peaks of proxies based on ice-phase hydrometeor fields, one related to upward fluxes and the second related to vertically integrated ice content, to peaks of the flash rate density and suggested a blended solution using both proxies. Yair et al. (2010) introduced a lightning potential index (LPI) that is calculated using the simulated grid‐scale vertical velocity and simulated hydrometeor mass mixing ratios of liquid water, cloud ice, snow, and graupel. Barthe et al. (2010) concluded that none of precipitation ice mass, ice water path, ice mass flux product, updraft volume, maximum vertical velocity, and cloud top height could predict the lightning flash rates and trends well for both of their two cases. However, more recent studies of Formenton et al. (2013), Federico et al. (2014), and Bovalo et al. (2019) confirm a key role of graupel in the cloud electrification and use ice and/or graupel content for the lightning simulation and proxy definition.
With the lightning proxies, lightning observation operators are created to compare the model output to the lightning observations and assimilate the lightning data. Most of the recent LDA schemes use lightning operators based on ice hydrometeors or updraft characteristics, e.g., graupel mass or updraft volume. In the following, a brief overview of LDA techniques is presented, with the focus on 3-dimensional variational (3DVar) LDA and studies to assimilate GLM data.
Fierro et al. (2012) put forward a widely used (e.g., Dixon et al., 2016; H. Wang et al., 2017; Federico et al., 2017; Y. Wang et al., 2017) concept of lightning proxy, calculating water vapor mixing ratio from simulated graupel mass and observed flash rates. They then increased the water vapor mixing ratio in the 0 to −20 ∘C layer where lightning was observed and the relative humidity (RH) of the background was less than 81 %. Precipitating convection was better correlated with observed reflectivity fields for the LDA than for the control experiment. The method was further tested by Fierro et al. (2014) using 10 min flash extent density (FED). Lynn et al. (2015) and Marchand and Fuelberg (2014) refined the nudging technique of Fierro et al. (2012) to increase the virtual temperature perturbation and favor static instability or to warm the source layer of the convective updraft, respectively. Lynn et al. (2015) also introduced an extension to suppress spurious convection. Other nudging-based LDAs make use of ice-phase particle mixing ratios (e.g., Qie et al., 2014; Wang et al., 2018) and radar reflectivity pseudo-observations (Wang et al., 2014).
Mansell (2014) and Allen et al. (2016) assimilated synthetic GLM total lightning represented as FED using an ensemble Kalman filter (EnKF). Mansell (2014) used both the simulated flash rate and a linear relationship between total lightning and graupel volume as observation operators. Allen et al. (2016) recommend a linear best fit operator based on graupel mass and graupel volume. In preparation of a hybrid variational–ensemble LDA technique for GLM, Apodaca et al. (2014) assimilated World Wide Lightning Location Network (WWLLN) data in the Weather Research and Forecasting (WRF) model. However, the use of WWLLN as a GLM proxy is debatable as WWLLN mainly detects CG flashes, whereas GLM detects total lightning.
A 3DVar LDA was applied by Y. Wang et al. (2017) using the relationship given by Fierro et al. (2012) and assimilated pseudo-RH profiles in the form of sounding data. They noted increased forecast skills in general but also that the method still needs improvement to suppress spurious convection. Fierro et al. (2016) replaced their previous nudging by a 3DVar LDA with 10 min FED. They found that the radar data assimilation (RDA) yielded better forecasts of convective cells during the first 30 min of the forecast, while the LDA gave better storm structures 1 h into the forecast. The combination of both RDA and LDA provided the highest forecast skill. Fierro et al. (2019) tested the 3DVar LDA technique developed for ground-based data with GLM total lightning observations. It adjusts the water vapor mass mixing ratio (qv) in regions of lightning by setting RH to 95 % in a layer 3 km above the lifted condensation level (LCL) if the background RH is less than 95 %. Both LDA and RDA improved the short-term accumulated precipitation and radar reflectivity composite. Hu et al. (2020) adopted the technique of Fierro et al. (2019) and found, as also previously reported, a wet bias in the model that increased with the forecast time. The method still misses a suppression of spurious convection in regions without lightning. They also conducted a layer depth sensitivity study with similar results for adding qv in layers of 2 to 10 km depth. Kong et al. (2020) present an LDA of real GLM data in an EnKF framework. FED at 10 km pixel resolution is assimilated using both graupel mass and graupel volume-based observation operators, with positive results on the convection forecasts. The LDA of Chinese satellite Fengyun-4 (FY4) lightning data was realized by Liu et al. (2020) through creating pseudo-RH profiles and by Chen et al. (2020) through retrieving maximum proxy-reflectivity and finally pseudo-reflectivity profiles from the lightning data.
The main goal of this work is to develop a 3DVar LDA for MTG-LI data to improve analyses and forecasts, especially in convective situations. Pseudo-observations of the MTG-LI are generated to form the lightning database (Sect. 3). A novel LDA scheme is developed for the regional, operational, convective-scale model AROME-France of Météo-France. Various approaches in which FED is assimilated together with or without radar reflectivity and Doppler wind are compared to assess the added value of the developed LDA. Recent Var LDAs using GLM data, e.g., Fierro et al. (2019) and Hu et al. (2020), cannot suppress spurious convection. Our LDA of GEO lightning data should promote convection if needed and also suppress spurious convection.
The NWP model configuration and lightning data as used for this work are briefly explained in Sects. 2 and 3, respectively. Section 4 introduces the lightning observation operator developed for this study. Then, our LDA method and the model experiments are explained in Sects. 5 and 6. Section 7 describes the AROME-France analysis resulting from LDA. One of four case studies is detailed using different assimilation experiments, including the new LDA. Finally, Sect. 9 concludes this work.
AROME-France is the convective-scale, limited-area model run operationally by Météo-France since 2008 (Seity et al., 2011). It provides 36 to 42 h forecasts five times a day (00:00, 03:00, 06:00, 12:00, 18:00 UTC). After an update in 2015, the model grid comprises 1440×1536 grid points in the horizontal with uniform 1.3 km horizontal resolution. The physical model domain and model topography are shown in Fig. 1. In the vertical, the lowest model level is situated at around 5 m above ground. Each column extends up to the pressure level of 10 hPa. The vertical resolution is refined homogeneously from top to bottom by a factor of 1.5. In total, 90 vertical levels (33 levels below 2000 m) are computed. Model time steps equal 50 s. Model dynamics are non-hydrostatic, semi-implicit, and semi-Lagrangian. Lateral boundary conditions (LBCs) are extracted from the global model ARPEGE (Bouyssel et al., 2022). AROME-France features a Davies relaxation (Davies, 1976) coupling and ARPEGE synchronization. The initial conditions rely on a 3DVar data assimilation technique (Sect. 5).
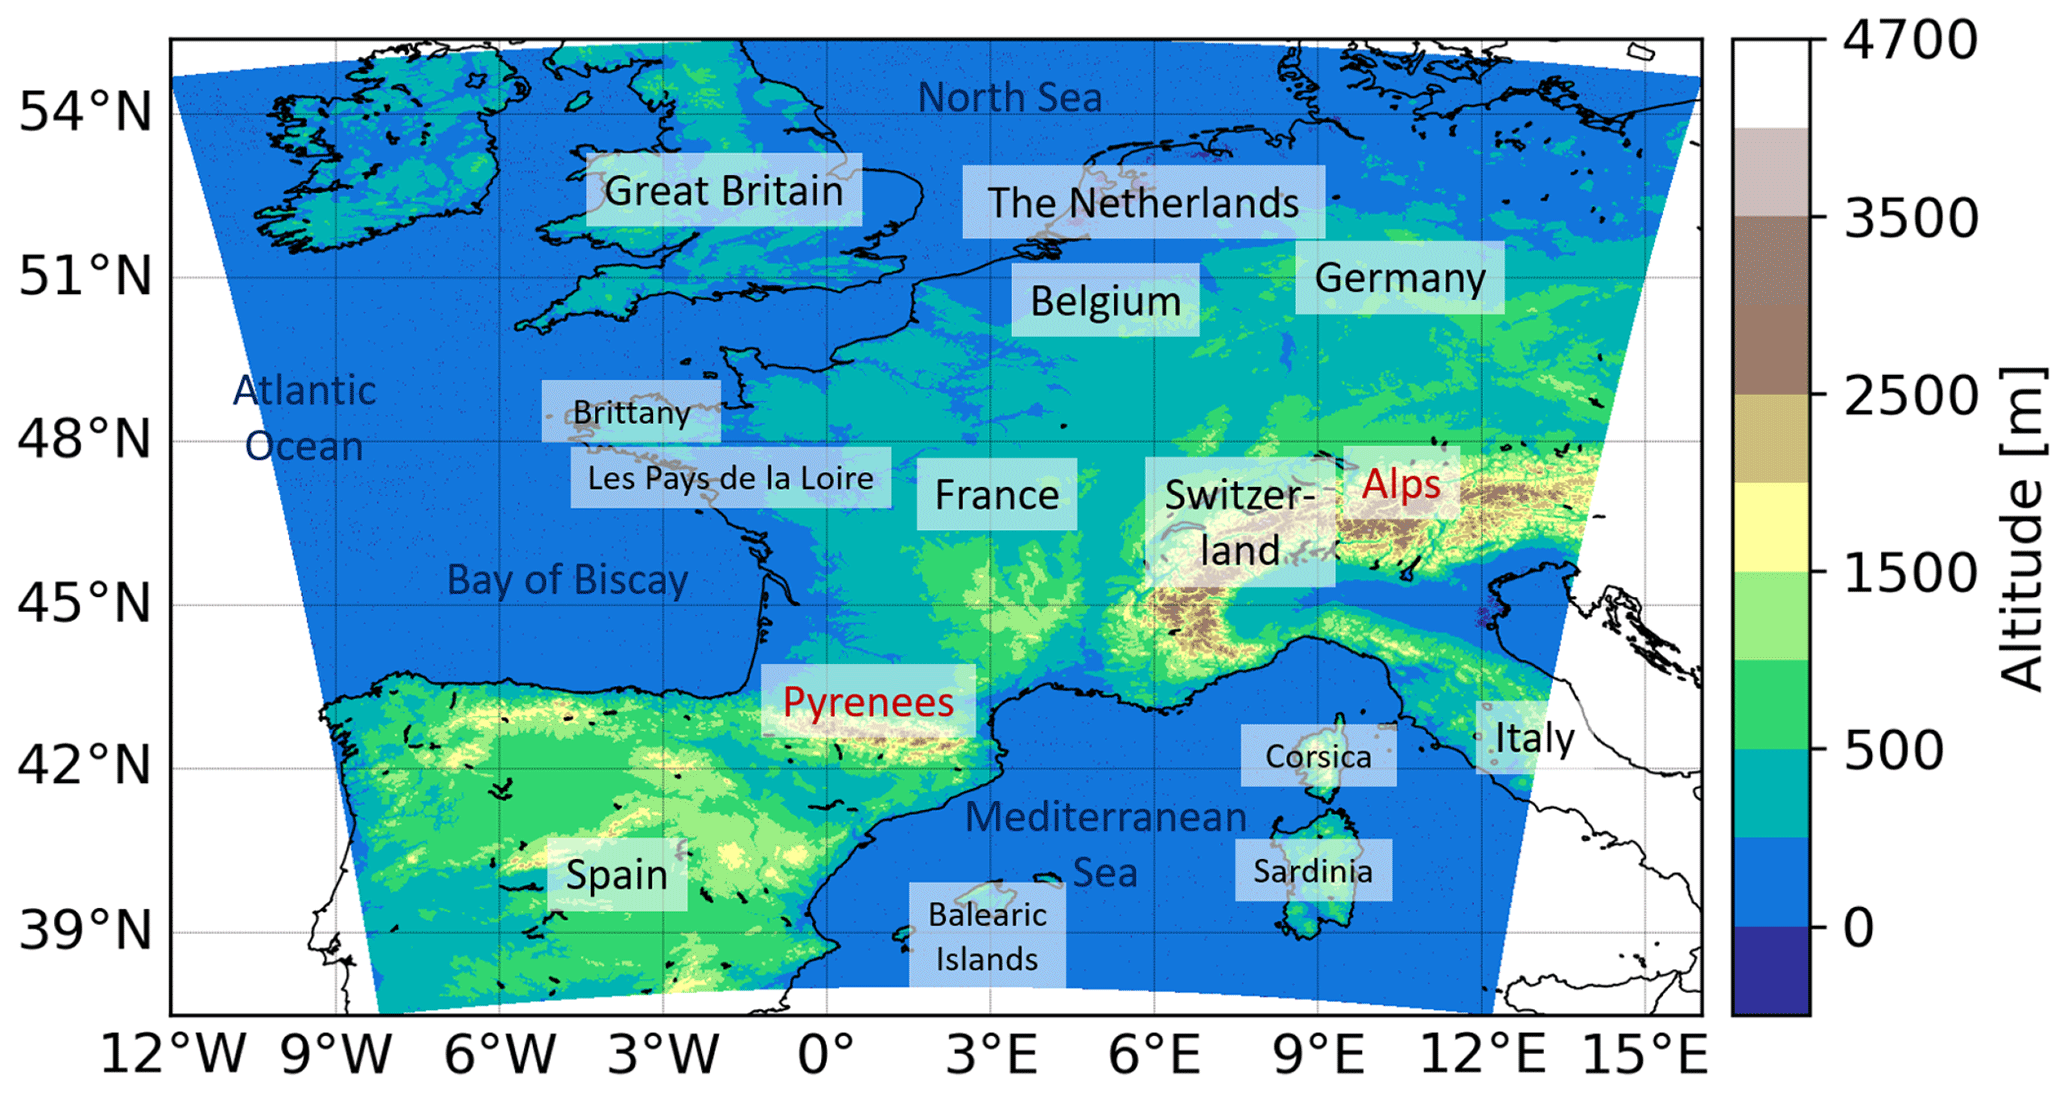
Figure 1AROME-France physical domain and model topography. The AROME-France horizontal grid is equidistant at 1.3 km resolution.
Deep convection is expected to be mostly resolved on the model grid (Fischer et al., 2018). Parametrization of sub-grid-scale shallow convection is based on Pergaud et al. (2009). AROME-France uses a mixed-phase microphysical scheme with riming processes and graupel (Seity et al., 2011). In particular, the microphysics scheme of AROME-France separates five prognostic hydrometeor variables that are specific contents of precipitating species rain (qr), snow (qs), and graupel (qg) and the two non-precipitating species ice crystals (qi) and cloud droplets (qc). In addition, the water vapor specific content qv (also termed specific humidity) is computed. Hail is assumed to behave as large graupel particles. Overall, more than 25 processes are parametrized into the microphysics scheme (Lascaux et al., 2006). AROME-France physics include a 1-dimensional (1D) turbulence parametrization as a combination of a prognostic turbulent kinetic energy (TKE) equation with a diagnostic mixing length. An externalized surface (SURFEX) scheme and the European Center for Medium-Range Weather Forecasts (ECMWF) radiation parametrization are other components of AROME-France model physics. Details can be found in Seity et al. (2011) and Brousseau et al. (2016).
This work adapts the GEO lightning pseudo-observation generator as developed by Erdmann et al. (2022). It was trained using low-frequency (LF) ground-based National Lightning Detection Network (NLDN) records collected over the southeast US. The LF ground-based lightning observations in this study are provided by the French network Meteorage (Schulz et al., 2016; Pédeboy, 2015) as input. Meteorage locates total lightning with a discrimination between CG strokes and IC pulses. They are clustered to the flash level data using the same method as Erdmann et al. (2020), i.e., a spatiotemporal clustering with criteria of 20 km and 0.4 s. To verify Meteorage data as suitable input to the generator, Meteorage and NLDN observations were compared to space-borne ISS-LIS data as common reference (Erdmann, 2020): the flash detection efficiency (DE) of NLDN relative to ISS-LIS was about 76 %. ISS-LIS detected about 59 % of the NLDN flashes. In France, Meteorage flash DE relative to ISS-LIS was about 83 %, while ISS-LIS detected about 57 % of the Meteorage flashes. It should be mentioned that the low-earth-orbit, optical ISS-LIS observes lightning in a different way than the ground-based LF networks, with different detection efficiencies for CG and IC flashes (e.g., Erdmann et al., 2020; Zhang et al., 2019). The statistical evaluation of general flash characteristics revealed that NLDN and Meteorage flashes feature similar distributions of flash extent (average of about 7.0 km), flash duration (average of about 0.2 s), and stroke and/or pulse number per flash (average of about 3.6). Meteorage, with shorter baseline distance than NLDN, recorded on average higher LF currents for the occurring flashes (average of 9.5 and 8.3 kA for Meteorage and NLDN, respectively). In all cases, flashes with a large extent, long duration, or a high number of ISS-LIS events or LF strokes and/or pulses were more likely detected by both LLSs than the small, short-duration flashes. Overall, Meteorage was validated as a suitable input to the GEO lightning pseudo-observation generator. Pseudo-observations of MTG-LI are then generated on a regular latitude–longitude grid with an average pixel resolution of 7 km, which approximates the expected MTG-LI resolution over France (Bartolomeo Viticchiè, personal communication, 2020). FEDs are calculated per 5 min interval that can then be summed as needed for the assimilation. This work uses a 10 min interval of FED data in the LDA that is centered at the time of the analysis (as done by Fierro et al., 2016; Hu et al., 2020). The short period around the analysis reduces displacement errors in the analysis. The domain is limited to 40 to 51∘ N and 5.5∘ W to 10∘ E, which is inside the AROME-France physical model domain. The pseudo-MTG-LI FED is referred to as FED observation hereafter to avoid confusion with the pseudo-observations (POs) created by the 1-dimensional Bayesian (1DBay) retrieval.
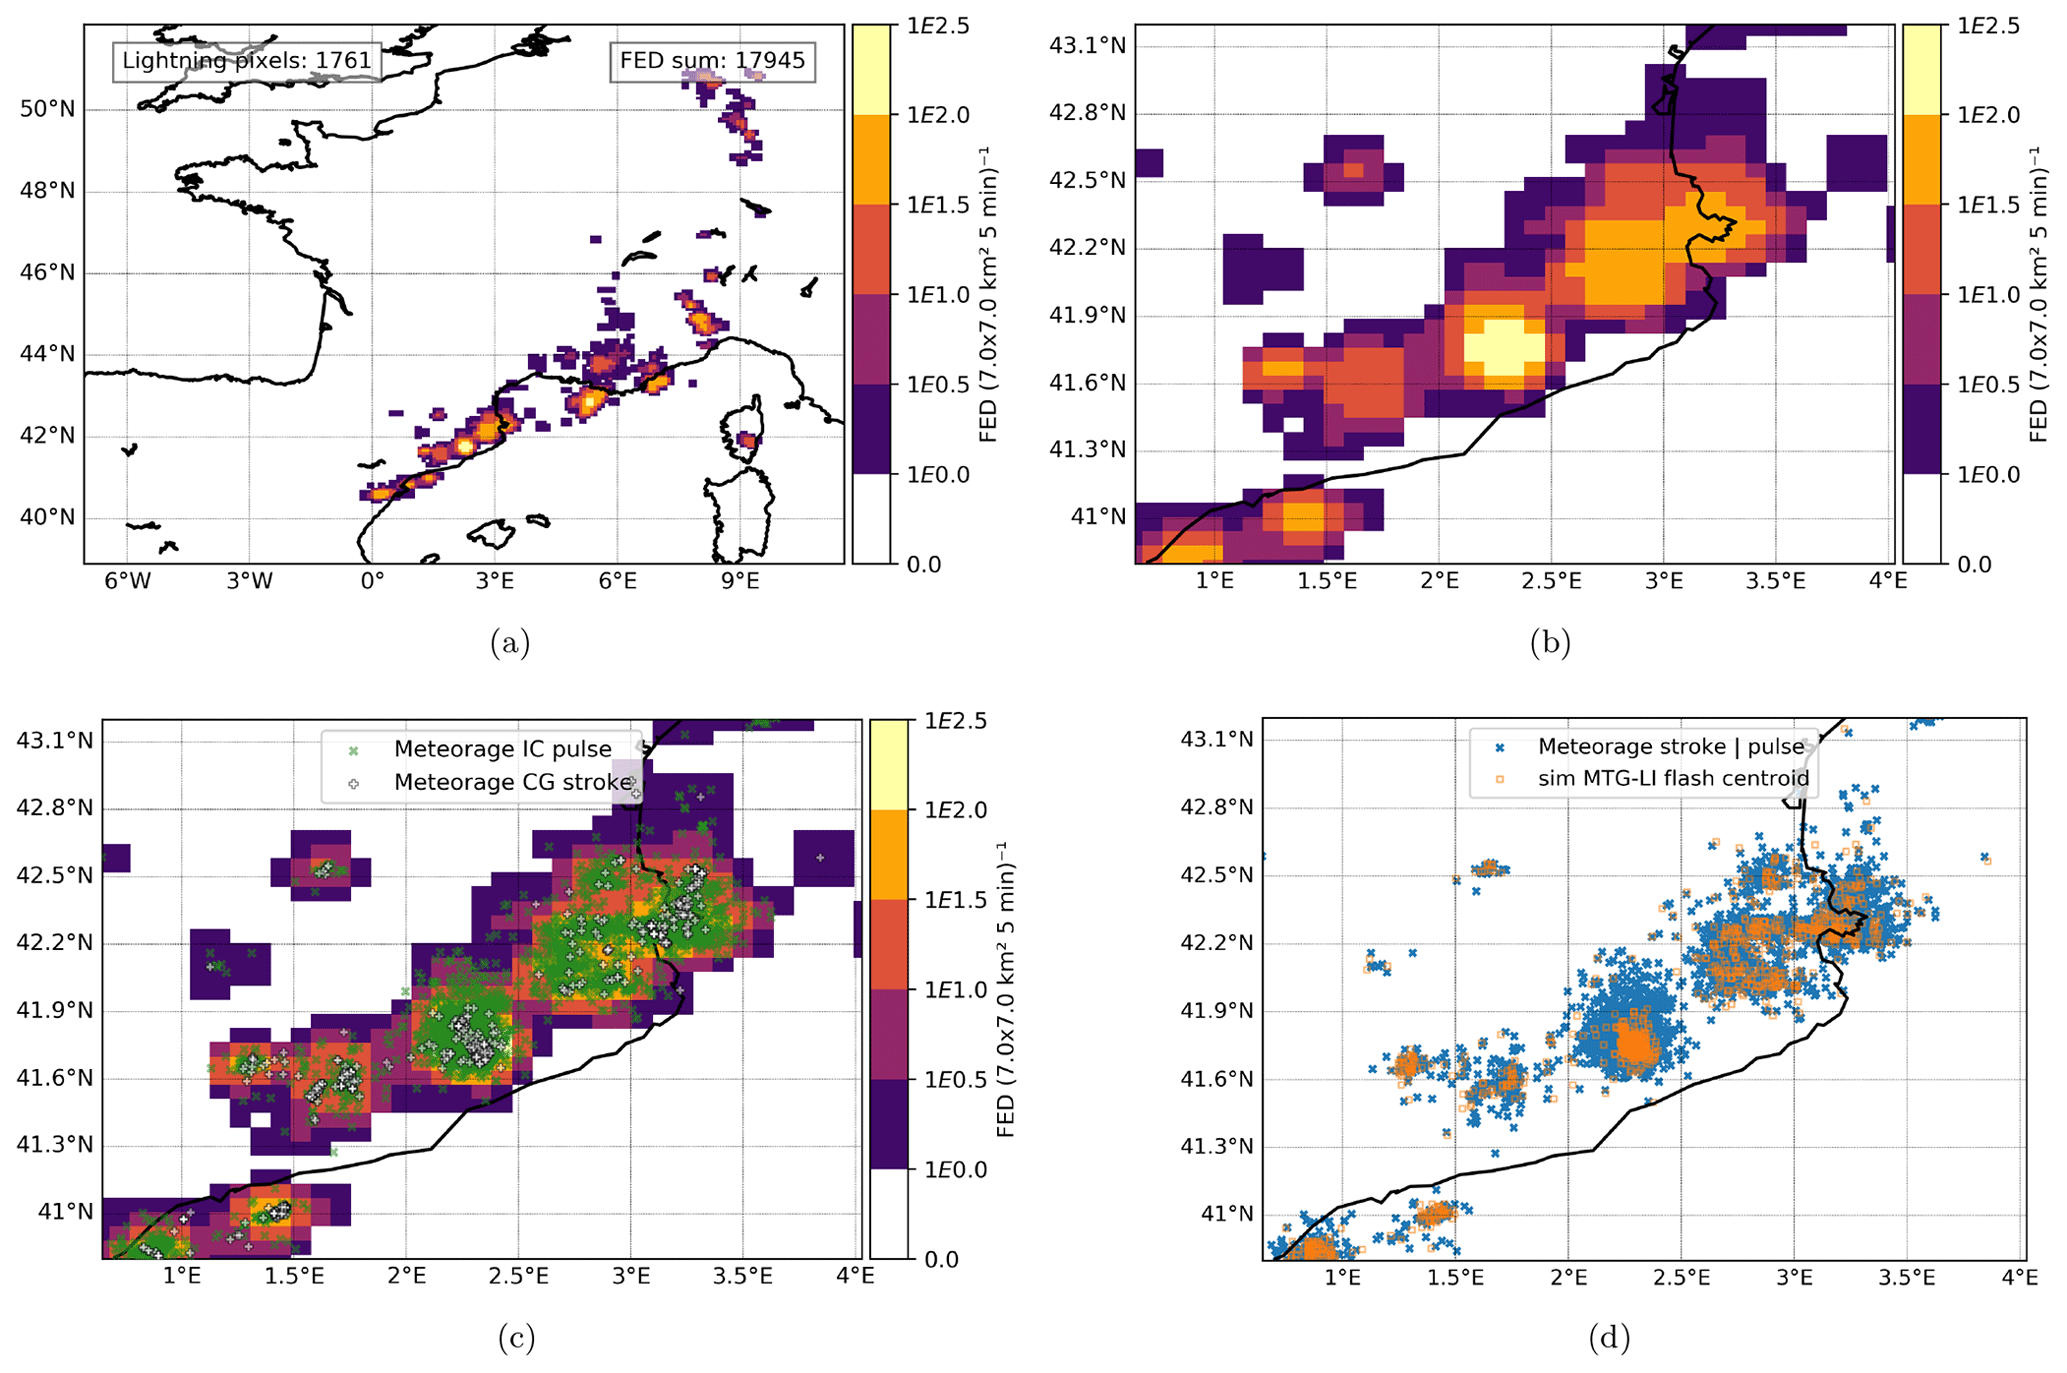
Figure 2Simulated MTG-LI FED in the entire domain (a) and zoomed-in region of the maximum FED value (b) on a 7 km × 7 km grid. The Meteorage strokes and pulses that were used to generate the MTG-LI flashes are superimposed on the FED in (c). Simulated MTG-LI flash centroids and the corresponding Meteorage strokes plus pulses in (d). Example for the period from 9 August 2018, 13:55 to 14:00 UTC.
An example of simulated MTG-LI is provided in Fig. 2a for the entire study domain, and Fig. 2b is a zoomed-in image of the FED maximum on 9 August 2018, 13:55 to 14:00 UTC. The regular latitude–longitude grid of the FED is obvious in Fig. 2b. Throughout the domain, the FED pixels have a size of roughly 7 km × 7 km.
Figure 2c superimposes the zoomed-in simulated FED and the Meteorage CG strokes and IC pulses that were used as input to the GEO lightning pseudo-observation generator. The vast majority of strokes and pulses lies within the area of non-zero FED. Figure 2d illustrates that the simulated MTG-LI flash centroids are situated within the corresponding Meteorage stroke and pulse distribution.
Previous studies suggest that graupel is a reliable proxy for lightning (see Sect. 1). Our observation operator is trained using the relationship found between MTG-LI FED observations and simulated graupel mass (mg) from the 1 h forecast of AROME-France for 24 d in 2018 (2 d per month). FED time periods of 10 min are used (e.g., as in Fierro et al., 2016; Hu et al., 2020) centered at the corresponding time of the AROME-France analysis. The mg profile is extracted from the AROME-France grid point closest to the FED pixel center. Thus, one specific mg profile is related to one FED value. This gives an equal count of FED and column-integrated mg values that are used to train and validate our observation operator. Following Deierling et al. (2008), mg is taken from layers where the temperature was below −5 ∘C. As a reminder, AROME-France graupel mass combines graupel and hail. All FED and column graupel mass values are further processed as climatological distributions (see Fig. 3) regardless of observation location and time. This approach is different from Deierling et al. (2008) and Barthe et al. (2010), who used storm-based relationships of case studies, and from McCaul et al. (2009), who used the domain-wide peak values. Pixel-to-pixel mg and FED were barely correlated in our study, with about a 0.09 Pearson correlation coefficient, likely as a consequence of a typical displacement of convection in the model by more than the FED spatial resolution of 7 km. The second approach with domain-wide peak values was not further tested as it reduces the sample size for a regression analysis drastically. Our observation operator uses a simple linear regression between observed FED and simulated column graupel mass. It is unbiased by definition. Our approach optimizes both the slope factor and the y intercept of the regression, whereas, e.g., McCaul et al. (2009) only used a proportionality between FED and a proxy.
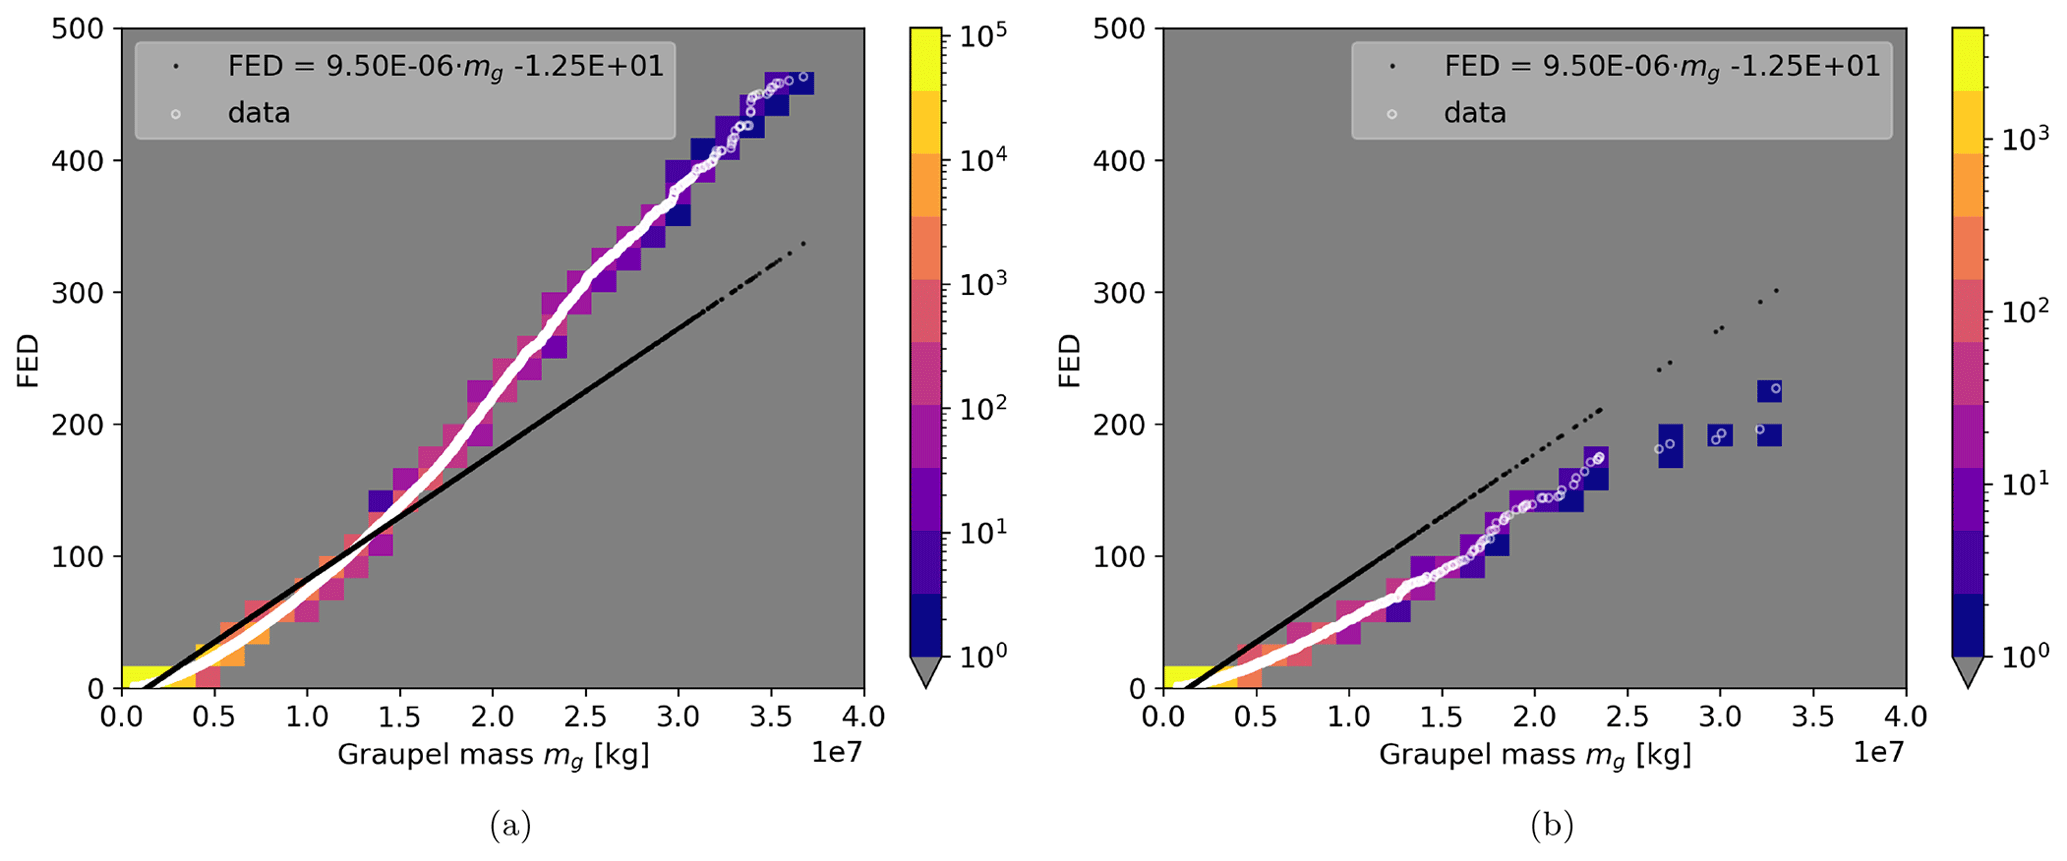
Figure 3The observed FED, per 10 min and on 7 km × 7 km pixels, climatological distribution versus the climatological distribution of AROME-France graupel mass mg at model grid points closest to each FED observation. The graupel mass is integrated vertically over the AROME-France grid point for a 1.3 km × 1.3 km pixel. Grid points with any FED or mg equal to zero are not considered. Panel (a) shows the training of a linear regression for 24 d in 2018, and (b) shows the results of a validation for independent data of 2 additional days in 2018. Colors indicate the number of samples, the white circles plot the data points, and black dots applied the mg values in the linear regression equation (see figure legend).
Figure 3 presents the analyzed linear relationship between FED and column-integrated graupel mass mg. The functions are obtained after sorting both the FED and mg data individually. Paired data points in Fig. 3 are geographically independent values as described in Combarnous et al. (2022). It should be noted that all pixels with either FED equal to zero or mg equal to zero are removed from the data. The observation operator represents the cases when lightning was actually observed. The training data (24 d) results are shown in Fig. 3a, and the results for 6 and 7 October 2018 as validation period can be seen in Fig. 3b. The Pearson correlation coefficient equals 0.97 for the training data and 0.92 for the validation data (0.96 combined).
Analyzing the training data, the linear relationship fits the majority of the data well. A discrepancy is identified for the largest graupel mass and FED values (Fig. 3). Here, the observation operator tends to underestimate the FED for a given graupel mass. The high values (of both FED and graupel mass) are rare relative to the lower values as indicated by the colored pixels in Fig. 3a. Hence, this observed discrepancy has little effect on the Pearson correlation coefficient. It should still be considered that high FED values are systematically underestimated. It is further noted that the y intercept is negative, meaning that statistically a certain mass of graupel is required to initiate lightning. This result is well in accordance with the widely accepted non-inductive charging as the main electrification process in extratropical storms.
The validation data (Fig. 3b) roughly follow the regression line inferred from the training data. One can see, however, that the slope is smaller than that of the black regression line; i.e., observed values of FED are always lower for a given mg than the training data imply. The number of FED–mg pairs is significantly lower for the 48 h validation case than for the 24 d training dataset. Furthermore, the validation data comprise one single meteorological situation, while the training data include several weather situations in different seasons. The observed discrepancy is considered during the evaluation of results.
FED cannot be assimilated directly since lightning is not predicted by AROME-France. The previously described observation operator relates the FED observations to the prognostic variables of the NWP model and allows for comparing background and observations. The final step prior to the assimilation creates pseudo-observations that can be ingested in the 3DVar system. Unlike Fierro et al. (2019), Hu et al. (2020), and others who used an empirical method to adjust moisture in thunderstorms, the expected water vapor PO is retrieved for each model grid column (applying Bayes' theorem) in a 1DBay approach. This allows us to (i) replace the humidity field in spurious convection areas with that of their convection-free environment and thus in principle abolish the wet bias that results from data assimilation techniques that only consider the occurrence of lightning (e.g., Fierro et al., 2012, 2019; Hu et al., 2020) and (ii) make use of the FED value to modulate the humidity field in observed lightning areas by leveraging the model's ability to create consistent, flow-dependent humidity and graupel profiles near the observation. Technically speaking, synthetic profiles are created and assimilated as sounding data.
5.1 The 1DBay retrieval
All FED values are transformed to units of decibels (dB) as to account for the large range of scales, referred to as dBFED. FED equal to zero is transformed to dBFED of −10 dB. In general, dBFED below 0 dB means linear FED less than 11 , i.e., no lightning activity. The 1DBay retrieval of POs of relative humidity RH, , is defined as
with the weights Wi for each point as
where i and j are counters for the grid points within the defined area, referred to as vicinity, FFO means the FED forward operator as a specific observation operator, and σo is the standard deviation of the 1DBay retrieval. Then dBFFO(xi) defines the simulated AROME-France dBFED by converting the output of the FFO to decibel units.
Equations (1) and (2) can be used with different model variables or diagnostics; e.g., the sensitivity test for σo as described in the following used rather than .
Each RH PO is the best estimation from a weighted linear combination of RH profiles taken from the model background in the vicinity of the FED observation.
The method was proposed by Caumont et al. (2010), used in the operational model AROME-France (Wattrelot et al., 2014), and applied by Borderies et al. (2019) for radar reflectivity data and Duruisseau et al. (2019) for microwave radiances. Here, weights are calculated based on differences between observed and simulated FED. The 1DBay retrieves the best estimate of RH at the center of each observed FED pixel from the background using Bayes' theorem. It is expected that the model can predict a quantity similar to the observations within a certain area in most cases. The vicinity is initially fixed to a square of 160 km × 160 km centered at the observation. This size follows the suggestion of Borderies et al. (2018, 2019). However, the FED pixels (about 7 km) are significantly larger than the radar reflectivity pixels (about 1 km), and a given vicinity contains less FED than radar data points to retrieve the expected profile. Hence, the vicinity is adapted to the specifications of the FED data. The 1DBay vicinities of 160, 320, and 500 km were tested regarding the RMSE between observed FED and retrieved FED (not shown). It was found that larger vicinities give lower overall RMSE as there are more background profiles to feed the retrieval and to find grid points that are similar to the FED observation. In consequence, all LDA experiments presented in the following use a 1DBay vicinity of 500 km.
The database comprises model forecasts at the observation time and in the vicinity of the observation location. Since FED has no vertical dimension, the covariance matrix is reduced to a single value of variance, , which is assumed to be constant. A small σo means that the retrieval favors columns with values close to the FED observation. This can produce accurate retrievals; however, no retrieval can be created when the difference between all simulated FEDs in the vicinity and the observed FED is large relative to σo (see Eq. 2 where weights approach 0 in that case). Large values of σo cause smoothing over all grid points in the vicinity of the observation. In that case, the likelihood to retrieve POs is high, at the cost of a less accurate retrieval potentially independent of the observation.
An assumption of the Bayesian retrieval is that differences between the observation and the model background, referred to as innovations, are Gaussian distributed. Figure 4 shows the PDF of innovations (FED observation minus AROME-France background FED – AROME_FED) for the 24 h assimilation cycles on 8 August 2018. The distribution is bell-shaped and centered at 0. It is symmetric, and the skewness is close to 0. Although the kurtosis is higher than for a classical Gaussian distribution, this distribution of innovations sufficiently fulfills the assumption of the 1DBay method to justify its use in this study.
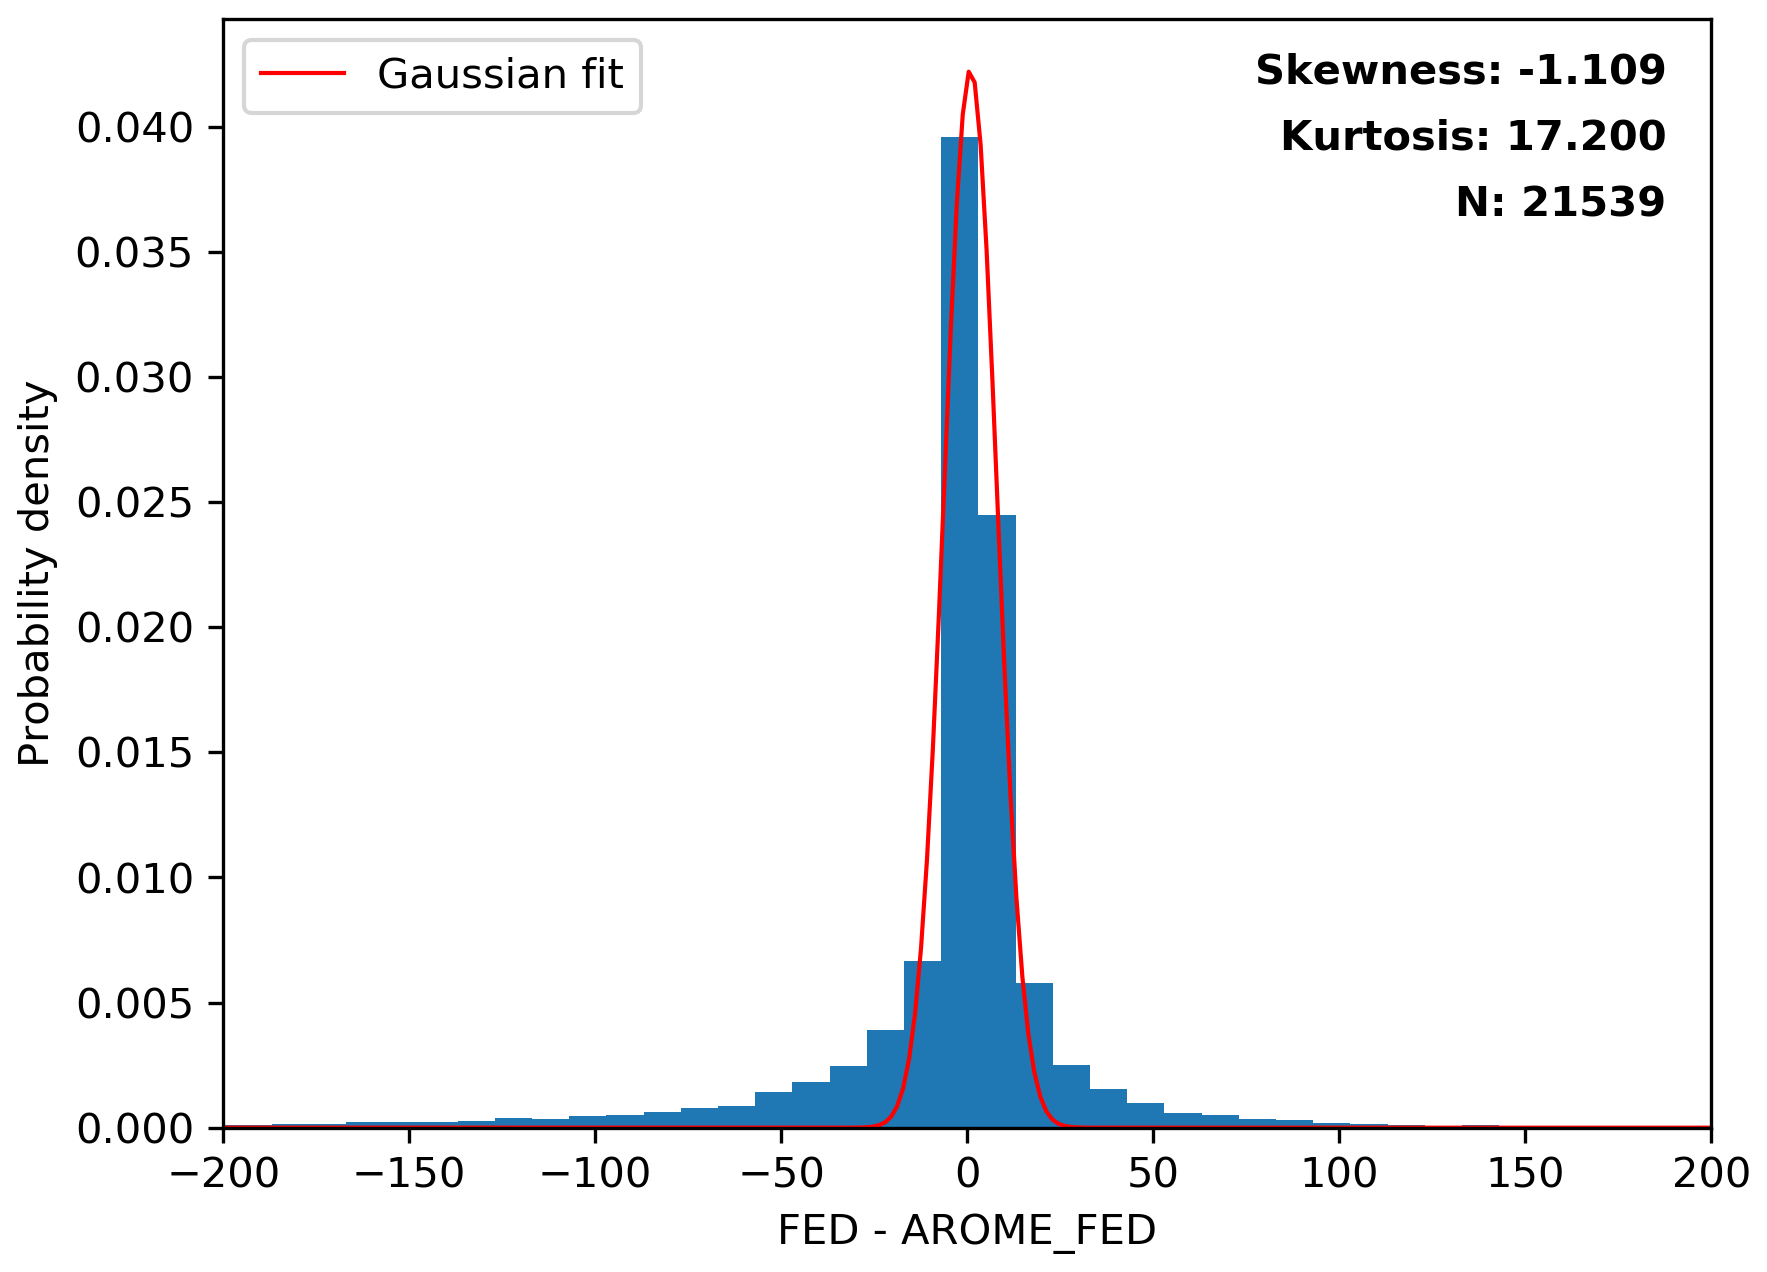
Figure 4Innovations of FED observation minus AROME_FED for the 24 h assimilation cycles on 8 August 2018. Skewness, kurtosis, and the sample size N are given. The red line shows the Gaussian fit on the PDF of the innovations.
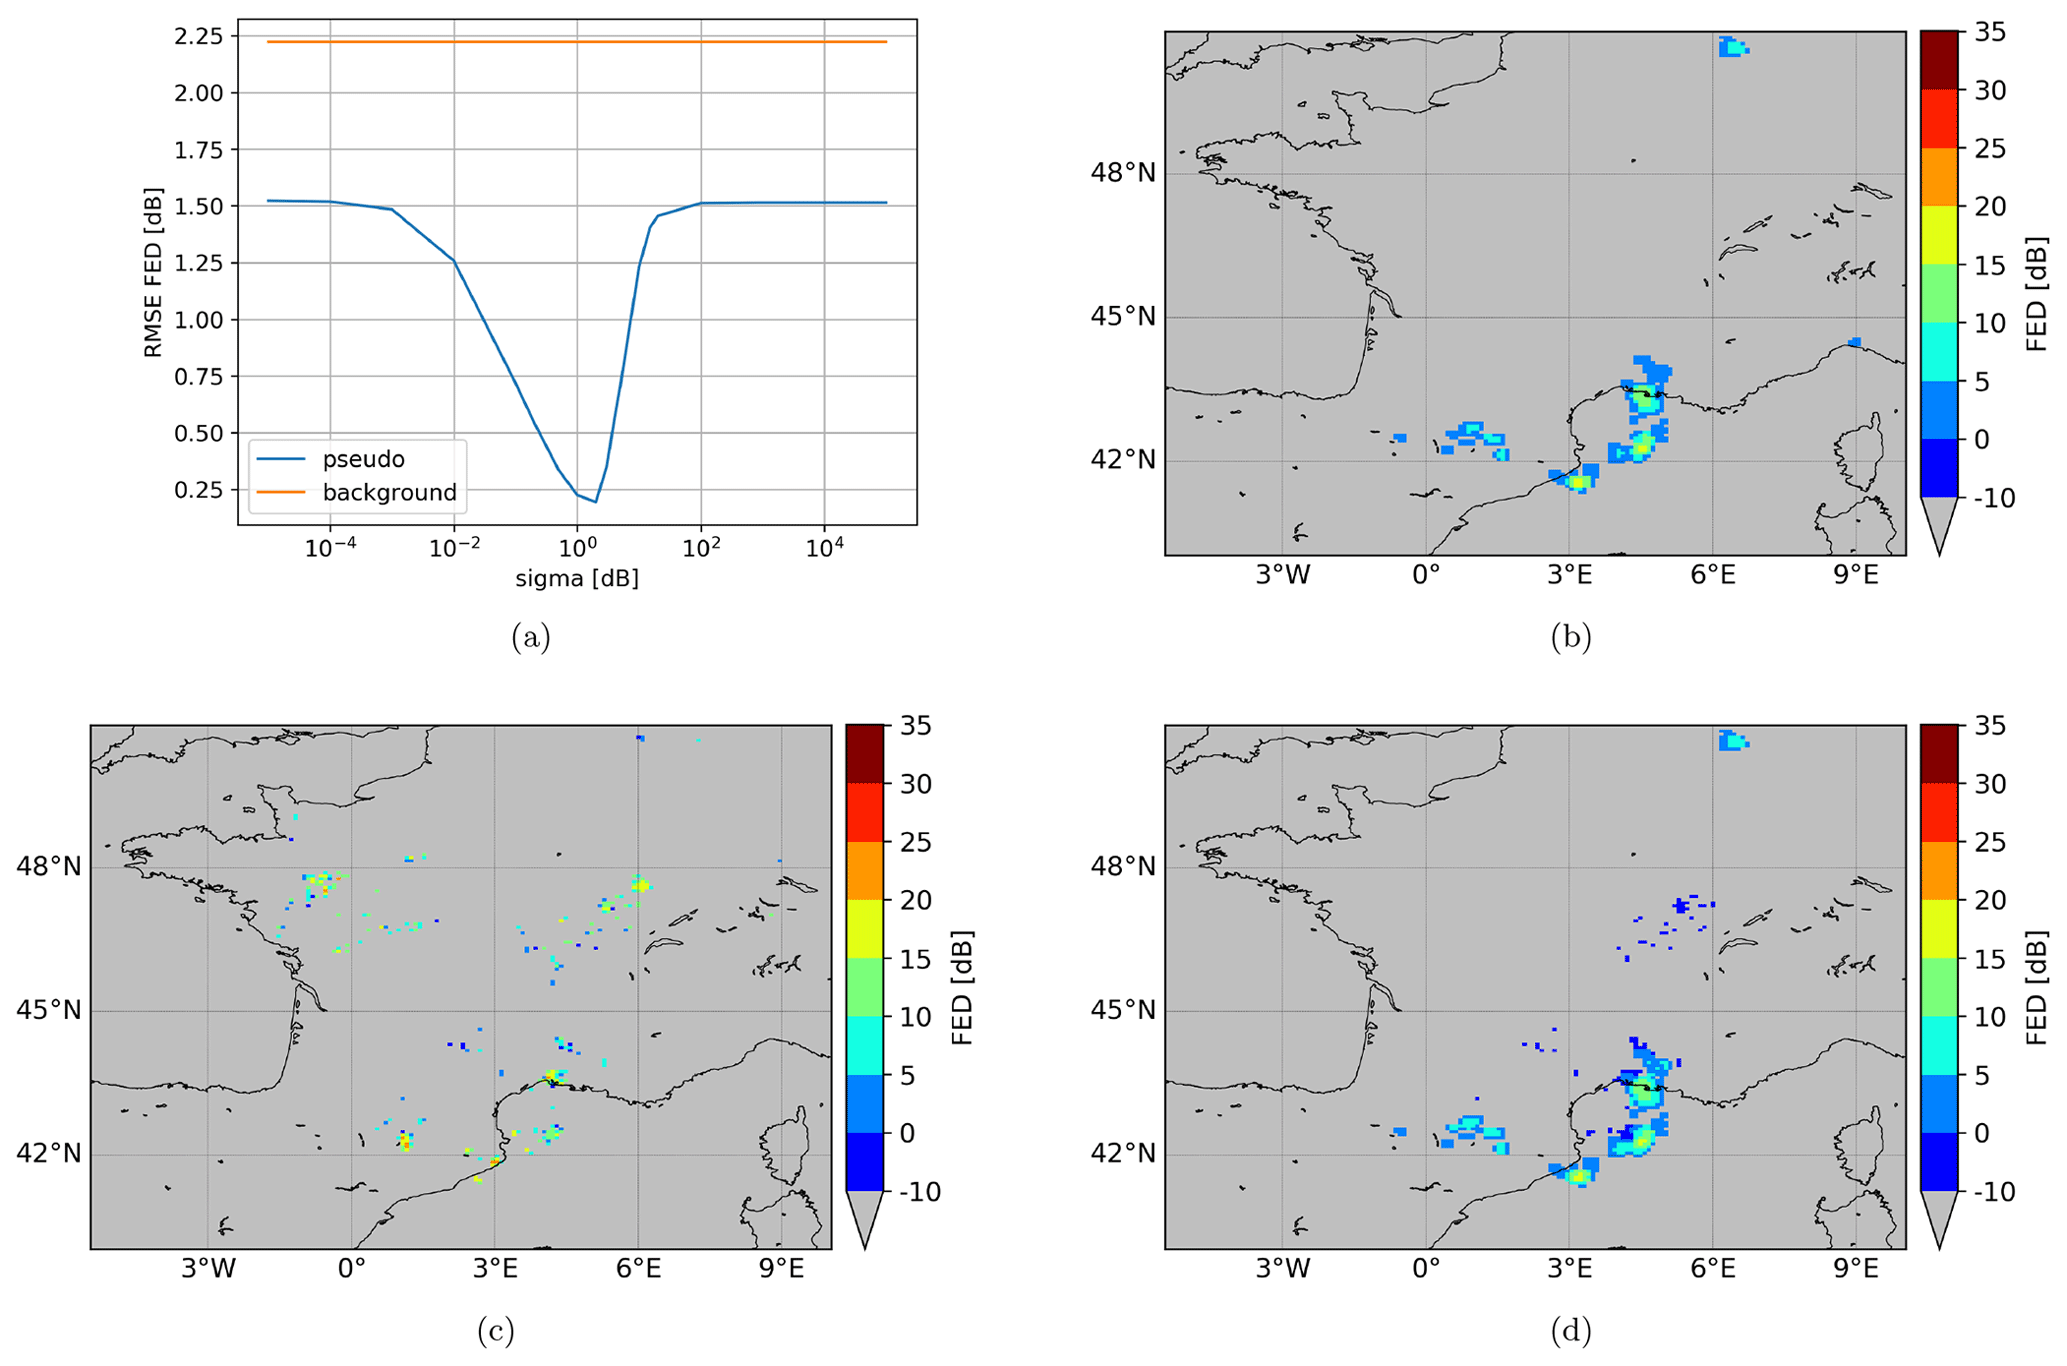
Figure 5(a) The sensitivity test for standard deviation σo of the 1DBay retrieval as inferred from the pixel-to-pixel RMSE between the dBFED observation and the AROME_dBFED (background), as well as the 1DBay-retrieved pseudo-dBFED (pseudo). The 7 October 2018, 00:00 UTC, case with the MTG-LI dBFED observation (b), the model background AROME_dBFED (c), and the 1DBay-retrieved pseudo-dBFED with a σo of 2 (d). Grey color means no lightning.
The value for the standard deviation σo of the observation and observation operator is inferred from a sensitivity study. It aims at minimizing the root mean square error (RMSE) between observed and retrieved pseudo-FED for the 24 training days also used in Sect. 4. Pixel-to-pixel RMSE is used for all non-zero FED pixels and 10 min intervals centered at each full hour. The pseudo-FED is computed from the joint use of the observation operator and the 1DBay retrieval. Figure 5a shows the curve of the RMSE between the dBFED observation (from pseudo-MTG-LI) and retrieved pseudo-dBFED from the 1DBay retrieval for different σo. The RMSE between AROME-France background dBFED (AROME_dBFED) that was obtained from the observation operator without an additional 1DBay is shown as reference. Including the 1DBay retrieval (blue curve in Fig. 5a) produces pseudo-dBFED much closer to the dBFED observation, i.e., lower RMSE, than the AROME_dBFED (orange curve in Fig. 5a). The minimum RMSE for the retrieval is found at σo of 2.0 dB. This value is used for retrieving the pseudo-RH profiles in the following.
Case studies of fields of observed, background, and retrieved dBFED are conducted to visualize the effect of σo on the pseudo-dBFED. The example of 7 October 2018, 00:00 UTC, is presented in Fig. 5b–d. The dBFED observation in Fig. 5b shows lightning activity mainly in the south center of the domain. Figure 5c indicates positive background dBFED in the region of lightning observations; however, it is also widespread near the center of the domain and over western France. The map of the 1DBay-retrieved pseudo-dBFED in Fig. 5d demonstrates that the method effectively reduces the spurious dBFED in these regions (retrieved dBFED below 0, grey and marine blue). In some regions, the 1DBay retrieves pseudo-dBFED to completely remove the spurious lightning, e.g., over western France and for some grid points over Switzerland. Spurious high values of AROME_dBFED near the center of the domain (Fig. 5c) are effectively decreased to negative dBFED (marine blue in Fig. 5d), in other words no lightning activity, similar to the observations in that region (Fig. 5b). Furthermore, the pseudo-dBFED values and areas of positive pseudo-dBFED in the south center of the domain closely match the dBFED observation. The observed, weak dBFED over the Gulf of Genoa could not be reproduced by the 1DBay retrieval as the background does not provide any positive dBFED in the retrieval vicinity.
An additional method, the humidity adjustment (HA), is applied if lightning (i.e., positive FED) is observed but all background FED values in the vicinity are zero. In this case, there is no estimated profile at this point, and all Wi in the vicinity equal zero. The HA is also applied if all background dBFED values within the vicinity of the FED observation are at least 10 dB smaller than the observed dBFED value. Although the sum of Wi can become greater than zero in this case, the retrieval would generate a profile that is too dry with respect to the FED observation. To produce RH POs, the layer between LCL and 13 km is saturated (i.e., RH set to 100 %) at all levels where the modeled RH is less than 100 %. This is conceptually similar to the method of Fierro et al. (2019), among others. However, the HA is only applied for a few pseudo-RH profiles where the 1DBay method did not retrieve POs. For instance, the HA only contributes to 1.6 % of almost 20 000 assimilated profiles during 8 August 2018, the study case that is detailed below.
Another case with Eqs. (1) and (2) equal to 0 for all weights may occur if the observed FED equals 0 and the background FED is positive for all grid points in its vicinity. This behavior was observed for the initial 160 km vicinity but not within the 320 and 500 km vicinities. Thus, if the vicinity has a sufficient size, there are background grid points without lightning activity that can be used in the 1DBay retrieval. If, however, the specified vicinity were too small, one would need to artificially remove spurious FED, i.e., convection and humidity, from the model.
Eventually, no pseudo-RH profiles are created if both the observed FED and the closest (in space) AROME-France background FED equal zero.
It should be mentioned that the 1DBay retrieval method was initially developed and applied to retrieve humidity and cloud profiles from passive and active remote sensing data (e.g., Olson et al., 1996; Kummerow et al., 2001). Caumont et al. (2010) brought this approach forward by restricting the 1DBay method to use model profiles at the forecast time and in the neighborhood of the observation. This approach was successfully applied by Wattrelot et al. (2014) and Borderies et al. (2019) for radar reflectivity assimilation in AROME-France. However, a 1DBay has not yet been used to retrieve humidity profiles from FED data. Whereas an FED greater than zero is always related to the presence of graupel and thus a RH profile with a cloud, an FED equal to zero does not necessarily mean a location without cloud coverage. It is the same problem which is faced for radar reflectivity but is presumably more marked than for the centimeter wavelength radars (Caumont et al., 2010) and even more than for the millimeter wavelength radars which are even more sensitive to the small hydrometeors (Borderies et al., 2019). In addition, FED is a 2-dimensional (2D) variable without vertical extent, while the 1DBay retrieves vertical RH profiles. The use of integrated column graupel mass as a proxy addresses the latter aspect by converting the 3D AROME-France outputs into a 2D variable comparable to FED. RH profiles are assimilated since assimilating hydrometeor contents when VAR is able to update these variables often results in poor performances because the cross correlations with key variables such as temperature and humidity are poorly represented in climatological B matrices. To mitigate this effect, some recent studies assimilate humidity along with hydrometeor contents (see, e.g., Wang et al., 2013, and Do et al., 2022, for radar reflectivity).
5.2 3DVar assimilation
The retrieved pseudo-RH profiles are assimilated as sounding data in the 3DVar assimilation system of AROME-France. AROME-France uses a 1 h assimilation window. The short assimilation cycles aim at partially overcoming the missing temporal dimension and at allowing the assimilation of more high-frequency observations that can improve the initial conditions especially on the convective scale. AROME-France operationally assimilates surface (e.g., ground stations, ships, buoys) and aircraft measurements, Global Positioning System (GPS) zenith tropospheric delay (ZTD) data, satellite brightness temperatures of several polar orbiting satellites and from Meteosat Second Generation (MSG) SEVIRI, satellite-based atmospheric motion vectors, and radar velocity and reflectivity data (Seity et al., 2011; Brousseau et al., 2016). The control variables are temperature, specific humidity, surface pressure, and horizontal wind components. The 3DVar system minimizes the 3DVar cost function J of the state vector x:
with the state vector of the background xb, the observation vector yo, the observation operator H, and the observation error covariance matrix R. The climatological background error covariance matrix B is inferred from offline AROME-France ensemble assimilation as a multivariate set of calculations for the control variable covariances and cross-covariances (Brousseau et al., 2014).
This section evaluates the effect of LDA relative to RDA. Since the application of the 1DBay retrieval for FED data constitutes a new approach, different experiments of AROME-France with respect to LDA are conducted. All experiments are initiated at 00:00 UTC and run for a forecast period of 30 h until 06:00 UTC the following day.
Table 1 lists the six different assimilation experiments. First, there is a control experiment used as reference without RDA, without Doppler wind velocity assimilation, and without LDA. It is called CTRL. The second experiment includes the use of radar data and is similar to the current operational AROME-France. It is referred to as RDA. All RDA experiments shown here assimilate both reflectivity and Doppler wind velocity.
Table 1Simulation and assimilation techniques of the different AROME-France experiments. They differ by the use of radar data assimilation (RDA) and lightning data assimilation (LDA), as well as the application of the noCloud (nC) filter as described in the text.
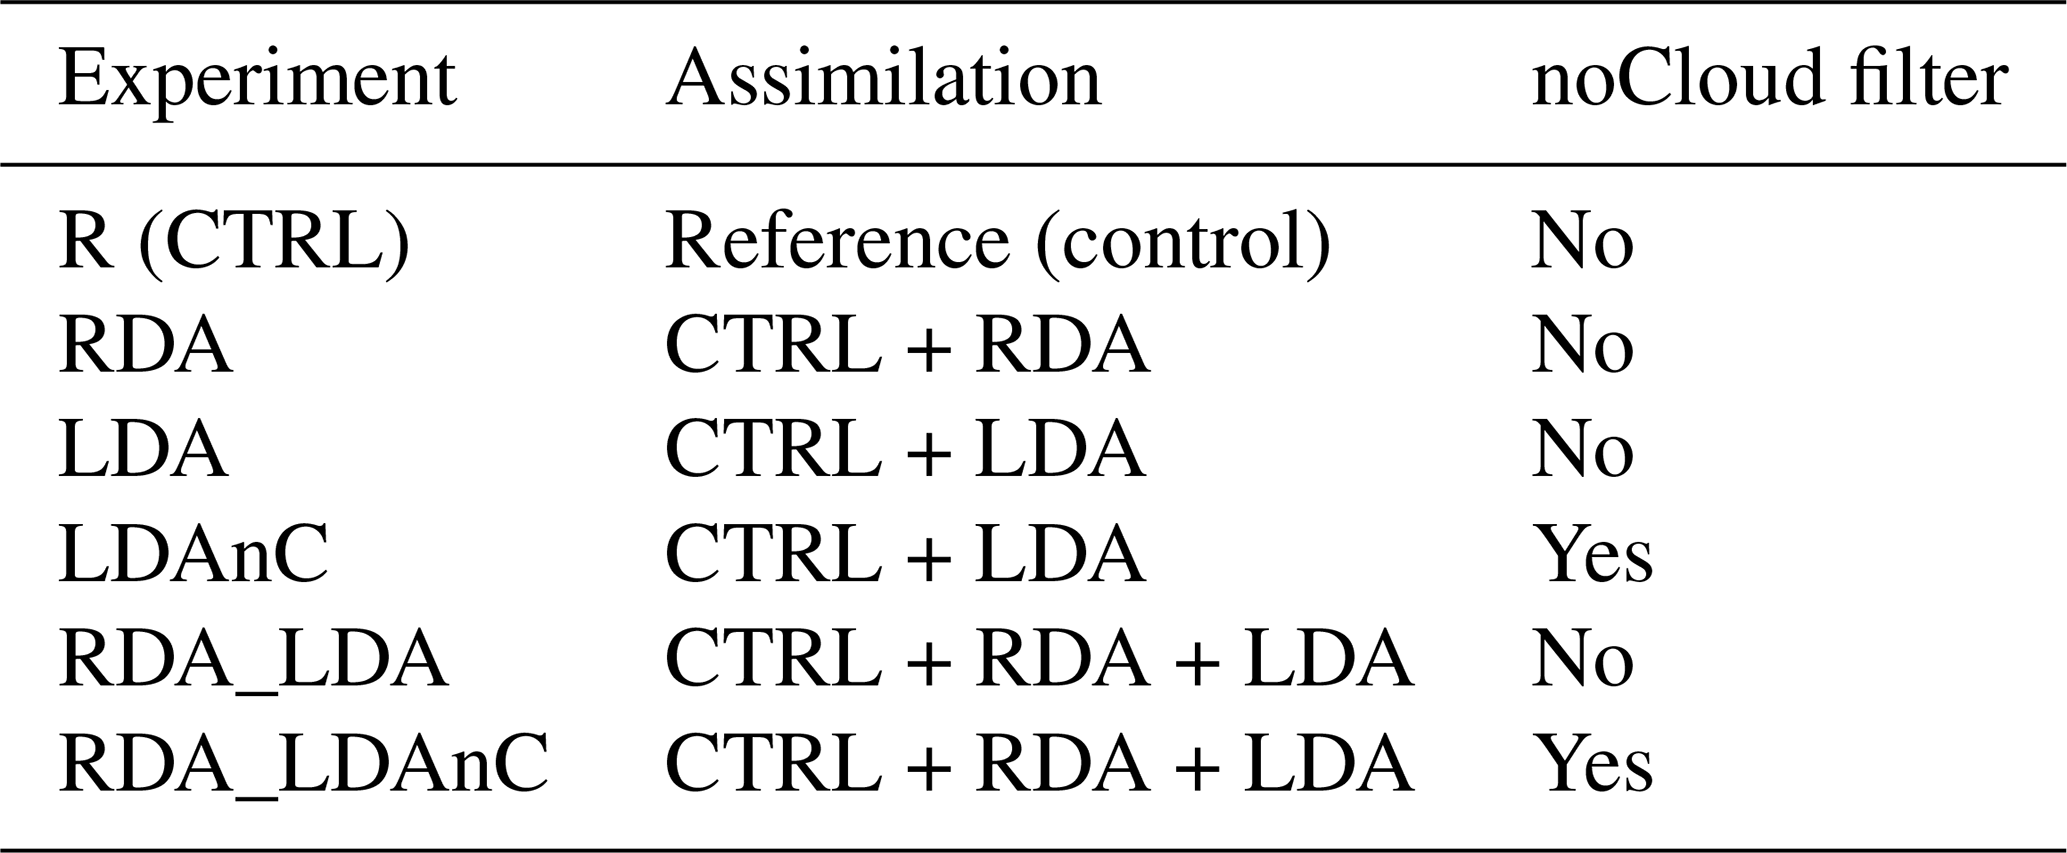
While analyzing first LDA experiments, it was evident that the use of all FED observations led to incorrect results; i.e., the changes to the AROME-France background humidity contradicted the assimilated pseudo-RH profiles (not shown). This behavior is known to occur because the R matrix is diagonal, whereas observation error cross-correlations are actually present, which leads to sub-optimal solutions (e.g., Rabier, 2006). It could be mitigated by reducing the number of assimilated observations (thinning; Järvinen and Undén, 1997). In this work, FED data are thinned by a factor of 2 in latitude and longitude directions – i.e., one in four observations are assimilated – so that no observations of adjacent FED pixels are used. Tests revealed that this thinning was sufficient to eliminate the FED observation error correlations. For comparison, 1 in 64 radar observations, with a higher horizontal resolution than our FED data, are assimilated in AROME-France (Michel, 2018). The thinning, thus, prevents assimilating observations with correlated observation errors, which would contradict the assumption of a diagonal R matrix. The resulting LDA experiment without RDA is labeled “LDA”.
The second LDA experiment without RDA, LDAnC, adds a so-called noCloud filter. This noCloud filter is utilized for locations where the observed FED equals zero but the AROME_FED exhibits lightning activity. Then, the distance to the closest positive FED observation, dFED, is computed. If dFED remains within 21 km, i.e., a maximum of three FED pixels, it is assumed that the profile is still situated within the same thundercloud responsible for the observed FED greater than zero. In this case, the RH profile of the background is kept to avoid reducing the RH if the observed FED equals zero but the location is likely associated with a cloud. In the case where dFED exceeds 21 km, AROME-France profiles within 21 km are not considered in the 1DBay as they probably belong to spurious simulated thunderclouds. Hence, the noCloud filter should help to effectively reduce background humidity in spurious convection.
The two remaining experiments combine both LDA methods with RDA. They are labeled RDA_LDA and RDA_LDAnC.
All model experiments are initiated 1 d prior to the start of the model forecast. During the first 24 h, the 3DVar assimilation system of AROME-France creates 23 analyses (there is no analysis for the time of initialization). The reference, LDA, and RDA experiments are conducted for 23 h prior to the evaluated analysis. This time period has been chosen because convection was continuously observed inside the model domain. In addition, the long assimilation period allows AROME-France to efficiently ingest all available observations.
This section describes the LDA ability to modify and update the model background. The following sections briefly introduce the four test cases, detail one case, and discuss (i) the LDA effects on the AROME-France background and (ii) AROME-France rainfall forecasts for this selected case. AROME-France simulations are mainly analyzed for the first 12 h of the forecast since the strongest impacts of RDA and LDA are expected during these forecast hours, as seen in Fierro et al. (2019), for example. The influence of the lateral boundary conditions becomes predominant after 12 h (Vié et al., 2011).
7.1 Case 1: 8 to 10 August 2018
Strong convection and lightning activity were observed over France on 7 August, and the electrical cells were still active over northern France and Belgium during the early hours of 8 August. Moist and warm air created unstable conditions over southeastern France where lightning was observed during the entire day. Whereas a dominant southwest flow was present aloft, winds in lower levels were calm but caused slight warm air advection. The 2 m temperatures reached up to 33 ∘C, while the dew point temperatures exceeded 20 ∘C over southwestern France. CAPE values far beyond 1000 J kg−1 indicated the potential for widespread deep convection and thunderstorm activity. Figure 6a and b show the 500 hPa map and surface analysis, respectively, on 8 August 2018, 12:00 UTC. The amplifying trough over the Atlantic is evident, and the major cold front was about to enter the study domain at this time. In the evening of 8 August, the trough that was situated over the Atlantic amplified and the associated cold front started to impact the weather in the domain. Strong convective cells formed over Spain and propagated all the way over France to Belgium and western Germany following the air mass boundary and the eastward movement of the trough. The storms left the study domain in the afternoon of 9 August. At that time, new cells formed over southeastern France and remained quasi-stationary until the end of the day. Then, only a few cells developed over the northern Mediterranean Sea until the end of the forecast period. The 30 h forecast starts 9 August 2018, 00:00 UTC, preceded by a 24 h period with hourly data assimilation.
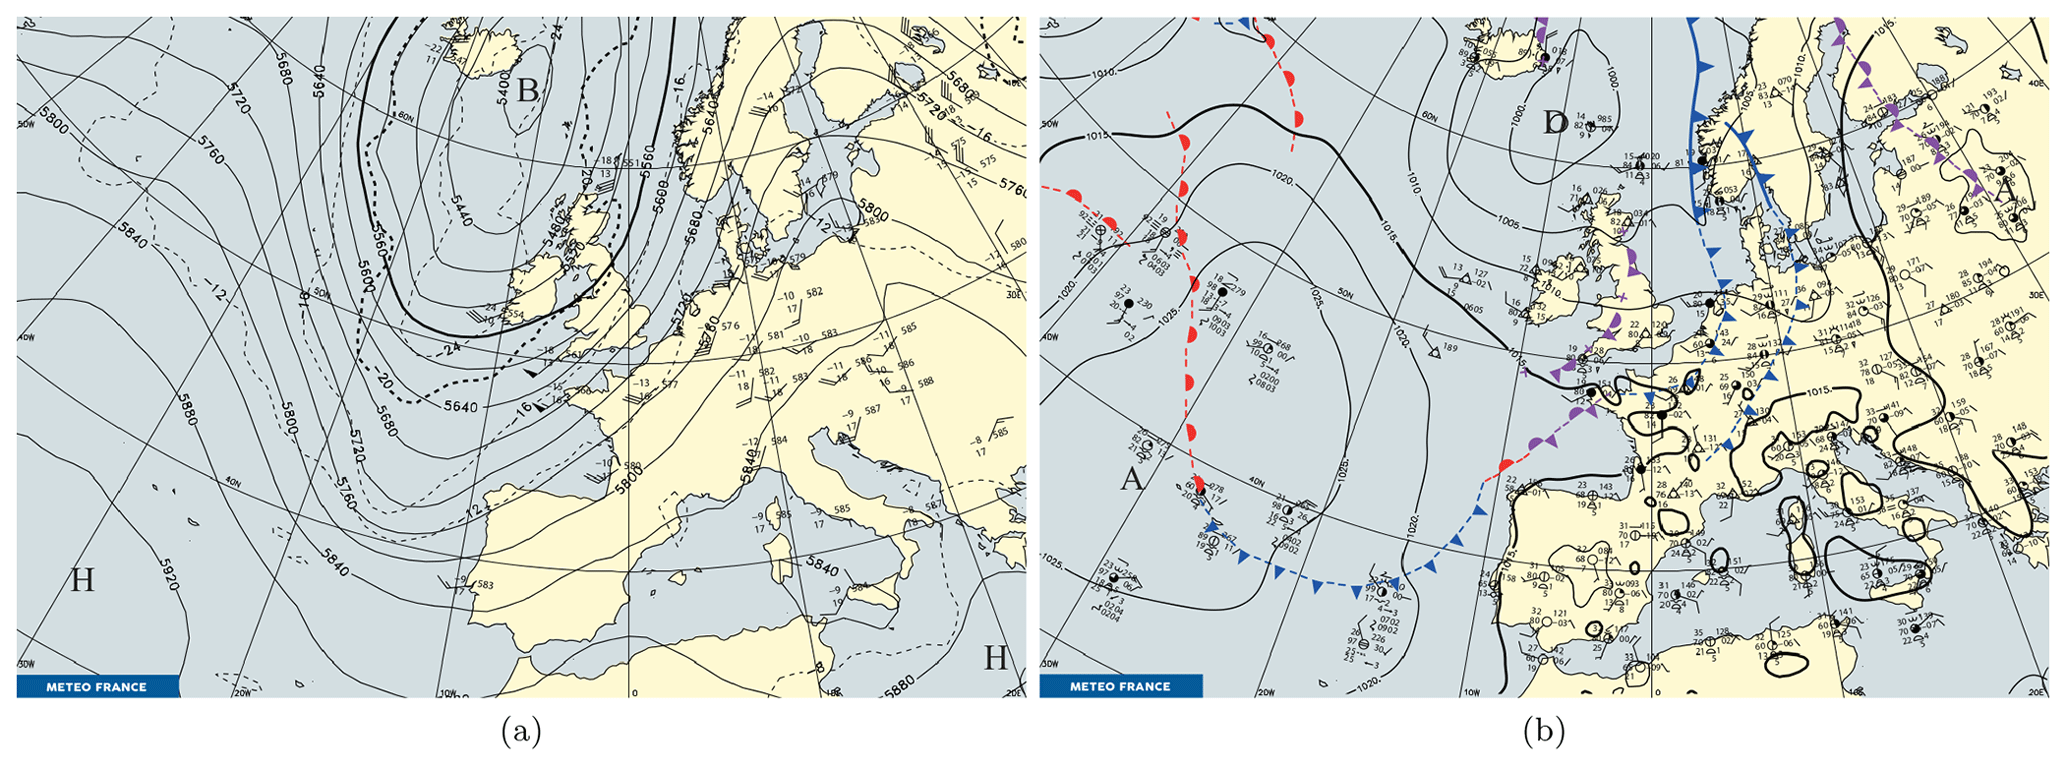
Figure 6(a) Météo-France 500 hPa analysis of geopotential height (in geopotential meters, gpm, solid lines) and temperature (in ∘C, dashed lines) with centers of low (“B”) and high (“H”) geopotential, and (b) Météo-France surface analysis with low- and high-pressure centers shown as “D” and “A”, respectively, on 8 August 2018, 12:00 UTC. Maps from the Météo-France daily weather bulletin archive https://donneespubliques.meteofrance.fr/?fond=produit&id_produit=129&id_rubrique=52 (last access: 19 October 2022).
7.1.1 AROME-France analysis
Details to create the AROME-France analysis are presented in Fig. 7 for experiment LDAnC on 8 August 2018, 23:00 UTC. The first row of the figure (Fig. 7a–c) includes (a) the AROME_dBFED, (b) the 1DBay dBFED, and (c) the dBFED observation. AROME-France could not predict most of the lightning activity over the Bay of Biscay and southwestern France (Fig. 7a and c; see Fig. 1 for the locations of the regions of interest). The region of the highest observed dBFED is correctly predicted, however, with underestimated dBFED values (Fig. 7a and b versus c). The 1DBay dBFED (Fig. 7b) shows positive dBFED patterns that match the observed dBFED (Fig. 7c) despite the fragmented dBFED in the AROME-France background (Fig. 7a). Hence, Fig. 7g shows that integrated water vapor (IWV) is added to the background in regions where the AROME-France background underestimates the dBFED. Over southern France, the marine blue spots in Fig. 7b indicate that the 1DBay retrieval succeeds in reducing the spurious AROME_dBFED (Fig. 7a versus c). Hence, IWV should be reduced here by the assimilation. Consequently, the PO IWV (Fig. 7e) clearly decreases compared to the background IWV (Fig. 7d), as shown in Fig. 7g. In addition, the LDA experiment reduces the model IWV at the rare locations where the AROME_dBFED exceeded the observed dBFED, e.g., due to a slight spatial shift in the local dBFED maxima at about 44.3∘ N and 0.8∘ E (compare Fig. 7a, c, and g at this location).
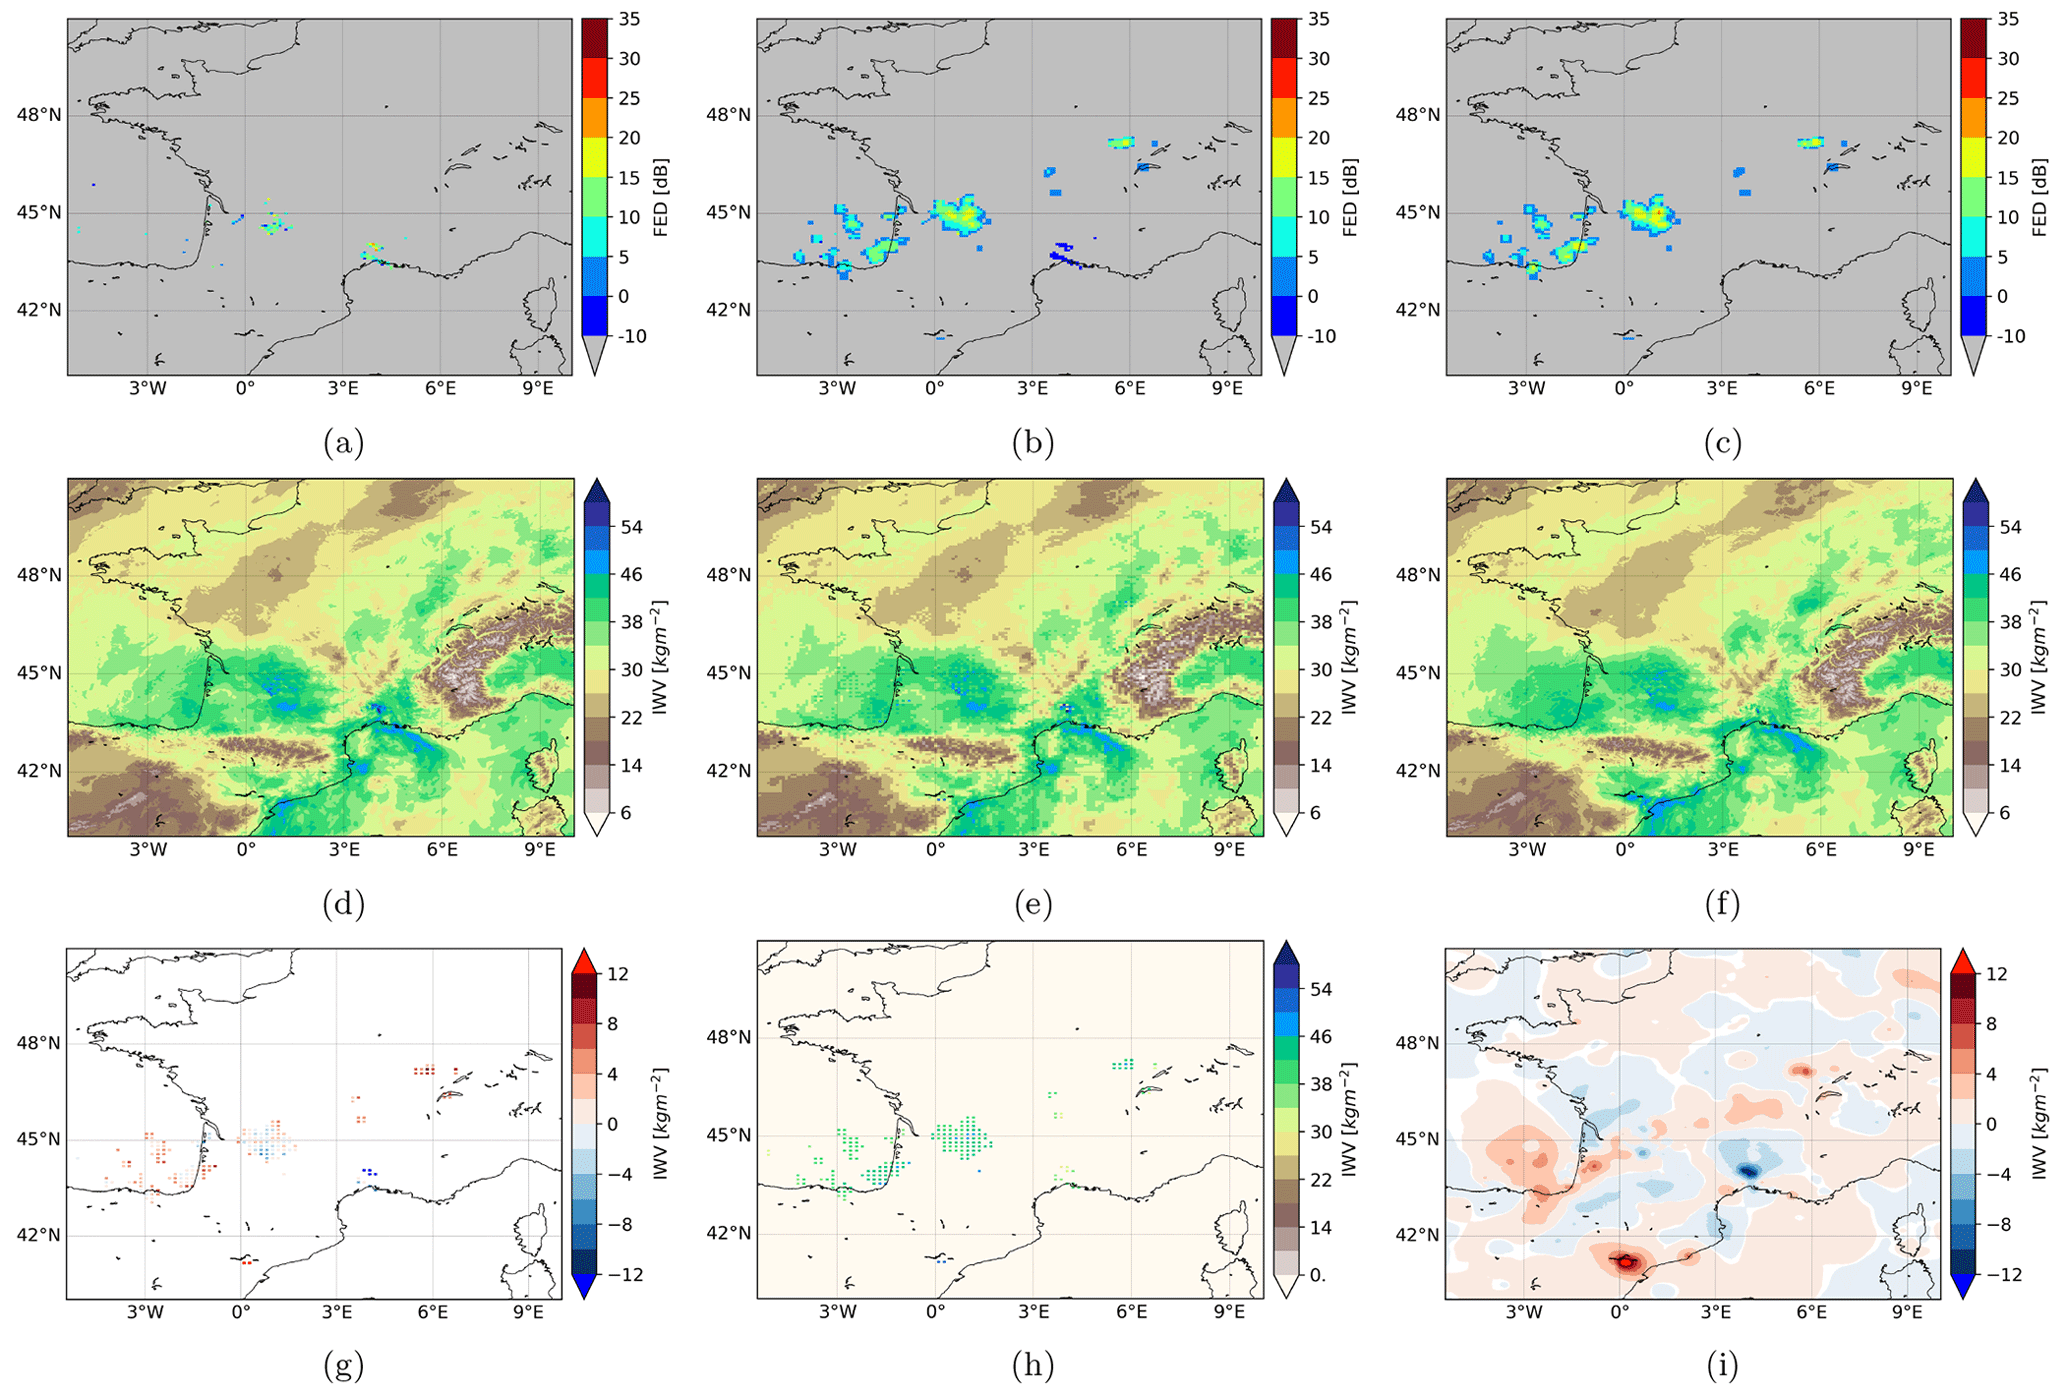
Figure 7(a) The background AROME_dBFED, (b) the 1DBay-retrieved dBFED, (c) the MTG-LI dBFED observation, (d) the AROME-France background IWV, (e) PO IWV merged with the background where no profiles were retrieved, (f) the IWV of the analysis, (g) the difference between the PO IWV minus the background IWV, (h) the 1DBay-only IWV including only points where RH was retrieved, and (i) the difference in the IWV of the analysis and background. Results for 8 August 2018, 23:00 UTC, and model experiment LDAnC.
The 1DBay method aims at finding the profiles that are physically consistent with FED observations in terms of relative humidity. Indeed, the analysis (Fig. 7f) adds humidity to the background over the southwestern regions and to the cell over eastern France. It can also be seen in the difference between analysis IWV and background IWV (Fig. 7i), where LDA reduces model IWV where spurious lightning activity was predicted. In addition, Fig. 7h displays the IWV as output of the 1DBay retrieval method where no background IWV is included. It is intended that the 1DBay retrieves complete profiles, whereas the HA only adds humidity to certain layers. A smaller IWV from pure PO (Fig. 7h) than from background plus PO (Fig. 7e) means that the HA method was used. The comparison of Fig. 7e and h shows the same IWV values for most points with PO. This result means that the HA is rarely used, and the preferred 1DBay method that retrieves flow-consistent PO profiles is mostly used to get the POs.
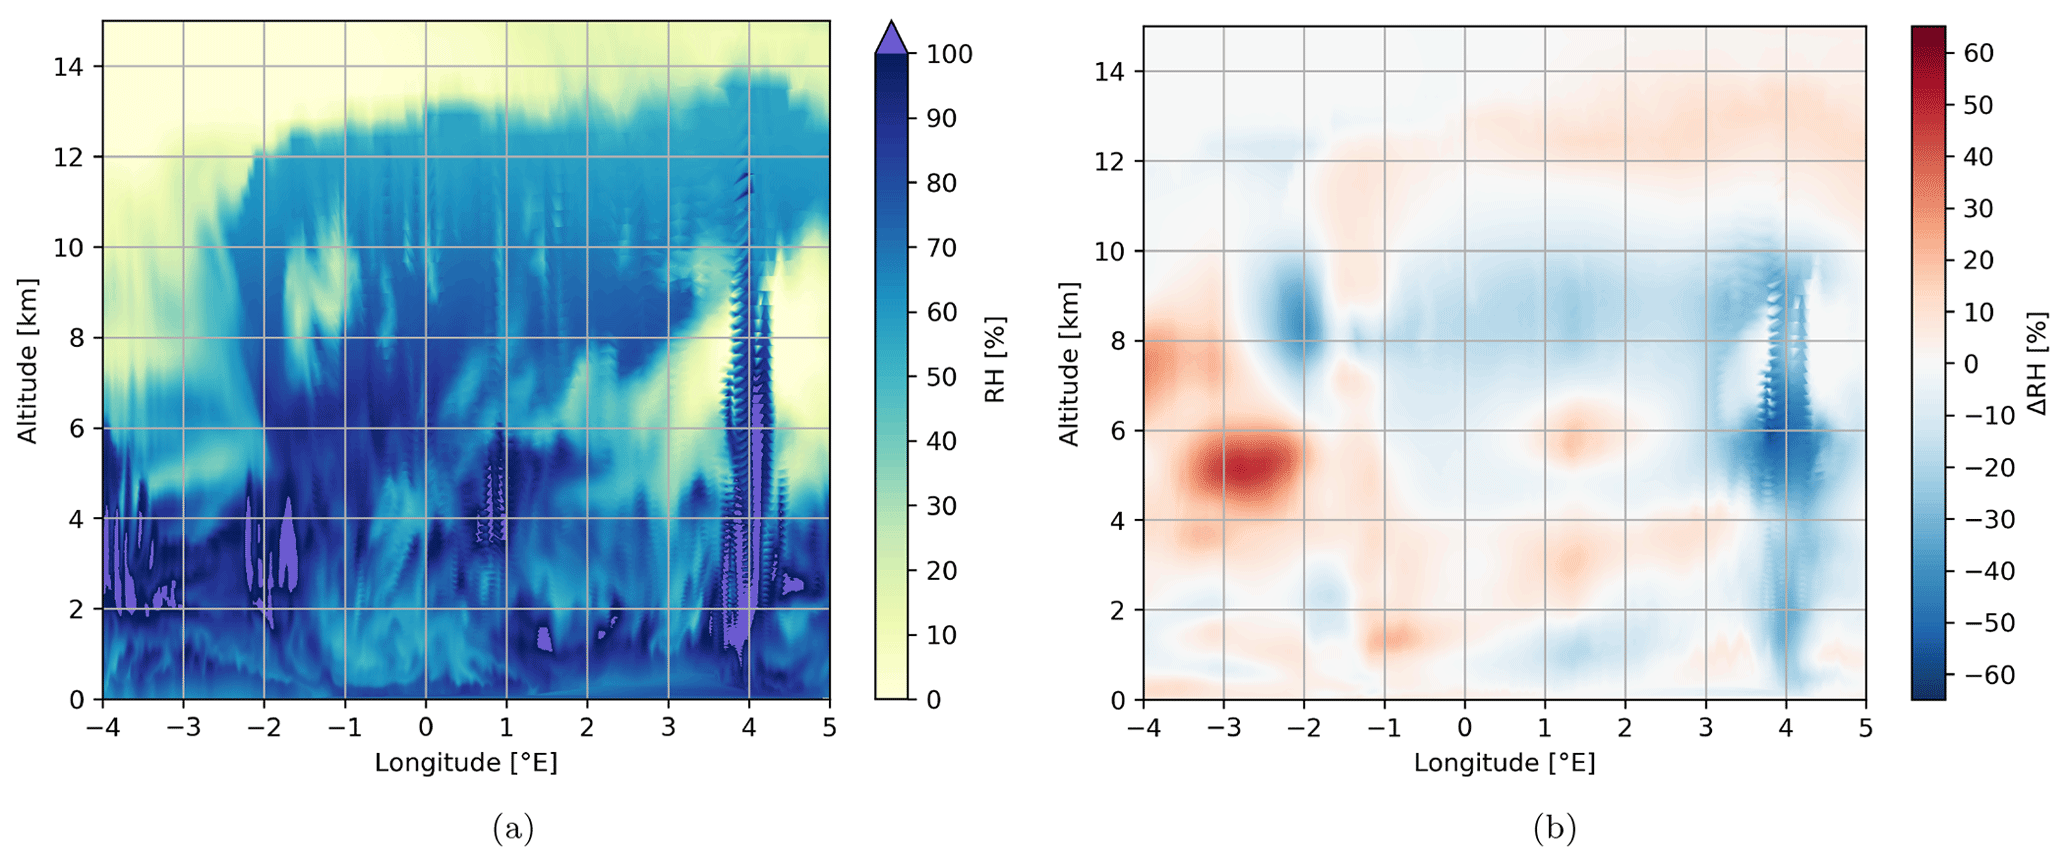
Figure 8Vertical cross-sections along 44∘ N of (a) the AROME background RH and (b) the difference of analysis minus background RH. Sawtooth features visible at 4∘ E are interpolation artifacts caused by the grid's irregularity. Results for 8 August 2018, 23:00 UTC, and model experiment LDAnC.
Figure 8 illustrates the RH vertical structure at 44∘ N latitude between 4∘ W et 5∘ E at the same time as fields in Fig. 7 are taken. AROME-France background RH (Fig. 8a) and the difference of analysis minus background (Fig. 8b) are included. The latitude was chosen as the analysis increases and decreases the background IWV here (Fig. 7i). The latitude also exhibits regions where AROME-France over- and underestimated the FED (Fig. 7a, c). In Fig. 8b, higher RH in the analysis than the background (positive values) from 4 to 2∘ W (−4 to −2 in the figure) corresponds well with Fig. 7g and i where humidity as evidenced by IWV was added to the background since AROME_FED was lower than the FED observation. RH is reduced in columns near 4∘ E where spurious AROME_FED was found (Fig. 7a, c). Figure 8 also shows that the RH was not changed when observed FED was higher than AROME_FED but the background RH was at least 100 % (e.g., altitudes up to 4 km and from 4 to 2∘ W). All in all, the vertical cross-section shows that changes induced by the LDA result in physically consistent analysis in the vertical structure.
7.1.2 AROME-France rainfall forecasts
The Antilope rainfall accumulation (RA) combines the data of the operational radar network of Météo-France and rain gauges on a 0.01∘ resolution grid at each hour (Laurantin, 2008, 2013). RA maps for the first 6 h of the forecast are shown in Fig. 9a to e for (a) Antilope and the experiments (b) CTRL, (c) RDA, (d) LDA, and (e) LDAnC.
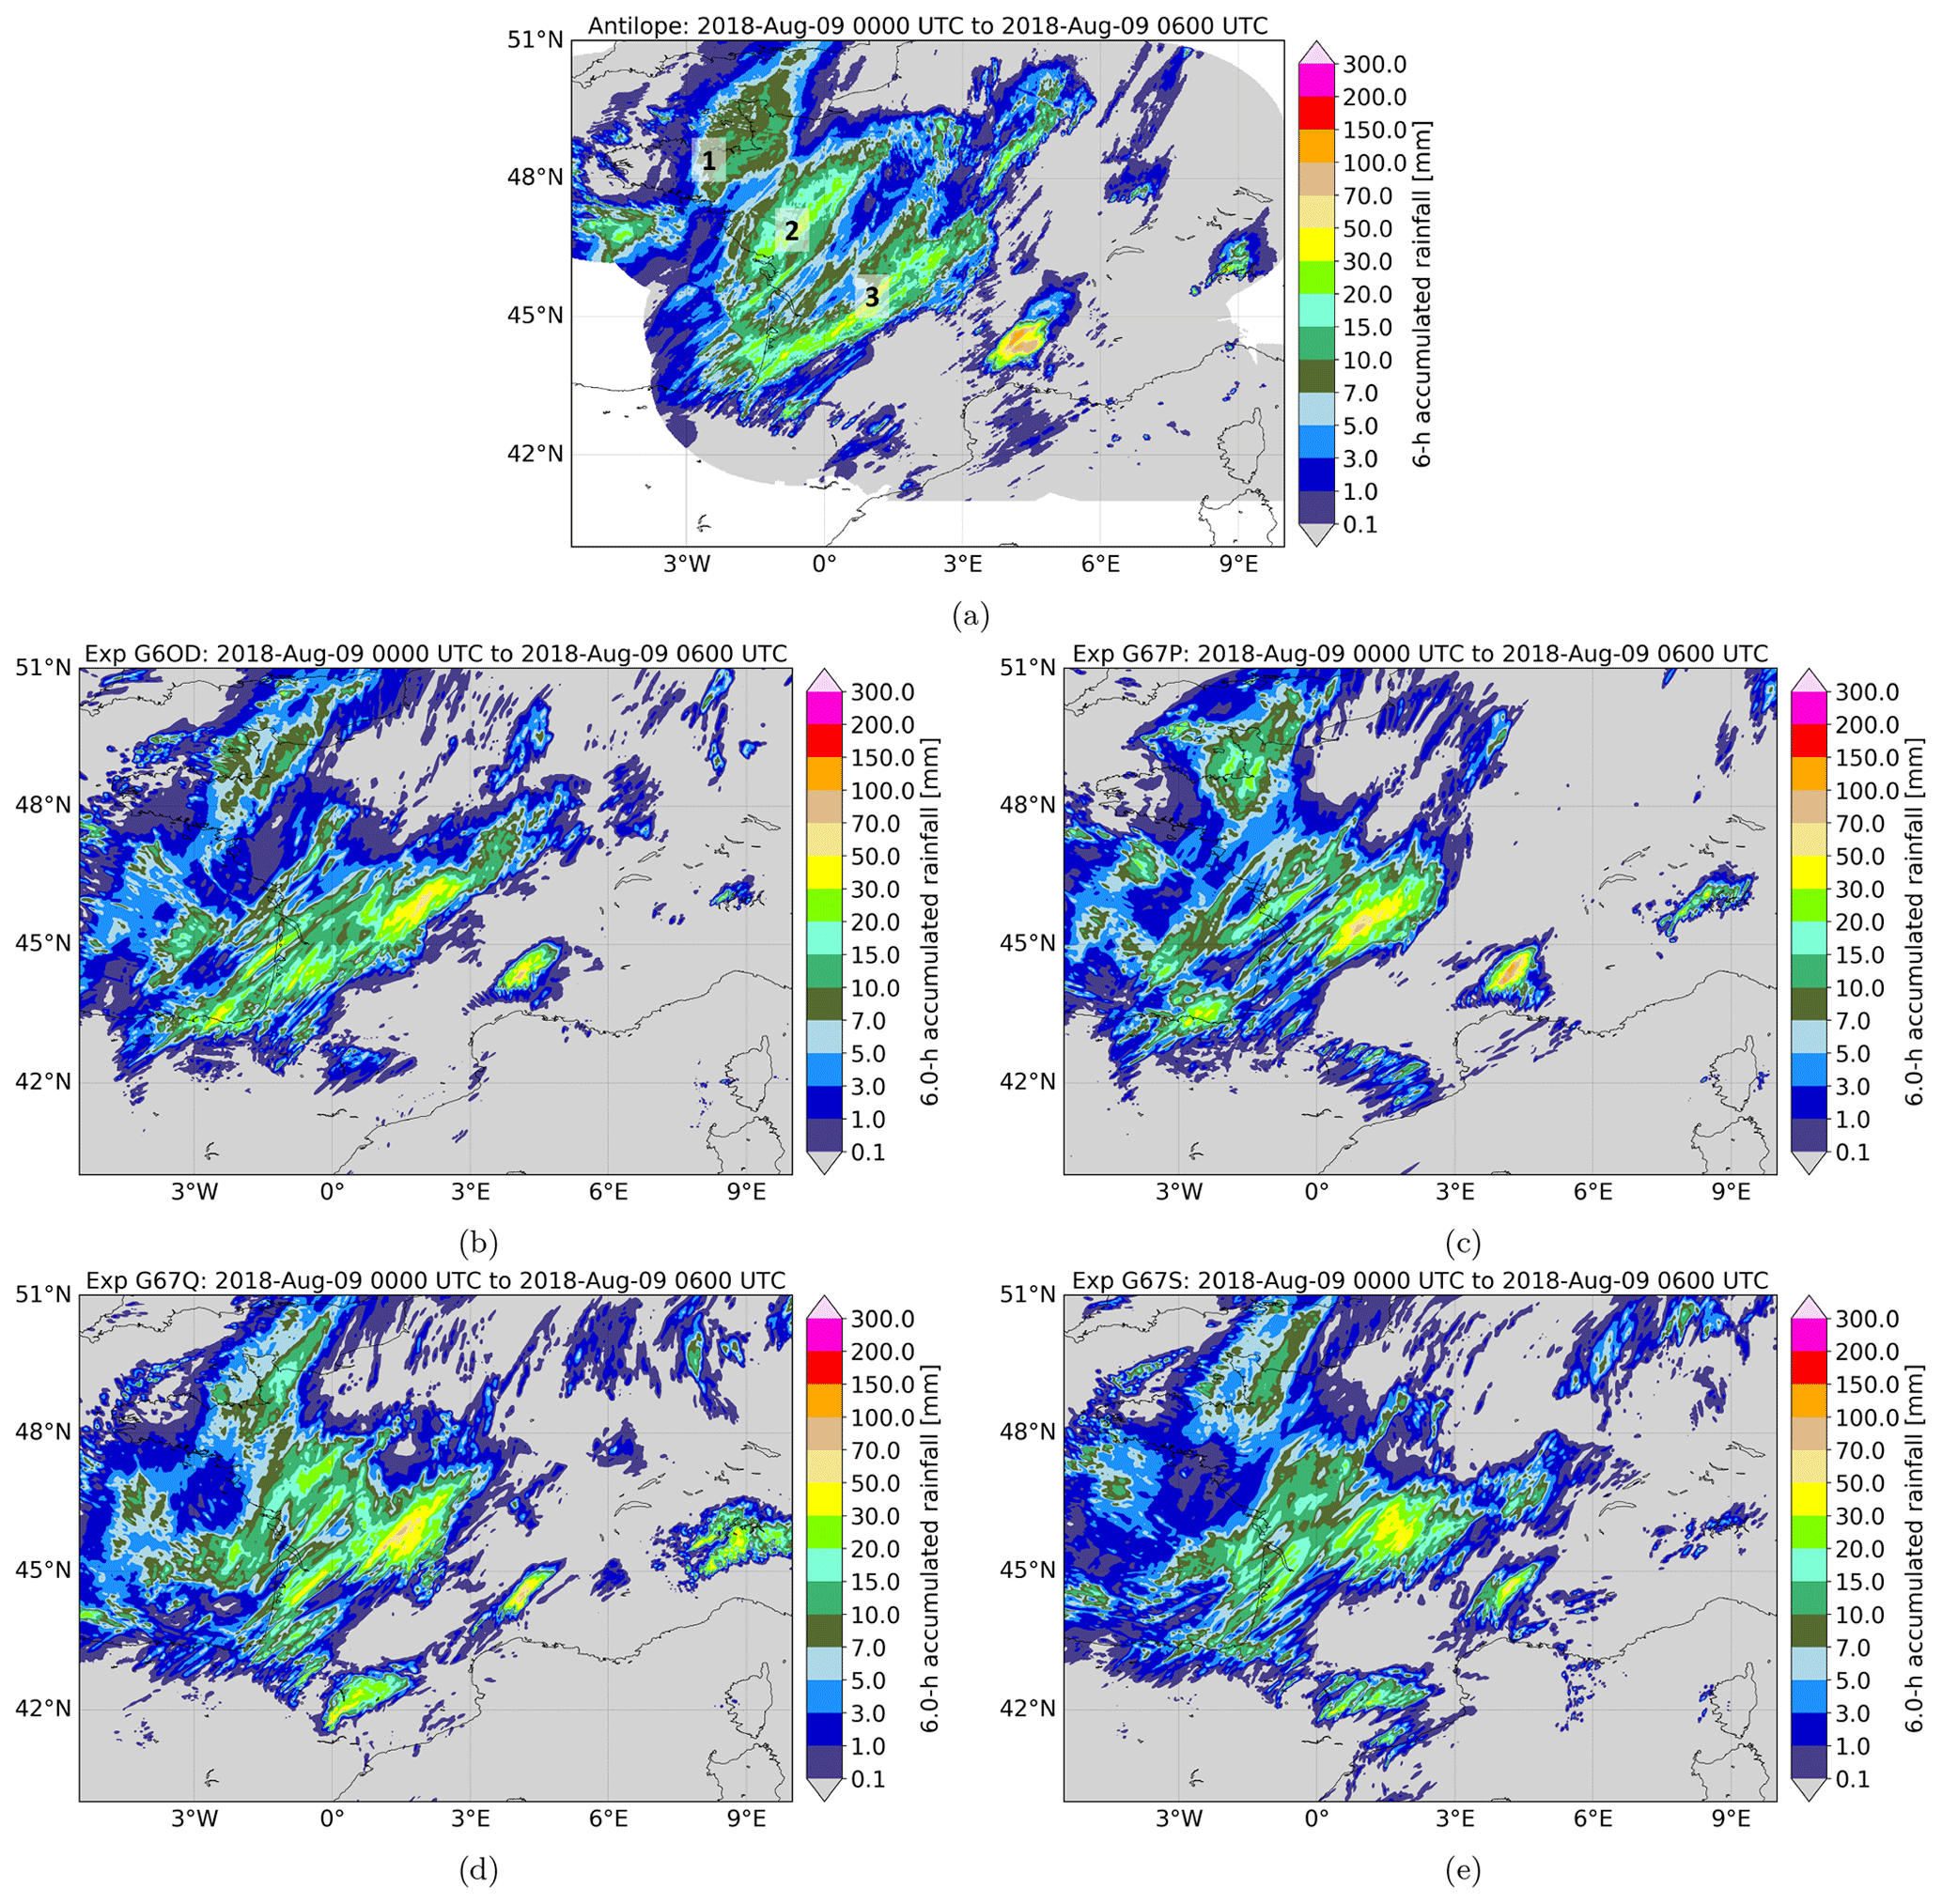
Figure 9The 6 h rainfall accumulations (RAs) for the period until 9 August 2018, 06:00 UTC, i.e., the first 6 h of the 30 h forecast. (a) RA observations and the AROME-France experiments (b) CTRL, (c) RDA, (d) LDA, and (e) LDAnC. Three main thunderstorm tracks are labeled with black numbers 1 to 3 in (a).
Three major thunderstorm tracks, labeled 1 to 3 from north to south hereafter, produce the bands of high RAs over the northwestern part of the domain (Fig. 9a). The local maximum with very high RA up to 150 mm per 6 h over southern France is caused by a quasi-stationary thunderstorm development. The AROME-France experiments (Fig. 9b–e) predict the RA of track 1 relatively well. Experiment CTRL (Fig. 9b) and the two LDA experiments (Fig. 9d, e) underestimate the area of high RA in the northwest of the domain for track 1. Experiments RDA (Fig. 9c) and LDA (Fig. 9d) overestimate the maximum RA over this region by about 20 mm and 5 mm, respectively. Track 2 is best predicted by experiment LDA, with good agreement in maximum RA and area of high RAs to the observations (Fig. 9a). Experiment LDAnC (Fig. 9e) also predicts the extent of the RAs related to track 2 but underestimates the RA amounts especially for the northern part of the track, i.e., most recent storm location to the prediction time. Experiment CTRL and the experiment using RDA without LDA poorly predict the high RAs related to track 2. It is not clear whether the storm is modeled at all or placed too far south. RAs of track 3 are similarly predicted by the RDA and LDA AROME-France experiments that all underestimate the RA of the southern part, i.e., during the beginning of the forecast period, and overestimate the RA of the northern part of the track, i.e., the most recent RA. Experiment CTRL predicts the southern part of track 3 arguably better than the RDA and LDA experiments. The 6 h RAs related to the local thunderstorm over southern France are best predicted by CTRL and RDA. Both LDA experiments somewhat underestimate the local RA maximum and the area of high RAs. In addition, the LDA experiment produces a spurious, local, high-RA cluster over northeastern Spain.
This case study implies that LDA without both RDA and the noCloud filter of FED has the highest fraction skill score (FSS, not shown; see Sect. 8) for predicting heavy precipitation. In that it differs from the other three case studies where the noCloud filter improves the LDA experiment skill, a future analysis might detail why the RDA and LDA with noCloud filter have lower skill than the LDA. Such an analysis is beyond the present proof-of-concept scope.
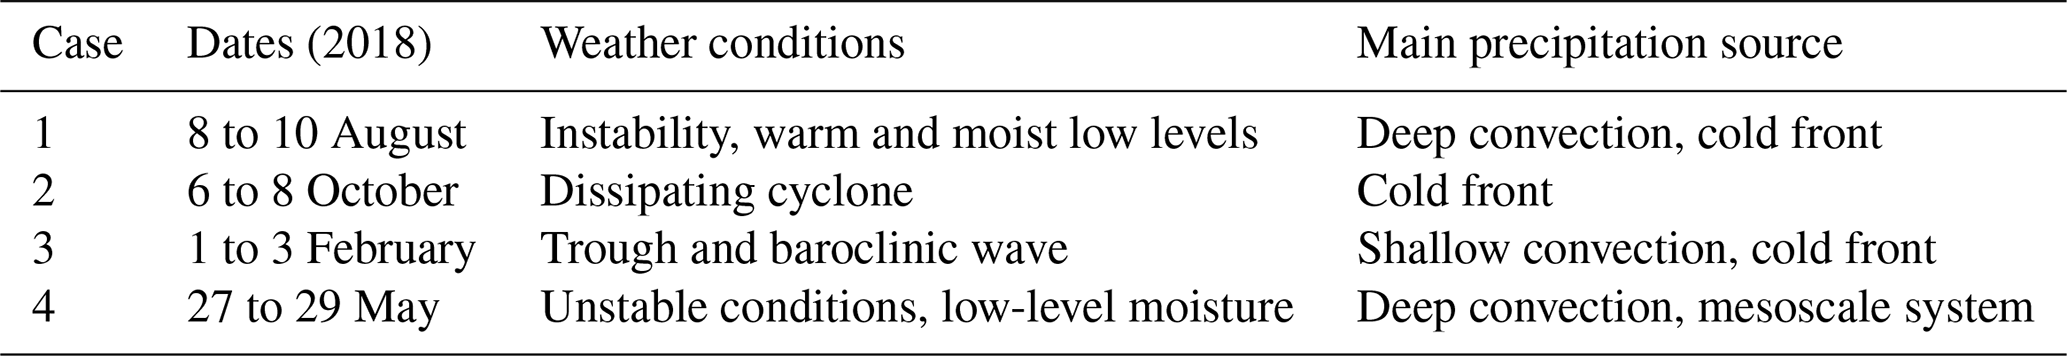
7.2 Cases 2, 3, and 4
All case studies are summarized in Table 2. Besides the detailed case 1, the other case studies analyzed a cyclone with mainly frontal precipitation in autumn (case 2), shallow convection in winter (case 3), and widespread deep convection in late spring (case 4). The evaluation of these three cases revealed that the RDA and LDA improve the RA forecast skill for convection within the study domain over western Europe. Once RDA and once LDAnC provide the best RA forecast. Experiments combining RDA and LDA exhibit FSS values between RDA and LDA and thus mean the best trade-off overall. In the future, a coupled assimilation of RDA and LDA could be tested. For example, PO RH profiles could be retrieved from a weighted product that includes both radar reflectivity and FED, thereby adapting the 1DBay.
In situations where convection from the Atlantic Ocean is advected into the study domain from the west, i.e., case 3, RDA and LDA could not improve the control run. Both RDA and LDA currently rely on ground-based observations with limited coverage over the Atlantic Ocean. It is expected that the real MTG-LI observations will help to predict cloud systems forming over the ocean with higher efficiency than the LDA using the generated MTG-LI observations derived from ground-based observations.
This section compares the predicted 6 h RAs of different AROME-France experiments (Table 1) and the observations in a statistical way. The forecast skill is quantified calculating fractions skill scores (FSSs). The FSS was introduced by Roberts and Lean (2008): the FSS can be calculated as the skill score from the mean squared error (MSE) for the observed and forecast fraction O(n) and M(n), respectively, from a neighborhood of length n as
with
and
with the observation and forecast binary fields IO and IM that equal 0 if the field value is smaller than the threshold and 1 otherwise. Our implementation uses the fast calculation of FSS in Python as proposed by Faggian et al. (2015). The FSS is calculated hourly for 6 h RAs with a sliding 6 h time window for the 30 h forecast period. Forecasts are initiated at 00:00 UTC. The FSS can be generalized to yield an average score if the numerator and denominator are averaged separately, and then the FSS is calculated (Faggian et al., 2015). This allows us to achieve overall FSSs including forecasts of all four case studies.
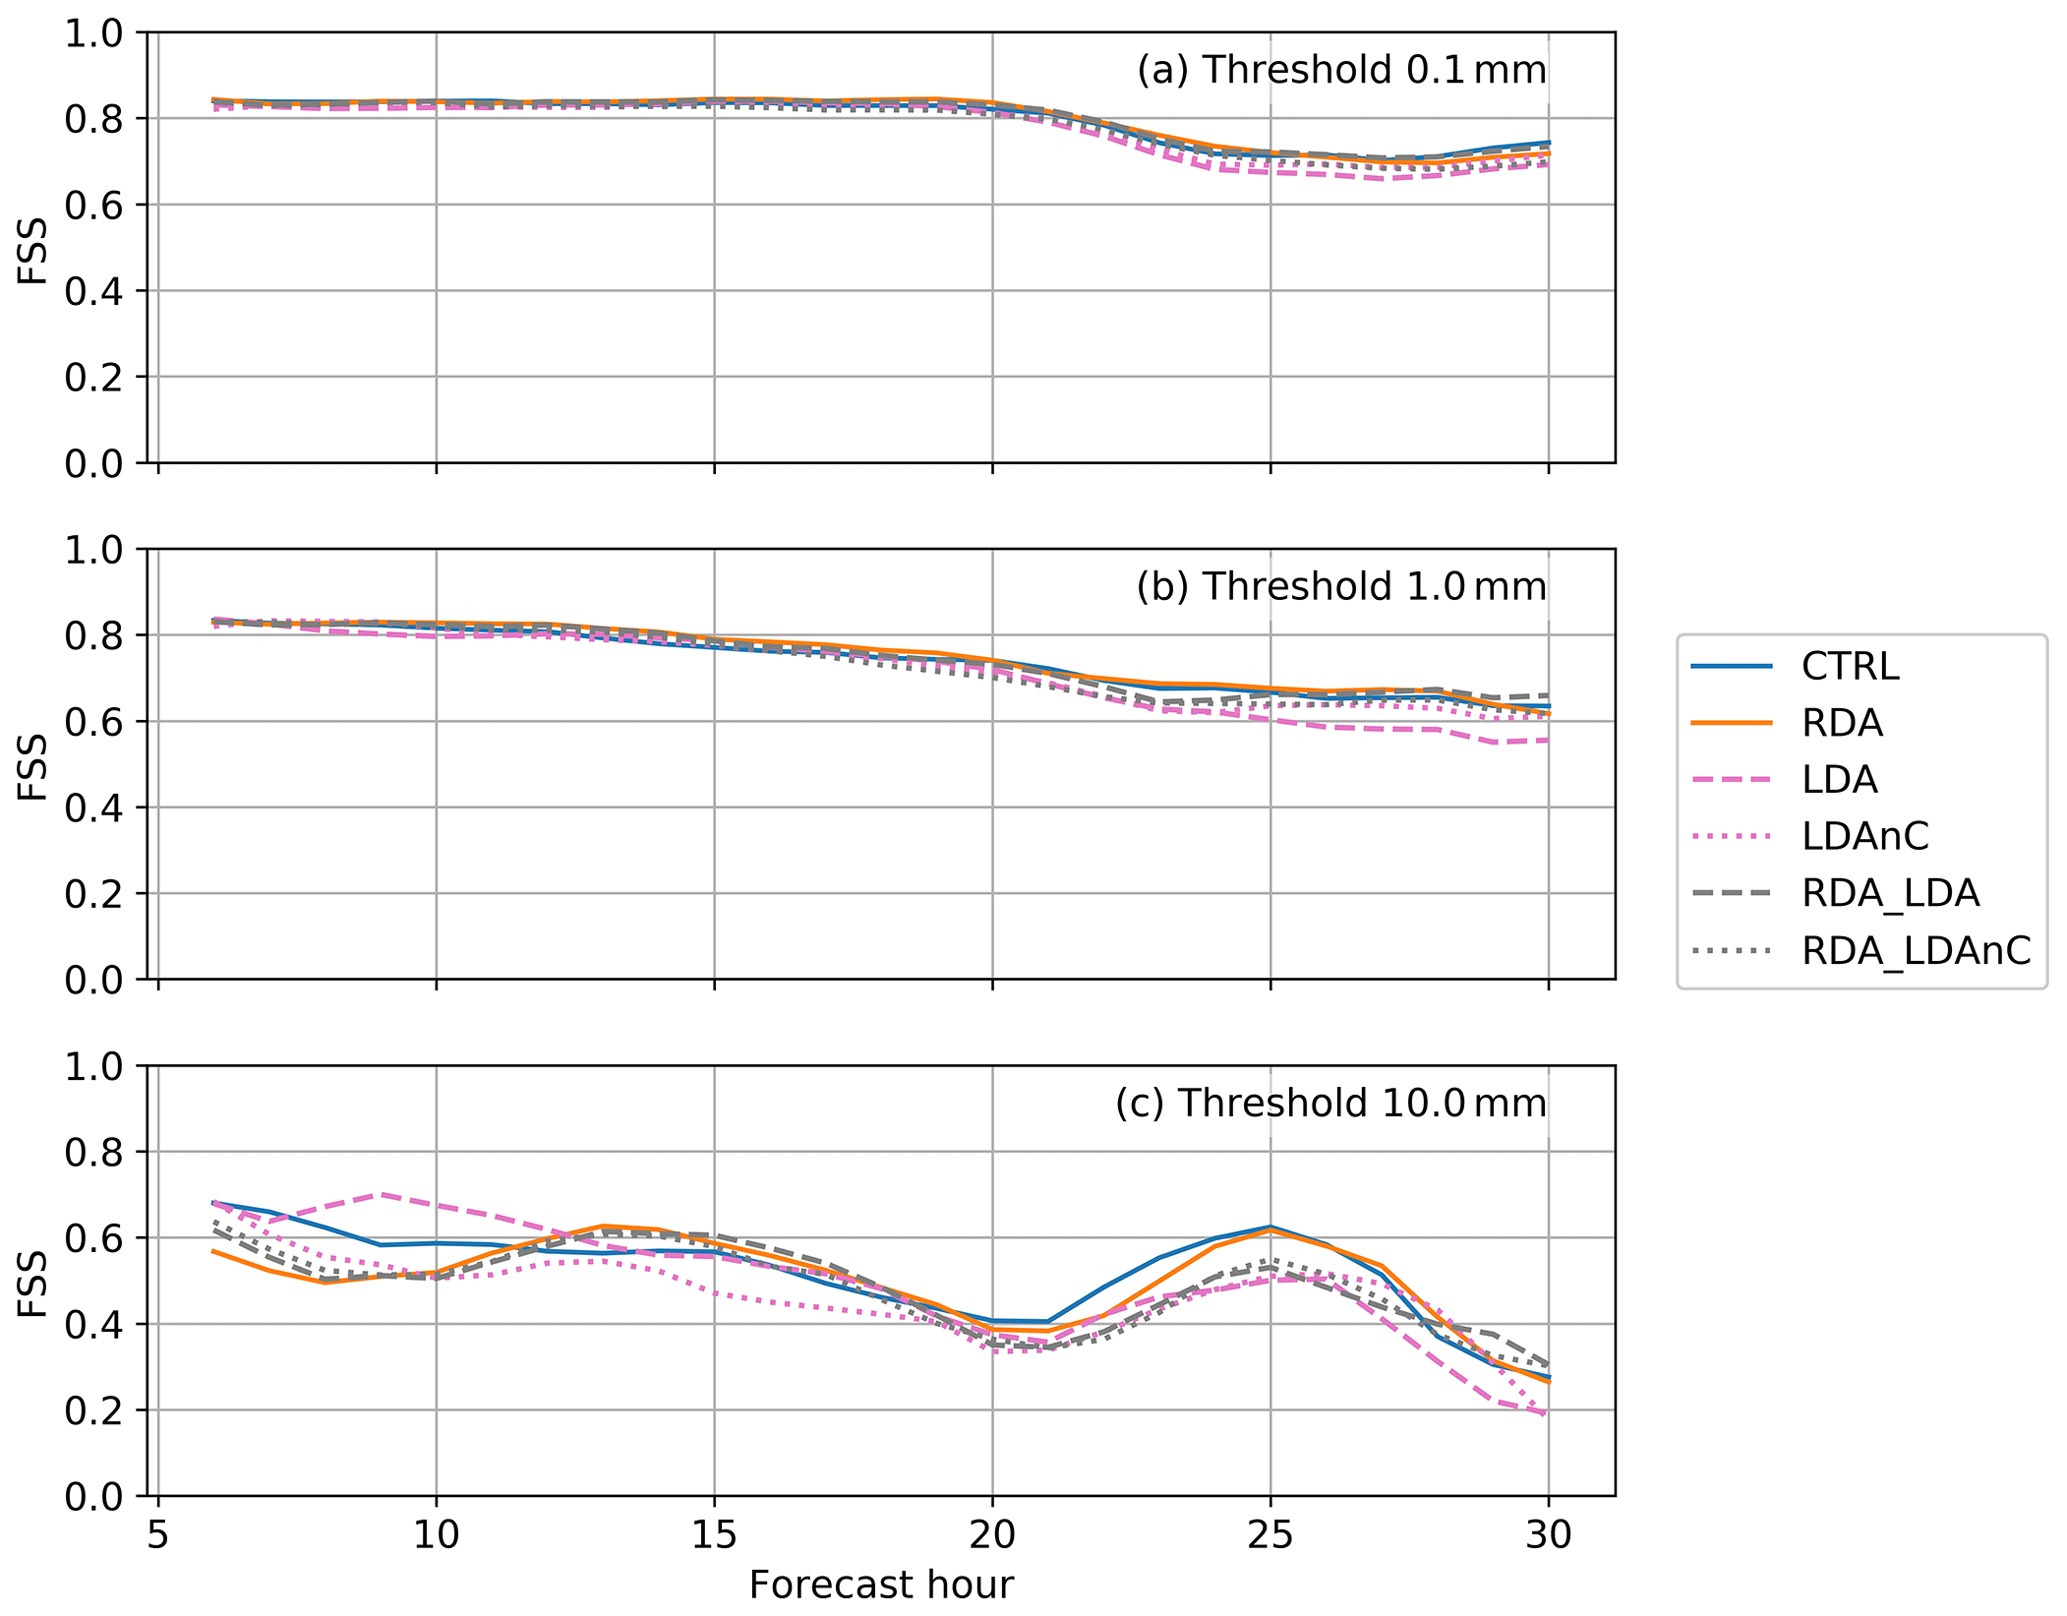
Figure 10FSS average of 6 h RAs calculated hourly for a sliding window during the 30 h forecast initiated at 00:00 UTC for the four study cases. The colors and line style indicate the model experiments as defined in Sect. 6. Three different RA thresholds are used: (a) 0.1 mm, (b) 1.0 mm, and (c) 10.0 mm. The size of the neighborhood used to calculate the FSS was set to 0.5∘.
Here, 6 h RA thresholds of 0.1, 1.0, and 10.0 mm are used to represent different RA categories. An FSS neighborhood of 0.5∘ is used. Figure 10 shows the FSSs for the entire forecast period of 30 h and combination of the four cases.
FSSs of 0.8 to 0.9 during the first 15 h of the forecast for the RA thresholds 0.1 and 1.0 mm (Fig. 10a and b, respectively) indicate that regions with precipitation were equally well identified by all six AROME-France experiments. RDA or LDA effects on the FSS diminish beyond 12 h of the forecast as the effect of the boundary conditions becomes predominant. The LDA without RDA and without the noCloud filter (LDA) gains the highest FSS for the high-RA threshold and during the first 12 h of the forecast (Fig. 10c). This finding demonstrates the high potential of LDA in AROME-France. The noCloud filter cannot always improve the LDA. RDA exhibits the lowest FSS during the first 6 h of the forecast due to a low skill during the August case where high RAs of storm track 2 over the Pays de la Loire region in France were not predicted (see also Fig. 9). The combination of LDA and RDA (RDA_LDA) gives FSSs between the skill of RDA and LDA.
This proof-of-concept study uses four cases, a rather low amount of data. Usually, scores are calculated over several months for evaluating whether a new method improves an existing NWP model. FSS curves appeared noisy for high thresholds and short accumulation periods (not shown) as a result. The main conclusion here is that there are likely not enough data to show significant differences; however, the encouraging point is that the effect of the assimilation is neutral.
The objective of this work is to design an assimilation technique for the upcoming MTG-LI data for the regional, convection-permitting model AROME-France. To date, AROME-France applies a 3DVar assimilation system. A tailored 1DBay plus 3DVar assimilation technique (Caumont et al., 2010) is used to assimilate pseudo-MTG-LI flash extent density (FED) in AROME-France. A similar assimilation technique is currently used operationally for radar reflectivity data assimilation in AROME-France but has not yet been tested for LDA.
This work first generated MTG-LI data that are used to create the FED observations (Erdmann et al., 2022). Then, an observation operator for FED is developed based on a linear, climatological relationship between observed FED and the column-integrated AROME-France graupel mass, mg, above the −5 ∘C isotherm. The operator is trained for 24 d in 2018 and validated for 2 independent days in 2018. Pearson correlation coefficients of 0.97 and 0.92 for the training and validation data, respectively, reveal a very strong relation between the distributions of observed FED and model mg. Nevertheless, the observation operator systematically overestimates the FED for mg values greater than 1.5 × 10⁷ kg per AROME-France grid cell of 1.3 km × 1.3 km. More sophisticated observation operators are currently being tested (Combarnous et al., 2022) but have not been included in this work yet.
The observation operator is then used to compare AROME-France-derived background FED (AROME_FED) to the FED observations. The 1DBay method identifies the best estimation of the FED from the background to in turn create pseudo-observations (POs) of RH profiles based on both the FED observation and the AROME-France background fields. As background profiles are processed, the 1DBay method maintains model physics and flow characteristics.
The PO RH profiles add humidity to the AROME-France background where the observed FED exceeds the AROME_FED. It is further found that the 1DBay retrieval leads to a reduction in humidity where the observed FED equals zero and the AROME_FED is positive, i.e., in regions of spurious convection with substantial mg. Hence, the LDA technique improves the AROME-France background humidity. It is capable of both promoting convection in regions with lightning and suppressing spurious convection. This was successfully verified in four case studies where the new LDA technique provided similar skill to the operational RDA in AROME-France.
FED exhibits the highest values near the convective core of a thunderstorm, and the lightning activity does not always cover the entire cloud size. In fact, zero FED exists at cloudy locations. In order to address the specific nature of FED data, the 1DBay retrieval method is adapted. In detail, a wider vicinity is used to identify vertical profiles in the 1DBay method and a so-called noCloud filter is introduced. First results reveal that this adaption of the method can help to more effectively reduce the background humidity in regions of spurious convection and to avoid a reduction in the background humidity if the profile occurs at the location of a cloud. Nonetheless, one of the four case studies revealed more skill in the LDA without the noCloud filter than the LDA using this modification. The noCloud filter is a first approach trying to overcome this issue by keeping the background humidity constant when lightning was correctly simulated but not observed. The authors encourage further research on how the specifications of FED data can best be addressed by the LDA scheme, i.e., through correlations between lightning locations and cloud cover.
In addition, this study found that the thinning of the FED observations (on a grid of resolution of 7 km) was necessary to avoid the effect of correlations between the observation errors that violate the assumptions of a diagonal observation error matrix in the AROME-France 3DVar data assimilation system (not shown).
Finally, forecasts of 6 h rain accumulations are evaluated through FSS analysis. The developed LDA scheme can in general compete with the established RDA, an encouraging result for the further testing and development of the LDA in AROME-France. Positive effects on the forecast of rainfall by both RDA and LDA are found mainly for the high-precipitation threshold and during the first 9 to 12 h of the forecast. Longer forecast times show a small spread in FSSs between the control run, RDA, and LDA for the three RA thresholds, indicating that the assimilated radar and FED data do not significantly affect the model forecast after 12 h. The FSSs of the combination of RDA and LDA indicate in most cases skill between the RDA and the LDA. The combined RDA–LDA approach provides the best trade-off in a general sense and with respect to the assimilated observations. The case of 2 February 2018 was unique in that neither RDA nor LDA improved the FSS of the control run. This case was significantly influenced by weather phenomena over the Atlantic Ocean, with limited radar and Meteorage coverage. Real MTG-LI data will provide more accurate lightning records over the Atlantic than the synthetic MTG-LI data based on Meteorage observations used in this study, and the LDA performance might improve in such situations.
It could be further studied whether the radar reflectivity and LDA can be coupled. A coupled approach may help to overcome some issues explained for zero FED at cloudy locations in general or at least for precipitating clouds and, at the same time, benefit from the successful promotion and suppression of convection by both RDA and LDA. As the LDA explored here is based on satellite observations, such a coupled approach will also benefit forecasts over regions with limited radar coverage. The specific improvement over regions such as oceans and mountain ranges has not been studied here since our pseudo-MTG-LI observations are based on ground-based Meteorage records. A study addressing in particular the skill over such regions would be of great interest as soon as real MTG-LI data become available.
Python 3.4 coding was used, with standard libraries and Matplotlib for the figures. The code was mainly developed during Felix Erdmann's PhD and as such is the property of the funders CNES and Météo-France. Python code that is subject to active research and further studies cannot be made available. Parts of the code (Python scripts) to create the figures are available from the corresponding author upon request.
This work uses pseudo-MTG-LI data that are generated as described in Erdmann et al. (2022). These data are not publicly available as they are created based on commercial Météorage lightning observations. Météorage data are provided by and are the property of Météorage as a company. AROME model fields are available in real time at https://donneespubliques.meteofrance.fr/ (METEO FRANCE, 2022). Other data that are used in the assimilation in AROME-France are available as stated in Seity et al. (2011) and in Brousseau et al. (2016).
FE wrote the paper text and created the figures. OC and ED were involved in content creation. All contributed to article reviews. OC and FE developed the assimilation technique.
The contact author has declared that none of the authors has any competing interests.
Publisher's note: Copernicus Publications remains neutral with regard to jurisdictional claims in published maps and institutional affiliations.
This work was a part of Felix Erdmann's PhD and as such was funded by CNES and Météo-France. The authors thank two anonymous reviewers for their valuable feedback that helped to improve the article. The authors also thank Laurent Labatut and the Météo-France IT department for providing remote access to the Météo-France servers that was needed for the revision and creating the new figures.
This research has been supported by the Centre National d'Etudes Spatiales (CNES) SOLID project and EXADRE project and EXAEDRE project (grant no. ANR-16-CE04-0005)).
This paper was edited by Gregor C. Leckebusch and reviewed by two anonymous referees.
Allen, B. J., Mansell, E. R., Dowell, D. C., and Deierling, W.: Assimilation of Pseudo-GLM Data Using the Ensemble Kalman Filter, Mon. Weather Rev., 144, 3465–3486, https://doi.org/10.1175/MWR-D-16-0117.1, 2016. a, b
Allen, D. J. and Pickering, K. E.: Evaluation of lightning flash rate parameterizations for use in a global chemical transport model, J. Geophys. Res.-Atmos., 107, ACH 15-1–ACH 15-21, https://doi.org/10.1029/2002JD002066, 2002. a
Apodaca, K., Zupanski, M., DeMaria, M., Knaff, J. A., and Grasso, L. D.: Development of a hybrid variational-ensemble data assimilation technique for observed lightning tested in a mesoscale model, Nonlin. Processes Geophys., 21, 1027–1041, https://doi.org/10.5194/npg-21-1027-2014, 2014. a
Barthe, C., Deierling, W., and Barth, M. C.: Estimation of total lightning from various storm parameters: A cloud-resolving model study, J. Geophys. Res.-Atmos., 115, D24202, https://doi.org/10.1029/2010JD014405, 2010. a, b
Betz, H. D., Schmidt, K., Laroche, P., Blanchet, P., Oettinger, W. P., Defer, E., Dziewit, Z., and Konarski, J.: LINET – An international lightning detection network in Europe, Atmos. Res., 91, 564–573, https://doi.org/10.1016/j.atmosres.2008.06.012, 2009. a
Borderies, M., Caumont, O., Augros, C., Bresson, E., Delanoë, J., Ducrocq, V., Fourrié, N., Bastard, T. L., and Nuret, M.: Simulation of W-band radar reflectivity for model validation and data assimilation, Q. J. Roy. Meteor. Soc., 144, 391–403, https://doi.org/10.1002/qj.3210, 2018. a
Borderies, M., Caumont, O., Delanoë, J., Ducrocq, V., Fourrié, N., and Marquet, P.: Impact of airborne cloud radar reflectivity data assimilation on kilometre-scale numerical weather prediction analyses and forecasts of heavy precipitation events, Nat. Hazards Earth Syst. Sci., 19, 907–926, https://doi.org/10.5194/nhess-19-907-2019, 2019. a, b, c, d
Bouyssel, F., Berre, L., Bénichou, H., Chambon, P., Girardot, N., Guidard, V., Loo, C., Mahfouf, J.-F., Moll, P., Payan, C., and Raspaud, D.: The 2020 Global Operational NWP Data Assimilation System at Météo-France, in: Data Assimilation for Atmospheric, Oceanic and Hydrologic Applications, edited by: Park, S. K. and Xu, L., IV, 645–664, https://doi.org/10.1007/978-3-030-77722-7_25, Springer, Cham, 2022. a
Bovalo, C., Barthe, C., and Pinty, J.-P.: Examining relationships between cloud-resolving model parameters and total flash rates to generate lightning density maps, Q. J. Roy. Meteor. Soc., 145, 1250–1266, https://doi.org/10.1002/qj.3494, 2019. a
Brousseau, P., Desroziers, G., Bouttier, F., and Chapnik, B.: A posteriori diagnostics of the impact of observations on the AROME-France convective-scale data assimilation system, Q. J. Roy. Meteor. Soc., 140, 982–994, https://doi.org/10.1002/qj.2179, 2014. a
Brousseau, P., Seity, Y., Ricard, D., and Léger, J.: Improvement of the forecast of convective activity from the AROME-France system, Q. J. Roy. Meteor. Soc., 142, 2231–2243, https://doi.org/10.1002/qj.2822, 2016. a, b, c, d
Buiat, M., Porcù, F., and Dietrich, S.: Observing relationships between lightning and cloud profiles by means of a satellite-borne cloud radar, Atmos. Meas. Tech., 10, 221–230, https://doi.org/10.5194/amt-10-221-2017, 2017. a
Caumont, O., Ducrocq, V., Wattrelot, E., Jaubert, G., and Pradier-Vabre, S.: 1D+3DVar assimilation of radar reflectivity data: a proof of concept, Tellus A, 62, 173–187, https://doi.org/10.1111/j.1600-0870.2009.00430.x, 2010. a, b, c, d
Chen, Y., Yu, Z., Han, W., He, J., and Chen, M.: Case Study of a Retrieval Method of 3D Proxy Reflectivity from FY-4A Lightning Data and Its Impact on the Assimilation and Forecasting for Severe Rainfall Storms, Remote Sens., 12, 1165, https://doi.org/10.3390/rs12071165, 2020. a
Combarnous, P., Erdmann, F., Caumont, O., Defer, É., and Martet, M.: A satellite lightning observation operator for storm-scale numerical weather prediction, Nat. Hazards Earth Syst. Sci., 22, 2943–2962, https://doi.org/10.5194/nhess-22-2943-2022, 2022. a, b
Davies, H. C.: A lateral boundary formulation for multi-level prediction models, Q. J. Roy. Meteor. Soc., 102, 405–418, https://doi.org/10.1002/qj.49710243210, 1976. a
Deierling, W. and Petersen, W. A.: Total lightning activity as an indicator of updraft characteristics, J. Geophys. Res., 113, D16210, https://doi.org/10.1029/2007JD009598, 2008. a, b
Deierling, W., Petersen, W. A., Lathman, J., Ellis, S., and Christian, H. J.: The relationship between lightning activity and ice fluxes in thunderstorms, J. Geophys. Res., 113, D15210, https://doi.org/10.1029/2007JD009700, 2008. a, b, c, d
Dixon, K., Mass, C., Hakim, G., and Holzworth, R.: The Impact of Lightning Data Assimilation on Deterministic and Ensemble Forecasts of Convective Events, J. Atmos. Ocean. Tech., 33, 1801–1823, https://doi.org/10.1175/JTECH-D-15-0188.1, 2016. a
Do, P.-N., Chung, K.-S., Lin, P.-L., Ke, C.-Y., and Ellis, S. M.: Assimilating Retrieved Water Vapor and Radar Data from NCAR S-PolKa: Performance and Validation Using Real Cases, Mon. Weather Rev., 150, 1177–1199, https://doi.org/10.1175/MWR-D-21-0292.1, 2022. a
Dobber, M. and Grandell, J.: Meteosat Third Generation (MTG) Lightning Imager (LI) Instrument Performance and Calibration from User Perspective, in: Proceedings of the 23rd Conference on Characterization and Radiometric Calibration for Remote Sensing (CALCON), 11–14 August 2014, Utah State University, Logan, Utah, USA, 13 pp., 2014. a
Duruisseau, F., Chambon, P., Wattrelot, E., Barreyat, M., and Mahfouf, J.-F.: Assimilating cloudy and rainy microwave observations from SAPHIR on board Megha Tropiques within the ARPEGE global model, Q. J. Roy. Meteor. Soc., 145, 620–641, https://doi.org/10.1002/qj.3456, 2019. a
Erdmann, F.: Préparation à l'utilisation des observations de l'imageur d'éclairs de Météosat Troisième Génération pour la prévision numérique à courte échéance (Preparation for the use of Meteosat Third Generation Lightning Imager observations in short-term numerical weather prediction), PhD thesis, Université Toulouse 3 – Paul Sabatier, Toulouse, France, http://thesesups.ups-tlse.fr/4947/ (last access: 27 September 2022), 2020. a
Erdmann, F., Defer, E., Caumont, O., Blakeslee, R. J., Pédeboy, S., and Coquillat, S.: Concurrent satellite and ground-based lightning observations from the Optical Lightning Imaging Sensor (ISS-LIS), the low-frequency network Meteorage and the SAETTA Lightning Mapping Array (LMA) in the northwestern Mediterranean region, Atmos. Meas. Tech., 13, 853–875, https://doi.org/10.5194/amt-13-853-2020, 2020. a, b
Erdmann, F., Caumont, O., and Defer, E.: A geostationary lightning pseudo-observation generator utilizing low frequency ground-based lightning observations, J. Atmos. Ocean. Tech., 39, 3–30, https://doi.org/10.1175/JTECH-D-20-0160.1, 2022. a, b, c
Faggian, N., Roux, B., Steinle, P., and Ebert, B.: Fast calculation of the Fractions Skill Score, Mausam, 66, 457–466, 2015. a, b
Federico, S., Avolio, E., Petracca, M., Panegrossi, G., Sanò, P., Casella, D., and Dietrich, S.: Simulating lightning into the RAMS model: implementation and preliminary results, Nat. Hazards Earth Syst. Sci., 14, 2933–2950, https://doi.org/10.5194/nhess-14-2933-2014, 2014. a
Federico, S., Petracca, M., Panegrossi, G., Transerici, C., and Dietrich, S.: Impact of the assimilation of lightning data on the precipitation forecast at different forecast ranges, Adv. Sci. Res., 14, 187–194, https://doi.org/10.5194/asr-14-187-2017, 2017. a
Fierro, A. O., Mansell, E. R., Ziegler, C. L., and MacGorman, D. R.: Application of a Lightning Data Assimilation Technique in the WRF-ARW Model at Cloud-Resolving Scales for the Tornado Outbreak of 24 May 2011, Mon. Weather Rev., 140, 2609–2627, https://doi.org/10.1175/MWR-D-11-00299.1, 2012. a, b, c, d
Fierro, A. O., Gao, J., Ziegler, C. L., Mansell, E. R., MacGorman, D. R., and Dembrek, S. R.: Evaluation of a Cloud-Scale Lightning Data Assimilation Technique and a 3DVAR Method for the Analysis and Short-Term Forecast of the 29 June 2012 Derecho Event, Mon. Weather Rev., 142, 183–202, https://doi.org/10.1175/MWR-D-13-00142.1, 2014. a
Fierro, A. O., Gao, J., Ziegler, C. L., Calhoun, K. M., Mansell, E. R., and MacGorman, D. R.: Assimilation of Flash Extent Data in the Variational Framework at Convection-Allowing Scales: Proof-of-Concept and Evaluation for the Short-Term Forecast of the 24 May 2011 Tornado Outbreak, Mon. Weather Rev., 144, 4373–4393, https://doi.org/10.1175/MWR-D-16-0053.1, 2016. a, b, c
Fierro, A. O., Wang, Y., Gao, J., and Mansell, E. R.: Variational Assimilation of Radar Data and GLM Lightning-Derived Water Vapor for the Short-Term Forecasts of High-Impact Convective Events, Mon. Weather Rev., 147, 4045–4069, https://doi.org/10.1175/MWR-D-18-0421.1, 2019. a, b, c, d, e, f, g
Fischer, C., Bouyssel, F., Brousseau, P., El Khatib, R., Pottier, P., Seity, Y., Wattrelot, E., and Joly, A.: Les modèles opérationnels de prévision numérique à aire limitée de Météo-France, La Météorologie, 100, 18–28, https://doi.org/10.4267/2042/65139, 2018. a
Formenton, M., Panegrossi, G., Casella, D., Dietrich, S., Mugnai, A., Sanò, P., Di Paola, F., Betz, H.-D., Price, C., and Yair, Y.: Using a cloud electrification model to study relationships between lightning activity and cloud microphysical structure, Nat. Hazards Earth Syst. Sci., 13, 1085–1104, https://doi.org/10.5194/nhess-13-1085-2013, 2013. a
Giannaros, T. M., Kotroni, V., and Lagouvardos, K.: Predicting lightning activity in Greece with the Weather Research and Forecasting (WRF) model, Atmos. Res., 156, 1–13, https://doi.org/10.1016/j.atmosres.2014.12.009, 2015. a
Giannaros, T. M., Kotroni, V., and Lagouvardos, K.: WRF-LTNGDA: A lightning data assimilation technique implemented in the WRF model for improving precipitation forecasts, Environ. Model. Softw., 76, 54–68, https://doi.org/10.1016/j.envsoft.2015.11.017, 2016. a
Goodman, S. J., Blakeslee, R. J., Koshak, W. J., Mach, D., Bailey, J., Buechler, D., Carey, L., Schultz, C., Bateman, M., McCaul, E., and Stano, G.: The GOES-R Geostationary Lightning Mapper (GLM), Atmos. Res., 125–126, 34–49, https://doi.org/10.1016/j.atmosres.2013.01.006, 2013. a
Hu, J., Fierro, A. O., Wang, Y., Gao, J., and Mansell, E. R.: Exploring the Assimilation of GLM-Derived Water Vapor Mass in a Cycled 3DVAR Framework for the Short-Term Forecasts of High-Impact Convective Events, Mon. Weather Rev., 148, 1005–1028, https://doi.org/10.1175/MWR-D-19-0198.1, 2020. a, b, c, d, e, f
Janisková, M. and Lopez, P.: Linearized Physics for Data Assimilation at ECMWF, in: Data Assimilation for Atmospheric, Oceanic and Hydrologic Applications, edited by: Park, S. and Xu, L., Springer, Berlin, Heidelberg, vol. 2, https://doi.org/10.1007/978-3-642-35088-7_11, 2013. a
Järvinen, H. and Undén, P.: Observation screening and background quality control in the ECMWF 3D-Var data assimilation system, Tech. rep. ECMWF, https://doi.org/10.21957/lyd3q81, 1997. a
Karagiannidis, A., Lagouvardos, K., Lykoudis, S., Kotroni, V., Giannaros, T., and Betz, H.-D.: Modeling lightning density using cloud top parameters, Atmos. Res., 222, 163–171, https://doi.org/10.1016/j.atmosres.2019.02.013, 2019. a
Kong, R., Xue, M., Fierro, A. O., Jung, Y., Liu, C., Mansell, E. R., and MacGorman, D. R.: Assimilation of GOES-R Geostationary Lightning Mapper Flash Extent Density Data in GSI EnKF for the Analysis and Short-Term Forecast of a Mesoscale Convective System, Mon. Weather Rev., 148, 2111–2133, https://doi.org/10.1175/MWR-D-19-0192.1, 2020. a
Kummerow, C., Hong, Y., Olson, W. S., Yang, S., Adler, R. F., McCollum, J., Ferraro, R., Petty, G., Shin, D.-B., and Wilheit, T. T.: The Evolution of the Goddard Profiling Algorithm (GPROF) for Rainfall Estimation from Passive Microwave Sensors, J. Appl. Meteorol., 40, 1801–1820, https://doi.org/10.1175/1520-0450(2001)040<1801:TEOTGP>2.0.CO;2, 2001. a
Lagouvardos, K., Kotroni, V., Defer, E., and Bousquet, O.: Study of a heavy precipitation event over southern France, in the frame of HYMEX project: Observational analysis and model results using assimilation of lightning, Atmos. Res., 134, 45–55, https://doi.org/10.1016/j.atmosres.2013.07.003, 2013. a
Lascaux, F., Richard, E., and Pinty, J.-P.: Numerical simulations of three different MAP IOPs and the associated microphysical processes, Q. J. Roy. Meteor. Soc., 132, 1907–1926, https://doi.org/10.1256/qj.05.197, 2006. a
Laurantin, O.: ANTILOPE: hourly rainfall analysis merging radar and rain gauge data, in: Int. Symp. Weather Radar and Hydrology (WRaH2008), Grenoble and Autrans, France, 10–15 March 2008, 2008. a
Laurantin, O.: ANTILOPE: hourly rainfall analysis over France merging radar and rain gauges data, in: Proceedings of the 11th International Precipitation Conference, edited by: Leijnse, H. and Uijlenhoet, R., KNMI, Ede-Wageningen, the Netherlands, 30 June to 3 July 2013, 2013. a
Liu, P., Yang, Y., Gao, J., Wang, Y., and Wang, C.: An Approach for Assimilating FY4 Lightning and Cloud Top Height Data Using 3DVAR, Front. Earth Sci., 8, 288, https://doi.org/10.3389/feart.2020.00288, 2020. a
Lynn, B. H., Kelman, G., and Ellrod, G.: An Evaluation of the Efficacy of Using Observed Lightning to Improve Convective Lightning Forecasts, Weather Forecast., 30, 405–423, https://doi.org/10.1175/WAF-D-13-00028.1, 2015. a, b
Mansell, E. R.: Storm-Scale Ensemble Kalman Filter Assimilation of Total Lightning Flash-Extent Data, Mon. Weather Rev., 142, 3683–3695, https://doi.org/10.1175/MWR-D-14-00061.1, 2014. a, b
Mansell, E. R., Ziegler, C. L., and MacGorman, D. R.: A Lightning Data Assimilation Technique for Mesoscale Forecast Models, Mon. Weather Rev., 135, 1732–1748, https://doi.org/10.1175/MWR3387.1, 2007. a
Marchand, M. R. and Fuelberg, H. E.: Assimilation of Lightning Data Using a Nudging Method Involving Low-Level Warming, Mon. Weather Rev., 142, 4850–4871, https://doi.org/10.1175/MWR-D-14-00076.1, 2014. a
McCaul, Eugene W., J., Goodman, S. J., LaCasse, K. M., and Cecil, D. J.: Forecasting Lightning Threat Using Cloud-Resolving Model Simulations, Weather Forecast., 24, 709–729, https://doi.org/10.1175/2008WAF2222152.1, 2009. a, b, c
Michel, Y.: Revisiting Fisher's approach to the handling of horizontal spatial correlations of observation errors in a variational framework, Q. J. Roy. Meteor. Soc., 144, 2011–2025, https://doi.org/10.1002/qj.3249, 2018. a
Olson, W. S., Kummerow, C. D., Heymsfield, G. M., and Giglio, L.: A Method for Combined PassiveActive Microwave Retrievals of Cloud and Precipitation Profiles, J. Appl. Meteorol., 35, 1763–1789, https://doi.org/10.1175/1520-0450(1996)035<1763:AMFCPM>2.0.CO;2, 1996. a
Papadopoulos, A., Chronis, T., and Anagnostou, E.: Improving Convective Precipitation Forecasting through Assimilation of Regional Lightning Measurements in a Mesoscale Model, Mon. Weather Rev., 133, 1961–1977, https://doi.org/10.1175/MWR2957.1, 2005. a
Pédeboy, S.: Analysis of the French lightning locating system location accuracy, 2015 International Symposium on Lightning Protection (XIII SIPDA), Balneário Camboriú, Brazil, 28 September–2 October 2015, 337–341, https://doi.org/10.1109/SIPDA.2015.7339299, 2015. a
Pergaud, J., Masson, V., Malardel, S., and Couvreux, F.: A Parameterization of Dry Thermals and Shallow Cumuli for Mesoscale Numerical Weather Prediction, Bound.-Lay. Meteorol., 132, 83–106, https://doi.org/10.1007/s10546-009-9388-0, 2009. a
Pessi, A. T. and Businger, S.: The Impact of Lightning Data Assimilation on a Winter Storm Simulation over the North Pacific Ocean, Mon. Weather Rev., 137, 3177–3195, https://doi.org/10.1175/2009MWR2765.1, 2009. a
Price, C. and Rind, D.: A simple lightning parameterization for calculating global lightning distributions, J. Geophys. Res., 97, 9919–9933, https://doi.org/10.1029/92JD00719, 1992. a
Price, C. and Rind, D.: What determines the cloud-to-ground lightning fraction in thunderstorms?, Geophys. Res. Lett., 20, 463–466, https://doi.org/10.1029/93GL00226, 1993. a
Qie, X., Zhu, R., Yuan, T., Wu, X., Li, W., and Liu, D.: Application of total-lightning data assimilation in a mesoscale convective system based on the WRF model, Atmos. Res., 145–146, 255–266, https://doi.org/10.1016/j.atmosres.2014.04.012, 2014. a
Rabier, F.: Importance of Data: A Meteorological Perspective, in: Ocean Weather Forecasting, edited by: Chassignet, E. and Verron, J., Chap. 12, Springer, Dordrecht, 343–360, https://doi.org/10.1007/1-4020-4028-8_12, 2006. a
Roberts, N. and Lean, H.: Scale-Selective Verification of Rainfall Accumulations from High-Resolution Forecasts of Convective Events, Mon. Weather Rev., 136, 78–97, https://doi.org/10.1175/2007MWR2123.1, 2008. a
Schulz, W., Diendorfer, G., Pedeboy, S., and Poelman, D. R.: The European lightning location system EUCLID – Part 1: Performance analysis and validation, Nat. Hazards Earth Syst. Sci., 16, 595–605, https://doi.org/10.5194/nhess-16-595-2016, 2016. a
Seity, Y., Brousseau, P., Malardel, S., Hello, G., Bénard, P., Bouttier, F., Lac, C., and Masson, V.: The AROME-France Convective-Scale Operational Model, Mon. Weather Rev., 139, 976–991, https://doi.org/10.1175/2010MWR3425.1, 2011. a, b, c, d, e
Vié, B., Nuissier, O., and Ducrocq, V.: Cloud-Resolving Ensemble Simulations of Mediterranean Heavy Precipitating Events: Uncertainty on Initial Conditions and Lateral Boundary Conditions, Mon. Weather Rev., 139, 403–423, https://doi.org/10.1175/2010MWR3487.1, 2011. a
Wang, H., Sun, J., Fan, S., and Huang, X.-Y.: Indirect Assimilation of Radar Reflectivity with WRF 3D-Var and Its Impact on Prediction of Four Summertime Convective Events, J. Appl. Meteorol. Clim., 52, 889–902, https://doi.org/10.1175/JAMC-D-12-0120.1, 2013. a
Wang, H., Liu, Y., Cheng, W. Y. Y., Zhao, T., Xu, M., Liu, Y., Shen, S., Calhoun, K. M., and Fierro, A. O.: Improving Lightning and Precipitation Prediction of Severe Convection Using Lightning Data Assimilation With NCAR WRF-RTFDDA, J. Geophys. Res.-Atmos., 122, 12,296–12,316, https://doi.org/10.1002/2017JD027340, 2017. a
Wang, H., Liu, Y., Zhao, T., Liu, Y., Xu, M., Shen, S., Jiang, Y., Yang, H., and Feng, S.: Continuous Assimilation of Lightning Data Using Time-Lagged Ensembles for a Convection-Allowing Numerical Weather Prediction Model, J. Geophys. Res.-Atmos., 123, 9652–9673, https://doi.org/10.1029/2018JD028494, 2018. a
Wang, Y., Yang, Y., and Wang, C.: Improving forecasting of strong convection by assimilating cloud-to-ground lightning data using the physical initialization method, Atmos. Res., 150, 31–41, https://doi.org/10.1016/j.atmosres.2014.06.017, 2014. a
Wang, Y., Yang, Y., Liu, D., Zhang, D., Yao, W., and Wang, C.: A Case Study of Assimilating Lightning-Proxy Relative Humidity with WRF-3DVAR, Atmosphere, 8, 20, https://doi.org/10.3390/atmos8030055, 2017. a, b
Wattrelot, E., Caumont, O., and Mahfouf, J.-F.: Operational Implementation of the 1D+3D-Var Assimilation Method of Radar Reflectivity Data in the AROME Model, Mon. Weather Rev., 142, 1852–1873, https://doi.org/10.1175/MWR-D-13-00230.1, 2014. a, b
Wong, J., Barth, M. C., and Noone, D.: Evaluating a lightning parameterization based on cloud-top height for mesoscale numerical model simulations, Geosci. Model Dev., 6, 429–443, https://doi.org/10.5194/gmd-6-429-2013, 2013. a
Yair, Y., Lynn, B., Price, C., Kotroni, V., Lagouvardos, K., Morin, E., Mugnai, A., and Llasat, M. d. C.: Predicting the potential for lightning activity in Mediterranean storms based on the Weather Research and Forecasting (WRF) model dynamic and microphysical fields, J. Geophys. Res.-Atmos., 115, D04205, https://doi.org/10.1029/2008JD010868, 2010. a
Zhang, D., Cummins, K. L., Bitzer, P. M., and Koshak, W. J.: Evaluation of the Performance Characteristics of the Lightning Imaging Sensor, J. Atmos. Ocean. Tech., 36, 1015–1030, https://doi.org/10.1175/JTECH-D-18-0173.1, 2019. a
Non-integer FED values are possible when applying the observation operator.
- Abstract
- Introduction
- Model configuration
- Lightning data
- Lightning observation operator
- The 1DBay plus 3DVar assimilation method
- Experimental setup
- The AROME-France analysis and forecast assimilating FED observations
- Quantitative skill of AROME-France RA forecasts
- Conclusions
- Code availability
- Data availability
- Author contributions
- Competing interests
- Disclaimer
- Acknowledgements
- Financial support
- Review statement
- References