the Creative Commons Attribution 4.0 License.
the Creative Commons Attribution 4.0 License.
 | 01 Aug 2023
Characteristics of debris flows recorded in the Shenmu area of central Taiwan between 2004 and 2021
The data of debris-flow events between 2004 and 2021 in the Shenmu area Taiwan are presented and discussed in this paper. A total of 20 debris-flow events were observed in 18 years. Debris flows in the Shenmu area usually occurred in the Aiyuzi Stream during the rainy season, May to September, and about once per year between 2009 and 2017. The rainfall thresholds from the observed data are proposed to be Imax (maximum hourly rainfall), R24 (24 h accumulated rainfall), and Rt (effective accumulated rainfall) of 9, 23, and 67.8 mm, respectively. The rainfall data also imply that the trend curves of intensity–duration (I–D) were different before and after 2009, which is due to the extreme rainfall event of Typhoon Morakot in 2009. The I–D curve obtained from the post-2009 data is proposed as the baseline of the debris-flow I–D relationship in the study area. The extreme rainfall event also influenced the flow speed (average 14.3 m s−1 before 2010 and 4.46 m s−1 after 2010) and the occurrence frequency of debris flows (1.83 times per year before 2009 and 0.75 times after 2009). Recent findings have indicated that the ground surface vibrational signals of debris flows are potentially useful for debris-flow early warning in terms of accumulated energy, and the characteristic frequency of debris flows in the study area was below 40 Hz. The dataset and the rainfall thresholds in this study permit comparison with other monitored catchments and are useful for global debris-flow datasets.
- Article
(9598 KB) - Full-text XML
- BibTeX
- EndNote


Debris flows have become a common disaster in Taiwan in the past 2 decades (Huang et al., 2013, 2016, 2017). To understand the characteristics, especially the triggering factors, of debris flows, devices and monitoring stations have been installed and established in the areas prone to debris flows. Given the environmental conditions in mountain areas in Taiwan, it is more desirable to deploy monitoring instrumentation at the potential debris-flow streams, especially in the upper sections of them. But problems are usually encountered, like power supply and communication interruption, when trying to install sensors in distant mountain areas. It is difficult in debris-flow research to obtain full-scale experimental data that can represent in situ conditions. Instead, the observation data from these monitoring stations in Taiwan provide valuable information for debris-flow-characteristic studies (Huang et al., 2013; Hürlimann et al., 2019).
In Taiwan, the debris-flow monitoring system was built by the Taiwan government, specifically the Soil and Water Conservation Bureau (SWCB), by designing and applying different types of monitoring stations (Wang et al., 2011; Huang et al., 2013). Permanent and automatic monitoring devices were installed on sites to collect data about debris flows. In a potential debris-flow area, the debris flows usually occur at a low frequency and are considered uncommon events when compared to other natural hazards, e.g., heavy rainfalls (Riedel and Sarrantonio, 2021). But at some locations, the occurrence frequency of debris flows is higher than at other locations (Marchi et al., 2021). The Shenmu area in Taiwan is one where debris flows have occurred more often at than other locations and almost once every year in the past 18 years (2004 to 2021).
Studies about debris-flow characteristics started in Japan and China (Marchi et al., 2021). A review by Hürlimann et al. (2019) has addressed information collected from nine monitoring sites and discussed the achievements and the types of monitoring systems. The monitoring site conditions, local features of the Shenmu area, and debris-flow events have been used as an important monitoring case in many studies (Huang et al., 2013, 2016; Lee et al., 2017; Wei et al., 2018; Hürlimann et al., 2019). Therefore, the available data collected from the Shenmu debris-flow monitoring station during the period of 2004 to 2021 were used for this work. It should be noted that there were no debris flows after 2017, and the tables and figures in this study present the results of recorded debris-flow events.
This study focuses on the rainfall data obtained from recorded debris-flow events in the Shenmu area and the potential indicators or factors that could be used for debris-flow early warning. The purpose of this research includes the discussion of rainfall characteristics, in terms of rainfall intensity (I), duration (D), and accumulated rainfall (R), and recent findings about the impacts of extreme weather, variation in soil moisture, and ground surface vibrational signals of debris flows. A dataset of debris flows recorded in the Shenmu area between 2004 and 2021 is presented in this study. The event data were collected from various available sources. The data prepared in this study include dates of debris-flow events, time of debris-flow occurrence (whenever available), the triggering rainfalls (rainfall intensity, accumulated rainfall, and duration), and a brief review of soil moisture and vibrational signal graphs (for some events).
Early research reveals the potential intensity–duration (I–D) curves from global event data (Caine, 1980; Guzzetti et al., 2008). These curves can be used as a baseline, the minimum rainfall thresholds, for debris flows by considering the rainfall intensity and duration of a given area. The dataset prepared for this study was compared with global I–D curves. The rainfall data obtained and used in this study are from the Shenmu rainfall station (23∘31.9645′ N, 120∘50.62′ E) maintained by the Central Weather Bureau (CWB) and from the Shenmu debris-flow monitoring station (23∘31.6938′ N, 120∘51.3927′ E) maintained by the Soil and Water Conservation Bureau (SWCB). These data were collected from the instrumentation installed in the study area and were used to describe the important characteristics of debris-flow I–D curves in the Shenmu area and compare them with the global debris-flow database. Analysis of debris-flow rainfall thresholds is also discussed from different approaches. The change in rainfall thresholds used for debris-flow early warnings by the local government and the characteristics of maximum hourly rainfall, effective accumulated rainfall, and the I–D of debris-flow events in Shenmu are described and compared here.
Other monitoring data that could be potentially useful for debris-flow early warning are also discussed in this study, including the soil moisture and ground surface vibrational signals. The impacts of extreme weather, specifically Typhoon Morakot in 2009 in this study, are also analyzed and compared using flow speeds, estimated from the video camera footage available online for several events, and the occurrence frequency of debris flows. Conclusions are made to highlight the contributions of this work at the end.
The study area is at the village of Shenmu, the location of three torrents with very high potential for debris flow. The three debris-flow torrents, the Aiyuzi Stream (DF226, where DF refers to the debris flow number), Huosa Stream (DF227), and Chusuei Stream (DF199), join the Heshe Stream around the entrance of the village, and the entire basic area is about 72.2 km2 (Huang et al., 2013; Hürlimann et al., 2019). These streams belong to the watershed of the Chenyulan River in the central part of Taiwan. The terrain and landslide areas of streams and basic information are shown in Fig. 1 and Table 1, respectively. In the study area, debris flows commonly occur in the Aiyuzi Stream due to its shorter length and larger landslide areas located in its upstream area since Typhoon Morakot in 2009 (Huang et al., 2013). The slope angles in the upstream areas of the debris flows are between 30 and 50∘, and the average slope in the Aiyuzi Stream watershed is about 39.3∘ (Wei et al., 2018), based on the fact that over 75 % of the Aiyuzi Stream watershed area has slopes greater than 32∘ (Huang et al., 2007). A great percentage of the watershed has been affected by significant landslides (Fig. 1). With observations from the sites and from the videos of debris flows in the Aiyuzi Stream, the debris flows in the Shenmu area are classified as granular flows. In many field investigations, boulders are often 1–2 m in diameter, and boulders with a diameter of more than 4–5 m can be seen in the accumulation of debris along streams.
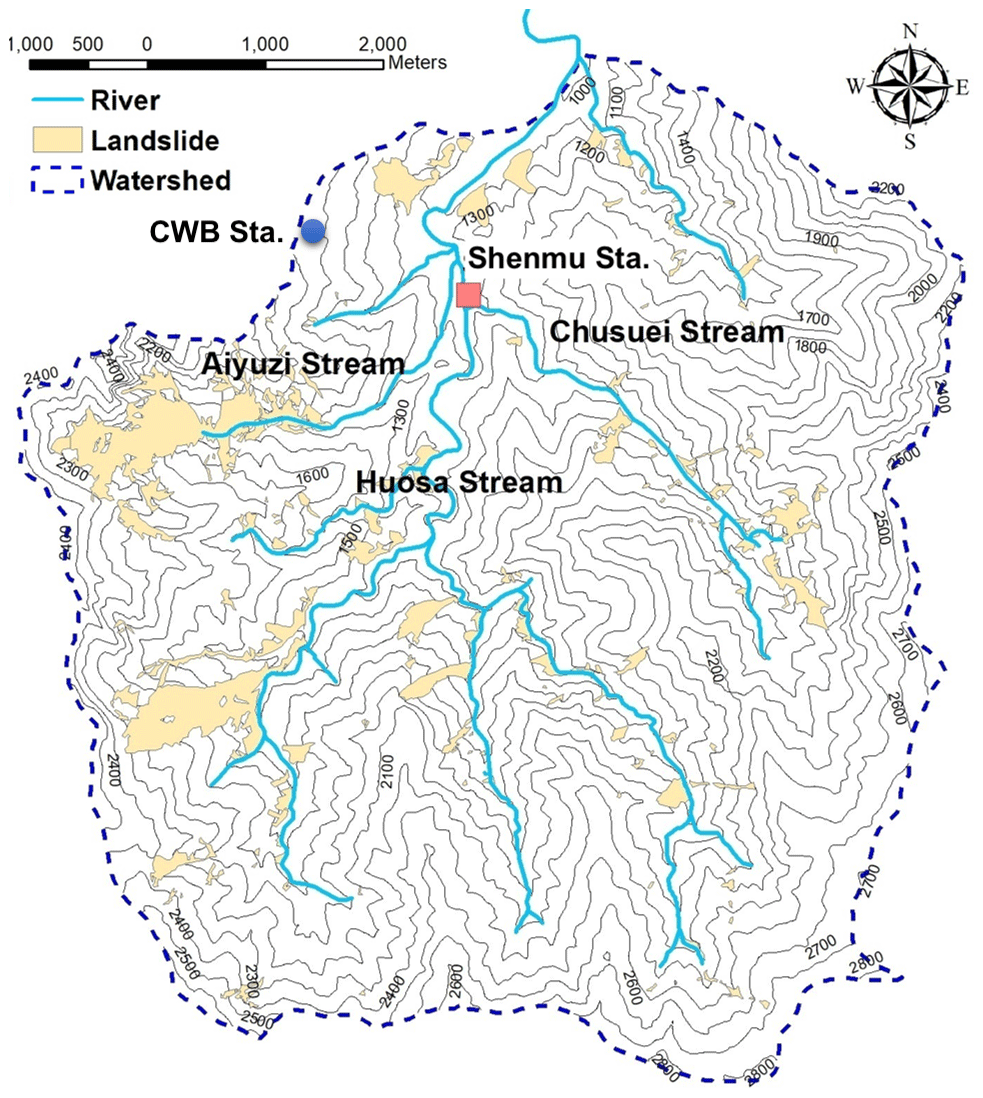
Figure 1A map of terrain and the landslide areas (after 2009) of the Shenmu area (adapted from Huang et al., 2019b).
Table 1The total landslide area in Shenmu after 2009 (Huang et al., 2013).
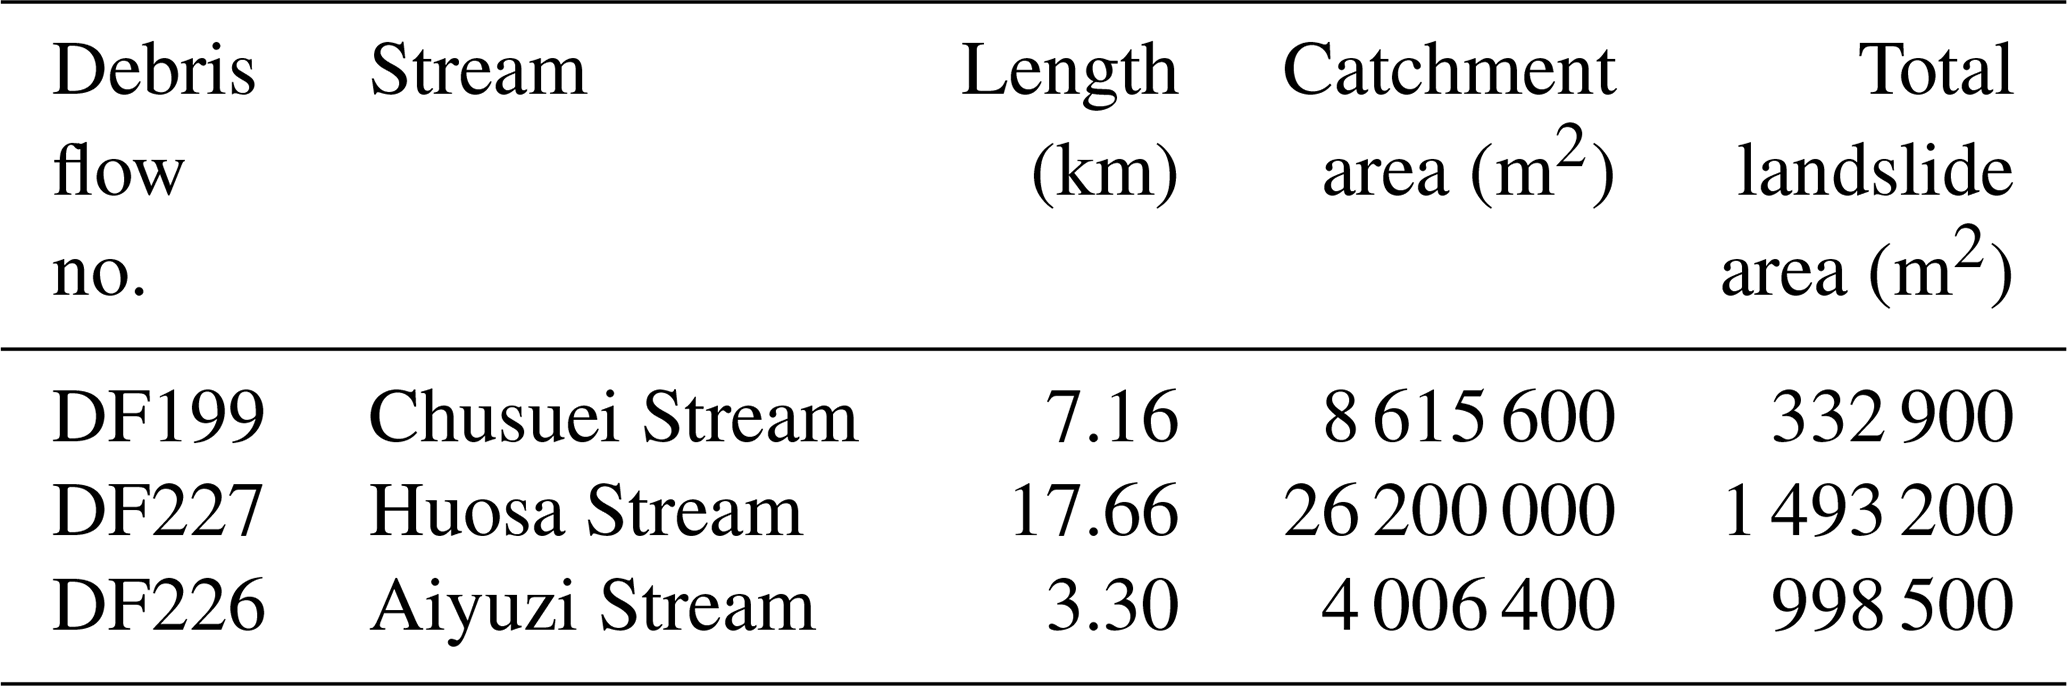
Among the three debris-flow torrents in the study area, the Aiyuzi Stream is the focus of this study. The Aiyuzi Stream is a stream at the upstream of the Chenyulan River catchment area. The total length of this stream is about 3.731 km, the watershed area is 405.02 ha, and the topographical elevation is between 1200 and 2500 m. According to Chen et al. (2012), the landslide ratio (landslide projected area total catchment area) of this catchment area is about 12 %–34.2 % (during 1996 to 2009), and there is a trend of increasing year by year.
Based on the rainfall data (from June 1987 to February 2017) from the Shenmu station of Taiwan's Central Weather Bureau (CWB), the average annual rainfall in the Aiyuzi Stream watershed area is about 3054.7 mm, of which the average total accumulated rainfall in the rainy season (from April to October each year) is 2644.5 mm (Wei et al., 2018). Because of the abundant rains and landslide-induced debris in the upstream area, with steep slopes (about 39.3∘ on average) in the region, debris flows often occurred in the Aiyuzi Stream during heavy rains and typhoons.
Since the Chi-Chi Earthquake in 1999, the environmental conditions in the mountain areas of central Taiwan have become vulnerable to heavy rainfalls and typhoons. Rainfall-induced shallow landslides have occurred more often than ever, resulting in abundant soil, rocks, and debris accumulated in the streams. Debris-flow disasters since 2000 have increased the general public's attention to these events. To protect people living in the debris-flow-prone areas, the Taiwan government started to establish debris-flow monitoring stations in 2002 and later developed mobile monitoring stations and portable units to meet different needs. More and more observation data were obtained as debris flows occurred almost annually from 2004 to 2009. In the study area, the debris flow that occurred in 2004 was the first officially observed event with available monitoring data.
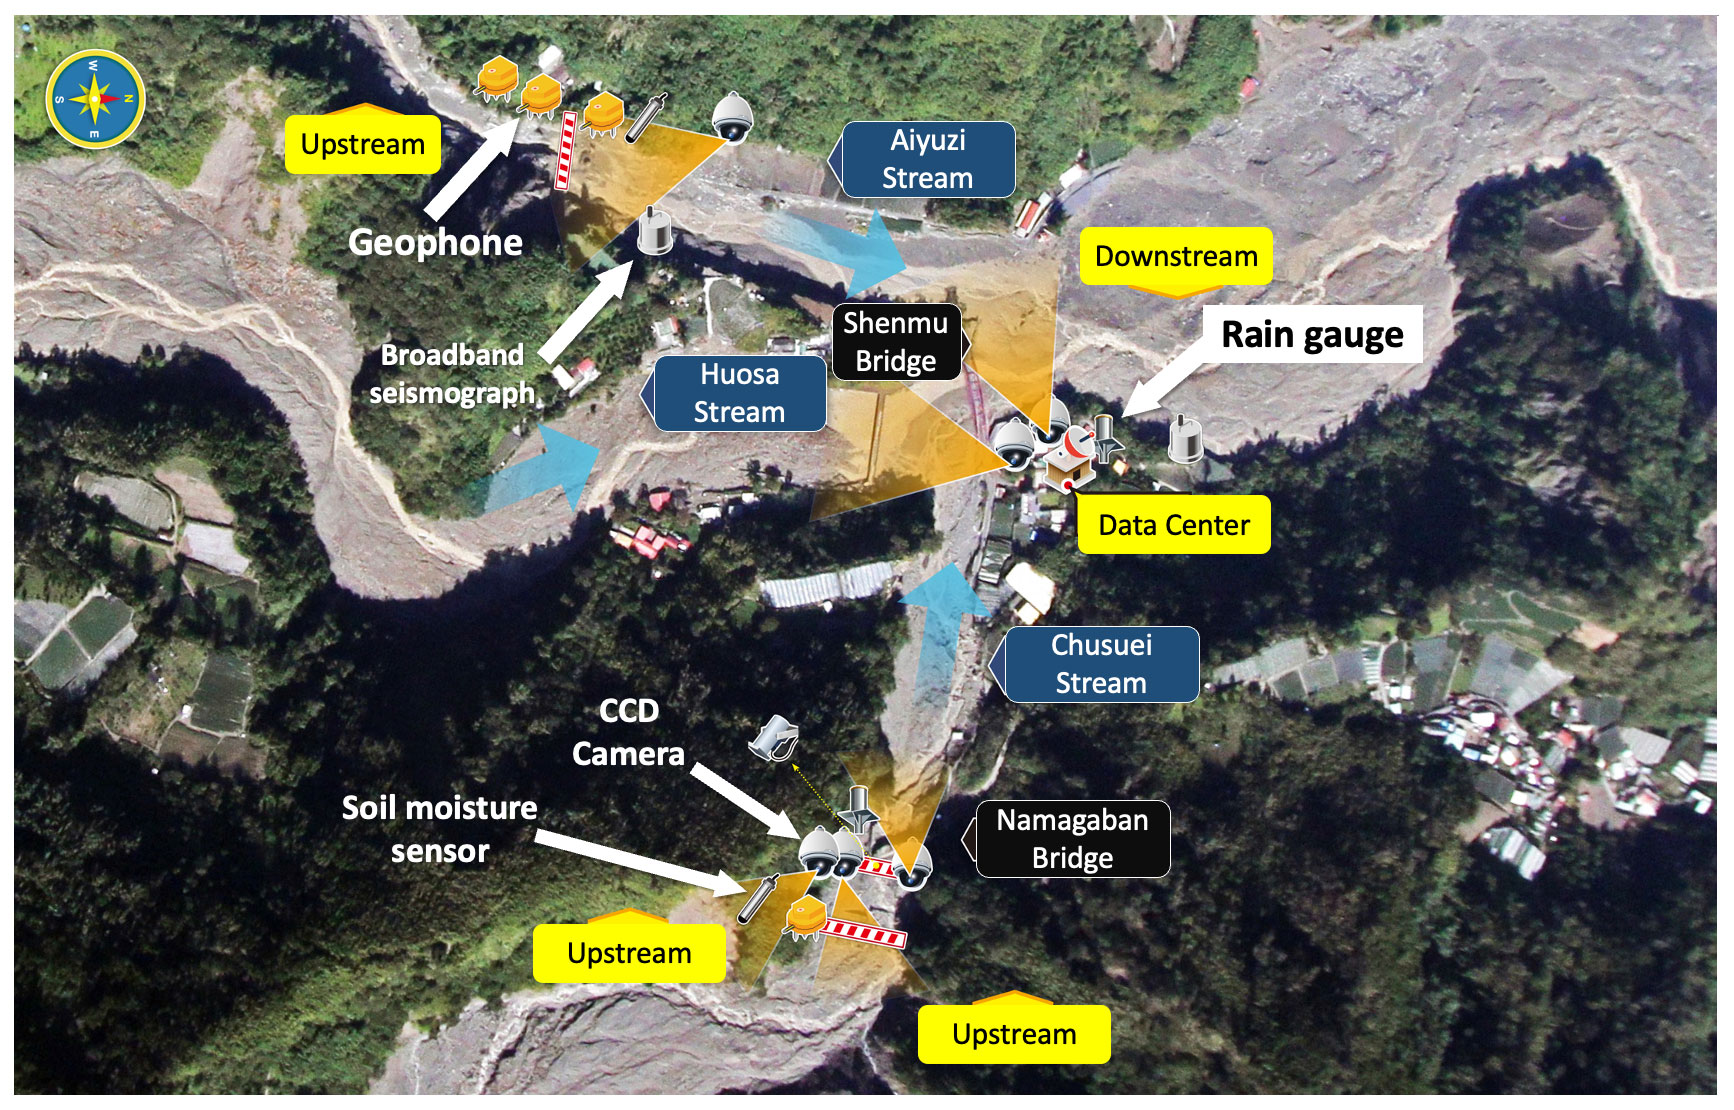
Figure 2The layout of sensors installed at the Shenmu monitoring station (base map credit: GIS Research Center, Feng Chia University, Taiwan).
The Shenmu debris-flow monitoring station was established in 2002 and is installed at 1187 m a.s.l. at the confluence of three potential debris-flow torrents (Fig. 2). Different sensors are installed on the site of the monitoring station to observe and collect data for debris-flow warning and disaster responses. The monitoring options installed in the Shenmu area include direct and indirect measures for debris flows. The direct option refers to devices that can capture debris flows, issue warnings, and measure the status of debris flows when they occur. These devices used in Shenmu are wire sensors and geophones. The wire sensor simply issues a signal that is “broken” when a debris flow passes through and breaks the wire over the channel. The geophone detects the ground surface vibration, and the debris flow is recognized when a peak in the vibration records is evident (Huang et al., 2016, 2007; Huang and Chen, 2022). The signals from the wire sensors and geophones indicate the occurrence of debris flows and the timing based on when a debris flow runs through the locations of these instruments. Other monitoring options, including rain gauges, soil moisture sensors, CCD cameras, and flow speed meters, are used as supporting devices to help confirm the occurrence of debris flows. False alarms are inevitable during debris-flow monitoring, and cross-checking is necessary and important.
Among the monitoring data, rainfall is the most used and important information for debris-flow warning and analysis. The signal of ground surface vibration is another considerably useful factor for indicating the occurrence of debris flows (Huang et al., 2012, 2017; Wei et al., 2018). Change in water content in the underground soil is detected by soil moisture sensors, and the data are useful for potential estimation of shallow landslides. Figure 2 shows a detailed layout of the Shenmu monitoring station, including rain gauges (TK-1, Takeda Keiki Co.), geophones (GS-20DX, Geospace), wire sensors, soil moisture sensors, and video cameras (PTZ camera). Similarly to the geophones, two broadband seismic sensors (Yardbird DF-2, Academia Sinica, Taiwan) are also installed along the Aiyuzi Stream (Huang et al., 2017).
Table 2Debris-flow events in the Shenmu area.
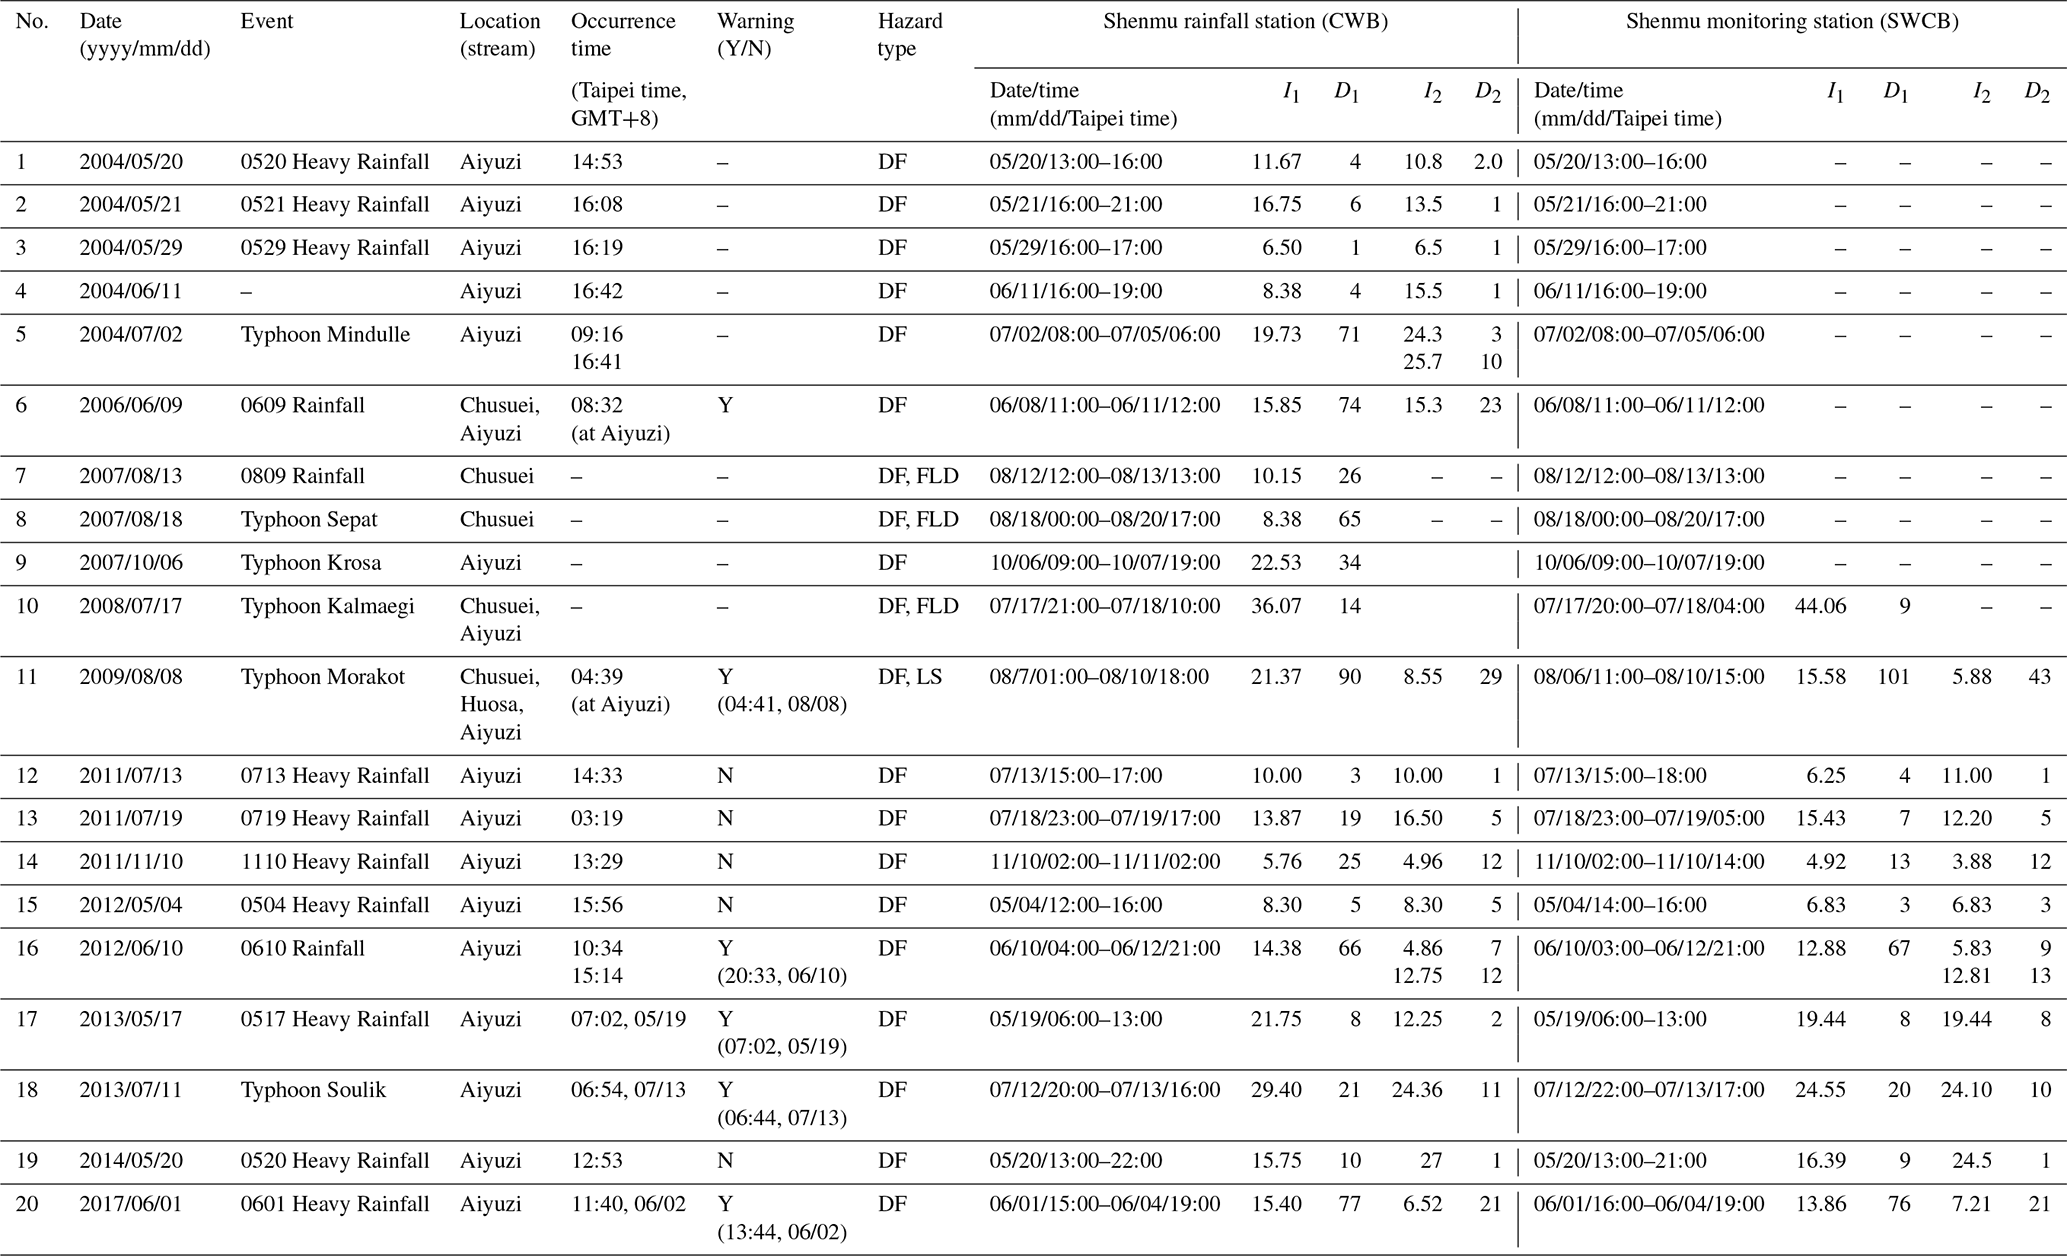
I1,I2: the rainfall intensity (mm h−1) of the whole event and of the duration between the event start and 1 h before the occurrence of the debris flow, respectively; D1, D2: the rainfall duration (hour) of the whole event duration and of the duration between the event start and 1 h before the occurrence of the debris flow, respectively; DF: debris flow; FLD: flood; LS: landslide; Y: yes; N: no; –: not available.
Typhoon Herb in 1996 caused debris flows in the channel of the Chusuei Stream. Frequent debris flows occurred in the Shenmu area after 1996. In July 2001, with heavy rainfalls, Typhoon Toraji caused severe casualties and property loss in the Shenmu area. Therefore, SWCB started to build the debris-flow monitoring station in Shenmu in 2002. Since that time, the local monitoring system has operated to continuously collect the observation data of debris flows in the study area. Table 2 shows the observed event list of the Shenmu area.
The events in Table 2 imply that the debris flows occurred almost every year during 2009 to 2014, with a total of 9 debris-flow events in 6 years, compared to the period between 2004 and 2008, when debris flows occurred 10 times in 5 years. It is noted that, after the extreme rainfall event of Typhoon Morakot in 2009 (from 7 to 9 August, accumulated rainfall of 1872 mm in the Shenmu area), all the observed debris flows occurred in the Aiyuzi Stream. A possible explanation for these conditions is the shorter length of the stream and more landslides in the upstream areas of the Aiyuzi Stream after 2009 when compared with the other two streams (Table 1). With an abundant debris source in the upstream sections and heavy rainfalls, these factors contribute to the frequent occurrence of debris flows in the Aiyuzi Stream. From 2014 until 2021, there was only one record of a debris flow in Shenmu (Table 2). It seems that the occurrence frequency reduced from once per year during 2009 to 2014 to very few in the subsequent 7 years (from 2015 to 2021). From Table 2, the average frequency of occurrence is about 1.11 times per year during the period from 2004 to 2021 (20 debris-flow events in 18 years). Comparatively, the average frequency of debris-flow occurrence is 1.83 times per year from 2004 to 2009 (11 debris-flow events in 6 years) and 0.75 times per year after 2009 (9 debris-flow events in 12 years).
Table 3Annual landslide increments (m2) from 2005 to 2017 in the Shenmu area. The value in bold font means the highest annual landslide increment.
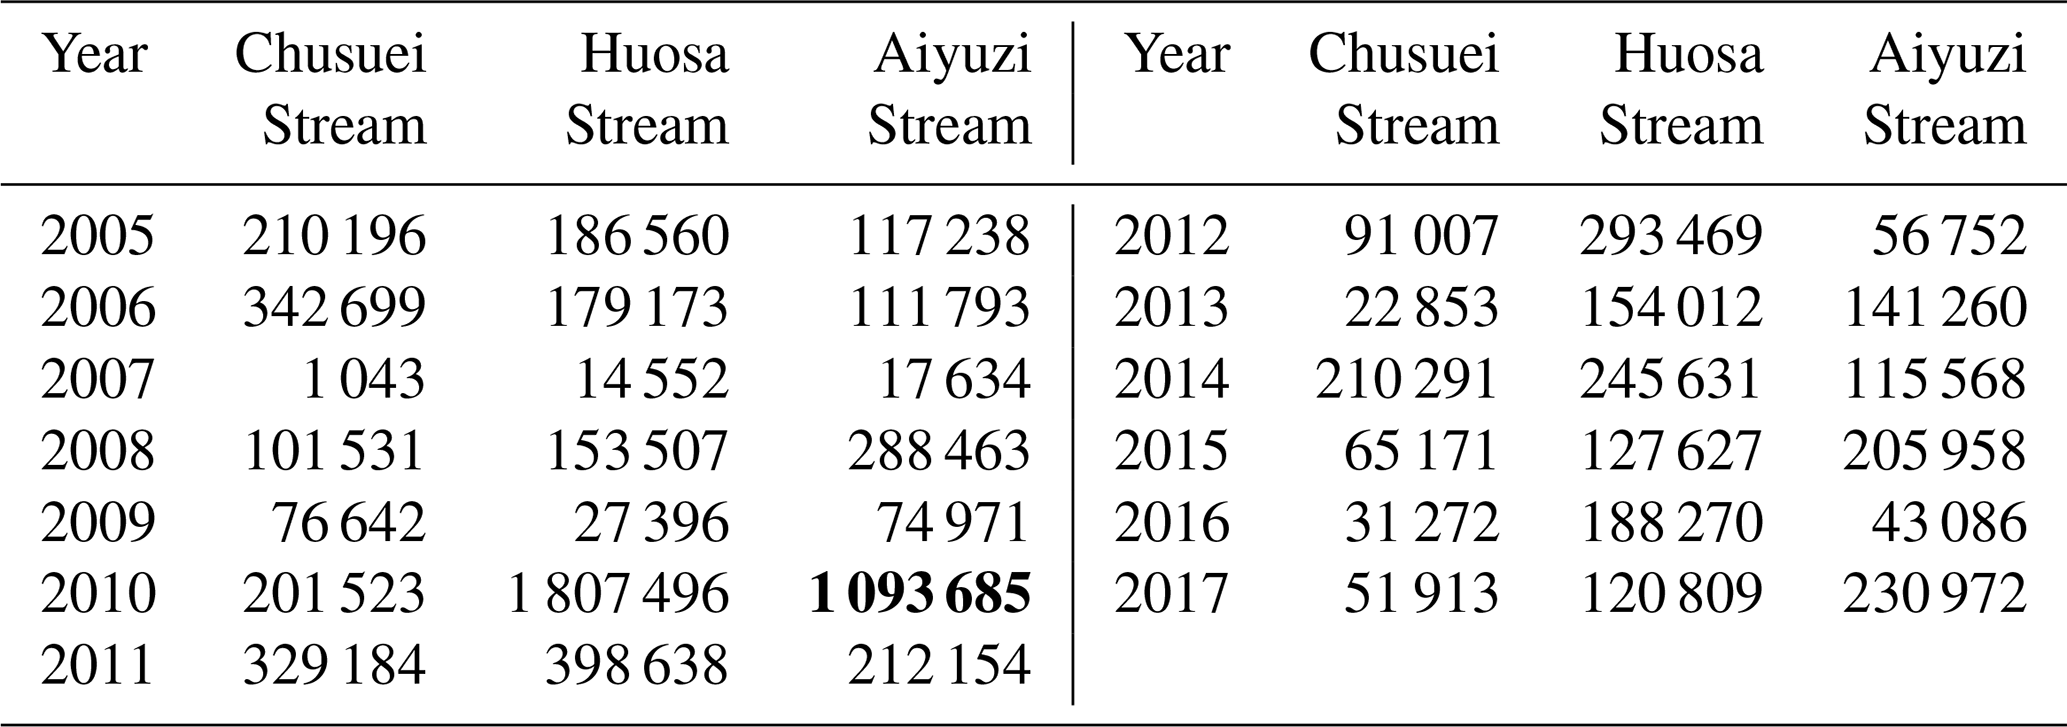
The main cause of the frequent debris flows in Shenmu was from the abundant debris source because of the landslides. The landslide increments in Fig. 4 and Table 3 were estimated based on satellite image processing. When considering the landslide areas in the mid- to upstream sections, it is noticeable that the variation in landslide increments was quite different before and after 2009. In August 2009, Typhoon Morakot caused severe landslides in the study areas, and Fig. 3 shows the abrupt jump of landslide increments in 2010. The incremental ratio of landslides at the Aiyuzi Stream was higher than that at the other two streams. Given the conditions of a smaller catchment area and higher landslide increment ratio and because of its abundant debris source in the upstream sections, debris flows were expected to be likely to occur in the Aiyuzi Stream. The number of post-2009 debris-flow events confirmed the inference about the frequent debris flows in the Aiyuzi Stream.
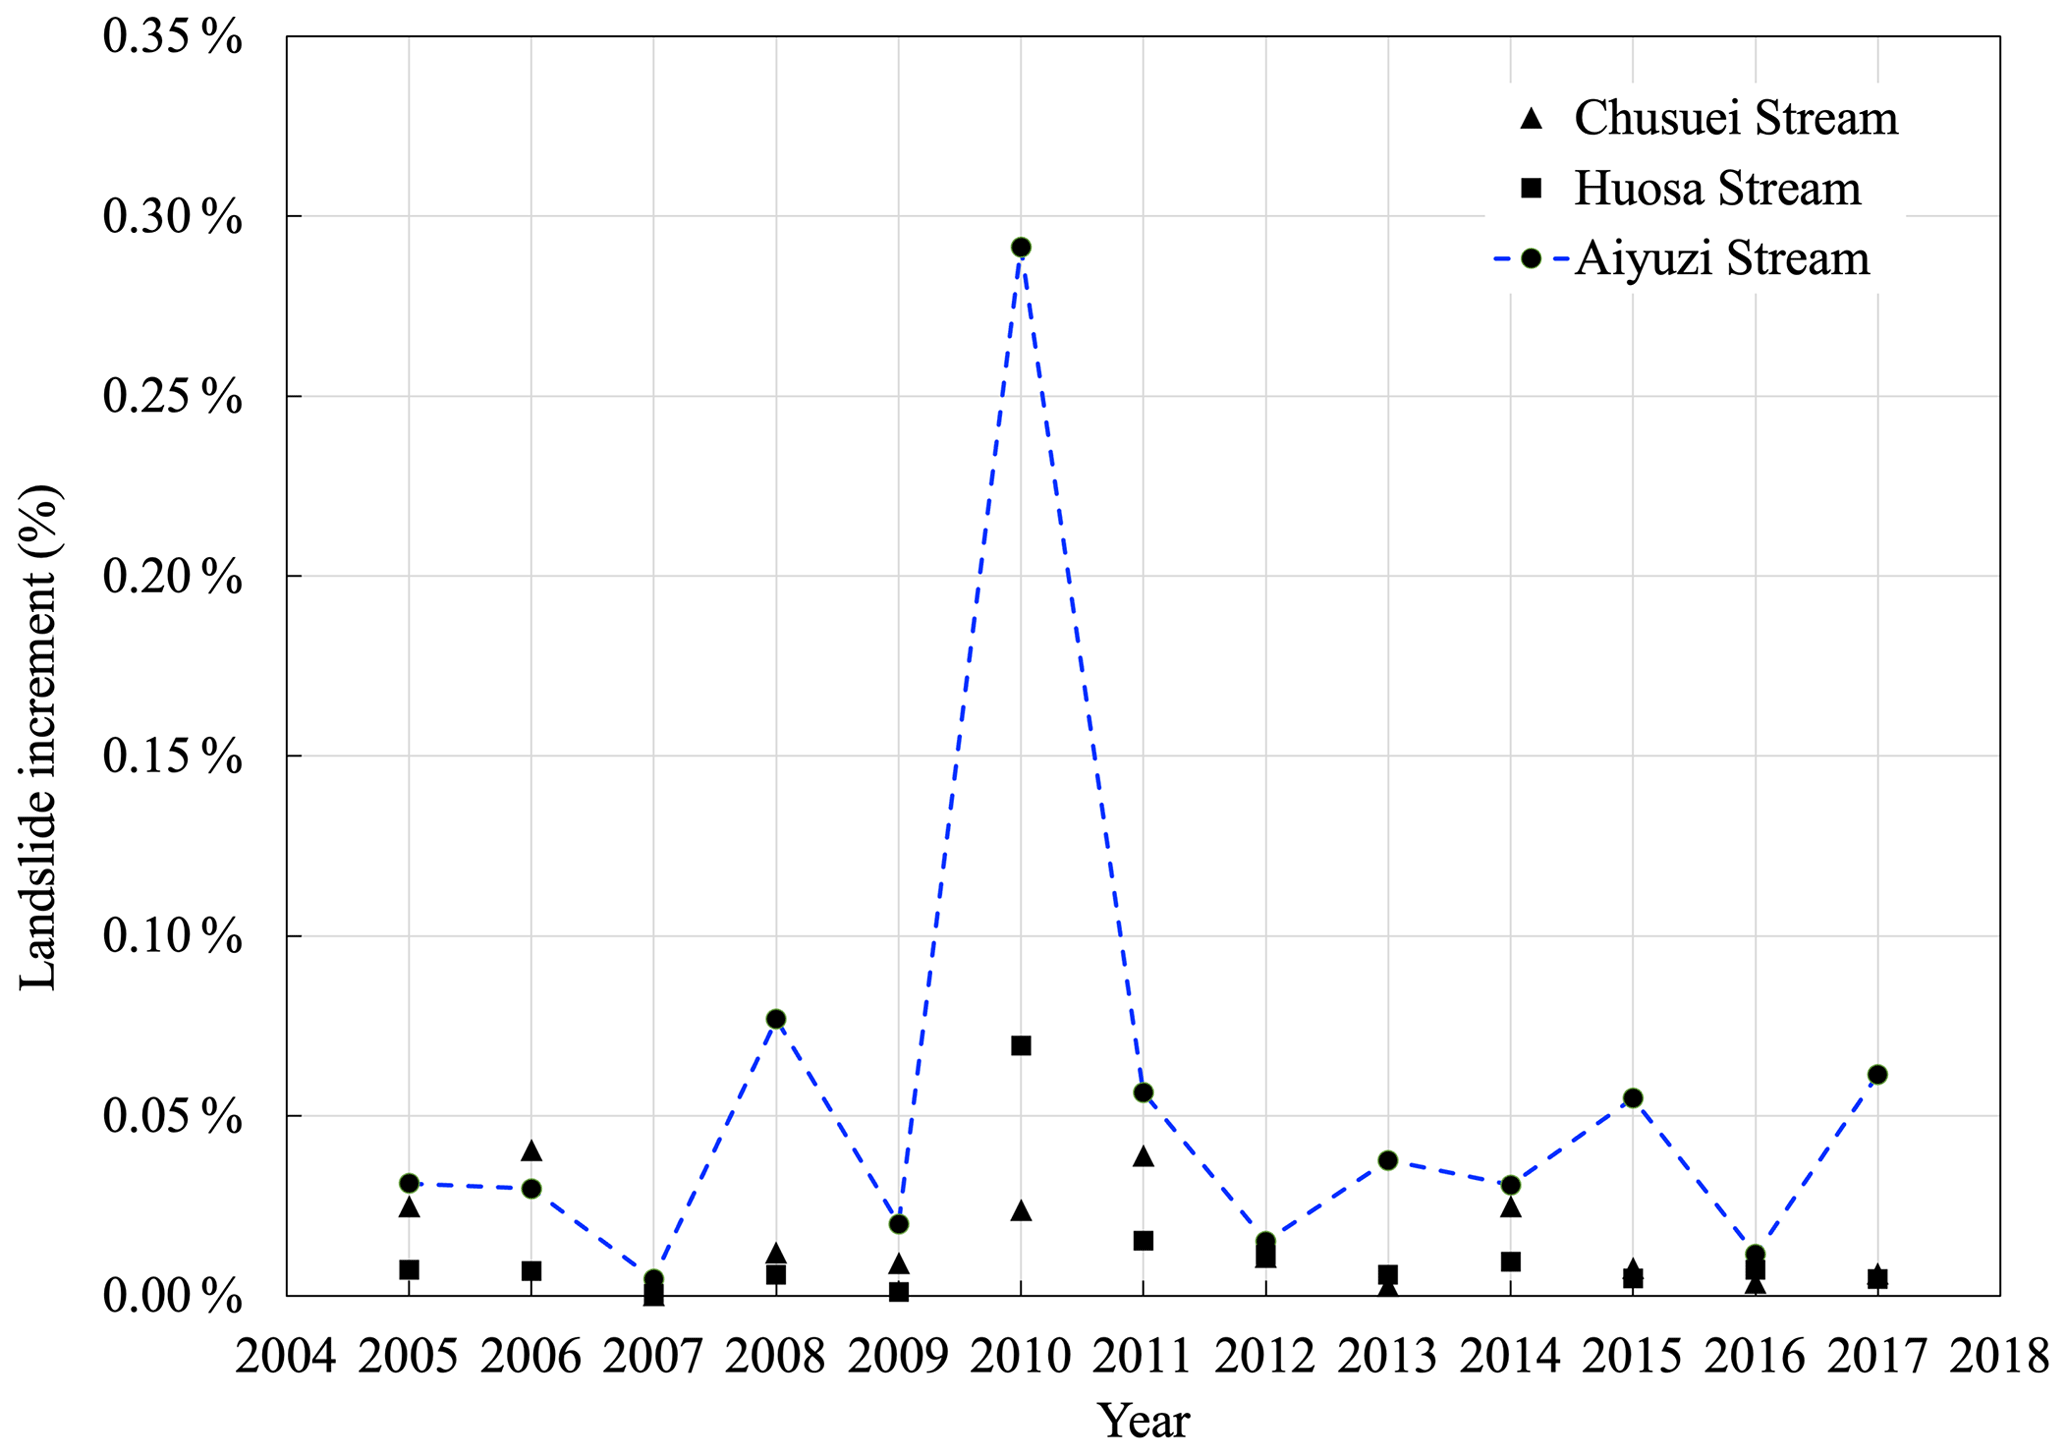
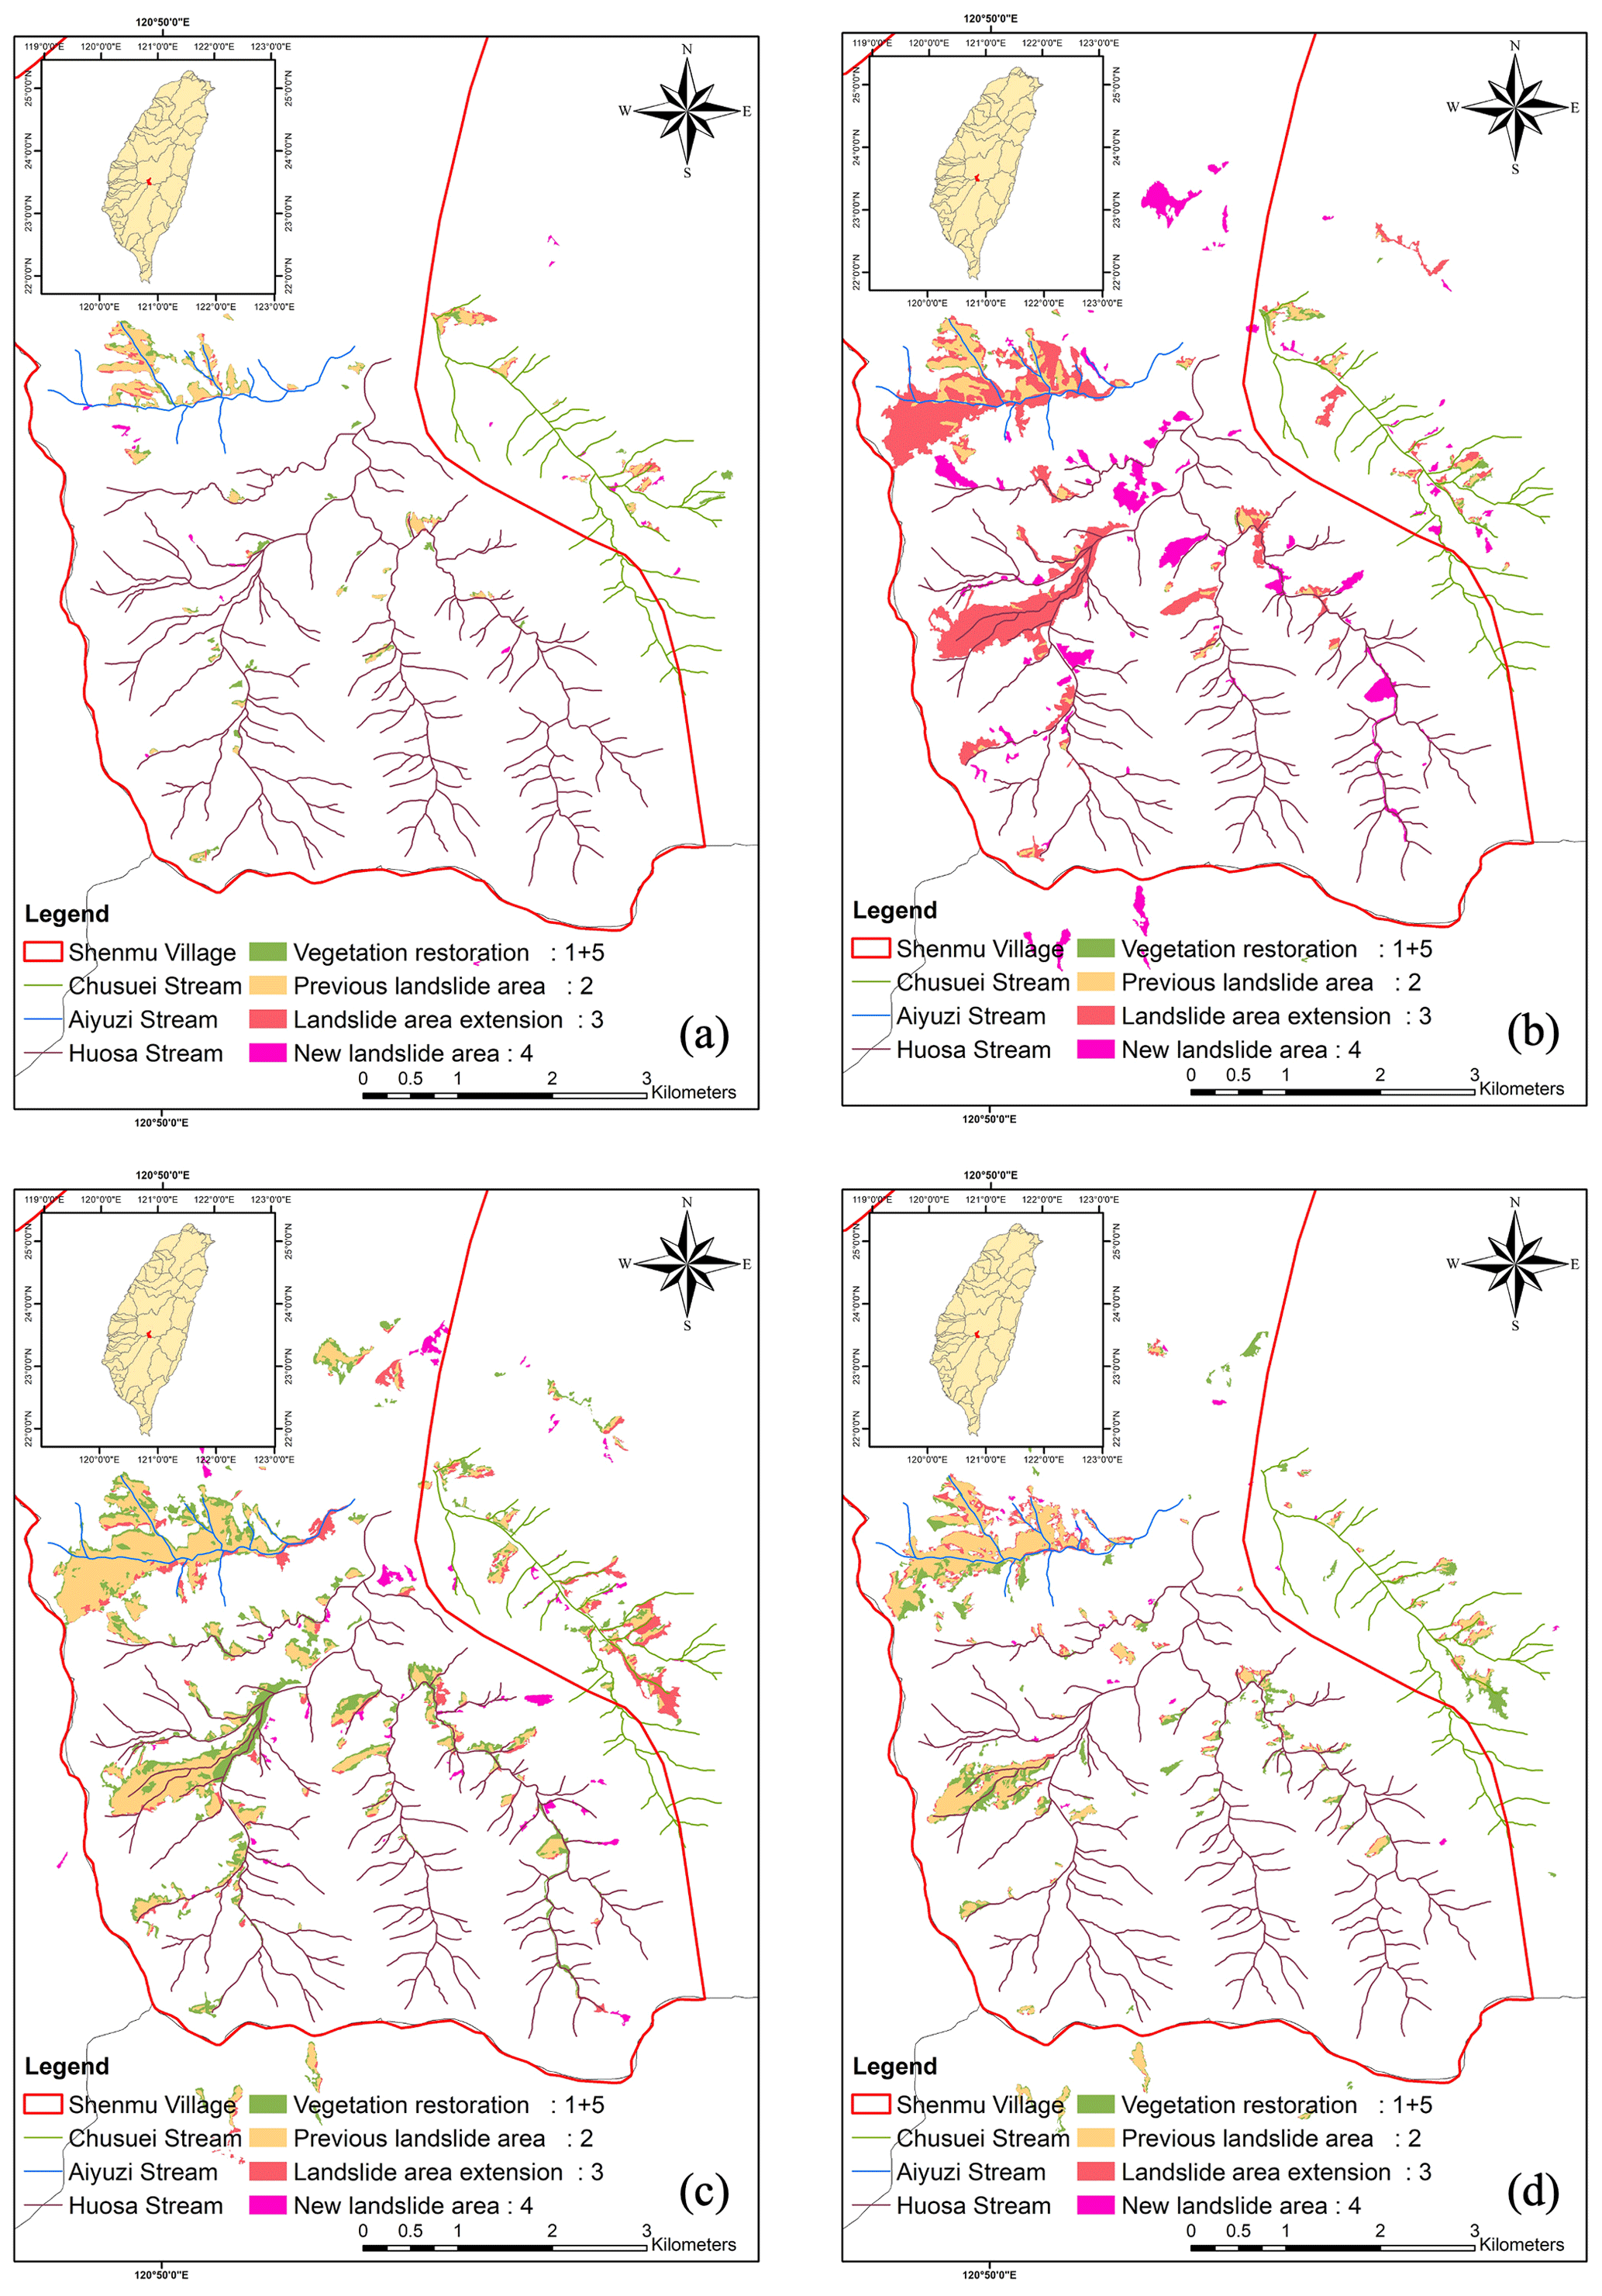
Figure 4The landslide increments of (a) 2009, (b) 2010, (c) 2011, and (d) 2017.
As stated above, from 1999 to 2009, the environment of the study area tended to reach a balance after the Chi-Chi Earthquake in central Taiwan. The landslide increment eased during this period. After 2009, the environmental conditions significantly changed due to Typhoon Morakot in 2009. More landslide areas resulted in debris flows every year during 2009 to 2014. Currently, the Shenmu area is still under the threat of debris flows during typhoons and heavy rainfalls.
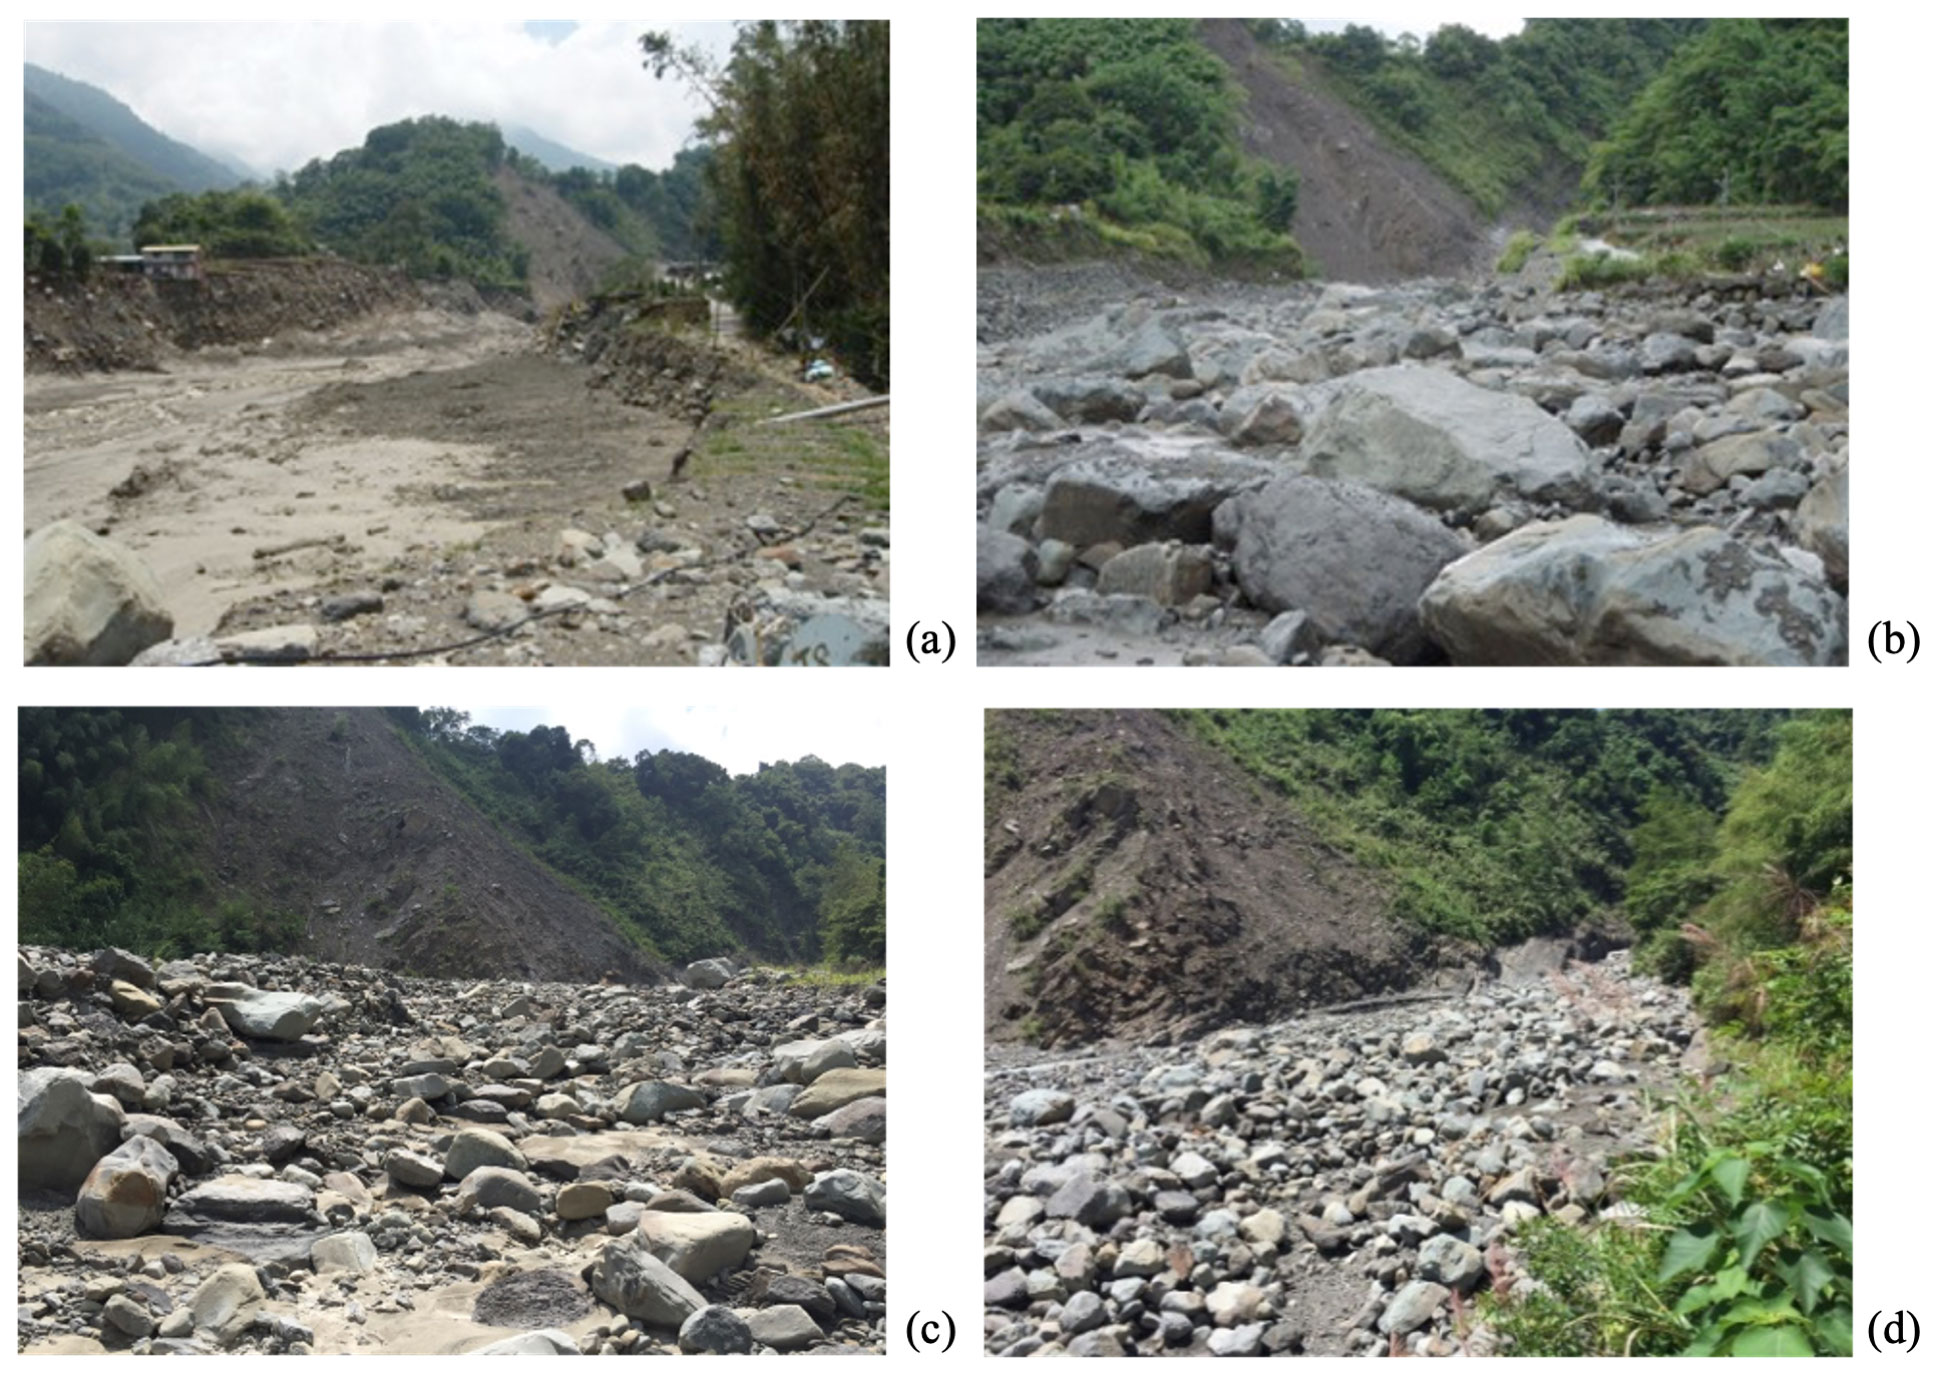
Figure 5Photos of the site near the mouth of the Aiyuzi Stream on (a) 12 August 2009, (b) 19 July 2011, (c) 26 September 2015, and (d) 9 June 2017 (photo credits: GIS Research Center, Feng Chia University, Taiwan).
According to the available satellite images from 2009 and 2014 to 2017, the mid- and downstream section widths of the three streams changed marginally (Table 4). The widest downstream channel is in the Huosa Stream, about 121 m, and the width of the Heshe Stream, the stream of confluence, has been about 132 m since 2009. It is noted that the debris flows did not change the stream channel width too much, but abundant sediment and debris accumulated during and after the debris flows (Fig. 5).
Table 4The channel width (m) of mid- to downstream.
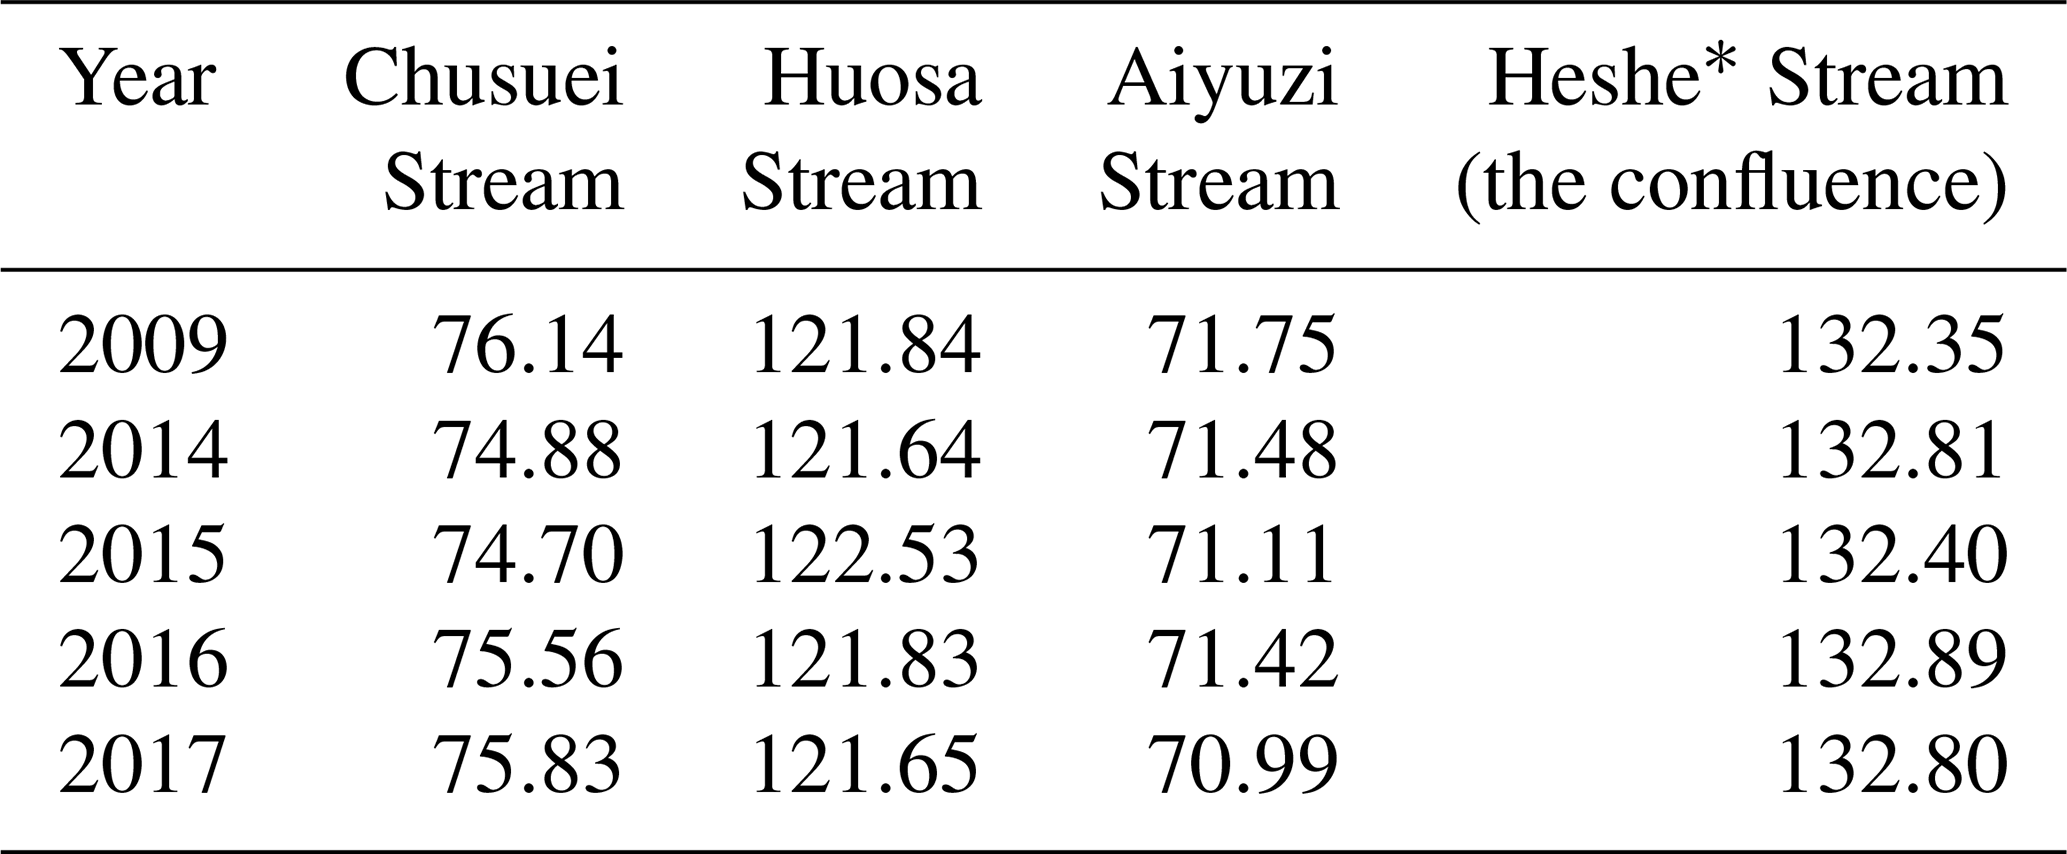
∗ The channel width (m) measured at about 200 m downstream of the confluence of the three potential debris-flow torrents.
3.1 Rainfall thresholds – RTI
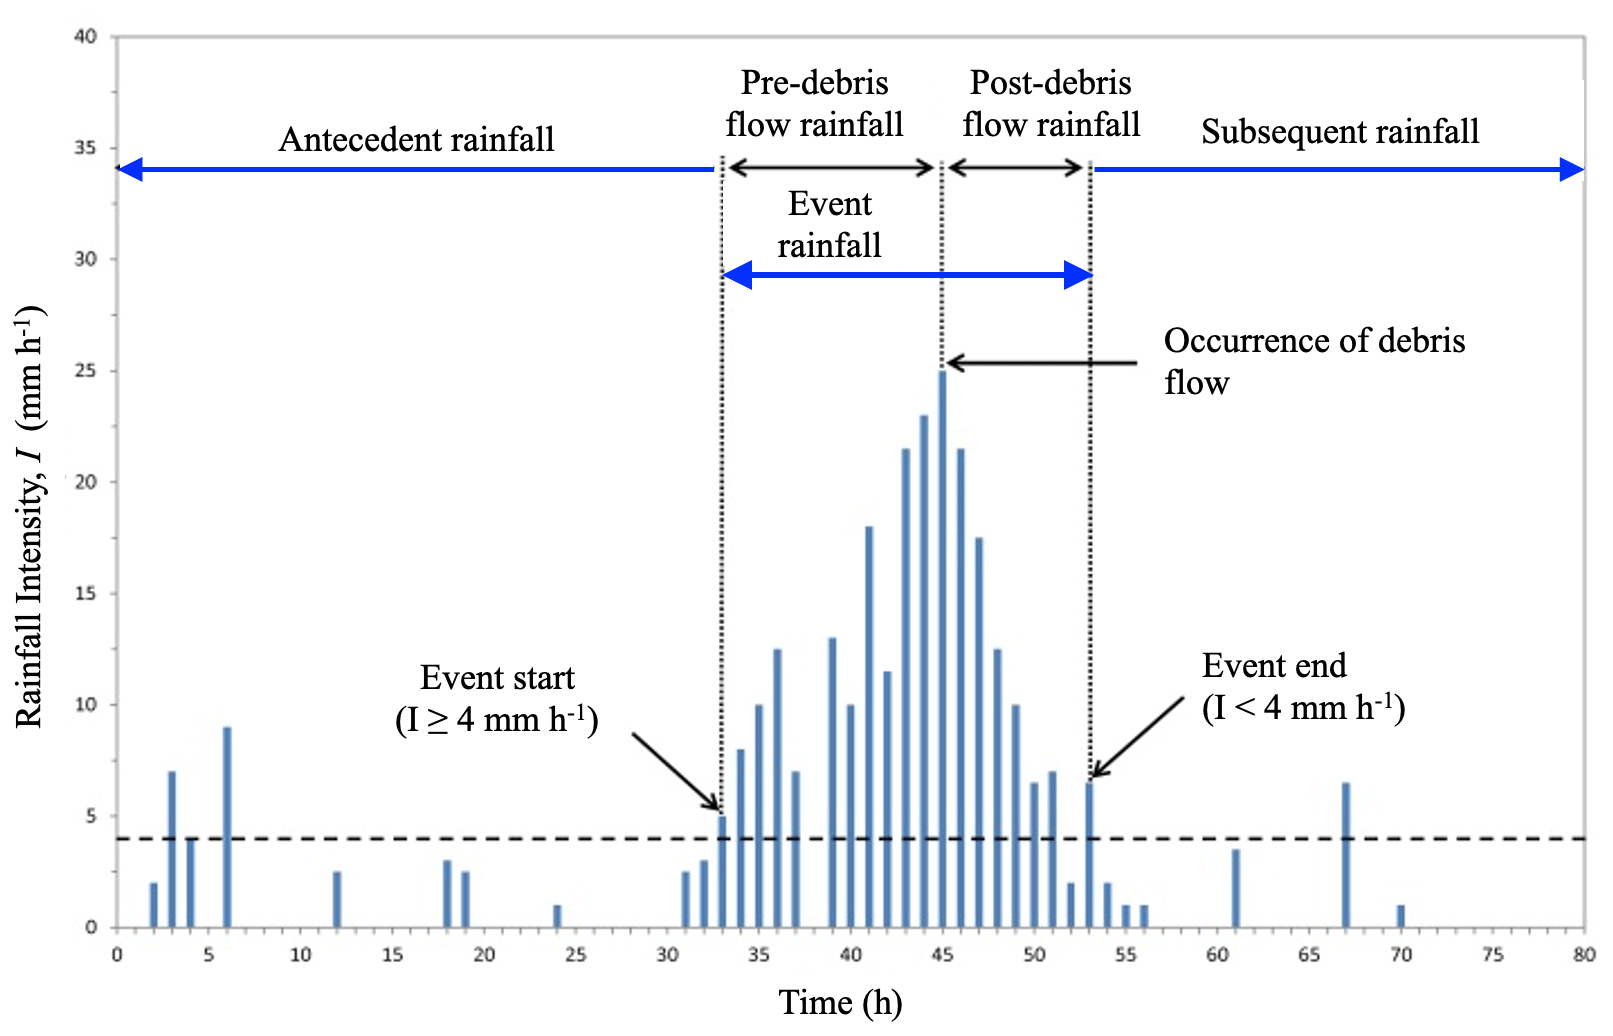
The current rainfall warning threshold of the Shenmu area was developed by Jan and Lee (2004), and an index, the rainfall-triggering index (RTI), which is the product of hourly rainfall (I) and effective accumulated rainfall (Rt), was used to determine the rainfall level of debris-flow warning. For a given rainfall event, the value Rt reflects the influence of antecedent rains of a 7 d period and is calculated following Eq. (1). Figure 6 illustrates the definitions of a rainfall event. Equation (1) shows the expression of Rt, where R0 is the current daily rainfall of an event, Ri is the daily rainfall of the previous ith day before the current event, and α is the weighting factor applied to antecedent daily rainfall. The weighting factor changed normally between 0.5 and 0.8 based on the rainfall patterns, and α of 0.7 is applied to the current debris-flow early warning in Taiwan.
The value of Rt is divided into nine levels, from 200 to 600 mm with intervals of 50 mm, to represent the rainfall thresholds at different locations. Based on the debris-flow case history, the rainfall threshold of the study area was 250 mm during 2000 to 2020 and has been 300 mm since 2021 due to the decreasing occurrence frequency of debris flows in the area.
3.2 Rainfall thresholds – Imax, R24, Rt
According to Huang et al. (2013), the case history of debris flows and heavy rainfalls in the Shenmu area implies rainfall thresholds of a maximum hourly rainfall (Imax) of 8 mm and an effective accumulated rainfall (Rt) of 67 mm before 2012. By adding additional and available rainfall data, Table 5 shows the events during 2014 to 2017. In addition to the effective accumulated rainfall, the accumulated rainfall of 24 h (R24) before the occurrence of a debris flow was considered in this study. For those events in which no debris flow occurred, the R24 was estimated by assuming the debris flow would occur at the time of Imax during an event. Figures 7 and 8 show plots of Imax–R24 and Imax–Rt based on the data of Huang et al. (2013) and this study. The plots show slightly different rainfall thresholds of Imax of 9 mm and Rt of 67.8 mm, as well as R24 of 23 mm as another rainfall threshold. The number of cases of Imax ≥ 9 mm and R24 ≥ 23 mm and of Imax ≥ 9 mm and Rt ≥ 67.8 mm are 33 and 32, respectively, from the collected data. Among them, there are 10 debris flows, implying that the case percentage of debris flows is 30.3 % and 31.3 %, respectively. Other sets of rainfall thresholds are proposed as Imax ≥ 16.5 mm and R24 ≥ 51.5 mm and as Imax ≥ 16.5 mm and Rt ≥ 75.2 mm, which result in the debris-flow case percentages of 40.0 % and 38.1 %, respectively. The abovementioned approach represents the debris-flow warning margins of rainfall in terms of Imax, R24, and Rt, as shown in the plots (the dashed orange and red lines). These numbers may be not high enough to be used for practical prediction of debris-flow occurrence. However, based on the case history, these rainfall thresholds (Imax and Rt), as well as the RTI threshold of 300 mm, are considered reasonable as checkpoints for debris-flow disaster monitoring in the Shenmu area.
Table 5Case history of rainfalls and typhoons in the Shenmu area from 2014 to 2017.
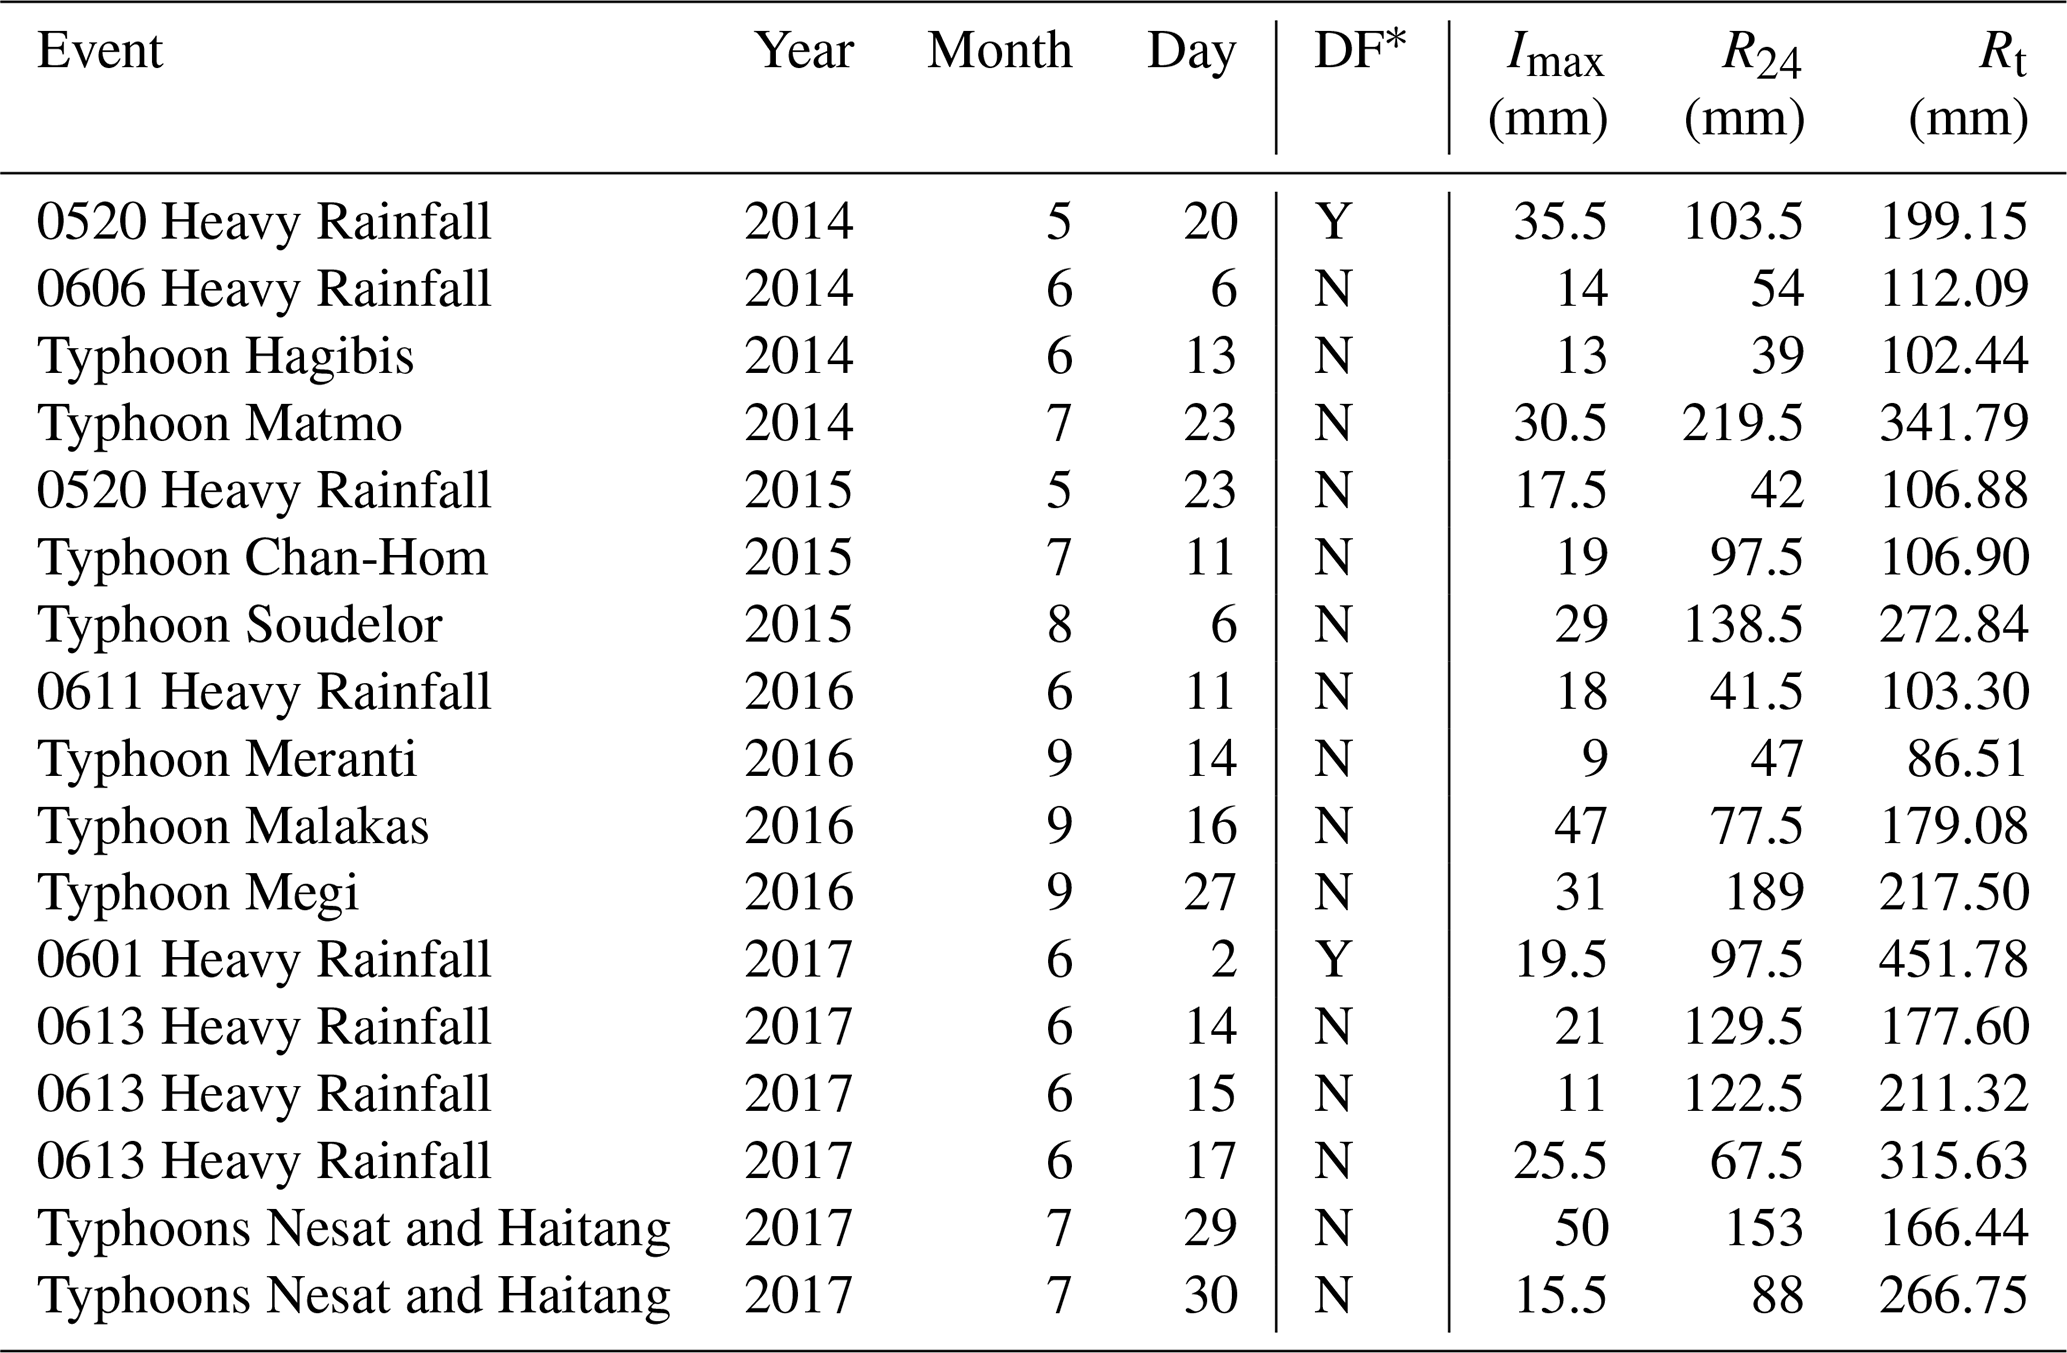
∗ DF: debris flow; Y: yes; N: no.
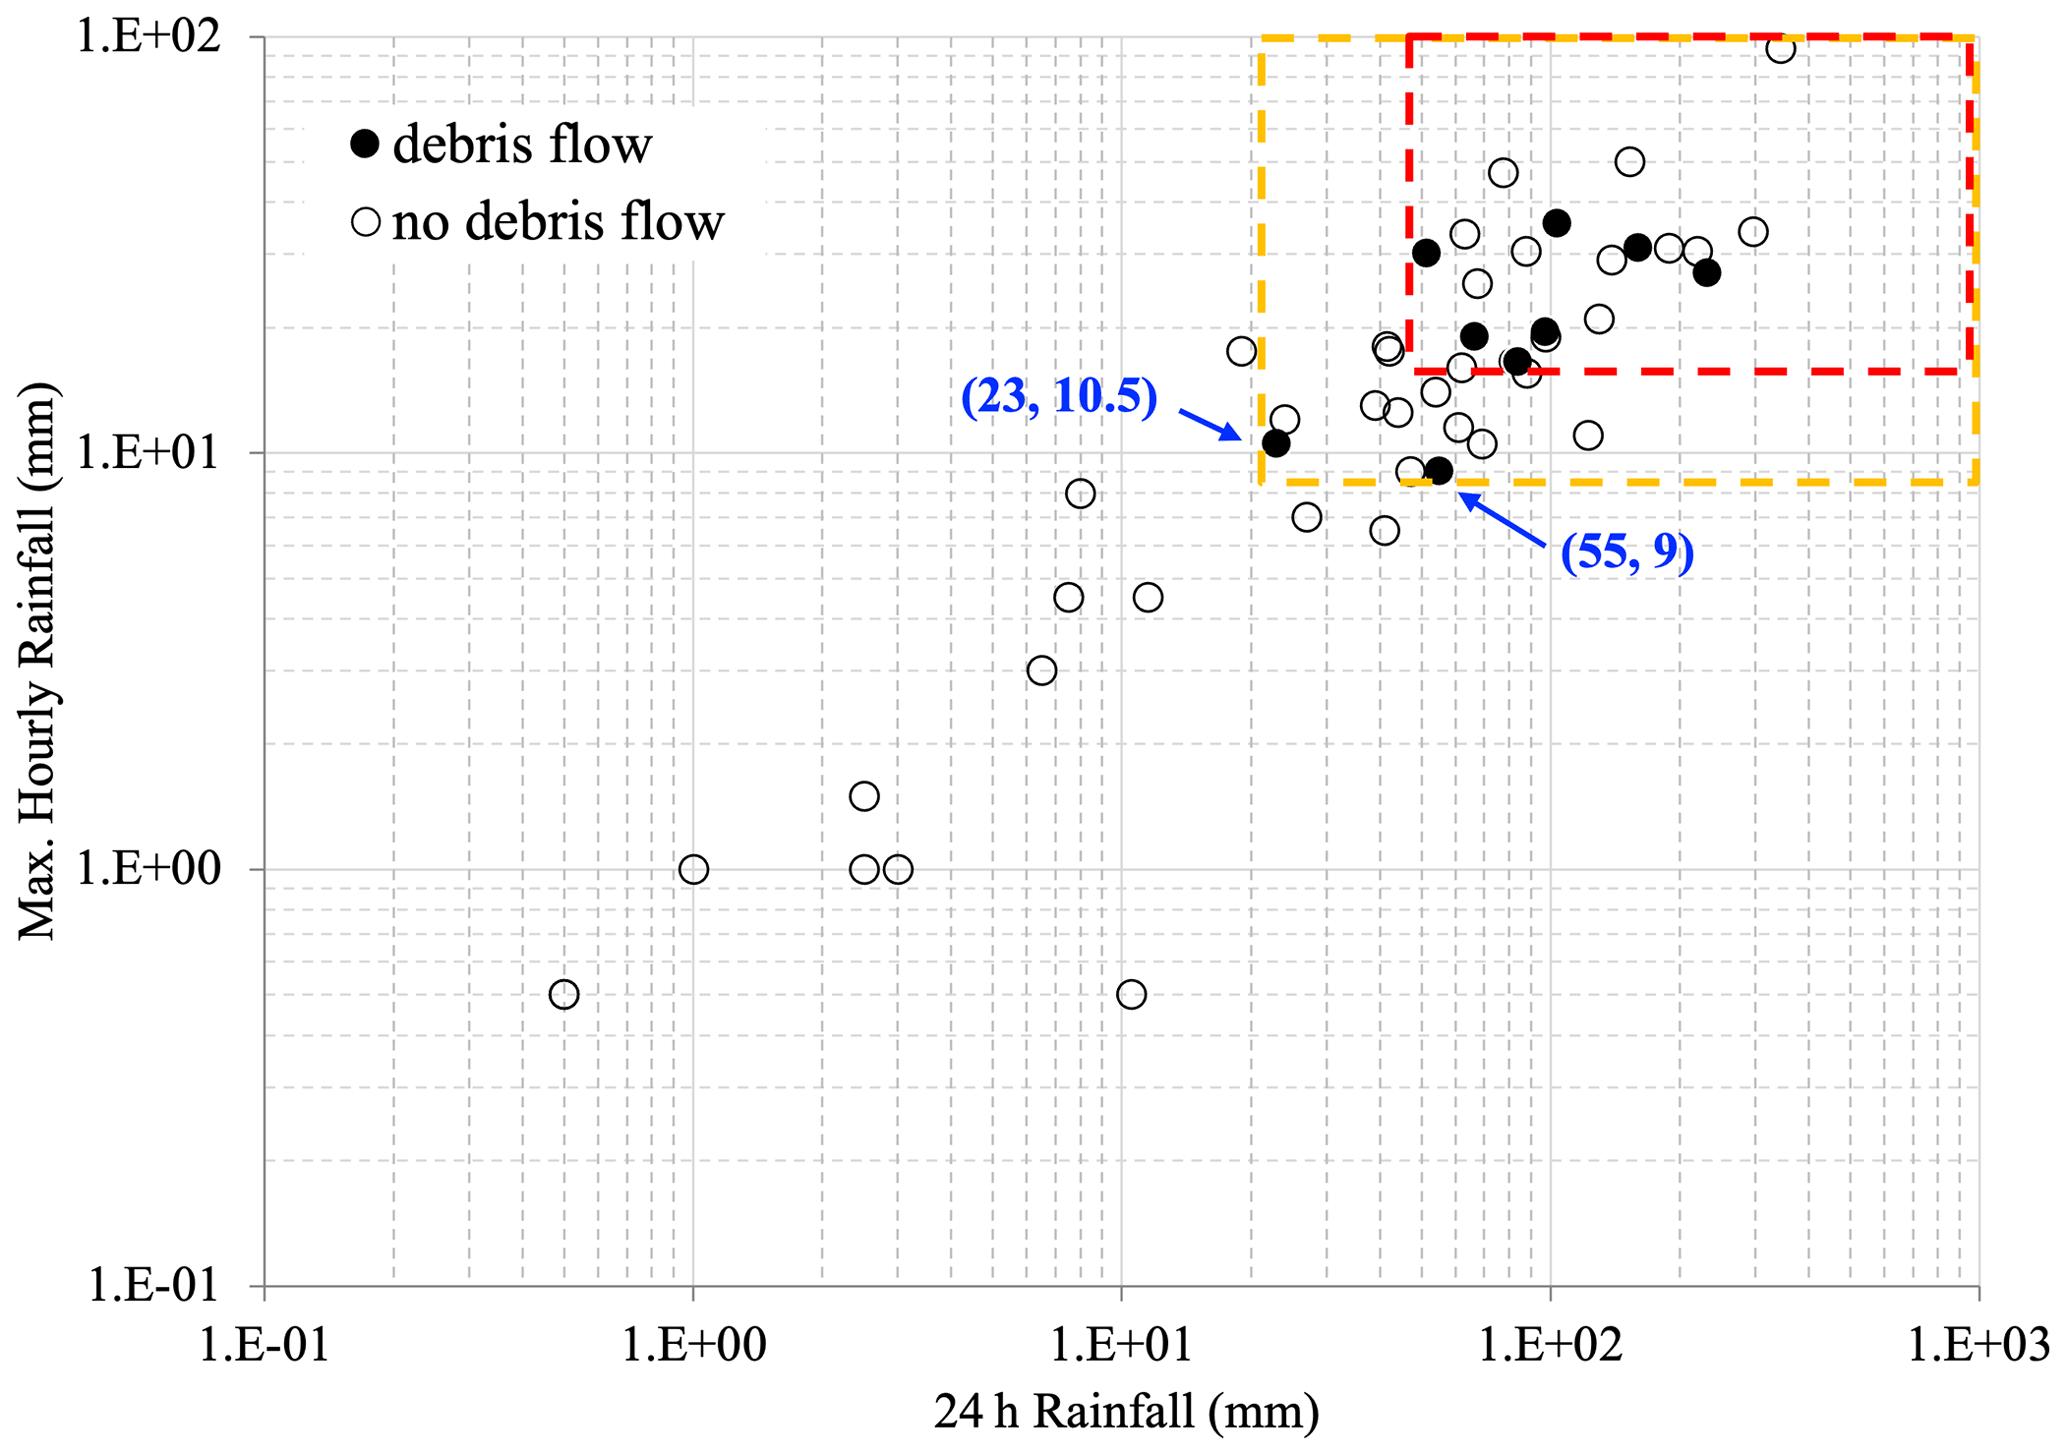
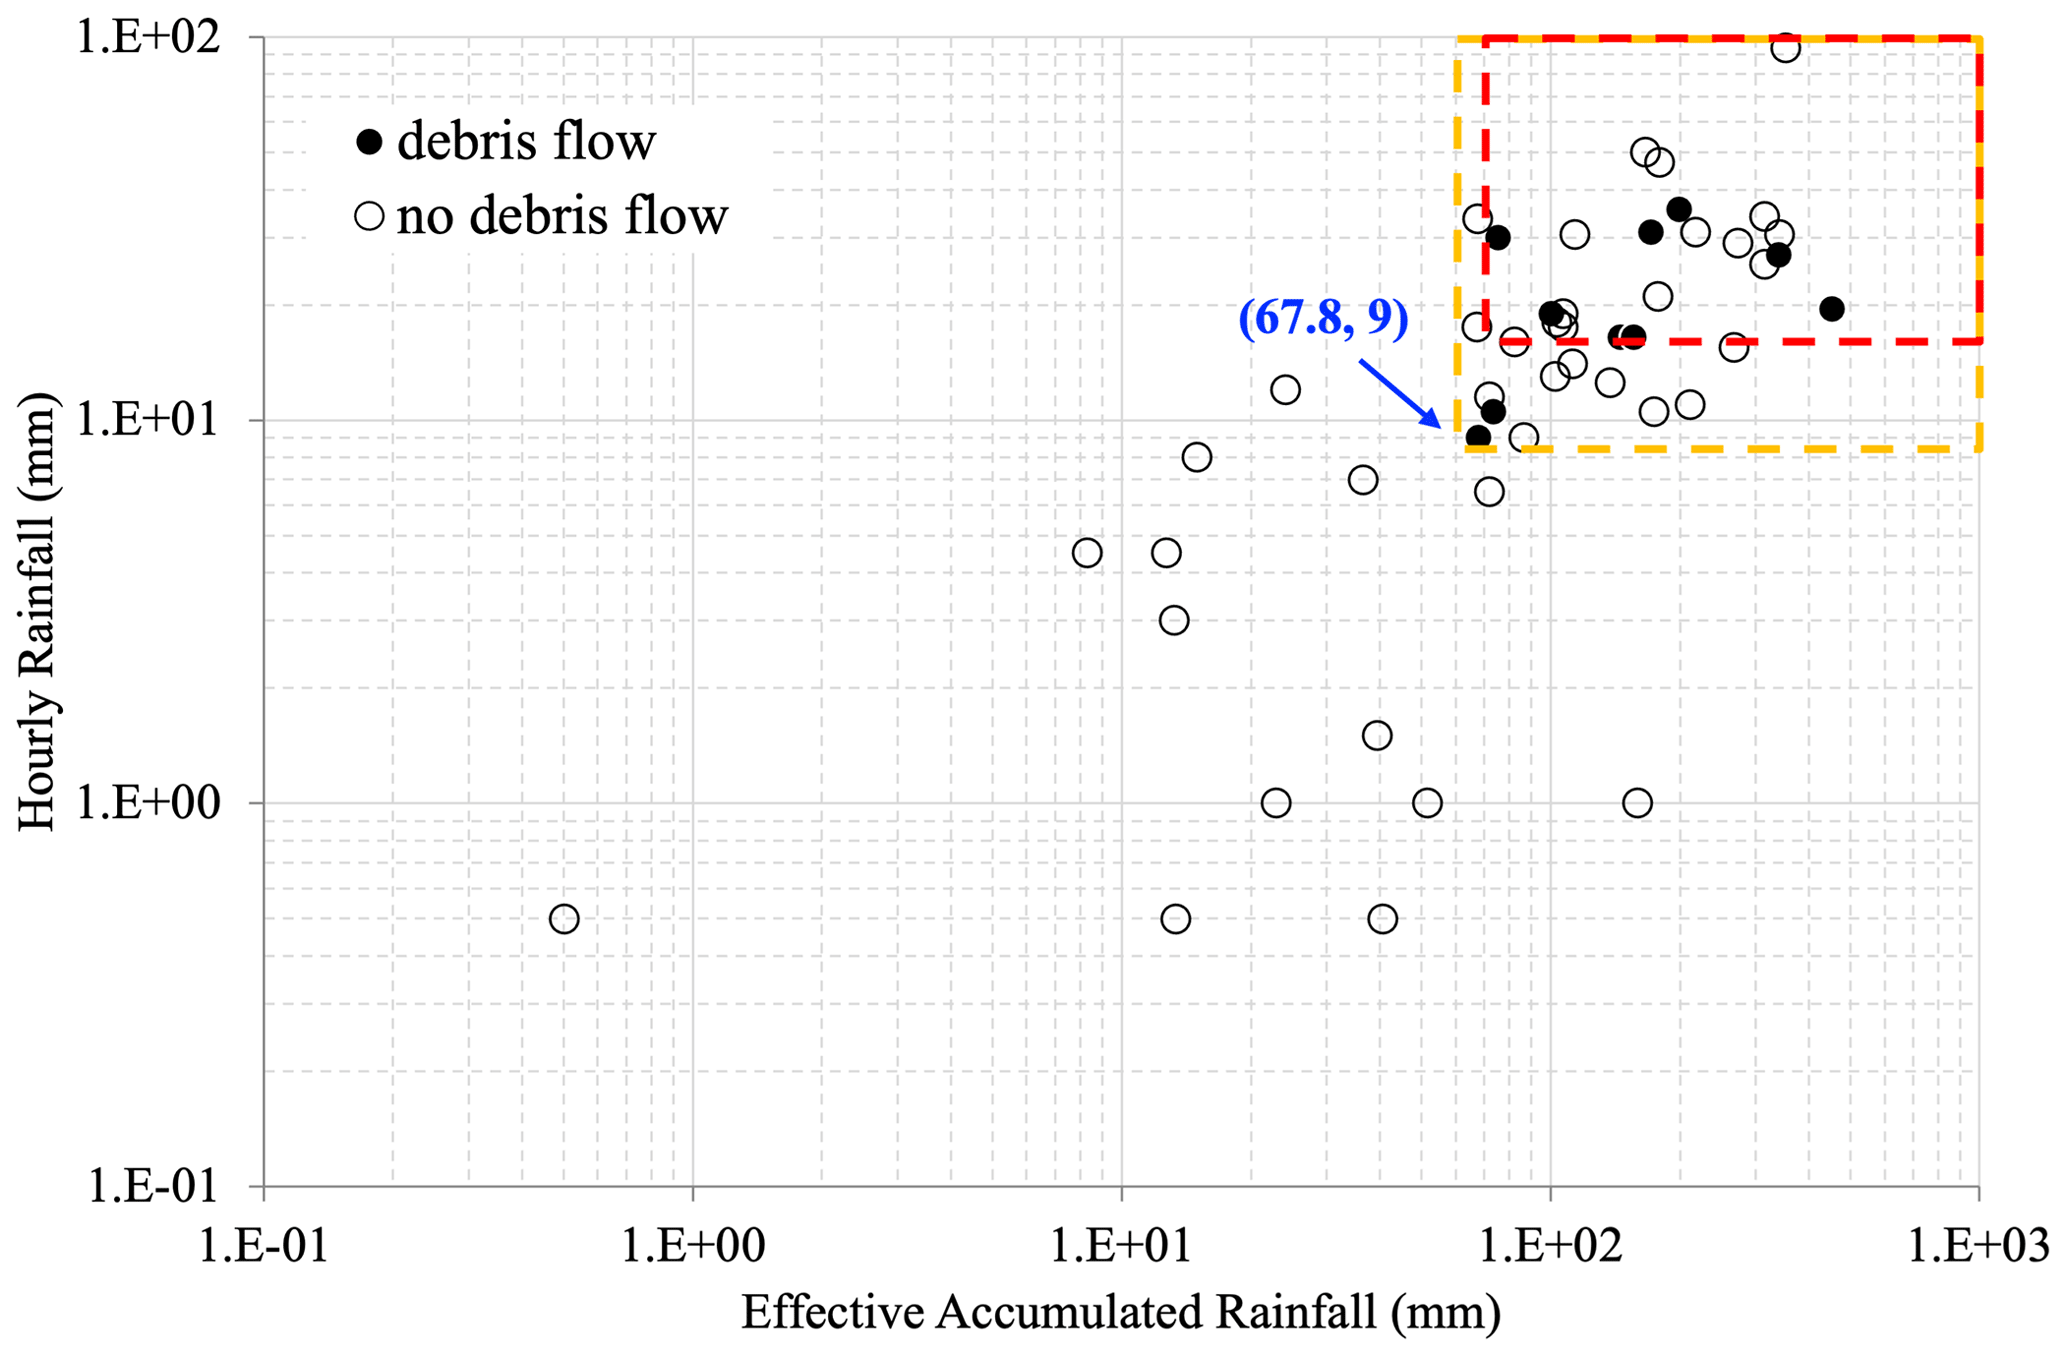
Figure 8The max hourly rainfall and effective accumulated rainfall of events in the Shenmu area.
3.3 Rainfall thresholds – the I–D curve
In addition to the rainfall thresholds of the RTI factor, the statistics of rainfall data obtained about the occurrence of debris flows show an additional characteristic relation of rainfall intensity (I) and duration (D). The records of rainfall data were collected from the rain gauges installed near and at the site of debris-flow monitoring. The I–D relation has been studied and is considered the basis of defining rainfall thresholds for debris flows. Early research reveals potential I–D curves from global event data (Caine, 1980; Guzzetti et al., 2008). The I–D data of debris-flow events in the Shenmu area are listed in Table 2, and the I–D curves are illustrated in the following Figs. 9 to 11.
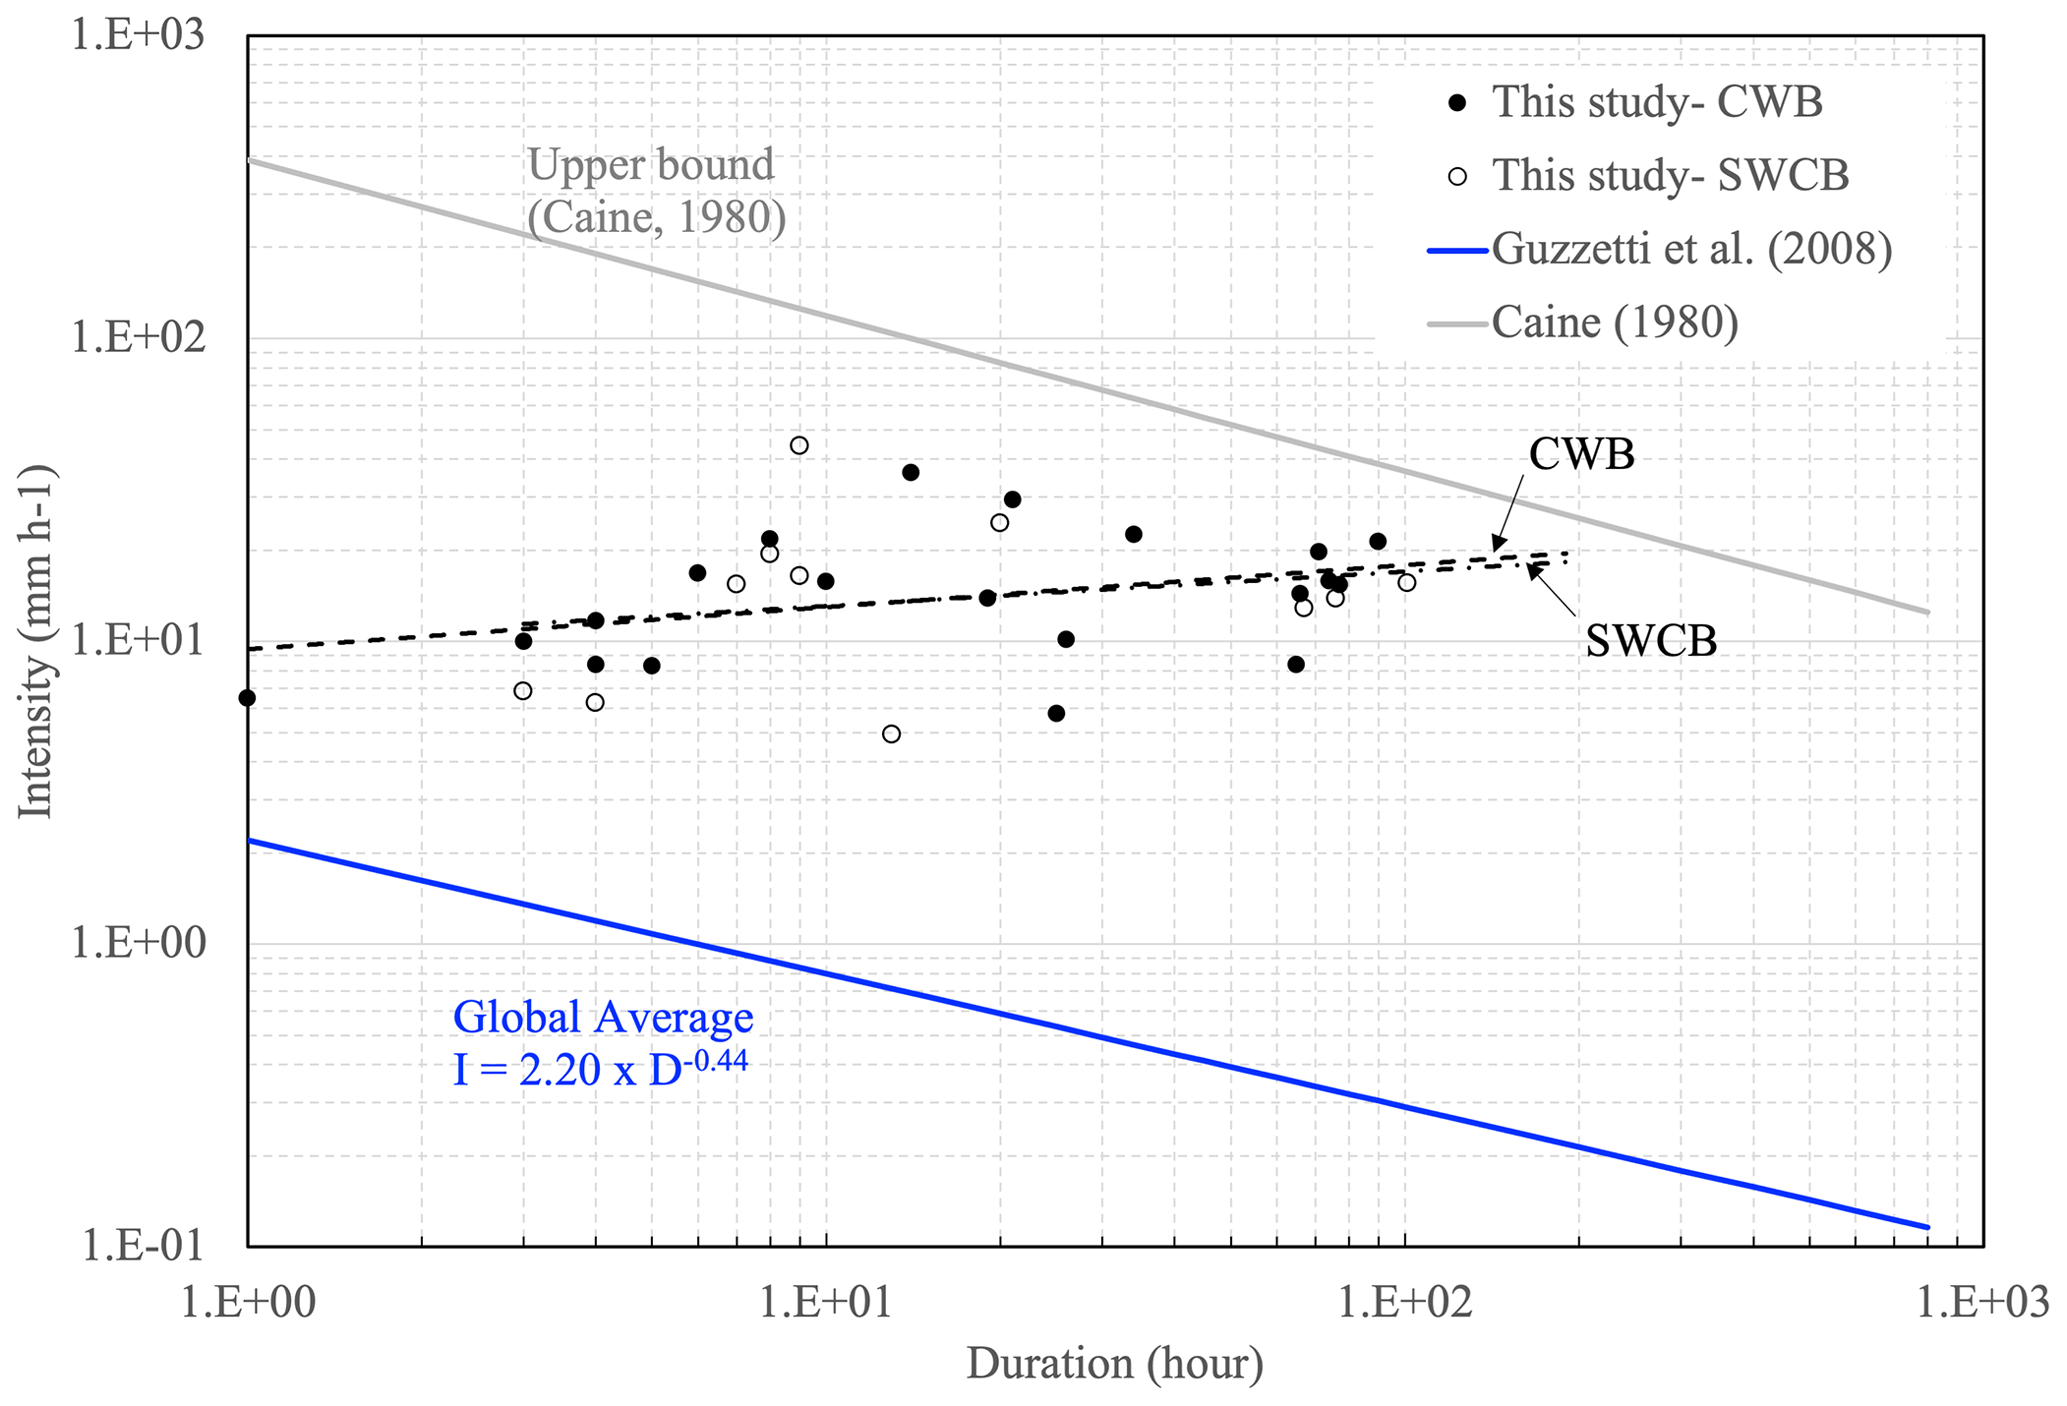
Figure 9 shows the intensity–duration plots of debris flows in Shenmu. The I–D data in this figure were estimated using the whole duration of each event and were obtained from the Shenmu rainfall station of the Central Weather Bureau (CWB) and the Shenmu debris-flow monitoring station of the Soil and Water Conservation Bureau (SWCB). The regression trends of data from both stations are similar with slight differences (dashed line of CWB and dash-dotted line of SWCB in Fig. 9) due to the locations where rainfall was measured. It was also noted that the trends (the slopes of the regression curve) in Fig. 9 are inconsistent with those from previous research (Caine, 1980; Guzzetti et al., 2008). All the I–D data of Shenmu fall above the global minimum rainfall I–D threshold (the blue line in the figure).
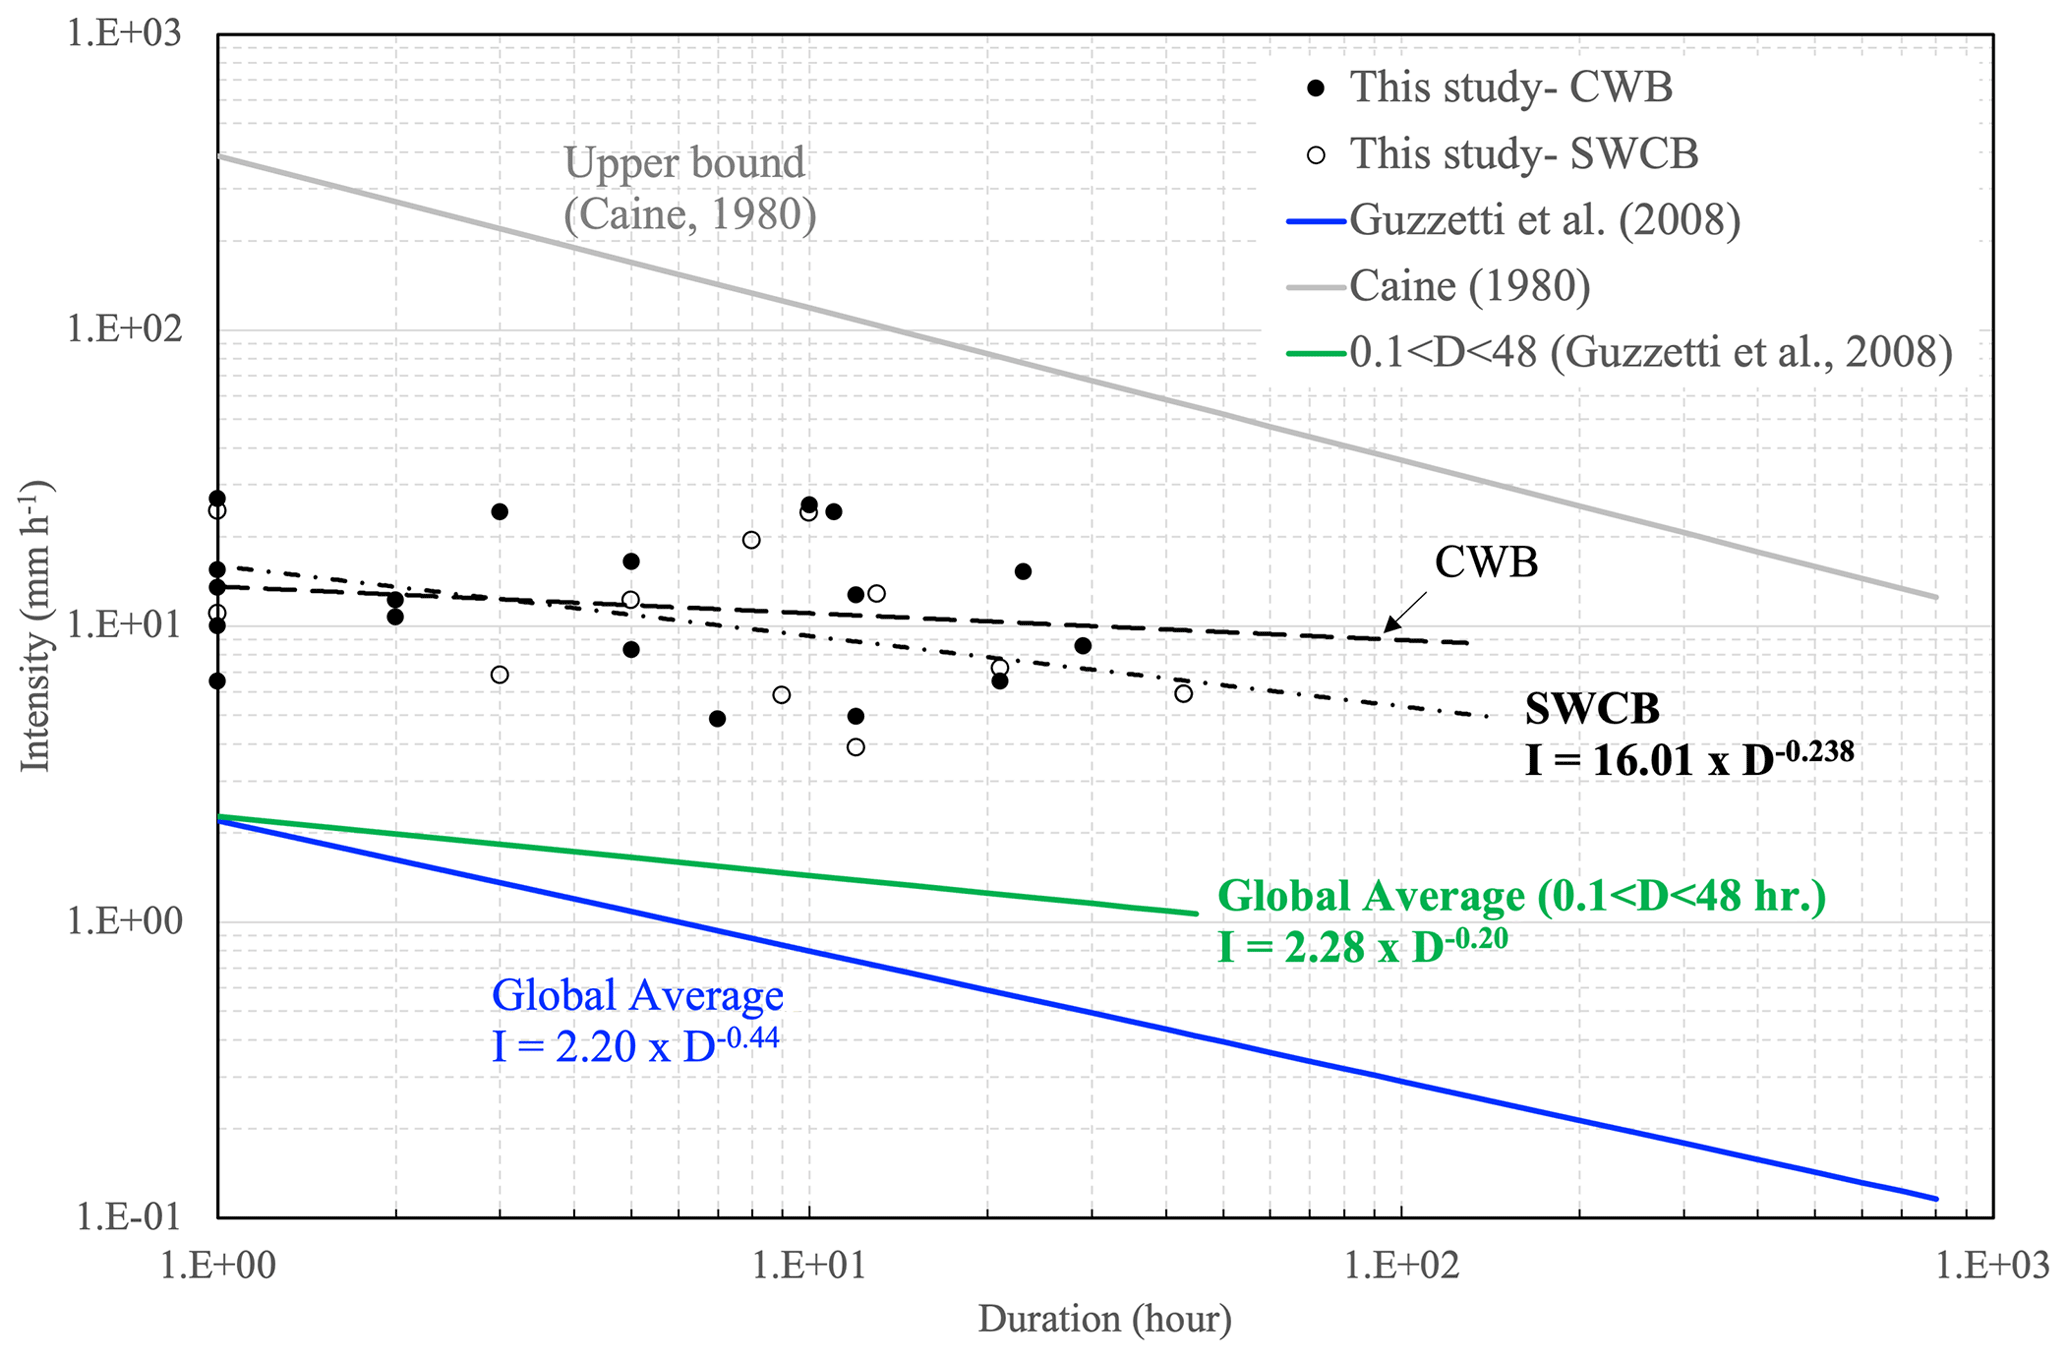
Figure 10 shows the I–D plots estimated during the period from the event start to 1 h before the occurrence of debris flows. It was noted that the trends of Fig. 10 are quite different to those in Fig. 9 and are considerably consistent with those from previous research. Most of the data in Fig. 10 are within a 48 h duration. The trend line of SWCB in Fig. 10 is highly consistent with the one (green line) of a 48 h duration from the literature (Guzzetti et al., 2008), with similar slopes. The results from Fig. 10 imply that the duration hours used for estimating the rainfall I–D of each event should be counted based on the period from the event start to 1 h before the occurrence of debris flows, rather than counting based on the whole event duration. In addition, the rainfall data from SWCB are more reasonable to analyze, since the rainfall station of SWCB is closer to the locations of debris-flow occurrence than that of CWB.
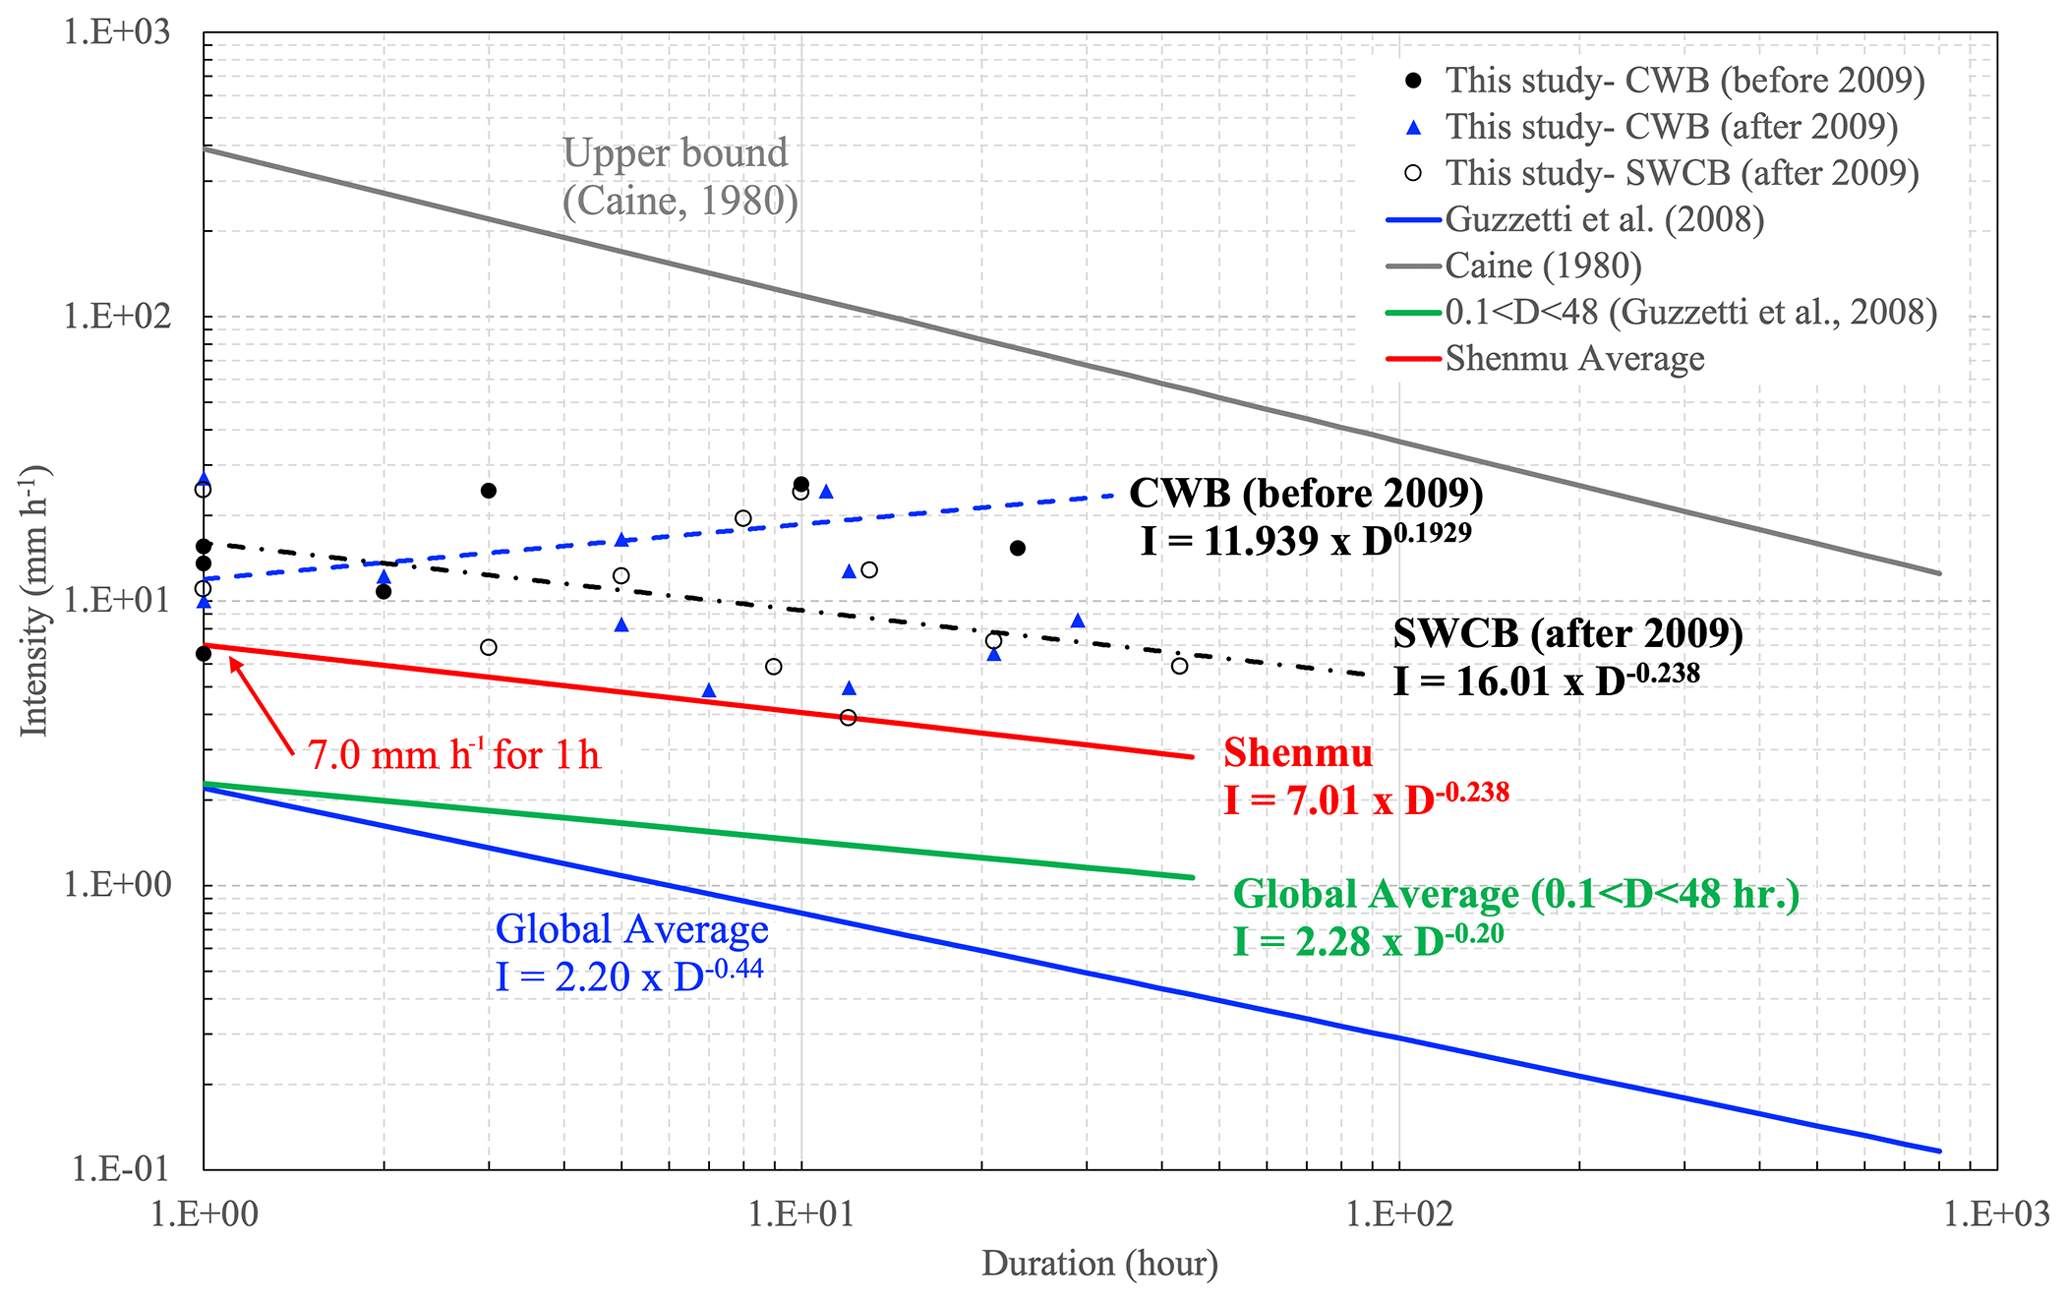
Among the debris-flow events in Shenmu, the catastrophic event of Typhoon Morakot in 2009 caused extremely heavy rainfalls in the mountain areas, resulting in severe landslides, floods, and debris flows. Because of the significant impact of Typhoon Morakot in 2009, the geological conditions and local environment of Shenmu greatly changed. Different trends in the plots of rainfall data obtained before and after 2009 reveal the influence of severe weather, as shown in Fig. 11. Both trends of post-2009 rainfall data show similar slopes to those from the literature. Among these curves, the trend obtained from the rainfall data of the SWCB station is highly consistent with the curve of a 48 h duration from the literature. The post-2009 data regression curve of SWCB (i.e., I = 16.01 × D−0.238) reasonably represents the rainfall I–D of debris flows, with the minimum boundary of the 48 h duration line (I = 7.01 × D−0.238) as reference. The hourly rainfall of 7 mm from Fig. 11 is comparable with the proposed debris-flow rainfall threshold Imax of 9 mm in this study. Both values can be considered the warning triggers and can be used to define the response procedures for debris-flow disaster management in the Shenmu area.
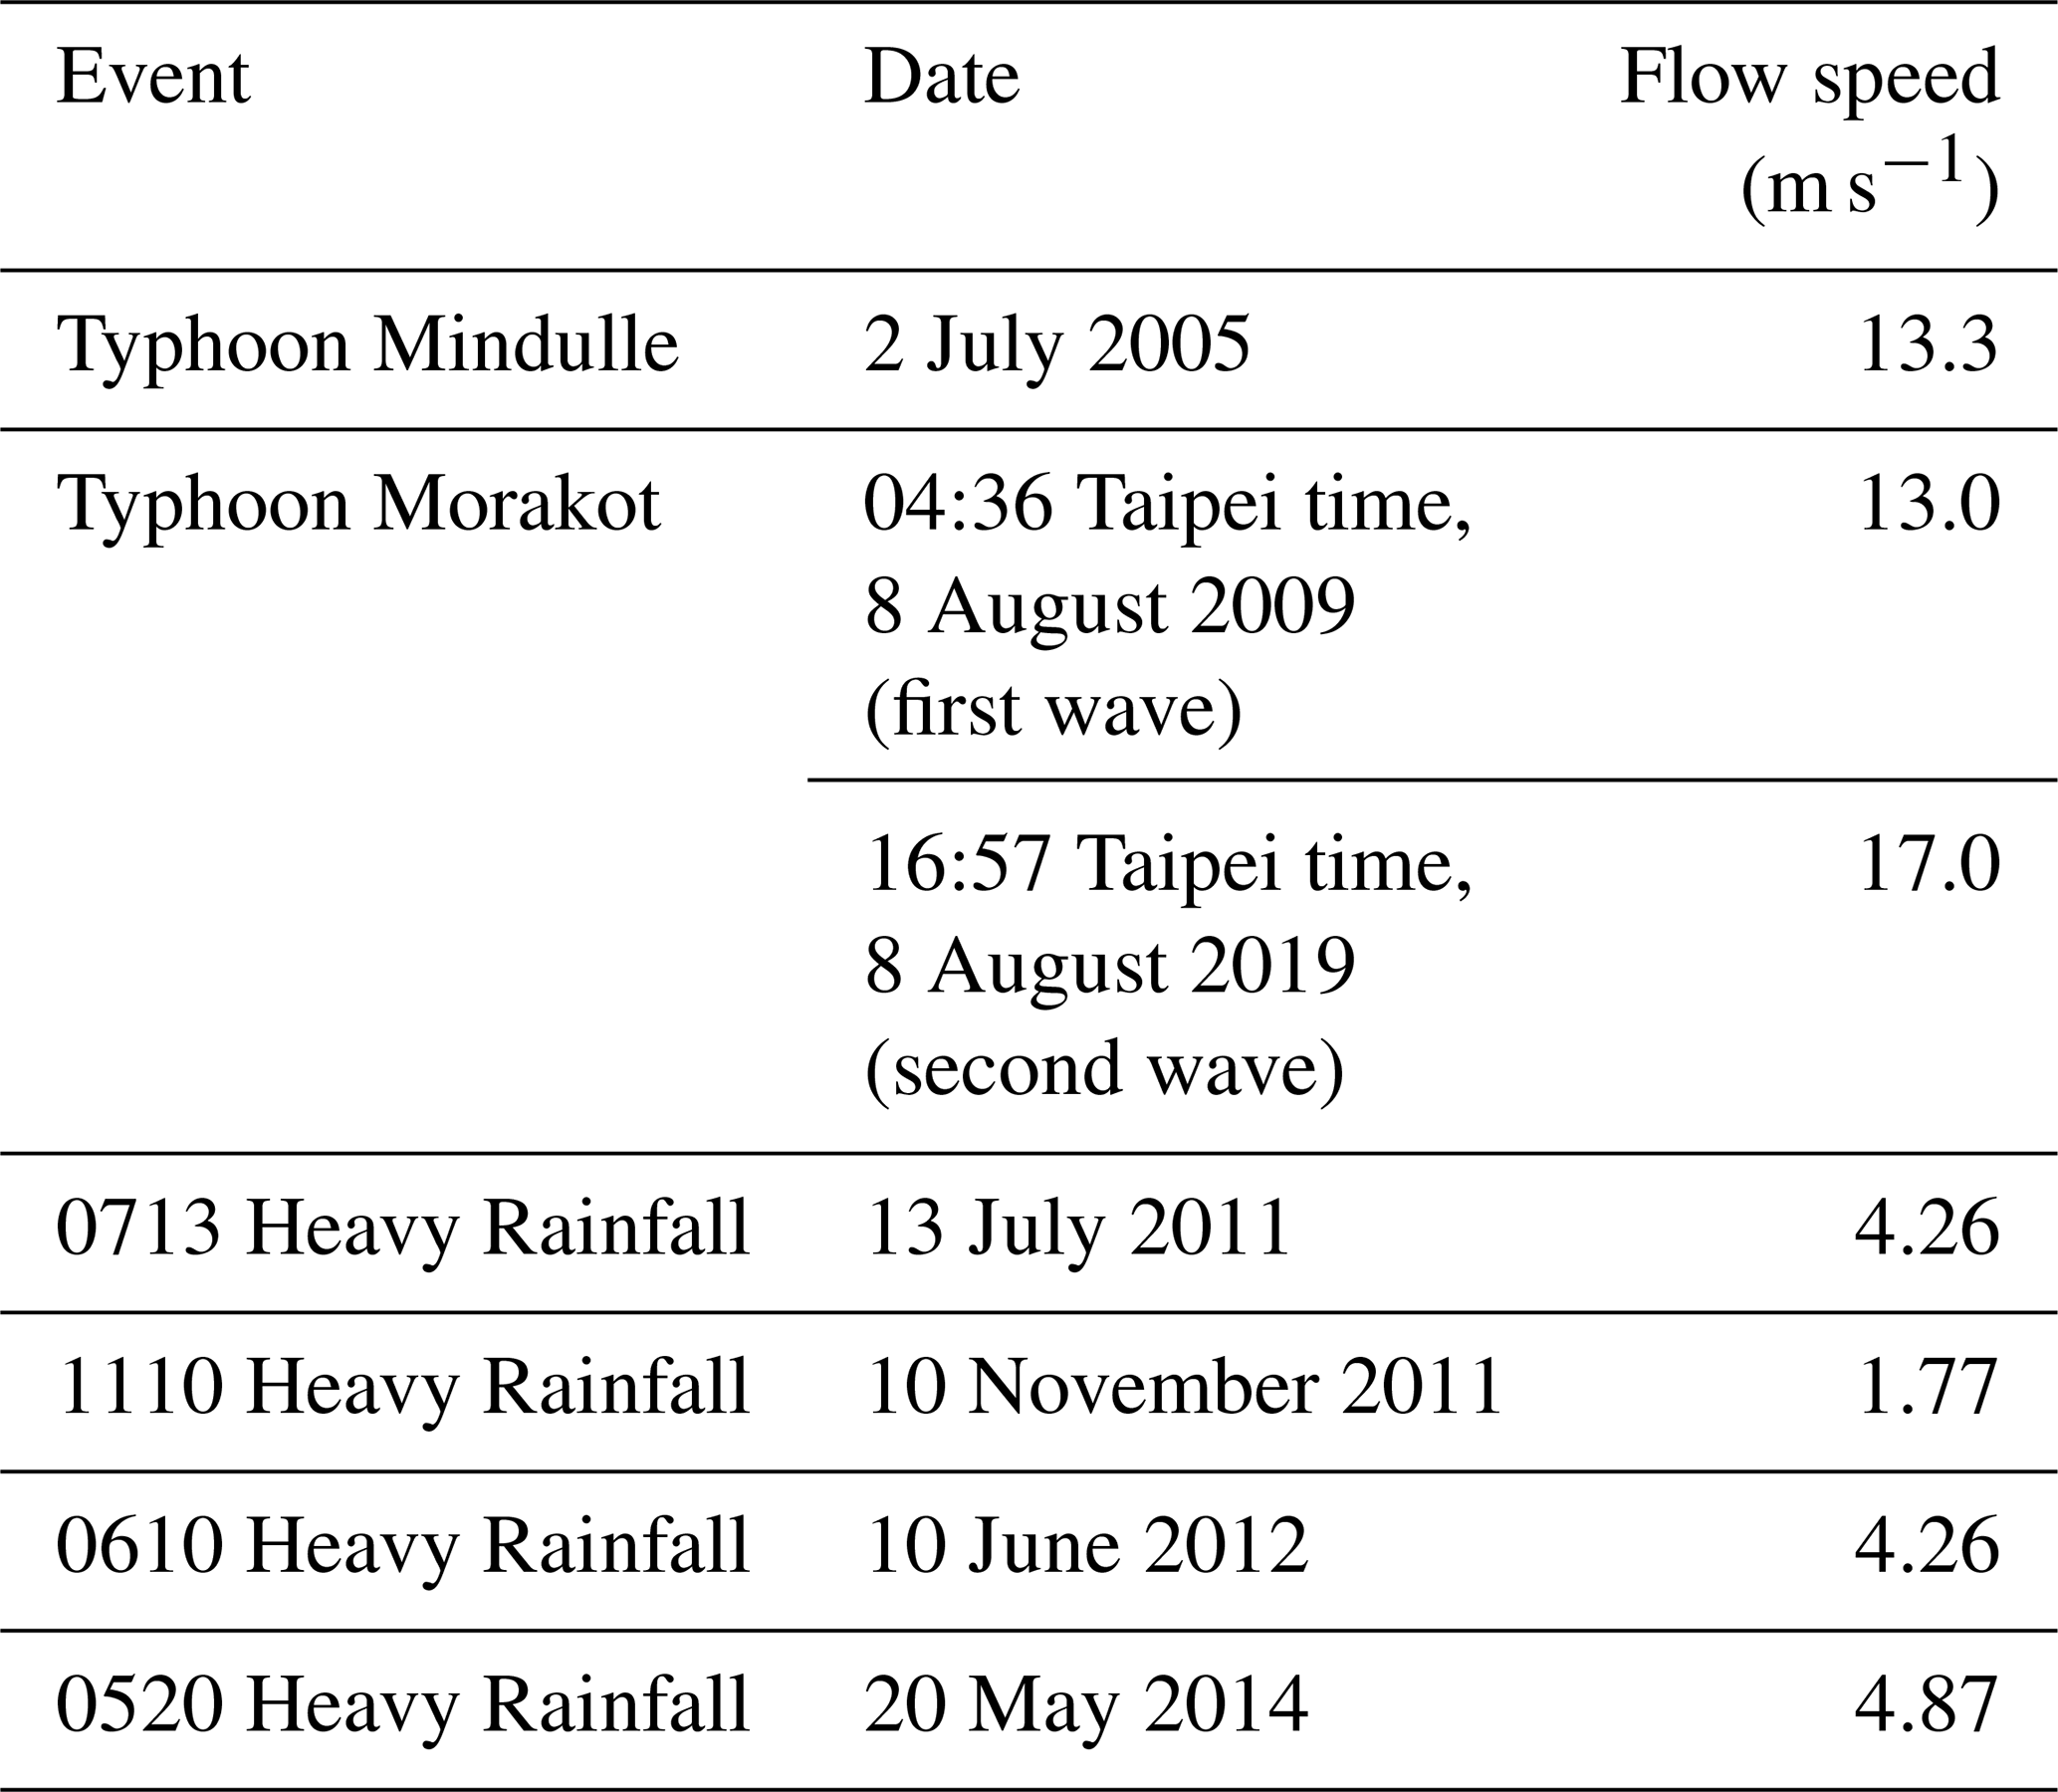
3.4 Debris-flow velocity
The flow velocity was estimated by geophone data and CCD video clips in several events in the Aiyuzi Stream. Table 6 summarizes the flow velocity estimation, as well as the rainfall information before the occurrence of debris flows. It has been noted that the flow velocity of debris flows was somewhat higher before 2010, with an average velocity of about 14.4 m s−1. After 2010, the average flow velocity of debris flows was much lower, about 4.5 m s−1, except the one obtained in the 1110 Heavy Rainfall event in 2011, which was only about 1.8 m s−1. A possible explanation for the lower flow speed of debris flows in the Aiyuzi Stream after 2009 is the reduced slope in the mid- to downstream sections due to the accumulation of debris from events.
3.5 Soil moisture and vibrational signals
Regarding the debris-flow warning, the soil moisture obtained from the site provides another aspect of evaluation. The variation in soil moisture with time has previously been analyzed with rainfall records and the occurrence of debris flows (Tsai et al., 2014). However, the continuous measurement of soil moisture was not well carried out within the whole monitoring period. The lack of this information had made the regression analysis of debris-flow occurrence and soil moisture unavailable. Another factor used for the determination of debris-flow occurrence is the ground vibrational signals. These data are mainly used for research purposes and are considered additional information for debris-flow disaster response (Huang et al., 2016, 2017). Previous research has shown that the characteristic frequency of the ground vibrational signals generated by the debris flows was between 10 and 40 Hz (Huang et al., 2016, 2017). The processed broadband signals revealed the lower frequency of debris-flow fronts between 0 and 10 Hz, which were captured earlier than those from the geophones (Huang et al., 2016). Figure 12 shows that the processed signal data (in terms of cumulative energy in the figure) had peaks when debris flows approached the monitoring station.
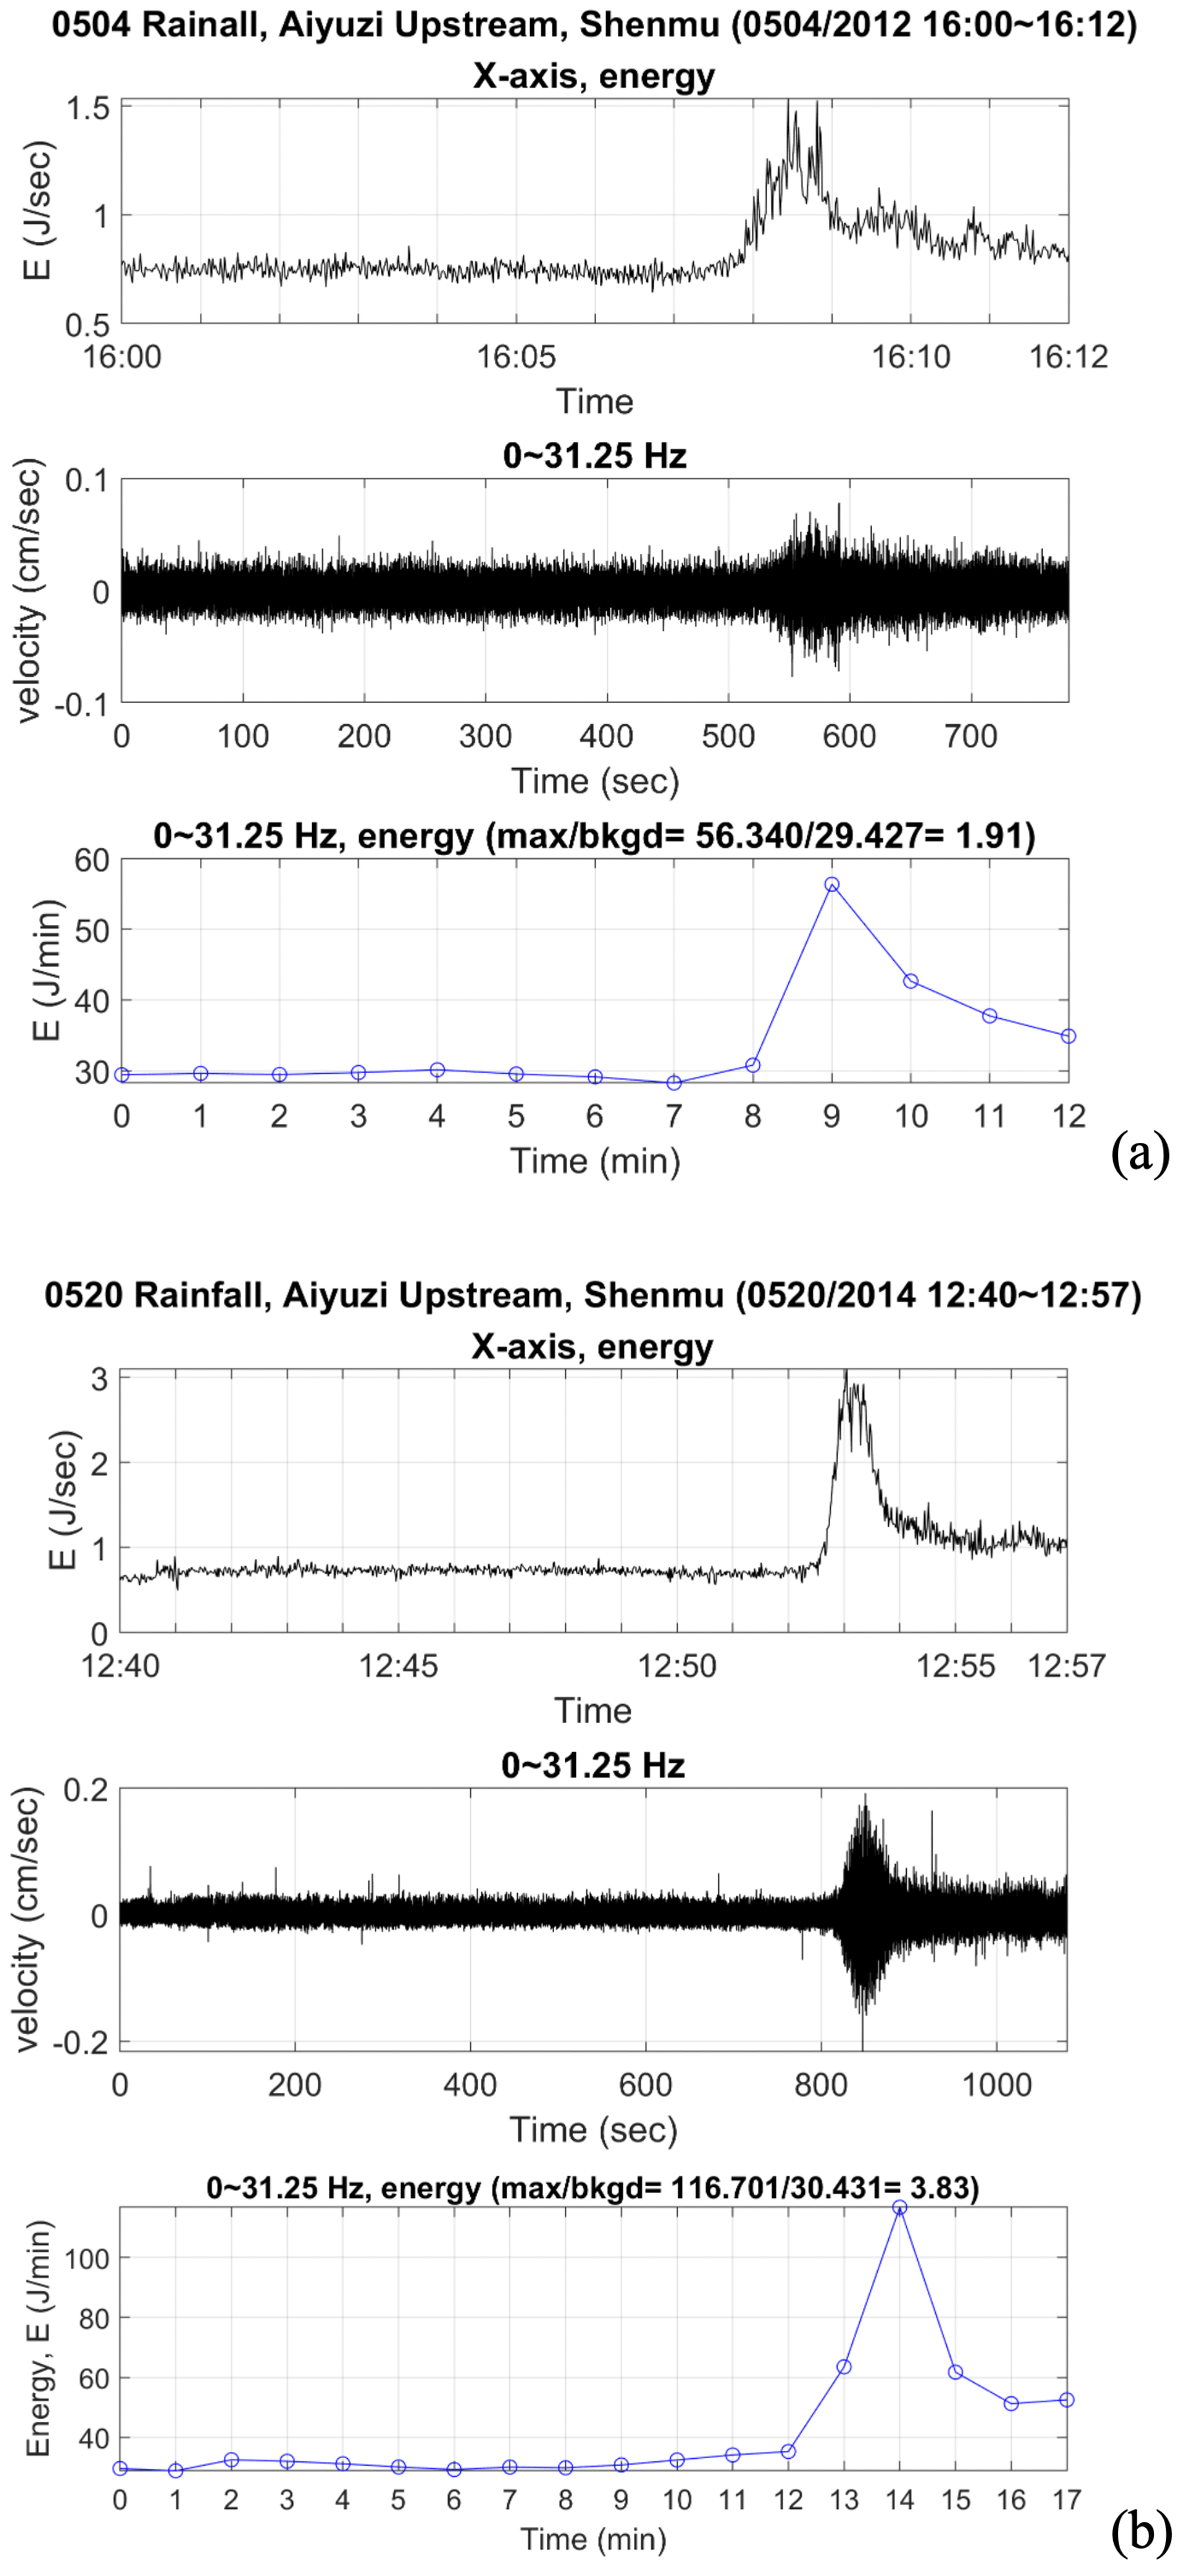
Figure 12Energy of vibrational signals for (a) 0504 Rainfall in 2012 and (b) 0520 Rainfall in 2014 (Huang et al., 2019a). The term “bkgd” denotes background.
In recent research (Wei et al., 2018), it has been found that the cumulative energy and the slope of cumulative energy in the 10 s interval (overlapping 50 %) and at a 5–40 Hz frequency can be used as interpretive indicators of debris flows. However, the short time window between the time detected by sensors and the arrival of debris flows in the residential areas limits the capability of ground surface vibrational signals in debris-flow early warning. Another recent study about the debris-flow vibrational signals was analyzed using machine learning methods (Huang and Chen, 2022), revealing the characteristic patterns of signals of debris flows in terms of averaged accumulated energy (6 s average) and the time interval of peaks (10 s before and after the peaks). Analysis results from studies indicate that the ground surface vibrational signals can be treated as a reference factor and are potentially useful for debris-flow early warning. Current research gives a promising indicator but is not applicable to disaster response.
With examination of several aspects of the debris-flow events in the Shenmu area, this analysis has led to the following conclusions.
The rainfall characteristics of debris flows in Shenmu mainly focus on the rainfall thresholds, in terms of the maximum hourly rainfall (Imax), 24 h accumulated rainfall (R24), and effective accumulated rainfall (Rt). The value of RTI-based effective accumulated rainfall has changed from 250 mm (during 2000 to 2020) to 300 mm (since 2021) due to the declining occurrence of debris flows in the area. Based on the case history in the Shenmu area, other proposed sets of rainfall thresholds for Imax, R24, and Rt are 9, 23, and 67.8 mm and 16.5, 51.5, and 75.2 mm. These values are considerably useful for debris-flow disaster monitoring.
Another perspective regarding rainfall characteristics in Shenmu is the rainfall intensity and duration when debris flows occur. Debris flows usually occur during the rainy season, especially during May to August in this area. They are more likely to occur during heavy rainfalls or intense typhoons. Precipitation thresholds of the initiation of debris flows are comparable to a global dataset. Compared to the global threshold of rainfall duration of less than 48 h (D < 48), the regression curve of rainfall I–D in the study area has a similar slope, indicating that shorter heavy rainfalls with average I ≥ 7.0 mm h−1 could have triggered debris flows after 2009.
Based on the observed debris-flow events, the average frequency of occurrence is about 1.11 times per year during the period from 2004 to 2021. Comparatively, the average frequency of debris-flow occurrence is 1.83 times per year from 2004 to 2009 and is 0.75 times per year after 2009. The average frequencies of debris-flow occurrence in the Shenmu area imply that there was at least one debris flow every year in the past 18 years. Also, it is noted that the occurrence frequency before 2009 is about twice the value after 2009, indicating that the impacts of extremely heavy rainfalls, particularly Typhoon Morakot in 2009, significantly changed the local environment and the basin conditions in the upstream sections. A lot of debris were transported from the upper streams in 2009. Therefore, the debris source coming from the unstable shallow slopes along the upstream sides may have been reduced by a large amount after 2009. In fact, there has been no debris flow observed in the study area since 2018. We expect that the amount of debris source is getting to a balanced level in this area.
The reducing trend of debris-flow occurrence after 2009 is reasonably due to fewer landslides in the upstream areas and fewer events of heavy rainfall. The debris source reached a balance in the 10 years after Typhoon Morakot in 2009. Another piece of possible evidence for fewer occurrences of debris flows is the flow speed of debris flows. The observed flow speed of debris flows from available data was abut 14.3 m s−1 before 2009 and was a much lower value of 4.46 m s−1 after 2009. A reasonable explanation for the slower flow speed after 2009 is the gentler slopes in the mid- to downstream sections after years of debris settlement and lower intensity of rainfall events in the past decade.
The monitoring results of past events show that peak values and rising energy from the ground surface vibrational signals were detected a few minutes earlier than the debris flow's arrival at the monitoring devices. The characteristic frequency of signals was between 0 and 40 Hz, and the cumulative energy and the slope of cumulative energy in the 10 s interval (overlapping 50 %) can be used as interpretive indicators of the debris flows. However, the limitation of a short evacuation time window needs to be improved, by either more data analysis or a different monitoring layout on the site, before being used as an indicator of debris-flow occurrence in future disaster response.
The dataset prepared in this study is useful for further analysis regarding the mechanism and characteristics of debris flows in Taiwan, as well as useful for global debris-flow datasets. It should be mentioned that the time series of rainfalls recorded by the rain gauges in the Shenmu area for the whole monitoring period is not completely available. Another problem is that a lack of systematic topographic surveys has restricted the estimation of sediment deposited along the stream channels in the Shenmu area, resulting in the difficulty of evaluating the magnitude of debris flows. These issues could be resolved by conducting regular on-site surveys and with the help of advanced monitoring technology in the future.
All available data used in this study can be obtained through the SWCB Debris and Large-scale Landslide Disaster Prevention Information website (https://246.swcb.gov.tw, last access: 6 March 2023) upon request.
The author has declared that there are no competing interests.
Publisher’s note: Copernicus Publications remains neutral with regard to jurisdictional claims in published maps and institutional affiliations.
The author thanks Yao-Min (Frank) Fang and his colleagues from the GIS Research Center of Feng Chia University who established the debris-flow monitoring system in Taiwan and have maintained the system for about 2 decades. The research on debris flows is funded by the Soil and Water Conservation Bureau (SWCB).
This research has been supported by the Soil and Water Conservation Bureau (grant no. SWCB-1110111015A).
This paper was edited by Mario Parise and reviewed by two anonymous referees.
Caine, N.: The rainfall intensity–duration control of shallow landslides and debris flows, Geogr. Ann. A., 62, 23–27, https://doi.org/10.1080/04353676.1980.11879996, 1980.
Chen, S. C., Chen, S. C., and Wu, C. H.: Characteristics of the landslides in Shenmu watershed in Nantou County, J. Chin. Soil Water Conserv., 43, 214–226, https://doi.org/10.29417/JCSWC.201209_43(3).0003, 2012 (in Chinese).
Guzzetti, F., Peruccacci, S., Rossi, M., and Stark, C. P.: The rainfall intensity–duration control of shallow landslides and debris flows: an update, Landslides, 5, 3–17, https://doi.org/10.1007/s10346-007-0112-1, 2008.
Huang, C. J., Yin, H. Y. Chen, C. Y., Yeh, C. H., and Wang, C. H.: Ground vibrations produced by rock motions and debris flows, J. Geophys. Res., 112, F02014, https://doi.org/10.1029/2005JF000437, 2007.
Huang, C. J., Chu, C. R., Tien, T. M., Yin, H. Y., and Chen, P. S.: Calibration and deployment of a fiber-optic sensing system for monitoring debris flows, Sensors, 12, 5835–5849, https://doi.org/10.3390/s120505835, 2012.
Huang, Y.-M. and Chen, C.-C.: Evaluation of Debris-Flow Vibration Signals Recorded at the Aiyuzi Stream in Shenmu Taiwan Using Machine Learning Methods, Water, 14, 3518, https://doi.org/10.3390/w14213518, 2022.
Huang, Y. M., Chen, W. C., Fang, Y. M., Lee, B. J., Chou, T. Y., and Yin, H. Y.: Debris Flow Monitoring – A Case Study of Shenmu Area in Taiwan, Disasters Adv., 6, 1–9, 2013.
Huang, Y. M., Chu, C. R., Fang, Y. M., Tsai, M. C., Lee, B. J., Chou, T. Y., Lee, C. Y., Chen, C. Y., and Yin, H. Y.: Characteristics of debris flow vibration signals in Shenmu, Taiwan, in: Proceedings of the 13th International Interpraevent Congress, Lucerne, Switzerland, 30 May–2 June 2016, International Research Society INTERPRAEVENT, Klagenfurt, Austria, 306–318, ISBN 9783901164248, 2016.
Huang, Y. M., Fang, Y. M., Chou, T. Y., Lee, C. Y., and Yin, H. Y.: The Vibration Signal Analysis of Debris Flow in Taiwan, in: Proceedings of the 5th International Conference on Geotechnical Engineering for Disaster Mitigation and Rehabilitation, Taipei, Taiwan, 13–14 September 2017, Airiti Press Inc., New Taipei, Taiwan, 149–161, https://doi.org/10.6140/9789864371419.201710.0013, ISBN 9789864371419, 2017.
Huang, Y. M., Fang, Y. M., and Yin, H. Y.: The Vibrational Characteristics of Debris Flow in Taiwan, in: Proceedings of the 7th International Conference on Debris-Flow Hazard Mitigation, Golden, Colorado, USA, 10–13 June 2019, Association of Environmental and Engineering Geologists, Ohio, USA, 8 pp., https://doi.org/10.25676/11124/173229, ISBN 9780578510828, 2019a.
Huang, Y. M., Lei, T. C., Lee, B. J., and Hsieh, M. H.: Landslide Potential Evaluation Using Fragility Curve Model, in: Landslides – Investigation and Monitoring, edited by: Ray, R. and Lazzari, M., IntechOpen, London, United Kingdom, https://doi.org/10.5772/intechopen.89183, 2019b.
Hürlimann, M., Coviello, V., Bel, C., Guo, X., Berti, M., Graf, C., Hübl, J., Miyata S., Smith, J. B., and Yin, H.-Y.: Debris-flow monitoring and warning: review and examples, Earth-Sci. Rev., 199, 102981, https://doi.org/10.1016/j.earscirev.2019.102981, 2019.
Jan, C. D. and Lee, M. H.: A Debris-Flow Rainfall- Based Warning Model, Journal of Chinese Soil and Water Conservation, J. Chin. Soil Water Conserv., 35, 275–285, 2004 (in Chinese).
Lee, C. Y., Lee, B. J., Huang, Y. M., Lei, T. C., Hsieh, M. H., Wang, H. P., Fang, Y. M., and Yin, H. Y.: Risk Assessment of Landslide by using Fragility Curves – A Case Study in Shenmu, Taiwan, in: Proceedings of the 5th International Conference on Geotechnical Engineering for Disaster Mitigation and Rehabilitation, Taipei, Taiwan, 13–14 September 2017, 137–148, https://doi.org/10.6140/9789864371419.201710.0012, 2017.
Marchi, L., Cazorzi, F., Arattano, M., Cucchiaro, S., Cavalli, M., and Crema, S.: Debris flows recorded in the Moscardo catchment (Italian Alps) between 1990 and 2019, Nat. Hazards Earth Syst. Sci., 21, 87–97, https://doi.org/10.5194/nhess-21-87-2021, 2021.
Riedel, J. L. and Sarrantonio, S. M.: Debris flow magnitude, frequency, and precipitation threshold in the eastern North Cascades, Washington, USA, Nat. Hazards 106, 2519–2544, https://doi.org/10.1007/s11069-021-04553-8, 2021.
Tsai, M. C., Huang, Y. M., Fang, Y. M., Lee, B. J., Chou, T. Y., and Yin, H. Y.: Characteristics of Debris Flow in Taiwan – A Case Study in Shenmu Area, in: Proceedings of the Interpraevent International Symposium 2014, Nara, Japan, 25–28 November 2014, International Research Society INTERPRAEVENT, Klagenfurt, Austria, 117–125, 2014.
Wang, H. P., Huang Y. M., Fang, Y. M, Chou, T. Y., and Yin, H. Y.: Basin-Wide Debris Flow Monitoring – Development of Portable Units and Deployment Study, in: Proceedings of 32nd Asian Conference on Remote Sensing, Taipei, Taiwan, 3–7 October 2011, Curran Associates, Inc. New York, USA, 3, 2014–2019, ISBN 9781618394972, 2011.
Wei, S. C., Liu, K. F., Huang, Y. M., Fang, Y. M., Yin, H. Y., Huang, H. Y., and Lin, C. L.: Characteristics and Warning Methods of Ground Vibrations Generated by Debris Flows at Ai-Yu-Zi Creek, J. Chin. Soil Water Conserv., 49, 77–88, https://doi.org/10.29417/JCSWC.201806_49(2).0002, 2018 (in Chinese).