the Creative Commons Attribution 4.0 License.
the Creative Commons Attribution 4.0 License.
Spatiotemporal seismicity pattern of the Taiwan orogen
Chien-Chih Chen
Strong Wen
Wei-Tsen Lu
We investigate the temporal and spatial seismicity patterns prior to eight M > 6 events nucleating in different regions of Taiwan through a region–time–length algorithm and an analysis of a self-organizing spinodal model. Our results show that the spatiotemporal seismicity variations during the preparation process of impending earthquakes display distinctive patterns corresponding to tectonic settings. Q-type events occur in southern Taiwan and experience a seismic quiescence stage prior to the mainshock. A seismicity decrease of 2.5 < M < 4.5 events occurs around the relatively high b-value southern Central Range, which contributes to the accumulation of tectonic stress for preparing for the occurrence of the Q-type event. On the other hand, A-type events occur in central Taiwan and experience a seismic activation stage prior to the mainshock, which nucleates on the edge of the seismic activation area. We should pay attention when accelerating seismicity of 3 < M < 5 events appears within the low b-value area, which could promote the nucleation process of the A-type event.
- Article
(8140 KB) - Full-text XML
- BibTeX
- EndNote
Seismic activity is related to spatiotemporal variations in the stress field and state, and seismicity changes prior to a large earthquake have been widely observed through different techniques, e.g., b-value analysis (Chan et al., 2012; Wyss and Stefansson, 2006), noncritical precursory accelerating seismicity theory (PAST) (Mignan and Giovambattista, 2008), pattern informatics (PI) algorithm (Rundle et al., 2003; Chen et al., 2005), the region–time–length (RTL) algorithm (Chen and Wu, 2006; Wen et al., 2016), and the analysis of self-organizing spinodal (SOS) model (Rundle et al., 2000). Previous studies have mostly focused on a significant earthquake; therefore, it is not easy to understand whether the properties of seismic activation and quiescence patterns respond to regional tectonic stress.
The Taiwan orogenic belt, which is an active and ongoing arc–continent collision zone as a result of the Philippine Sea Plate (PSP) obliquely colliding with the Eurasian Plate (EP), is particularly complex due to the two adjacent subduction zones, the Ryukyu trench and Manila trench to the northeast and south of the island, respectively (Suppe, 1984; Yu et al., 1997). The frequent and significant seismic activities as well as a rapid convergence rate of 85 to 90 mm yr−1 are well observed by the island-wide GPS and seismic networks (Fig. 1). The growth of the Taiwan orogenic belt shows propagation from north to south due to oblique plate convergence and opposing subduction in the southern and northern parts of Taiwan (Suppe, 1984). The central part of Taiwan, which is experiencing rapid to full collision, mainly consists of the Coastal Range, Central Range and Western Foothills (Shyu et al., 2005a, b). A myriad of active and thin-skinned structures are the products of the accretion of the continental sliver to the continental margin. In southern Taiwan, the EP subducting eastward beneath the PSP is in a stage of incipient arc–continent collision (Kao et al., 2000; Shyu et al., 2005a, b). The northwest domain of southern Taiwan, which represents the southern tip of the fold-and-thrust belt in the coastal plain and foothill region and shows very low seismicity, mainly consists of Miocene shallow marine deposits and a Pliocene–Pleistocene foreland basin as well as mudstones.
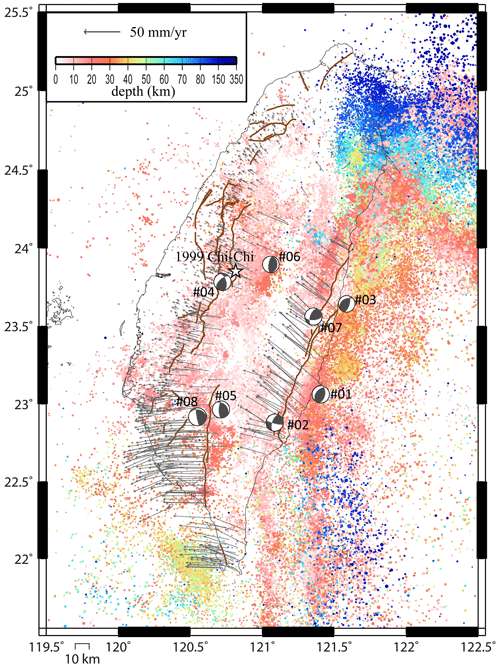
Figure 1Horizontal velocities from 2002 to 2017 (Chen et al., 2018) and seismicity between 1991 and 2018. The white star shows the location of the 1999 Chi-Chi earthquake, and the focal mechanisms determined by the Global CMT solution represent the locations of the investigated events in this study. The active faults (thick lines) identified by the Central Geological Survey of Taiwan are also shown.
Over the last 2 decades, several moderate earthquakes have occurred with various seismicity patterns and in GPS velocity field regions. We investigate the temporal and spatial seismicity patterns prior to eight M > 6 events nucleated in different regions of Taiwan through the RTL algorithm and analysis of the SOS model. Our attempt is not to catch the seismic precursor but to focus on the seismicity changes related to the regional tectonics, which might become useful hints for potential seismic hazard assessments. The results show that the temporal and spatial seismicity (2.5 < M < 5) variations during the preparation process of impending earthquakes could display distinctive patterns corresponding to the tectonic setting.
The region–time–length (RTL) algorithm (Sobolev and Tyupkin, 1997, 1999) is a statistical technique to detect the occurrence of seismic quiescence and activation by taking into account the location, occurrence time and magnitude of earthquakes. The RTL value is defined as the product of the three dimensionless factors, R, T and L:
where ri is the distance between the investigated point (x, y, z) and the ith prior event (with the occurrence time ti and rupture length li). n is the number of prior events that occurred in a defined space–time window with ri≤2r0 (r0, characteristic distance) and (t0, characteristic timespan). Rupture length li is a function of earthquake magnitude (Mi), (Kasahara, 1981). The weighted RTL value reflects the deviation from the background seismicity level (Rbk, Tbk and Lbk) with negative values for seismic quiescence and positive values for activation. r0 characterizes the decreasing influence of more distant events, and t0 describes the reducing influence rate of the preceding events as the time of calculation moving on. To diminish the ambiguity in determining the characteristic parameters, we follow the systematic procedure of correlation analysis over pairs of RTL results proposed by Huang and Ding (2012) to obtain the optimal model parameters, and , of each event. Details of this technique of correlation analysis are described in Appendix A. We calculate various combinations of r0 (ranging between 25 and 80 km with a step of 2.5 km) and t0 (ranging between 0.25 and 2.0 years with a step of 0.05 years). As the correlation coefficient criterion C0 is set, we can calculate the ratio W (or weight) of the combination with correlation coefficients equal to or larger than C0 for each model parameter of r0i (i=1–m; m=23) and t0j (j=1–n; n=36).
After testing many criterion sets, the criterion coefficient C0=0.6 and criterion ratio W0=0.5 are acceptable for each event, which represents at least 50% of the total combination pairs with correlation coefficient . Then, we obtain the average km and average years. These model parameters are similar to those of previous studies for Taiwan (Chen and Wu, 2006; Wen et al., 2016; Lu, 2017; Wen and Chen, 2017).
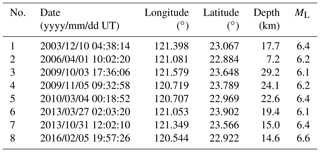
For statistical analyses, catalog completeness is an important factor. Since 1991, the Taiwan Telemetered Seismographic Network (TTSN) (Wang, 1989) has merged with the Central Weather Bureau (CWB) seismic network and updated to an integrated earthquake observation system, named the Central Weather Bureau Seismic Network (CWBSN). Wang et al. (1994) pointed out that most shallow earthquakes occurring in Taiwan are distributed at depths less than 35 km. According to previous studies (Wu and Chiao, 2006; Wu et al., 2008; Wen et al., 2016; Hsu et al., 2021), we used the earthquake catalog maintained by the CWB for the entire Taiwan area with M ≥ 2.5 and depth ≤ 35 km between 1991 and 2018 and applied a declustering procedure proposed by Gardner and Knopoff (1974). Considering a sufficient background seismicity and minimizing the influence of the 1999 Chi-Chi earthquake, we only selected the M > 6 inland earthquakes between 2003 and 2016 in Taiwan. Since two events occurring in a close space–time window would show high similarity in RTL function (Lu, 2017), we excluded the event occurring within and with respect to the last M > 6 events. For example, two M > 6 events within a distance of 10 km struck the Nantou area on 27 March and 2 June 2013, and we only analyzed the former event. Therefore, we have eight qualified M > 6 events, as listed in Table 1.
3.1 Temporal seismicity variation
The temporal variation in the RTL function represents the different stages of seismicity rate change at the target location with respect to the background level. For consistency, we adopt a 10-year catalog as the background for each investigated event. Figure 2 shows the temporal variation in the RTL functions prior to the investigated events. We can see that before the occurrence of the investigated event, both seismicity changes are observed: the seismic quiescence stage for nos. 1, 2, 5 and 8 (Q-type events hereafter) and the seismic activation stage for nos. 3, 4, 6 and 7 (A-type events hereafter). Q-type events occurred at different locations in southern Taiwan, and most, 3 among 4, of their temporal RTL functions exhibit the seismic quiescence stages during 2002–2004, which was before the occurrence of the 2003 Chengkung earthquake, i.e., event no. 1. The seismicity increase (activation stage) took approximately 2 years following the 2003 Chengkung mainshock (event no. 1). We note that the length of the seismic quiescence stage prior to the Q-type event might correspond to the magnitude.
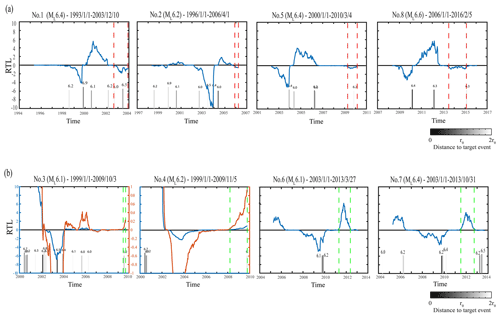
Figure 2Temporal variation of the RTL function (blue line) for (a) Q-type events and (b) A-type events. The orange curves and vertical axes on the right represent the enlarged RTL functions of event nos. 3 and 4. The vertical dashed red lines mark the seismic quiescence stage, and the vertical dashed green lines mark the seismic activation stage. The bar chart represents the occurrence time of M ≥ 6.0 events within a distance of 2r0 from the target event; each number above the bar is the magnitude.
A-type events all occurred in central Taiwan and were located within with respect to the 1999 Chi-Chi earthquake. Figure 3 shows the declustered seismicity distribution as a function of time and latitude. Significant seismicity followed the 1999 Chi-Chi earthquake north of 23∘ N. Since the background seismicity of event nos. 3 and 4 started from 1 January 1999, the RTL functions were obviously affected by the occurrence of the 1999 Chi-Chi earthquake. Therefore, we enlarge the vertical axis to accentuate the seismicity variation prior to event nos. 3 and 4. As shown in Fig. 2, the temporal RTL functions of A-type events mostly show a seismic activation stage between 2004 and 2006, which corresponds to the seismicity increase following the 2003 Chengkung mainshock (event no. 1). However, for the A-type event, we could not see the relationship between the length of the seismic activation stage and the magnitude.
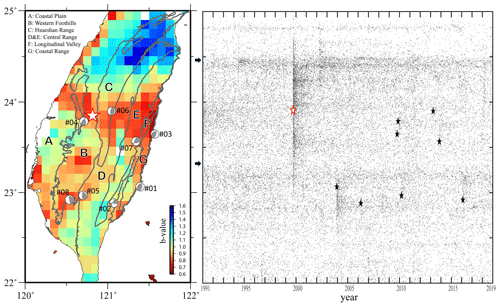
Figure 3Map view of the earthquake b value and declustered seismicity distribution as a function of time and latitude. The white star indicates the 1999 Chi-Chi earthquake, and the black stars (or focal mechanisms) represent the investigated events in this study. The black arrows indicate the seismicity boundaries. The major geological units in Taiwan are marked by gray curves and labeled from A to G.
3.2 Spatial seismic activation–quiescence distribution
Since Q-type and A-type events are located in southern and central Taiwan, respectively, it would be worth examining the spatial pattern of their abnormal seismicity stages. Wen and Chen (2017) pointed out that various seismic activation or quiescence processes of about 2–4 years were found prior to some events occurring in Taiwan (Chen and Wu, 2006; Wen et al., 2016; Wu et al., 2008). Thus, for consistency, we only consider the last abnormal stage within 4 years prior to the investigated events, as marked by red vertical lines for the quiescence stage of Q-type events and green vertical lines for the activation stage of A-type events. Then, we calculate the summation of the selected period to generate the seismic quiescence–activation distribution. Considering the definition of the weighted RTL function, a sufficient amount of background seismicity should be regarded as a criterion (Wen and Chen, 2017). Using the declustered catalog from 1991 to 2016, we set up two conditions similar to those of Wen and Chen (2017) for each grid to strengthen the reliability: (i) the total number of events within the grid area of 0.1∘ × 0.1∘ must be more than 26 (i.e., at least 1 event occurred every year on average), and (ii) the total events within a circle of 2r0 in radius must be more than 9360 (i.e., at least 30 events occurred every month on average). For each event, we normalize the spatial distribution based on the summed result. The spatial seismic activation–quiescence map provides the information of influence of surrounding seismicity state to the target event during the abnormal stage. Similar to previous studies (e.g., Huang et al., 2001; Huang and Ding, 2012), Fig. 4 shows that Q-type events mostly occurred on the edge of the seismic quiescence area, and seismic activation appeared around the A-type events.
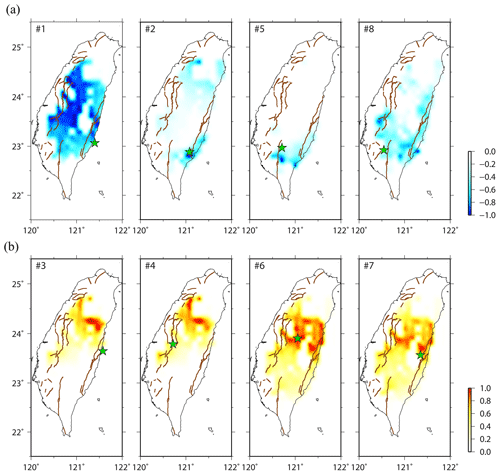
Figure 4(a) The summed and normalized seismic quiescence map for the selected time window of the temporal RTL function of Q-type events, and (b) the summed and normalized seismic activation map for the selected time window of the temporal RTL function of A-type events. Stars represent the locations of the investigated events. The active faults (thick lines) identified by the Central Geological Survey of Taiwan are also shown.
4.1 Spatiotemporal characteristics of seismicity changes
The RTL analysis accounts for the background seismicity prior to the investigated event. Therefore, the RTL analyses account for almost the same background period for event nos. 3 and 4 (1999–2009) and for event nos. 6 and 7 (2003–2013), respectively. As the temporal RTL functions show the seismic activation stage prior to the mainshocks during a similar period, we could expect similar seismic activation maps for event nos. 3 versus 4 and event nos. 6 versus 7, as shown in Fig. 4. Furthermore, the seismic quiescence stage of event no. 5 occurred in a similar period as the seismic activation stage of event no. 3 (Fig. 2), and the seismic quiescence area of event no. 5 complements the seismic activation area of event no. 3 (Fig. 4). In contrast, although event nos. 3 and 7 occurred at close locations, the difference in the 10-year background period affects the weighting of the deviation. For example, the seismic quiescence stage during 2007–2009 shown in the temporal RTL function of event no. 7 (Fig. 2) is evaluated as the background seismicity level (RTL value is equal to zero) in the temporal RTL function with respect to event no. 3. On the other hand, Wen and Chen (2017) pointed out that an abnormal seismic stage derived with various background periods cannot be produced by chance. The temporal RTL functions of five events (nos. 1–5 in Fig. 2) accounting for different background periods all exhibit the seismic quiescence stage before the occurrence of event no. 1. This phenomenon is consistent with the seismic quiescence map of event no. 1 (Fig. 4) and the Z-value map of Wu et al. (2008) in which the seismic activity decreased during 2002–2003 for a large area in Taiwan. In addition, the widespread seismic activation distribution of nos. 6 and 7 (Fig. 4) also responded to the seismic activity increase during 2011–2012 (nos. 6–8 in Fig. 2). Wen et al. (2016) suggested that, after the 2010 Jiashian earthquake (event no. 5), the 2-year seismicity increase is caused by the increase in Coulomb stress change, which is consistent with the seismic activation period in the temporal RTL function of event no. 8.
Rundle et al. (2000) proposed the self-organizing spinodal (SOS) model for characteristic earthquakes and suggested that small earthquakes occurred uniformly at all times, while the occurrence rate of intermediate-sized earthquakes varied during the earthquake cycle. Chen (2003) investigated the SOS behavior of the 1999 Chi-Chi earthquake and proposed the seismic activation of moderate-size (5 < M < 6) events prior to the mainshock. Here, we also calculate the cumulative frequency–magnitude distributions for these eight events using the same catalog periods of the RTL analysis. For each investigated event, we only compared the distribution diagrams of the long-term (background period) and abnormal seismic stages marked by dashed lines in Fig. 2, within a radius of 25 km with respect to the epicenter. As shown in Fig. 5, cumulative frequency–magnitude distributions of long-term seismicity (red dots) generally exhibit linear power law distributions. For the Q-type events, the cumulative frequency distributions of the seismic quiescence stage (black dots) appear to lack 2.5 < M < 4.5 events (Fig. 5a), and the lack of a level corresponds to the seismic quiescence distribution near the epicenter (Fig. 4). This indicates that within the seismic quiescence stage before the occurrence of the Q-type event, the quiescence of 2.5 < M < 4.5 activity contributes to the accumulation of tectonic stress. On the other hand, the cumulative frequency distributions of the seismic activation stage of the A-type events (black dots in Fig. 5b) show that the seismic activation of 3 < M < 5 events within the seismic activation stage before the occurrence of the A-type earthquake can be found, which is similar to the results of the 1999 Chi-Chi earthquake (Chen, 2003). Event nos. 6 and 7, which are located very close to the high seismic activation area (Fig. 4), display the more obvious increase in the number of 4 < M < 5 events during the seismic activation stage (Fig. 5b).
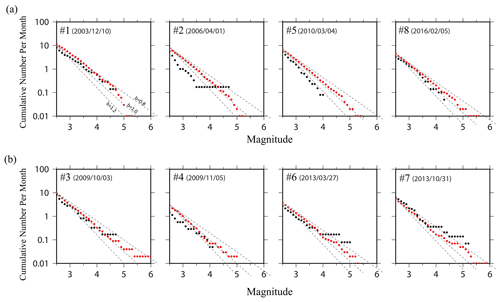
Figure 5The cumulative frequency–magnitude distributions prior to the investigated events. Red and black dots represent the long-term and abnormal seismic stage marked in Fig. 2, respectively.
Event no. 4 occurred only one month later than event no. 3; however, the seismic activation stage of event no. 4 was much longer than that of event no. 3. Furthermore, the cumulative frequency distributions of the seismic activation stage of event no. 4 display a lower intercept (Fig. 5b), which represents the overall decreasing seismicity within this seismic activation stage. Here, we further divide the seismic activation stage of event no. 4 into three periods for discussion:
- i.
P1 encompasses February 2008–March 2009 before the seismic activation stage of event no. 3.
- ii.
P2 encompasses April–September 2009 matching the seismic activation stage of event no. 3.
- iii.
P3 encompasses October 2009 between the occurrences of event nos. 3 and 4.
The seismic activation distributions in Fig. 6 are all normalized with respect to the maximum RTL value of the seismic activation distribution of event no. 4 through periods P1–P3. We can see that before the seismic activation stage of event no. 3 during February 2008–March 2009 (P1), the location of event no. 3 indeed shows no seismic activation, as exhibited in the temporal RTL function (Fig. 2b). On the other hand, for the location of event no. 4, the seismic activation remains through all three periods P1–P3. Combined with the overall decreasing seismicity indicated by the lower intercept in Fig. 5b, these results suggest that this seismic activation prior to event no. 4 was mainly contributed by the relatively accelerating activity of 3.5 < M < 4 events.
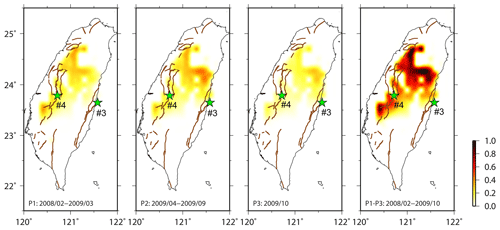
Figure 6The summed seismic activation map for different periods of the seismic activation stage prior to event no. 4; all maps are normalized based on the summed results of P1–P3. Stars represent the locations of event nos. 3 and 4. The active faults (thick lines) identified by the Central Geological Survey of Taiwan are also shown.
4.2 Implication for the tectonic setting
Several major active faults in southwestern Taiwan have been identified, and most of them have been dominated by thrust movement. Some strike-slip structures, e.g., the Zuochen and Hsinhua faults, acted as the transfer structures between these thrust faults (Ching et al., 2011; Deffontaines et al., 1994, 1997; Rau et al., 2012). These transfer structures develop at around 23∘ N, which is the northern limit of the Wadati–Benioff zone (Kao et al., 2000) and close to the seismicity boundary indicated in Fig. 3. Geodetic data displayed various rates and orientations of horizontal shortening with rapid uplift rates in southern Taiwan (Fig. 1), which might be caused by underplating beneath the Central Range sustaining crustal thickening and exhumation (Simoes et al., 2007). The seismic b value, which is the relative earthquake size distribution, can be derived from the Gutenberg–Richter relation (Gutenberg and Richter, 1944): , where constant a is related to seismicity and N is the number of earthquakes with magnitudes greater than M. In general, a high b value indicates a larger proportion of small events, and a low b value suggests that large earthquakes dominate over small ones. Using the same declustered catalog from 1991 to 2018, we search for events within a radius of 25 km with respect to the center of each grid (0.1∘ × 0.1∘). Only for the grids with more than 30 events, we calculate the b value using the weighted least-squares fitting method (Shi and Bolt, 1982) and the spatial distribution of b values, as shown in Fig. 3. The seismicity in the southern Central Range is active but shows significant heterogeneity in faulting types (Fig. 1; Chen et al., 2017; Wu et al., 2018), and relatively high b values suggest the predominance of small earthquakes in this region (Fig. 3 and red dots in Fig. 5a; Wu et al., 2018). Wen et al. (2016) found the decreased seismicity and increased Coulomb stress change in the southern Central Range prior to the 2010 Jiashian earthquake (i.e., event no. 5) and suggested both variations in Coulomb stress and seismicity rate play important roles in contributing to the nucleation process of impending earthquakes. The seismicity rate change can be considered a proxy for the stress state change (Dieterich, 1994; Dieterich et al., 2000), and this implies that the quiescence of seismicity contributes to the accumulation of tectonic stress. Since this relatively high b-value region in the southern Central Range has been observed to have a seismicity decrease (2.5 < M < 4.5 events) before the occurrence of Q-type events, it can be an indicator of stress change.
Many devastating earthquakes with surface ruptures have occurred in central Taiwan, including the 1935 M 7.1 Hsinchu–Taichung earthquake, the 1951 Longitudinal Valley earthquake sequence and the 1999 Chi-Chi earthquake (Lee et al., 2007; Chen et al., 2008; Lin et al., 2013). Hsu et al. (2009) derived the consistent orientations of principal strain rate and crust stress axes in central Taiwan, which implies that faulting style corresponds to stress buildup accumulating from interseismic loading (Fig. 1). They also pointed out that, for central Taiwan, small events tend to surround the locked fault zone, where major earthquakes might occur, during the interseismic period. The 1999 Chi-Chi earthquake ruptured the area near the end of the décollement with a high contraction rate (Dominguez et al., 2003; Hsu et al., 2003, 2009). In addition, similar to the 1999 Chi-Chi earthquake, the A-type events occurred in the low b-value area surrounded by small and active events. Chen and Wu (2006) derived the temporal RTL function of the 1999 Chi-Chi earthquake, showing a pattern similar to that of A-type events with the activation stage prior to the mainshock. Furthermore, Wu (2006) calculated the seismic activation map of the 1999 Chi-Chi event and found that the 1999 Chi-Chi mainshock occurred on the edge of the seismic activation area, which is a low b-value region. This is similar to the seismic activation maps of A-type events, which display the hot-spot pattern contracting within the low b-value area (Figs. 3 and 4). The nucleation of the A-type mainshock can be attributed to the perturbation of background seismicity (3 < M < 5 events) by the stress state change (Dieterich, 1994; Dieterich et al., 2000).
The cumulative frequency distributions of long-term seismicity in Fig. 5 show a b value of 0.8–1.0 around these eight events, which is consistent with the pattern shown in Fig. 3. However, the cumulative frequency distributions of long-term seismicity exhibit different trends of magnitudes larger than 4.5 for the two types of events. The seismicity for M > 4.5 events is lower in the area around the Q-type event but higher in the area around the A-type event. Event nos. 1, 2, 3 and 7 occurred in eastern Taiwan with an average GPS velocity of about 60 mm yr−1 (Fig. 1), and the cumulative frequency distributions of long-term seismicity display a high intercept (Fig. 5). This rapid convergence rate generally remains in the western part of southern Taiwan, which indicates that only a little shortening is consumed from east to the west in southern Taiwan. This corresponds to the active seismicity of small earthquakes, as indicated by the high intercept of the cumulative frequency distributions of long-term seismicity for event nos. 1, 2, 5 and 8 (Fig. 5). Therefore, for the pre-collisional rapid and distributed convergence in southern Taiwan (Shyu et al., 2005a), the quiescence of 2.5 < M < 4.5 activity contributes to the accumulation of tectonic stress for preparing for the occurrence of the Q-type event. On the other hand, the shortening rate is obviously consumed in the mountainous area of central Taiwan. Therefore, the lowest intercept of the cumulative frequency distributions of long-term seismicity for event no. 4 (Fig. 5) reflects the slow GPS velocity and low seismicity in the western part of central Taiwan (Fig. 1). For central Taiwan, small events tend to surround the locked fault zone of the potential major events during the interseismic period, and the 1999 Chi-Chi earthquake is the case affected by the accelerating seismicity of moderate-size events and ruptured the area near the end of the décollement with a high contraction rate (Chen, 2003; Dominguez et al., 2003; Hsu et al., 2003, 2009). Tectonic stress accumulating from the interseismic loading with the perturbation of the accelerating activity of 3 < M < 5 events could promote the nucleation process of the A-type event. The mechanisms causing these different phenomena are not clear, and further study is still needed. For example, some studies using machine-learning-based earthquake detectors and template-matching techniques will be helpful to build a more complete earthquake catalog in Taiwan (Liao et al., 2021; Zhai et al., 2021) and to get more useful data on small earthquakes with a magnitude below 2.5.
Through statistical analyses of recent large earthquakes that occurred in Taiwan, we summarize various temporal and spatial seismicity patterns prior to the earthquakes that nucleated in different regions of Taiwan:
-
Q-type events occurred in southern Taiwan, with the northern boundary of 23.2∘ N, and experienced a seismic quiescence stage prior to the mainshock. A seismicity decrease of 2.5 < M < 4.5 events in the relatively high b-value southern Central Range could be an indicator of stress change related to the preparation process of such events.
-
A-type events occurred in central Taiwan and experienced a seismic activation stage prior to the mainshock, which nucleated on the edge of the seismic activation area. We should consider when accelerating seismicity of 3 < M < 5 events appears within the low b-value area.
Our results show that the spatiotemporal seismicity variations during the preparation process of impending earthquakes could display a distinctive pattern corresponding to the tectonic setting.
In the systematic correlation analysis for searching the optimal model parameters, we calculate various combinations of r0 (ranging between 25 and 80 km with a step of 2.5 km) and t0 (ranging between 0.25 and 2.0 years with a step of 0.05 years). As the correlation coefficient criterion C0 is set, we can calculate the ratio W (or weight) of the combination with correlation coefficients equal to or larger than C0 for each model parameter of r0i (i=1–m; m=23) and t0j (j=1–n; n=36). Then, the contour map for the ratio W is generated, as shown in Fig. A1.
where the logical function I(Φ) is defined as
As the criterion ratio W0 is set, the optimal model parameters, and , can be obtained by the following formulas:
Using event no. 6 as an example, we considered criterion coefficient C0 = 0.6 and criterion ratio W0 = 0.5, which indicates that at least 50 % of the total combination pairs had a correlation coefficient . Then, we obtained = 50.0 km and = 1.14 years (diamond in Fig. A1) by averaging the parameter values that passed the criterion.
In addition, Nagao et al. (2011) proposed the RTM algorithm to reduce the dual effect of the distance (ri) by introducing the new factor
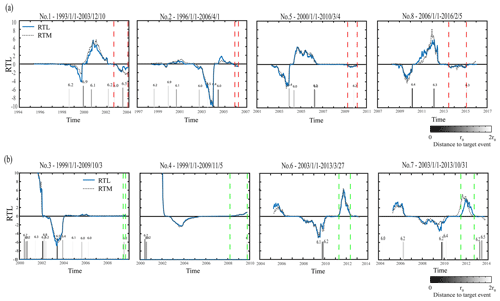
where Mi is the earthquake magnitude of the ith prior event. Here, we also calculate the RTM function of each investigated event with the same characteristic parameter set of the RTL model, and both functions display very similar trends with minor differences, as shown in Fig. A2. The reason for this could be that, for these eight events, no large earthquakes occurred in the vicinity of the epicenter. The bar chart in Fig. A2, which represents the occurrence time of M ≥ 6.0 events within a distance of 2r0 from the target event, also supports this explanation.
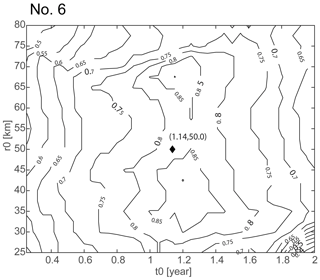
Figure A1Contour map of ratio W for various combinations of model parameters of r0 and t0, with C0 = 0.6 for event no. 6. The diamond shows the optimal model parameters as selecting criterion ratio W0 = 0.5.
Code used in this research can be obtained from the first author upon reasonable request.
The seismic data are available in Taiwan Geophysical Database Management System (GDMS; https://gdmsn.cwb.gov.tw/, Central Weather Bureau, 2022).
Conceptualization: YYW and CCC. Investigation: YYW and WTL. Validation, formal analysis and writing (original draft preparation): YYW. Writing (review and editing): YYW, CCC and SW.
The contact author has declared that none of the authors has any competing interests.
Publisher’s note: Copernicus Publications remains neutral with regard to jurisdictional claims in published maps and institutional affiliations.
We thank the Taiwan Geophysical Database Management System (GDMS), developed by the Central Weather Bureau (CWB) of Taiwan, for providing seismic data.
The Taiwan Earthquake Center (TEC) contribution number for this article is 00183.
This research has been supported by the National Science and Technology Council, Taiwan (grant nos. MOST 110-2116-M-194-018 and MOST 111-2116-M-194-020).
This paper was edited by Oded Katz and reviewed by three anonymous referees.
Central Weather Bureau: https://gdmsn.cwb.gov.tw/, last access: March 2022.
Chan, C. H., Wu, Y. M., Tseng, T. L., Lin, T. L., and Chen, C. C.: Spatial and temporal evolution of b-values before large earthquakes in Taiwan, Tectonophysics, 532, 215–222, 2012.
Chen, C.-C.: Accelerating seismicity of moderate-size earthquakes before the 1999 Chi-Chi, Taiwan, earthquake: Testing time-prediction of the self-organizing spinodal model of earthquakes, Geophys. J. Int., 155, F1–F5, https://doi.org/10.1046/j.1365-246X.2003.02071.x, 2003.
Chen, C. C. and Wu, Y. X.: An improved region–time–length algorithm applied to the 1999 Chi-Chi, Taiwan earthquake, Geophys. J. Int., 166, 1144–1147, https://doi.org/10.1111/j.1365-246X.2006.02975.x, 2006.
Chen, C.-C., Rundle, J. B., Holliday, J. R., Nanjo, K. Z., Turcitte, D. L., Li, S. C., and Tiampo, K. F.: The 1999 Chi-Chi, Taiwan, earthquake as a typical example of seismic activation and quiescence, Geophys. Res. Lett., 32, L22315, https://doi.org/10.1029/2005GL023991, 2005.
Chen, J. S., Ching, K. E., Rau, R. J., Hu, J. C., Cheng, K. C., Chang, W. L., Chuang, R. Y., Chen, C. L., and Chen, H. C.: Surface deformation in Taiwan during 2002–2017 determined from GNSS and precise leveling measurements, Central Geological Survey Special Publication, 33, 157–178, 2018 (in Chinese with English abstract).
Chen, K. H., Toda, S., and Rau, R. J.: A leaping, triggered sequence along a segmented fault: the 1951 Hualien – Taitung earthquake sequence in eastern Taiwan, J. Geophys. Res., 113, B02304, https://doi.org/10.1029/2007JB005048, 2008.
Chen, S. K., Wu, Y. M., Hsu, Y. J., and Chan, Y. C.: Current crustal deformation reassessed by cGPS strain-rate estimation and focal mechanism stress inversion, Geophys. J. Int., 210, 228–239. https://doi.org/10.1093/gji/ggx165, 2017.
Ching, K. E., Johnson, K. M., Rau, R. J., Chuang, R. Y., Kuo, L. C., and Leu, P. L.: Inferred fault geometry and slip distribution of the 2010 Jiashian, Taiwan, earthquake is consistent with a thick-skinned deformation model, Earth Planet. Sc. Lett., 301, 78–86, https://doi.org/10.1016/j.epsl.2010.10.021, 2011.
Deffontaines, B., Lee, J.-C., Angelier, J., Carvalho, J., and Rudant, J.-P.: New geomorphic data on the active Taiwan orogen: a multisource approach, J. Geophys. Res., 99, 20243–20266, 1994.
Deffontaines, B., Lacombe, O., Angelier, J., Mouthereau, F., Lee, C. T., Deramond, J., Lee, J. F., Yu, M. S., and Liu, P. M.: Quaternary transfer faulting in Taiwan Foothills: evidence from a multisource approach, Tectonophysics, 274, 61–82, 1997.
Dieterich, J., Cayol, V., and Okubo, P.: The use of earthquake rate changes as a stress meter at Kilauea volcano, Nature, 408, 457–460, 2000.
Dieterich, J. H.: A constitutive law for rate of earthquake production and its application to earthquake clustering, J. Geophys. Res., 99, 2601–2618, 1994.
Dominguez, S., Avouac, J. P., and Michel, R.: Horizontal coseismic deformation of the 1999 Chi-Chi earthquake measured from SPOT satellite images: implications for the seismic cycle along the western foothills of central Taiwan, J. Geophys. Res., 108, B22083, https://doi.org/10.1029/2001JB000951, 2003.
Gardner, J. K. and Knopoff, L.: Is the sequence of earthquakes in Southern California, with aftershocks removed, Poissonian?, B. Seismol. Soc. Am., 64, 1363–1367, 1974.
Gutenberg, B. and Richter, C. F.: Frequency of earthquakes in California, B. Seismol. Soc. Am., 34, 185–188, 1944.
Hsu, Y. J., Simons, M., Yu, S. B., Kuo, L. C., and Chen, H. Y.: A two-dimensional dislocation model for interseismic deformation of the Taiwan mountain belt, Earth Planet. Sc. Lett., 211, 287–294, 2003.
Hsu, Y. J., Yu, S. B., Simons, M., Kuo, L. C., and Chen, H. Y.: Interseismic crustal deformation in the Taiwan plate boundary zone revealed by GPS observations, seismicity, and earthquake focal mechanisms, Tectonophysics, 479, 4–18, https://doi.org/10.1016/j.tecto.2008.11.016, 2009.
Hsu, Y. J., Kao, H., Bürgmann, R., Lee, Y. T., Huang, H. H., Hsu, Y. F., and Zhuang, J.: Synchronized and asynchronous modulation of seismicity by hydrological loading: A case study in Taiwan, Sci. Adv., 7, eabf7282, https://doi.org/10.1126/sciadv.abf7282, 2021.
Huang, Q. and Ding, X.: Spatiotemporal variations of seismic quiescence prior to the 2011 M 9.0 Tohoku earthquake revealed by an improved Region-Time-Length algorithm, B. Seismol. Soc. Am., 102, 1878–1883, https://doi.org/10.1785/0120110343, 2012.
Huang, Q., Sobolev, G. A., and Nagao, T.: Characteristics of the seismic quiescence and activation patterns before the M = 7.2 Kobe earthquake, Tectonophysics, 337, 99–116, 2001.
Kao, H., Huang, G. C., and Liu, C. S.: Transition from oblique subduction to collision in the northern Luzon arc-Taiwan region: Constraints from bathymetry and seismic observations, J. Geophys. Res., 105, 3059–3079, 2000.
Kasahara, K.: Earthquake Mechanics, Cambridge Univ. Press., Cambridge, 248 pp., ISBN 0-521-22736-4, 1981.
Lee, S. J., Chen, H. W., and Ma, K. F.: Strong Ground Motion Simulation of the 1999 Chi-Chi, Taiwan, Earthquake from a Realistic 3D Source and Crustal Structure, J. Geophys. Res., 112, B06307, https://doi.org/10.1029/2006JB004615, 2007.
Liao, W. Y., Lee, E. J., Mu, D., Chen, P., and Rau, R. J.: ARRU phase picker: Attention recurrent-residual U-Net for picking seismic P-and S-phase arrivals, Seismol. Res. Lett., 92, 2410–2428, 2021.
Lin, D.-H., Chen, H., Rau, R.-J., and Hu, J.-C.: The role of a hidden fault in stress triggering: Stress interactions within the 1935 Mw 7.1 Hsinchu–Taichung earthquake sequence in central Taiwan, Tectonophysics, 601, 37–52, https://doi.org/10.1016/j.tecto.2013.04.022, 2013.
Lu, W. T.: Seismicity Changes Prior to the M > 6 Earthquakes in Taiwan During 1993 to 2016 – an Approach of the RTL Algorithm, MSc thesis, National Chung Cheng University, Taiwan, p. 66, 2017 (in Chinese with English abstract).
Mignan, A. and Giovambattista, R. Di: Relationship between accelerating seismicity and quiescence, two precursors to large earthquakes, Geophys. Res. Lett., 35, L15306, https://doi.org/10.1029/2008GL035024, 2008.
Nagao, T., Takeuchi, A., and Nakamura, K.: A new algorithm for the detection of seismic quiescence: introduction of the RTM algorithm, a modified RTL algorithm, Earth Planets Space, 63, 315–324, https://doi.org/10.5047/eps.2010.12.007, 2011.
Rau, R. J., Lee, J. C., Ching, K. E., Lee, Y. H., Byrne, T. B., and Chen, R. Y.: Subduction-continent collision in southwestern Taiwan and the 2010 Jiashian earthquake sequence, Tectonophysics, 578, 107–116, https://doi.org/10.1016/j.tecto.2011.09.013, 2012.
Rundle, J. B., Klein, W., Turcotte, D. L., and Malamud, B. D.: Precursory seismic activation and critical point phenomena, Pure Appl. Geophys., 157, 2165–2182, https://doi.org/10.1007/PL00001079, 2000.
Rundle, J. B., Turcotte, D. L., Shcherbakov, R., Klein, W., and Sammis, C.: Statistical physics approach to understanding the multiscale dynamics of earthquake fault systems, Rev. Geophys., 41, 1019, https://doi.org/10.1029/2003RG000135, 2003.
Simoes, M., Avouac, J. P., Beyssac, O., Goffe, B., Farley, K. A., and Chen, Y. G.: Mountain building in Taiwan: a thermokinematic model, J. Geophys. Res., 112, B11405, https://doi.org/10.1029/2006JB004824, 2007.
Shi, Y. and Bolt, B. A.: The standard error of the magnitude-frequency b value, B. Seismol. Soc. Am., 72, 1677–1687, 1982.
Shyu, J. B. H., Sieh, K., and Chen, Y.-G.: Tandem suturing and disarticulation of the Taiwan orogen revealed by its neotectonic elements, Earth Planet. Sc. Lett., 233, 167–177, 2005a.
Shyu, J. B. H., Sieh, K., Chen, Y.-G., and Liu, C.-S.: Neotectonic architecture of Taiwan and its implications for future large earthquakes, J. Geophys. Res., 110, B08402, https://doi.org/10.1029/2004JB003251, 2005b.
Sobolev, G. A. and Tyupkin, Y. S.: Low-seismicity precursors of large earthquakes in Kamchatka, Volc. Seismol., 18, 433–446, 1997.
Sobolev, G. A. and Tyupkin, Y. S.: Precursory phases, seismicity precursors, and earthquake prediction in Kamchatka, Volc. Seismol., 20, 615–627, 1999.
Suppe, J.: Kinematics of arc-continent collision, flipping of subduction, and backarc spreading near Taiwan, Mem. Geol. Soc. China, 21–33, 1984.
Wang, J. H.: The Taiwan Telemetered Seismographic Network, Phys. Earth Planet. Inter., 58, 9–18, 1989.
Wang, J. H., Chen, K. C., and Lee, T. Q.: Depth distribution of shallow earthquakes in Taiwan, J. Geol. Soc. China, 37, 125–142, 1994.
Wen, Y.-Y. and Chen, C.-C.: Seismicity variations prior to the 2016 ML 6.6 Meinong, Taiwan earthquake, Terr. Atmos. Ocean. Sci., 28, 737–742, https://doi.org/10.3319/TAO.2016.12.05.01, 2017.
Wen, Y.-Y., Chen, C.-C., Wu, Y.-H., Chan, C.-H., Wang, Y.-J., and Yeh, Y.-L.: Spatiotemporal investigation of seismicity and Coulomb stress variations prior to the 2010 ML 6.4 Jiashian, Taiwan earthquake, Geophys. Res. Lett., 43, 8451–8457, https://doi.org/10.1002/2016GL070633, 2016.
Wu, Y. H.: An improved region–time–length algorithm applied to the 1999 Chi-Chi, Taiwan earthquake, MSc thesis, National Central University, Taiwan, p. 115, 2006 (in Chinese with English abstract).
Wu, Y. M. and Chiao, L. Y.: Seismic Quiescence before the 1999 Chi-Chi, Taiwan, Mw 7.6 Earthquake, B. Seismol. Soc. Am., 96, 321–327, https://doi.org/10.1785/0120050069, 2006.
Wu, Y. M., Chen, C.-C., Zhao, L., and Chang, C.-H.: Seismicity characteristics before the 2003 Chengkung, Taiwan, earthquake, Tectonophysics, 457, 177–182, https://doi.org/10.1016/j.tecto.2008.06.007, 2008.
Wu, Y. M., Chen, S. K., Huang, T. C., Huang, H.-H., Chao, W. A., and Koulakov, I.: Relationship between earthquake b-values and crustal stresses in a young orogenic belt, Geophys. Res. Lett., 45, 1832–1837, https://doi.org/10.1002/2017GL076694, 2018.
Wyss, M. and Stefansson, R.: Nucleation points of recent mainshocks in Southern Iceland, mapped by b-values, B. Seismol. Soc. Am., 96, 599–608, 2006.
Yu, S. B., Chen, H. Y., and Kuo, L. C.: Velocity field of GPS stations in the Taiwan area, Tectonophysics, 274, 41–59, https://doi.org/10.1016/S0040-1951(96)00297-1, 1997.
Zhai, Q. S., Peng, Z. G., Chuang, L. Y., Wu, Y. M., Hsu, Y. J., and Wdowinski, S.: Investigating the Impacts of a Wet Typhoon on Microseismicity: A Case Study of the 2009 Typhoon Morakot in Taiwan Based on a Template Matching Catalog, J. Geophys. Res., 126, e2021JB023026, https://doi.org/10.1029/2021JB023026, 2021.


