the Creative Commons Attribution 4.0 License.
the Creative Commons Attribution 4.0 License.
 | 27 Apr 2023
Earthquake vulnerability assessment of the built environment in the city of Srinagar, Kashmir Himalaya, using a geographic information system
Midhat Fayaz
Shakil A. Romshoo
Irfan Rashid
Rakesh Chandra
The study investigates the earthquake vulnerability of buildings in Srinagar, an urban city in the Kashmir Himalaya, India. The city, covering an area of around 246 km2 and divided into 69 municipal wards, is situated in the tectonically active and densely populated mountain ecosystem. Given the haphazard development and high earthquake vulnerability of the city, it is critical to assess the vulnerability of the built environment to inform policy-making for developing effective earthquake risk reduction strategies. Integrating various parameters in a geographic information system (GIS) using the analytical hierarchical process (AHP) and technique for order preference by similarity to an ideal solution (TOPSIS) approaches, the ward-wise vulnerability of the buildings revealed that a total of ∼ 17 km2 area (∼ 7 % area; 23 wards) has very high to high vulnerability, moderate vulnerability affects ∼ 69 km2 of the city area (28 % area; 19 wards), and ∼ 160 km2 area (∼ 65 % area; 27 wards) has vulnerability ranging from very low to low. Overall, the downtown wards are most vulnerable to earthquake damage due to the high risk of pounding, high building density, and narrower roads with little or no open spaces. The modern uptown wards, on the other hand, have lower earthquake vulnerability due to the relatively wider roads and low building density. To build a safe and resilient city for its 1.5 million citizens, the knowledge generated in this study would inform action plans for developing earthquake risk reduction measures, which should include strict implementation of the building codes, retrofitting of the vulnerable buildings, and creating a disaster consciousness among its citizenry.
- Article
(14233 KB) - Full-text XML
- BibTeX
- EndNote


Among all the natural disasters, earthquakes are unique in the way that they occur without any warning (Langenbach, 2009) and are a major hindrance in the way of achieving sustainable development. Cities are growing fast all over the world through a process of urbanization, and more than half of the world's population lives in urban areas (Ritchie and Roser, 2018). Earthquakes cause immense loss of life and damage to properties, livelihoods, economic infrastructures, and communities, particularly in major urban centres (Kjekstad and Highland, 2009). Urban earthquake vulnerability has increased over the years due to the increasing complexity of the urban built environment (Düzgün et al., 2009; Riedel et al., 2015). The high earthquake susceptibility of urban centres is also due to their situation in hazard-prone locations (Duzgun et al., 2011; Mir et al., 2017), haphazard urbanization (Jena et al., 2020), and growing population (Beck et al., 2012), and that has attracted the attention of emergency planners for estimating the seismic risk associated with future earthquakes (Kontoes et al., 2012). Surveys have shown that collapsing buildings and other physical structures during an earthquake cause huge social, economic, and human losses (Panahi et al., 2014). The dynamic interaction between different urban components and the diverse forms of vulnerability prove that vulnerability is inherently a spatial problem (Hashemi and Alesheikh, 2012). Furthermore, the earthquake vulnerability of a building is an important parameter to consider in the evaluation of the potential earthquake damage in urban fabrics (Amini et al., 2009). Thus, the assessment of earthquake vulnerability of the built environment is crucial for any city located in an earthquake risk zone to better characterize and understand the inherent weakness and vulnerabilities of a city against earthquakes and to help prioritize preparedness and risk mitigation activities.
Structural vulnerabilities to earthquakes have arisen in the Kashmir valley in the recent decades, as the traditional construction materials and practices have been abandoned in favour of new ones (Yousuf et al., 2020). The lurking threat of an earthquake in the past had a great influence on the way people traditionally used to build their houses in the Kashmir valley (Langenbach, 2009; Ahmad et al., 2017). The traditional wooden-frame structures were designed to deal with earthquake threat to provide a safe and suitable built environment for people. The buildings constructed with wood substantially reduce the weight of buildings and provide structural flexibility compared to those of the other types of materials used in building construction (Alih and Vafaei, 2019). The traditional building types such as “Taq” and “Dhajji-Dewari” are earthquake resistant. In the Taq type buildings, wooden runners are placed at each floor level that tie the walls and the floor together, whereas the Dhajji-Dewari buildings consist of a braced timber frame with masonry infill that is placed diagonally in the walls. The timber braced frames offer stable confinement to the infill masonry as long as they rest together (Hicyilmaz et al., 2012). When compared to more contemporary building types, the Dhajji-Dewari constructions are more earthquake resistant because the seismic energy is dissipated between the mortar joints, the frame, and the infill rather than through non-linear deformations. Recently, the traditional ways of constructing houses have been replaced mostly by concrete types, thereby increasing the vulnerability of the structures to earthquakes. The residential buildings in the Kashmir valley are mostly built by local semi-skilled masons who do not have adequate technical expertise in building earthquake-resistance infrastructure, and therefore these structures lack the basic earthquake risk reduction features, including seismic resistance properties as otherwise prescribed in the building codes. It is therefore of utmost importance to assess the earthquake vulnerability of all the existing buildings in the Kashmir valley, comprising both traditional and modern construction types, since the valley falls in Seismic Zones IV or V (Ali and Ali, 2020). Despite the high vulnerability of the Kashmir valley to earthquakes, no initiative has been taken by the government agencies, non-government agencies, and the scientific community to develop an earthquake risk assessment strategy for the valley, which would inform urban development planning in the region to minimize the damage in the eventuality of an earthquake, as has been done in other vulnerable Himalayan areas of the country like Delhi, Dehradun, and Kolkata (Pathak, 2008; Nath et al., 2015; Rautela et al., 2015; Sinha et al., 2016). This study is therefore the first of its kind aimed at assessing the earthquake vulnerability of the built environment in the capital city of Jammu and Kashmir, i.e. Srinagar.
Many national and international studies have been conducted to estimate the physical vulnerability of the built environment by applying various techniques, viz. MCDM (multi-criteria decision-making), AHP (analytical hierarchical process), and ANN (artificial neural networking) (Jena et al., 2020; Jena and Pradhan, 2020; Lee et al., 2019; Alizadeh et al., 2018). Rashed and Weeks (2003) studied the physical vulnerability parameters in Tabriz, Iran, such as age and height of the buildings and earthquake intensity, which are major contributors in assessing the vulnerability of buildings. Erden and Karaman (2012) investigated the impact of systemic vulnerability parameters, such as topography, distance to the epicentre, soil classification, liquefaction, and fault/focal mechanism, using the AHP approach for earthquake vulnerability assessment of the Küçükekmeçe region of Istanbul, Turkey. Pathak (2008) carried out the earthquake vulnerability assessment of the city of Guwahati using rapid visual screening (RVS) by taking into account demand–capacity computation and structural and non-structural damage grade indexing. Nath et al. (2015) used geotechnical, seismological, and geological data to assess the seismic risk of the city of Kolkata. They used land use/land cover, population density, building typology, building age, and height of buildings for earthquake vulnerability assessment. Sinha et al. (2016) used the Spatial Multi-Criteria Analysis and Ranking Tool (SMART) methodology and classified the capital city of India, Delhi, as highly vulnerable to earthquakes using different physical parameters like number of storeys, year-built range, area, occupancy, and construction type. The earthquake vulnerability of the cities of Nainital and Mussoorie in the Uttarakhand state, India, was assessed by Rautela et al. (2015), employing the RVS methodology. Ahmad et al. (2012) used the experimental and analytical studies to investigate the vulnerability of the half-dressed rubble stone (DS) masonry structures in the Himalayas using the shake table method and fragility analysis of buildings. The study concluded that about 40 % of buildings can collapse in the eventuality of a large earthquake. The collapse rate of buildings can go up as high as 80 % if the epicentre of an earthquake is closer to the settlement. Baruah et al. (2020) have assessed the seismic vulnerability of the mega-city Shillong in India using RVS methodology by including parameters like building typology, local geology, geomorphology, slope angle, and population, suggesting that 60 % of the city falls under moderate to high vulnerability zones. Jena et al. (2021) carried out an analysis of the earthquake vulnerability of the Indian subcontinent using the LSTM (long short-term memory) model and multi-criterion analysis (MCA), which suggested that highly vulnerable areas are situated towards the northern and eastern parts of India. The study, conducted at a coarse scale, classified Jammu and Kashmir, of which the study area is a part, as highly vulnerable with a moderate to high earthquake vulnerability index.
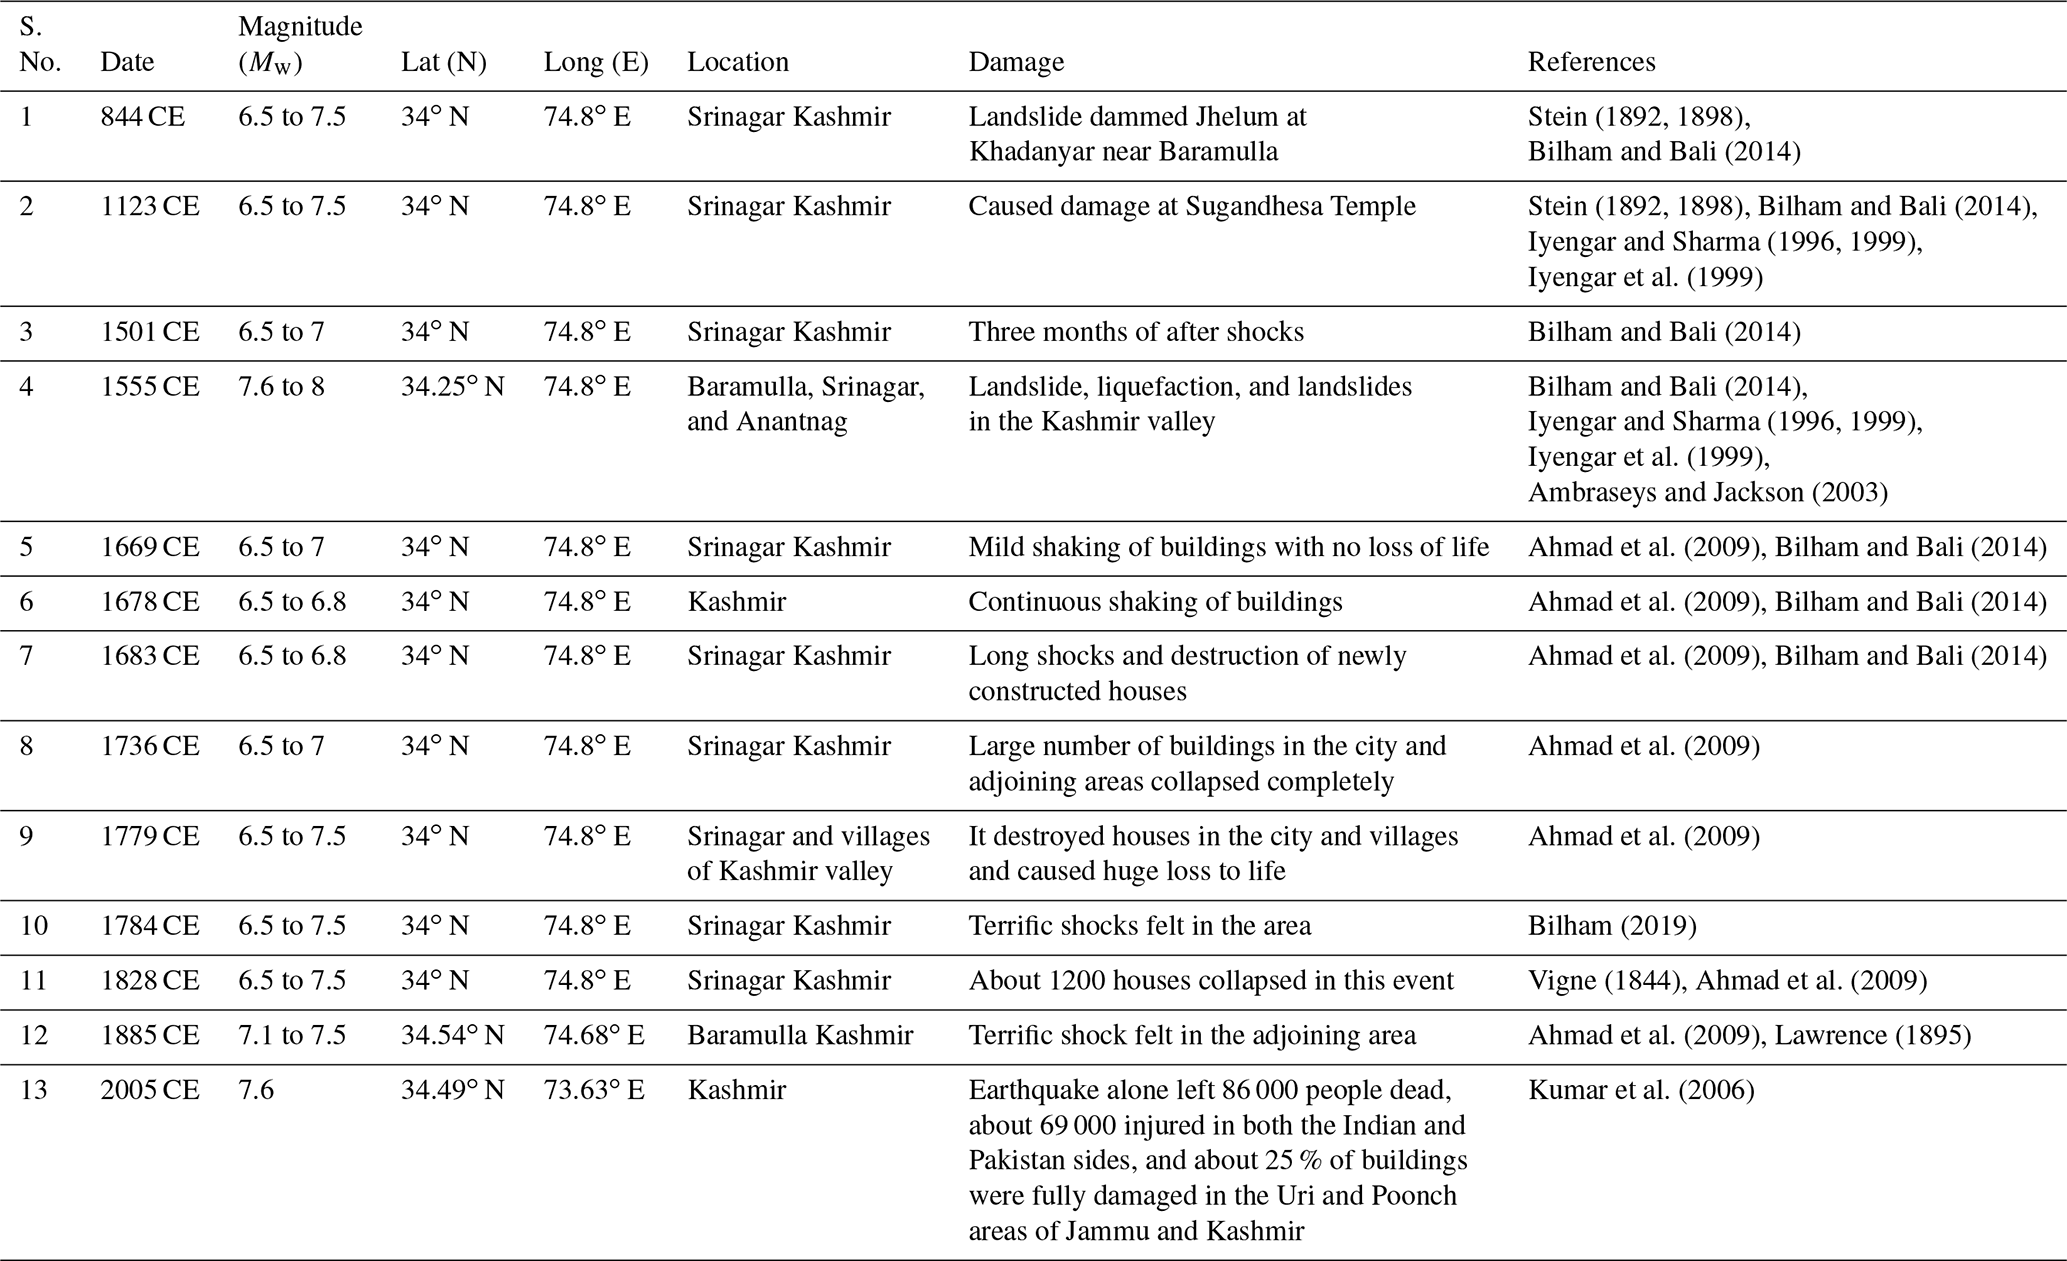
The present study therefore addresses the knowledge gap through the assessment of earthquake vulnerability of the built environment at a spatial high resolution, i.e. ward level, in order to identify the vulnerable areas of Srinagar, a major, rapidly growing and seismically vulnerable urban centre in the Kashmir valley. The location of an earthquake epicentre is related to the presence of geological structures (faults) in a particular area (Sana, 2018). The available historical and instrumental records of the earthquake events (Table 1) in the study area indicated a high probability of future earthquakes in the city of Srinagar. Dar et al. (2019) have shown that the Jhelum River, running through the city of Srinagar, itself flows along or parallel to the Jhelum fault at many places in the Kashmir valley. The city is predominantly located on the recent alluvium and Karewas with Panjal traps at some locations (Dar et al., 2015) and has a seismic hazard index (SHI) and liquefaction potential index (LPI) ranging from high to very high (Sana and Nath, 2016; Sana, 2018; Yousuf et al., 2020). It is assumed that, due to the past occurrence of earthquakes with epicentres in and around Srinagar and the almost uniform distribution of other geological, geomorphic, and soil parameters in the city, all the city wards would be equally vulnerable in the event of an earthquake. As a result, these parameters were kept constant and were not considered in the vulnerability analysis because the primary goal of this study was to assess earthquake vulnerability at the ward level. Based on the literature survey, expert opinion, and analyses of the available data, a set of six important indicators, such as building geometry, density, height, typology, pounding possibility, and road network, were selected in this study for assessing earthquake vulnerability of the built-up environment in the city. The structural vulnerability assessment of the city of Srinagar, which is located in the high earthquake-prone zone, will inform urban planning and development strategies in order to create a safe and secure built environment with adequate green and open spaces, as well as make the city sustainable, as envisioned under UNDP Sustainable Development Goal (SDG) 11 for sustainable cities and communities.
Srinagar, spread over an area of 246 km2, lies between 74∘43′ and 74∘52′ E longitudes and 34∘0′ and 34∘14′ N latitudes and is divided into 69 administrative wards (Fig. 1). The city is situated at an average elevation of 1713 m a.m.s.l. along the banks of the centrally flowing Jhelum River. The city of Srinagar, home to around 1.5 million people, is an economic hub, a seat of administration, and an important urban centre in the Kashmir Himalaya (Parry et al., 2012). The population of the city is projected to increase to 1.83 million by 2031 (Farooq and Muslim, 2014). The city is susceptible to high seismic hazards due to its peculiar geological setting (Sana, 2018), urban setting (Gupta et al., 2020), demographic profile, and tectonic setting (Chandra et al., 2018). The city is surrounded by Himalayan boundary faults, which are capable of generating destructive earthquakes that are well-documented in the historical archives and recent instrumental records as well (Sana, 2018; Gupta et al., 2020). There is a formidable history of earthquakes that have shaken Srinagar in the past millennium and have caused huge loss of human life and property (Table 1) (Rajendran and Rajendran, 2005; Langenbach, 2007; Bilham et al., 2010; Bilham, 2019; Yousuf et al., 2020). Though Srinagar is an old and historic city, the city grew organically without following any physical plan or building codes for the construction of its built infrastructure (Yousuf et al., 2020). Post-1947, the city grew very fast, mostly in a haphazard manner with no proper urban planning. The first master plan for the city was developed in 1971, followed by master plans for the 2000–2021 and 2022–2035 periods. However, all the previous plans did not have effective implementation in the city as per the master plan prescriptions because of the problems in the planning and implementation setup, including an inadequate legal framework and institutional structures. Furthermore, there is a distinct cultural and socio-economic inequality within the city, with the lower-middle income groups residing in the densely populated downtown wards and the upper-middle class and wealthy people residing in the uptown wards of the city. In such a situation, assessing ward-wise earthquake vulnerability of the built environment is highly critical for prioritizing risk reduction activities to reduce the earthquake vulnerability of the people and infrastructure in the city (Mouroux and Brun, 2006; Mili et al., 2018).
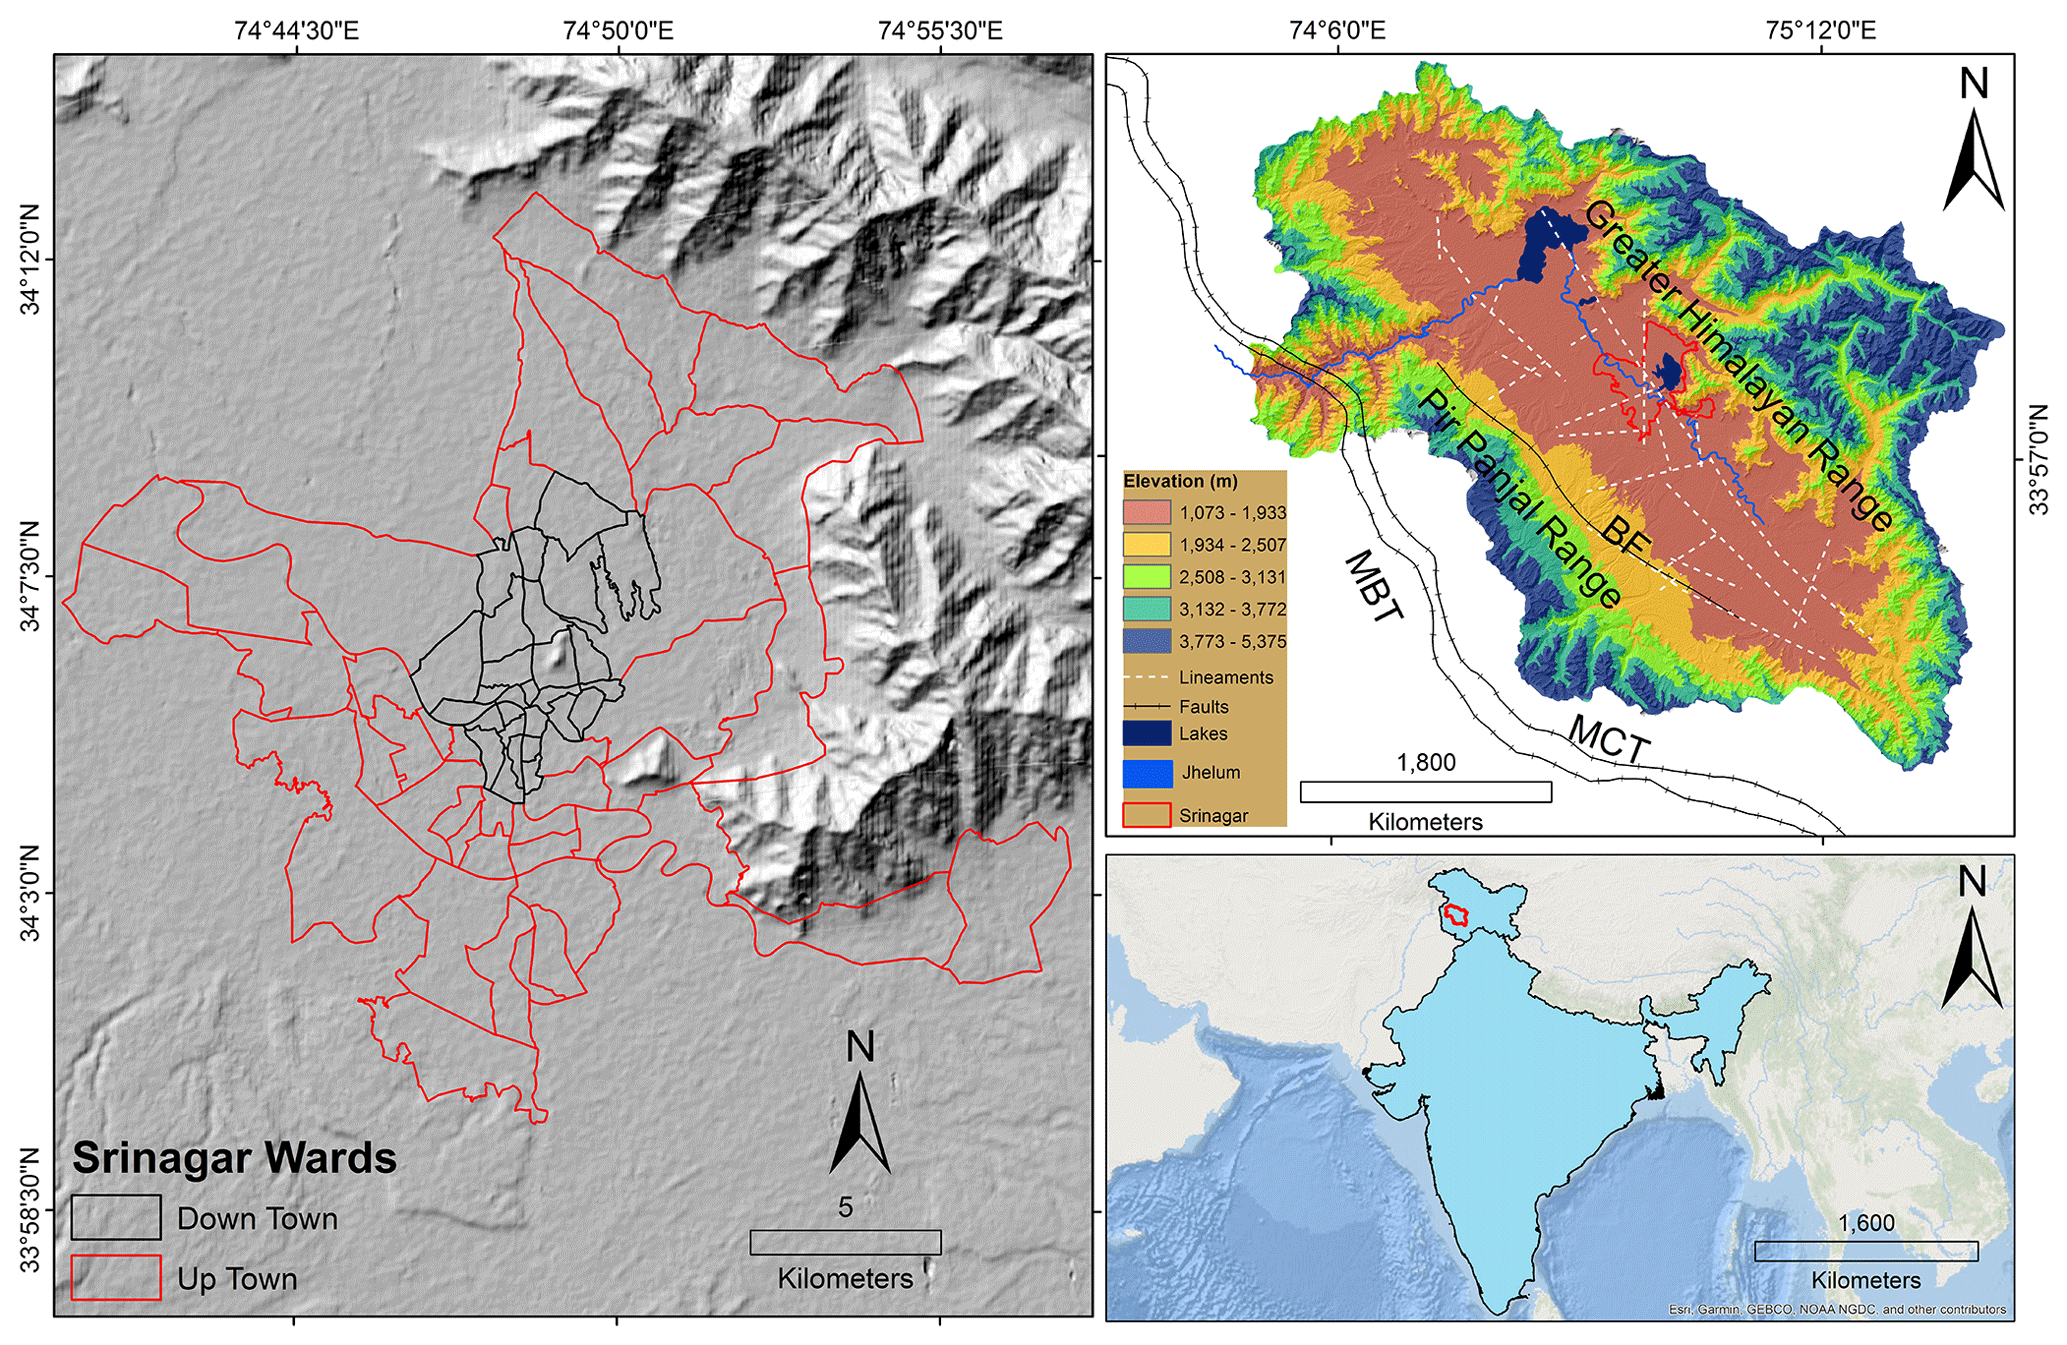
Figure 1Location of the study area. Here, the MBT stands for Main Boundary Thrust, MCT for the Main Central Thrust, and BF stands for the Balapur fault.
Table 1Records of the historical and instrumental earthquake events in the Kashmir valley.
The availability of high-spatial-resolution satellite images with a ground pixel size of 1 m opens up new possibilities for mapping individual features such as buildings (Li et al., 2019). To accomplish this study, ortho-rectified Cartosat-2 data of 2016–2017, having a spatial resolution of 1 m, were utilized to extract the spatial information of the built environment in Srinagar. The very high-resolution Cartosat-2 data have the potential to map individual buildings at a large scale (Sandhu et al., 2021).
3.1 Building inventory
Keeping in view the advantages of the manual digitization of features from satellite images over the digital image processing, the visual interpretation method was employed for delineating buildings and associated land use and land cover (Rashid et al., 2017). Various image interpretation elements, viz. tone, texture, pattern, size, shape, etc., supplemented by Google Earth were used to map the building footprint of the city on high-resolution Cartosat-2 data at a scale of 1:1000. All the buildings, roads, water bodies, and other associated urban built-up areas are included in the mapped features. The individual building footprints were accurately mapped; however, delineating the complex geometrical shape in unplanned dense and very dense built-up areas proved to be a difficult task (Sandhu et al., 2021). As a result, rather than individual building footprints, building blocks were digitized in the densely populated areas towards the centre of the downtown wards where the edges of the buildings become indistinguishable, causing difficulty in extracting individual building footprints. Following the evaluation in the field, these structures were thereafter segregated and corrected. Furthermore, all of the city's major roads were easily identifiable; however, the extractions of minor roads, particularly in the densely built-up downtown wards, were difficult to map due to their narrower widths and the metallic rooftop canopy of the adjacent building concealing the narrow alleys. The vector layer with the associated attributes like height, building use, typology, and number of building floors was created by combining the remote sensing data and field data. The high-resolution maps of the building footprint and road network were then utilized to critically assess the ward-wise earthquake vulnerability of buildings in the city.
3.2 Building vulnerability indicators
The vulnerability of the built environment determines its earthquake risk. Building collapse causes major damage during an earthquake. Thus, faulty building structures and the use of unsafe materials are some of the major causes of damage during an earthquake (Lantada et al., 2009). Assessment of the earthquake vulnerability of individual buildings and neighbourhoods is a complex process (Langenbach, 2009; Agrawal and Chourasia, 2007) and involves consideration of numerous parameters, which are described as follows.
3.2.1 Building height
Because of its antiquity, tradition, heritage, and significance, the built environment in different wards of Srinagar shows a remarkable diversity (Meier and Will, 2008). Building height has a substantial impact on earthquake response and the level of structural damage (Kircher et al., 1997; Priestley, 2000). Buildings with a lower height-to-surface area ratio are more earthquake resistant, and vice versa (Alizadeh et al., 2018). As a result, high-rise buildings with a smaller surface area are more vulnerable to earthquake damage. When these types of buildings shake and swing during an earthquake, they have a higher probability of pounding. Extensive ward-by-ward field surveys were conducted to generate a comprehensive building height map of the city. During the field surveys, the number of floors of the randomly selected buildings from each ward in the city were surveyed and counted. For the building height estimation during the field surveys, three types of buildings were considered: single-storey, double-storey, and triple- or multiple-storey buildings. The field data were then combined in a geographic information system (GIS) database.
3.2.2 Masonry building
The traditional construction practices are considered outmoded, insubstantial, and indicative of poverty in developing countries (Langenbach, 2009). As a result, people are moving away from the traditional types and methods of construction and adopting the modern practices and types of buildings with bricks, cement blocks, and stones. Masonry buildings, as they are known, are extremely vulnerable to earthquakes (Alam and Haque, 2018). The disappearance of traditional construction and buildings in Srinagar and the rise of the contemporary masonry construction practices have made the city more vulnerable to earthquakes. A physical survey of the buildings was conducted to determine the type of buildings for the physical vulnerability assessment of masonry buildings in the city (Rahman et al., 2015). The pattern of buildings along the main and link roads was surveyed during the fieldwork because a majority of the buildings in the city are masonry. The presence of non-masonry building types was recorded using the Trimble Juno 5B handheld GPS having 2–4 m accuracy, which was then combined with GIS data to estimate the proportion of various masonry building types in the city.
3.2.3 Pounding possibility
One of the most common causes of structural damage during an earthquake is the pounding between neighbouring buildings (Anagnostopoulos, 1988). Pounding occurs when two or more buildings, situated close to each other, collide during an earthquake (Alam and Haque, 2018). Every building has its natural frequency and swings correspondingly during an earthquake (Lu et al., 2017; Jia et al., 2018). If the distance between buildings is insufficient, the buildings cannot swing freely, resulting in local thrashing of the structures (Gioncu and Mazzolani, 2010). Due to the location of the city of Srinagar in a seismically active region, its socio-economic setup, unplanned urbanization, and faulty land-use planning (Yousuf et al., 2020), Srinagar faces a significant risk of structural damage from pounding during an earthquake. To determine the potential of pounding in Srinagar, we employed a methodology that requires a minimum separation distance of 4 % of the building height between two buildings (FEMA, 1998). The pounding potential was calculated using the following equation:
where S is the minimum separation distance between the buildings, and h1 and h2 are the heights of two adjacent buildings.
3.2.4 Building geometry
The earthquake damage to a building also depends on its geometry. Compared to regular structures, buildings having geometrical irregularities, such as a tall height-to-width ratio, a large length-to-width ratio, or a large offset in plan and elevation, perform poorly and sustain significant damage during earthquakes (Alih and Vafaei, 2019). We employed high-resolution Cartosat-2 data and validated them against the field data to generate a building geometry map of the city. The remote sensing data were pre-processed, and the edge enhancement technique was used for highlighting the edges of buildings (Somvanshi et al., 2018; Huang et al., 2019). The geometry map of the city was then generated using manual digitization of the building edges, which was later validated in the field.
3.2.5 Road network
Urban roadways are a complex network that is extremely vulnerable to disruption in the event of natural disasters such as earthquakes (Golla et al., 2020). Roads play an important role in the post-earthquake response and recovery phase. Roadblocks caused by earthquakes not only have a negative impact on post-earthquake emergency services but also isolate specific areas of cities where basic amenities such as hospitals, shelters, and other critical services are situated (Balijepalli and Oppong, 2014). Thus, the mapping of roads is essential for assessing the earthquake vulnerability of a city. Using the manual digitization technique, all roads in Srinagar were mapped from the high-resolution satellite data at a scale of 1:1000. Because the buildings in Srinagar are not built in a planned manner, the majority of the roads are small and narrower and are classified into three categories: less than 8 ft, 8 to 16 ft, and more than 16 ft roads (Alam and Haque, 2018). Roads with a width of less than 8 ft are considered particularly vulnerable.
3.2.6 Building density
In addition to the aforementioned parameters, the building density of an urban area has a significant impact on its structural vulnerability (Bahadori et al., 2017). The more densely built a place is, the more vulnerable it is to earthquakes (Jena and Pradhan, 2020). For all the wards of Srinagar, the building density was determined as the number of buildings per unit area. For building density mapping, we used 1 m high-resolution Cartosat data, which were then draped onto Google Earth imagery for validation. The building density was also validated during the extensive field surveys.
3.3 Field validation
Comprehensive ground-truth surveys were conducted in all the wards of the city to validate the building inventory GIS database. Because there are so many buildings and their area is so large, ward-wise validation of the delineated buildings was done using the stratified random sampling method. It was ensured that the validation sites were well-distributed throughout the ward (Han et al., 2020). For field data collection, a pro forma metric was developed to collect data such as latitude, longitude, building use, number of floors, and construction type. The position of individual buildings in every ward was identified on the building inventory map during field surveys through visual observation and using GPS coordinates, and the locations were documented (Ahmad et al., 2009). A total of 8000 field validation points were collected throughout the city (Fig. 2), and the physical attributes of each building were inspected externally to determine various building parameters. After the field surveys, the building inventory database was updated to match the ground-truth data.
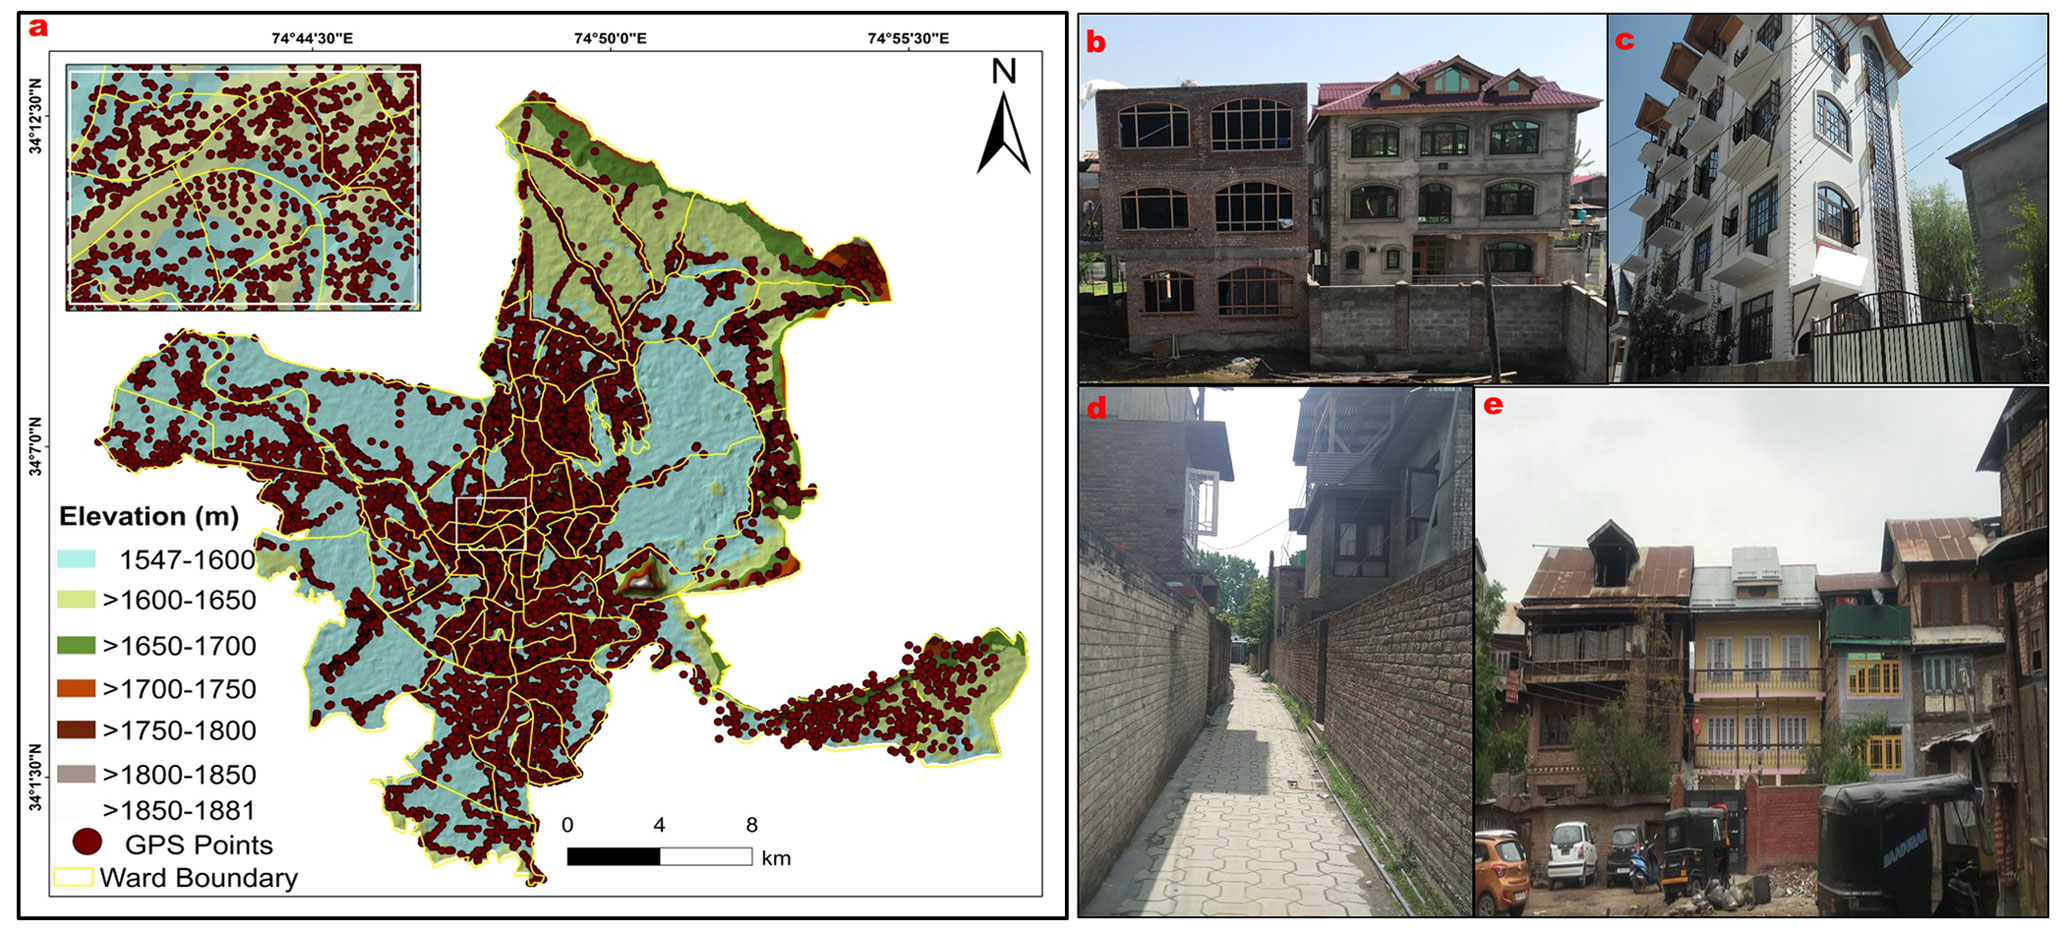
Figure 2(a) Field validation map showing the distribution of ground samples, with the inset showing the density of samples. The elevation of the study area is based on the ASTER DEM data. Field photographs: (b) a modern masonry construction practice adopted in a residential area, (c) a commercial building with large windowpanes, (d) the narrower roads in the city centre, and (e) the buildings with insufficient or no separation distance.
3.4 Analytical hierarchical process (AHP) approach
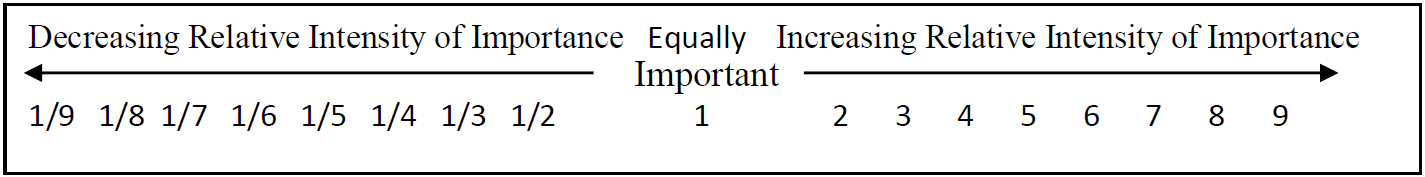
Due to its simplicity and rationality (Rezaie and Panahi, 2015; Alam and Mondal, 2019), the AHP is a widely used multi-criteria decision-making method (MCDM) for disaster vulnerability assessment. It considers both qualitative and quantitative parameters to develop a hierarchical solution decision-making among various alternatives and their sub-categories. The analytical hierarchical process (AHP) weights parameters and sub-parameters based on expert opinion, ensuring transparency and consideration of local-specific conditions of a study area that global indices cannot (Füssel, 2010). There are three key assessment steps in the AHP. The first step is to create binary comparison matrices on a scale of 1–9 (Saaty, 1980), where 1 indicates that two parameters are equally important, 9 indicates that one parameter is extremely important, and 1/9 indicates that the parameter is of the least importance. Table 2 shows the scale of importance. The AHP was used to create indices that measured spatial variations in structural vulnerability ward by ward across Srinagar.
In the second step, the weights of different factors are determined from a row-multiplied value (RMV) in unnormalized and normalized values using Eqs. (2) and (3).
where mi refers to the unnormalized value of the ith parameter, and n represents the total influential parameters.
The third and most important step of this approach is to compute the consistency between judgements and weights. The consistency is calculated from the consistency index and consistency ratio employing Eqs. (4) and (5). If the consistency ratio is <0.1, the pairwise comparison matrix is consistent, and if it is >0.1, the pairwise comparison between indicators and sub-indicators must be iterated until a good consistency is achieved.
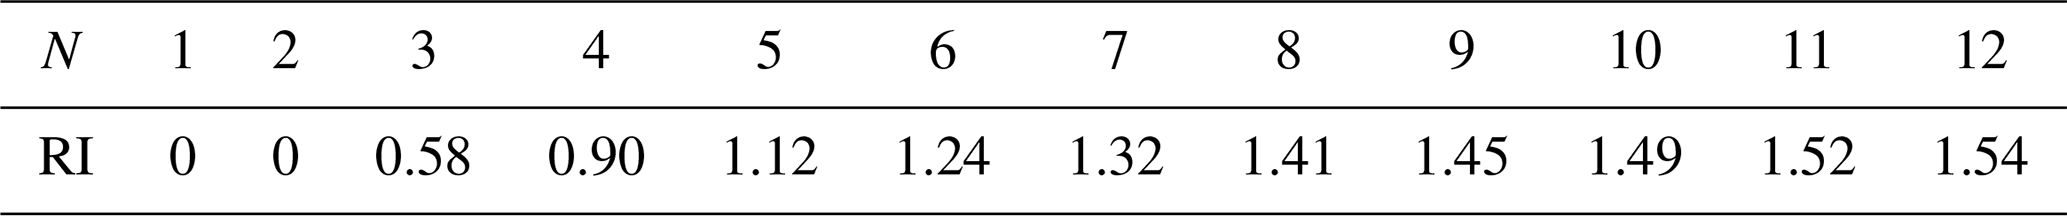
where L represents the eigenvalue of the pairwise comparison matrix, and RI is the random inconsistency index, which depends on the number of vulnerability assessment parameters (n) used in the assessment. The variation of RI values for a different number of parameters is shown in Table 3.
Table 3Random inconsistency indices (RIs) for n=1, 2...12 (after Saaty, 1980).
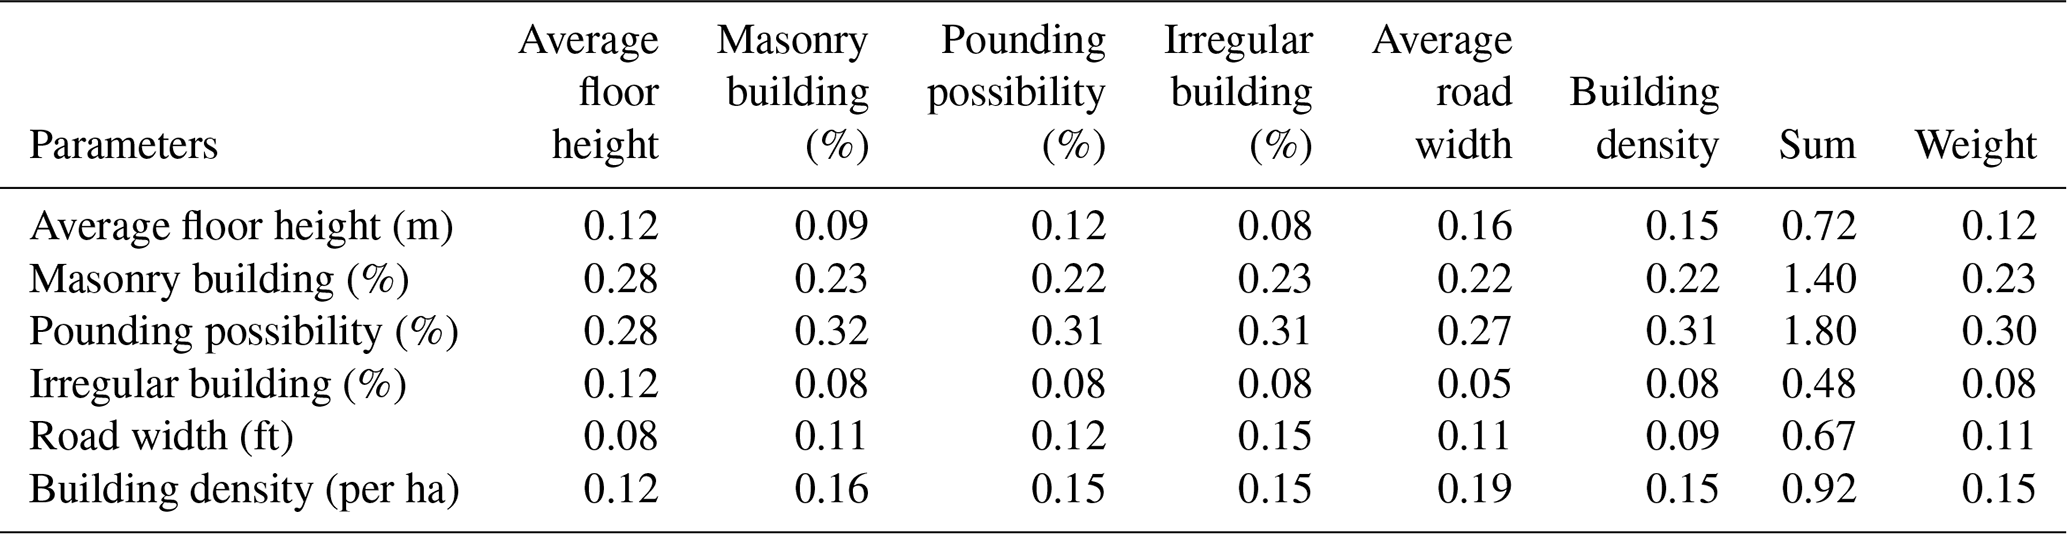
All four authors were involved in determining the expert judgement process, viz. Shakil Ahmad Romshoo, remote sensing and GIS; Irfan Rashid, environmental sciences; Rakesh Chandra, geology; and Midhat Fayaz, geoinformatics. Furthermore, a large body of literature was also consulted that informed the expert judgement process. Based on the multiple judgements, a comparison matrix of six earthquake vulnerability factors was established in this study (Yariyan et al., 2020). The geometric mean of expert opinions was then calculated to compile all of the opinions into a single matrix (Table 4). As a result, the factors are weighted and ranked on a scale of 0 to 1. The consistency ratio (CR) of 0.015 was achieved, which indicates consistency in the pairwise comparison of vulnerability factors (Saaty, 1980).
Table 4Pairwise matrix showing weights for each of the factors used in the AHP model.
3.5 Technique for order preference by similarity to ideal solution (TOPSIS) approach
The TOPSIS is a multi-criteria decision-making analysis (MCDA) method that chooses alternatives based on the distance between positive and negative ideal points (Hwang et al., 1993; Joshi and Kumar, 2014). The TOPSIS model is based on the concept that the chosen alternative should be the closest to the ideal solution while being the farthest from the negative ideal solution. The important steps involved in the TOPSIS approach are listed below.
-
Step 1: construction of the normalized decision matrix using Eq. (6).
where xij is the score of option i with respect to criterion j.
-
Step 2: construction of the weighted normalized decision matrix using Eq. (7):
where wj is the weight for each criterion.
-
Step 3: identifying the positive and negative ideal solutions. The positive (A+) and negative (A′) ideal solutions are defined according to the weighted decision matrix using Eqs. (8) and (9), respectively:
-
Step 4: calculating the separation distance of each alternative from the positive and negative ideal solution using Eqs. (10) and (11), respectively, after Hwang et al. (1993):
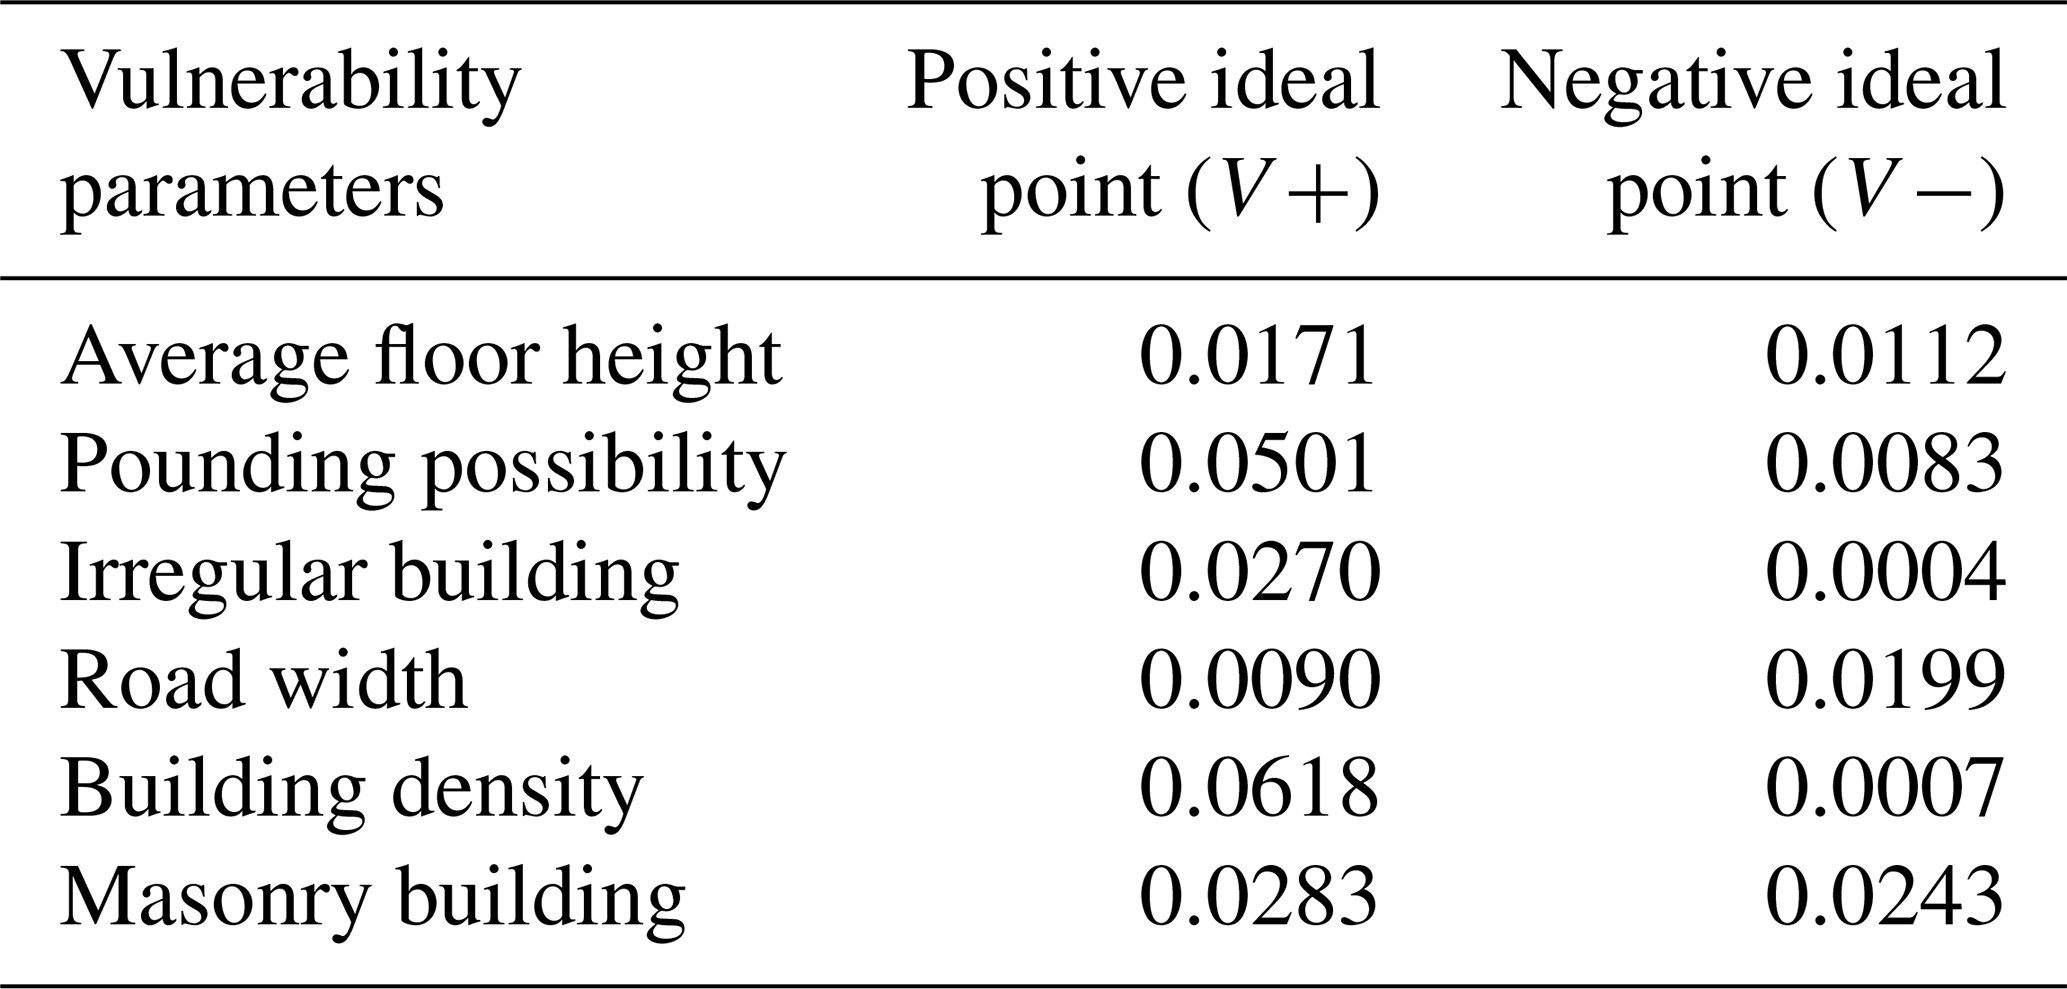
where is the distance from the ith alternative to the positive ideal point for the jth feature, and is the distance between the ith alternative and the negative ideal point for the jth feature and . The negative and positive ideal point for each seismic vulnerability factor is shown in Table 5.
-
Step 5: measuring the relative closeness of each parameter to the ideal solution using Eq. (12).
where, is a value between 0 and 1, and the closer the number is to 1, the closer the alternative is to the ideal condition. The positive ideal point in this study is the one with the maximum structural earthquake vulnerability, while the negative ideal point is the one with the lowest vulnerability. Furthermore, the closer an alternative value is to 1, the more vulnerable those limits are, and the closer it is to 0, the less vulnerable they are.
Based on the expert opinions, the AHP model was used to assign weights to all the parameters. Following that, the TOPSIS model was used to rank the wards after evaluating the best alternatives using mathematical calculations. Finally, the weighted and best alternative evaluated structural vulnerability parameters from both the AHP and TOPSIS models are combined in a GIS environment to create a ward-by-ward earthquake vulnerability map of the built environment in Srinagar. The integrative use of these two models reduces the uncertainty in the input data and improves accuracy and validity. Furthermore, decision-making based on the integrated use of the AHP and TOPSIS leads to more robust and effective outcomes for addressing the complex problems (Nyimbili et al., 2018). Many studies have recommended the integrated use of TOPSIS with AHP for determining criteria and conducting analyses regarding complex decision-making problems (Behzadian et al., 2012). Additionally, the integrated use of AHP and TOPSIS helps to resolve the weighting problem by incorporating expert opinions and preferences, thereby increasing the consistency of the outputs for arriving at consensus in decision-making in earthquake disaster vulnerability analysis (Nyimbili et al., 2018).
The adopted methodology has a few limitations, much like any other modelling technique. In addition to the inherent flaws in the MCDA, there may be some limitations, such as the fact that certain layers become more dominant than others due to the weighting criteria used, which in turn depends upon the expert perceptions about which of the vulnerability parameters have the greatest impact on modelling outcomes in the vulnerability analysis.
Table 5Positive and negative ideal points used in the TOPSIS model.
4.1 Analysis of building parameters
4.1.1 Building height
In the city, around 2.5 lakh buildings were mapped (Fig. 3), with nearly 86.4 % of the buildings being residential, 7.1 % being commercial, and the remaining ∼ 6.5 % having various uses and purposes such as educational, religious, defence, health and medical, and industrial. The analysis revealed that the single-storey buildings account for ∼ 8 % of all the buildings, double-storey buildings account for ∼ 50 %, and triple-storey buildings account for ∼ 42 %. However, only a small number (n=307, 0.12 %) of buildings have more than three floors. Of the 69 wards, 18 have an average of two floors, while 51 have an average of three floors.
The building height has a significant impact on the ward's vulnerability to earthquakes. A majority of the residential buildings in Srinagar have an average floor height of 3 m, whereas government offices and commercial buildings typically have an average floor height of 3.5 m. The lowest ward-wise average building height of 6.33 m was found in municipal ward A (BB Cantt), which is primarily a cantonment area used and administered for security and defence purposes. Ward number 50 (Lal Bazar) has the highest ward-wise average building height of 9.68 m. Figure 4 depicts the spatial distribution of ward-wise average building heights, with the average values provided in Table 6.
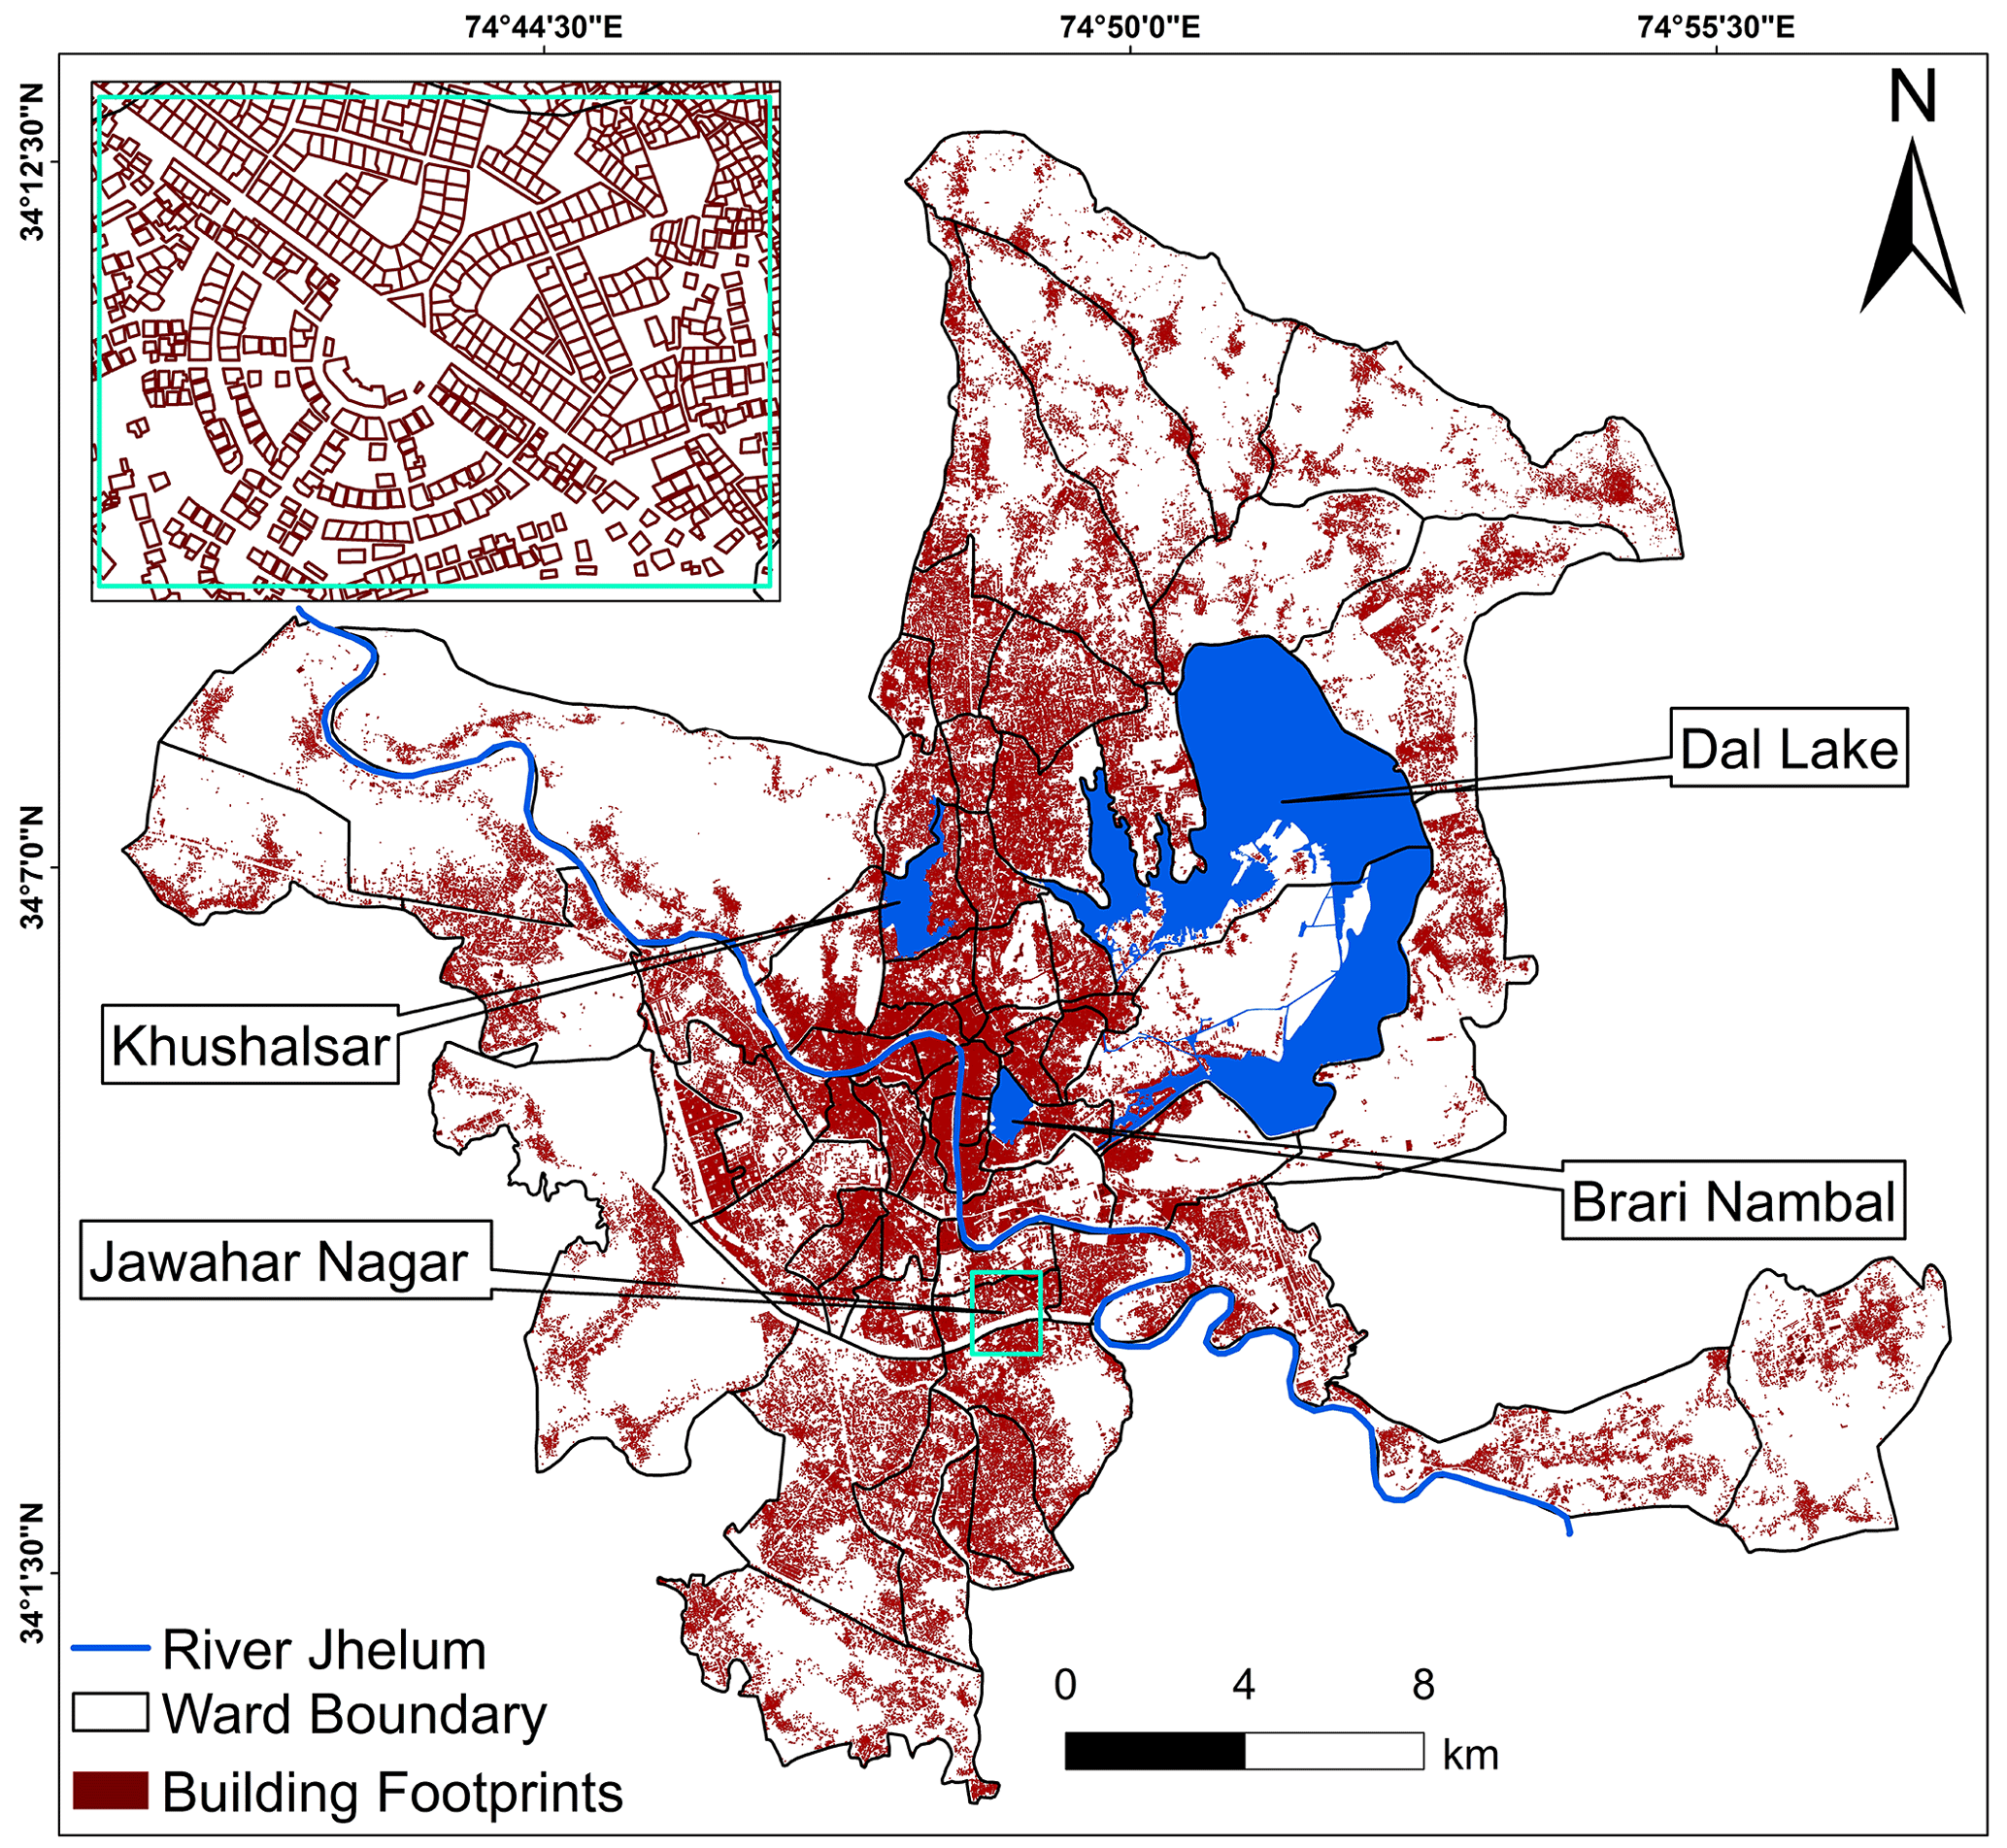
Figure 3Building footprint map of Srinagar.
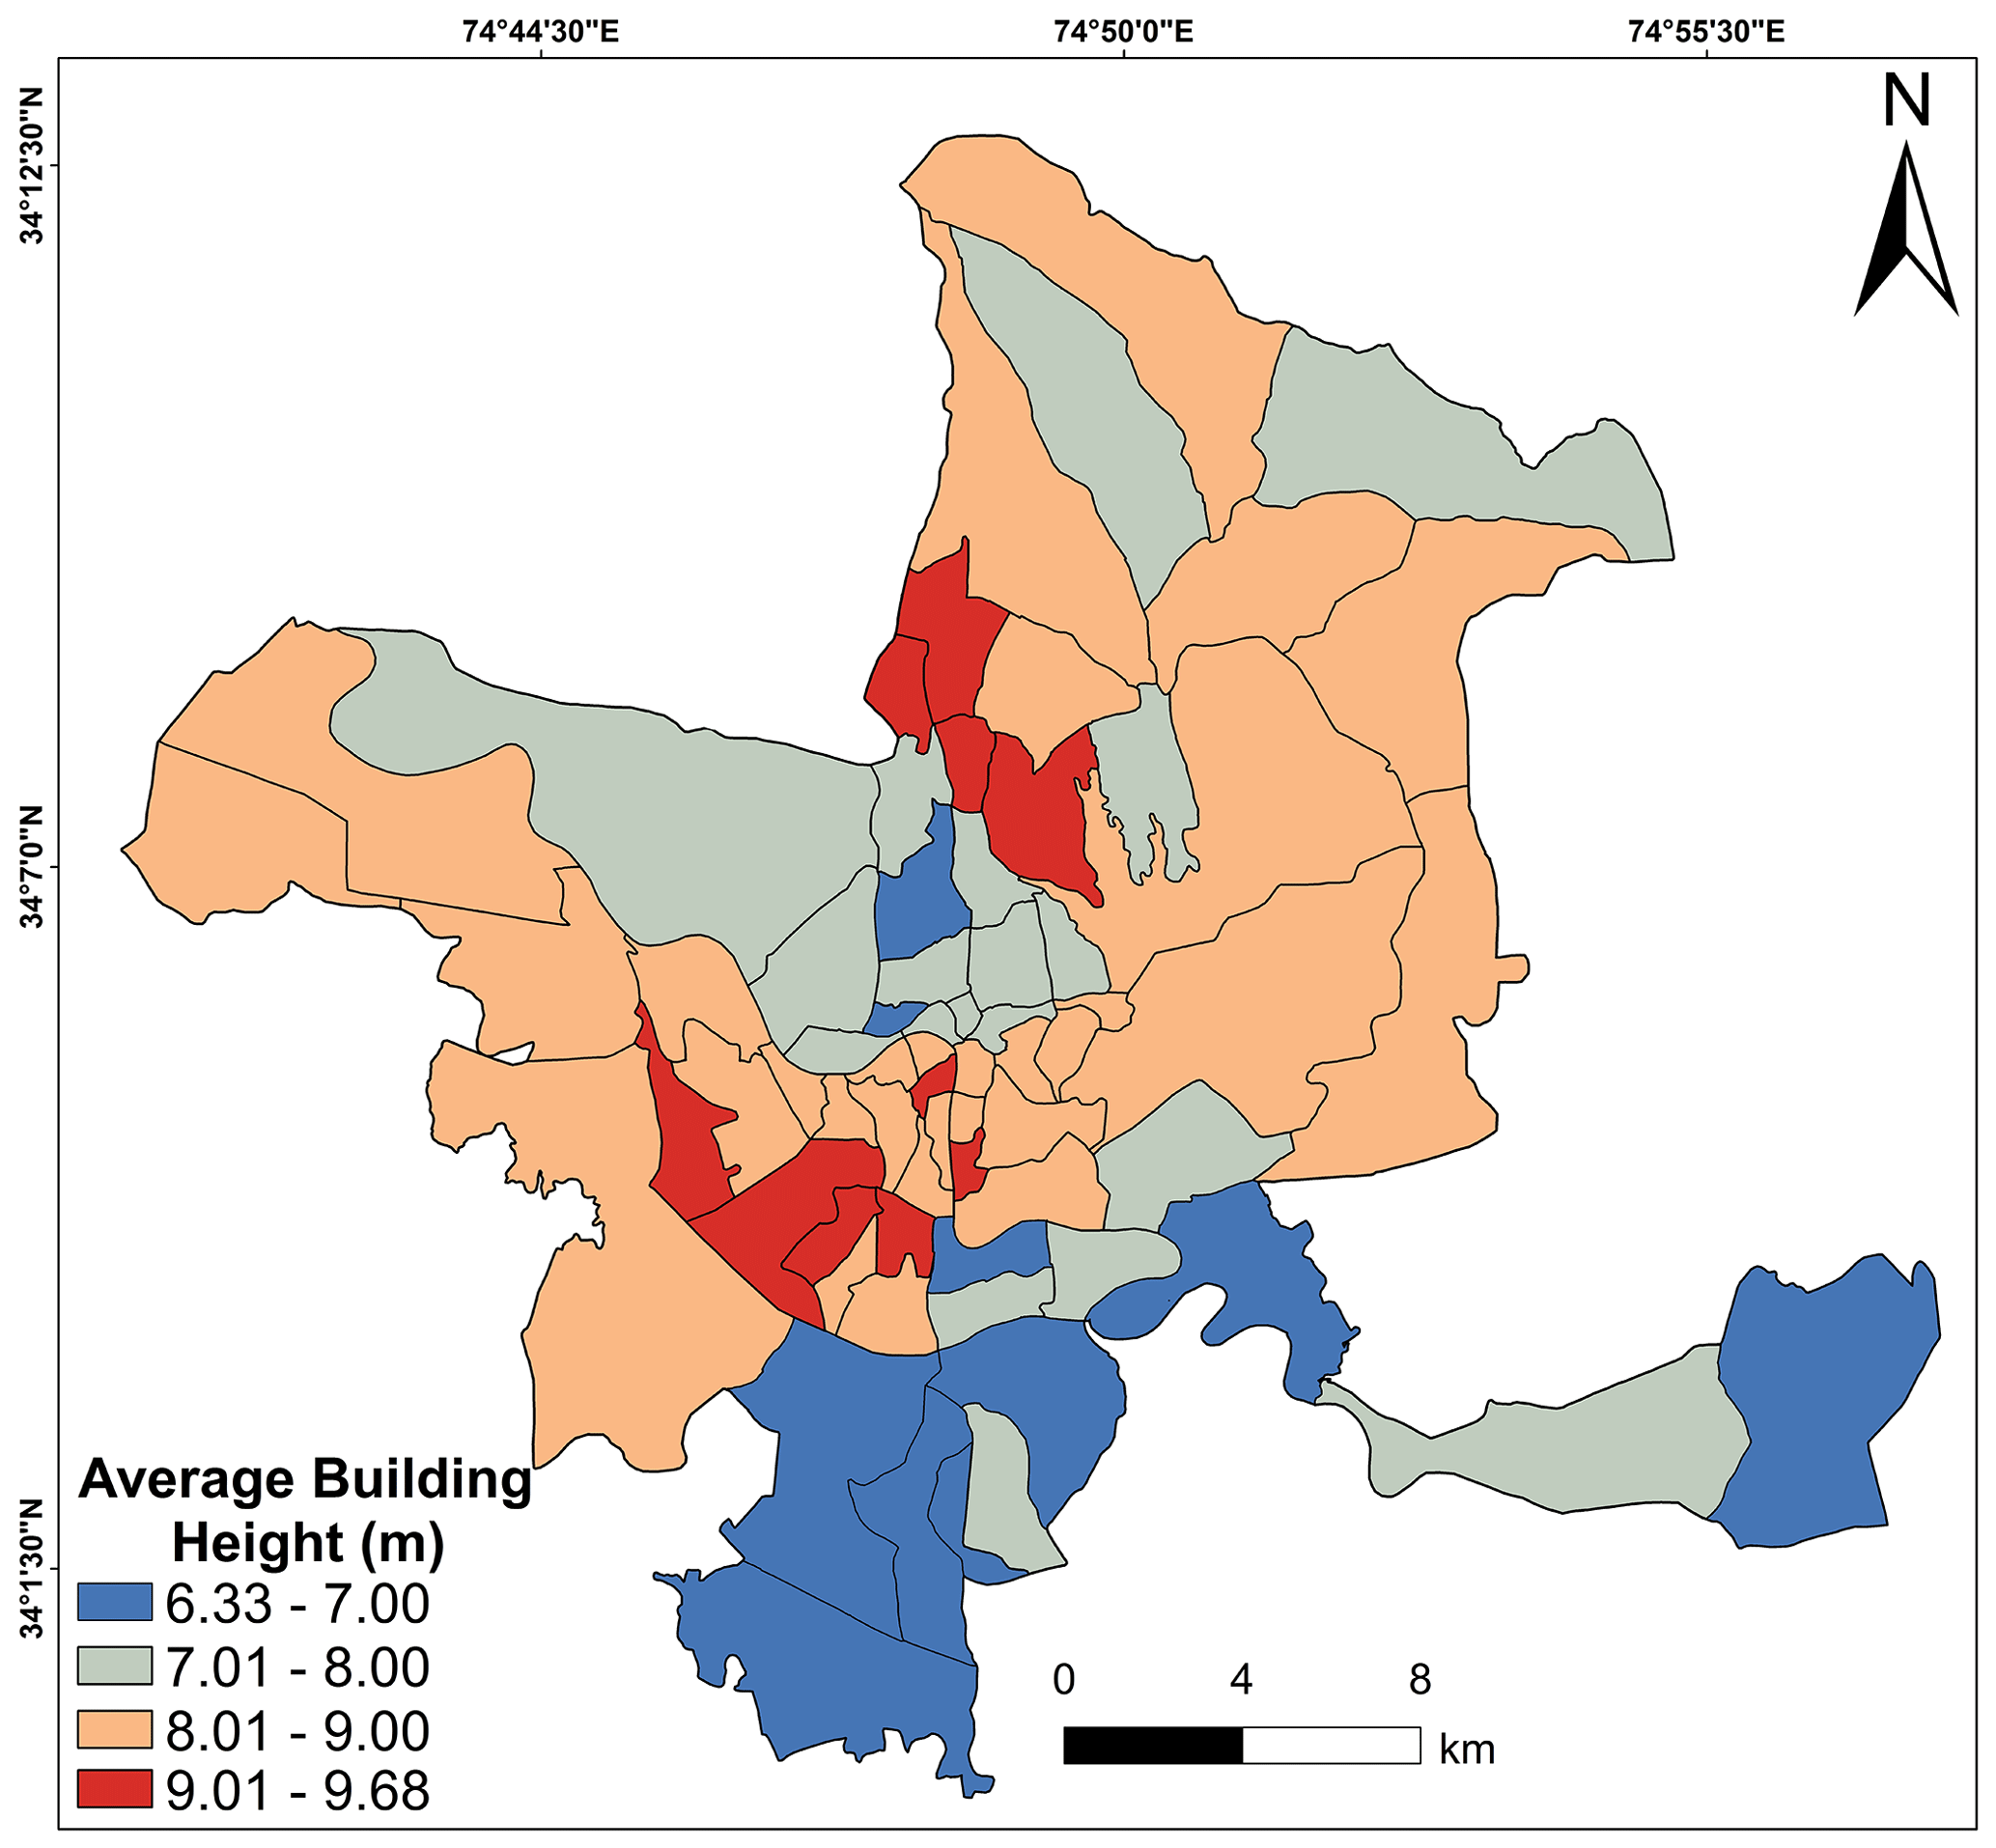
Figure 4Ward-wise distribution of average building height in Srinagar.
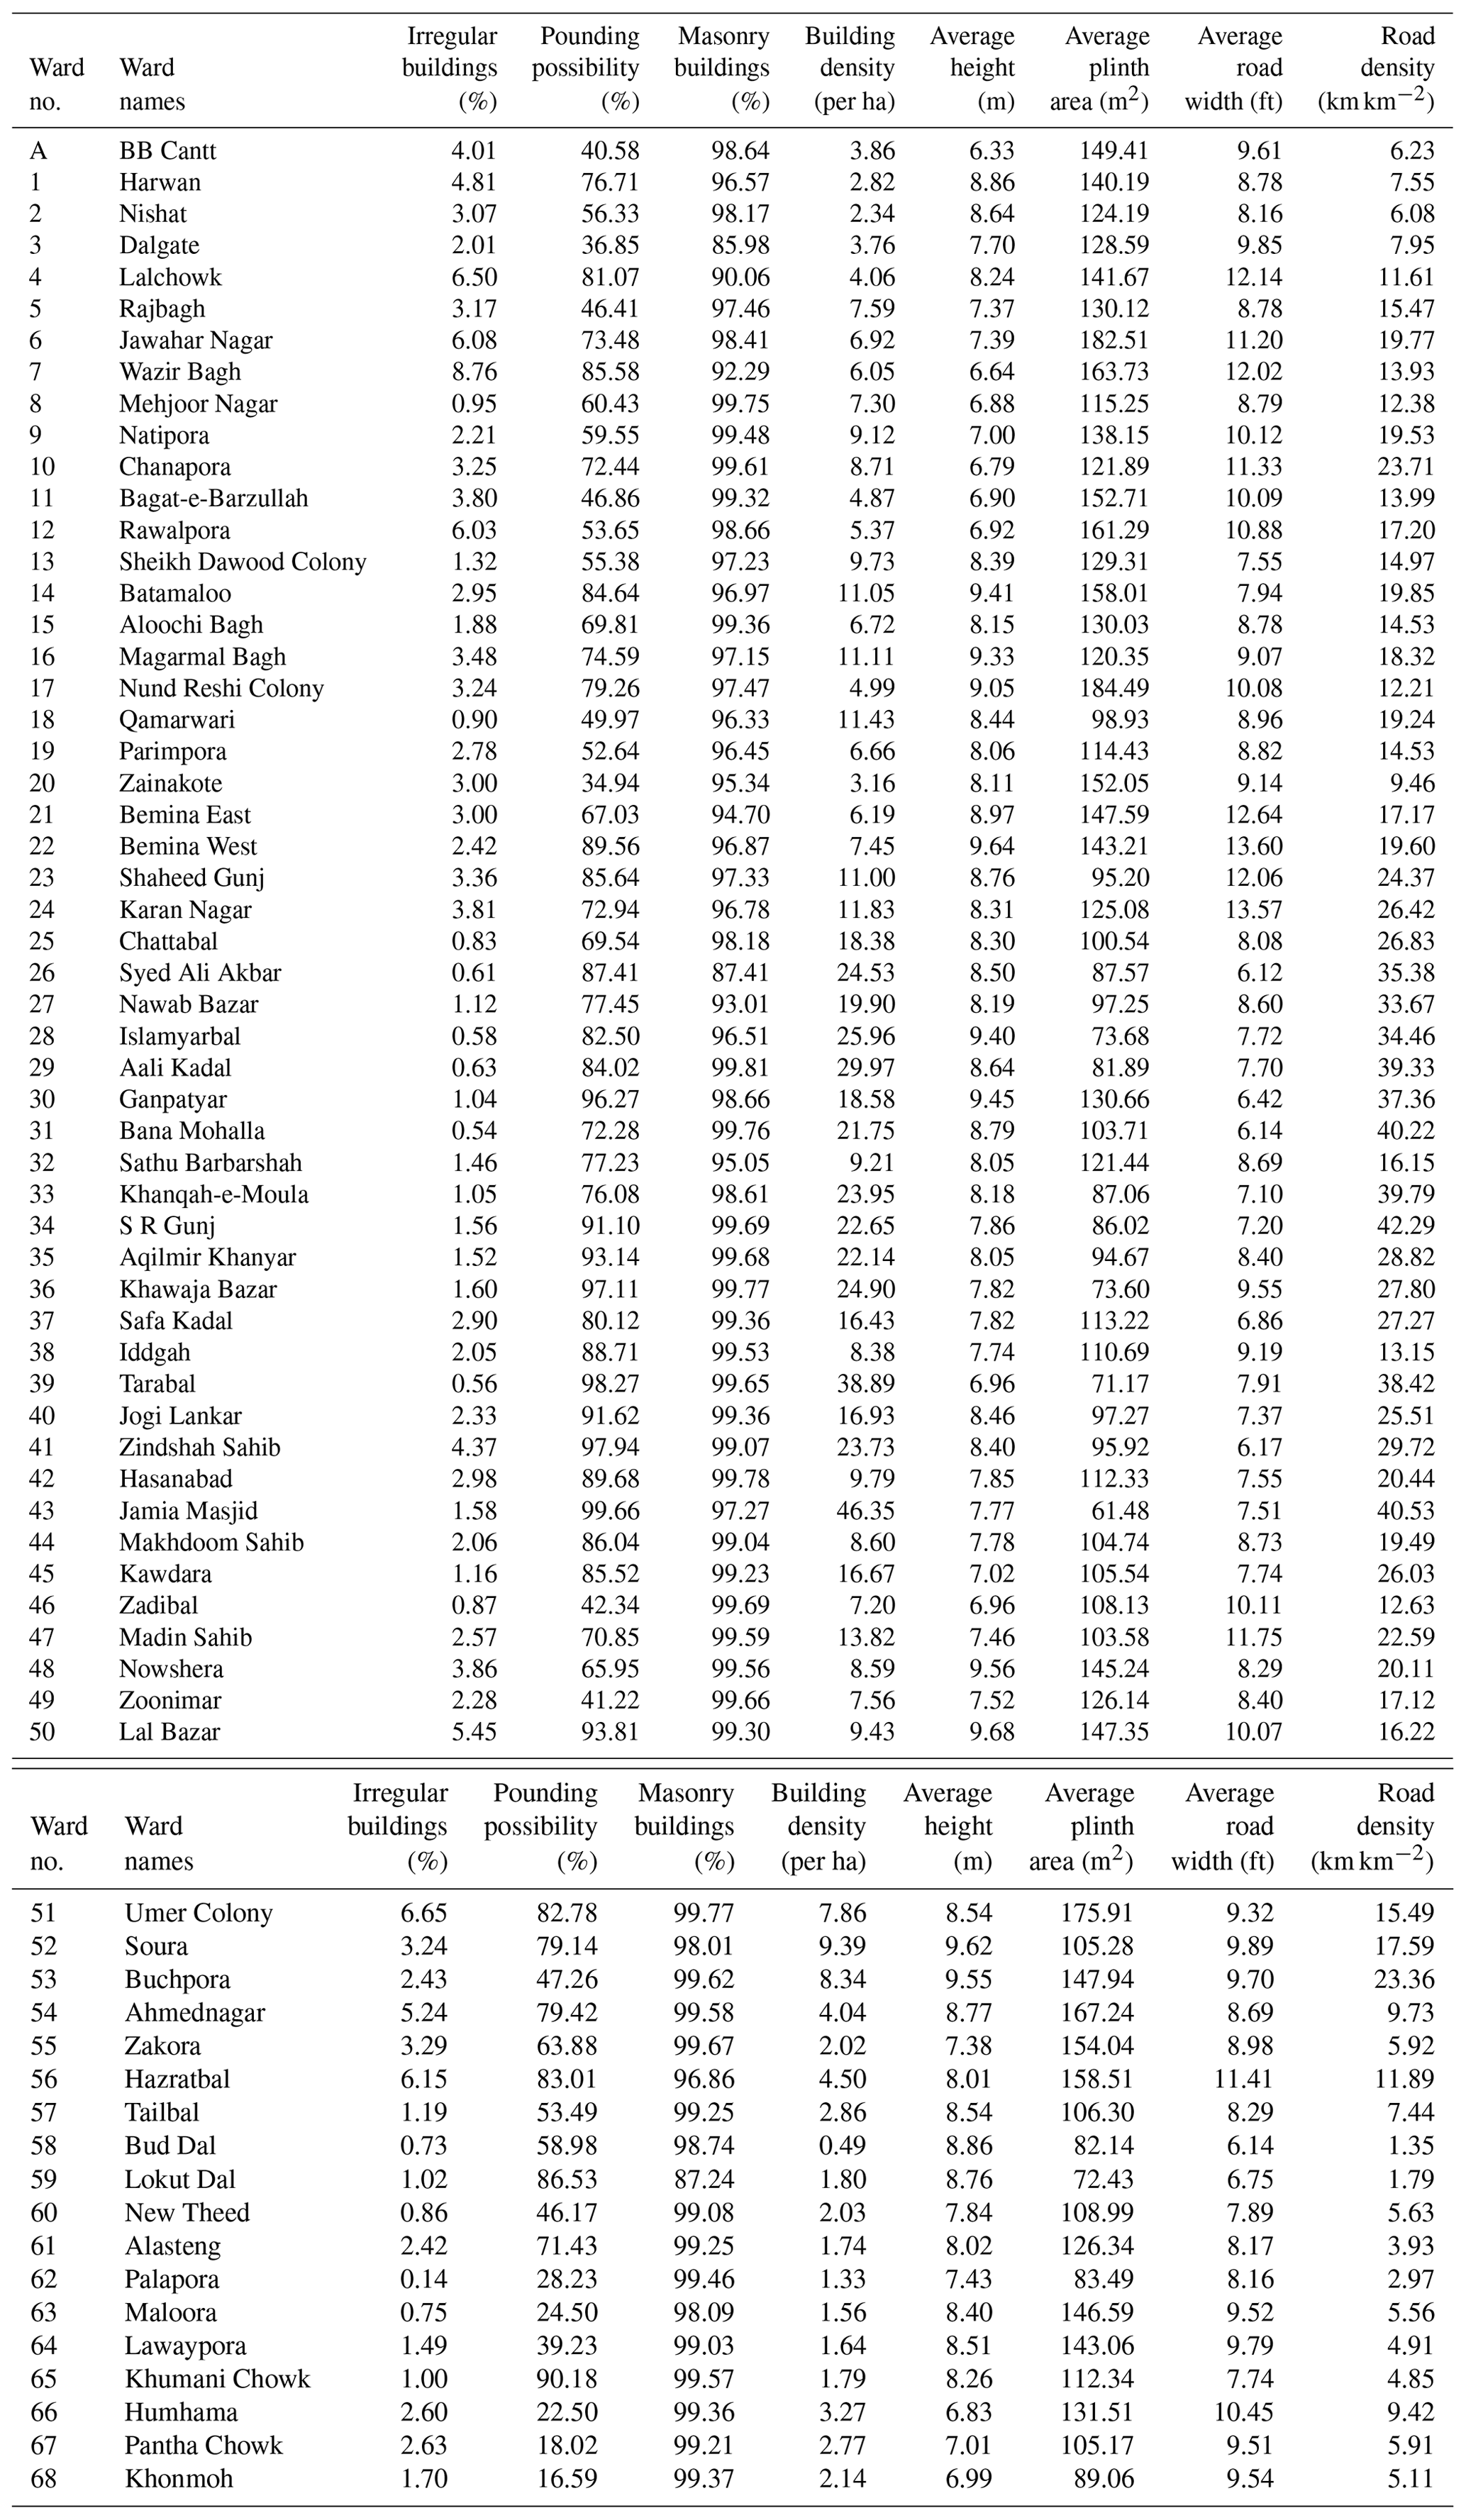
Table 6Ward-wise built-up parameters used for vulnerability assessment of the city of Srinagar.
4.1.2 Masonry building
The type of construction material used in building construction determines the earthquake vulnerability of the built environment (Lang et al., 2018). The masonry buildings have an extremely poor seismic resistance (Alam and Haque, 2018). The strength of the buildings is mostly determined by the material and the type of mortar used for constructing walls (Lang et al., 2018). Table 6 and Fig. 5 show the ward-wise distribution of masonry buildings in Srinagar. The proportion of masonry structures in the city varies between 82 % and 99.8 %. Masonry buildings account for about 98 % of the city's total buildings, making it highly vulnerable to earthquakes. Ward number 29 (Aali Kadal) has the highest number of masonry buildings (99.8 %), whereas the wards 3, 26, and 59 (Dalgate, Syed Ali Akbar, and Jawahar Nagar, respectively) have about 15 % non-masonry buildings.
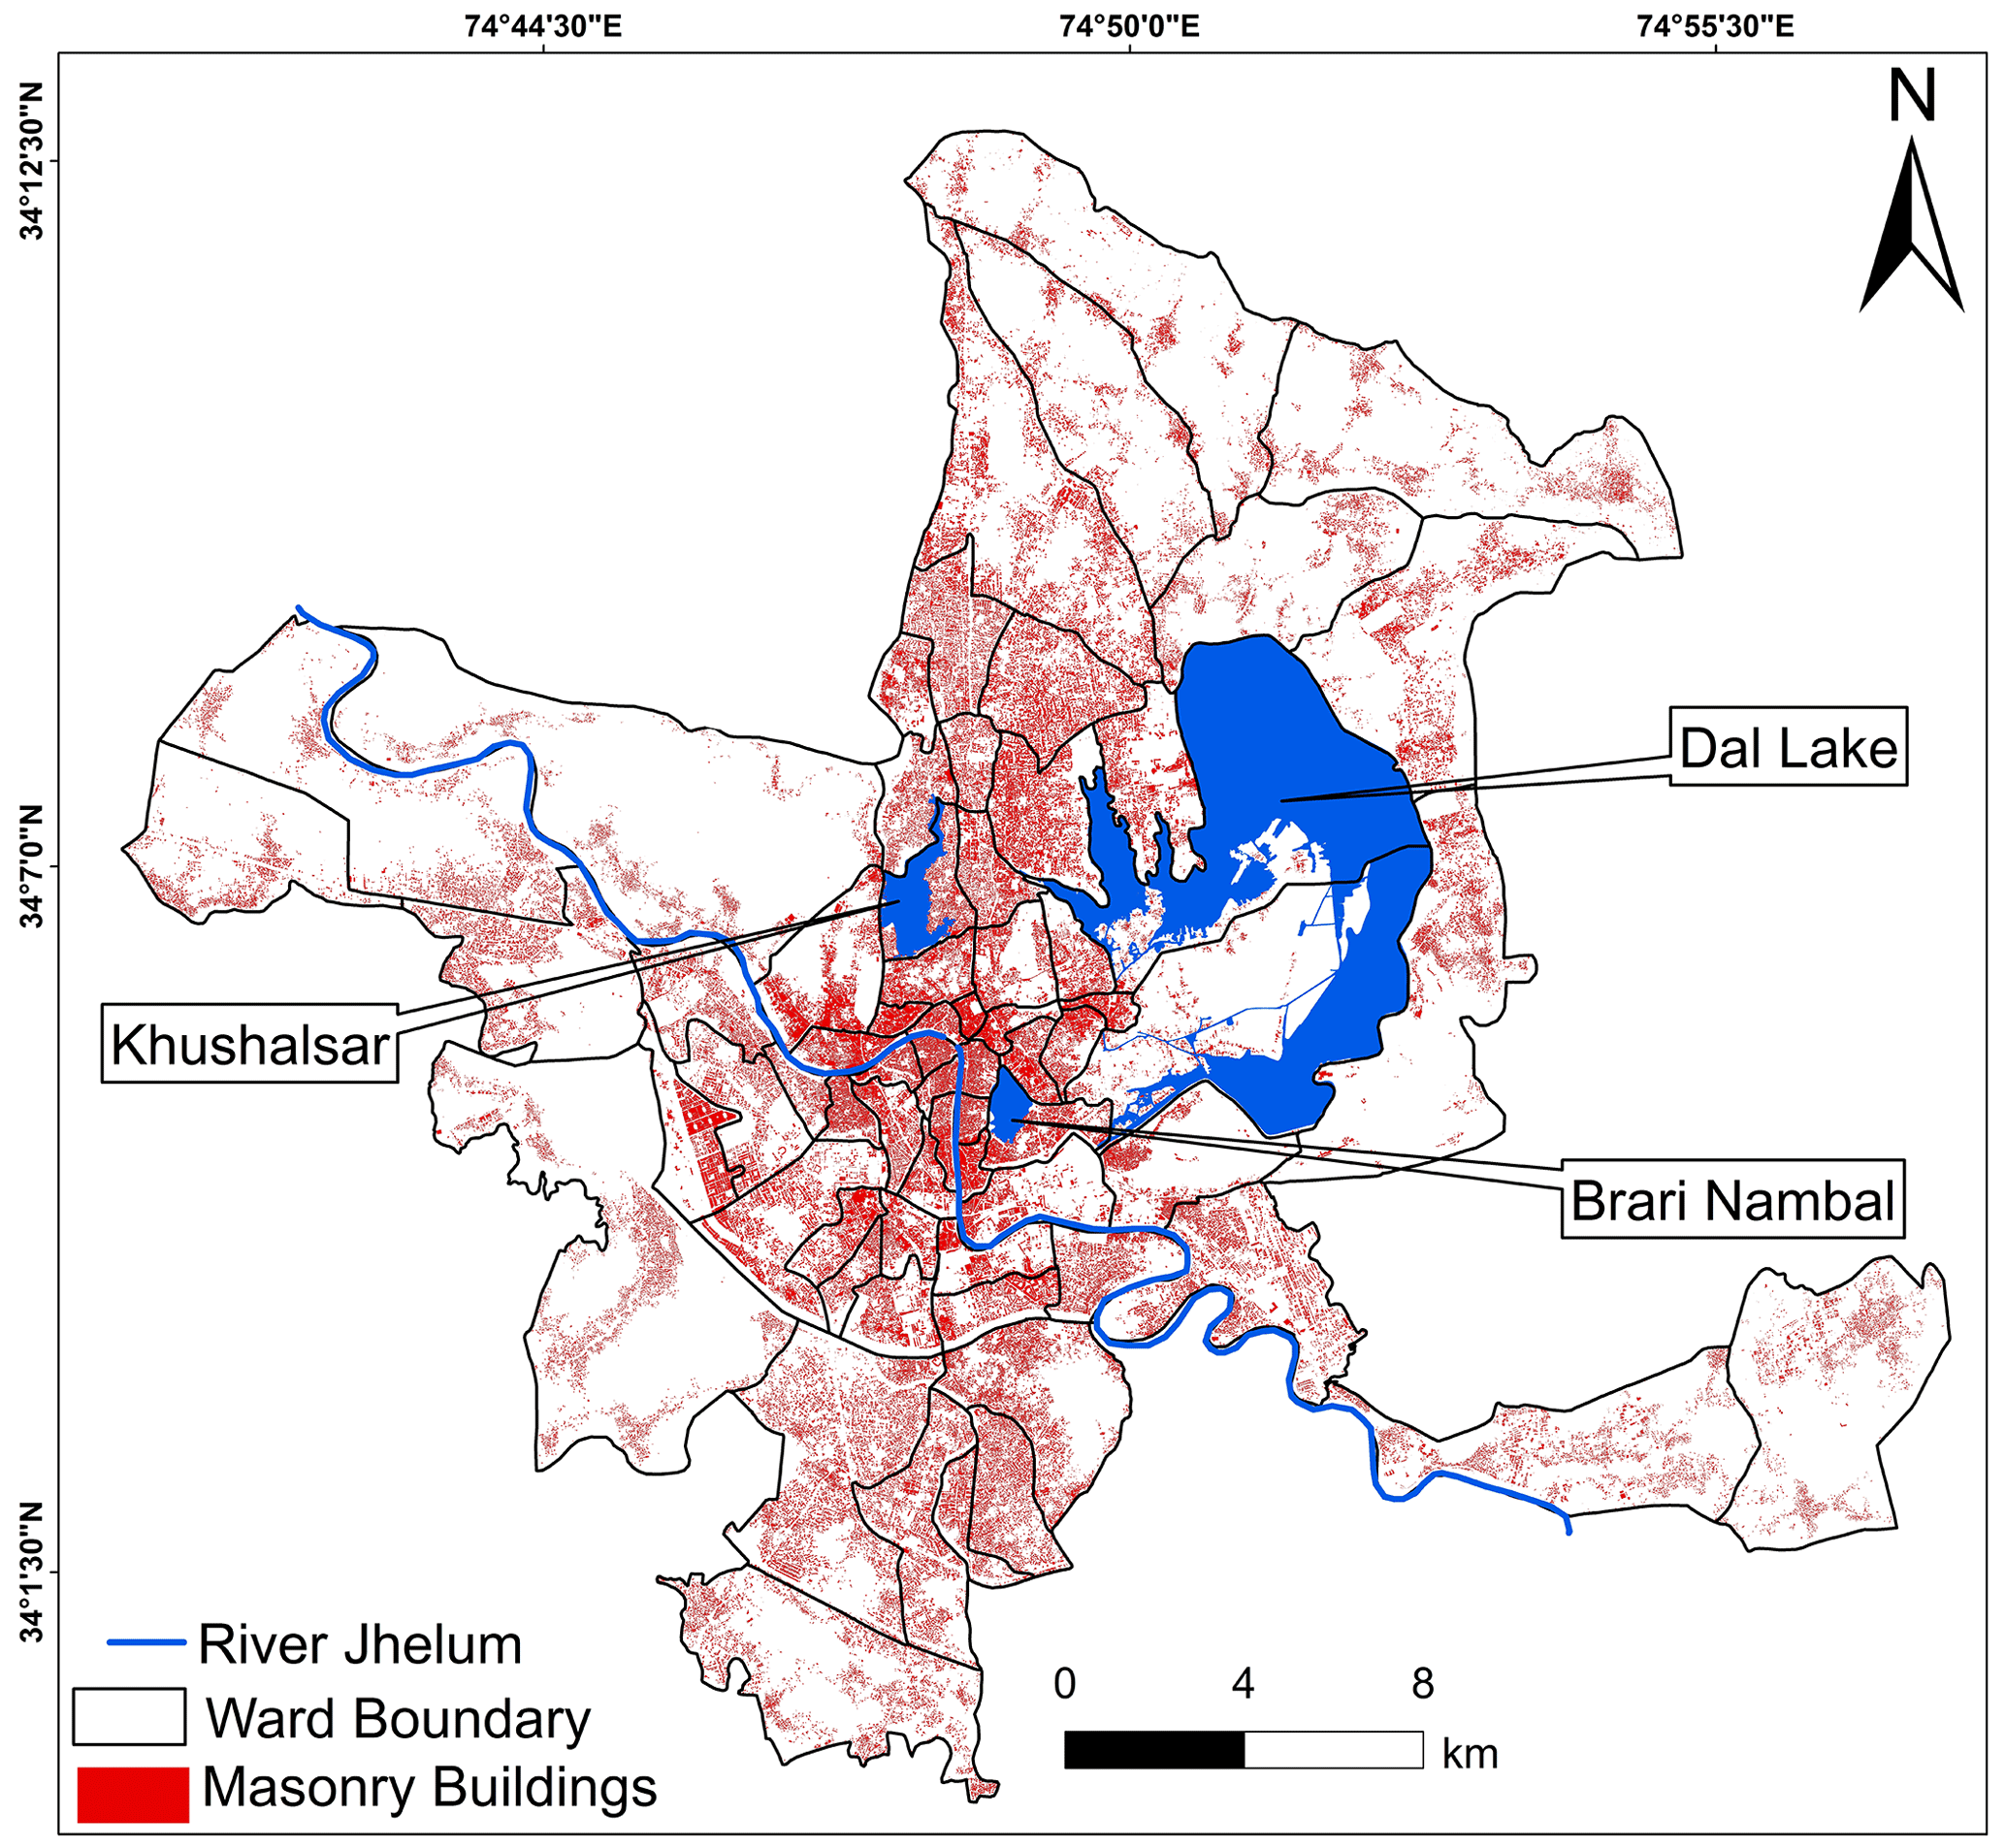
Figure 5Ward-wise distribution of masonry buildings in the city.
4.1.3 Pounding possibility
From the analysis of the estimated separation distance and height of the adjacent buildings, it was found that ∼ 65 % of buildings in the city have a high chance of pounding with neighbouring buildings, at least on one side, because the ideal offset between the buildings has not been maintained due to the haphazard building construction practices, particularly in the downtown wards of the city (Fig. 6). Table 6 provides information about the ward-by-ward pounding probability of the city. It is therefore evident from the analysis that the downtown wards of the city have the highest risk of pounding because the buildings are densely packed in most of the wards. Comparably, the uptown wards show a lower pounding possibility due to the sufficient gaps between the buildings.
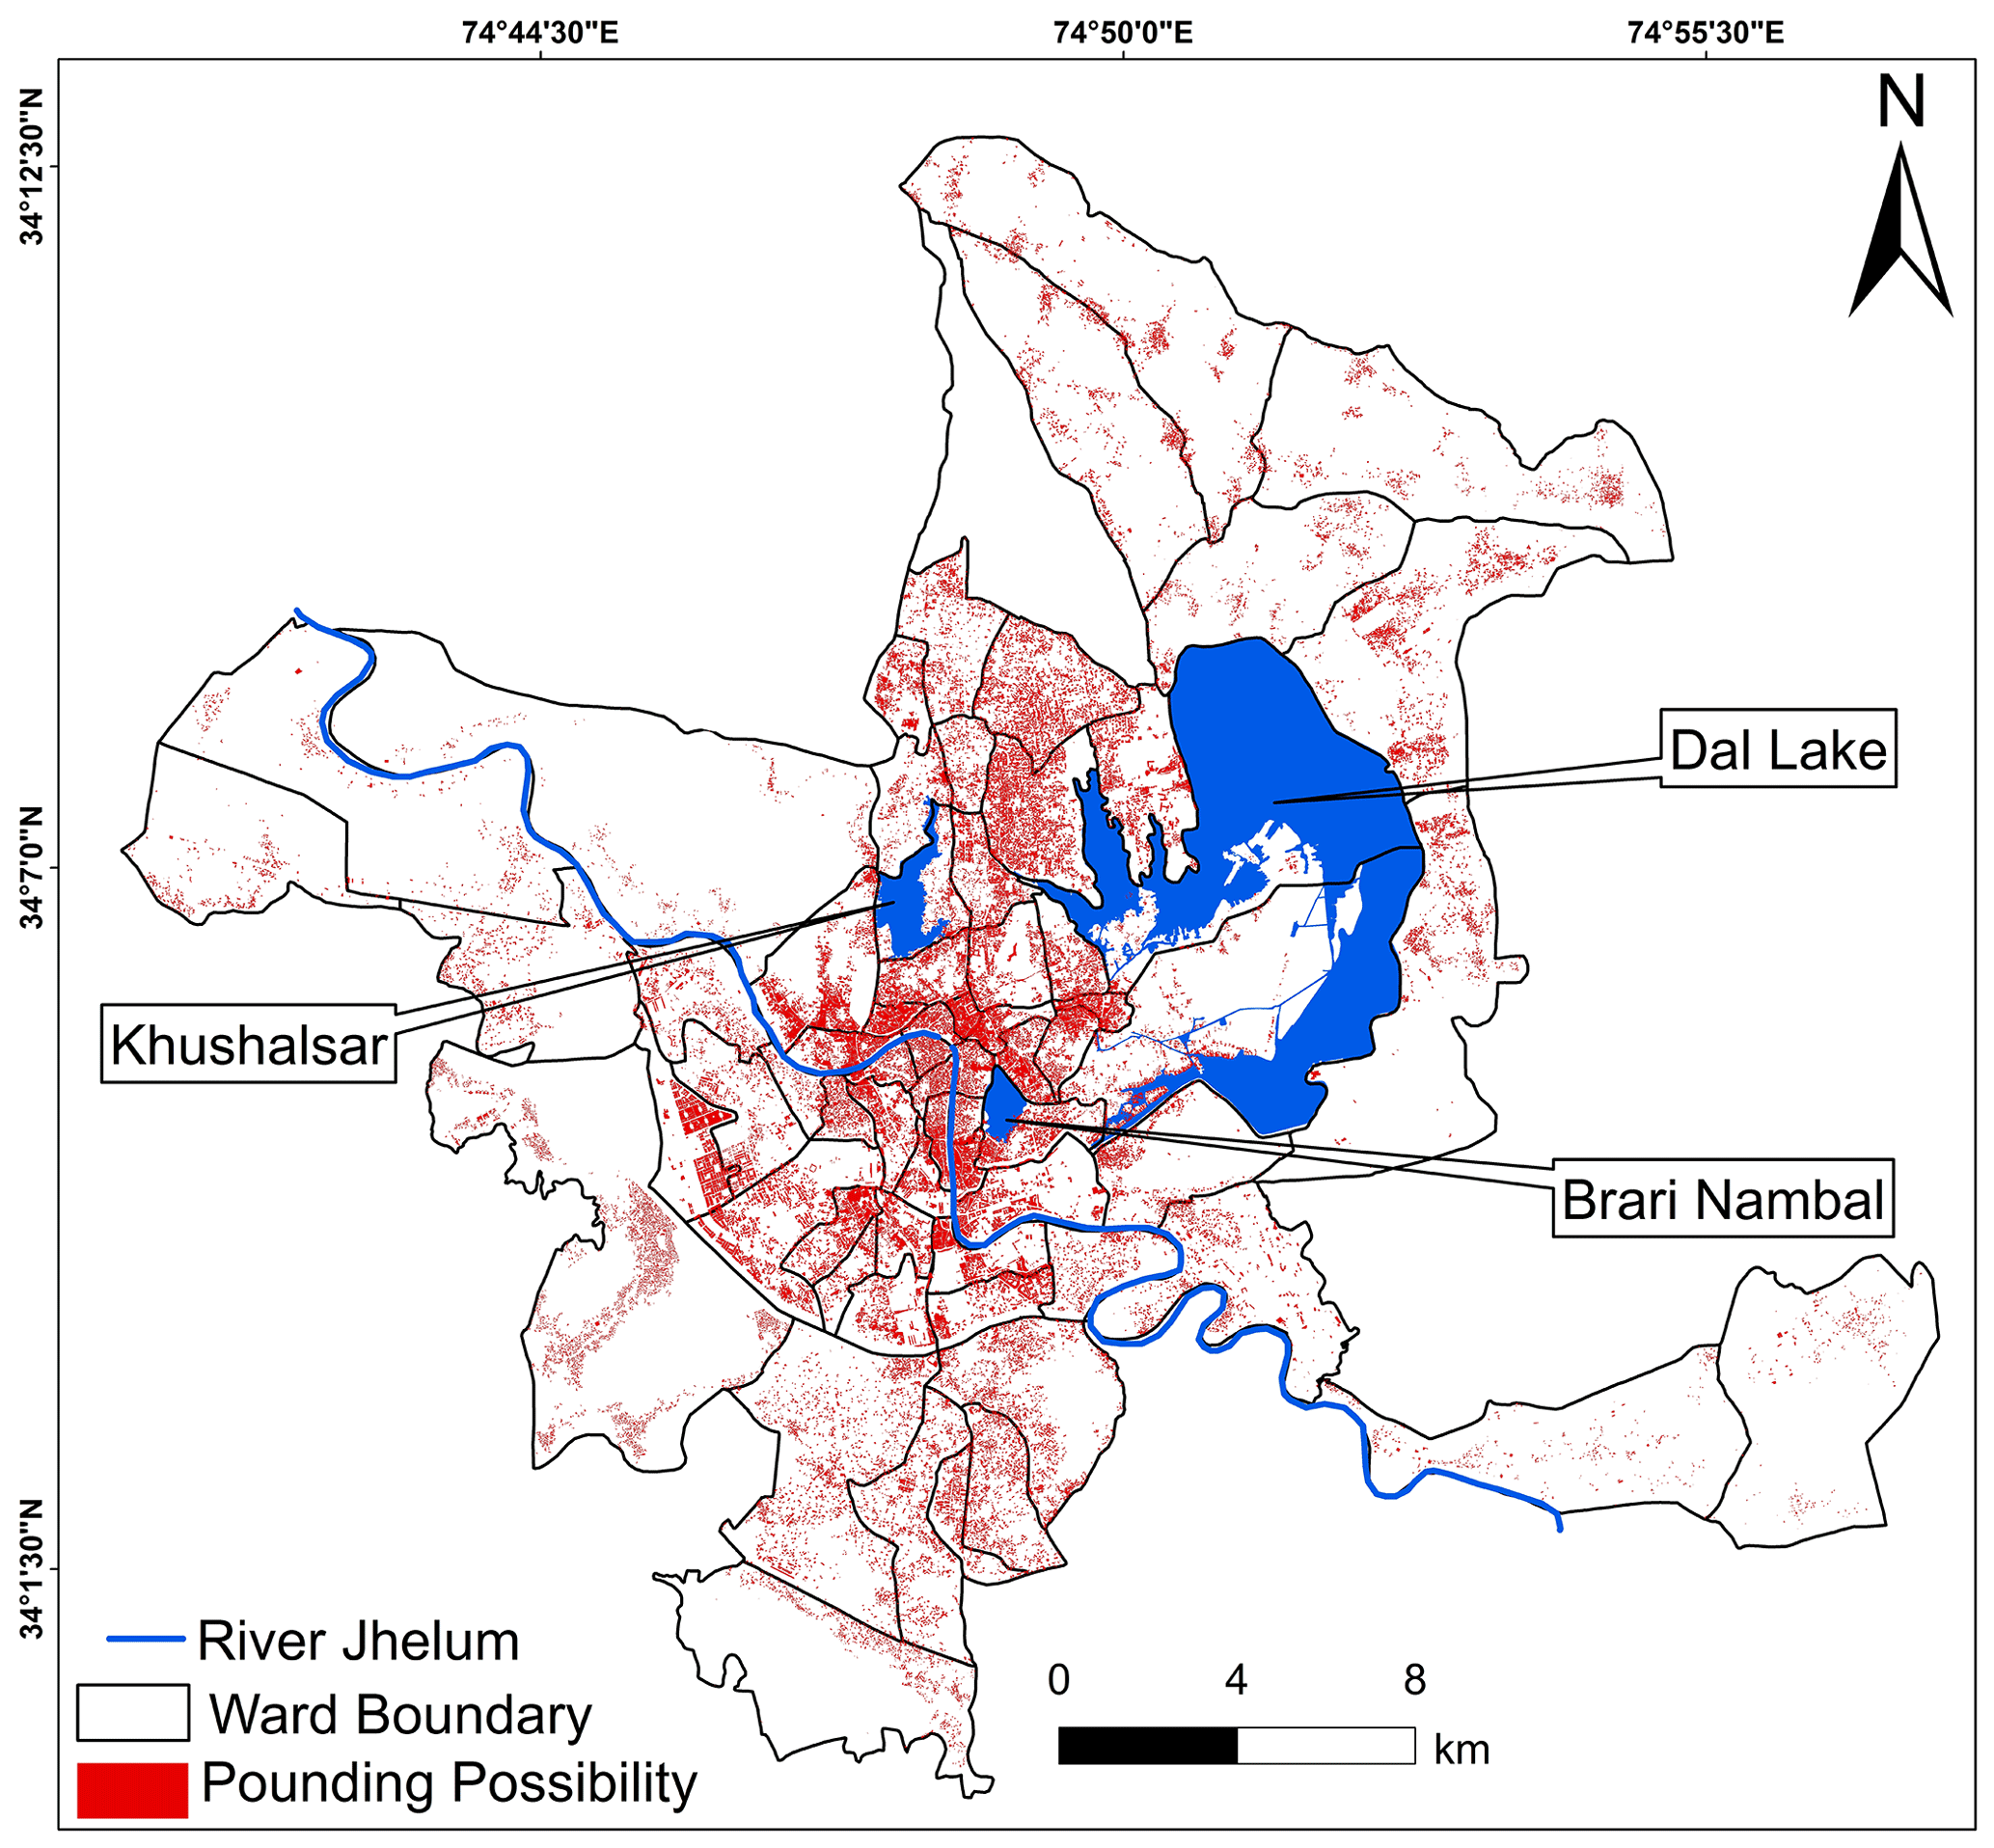
Figure 6Ward-wise distribution of building pounding possibility in the city.
4.1.4 Building geometry
Modern buildings in the city are constructed with irregular shapes and frequent offsets for aesthetic building layout and structural design. The building irregularities, either planar or vertical, make structures vulnerable to seismic loading (Mazza, 2014; Ahirwal et al., 2019). As a result, while assessing the earthquake vulnerability of the built environment, building irregularity is an important factor to consider. It was found from the analysis of the data provided in Table 6 and Fig. 7 that ∼ 3 % of the buildings in the city have irregular shapes. Fewer irregular buildings are found in the municipal ward number 62, i.e. Palapora (n=8, 0.13 %), whereas the largest number of irregular buildings are present in ward number 7, i.e. Wazir Bagh (n=158, 8.76 %), increasing the ward's vulnerability in the city. The typical residential buildings usually have a conventional, regular, and rectangular shape with four sides and an average plinth area of 120 m2 (Table 6). Some of the schools, colleges, government offices, hospitals, and commercial complexes have irregular architectural shapes, such as the shape of the letters “O,” “L,” “U,” “T,” and “H,” making them more vulnerable to earthquakes. Furthermore, most schools, colleges, and hospitals are usually made up of multiple smaller buildings with regular shapes that are close to each other, increasing the risk of pounding and making these building complexes more vulnerable to earthquake damage.
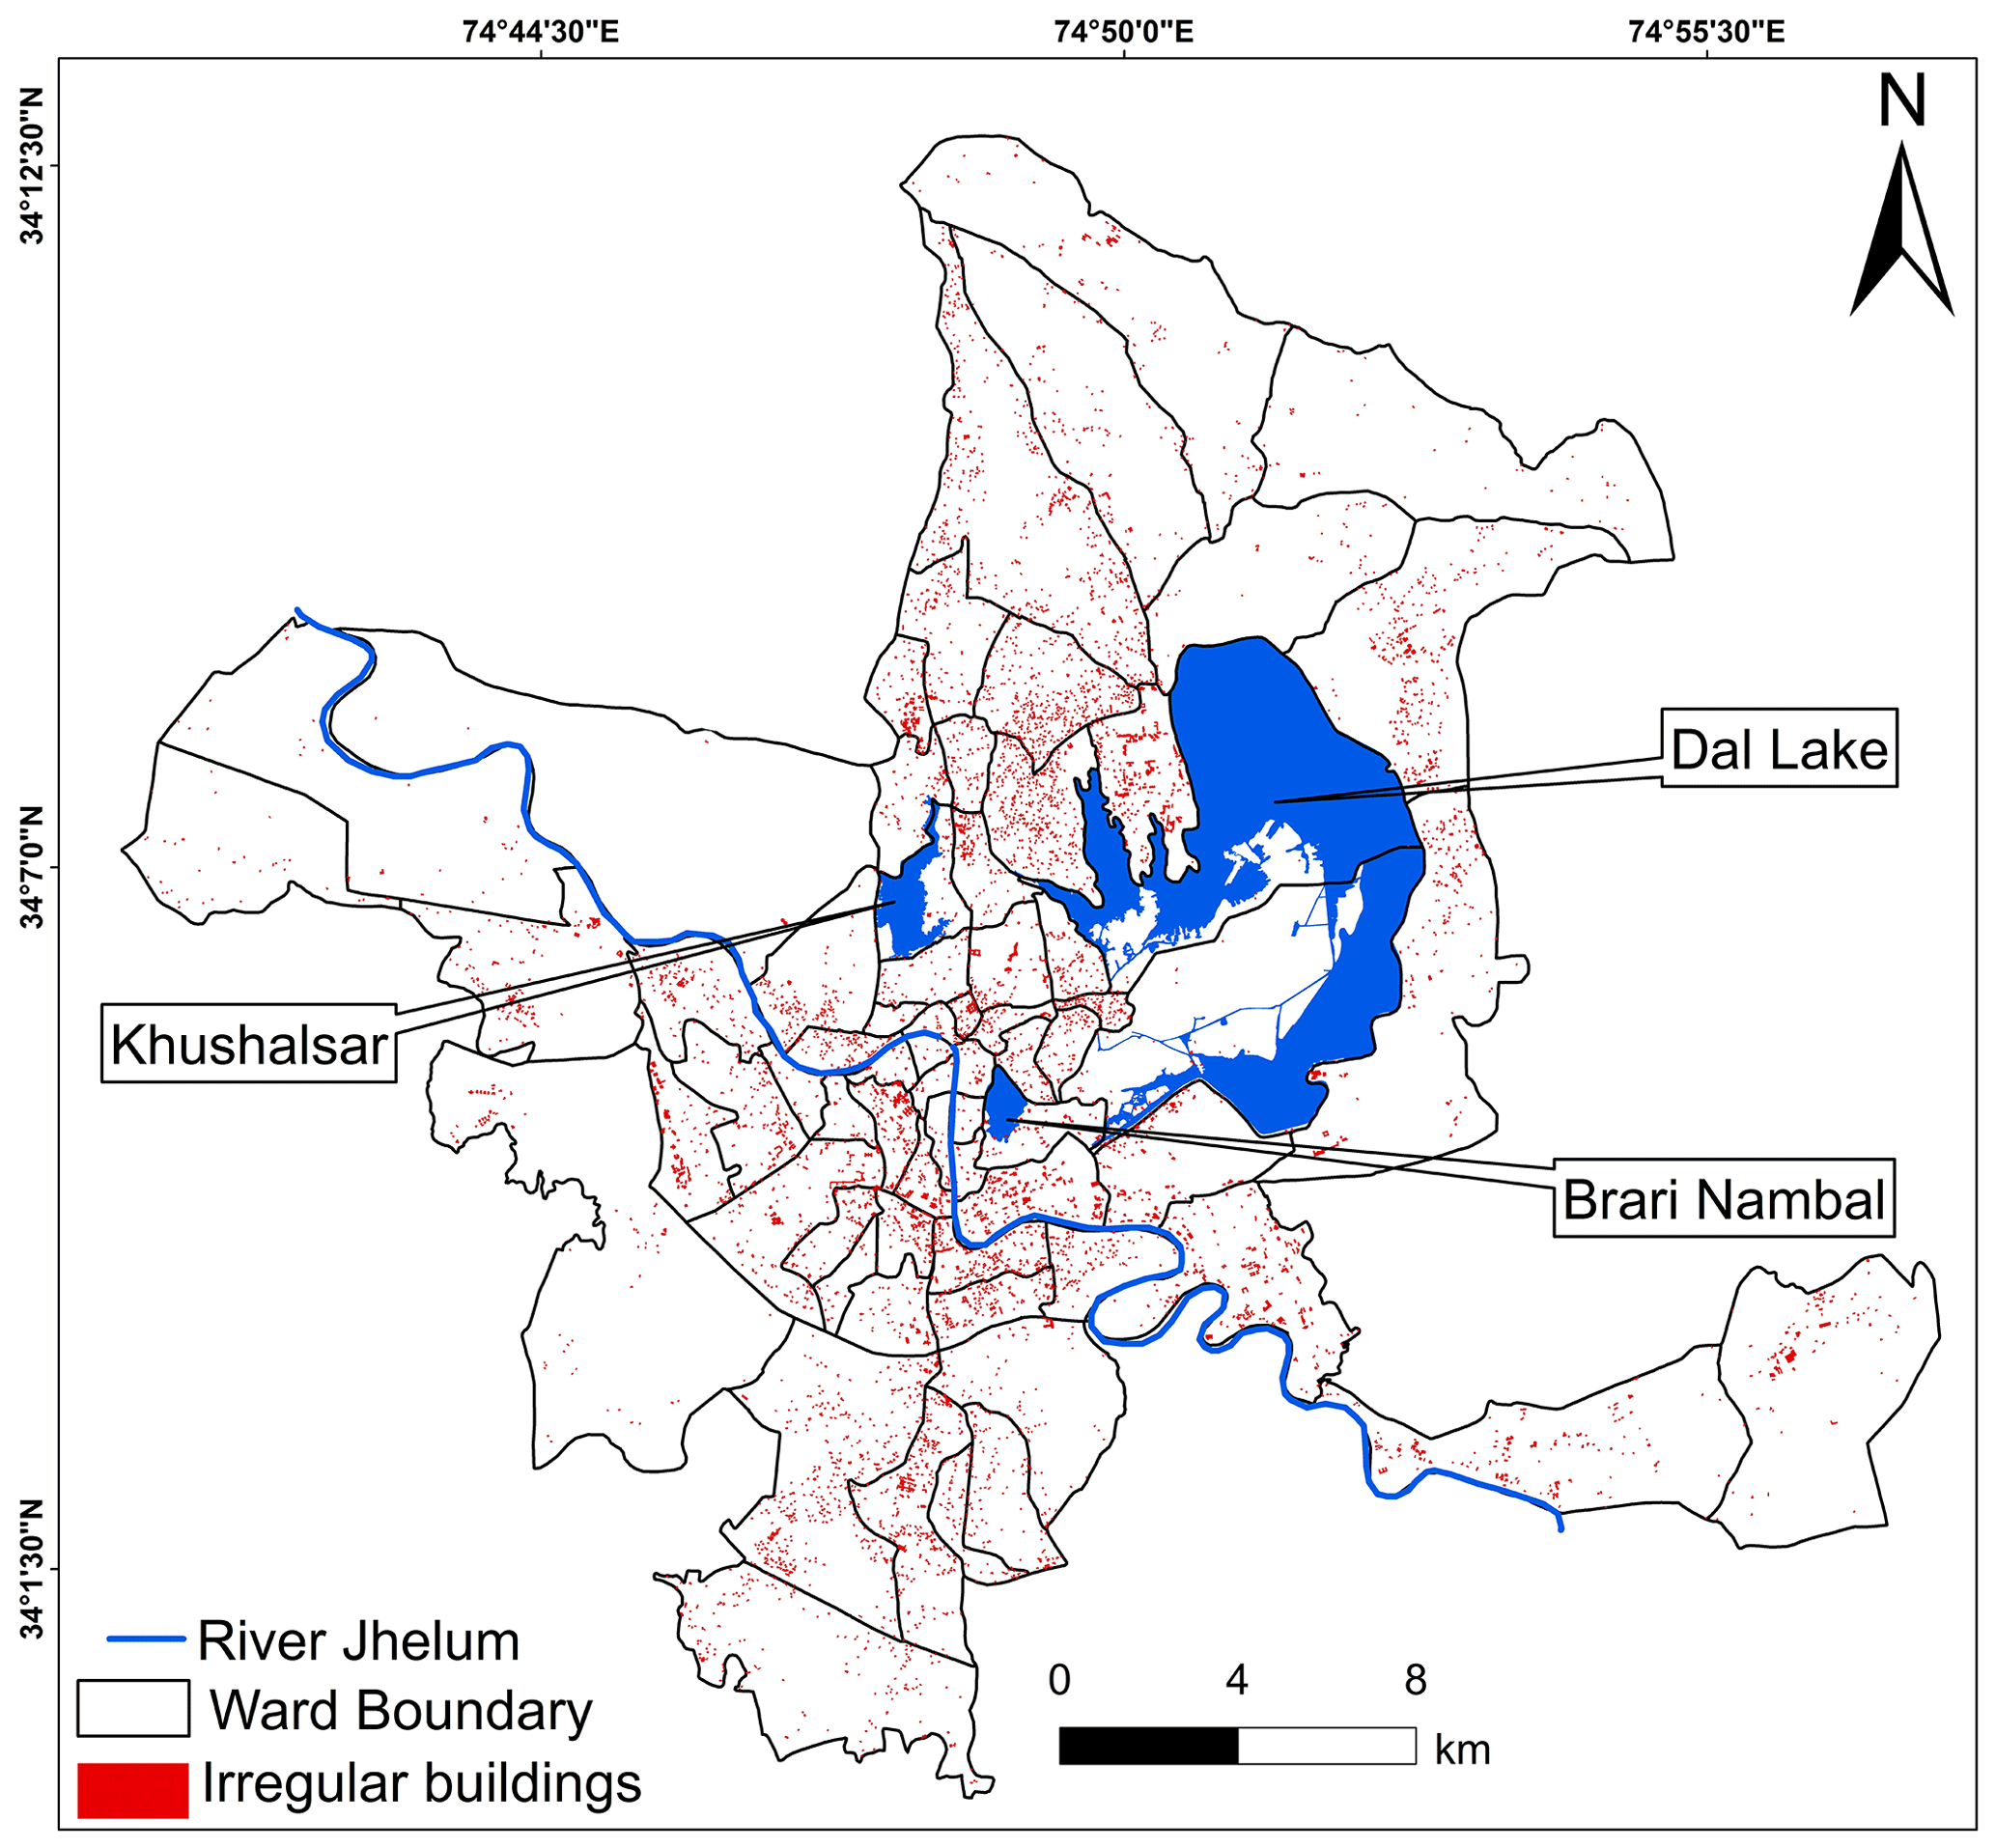
Figure 7Ward-wise distribution of irregularly shaped buildings in the city.
4.1.5 Building density
The average building density of Srinagar is 10 buildings per hectare (including residential and commercial buildings). However, the building density in 17 wards of the downtown area is more than 15 buildings per hectare (Table 6; Fig. 8). The highest building density of 46 buildings per hectare was observed in municipal ward number 43 (Jamia Masjid), followed by ward 39 (Tarabal) and ward 29 (Aali Kadal), which have a building density of 39 and 30, respectively. Ward number 58 (Bud Dal) has the lowest building density, with only one building per hectare. Srinagar is one of the largest urban centres in the Himalayan region and is experiencing considerably high rates of population growth and built-up area expansion, leading to the extension of urban areas and the merging of the city's fringe areas into the main city (Bhat et al., 2012). The outer peripheral wards have mostly low building density, and these are the developing areas proposed under the Srinagar Master Plan 2035. Knowledge about the building packing within the urban city centre is crucial information for the earthquake vulnerability assessment. The current practise of constructing buildings with insufficient space between them increases the congestion and building density of cities (Bahadori et al., 2017). The areas with high building density (Table 6) are more vulnerable to earthquake damage than those with the low building density (Shadmaan and Islam, 2021). The high building density also leads to a small separation distance between buildings and a reduction in the open space area. This reduces the amount of useful space available for evacuation and shelters during post-earthquake rescue operations. In order to decrease the loss and damage to human life and infrastructure caused by earthquakes, it is important to regulate building density and ensure the reinforcement of old structures (Jena et al., 2020). Good planning, a lower building density, and evenly spaced buildings reduce the seismic vulnerability of a city (Aghataher et al., 2008).
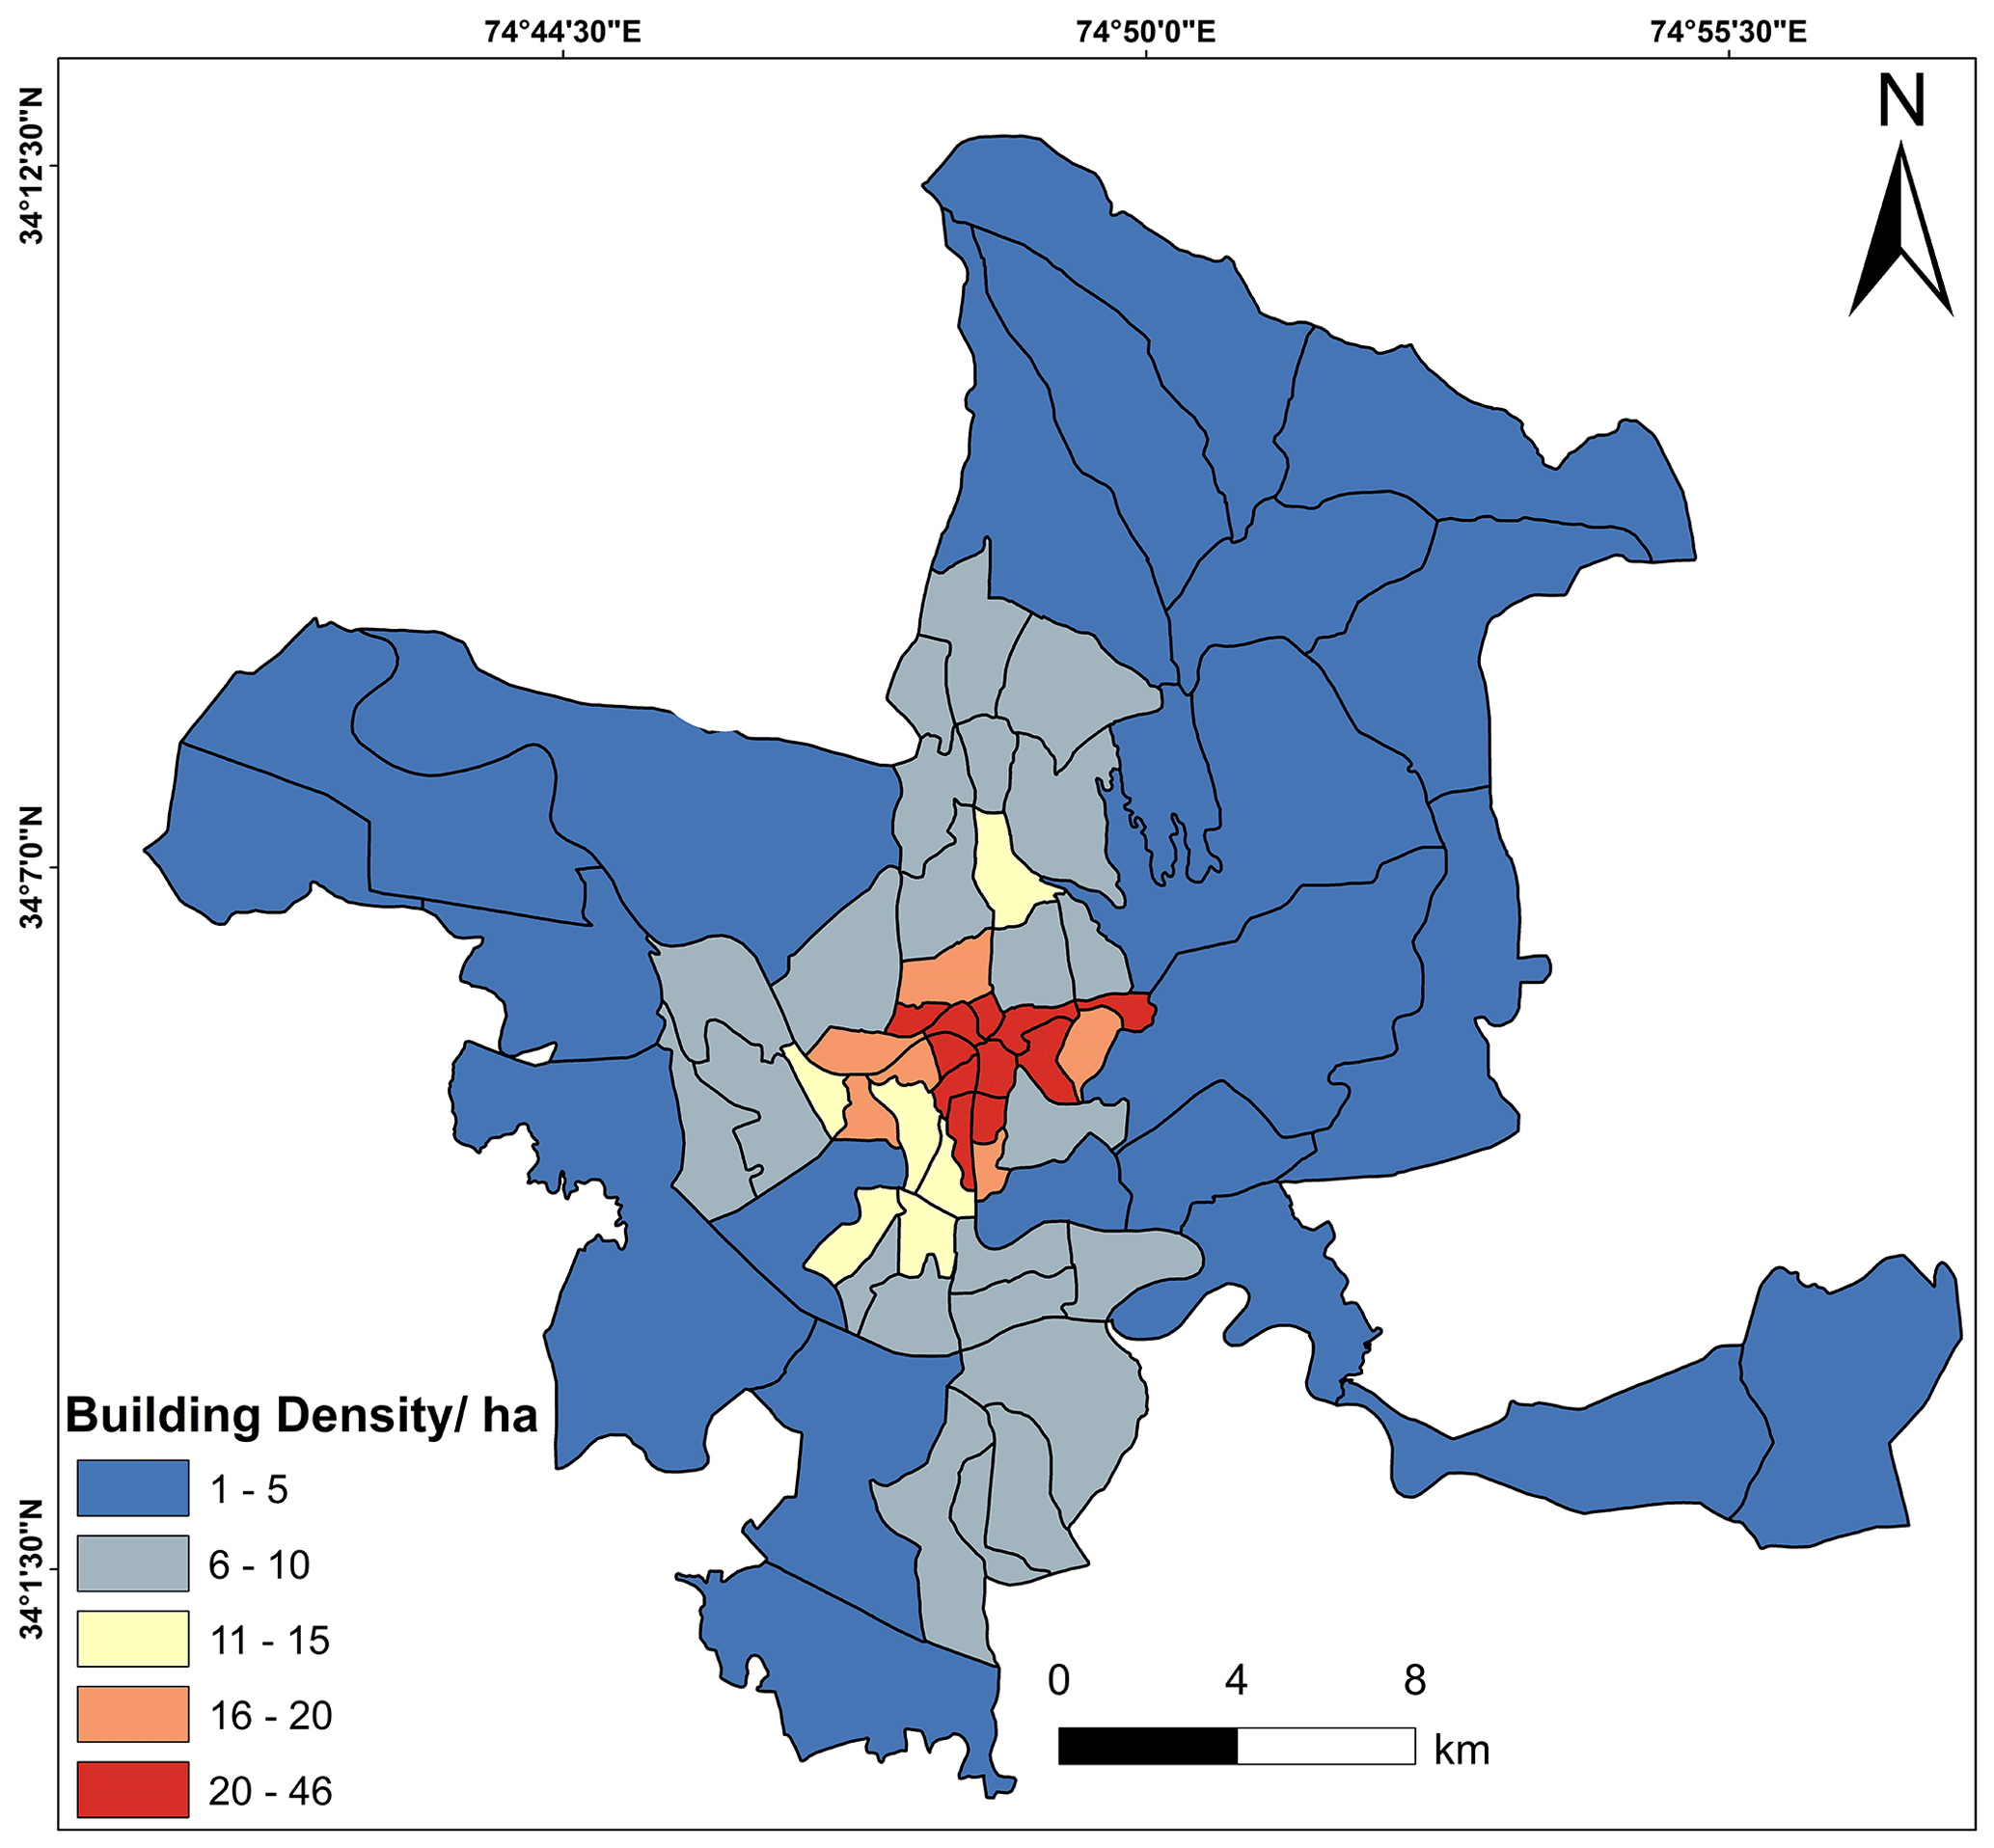
Figure 8Ward-wise distribution of building density in the city.
4.1.6 Road network
Despite the high population and building density in the city, the road network connectivity in the city is good, with a total road length of 2246 km. In the eventuality of an earthquake, the effectiveness of an urban road network decreases significantly due to road damage caused by collapsed buildings and blockages (Bono and Gutiérrez, 2011; Zanini et al., 2017). On the basis of their width, the roads in the city were classified into three categories: <8 ft, 8 to 16 ft, and >16 ft (Fig. 9). The roads or streets with a width of less than 8 ft are considered possible blockade sites. From the analysis of the data provided in Table 6, it is evident that wards 26 (Syed Ali Akbar), 31 (Bana Mohalla), 58 (Bud Dal), 41 (Zindshah Sahib), 30 (Ganpatyar), and 37 (Safa Kadal) have the smallest average road width of less than 7 ft, despite having high road densities, except for ward 58 (Bud Dal), which has a road density of 1.35 km km−2 due to the fact that most of the ward is covered by water (Dal Lake). Ward 31 has a road density of 40.22 km km−2, ward 26 has a road density of 35.38 km km−2, ward 30 has a road density of 37.36 km km−2, ward 41 has a road density of 29.72 km km−2, and ward 37 has a road density of 27.27 km km−2. Wards 24 (Karan Nagar) and 22 (Bemina West) have the largest average road width of 13.58 ft and a road density of 26.42 and 19.60 km km−2, respectively (Table 6). It is worth noting that the road network in the city is relatively denser in the downtown wards, and, as a result, the roads being narrower there makes these places in the city more vulnerable to earthquake damage and would possibly impede the post-earthquake evacuation and rehabilitation operations. The road network in the uptown wards towards the periphery of the city, on the other hand, is less dense. The roads being relatively wider in the outer wards makes them more suitable for evacuation and would facilitate easy movement of traffic and relief during an earthquake compared to the inner-city wards.
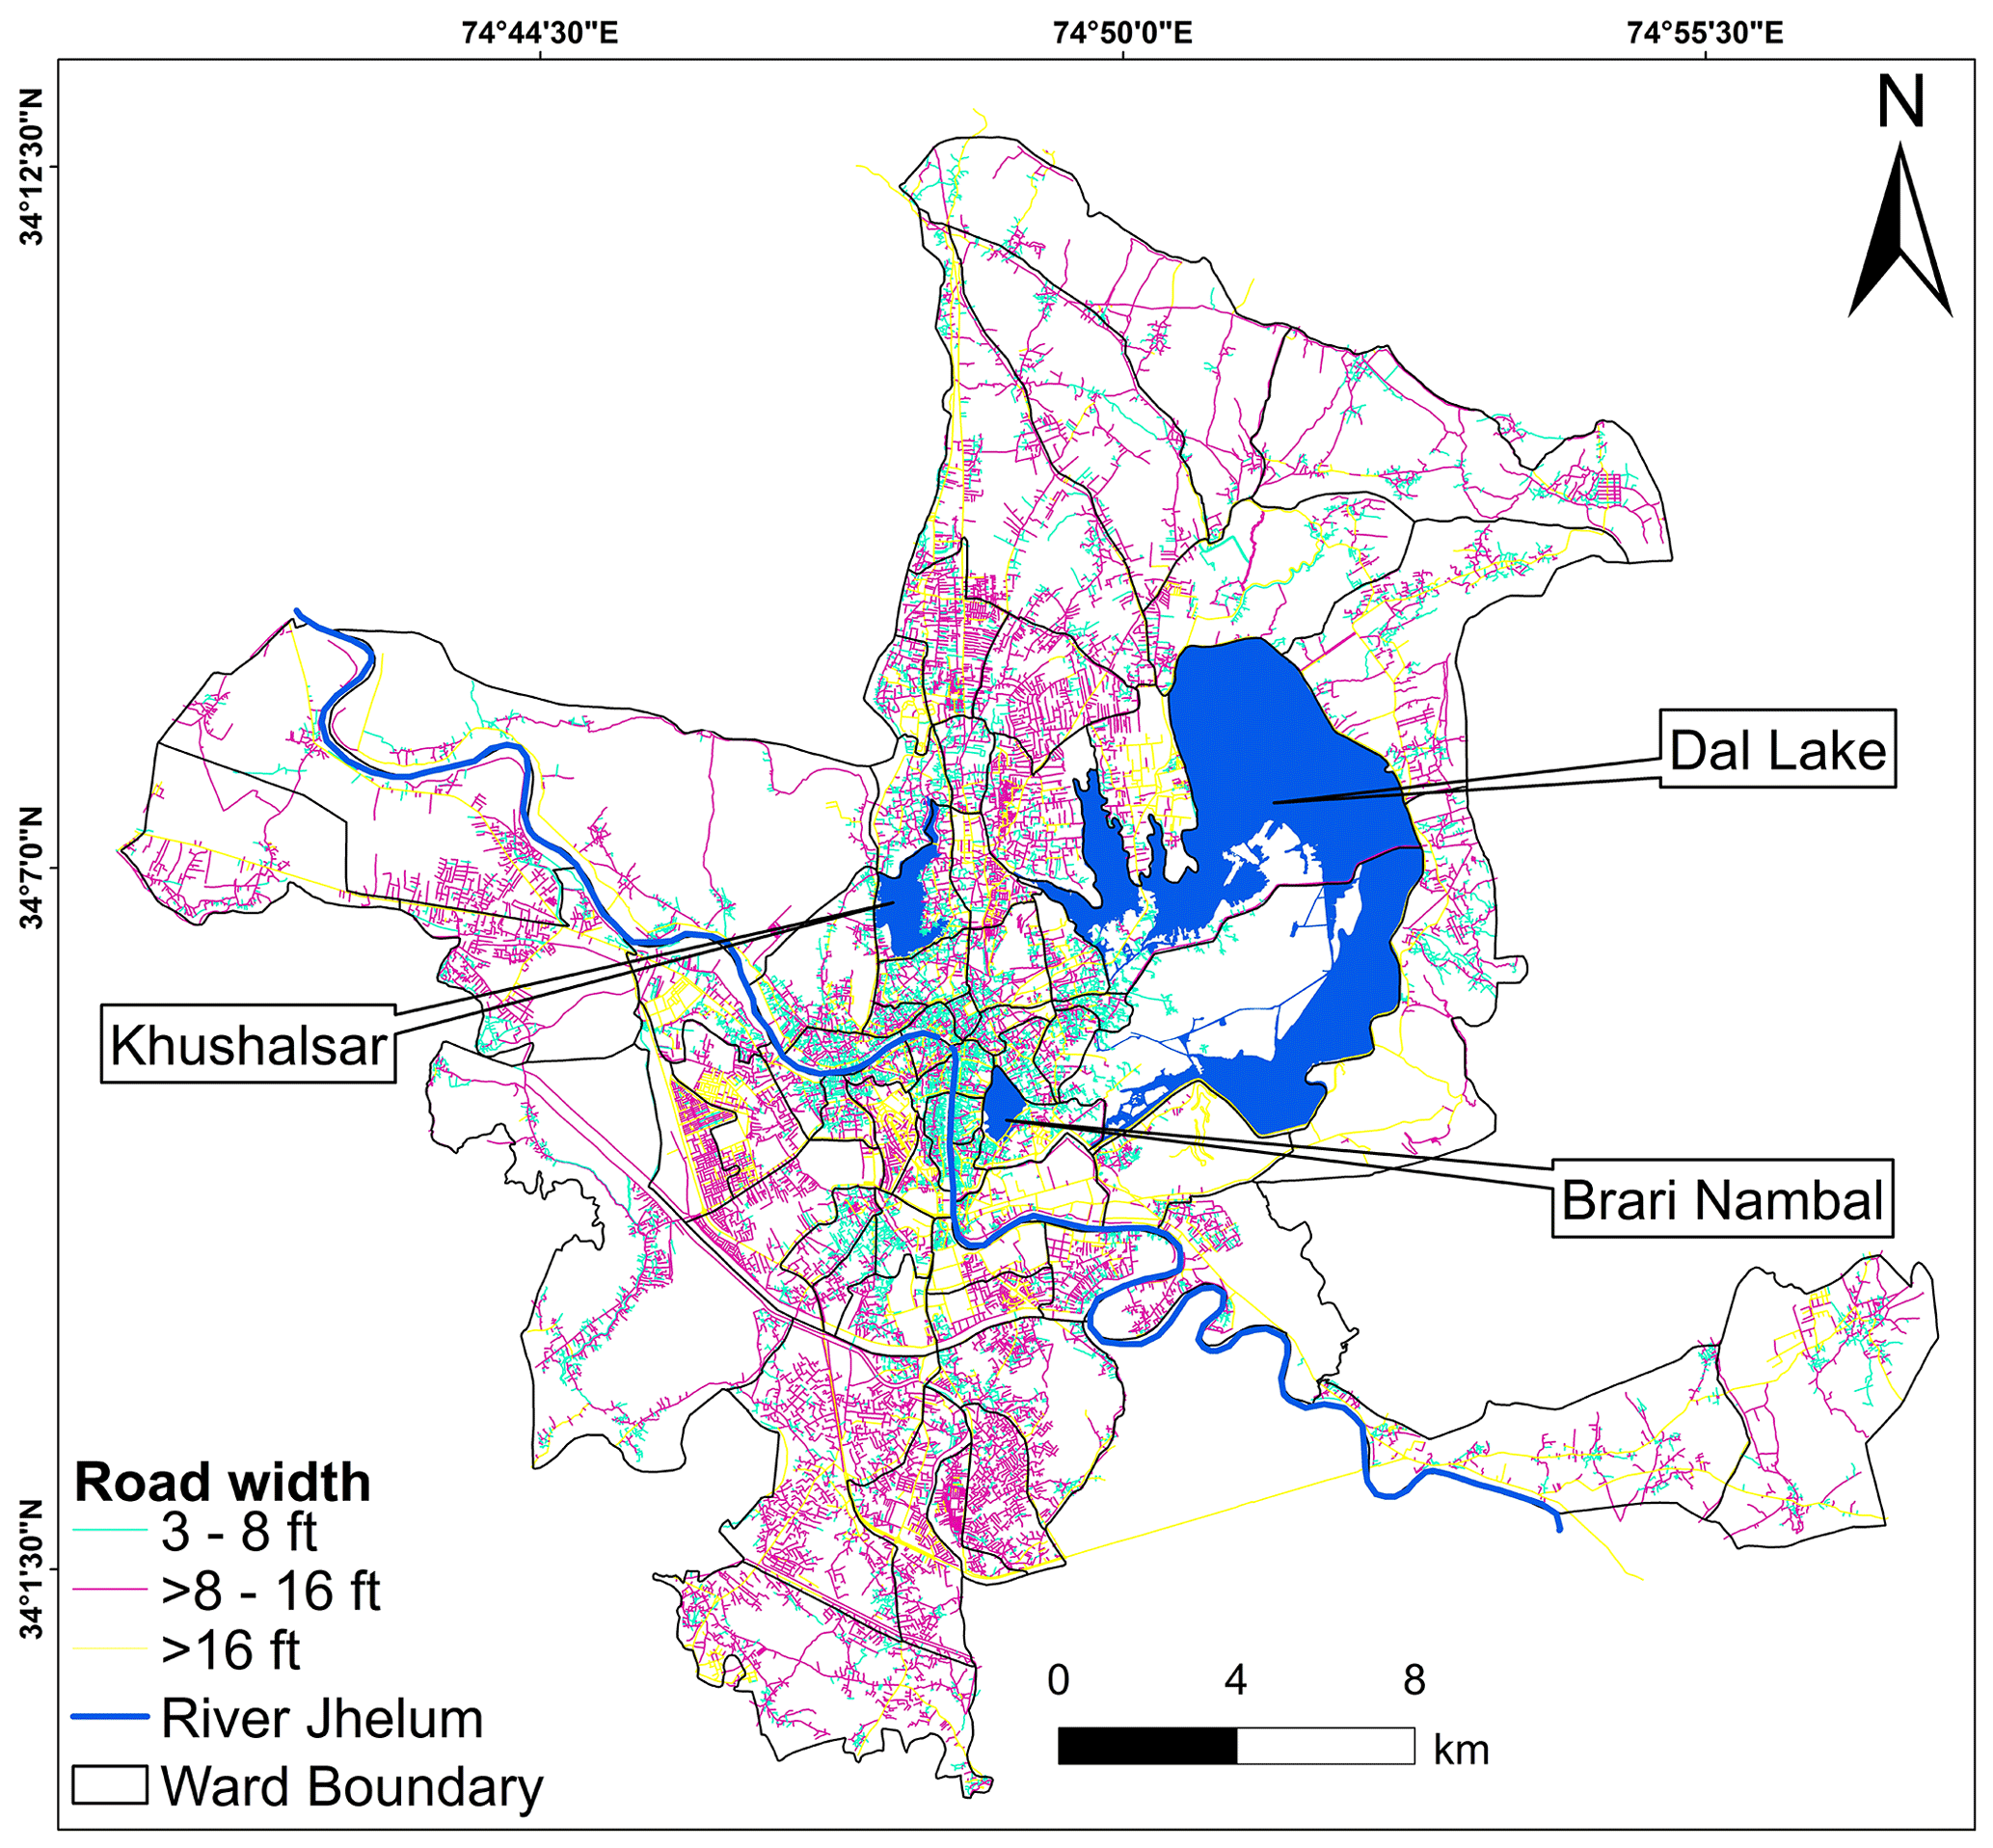
Figure 9Ward-wise road network in the city.
4.2 Earthquake vulnerability analysis
Earthquake events are usually characterized by high exposure to social and economic consequences that can be severe (Oliveira, 2003), and therefore earthquake vulnerability assessment aids pre-earthquake planning and post-earthquake emergency operations by providing vital information that informs earthquake risk reduction measures (Saputra et al., 2017). The GIS-based analysis of the earthquake vulnerability of the built environment in Srinagar, using the coupled model of AHP and TOPSIS, was carried out to highlight the ward-wise vulnerability in the event of an earthquake. Because all of the structural vulnerability parameters have different importance and impacts, the structural vulnerability of the city cannot be achieved by relying on a single parameter (Panahi et al., 2014). Therefore, six important parameters were considered in this study to produce a robust earthquake vulnerability assessment of the city. This study classified 69 municipal wards of the city into five earthquake-vulnerable classes: very high, high, moderate, low, and very low earthquake vulnerability. The results showed that 9 municipal wards in the city are very highly vulnerable, 14 wards are highly vulnerable, 19 wards are moderately vulnerable, 17 wards are in the low vulnerable category, and 10 wards fall in the very low vulnerable category (Fig. 10). The vulnerability map reveals that wards categorized under the same vulnerability class are contiguous to one another, indicating a clear pattern of earthquake vulnerability in Srinagar. The city centre, which also happens to be the site of ancient urban settlements including several heritage buildings and shrines, has a very high level of structural vulnerability, and as we move towards the outer peripheral wards, the vulnerability changes from moderate to low. The probability of masonry buildings collapsing in the event of an earthquake is higher (Bhosale et al., 2018), and the city has a large percentage of such buildings, making it more vulnerable to earthquakes. Buildings with regular geometry, uniform mass distribution, and rigidity in plan and elevation are more resistant to earthquakes than buildings with irregular geometry and hence variable mass distribution (Stein, 1892). As the findings of this study show, a good number of buildings in a few wards of the city have irregular geometry, making them more vulnerable to earthquakes. The high building density, maximal pounding potential, and narrower road network near the city centre make these wards particularly vulnerable when compared to the other wards located in the periphery of the city.
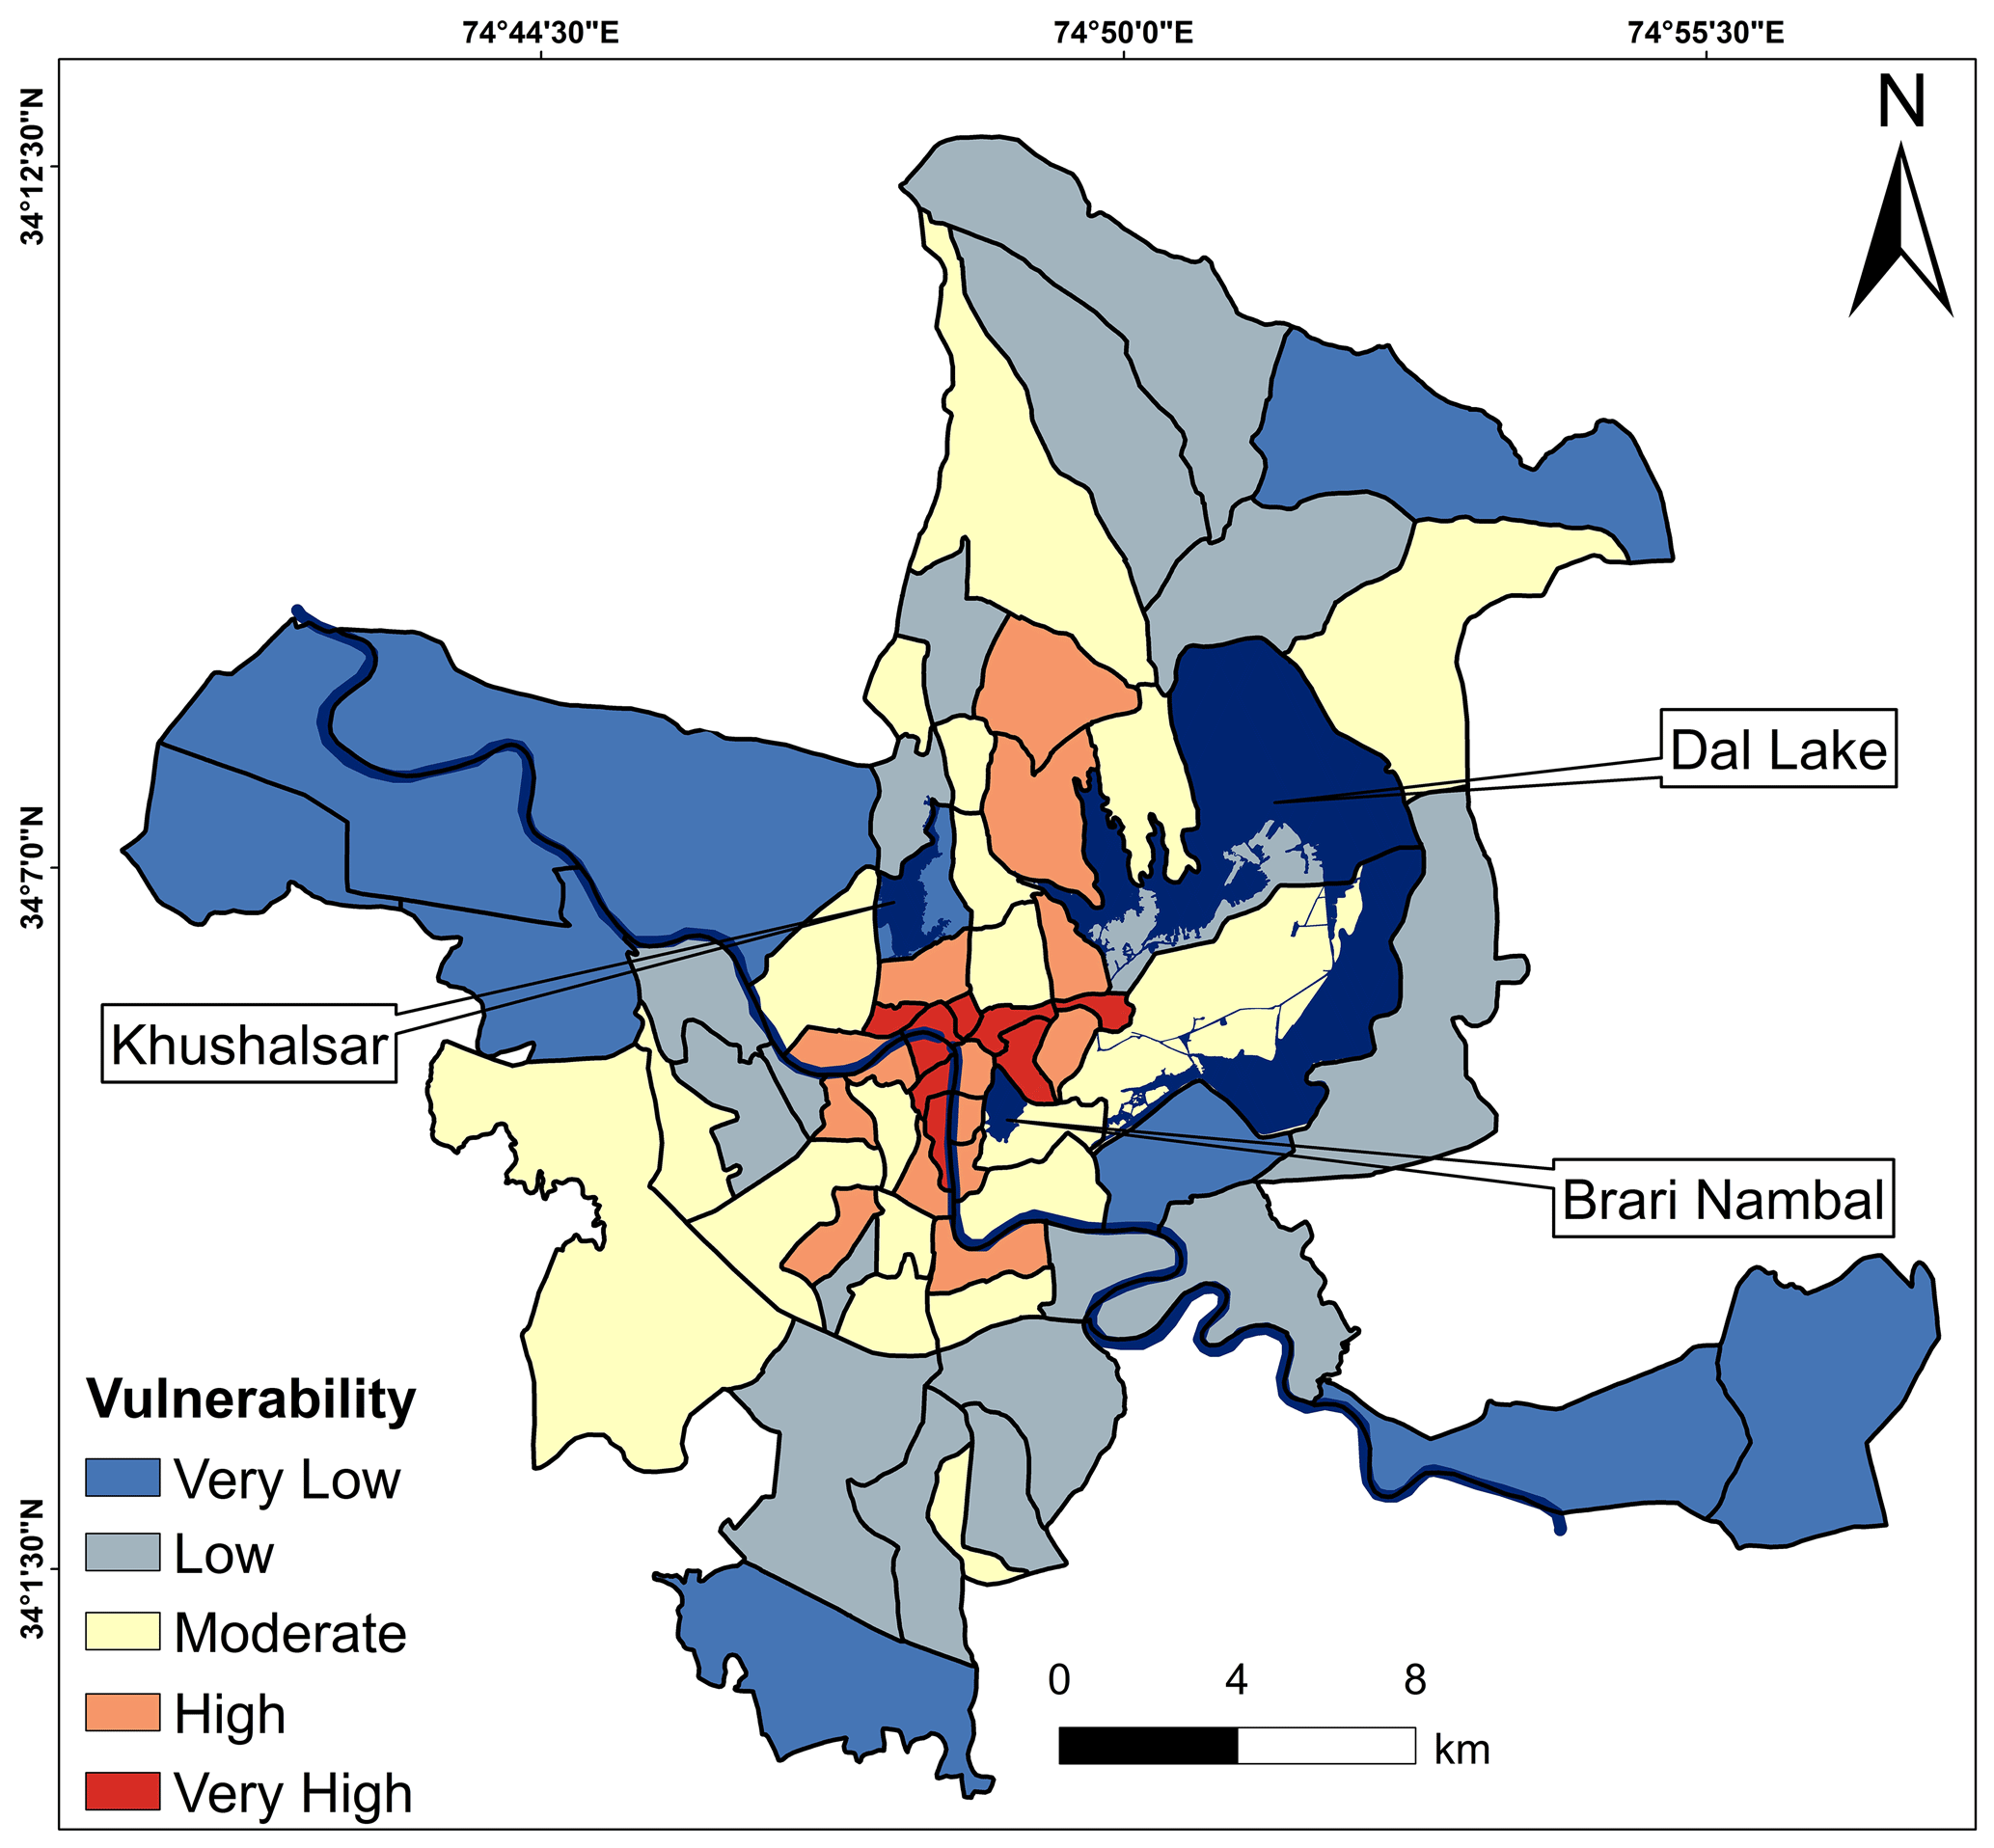
Figure 10Structural vulnerability of Srinagar.
Since a majority of the built-up area in the city is non-engineered, highly dense, irregular, and masonry based, the results indicate that infrastructure development of any type in the very high and high vulnerable zones of the city must adhere to the prescribed building codes and by-laws to achieve the desired resilience to earthquakes. It is pertinent to mention here that wetlands and marshlands were masked in this study and hence not used in the analysis. However, the continued construction of both government and residential buildings in the wetlands and marshy areas of Srinagar, particularly towards the south of the city, is worrisome because it makes these wards in the city more vulnerable to earthquake damage.
The socio-economic conditions of an area play an important role in determining the vulnerability of an area to earthquake hazards. Srinagar has witnessed a population explosion, with the population increasing from 0.25 million in 1961 to 1.5 million in 2011. The city also has a high proportion of female and child residents (59 %) and a population density of 4000 people per square kilometre. Migration from the rural areas and population growth are the primary drivers of this enhanced population expansion in the city (Nengroo et al., 2017). The city has been under pressure to expand its built-up area in order to cater to the population boom, which has also led to excessive resource depletion, widening wealth, and poverty gaps and has deteriorated the environmental and socio-economic conditions (Mitsova et al., 2011; Kamat and Mahasur, 1997). With the mounting demand for new housing in the city, the quality and condition of houses have received negligible attention. These concerns about accelerated population progression, along with high urbanization, have increased the socio-economic vulnerability of the built environment in Srinagar to earthquakes. Furthermore, in the event of a major earthquake, the lack of critical amenities such as trauma hospitals and shelters, as well as poor road conditions in several wards of Srinagar, could result in significant loss of life and property.
Earthquake vulnerability assessment of the built-up environment in Srinagar, if followed by retrofitting, restoration, and rehabilitation initiatives in the most vulnerable wards of the city, will help to reduce the damage during earthquakes. This study can guide city planners in choosing safe and low-density areas for housing and infrastructure development and even help them to evaluate the suitability of the new infrastructural development as envisaged under the 2035 Master Plan. The study has identified densely populated areas that are particularly vulnerable to earthquakes and where no further infrastructural development should be permitted other than the development of open and green spaces. In very high and high earthquake-vulnerable zones, provision for emergency services such as firefighters, shelters, specialized medical facilities, and so on must be made to minimize the loss of life and property in the event of an earthquake. Pre- and post-earthquake disaster mitigation and capacity-building initiatives are critical for transforming Srinagar into a safe, sustainable, and earthquake-resistant city. The challenges surrounding the earthquake threat to Srinagar and the city's preparedness thereof necessitate the adoption of new scientific and innovative urban development planning and inexpensive measures aimed at inculcating a culture of earthquake consciousness among its citizenry. The establishment of a culture of earthquake-resistant and safe construction will undoubtedly make the city safer and reduce the adverse consequences of earthquakes.
Understanding the structural vulnerability of a city situated in a high earthquake-prone zone at a ward scale is critical for deciding the appropriate urban planning and development strategies to build and promote a safe, inclusive, sustainable, and earthquake-resilient living environment as contemplated under SDG 11. The current study, which is the first of its kind for Srinagar, reveals the micro-level structural vulnerability of the built-up environment in the city. The vulnerability zonation map generated for the city reveals that around 32 % of the city has very low vulnerability, which covers 10 municipality wards. The low earthquake vulnerability zone encompasses around 33 % of the city, comprising 17 wards; the moderate vulnerability zone covers around 28 % of the city, comprising 19 wards; the high vulnerability zone covers 5.7 % of the city and 14 wards; and the very high vulnerability zone covers 1.28 % of the city and 9 municipality wards. Overall, about 7 % of the city, covering one-third of the city's municipal wards (n=23), falls into either high or very high earthquake vulnerability zones. The downtown wards in the city's central area are the most vulnerable to earthquakes due to the high population density, high pounding potential, high building density, and narrower streets with little or no open and green areas. Reducing infrastructure development in these neighbourhoods by relocating residents and services to the less congested areas is an intervention that must be undertaken. Since green and open spaces are used as evacuation places, it is strongly advised that new construction in these areas, as well as the development of these spaces, must be avoided. The study underlines the importance of developing emergency action plans that outline how to prevent causalities by allowing for the rapid, selective, and effective utilization of resources as well as retrofitting schemes and capacity-building programmes to safeguard human life and the economy in the city. The current study is in accordance with the 2030 Agenda for SDGs, which recognizes and reiterates the urgent need to lower the risk of disasters. The study will help to reduce the exposure and vulnerability of people to disasters and build resilient infrastructure. The findings of this study will support sensible urban planning, which calls for the construction of resilient infrastructure to reduce vulnerability to natural disasters, as well as sustainable development in line with SDG 11 and SDG 9, which demands manageable population and building densities, user-friendly public spaces, and mixed-use urban development. These findings are consistent with the posteriori knowledge of the study area's vulnerability and will help the urban planners and policymakers in developing future land-use planning and strategies. The socio-economic vulnerability of the city was not analysed in this study, but it would be included in future research to produce a more accurate and holistic assessment of the earthquake vulnerability to better inform policy-making for developing earthquake risk reduction strategies in the city.
This research was done under a sponsored project, and the data collection was done by the investigators through engagement of research staff, some of whom are using the same data for their doctoral research. All the datasets used in the current study are available upon request to the corresponding author, who is one of the main investigators of the project.
SAR: conceptualization, methodology, supervision, paper preparation with inputs from all co-authors. MF: data generation, methodology, formal analysis, field surveys, investigation, paper editing. IR: review and editing. RC: investigation, review and editing.
The contact author has declared that none of the authors has any competing interests.
Publisher’s note: Copernicus Publications remains neutral with regard to jurisdictional claims in published maps and institutional affiliations.
This article is part of the special issue “Estimating and predicting natural hazards and vulnerabilities in the Himalayan region”. It is not associated with a conference.
The research work was conducted under the Ministry of Earth Sciences sponsored research project titled “Geological characterization of the Kashmir valley with the objective of quantifying probabilistic hazard and risk in high risk areas of the valley using a logically integrated set of geoscientific investigations”. The financial assistance received from the sponsors under the project is thankfully acknowledged.
The work was funded by the Ministry of Earth Sciences (MoES), Govt. of India, New Delhi (award no. MoES/P.O.(Geosci)/16/2013).
This paper was edited by Roopam Shukla and reviewed by Moustafa Moufid Kassem and one anonymous referee.
Aghataher, R., Delavar, M. R., Nami, M. H., and Samnay, N.: A fuzzy-AHP decision support system for evaluation of cities vulnerability against earthquakes, World Appl. Sci. J., 3, 66–72, 2008.
Agrawal, S. K. and Chourasia, A.: Estimation of seismic vulnerability of building of delhi municipal area, J. Disaster Develop., 1, 169–185, 2007.
Ahirwal, A., Gupta, K., and Singh, V.: Effect of irregular plan on seismic vulnerability of reinforced concrete buildings, in: AIP Conference Proceedings (Vol. 2158, No. 1, p. 020012), AIP Publishing LLC, https://doi.org/10.1063/1.5127136, 2019.
Ahmad, B., Bhat, M. I., and Bali, B. S.: Historical record of earthquakes in the Kashmir Valley, Himal. Geol., 30, 75–84, 2009.
Ahmad, B., Alam, A., Bhat, M. S., Ahmad, S., Shafi, M., and Rasool, R.: Seismic risk reduction through indigenous architecture in Kashmir Valley, Int. J. Disaster Risk Reduc., 21, 110–117, https://doi.org/10.1016/j.ijdrr.2016.11.005, 2017.
Ahmad, N., Ali, Q., Ashraf, M., Alam, B., and Naeem, A.: Seismic vulnerability of the Himalayan half-dressed rubble stone masonry structures, experimental and analytical studies, Nat. Hazards Earth Syst. Sci., 12, 3441–3454, https://doi.org/10.5194/nhess-12-3441-2012, 2012.
Alam, M. S. and Haque, S. M.: Assessment of urban physical seismic vulnerability using the combination of AHP and TOPSIS models: A case study of residential neighborhoods of Mymensingh city, Bangladesh, J. Geosci. Environ. Protect., 6, 165, https://doi.org/10.4236/gep.2018.62011, 2018.
Alam, M. S. and Mondal, M.: Assessment of sanitation service quality in urban slums of Khulna city based on SERVQUAL and AHP model: A case study of railway slum, Khulna, Bangladesh, J. Urban Manag., 8, 20–27, https://doi.org/10.1016/j.jum.2018.08.002, 2019.
Ali, U. and Ali, S. A.: Comparative response of Kashmir Basin and its surroundings to the earthquake shaking based on various site effects, Soil Dyn. Earthq. Eng., 132, 106046, https://doi.org/10.1016/j.soildyn.2020.106046, 2020.
Alih, S. C. and Vafaei, M.: Performance of reinforced concrete buildings and wooden structures during the 2015 Mw 6.0 Sabah earthquake in Malaysia, Eng. Fail. Anal., 102, 351–368, https://doi.org/10.1016/j.engfailanal.2019.04.056, 2019.
Alizadeh, M., Ngah, I., Hashim, M., Pradhan, B., and Pour, A. B.: A hybrid analytic network process and artificial neural network (ANP-ANN) model for urban earthquake vulnerability assessment, Remote Sens., 10, 975, https://doi.org/10.3390/rs10060975, 2018.
Ambraseys, N. and Jackson, D.: A note on early earthquakes in northern India and southern Tibet, Current Sci., 84, 570–582, 2003.
Amini, H. K., Hosseini, M., Jafari, M. K., and Hosseinioun, S.: Recognition of vulnerable urban fabrics in earthquake zones: a case study of the Tehran metropolitan area, J. Seismol. Earthq. Eng., 10, 4, 2009.
Anagnostopoulos, S. A.: Pounding of buildings in series during earthquakes, Earthq. Eng. Struct. D., 16, 443–456, https://doi.org/10.1002/eqe.4290160311, 1988.
Bahadori, H., Hasheminezhad, A., and Karimi, A.: Development of an integrated model for seismic vulnerability assessment of residential buildings: Application to Mahabad City, Iran, J. Build. Eng., 12, 118–131, https://doi.org/10.1016/j.jobe.2017.05.014, 2017.
Balijepalli, C. and Oppong, O.: Measuring vulnerability of road network considering the extent of serviceability of critical road links in urban areas, J. Transp. Geogr., 39, 145–155, https://doi.org/10.1016/j.jtrangeo.2014.06.025, 2014.
Baruah, S., Boruah, G. K., Sharma, S., Hoque, W. A., Chetia, T., Dey, C., Gogoi, D., Das, P. K., Baruah, S., Basumatari, D., Pathak, J., Barua, A. G., and Choudhury, S.: Seismic vulnerability assessment of earthquake-prone mega-city Shillong, India using geophysical mapping and remote sensing, Georisk: Assessment and Management of Risk for Engineered Systems and Geohazards, 14, 112–127, https://doi.org/10.1080/17499518.2019.1598560, 2020.
Beck, E., André-Poyaud, I., Davoine, P. A., Chardonnel, S., and Lutoff, C.: Risk perception and social vulnerability to earthquakes in Grenoble (French Alps), J. Risk Res., 15, 1245–1260, https://doi.org/10.1080/13669877.2011.652649, 2012.
Behzadian, M., Otaghsara, S. K., Yazdani, M., and Ignatius, J.: A state-of the-art survey of TOPSIS applications, Expert Syst. Appl., 39, 13051–13069, https://doi.org/10.1016/j.eswa.2012.05.056, 2012.
Bhat, S., Ahmad, A., Bhat, M. S., Zahoor, A. N., Kuchay N. A., Bhat, M. S., Mayer A. I., and Sabar, M.: Analysis and simulation of urban expansion of Srinagar city, Sciences, 2249, 2224–5766, https://doi.org/ 10.5897/IJPC2015.0314, 2012.
Bhosale, A., Davis, R., and Sarkar, P.: New seismic vulnerability index for vertically irregular buildings, ASCE-ASME J. Risk Uncertainty Eng. Syst. A, 4, 04018022, https://doi.org/10.1061/AJRUA6.0000973, 2018.
Bilham, R.: Himalayan earthquakes: a review of historical seismicity and early 21st century slip potential, Geological Society, London, Special Publications, 483, 423–482, https://doi.org/10.1144/SP483.16, 2019.
Bilham, R. and Bali, B. S.: A ninth century earthquake-induced landslide and flood in the Kashmir Valley, and earthquake damage to Kashmir's Medieval temples, B. Earthq. Eng., 12, 79–109, https://doi.org/10.1007/s10518-013-9504-x, 2014.
Bilham, R., Bali, B. S., Bhat, M. I., and Hough, S.: Historical earthquakes in Srinagar, Kashmir: clues from the Shiva temple at Pandrethan, Ancient Earthq., 471, 110–117, 2010.
Bono, F. and Gutiérrez, E.: A network-based analysis of the impact of structural damage on urban accessibility following a disaster: the case of the seismically damaged Port Au Prince and Carrefour urban road networks, J. Transp. Geogr., 19, 1443–1455, https://doi.org/10.1016/j.jtrangeo.2011.08.002, 2011.
Chandra, R., Dar, J. A., Romshoo, S. A., Rashid, I., Parvez, I. A., Mir, S. A., and Fayaz, M.: Seismic hazard and probability assessment of Kashmir valley, northwest Himalaya, India, Nat. Hazards, 93, 1451–1477, https://doi.org/10.1007/s11069-018-3362-4, 2018.
Dar, R. A., Mir, S. A., and Romshoo, S. A.: Influence of geomorphic and anthropogenic activities on channel morphology of River Jhelum in Kashmir Valley, NW Himalayas, Quatern. Int., 507, 333–341, https://doi.org/10.1016/j.quaint.2018.12.014, 2019.
Duzgun, H. S. B., Yucemen, M. S., Kalaycioglu, H. S., Celik, K. E. Z. B. A. N., Kemec, S., Ertugay, K., and Deniz, A.: An integrated earthquake vulnerability assessment framework for urban areas, Nat. Hazards, 59, 917–947, https://doi.org/10.1007/s11069-011-9808-6, 2011.
Düzgün, H. S., Yücemen, M. S., and Kalaycioglu, H. S.: An Integrated Approach for Urban Earthquake Vulnerability Analyses, In EGU General Assembly Conference Abstracts (p. 6661), http://meetings.copernicus.org/egu2009 (last access: 1 September 2021), 2009.
Erden, T. and Karaman, H.: Analysis of earthquake parameters to generate hazard maps by integrating AHP and GIS for Küçükçekmece region, Nat. Hazards Earth Syst. Sci., 12, 475–483, https://doi.org/10.5194/nhess-12-475-2012, 2012.
Farooq, M., and Muslim, M.: Dynamics and forecasting of population growth and urban expansion in Srinagar City-A Geospatial Approach, International Archives of Photogrammetry, Remote Sens. Spatial Info. Sci., 40, 709–716, https://doi.org/10.5194/isprsarchives-XL-8-709-2014, 2014.
Federal Emergency Management Agency 1998 FEMA 310 Handbook for the Seismic Evaluation of Buildings: A Pre-standard 40 (Washington, DC: Federal Emergency Management Agency), Chapter 04, 22 pp., Sect. 4.3.1.2, 1998.
Füssel, H. M.: Review and quantitative analysis of indices of climate change exposure, adaptive capacity, sensitivity, and impacts, http://hdl.handle.net/10986/9193 (last access: August 2021), 2010.
Gioncu, V. and Mazzolani, F.: Earthquake engineering for structural design, CRC Press, 549–550, 2010.
Golla, A. P. S., Bhattacharya, S. P., and Gupta, S.: The accessibility of urban neighborhoods when buildings collapse due to an earthquake, Transportation Res. D, 86, 102439, https://doi.org/10.1016/j.trd.2020.102439, 2020.
Gupta, S. V., Parvez, I. A., Ankit, Khan, P. K., and Chandra, R.: Site effects investigation in Srinagar city of Kashmir basin using microtremor and its inversion, J. Earthq. Eng., 26, 1–22, https://doi.org/10.1080/13632469.2020.1816232, 2020.
Han, J., Kim, J., Park, S., Son, S., and Ryu, M.: Seismic vulnerability assessment and mapping of Gyeongju, South Korea using frequency ratio, decision tree, and random forest, Sustainability, 12, 7787, https://doi.org/10.3390/su12187787, 2020.
Hashemi, M. and Alesheikh, A. A.: Development and implementation of a GIS-based tool for spatial modeling of seismic vulnerability of Tehran, Nat. Hazards Earth Syst. Sci., 12, 3659–3670, https://doi.org/10.5194/nhess-12-3659-2012, 2012.
Hicyilmaz, K. M. O., Wilcock, T., Izatt, C., Da Silva, J., and Langenbach, R.: Seismic performance of dhajji dewari, in: 15th World Conference on Earthquake Engineering, Lisbon, ISBN 978-1-63439-651-6, 15933–15942, 2012.
Huang, F., Yu, Y., and Feng, T.: Automatic building change image quality assessment in high resolution remote sensing based on deep learning, J. Vis. Commun. Image R., 63, 102585, https://doi.org/10.1016/j.jvcir.2019.102585, 2019.
Hwang, C. L., Lai, Y. J., and Liu, T. Y.: A new approach for multiple objective decision making, Comput. Oper. Res., 20, 889–899, https://doi.org/10.1016/0305-0548(93)90109-V, 1993.
Iyengar, R. N. and Sharma, D.: Some earthquakes of Kashmir from historical sources, Current Sci., 71, 330–331, 1996.
Iyengar, R. N., Sharma, D., and Siddiqui, J. M.: Earthquake history of India in medieval times, Indian J. History Sci., 34, 181–238, 1999.
Jena, R. and Pradhan, B.: Integrated ANN-cross-validation and AHP-TOPSIS model to improve earthquake risk assessment, Int. J. Disaster Risk Reduc., 50, 101723, https://doi.org/10.1016/j.ijdrr.2020.101723, 2020.
Jena, R., Pradhan, B., and Beydoun, G.: Earthquake vulnerability assessment in Northern Sumatra province by using a multi-criteria decision-making model, Int. J. Disaster Risk Reduc., 46, 101518, https://doi.org/10.1016/j.ijdrr.2020.101518, 2020.
Jena, R., Naik, S. P., Pradhan, B., Beydoun, G., Park, H. J., and Alamri, A.: Earthquake vulnerability assessment for the Indian subcontinent using the Long Short-Term Memory model (LSTM), Int. J. Disaster Risk Reduc., 66, 102642, https://doi.org/10.1016/j.ijdrr.2021.102642, 2021.
Jia, L. J., Xiang, P., Wu, M., and Nishitani, A.: Swing story–lateral force resisting system connected with dampers: Novel seismic vibration control system for building structures, J. Eng. Mechan., 144, 04017159, https://doi.org/10.1061/(ASCE)EM.1943-7889.0001390, 2018.
Joshi, D. and Kumar, S.: Intuitionistic fuzzy entropy and distance measure based TOPSIS method for multi-criteria decision making, Egyptian Info. J., 15, 97–104, https://doi.org/10.1016/j.eij.2014.03.002, 2014.
Kamat, S. R. and Mahasur, A. A.: Air pollution: slow poisoning Chennai, The Hindu Survey of Environment, https://scholar.google.com/scholar_lookup?title=Air pollution:slow poisoning&publication_year=1997&author=S.R. Kamat&author=A.A. Mahasur (last access: 24 April 2023), 1997.
Kircher, C. A., Nassar, A. A., Kustu, O., and Holmes, W. T.: Development of building damage functions for earthquake loss estimation, Earthq. Spec., 13, 663–682, https://doi.org/10.1193%2F1.1585974, 1997.
Kjekstad, O. and Highland, L.: Economic and social impacts of landslides, in: Landslides–disaster risk reduction, 573–587 pp., Springer, Berlin, Heidelberg, https://doi.org/10.1007/978-3-540-69970-5, 2009.
Kontoes, C., Herekakis, T., Ieronymidi, E., Keramitsoglou, I., Fokaefs, A., Papadopoulos, G. A., Paralikidis, S., Aifantopoulou, D., Deflorio, A. Maria., Lasillo, D., and Kiranoudis, C. T.: Mapping seismic vulnerability and risk of cities: the MASSIVE project, J. Earth Sci. Eng., 2, 496, https://doi.org/10.17265/2159-581X/2012.08.006, 2012.
Kumar, K. V., Martha, T. R., and Roy, P. S.: Mapping damage in the Jammu and Kashmir caused by 8 October 2005 Mw 7.3 earthquake from the Cartosat–1 and Resourcesat–1 imagery, Int. J. Remote Sens., 27, 4449–4459, https://doi.org/10.1080/01431160600702376, 2006.
Lang, D. H., Kumar, A., Sulaymanov, S., and Meslem, A.: Building typology classification and earthquake vulnerability scale of Central and South Asian building stock, J. Build. Eng., 15, 261–277, https://doi.org/10.1016/j.jobe.2017.11.022, 2018.
Langenbach, R.: Don't Tear It Down! Preserving the Earthquake Resistant Vernacular Architecture of Kashmir – Text and Photographs by Randolph Langenbach, India: Vernacular Architecture of Kashmir – United Nations Educational, Scientific and Cultural Organization (UNESCO), ISBN 978-81-89218-20-1, 2009.
Langenbach, R.: From “Opus Craticium” to the “Chicago Frame”: earthquake-resistant traditional construction, Int. J. Archit. Herit., 1, 29–59, https://doi.org/10.1080/15583050601125998, 2007.
Lantada, N., Pujades, L. G., and Barbat, A. H.: Vulnerability index and capacity spectrum based methods for urban seismic risk evaluation, A comparison, Nat. hazards, 51, 501–524, https://doi.org/10.1007/s11069-007-9212-4, 2009.
Lawrence, W. R.: The Valley of Kashmir. Henry Froude, London, p. 478, 1895.
Lee, S., Panahi, M., Pourghasemi, H. Reza., Shahabi, H., Alizadeh, M., Shirzadi, A., Khosravi, K., Melesse, A. M., Yekrangnia, M., Rezaie, F., Moeini, H., Pham, B.Thai., and Ahmad, B. B.: Sevucas: A novel gis-based machine learning software for seismic vulnerability assessment, Appl. Sci., 9, 3495, https://doi.org/10.3390/app9173495, 2019.
Li, W., He, C., Fang, J., Zheng, J., Fu, H., and Yu, L.: Semantic segmentation-based building footprint extraction using very high-resolution satellite images and multi-source GIS data, Remote Sens., 11, 403, https://doi.org/10.3390/rs11040403, 2019.
Lu, X., Zhang, Q., Weng, D., Zhou, Z., Wang, S., Mahin, S. A., Ding, S., and Qian, F.: Improving performance of a super tall building using a new eddy-current tuned mass damper, Struct. Control Hlth., 24, e1882, https://doi.org/10.1002/stc.1882, 2017.
Mazza, F.: Modelling and nonlinear static analysis of reinforced concrete framed buildings irregular in plan, Eng. Struct., 80, 98–108, https://doi.org/10.1016/j.engstruct.2014.08.026, 2014.
Meier, H. R. and Will, T.: Cultural heritage and natural disasters: risk preparedness and the limits of prevention Kulturerbe und Naturkatastrophen: Möglichkeiten und Grenzen der Prävention, United Nations Educational, Scientific and Cultural Organization (UNESCO), 9–20 pp., ISBN 978-3-940046-64-2, 2008.
Mili, R. R., Hosseini, K. A., and Izadkhah, Y. O.: Developing a holistic model for earthquake risk assessment and disaster management interventions in urban fabrics, Int. J. Disaster Risk Reduc., 27, 355–365, https://doi.org/10.1016/j.ijdrr.2017.10.022, 2018.
Mir, R. R., Parvez, I. A., Gaur, V. K., Chandra, R., and Romshoo, S. A.: Crustal structure beneath the Kashmir basin adjoining the Western Himalayan syntaxis, B. Seismol. Soc. Am., 107, 2443–2458, https://doi.org/10.1785/0120150334, 2017.
Mitsova, D., Shuster, W., and Wang, X.: A cellular automata model of land cover change to integrate urban growth with open space conservation, Landscape Urban Plan., 99, 141–153, https://doi.org/10.1016/j.landurbplan.2010.10.001, 2011.
Mouroux, P. and Brun, B. L.: Presentation of RISK-UE project, B. Earthq. Eng., 4, 323–339, https://doi.org/10.1007/s10518-006-9020-3, 2006.
Nath, S. K., Adhikari, M. D., Devaraj, N., and Maiti, S. K.: Seismic vulnerability and risk assessment of Kolkata City, India, Nat. Hazards Earth Syst. Sci., 15, 1103–1121, https://doi.org/10.5194/nhess-15-1103-2015, 2015.
Nengroo, Z. A., Bhat, M. S., and Kuchay, N. A.: Measuring urban sprawl of Srinagar city, Jammu and Kashmir, India, J. Urban Manag., 6, 45–55, https://doi.org/10.1016/j.jum.2017.08.001, 2017.
Nyimbili, P. H., Erden, T., and Karaman, H.: Integration of GIS, AHP and TOPSIS for earthquake hazard analysis, Nat. hazards, 92, 1523–1546, https://doi.org/10.1007/s11069-018-3262-7, 2018.
Oliveira, C. S.: Seismic vulnerability of historical constructions: a contribution, B. Earthq. Eng., 1, 37–82, https://doi.org/10.1023/A:1024805410454, 2003.
Panahi, M., Rezaie, F., and Meshkani, S. A.: Seismic vulnerability assessment of school buildings in Tehran city based on AHP and GIS, Nat. Hazards Earth Syst. Sci., 14, 969–979, https://doi.org/10.5194/nhess-14-969-2014, 2014.
Parry, J. A., Ganaie, S. A., Nengroo, Z. A., and Bhat, M. S.: Spatial Analysis on the provision of Urban Amenities and their Deficiencies-A Case Study of Srinagar City, Jammu and Kashmir, India, Res. Human. Soc. Sci., 2, 192–218, 2012.
Pathak, J.: Earthquake vulnerability assessment of Guwahati urban centre, in: Proceedings of the 14th World Conference on Earthquake Engineering, The 14th World Conference on Earthquake Engineering (http://www.iitk.ac.in/, last access: 24 April 2023), WCEE'2008, 2008.
Priestley, M. J. N.: Performance based seismic design, B. New Zealand Soc. Earthq. Eng., 33, 325–346, https://doi.org/10.5459/bnzsee.33.3.325-346, 2000.
Rahman, N., Ansary, M. A., and Islam, I.: GIS based mapping of vulnerability to earthquake and fire hazard in Dhaka city, Bangladesh, Int. J. Disaster Risk Reduc., 13, 291–300, https://doi.org/10.1016/j.ijdrr.2015.07.003, 2015.
Rajendran, C. P. and Rajendran, K.: The status of central seismic gap: a perspective based on the spatial and temporal aspects of the large Himalayan earthquakes, Tectonophysics, 395, 19–39, https://doi.org/10.1016/j.tecto.2004.09.009, 2005.
Rashed, T. and Weeks, J.: Assessing vulnerability to earthquake hazards through spatial multicriteria analysis of urban areas, Int. J. Geogr. Info. Sci., 17, 547–576, https://doi.org/10.1080/1365881031000114071, 2003.
Rashid, I., Romshoo, S. A., and Abdullah, T.: The recent deglaciation of Kolahoi valley in Kashmir Himalaya, India in response to the changing climate, J. Asian Earth Sci., 138, 38–50, https://doi.org/10.1016/j.jseaes.2017.02.002, 2017.
Rautela, P., Joshi, G. C., Bhaisora, B., Dhyani, C., Ghildiyal, S., and Rawat, A.: Seismic vulnerability of Nainital and Mussoorie, two major Lesser Himalayan tourist destinations of India, Int. J. Disaster Risk Reduc., 13, 400–408, https://doi.org/10.1016/j.ijdrr.2015.08.008, 2015.
Rezaie, F. and Panahi, M.: GIS modeling of seismic vulnerability of residential fabrics considering geotechnical, structural, social and physical distance indicators in Tehran using multi-criteria decision-making techniques, Nat. Hazards Earth Syst. Sci., 15, 461–474, https://doi.org/10.5194/nhess-15-461-2015, 2015.
Riedel, I., Guéguen, P., Dalla Mura, M., Pathier, E., Leduc, T., and Chanussot, J.: Seismic vulnerability assessment of urban environments in moderate-to-low seismic hazard regions using association rule learning and support vector machine methods, Nat. Hazards, 76, 1111–1141, https://doi.org/10.1007/s11069-014-1538-0, 2015.
Ritchie, H. and Roser, M.: Urbanization, https://ourworldindata.org/urbanization (last access: 24 April 2023), 2019.
Saaty, T. L.: The Analytic Hierarchy Process Mcgraw Hill (This book has been translated into Chinese by S. Xu et al.; information is available from them at the Inst. of Systems Engineering, Tianjin Univ., Tianjin, China), New York, 324, 1980.
Sana, H. and Nath, S. K.: Liquefaction potential analysis of the Kashmir valley alluvium, NW Himalaya, Soil Dynam. Earthq. Eng., 85, 11–18, https://doi.org/10.1016/j.soildyn.2016.03.009, 2016.
Sana, H.: Seismic microzonation of Srinagar city, Jammu and Kashmir, Soil Dynam. Earthq. Eng., 115, 578–588, https://doi.org/10.1016/j.soildyn.2018.09.028, 2018.
Sandhu, S., Gupta, K., Khatriker, S., Bhardwaj, A., and Kumar, P.: Evaluation of Cartosat-2E Data for Large-Scale Urban Mapping, J. Indian Soc. Remote Sens., 49, 1593–1602, https://doi.org/10.1007/s12524-021-01337-2, 2021.
Saputra, A., Rahardianto, T., Revindo, M. D., Delikostidis, I., Hadmoko, D. S., Sartohadi, J., and Gomez, C.: Seismic vulnerability assessment of residential buildings using logistic regression and geographic information system (GIS) in Pleret Sub District (Yogyakarta, Indonesia), Geoenviron. Disasters, 4, 1–33, https://doi.org/10.1186/s40677-017-0075-z, 2017.
Shadmaan, M. S. and Islam, M. A. I.: Estimation of earthquake vulnerability by using analytical hierarchy process, Nat. Hazards Res., 1, 153–160, https://doi.org/10.1016/j.nhres.2021.10.005, 2021.
Sinha, N., Priyanka, N., and Joshi, P. K.: Using spatial multi-criteria analysis and ranking tool (SMART) in earthquake risk assessment: A case study of Delhi region, India, Geomatics, Nat. Hazards Risk, 7, 680–701, https://doi.org/10.1080/19475705.2014.945100, 2016.
Somvanshi, S. S., Kunwar, P., Tomar, S., and Singh, M.: Comparative statistical analysis of the quality of image enhancement techniques, Int. J. Image Data Fusion, 9, 131–151, https://doi.org/10.1080/19479832.2017.1355336, 2018.
Stein, S. A.: Kalhana's Rajatarangini, or Chronicle of the Kings of Kashmir, Education Society's Press, Sanskrit Text with Critical Notes, Bombay, p. 296, 1892.
Stein, A. S.: Kalhana's Rajatarangini: a Chronicle of the Kings of Kashmir, Constable and Co, Calcutta 2, translated by: Stein, M. Aurel, 1. Calcutta Delhi: Constable and Coreprint Motilal Banarsidass Publishers, 555, 1898.
Vigne, G. T.: Travels in Kashmir, Ladak and Iskardo, the Countries Adjoining the Mountain Course of the Indus and the Himalaya, North of Panjab, with Map, 2nd Edn, H. Colburn, London, 1, 406, 1844.
Yariyan, P., Avand, M., Soltani, F., Ghorbanzadeh, O., and Blaschke, T.: Earthquake vulnerability mapping using different hybrid models, Symmetry, 12, 405, https://doi.org/10.3390/sym12030405, 2020.
Yousuf, M., Bukhari, S. K., Bhat, G. R., and Ali, A.: Understanding and managing earthquake hazard visa viz disaster mitigation strategies in Kashmir valley, NW Himalaya, Prog. Disaster Sci., 5, 100064, https://doi.org/10.1016/j.pdisas.2020.100064, 2020.
Zanini, M. A., Faleschini, F., Zampieri, P., Pellegrino, C., Gecchele, G., Gastaldi, M., and Rossi, R.: Post-quake urban road network functionality assessment for seismic emergency management in historical centres, Struct. Infrastruct. E., 13, 1117–1129, https://doi.org/10.1080/15732479.2016.1244211, 2017.