the Creative Commons Attribution 4.0 License.
the Creative Commons Attribution 4.0 License.
 | 17 Jan 2023
Classifying marine faults for hazard assessment offshore Israel: a new approach based on fault size and vertical displacement
Zohar Gvirtzman
For many countries, the methodology for offshore geohazard mitigation lags far behind the well-established onshore methodology. Particularly complicated is the assessment of fault hazard in the marine environment. The determination of whether a fault is active or not requires ultra-high-resolution seismic surveys and multiple coring and, unfortunately, frequently ends with uncertain results. Moreover, if a pipeline must cross a fault, it is not enough to determine whether the fault is active; slip rates are needed for resistant planning.
Here we suggest a new approach for fault hazard assessment for the master planning of infrastructure. We provide planners a way to choose a route that will cross the least hazardous faults; these faults will then be investigated in site-specific surveys for slip rates that will allow seismic design. Instead of following the onshore practice that is hard to implement in the marine environment, we suggest taking advantage of the marine environment where seismic data are commonly better in quantity and quality. Based on existing industrial 3D seismic surveys, we measure for each fault in the study area the amount of its recent (in our specific case, 350 ka) vertical displacement and the size of its plane. According to these two independently measured quantities, we classify the faults into three hazard levels. This allows planners to choose infrastructure routes that cross the least hazardous faults at an early stage of planning and direct them to sites that need further investigation.
Our case study is the Israeli continental slope, where numerous salt-related, thin-skinned, normal faults dissect the seabed, forming tens of meters high scarps. A particular hazardous zone is the upper slope south of the Dor disturbance, where a series of big listric faults rupture the seabed in an area where the sedimentation rate is 4 times faster than the vertical displacement rate. We suggest that this indicates exceptionally fast creep, seismic rupture, or rapid tremor and slip episodes.
- Article
(20768 KB) - Full-text XML
- BibTeX
- EndNote


The need for geohazard assessment in the marine environment is increasing globally due to the growing number of infrastructures laid on the seafloor. To mitigate marine geohazards, numerous studies have been conducted in many world basins (Georgia Basin, Barrie et al., 2005; Sea of Marmara, Armijo et al., 2005; Gulf of Mexico, Prior and Hooper, 1999; offshore California, Clark et al., 1985, and references therein; Norwegian Sea, Shmatkova et al., 2015; Italian continental margins, Chiocci and Ridente, 2011; and more). Some of these studies focus on submarine landslides, and when faults are considered, they are sometimes treated as static seabed obstacles. Note, however, that even extremely accurate mapping of the seafloor does not provide the information needed to determine whether the fault is active or not.
Onshore, the criteria for fault activity is based on displacement of dated stratigraphic markers – 11 kyr (California, Bryant and Hart, 2007), 13 kyr (Israel, Sagy et al., 2013), and even older (see Styron and Pagani, 2020, compilation for examples). To determine if a specific fault is active, the continuation or displacement of the chosen marker is examined in outcrops or trenches.
In the marine environment, such an approach is much more complicated and requires high-resolution seismic surveys and core analyses (Posamentier, 2000; Kvalstad, 2007; Hough et al., 2011). Commonly a site-specific survey includes four steps (Prior and Hooper, 1999; Angell et al., 2003): (a) mapping the seafloor, (b) establishing a chronostratigraphic scheme by tying high-resolution seismic data to dated horizons in boreholes, (c) structural mapping of the fault and displacement measurements, and (d) geological interpretation and quantification. This commonly used approach is problematic because each survey requires months of work and frequently yields uncertain results.
One practical option is to define all faults rupturing the seabed as active faults in the absence of age information (On, 2016). This approach is based on the rationale that faults are likely active if they are identified at the seabed despite sedimentation. Note, however, that fault scarps can remain hundreds of thousands of years on the seabed without any additional jump if the sedimentation rate is lower than the displacement rate.
Another approach is to apply a probabilistic fault displacement hazard assessment (PFDHA, Wong and Stepp, 1998; Youngs et al., 2003; Angell et al., 2003), analogs to the practice developed for earthquake ground motion prediction (PSHA, Cornell, 1968, 1971). Such analysis provides a graph showing the annual frequency calculated for various displacement values. This probabilistic approach requires assumptions regarding (1) creep versus seismic slip and (2) the number of seismic events that had produced an observed displacement. In the case studied here (offshore Israel), we do not know if the studied faults produce earthquakes at all (maybe they only creep). Furthermore, if they produce earthquakes, we do not have any information about the magnitudes–frequency relationships. Thus, it seems that this approach will not yield robust results in our case.
The goal of this study is to provide a practical and relatively fast solution for early-stage planning of marine infrastructure that must cross a faulted zone. For instance, there is no choice in the case studied here, and planning requires a route that will cross the least hazardous faults. For this, we need criteria to determine the relative fault displacement hazard level. We base this determination on the amount of recent vertical displacement and the size of the fault plane. We assume that bigger faults with larger past displacements have a greater potential for larger future ruptures.
Our analysis takes advantage of the wealth of high-resolution seismic data frequently available offshore. Instead of investing in multiple coring to find out whether or not each specific fault in the study area displaces a recently dated horizon (a practice that frequently fails to provide an answer), we measure the vertical displacement of a 350 ka horizon (the most recent-dated horizon that covers all our research area) and the area of the fault plane. These two parameters are tough to measure in seismic data usually available on land and are easily measured in high-resolution surveys frequently available offshore.
2.1 Geological history of the Levant Basin
The Levant Basin was formed in the late Paleozoic and early Mesozoic, alongside the opening of the Tethys Ocean that had separated Africa from Eurasia (Garfunkel and Almagor, 1984; Garfunkel, 1988, 1998; Robertson, 1998). At that time, several rifting phases created a system of horsts and grabens spreading from the northern Negev northwestwards into the Levant Basin (Bein and Gvirtzman, 1977; Garfunkel and Almagor, 1984; Garfunkel, 1988, 1998; Robertson, 1998). After the rifting stage, approximately at the end of the Early Jurassic (∼ 180 Ma), the Levant continental margins turned passive and continued to accumulate sediments for more than 100 million years (Gvirtzman and Garfunkel, 1997, 1998; Steinberg et al., 2008; Bar et al., 2013).
At the end of the Turonian and the beginning of the Santonian (∼ 84 Ma), a change in the relative movement between Africa and Eurasia led to a change in the stress regime and folding along the Syrian Arc began (Krenkel, 1924; Henson, 1951; De-Sitter, 1962; Freund et al., 1975; Reches and Hoexter, 1981; Eyal and Reches, 1983; Sagy et al., 2018).
About 35 million years ago, a large area, including east Africa and northern Arabia, started rising above sea level. This process provided large amounts of clastic sediments to the Levant Basin, where the sedimentation rate increased significantly (Gvirtzman et al., 2008; Steinberg et al., 2011; Avni et al., 2012; Bar et al., 2016, 2013). These clastic sediments compose the Saqiye Group, which thickens from tens of hundreds of meters in the Israeli coasts to 1.5 km in the continental shelf area (Gvirtzman and Buchbinder, 1978) and 6 km in the deep Levant Basin (Steinberg et al., 2011).
About 6 million years ago, the connection between the Mediterranean Sea and the Atlantic Ocean was restricted during a short event termed the Messinian Salinity Crisis (MSC). During the crisis, the sea level dropped, and an evaporite sequence a few kilometers thick accumulated in the entire Mediterranean Sea (e.g., Ryan and Hsü, 1973; Hsü et al., 1973). The salt sequence offshore Israel is nearly 2 km thick in the deepest portion of the basin, thinning landwards and nearly pinching out to zero beneath the continental slope (Ryan and Cita, 1978; Mart and Gai, 1982; Gradmann et al., 2005; Bertoni and Cartwright, 2006; Netzeband et al., 2006; Gvirtzman et al., 2013, 2017).
In the Pliocene, the Nile, one of the largest rivers in the world, supplied a huge amount of sediments to the eastern Mediterranean that buried the Messinian salt and produced a giant delta with a well-developed deep-sea fan (Mascle et al., 2001). Alongshore currents transporting sediments from the Nile Delta through the Sinai coast to the Israeli coast gradually formed the continental shelf offshore Israel (Gvirtzman and Buchbinder, 1978; Goldsmith and Golik, 1980; Carmel et al., 1985; Stanley, 1989; Tibor et al., 1992; Buchbinder et al., 1993; Golik, 1993, 2002; Buchbinder and Zilberman, 1997; Perlin and Kit, 1999; Ben-Gai et al., 2005; Zviely et al., 2006, 2007; Klein et al., 2007; Schattner et al., 2015; Schattner and Lazar, 2016; Zucker et al., 2021). The slope of this continental shelf is currently faulted by faults, which are the target of this study.
2.2 Regional tectonic activity
It is generally agreed that the Levant continental margin is passive since the Middle Jurassic (Garfunkel, 1988; Gvirtzman et al., 2008) with no deep-seated active faults south of Mount Carmel (Fig. 1a). Neev et al. (1973) and Neev (1975) debated this consensus, suggesting that an active fault, which they named the Pelusium Line, runs all along the Israeli continental margin. On the other side, Garfunkel and Derin (1984) and Garfunkel (1988), argued that all faults crossing the Pliocene–Quaternary section offshore Israel are thin-skinned and salt-related. Nearly 30 years later, based on better seismic data, Gvirtzman et al. (2008) and Gvirtzman and Steinberg (2012) showed that a continental margin fault zone (CMFZ) does exist approximately at the same location marked by Neev et al. (1973), but this line stopped operating in the Miocene. The deep-seated faults along the CMFZ (∼ Pelusium Line) are sealed with Miocene strata and do not reach the surface.
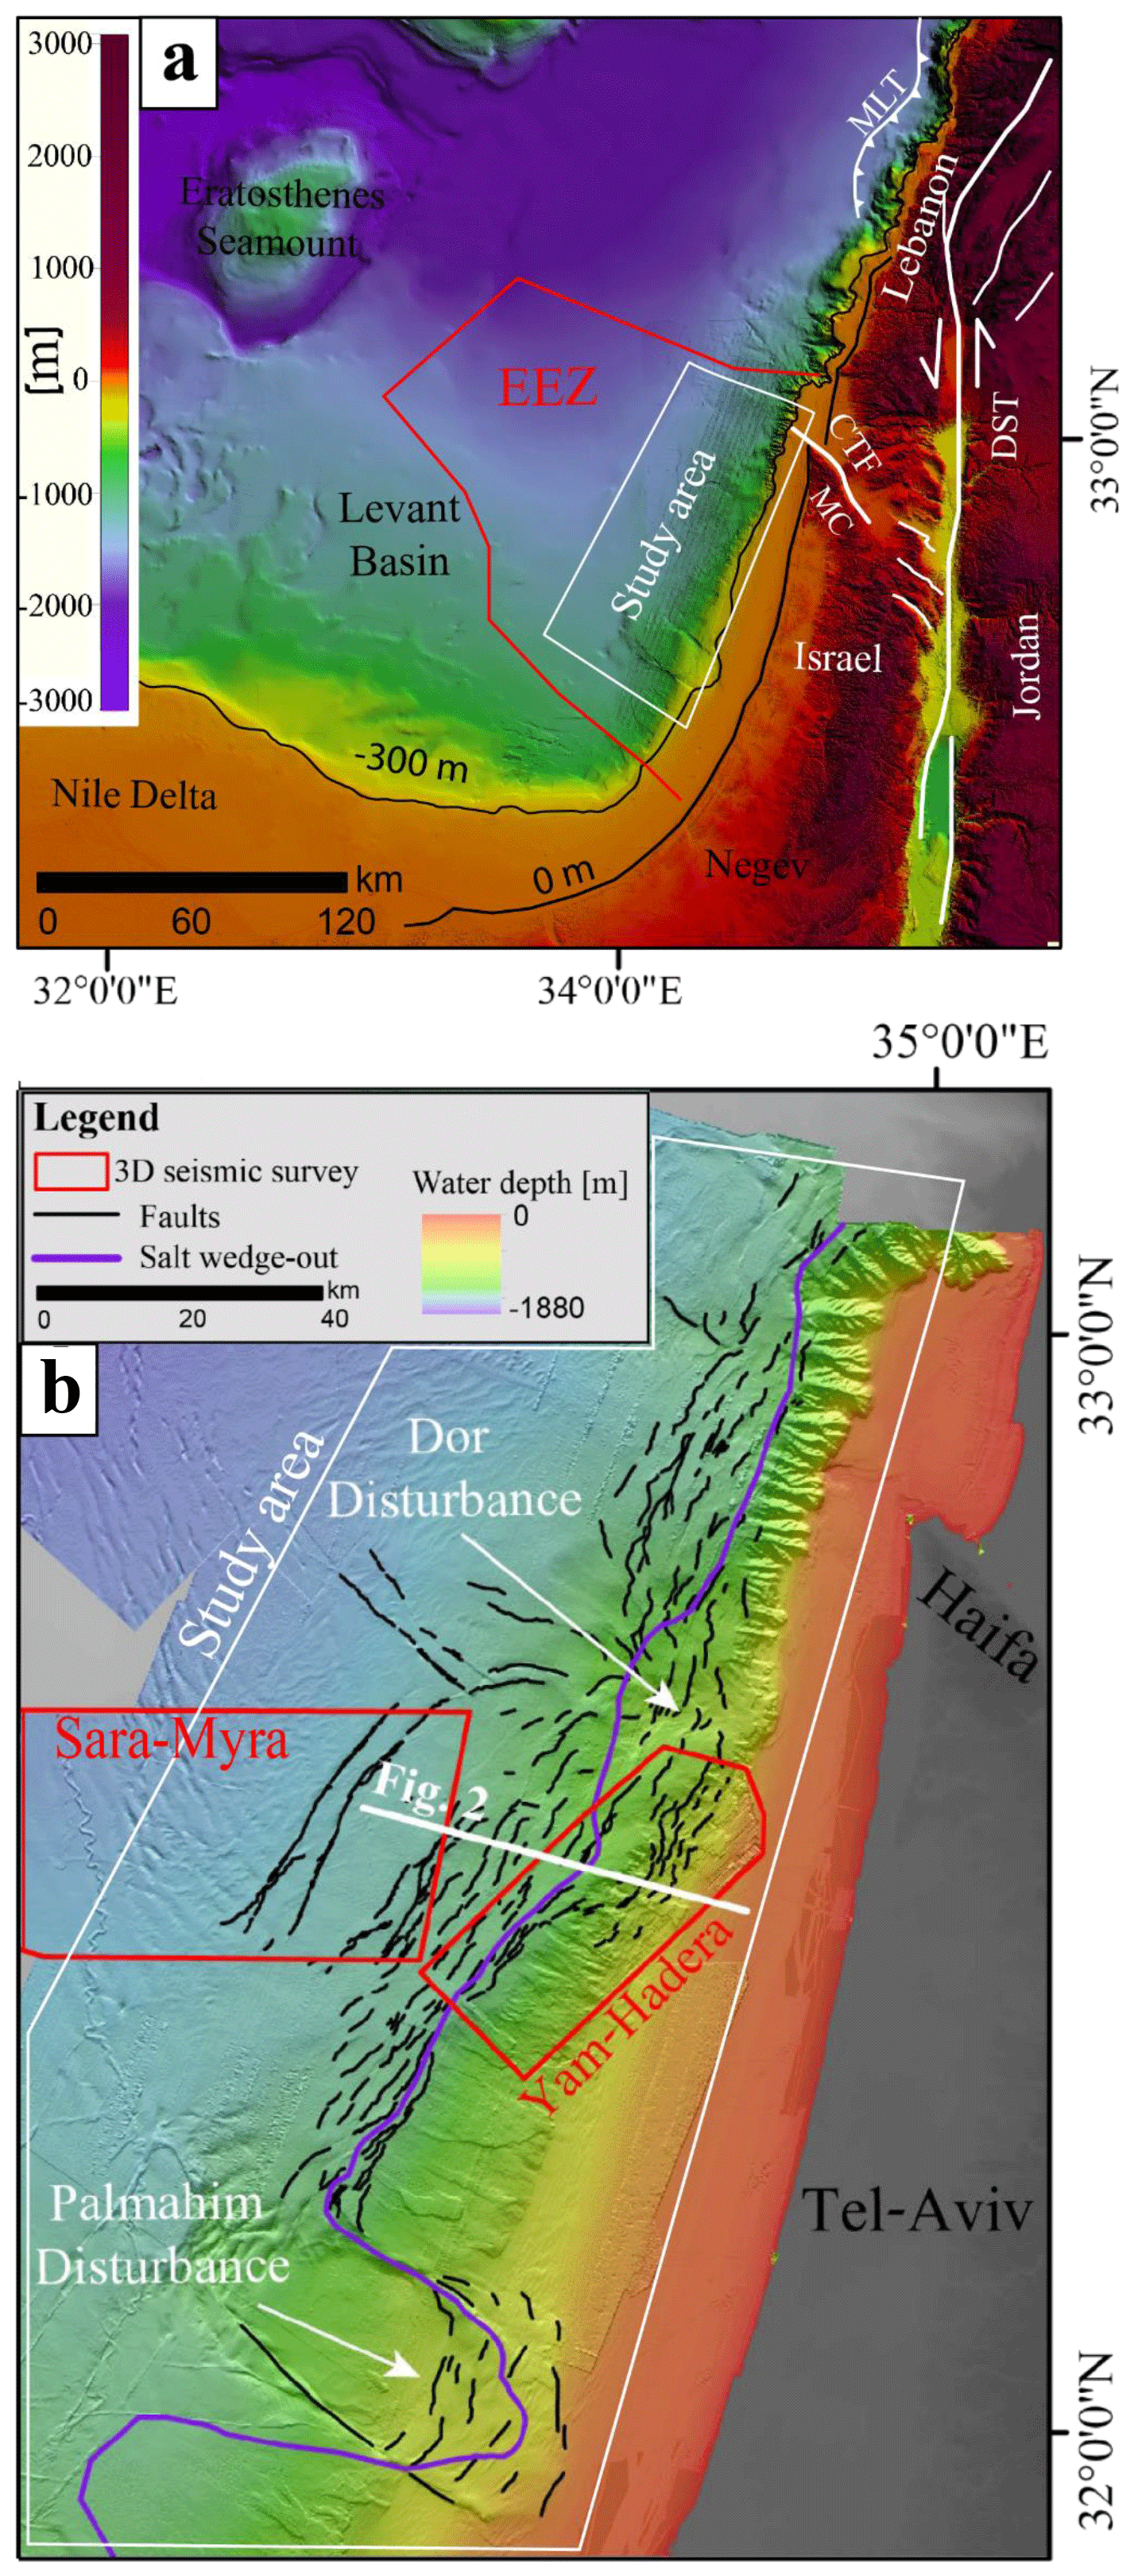
Figure 1Location maps. (a) Regional setting – bathymetry and topography from Hall (1994). Abbreviations: EEZ – Israel's exclusive economic zone; CTZ – Carmel–Tirza Fault; MC – Mount Carmel; DST – Dead Sea Transform; MLT – Mount Lebanon Thrust Fault. (b) The studied area with thin-skinned faults in black after Gvirtzman et al. (2015). Red polygons are borders of seismic surveys mentioned in the text.
Moving northwards to offshore northern Israel and Lebanon, the current tectonic activity is different. The Carmel–Tirza Fault (CTF, Fig. 1a), a branch of the Dead Sea Transform (DST), disrupts the continental margin off the Galilee (Kafri and Folkman, 1981; Garfunkel and Almagor, 1984; Ginzburg and Ben-Avraham, 1987; Schattner et al., 2006; Sharon et al., 2020). In addition, the Mount Lebanon Thrust (Fig. 1a) disrupts the continental margin offshore Lebanon and produces earthquakes, such as the 551 CE M = 7.5 Beirut–Tripoli earthquake (Elias et al., 2007).
2.3 Thin-skinned, salt-related normal faulting along the Israeli continental slope
Unlike the deep-seated faults that stopped operating in the Miocene and do not reach the seabed, numerous thin-skinned normal faults rupture the seafloor all along the Israeli continental slope (Fig. 1b), creating steep steps that are tens of meters high (Almagor and Garfunkel, 1979; Garfunkel et al., 1979; Mart and Gai, 1982; Almagor, 1984; Garfunkel, 1984; Garfunkel and Almagor, 1984; Tibor et al., 1992; Gradmann et al., 2005; Martinez et al., 2005; Bertoni and Cartwright, 2005, 2006; Netzeband et al., 2006; Mart and Ryan, 2007; Cartwright and Jackson, 2008; Cartwright et al., 2012; Gvirtzman et al., 2013, 2015; Katz et al., 2015; Safadi et al., 2017; Gadol et al., 2019).
Recently, based on improved bathymetry data, the seabed traces of these faults were mapped in detail (Gvirtzman et al., 2015; Katz et al., 2015; Kanari et al., 2020), showing that their scarps are not buried by sediments. This apparently indicates that displacement rates are higher than burial rates. However, averaged over hundreds of thousands of years, displacement rates are roughly similar to sedimentation rates (Elfassi et al., 2019). This indicates that the fault scarps observed on the present seafloor may have formed by recent instantaneous seismic ruptures (Elfassi et al., 2019) or rapid episodic motions. In any case, these relatively shallow thin-skinned faults are incapable of producing large earthquakes (discussed below) because their fault planes are relatively small compared to crustal faults. The major hazard they pose is surface rupture, which may as well trigger slumps (Katz et al., 2015).
The recognition that the thin-skinned faults along the Levant continental margin are related to salt tectonics has been stated in many studies (Neev et al., 1976; Ben-Avraham, 1978; Almagor and Hall, 1979; Garfunkel et al., 1979; Mart and Gai, 1982; Garfunkel, 1984; Garfunkel and Almagor, 1984; Tibor et al., 1992; Gradmann et al., 2005; Martinez et al., 2005; Bertoni and Cartwright, 2006, 2007; Loncke et al., 2006; Netzeband et al., 2006; Hübscher and Netzeband, 2017; Mart and Ryan, 2007; Hubscher et al., 2008; Cartwright and Jackson, 2008; Clark and Cartwright, 2009; Cartwright et al., 2012; Gvirtzman et al., 2013; Gadol et al., 2019; Ben Zeev and Gvirtzman, 2020; Hamdani et al., 2021). In particular, it has been suggested that faulting was initiated by basinward salt flow (Gradmann et al., 2005; Bertoni and Cartwright, 2006, 2015; Allen et al., 2016; Cartwright et al., 2018; Kirkham et al., 2019) triggered by basinward tilting of the continental margin, as a result of coastal uplift (Cartwright and Jackson, 2008; Elfassi et al., 2019; Hamdani et al., 2021).
The beginning of faulting was initially dated to a relatively broad time interval between the late Pliocene and the early Pleistocene (e.g., Garfunkel et al., 1979; Almagor, 1984; Gradmann et al., 2005; Netzeband et al., 2006). Later, based on 3D high-resolution seismic surveys, Cartwright and Jackson (2008) showed that offshore central Israel faulting began in the mid-Pliocene. Then, in the late Pliocene, it spread northward, and in the early Pleistocene, southward. Elfassi et al. (2019) established a new chronostratigraphic scheme for the Pliocene–Quaternary section offshore Israel that allows better fault dating. By combining seismic and bio-stratigraphic data, they divided the Pliocene–Quaternary sequence into four units (Fig. 2): unit 1 – Pliocene (5.33–2.6 Ma), unit 2 – Gelasian (2.6–1.8 Ma), unit 3 – Calabrian–Ionian (1.8–0.35 Ma), and unit 4 – Ionian–Holocene (< 0.35 Ma). Based on the improved chronostratigraphy, Elfassi et al. (2019) measured displacement rates on several faults offshore central Israel (in the Sara–Myra survey, Fig. 1b) and concluded that during the Pliocene faulting activity was minor (< 4 m Myr−1); then, in the Gelasian, it peaked to rates of > 100 m Myr−1 (10 cm kyr−1). Later it decreased to rates of ∼ 50 m Myr−1 (5 cm kyr−1).
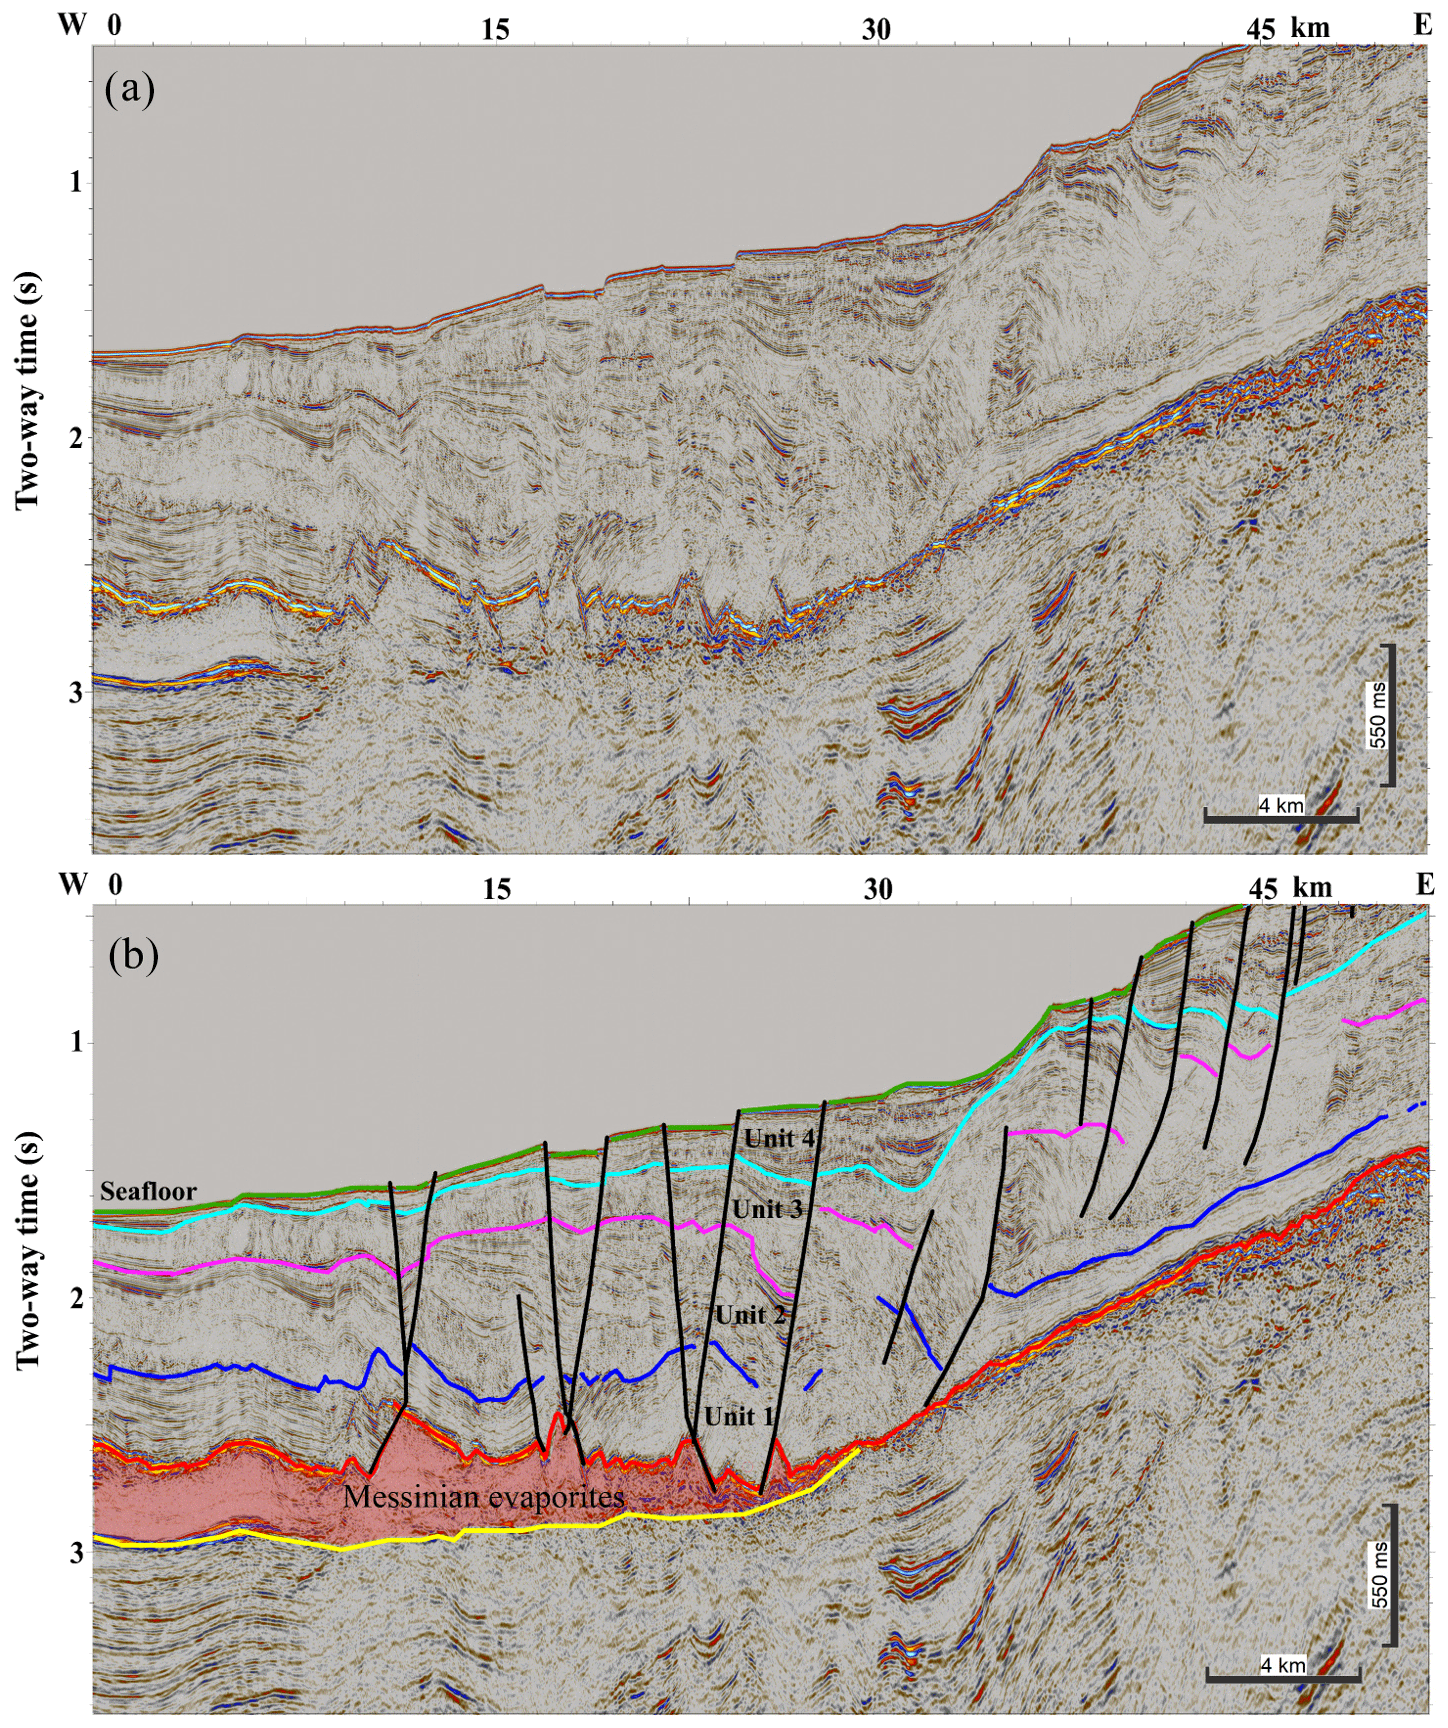
Figure 2Uninterpreted (a) and interpreted (b) seismic section across the Levant continental margin offshore Israel (location in Fig. 1b). Chronostratigraphic and seismostratigraphic of the Pliocene–Quaternary section after Elfassi et al. (2019). Green – seafloor; light blue – base unit 4; purple – base unit 3; blue – base unit 2; red – base unit 1 (and top evaporites); yellow – base evaporates. Thin-skinned faults in black lines.
In what follows, we use the chronostratigraphy of Elfassi et al. (2019) to map the most recent horizon (350 ka) in the entire study area (light blue – base unit 4 in Fig. 2b) and identify the zones with the most potent recent activity.
2.4 The Dor and the Palmahim disturbances
Two huge (10s of km) thin-skinned, rootless structures were observed in the 1970s along the Israeli slope – the Palmahim and the Dor disturbances (Fig. 1b; Garfunkel et al., 1979; Garfunkel, 1984; Almagor, 1984). Some studies described these disturbances as deep-seated tectonic structures (e.g., Neev et al., 1976), while others suggested gravitational instability structures induced by basinward sliding over late Miocene (i.e., Messinian evaporites) detachment surface (Garfunkel et al., 1977). According to Garfunkel (1984), these disturbances are similar to other gravitationally induced rootless structures, which are related to the flowage of underlying salt or shale, that are known in deltas and continental margins in other parts of the world (Bruce, 1973; Evamy et al., 1978; Harding and Lowell, 1979; Crans et al., 1980). The Palmahim structure has been described as a rotational slide, bounded between two translational faults (Mart et al., 1978; Garfunkel et al., 1979), while the Dor disturbance seems to be the focus of a regional deformation zone (Garfunkel, 1984; Gadol et al., 2019).
This study aims to map seabed fault scarps and their subsurface continuation. Accordingly, we start with bathymetry analysis quantifying fault scarps, and then we use seismic data to map faults in the subsurface and to measure displacements.
3.1 Bathymetry
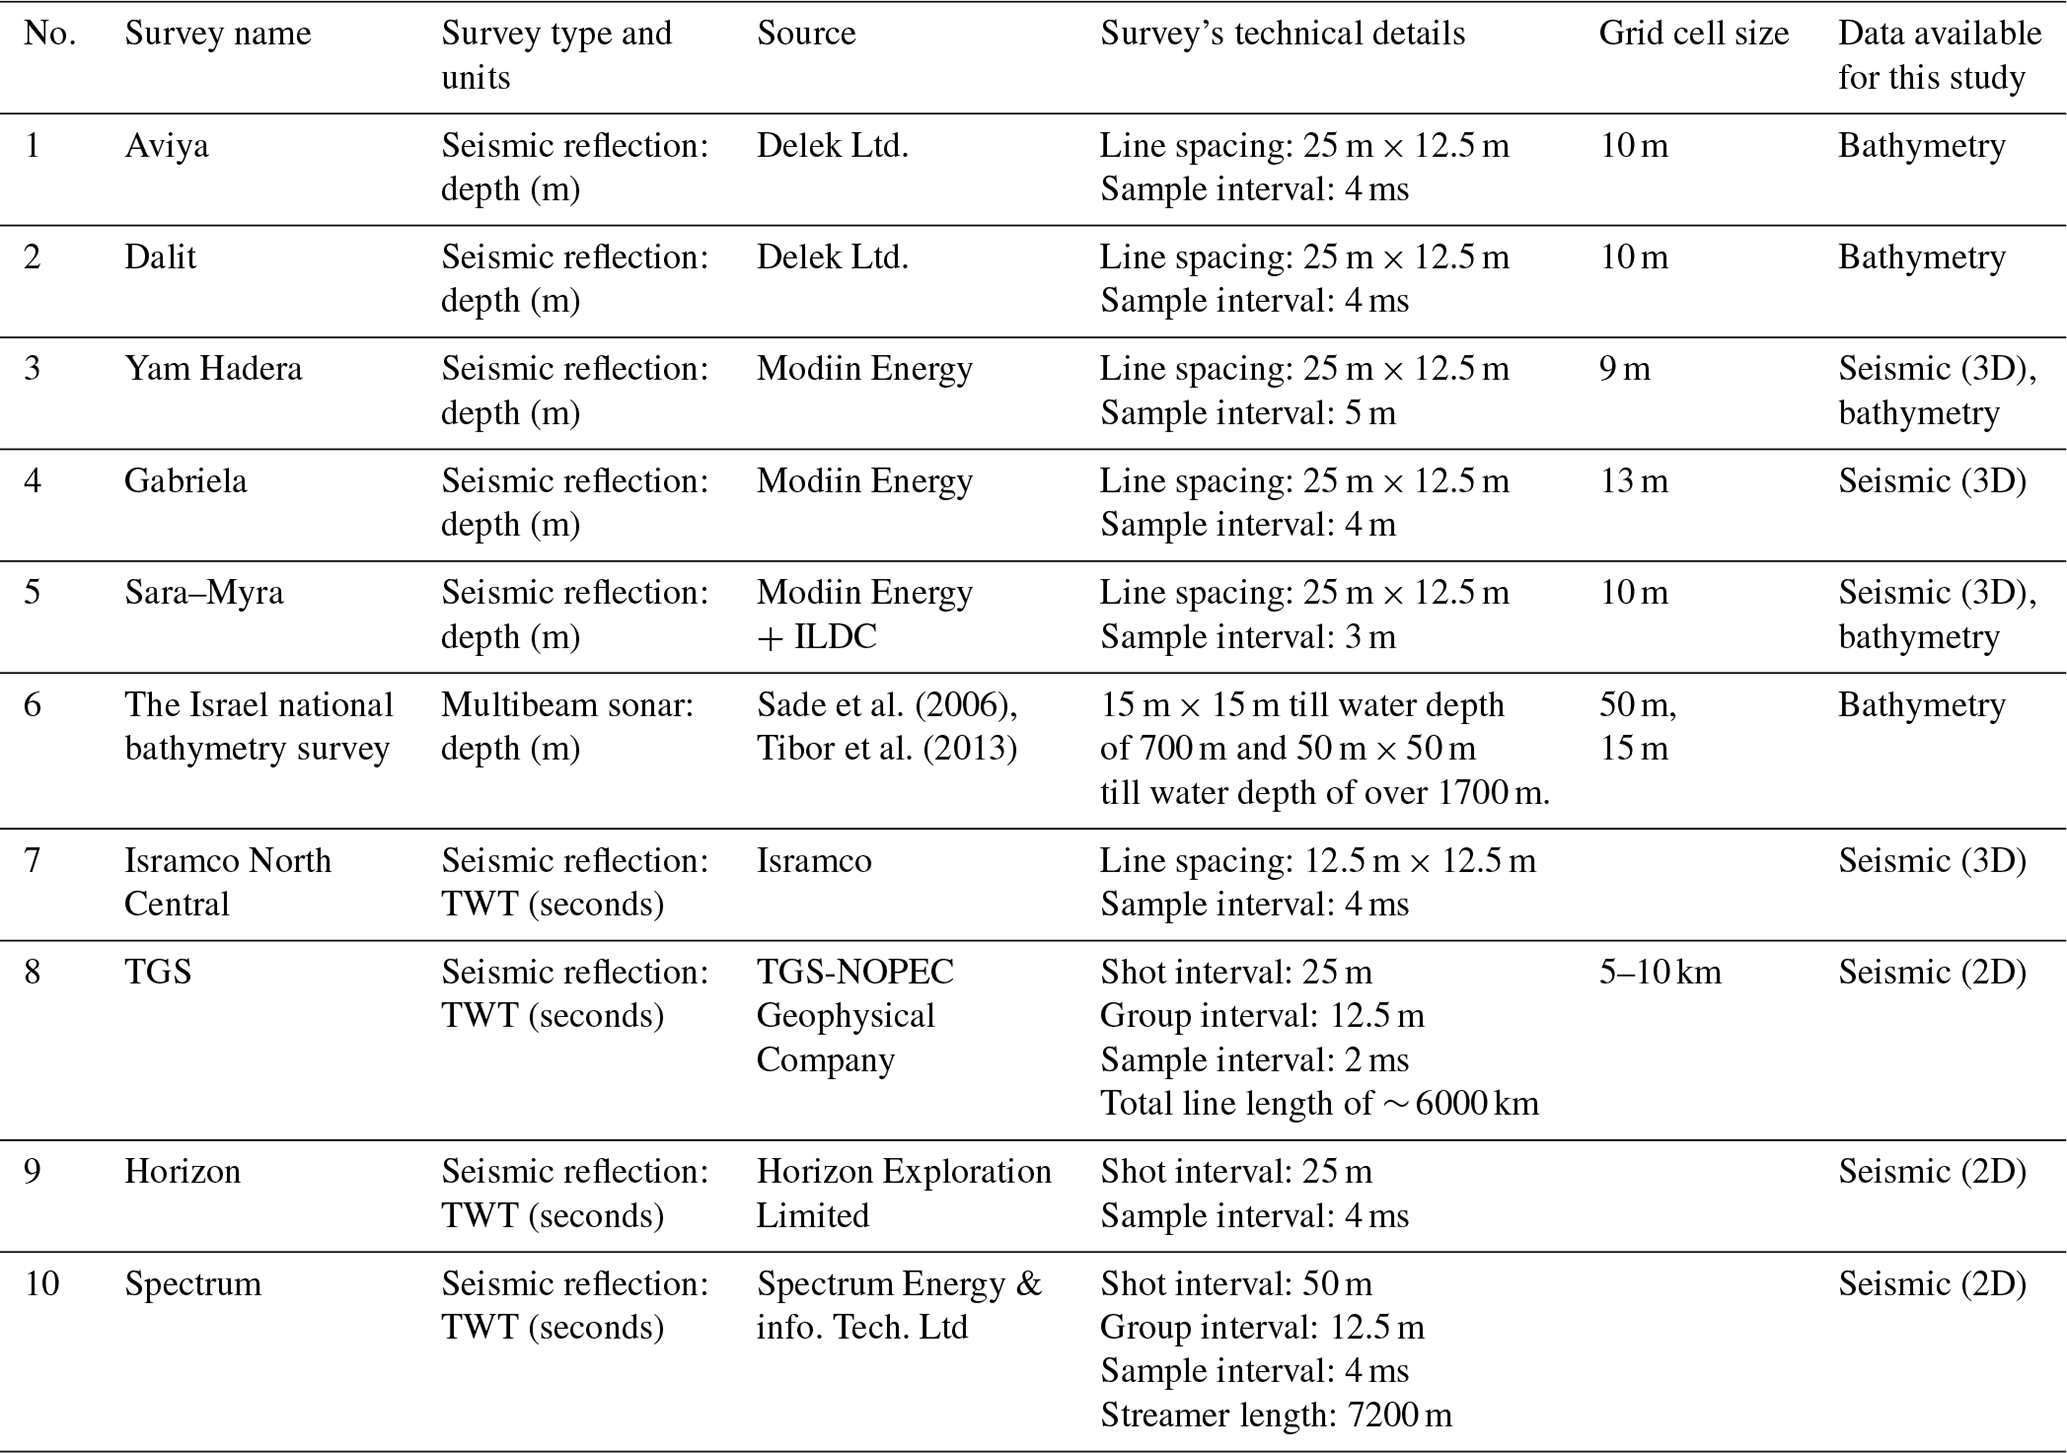
The Israel national bathymetry survey provides pixel resolution of 15 m until a water depth of ∼ 700 m (Sade et al., 2006, 2007) and 50 m between isobaths 700 and 1700 m (Tibor et al., 2013). In addition, we used bathymetric grids with ∼ 10 m cell size, derived from four 3D seismic surveys listed in Table 1 (Aviya; Dalit; Yam Hadera; and Sara–Myra).
To quantify the height of fault scarps at the present seafloor, we developed an algorithm that uses the fault map prepared by Gvirtzman et al. (2015) and automatically calculates elevation differences from both sides of the fault segment every 50 m. A fault segment is a visually mappable lineament in a bathymetric map, regardless of its connection to other segments in the sub-seabed. The algorithm begins with manually moving fault segments, marked by Gvirtzman et al. (2015), to their most accurate location, that is, along the maximal slope of the seabed fault scarp. Then, for each point along each fault, the algorithm measures the dip angle and the true fault direction (dip direction), ignoring the possibility that the fault scarp may have changed by erosion and/or sedimentation. For each point along the faults, the algorithm searches the two closest points from both sides of the fault according to the true dip direction and the dip angle. The calculated output includes the three components of the fault movement: throw, heave, and displacement. This algorithm was applied to all grids described in Table 1, and the measurements were used for the throw analysis.
3.2 Seismic reflection data
The seismic data used here include 2D and 3D industrial seismic reflection surveys processed in the time domain (TWT, two-way time) and 3D seismic cubes that were pre-stack depth migrated (Table 1). All surveys were loaded and interpreted using the Kingdom IHS software (IHS Markit, 2022). Preliminary mapping of the four seismic units described above was done by Elfassi et al. (2019). Ben-Zeev and Gvirtzman (2020) expanded this mapping to cover Israel's exclusive economic zone (EEZ; Fig. 1a). Here, we recheck and remap these horizons in detail along the continental slope where faults are common and map these four units in 3D seismic volumes (Fig. 1b, Table 1).
Subsurface faults mapping
Each fault with a seabed expression was mapped in the subsurface. When a seismic volume was available, we mapped the faults in 3D manually and frequently showed that separate seabed segments connect in the subsurface. If only the 2D seismic lines were available, connectivity between segments would sometimes remain uncertain. In addition, we measured the cumulative displacement of the ∼ 350 ka horizon (the theoretical vertical resolution is a quarter of a wavelength, in our case 4–5 m).
The subsurface mapping of faults adds several layers of information on top of seabed mapping: (1) it allows measuring the displacement of dated horizons and thus indicates the rate of motion; (2) it allows distinguishing between small surface faults that are minor and small surface faults that connect at the subsurface to large faults; (3) it allows identifying hidden fault segments, which do not appear on the bathymetry but may rupture it in the future; and (4) it provides a 3D view of the fault plane, which is essential for structural analysis (as well as estimation of potential earthquake magnitudes, if these faults rupture seismically; see discussion).
4.1 Measurements
4.1.1 Scarp height
Figure 3a shows the heights of seabed scarps measured from both sides of all faults every 50 m. The map shows that between the Palmahim and the Dor disturbances, fault scarps are relatively low (<20 m), whereas from the Dor disturbance northwards, they are significantly higher (20–90 m). This observation is consistent with extension measurements that also increases northwards (Cartwright and Jackson, 2008; Ben Zeev and Gvirtzman, 2020).
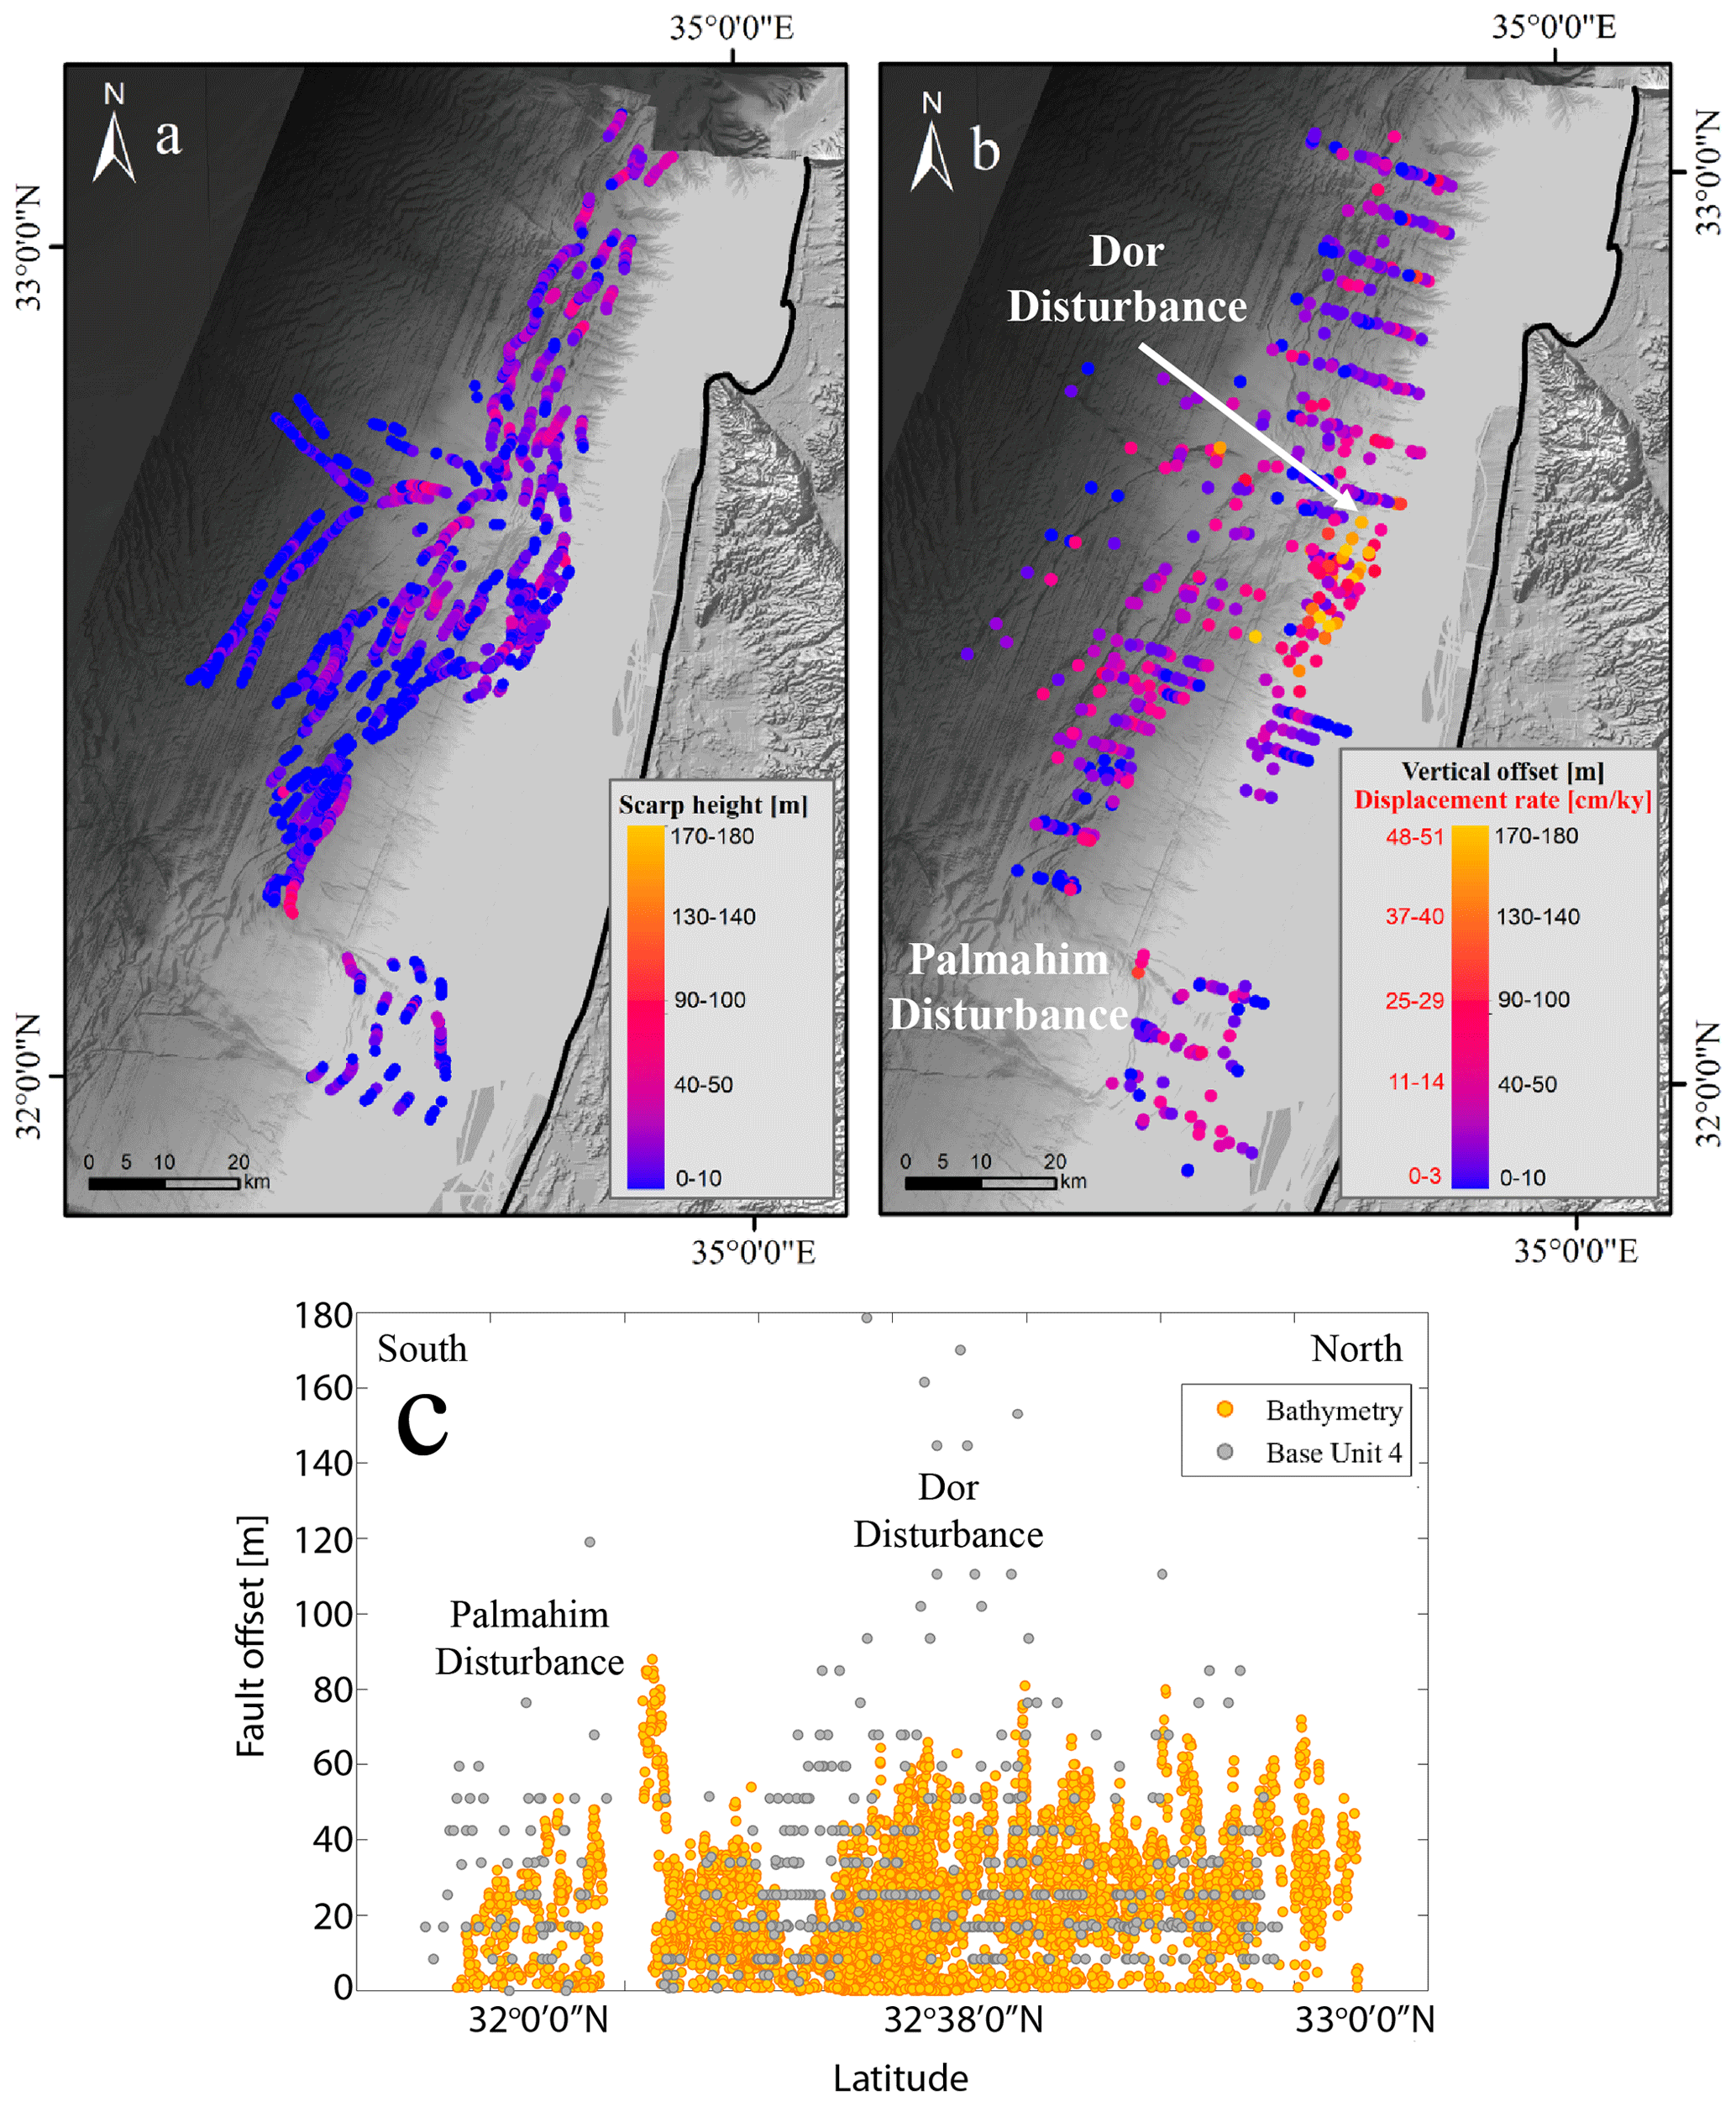
Figure 3Vertical offset measurements along faults. (a) Height of seabed scarps derived from bathymetry analysis. (b) Vertical offsets at the base unit 4 horizon measured from seismic data. Assigning 350 ka to the base unit 4 horizon (Elfassi et al., 2019), its vertical offset is transformed into vertical displacement rate (the left-hand side of the scale bar in panel b). (c) Vertical offset measured at the base of unit 4 (gray dots) and scarps height at the seafloor (orange dots). Note that vertical offsets in bathymetry increase northwards, whereas vertical offsets at the base of unit 4 increase in the vicinity of the Dor disturbance. Bathymetry from Tibor et al. (2013).
4.1.2 Vertical displacement rate
The problem with analyzing bathymetry alone is that faults scarps are reduced by sedimentation and erosion and do not correctly represent fault displacement. Therefore, we also measure fault throw along the youngest regionally mappable horizon (base unit 4, Fig. 3b), which yield vertical displacement rates averaged for the past 350 kyr (the best possible representation of “recent” in the study area). These measurements highlight an exceptionally active zone in the vicinity of the Dor disturbance with vertical displacement rates reaching 40–50 cm kyr−1 (Fig. 3b); this anomaly is not detected in the bathymetric analysis (Fig. 3a), emphasizing the need for subsurface measurements. To further illustrate the Dor anomaly, Fig. 3c shows a projection of all seabed and subsurface offset measurements along a south–north section, emphasizing peak throws near the Dor disturbance (at X ∼ 32∘38′0′′ N), nearly 2 times larger than in surrounding areas.
4.1.3 Sedimentation rate
Considering the 350 ka age of base unit 4 (Elfassi et al., 2019), recent sedimentation rates (thickness of unit 4 divided by 350 kyr) can be calculated for the entire study area (Fig. 4c). Results indicate relatively low (< 60 cm kyr−1) values in the deep basin, increasing to ∼ 90 cm kyr−1 in the mid-slope and > 150 cm kyr−1 along the basinward propagating shelf edge (Ben Zeev and Gvirtzman, 2020). Particularly interesting is the off-shelf area near the Dor disturbance reaching > 200 cm kyr−1 (the impact of this observation on fault interpretation is discussed below).

Figure 4(a) Faults on bathymetry background (after Tibor et al., 2013). (b) Base unit 4 structure map. (c) Unit 4 sedimentation rate. Half grabens separated the Dor disturbance from the shelf edge and emphasized its dome shape seen in panel (b). These half grabens are filled with a thick section of unit 4 with a sedimentation rate exceeding ∼ 1.8 m kyr−1 (c). A high sedimentation rate is also observed along the shelf edge, expressing shelf progradation during the past 350 kyr.
In addition to the shelf edge belt, a large thickness of unit 4 is observed in a deep half graben separating a prominent dome at the center of the Dor disturbance from the shelf edge (Fig. 4b). The accommodation space created by this half graben is quickly filled by sediments arriving from the nearby shelf edge. South of the Dor disturbance, the half graben is separated from the shelf edge (Fig. 5b). North of the disturbance, the two features create a continuous sedimentary package (Fig. 5a). Noteworthy, the listric faults east of the half graben are different from all the other faults as will be discussed below.
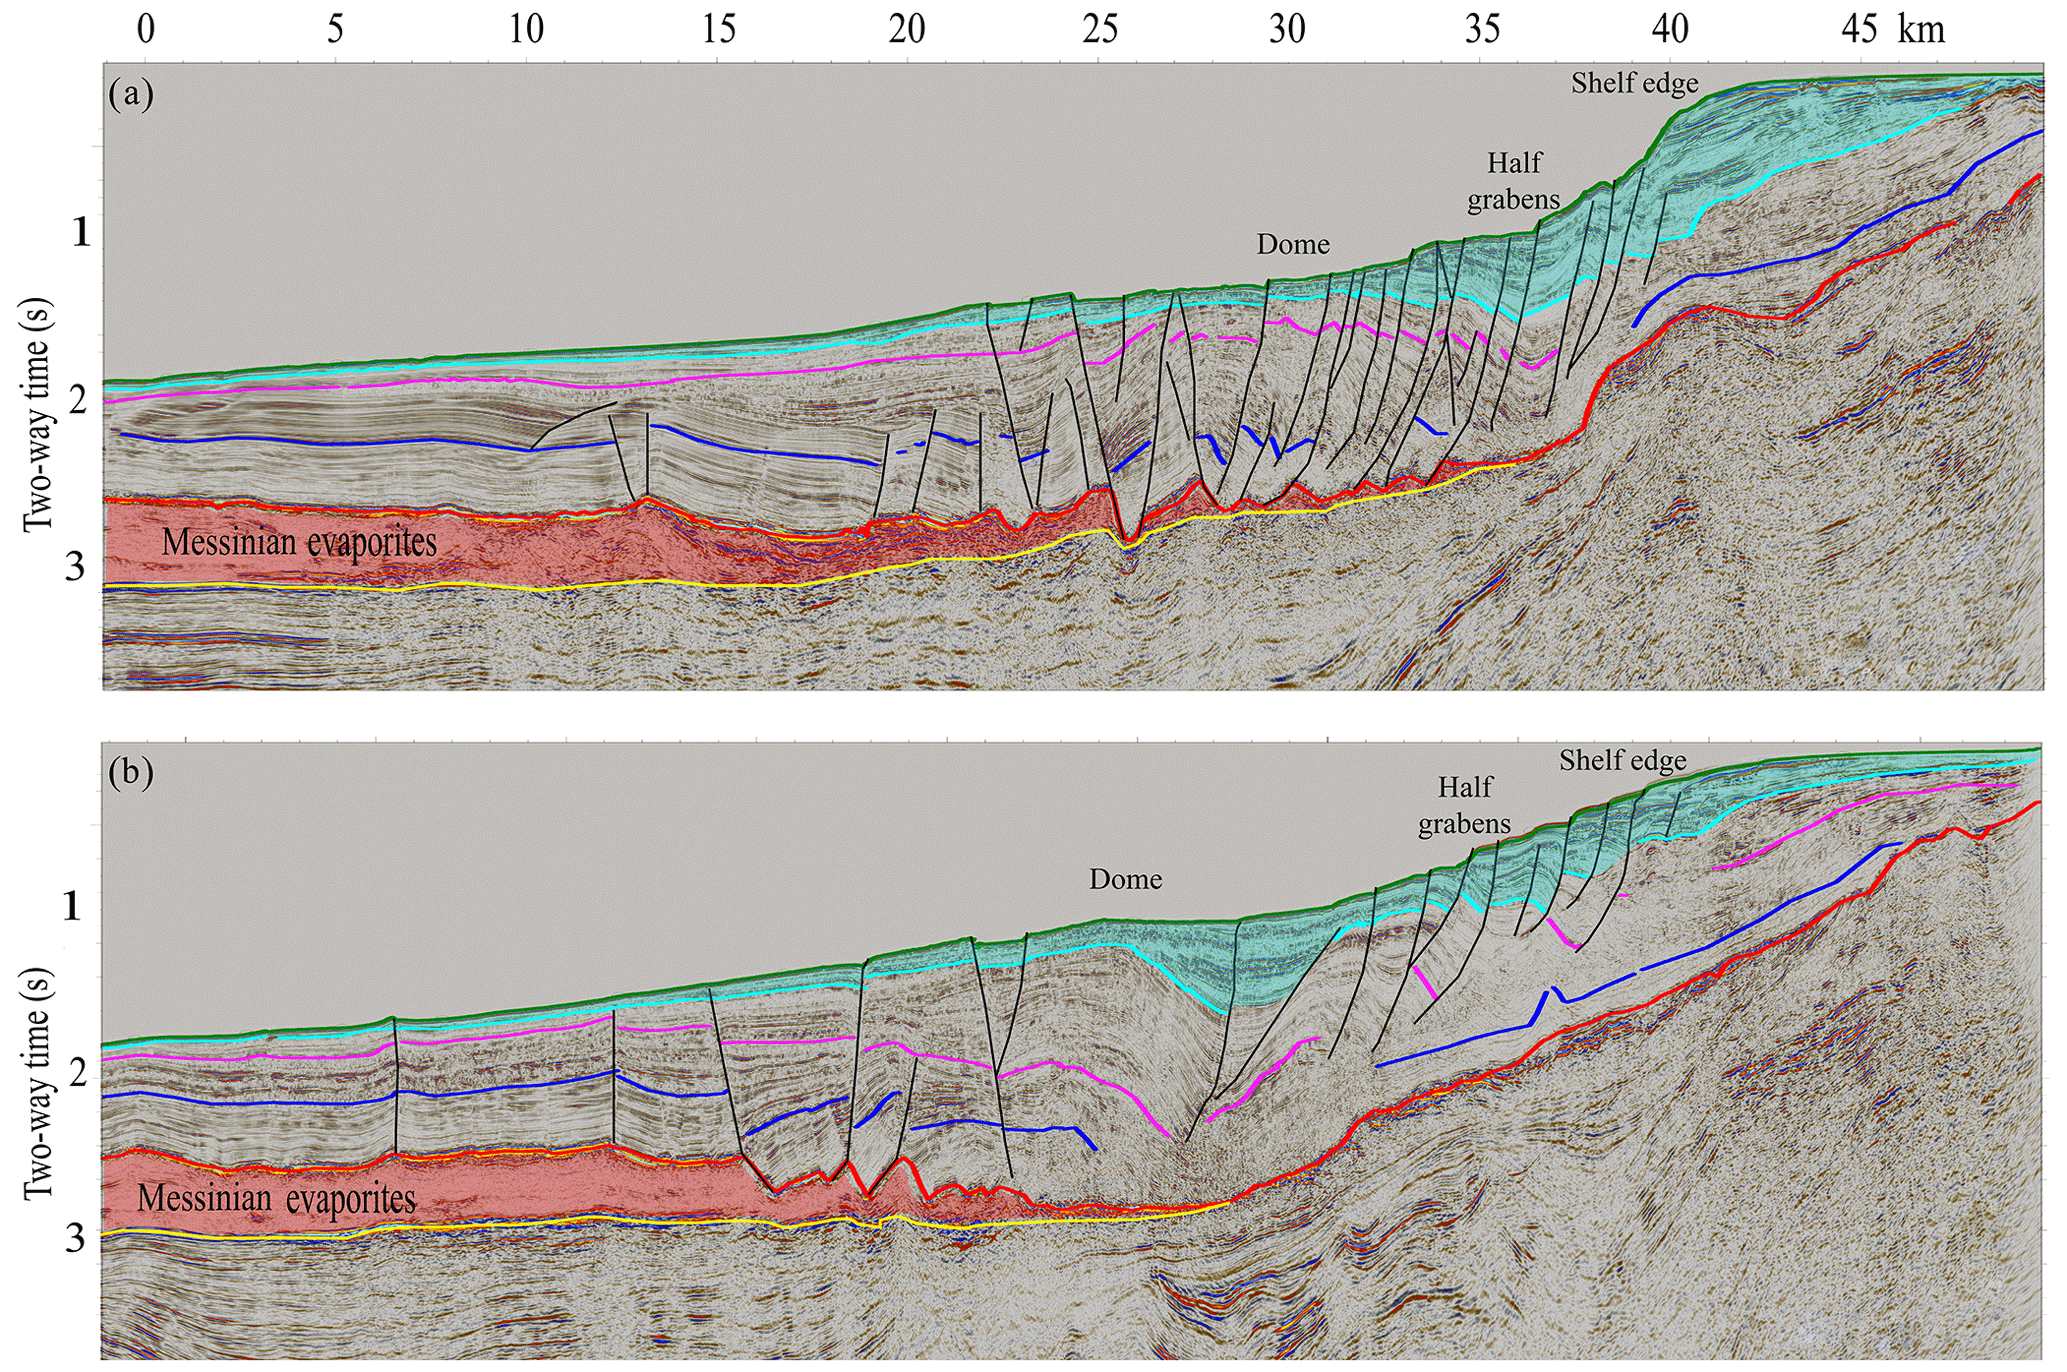
Figure 5Cross section (a) north and (b) south of the Dor disturbance (seismic location in Fig. 4a). Normal faults in black lines. Seismic reflectors as in Fig. 2.
4.2 Fault classification
4.2.1 Vertical displacement categories
To classify faults according to their vertical displacement, we assign each fault segment a single value of maximum throw measured anywhere along it (a) at the seabed (height of scarp) and (b) at the base of unit 4 (vertical offset). Results are presented in Fig. 6 in three colors – white represents faults producing seabed scarps < 30 m, red represents faults with seabed scarps of 30–60 m, and turquoise represents faults with seabed scarps > 60 m. This illustration is consistent with Fig. 3, showing that seabed fault scarps higher than 30 m (red) are more common near Dor and northwards (Fig. 6a). In contrast, fault scarps higher than 60 m (turquoise) are observed only north of Dor (Fig. 6b) with the exception of one outlier near the Palmahim disturbance. Noteworthy, the threshold values of 30 and 60 m were defined for convenience, such that all three groups will include a reasonable number of faults, and the third group with exceptionally high values will be smaller. If needed, these threshold values can be changed.
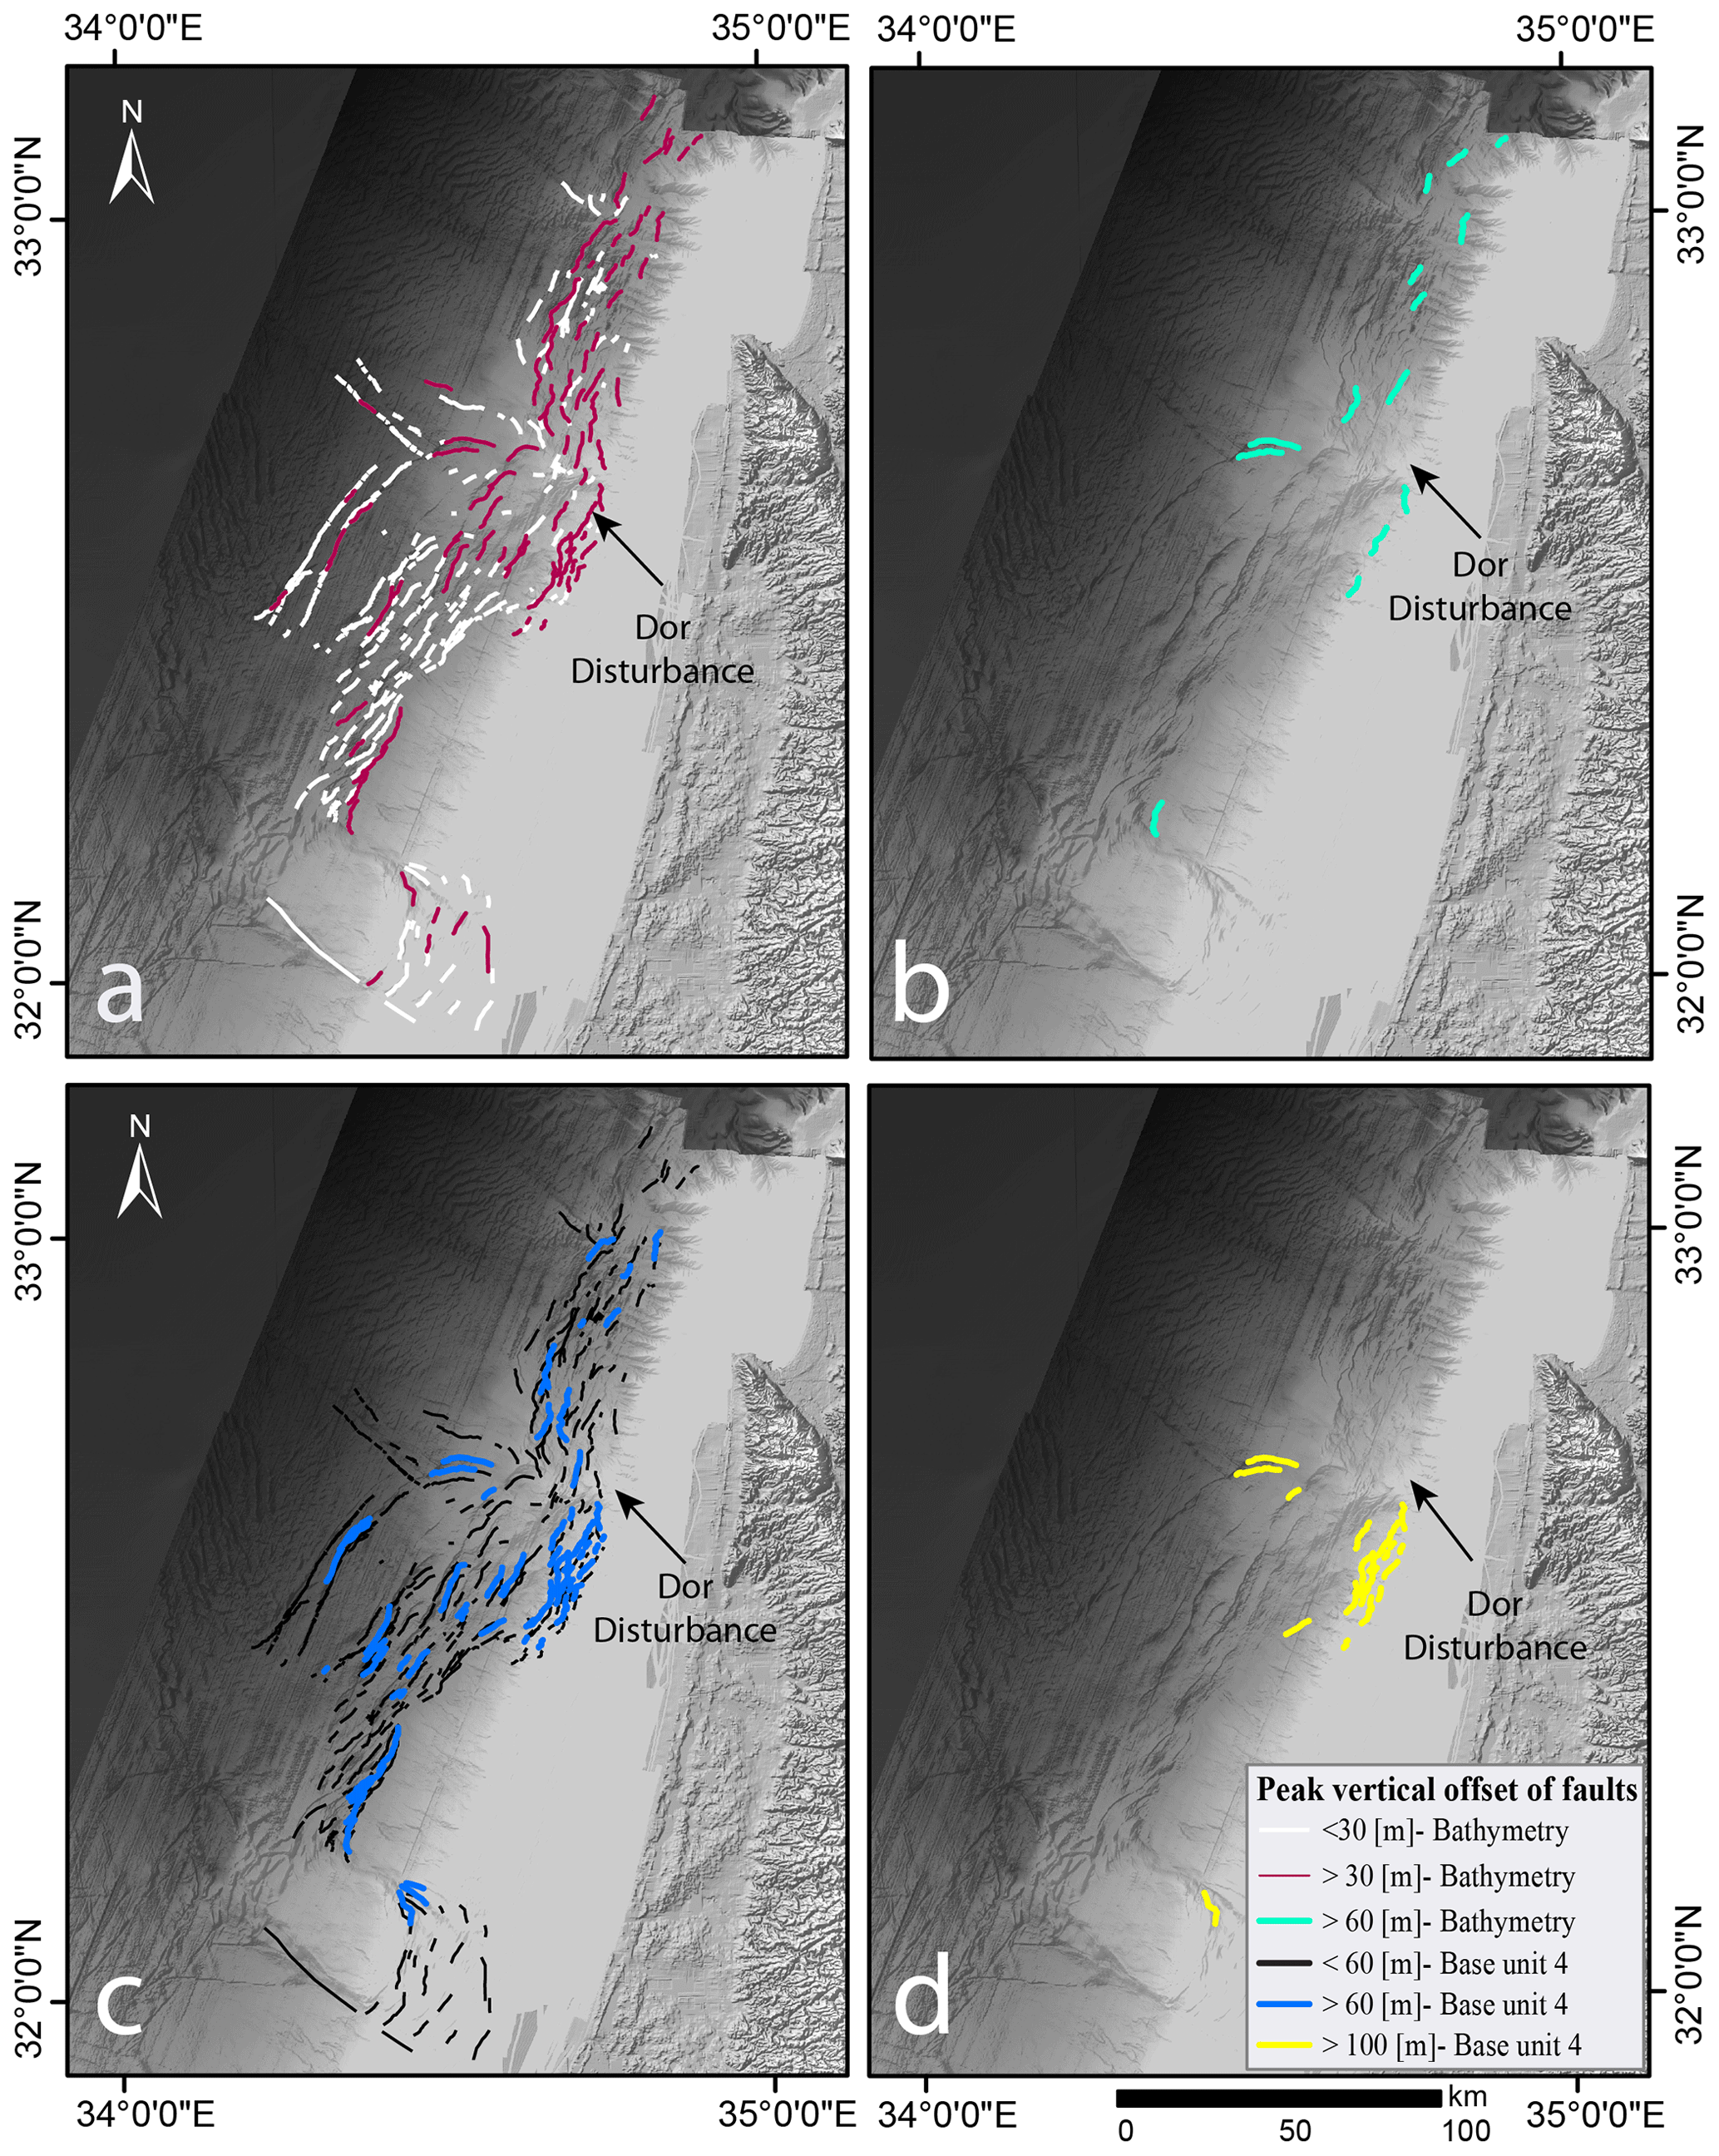
Figure 6Fault classification by vertical throw after assigning each fault segment a single value, representing the maximum vertical displacement measured anywhere along it. (a) Faults forming seabed scarps smaller (white) and higher (red) than 30 m. (b) Faults forming seabed scarps larger than 60 m (turquoise). (c) Faults displacing base unit 4 by more than 60 m (blue) and smaller than 60 m (black). (d) Faults displacing base unit 4 by more than 100 m (yellow). Note that faults with the largest vertical throw are concentrated around the Dor disturbance. Background in all maps is shaded relief of bathymetry (Tibor et al., 2013).
Consistent with our hypothesis that fault scarps are decreased by sedimentation and erosion, classification according to vertical offsets at the base of unit 4 (Fig. 6c and d) portrays a different picture with peak vertical displacements in the vicinity of the Dor disturbance without increasing northward trend (again, one outlier near Palmahim). In particular, we highlight the faults bounding the Dor disturbance from the east (Fig. 6d), where large throws (> 100 m) at the base of unit 4 are observed. These faults coincide with the listric faults mentioned above (Fig. 5b). Uncommonly, these faults form seabed scarps higher than 60 m (Fig. 6b) despite the exceptionally high sedimentation rate observed at that location (Fig. 4c).
4.2.2 Hidden fault segments
To map fault planes in the subsurface and measure their area, we use high-resolution 3D seismic volumes. Figure 7 illustrates that 35 fault segments rupturing the seabed on the eastern side of the Sara–Myra survey converge at depth to seven major faults. Noteworthily, a part of the fault marked by red (Fig. 7b) has no surface expression (Fig. 7a). This hidden fault segment ruptures the three lower horizons (Fig. 7d–f), reaching base unit 4 in several locations (Fig. 7c), and is unseen at the seabed (Fig. 7a). Namely, the partial seabed segments do not represent the actual fault size. A similar analysis conducted for the Yam Hadera seismic survey illustrates that several major fault segments (marked green, pink, and yellow) are hidden (Fig. 8a and b). The sub-seabed fault mapping in 3D highlights the segments “missing” in the bathymetry.
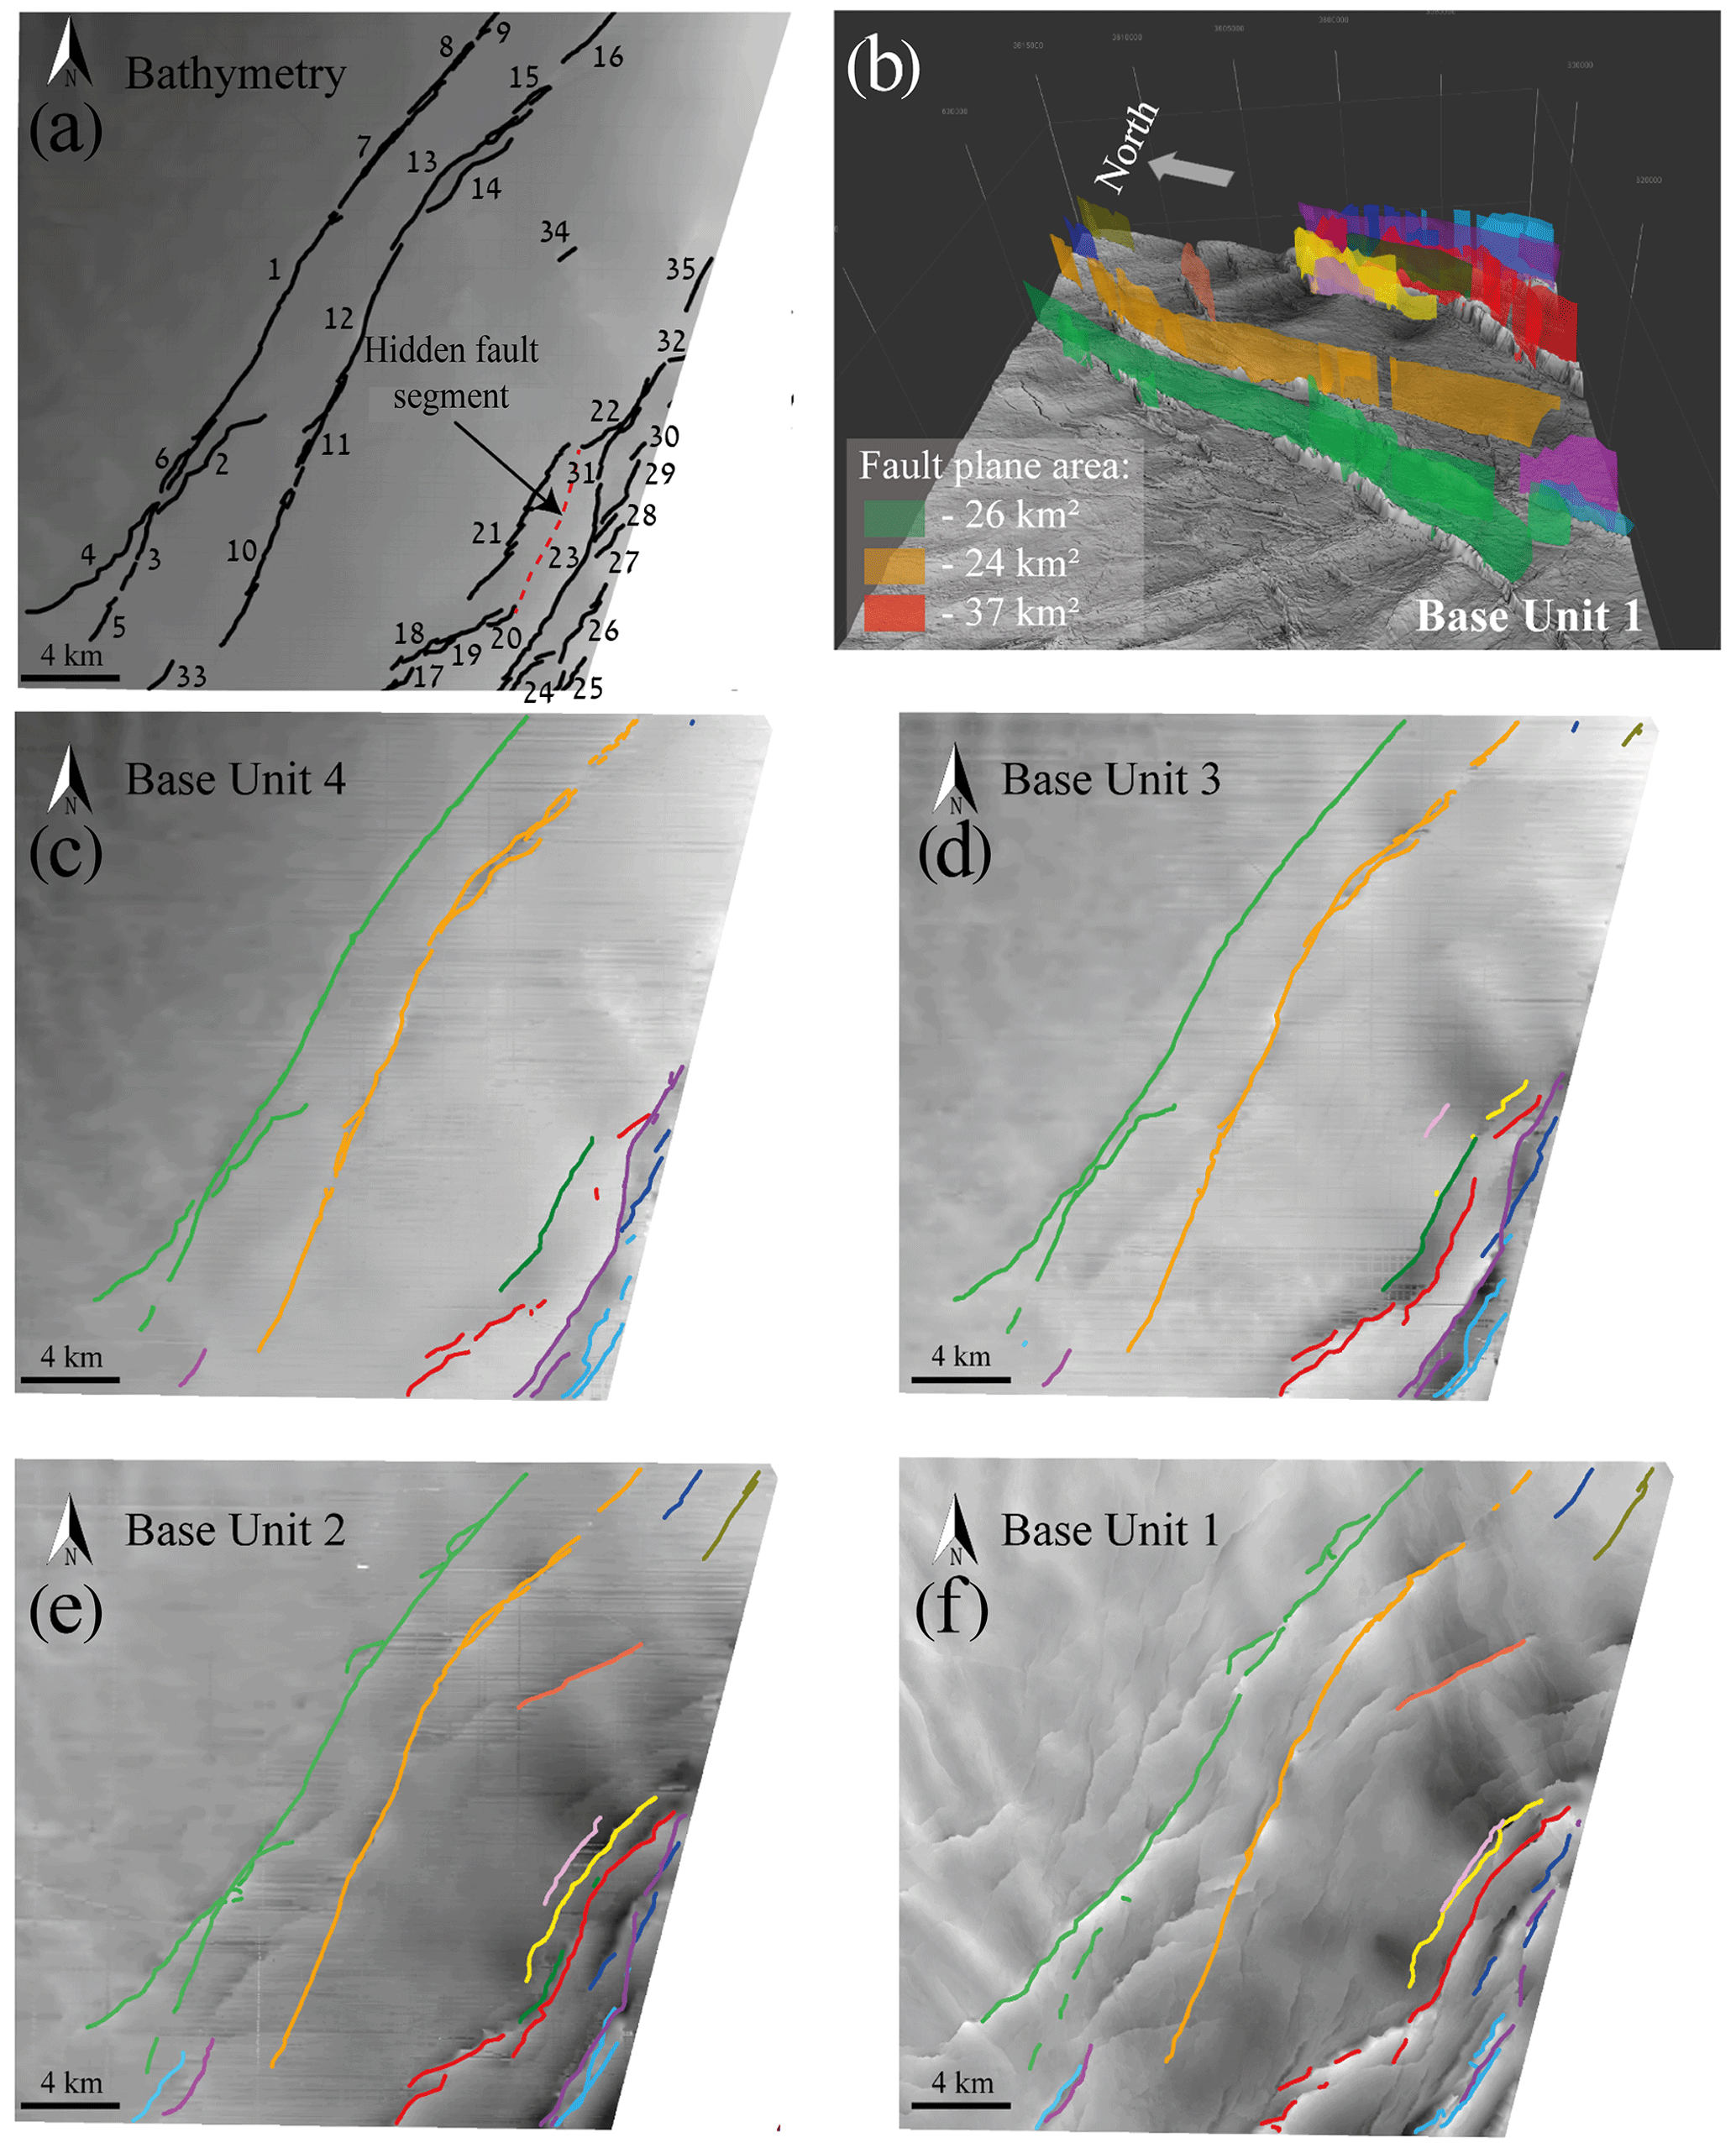
Figure 7Subsurface mapping of fault planes. (a) 35 faults segments rupturing the seabed in the eastern part of the Sara–Myra survey (location in Fig. 1). (b) A 3D view of fault planes illustrating that the 35 fault segments at the seabed belong to seven major faults (each fault represented by one color). An example of some fault plane area measurements. (c–f) Structural maps of four subsurface horizons (base units 4–1), each with faults crossing it (same colors as in panel b). Note the hidden fault segment (dashed red line in panel a), which does not disrupt the seabed but may rupture it in the future.
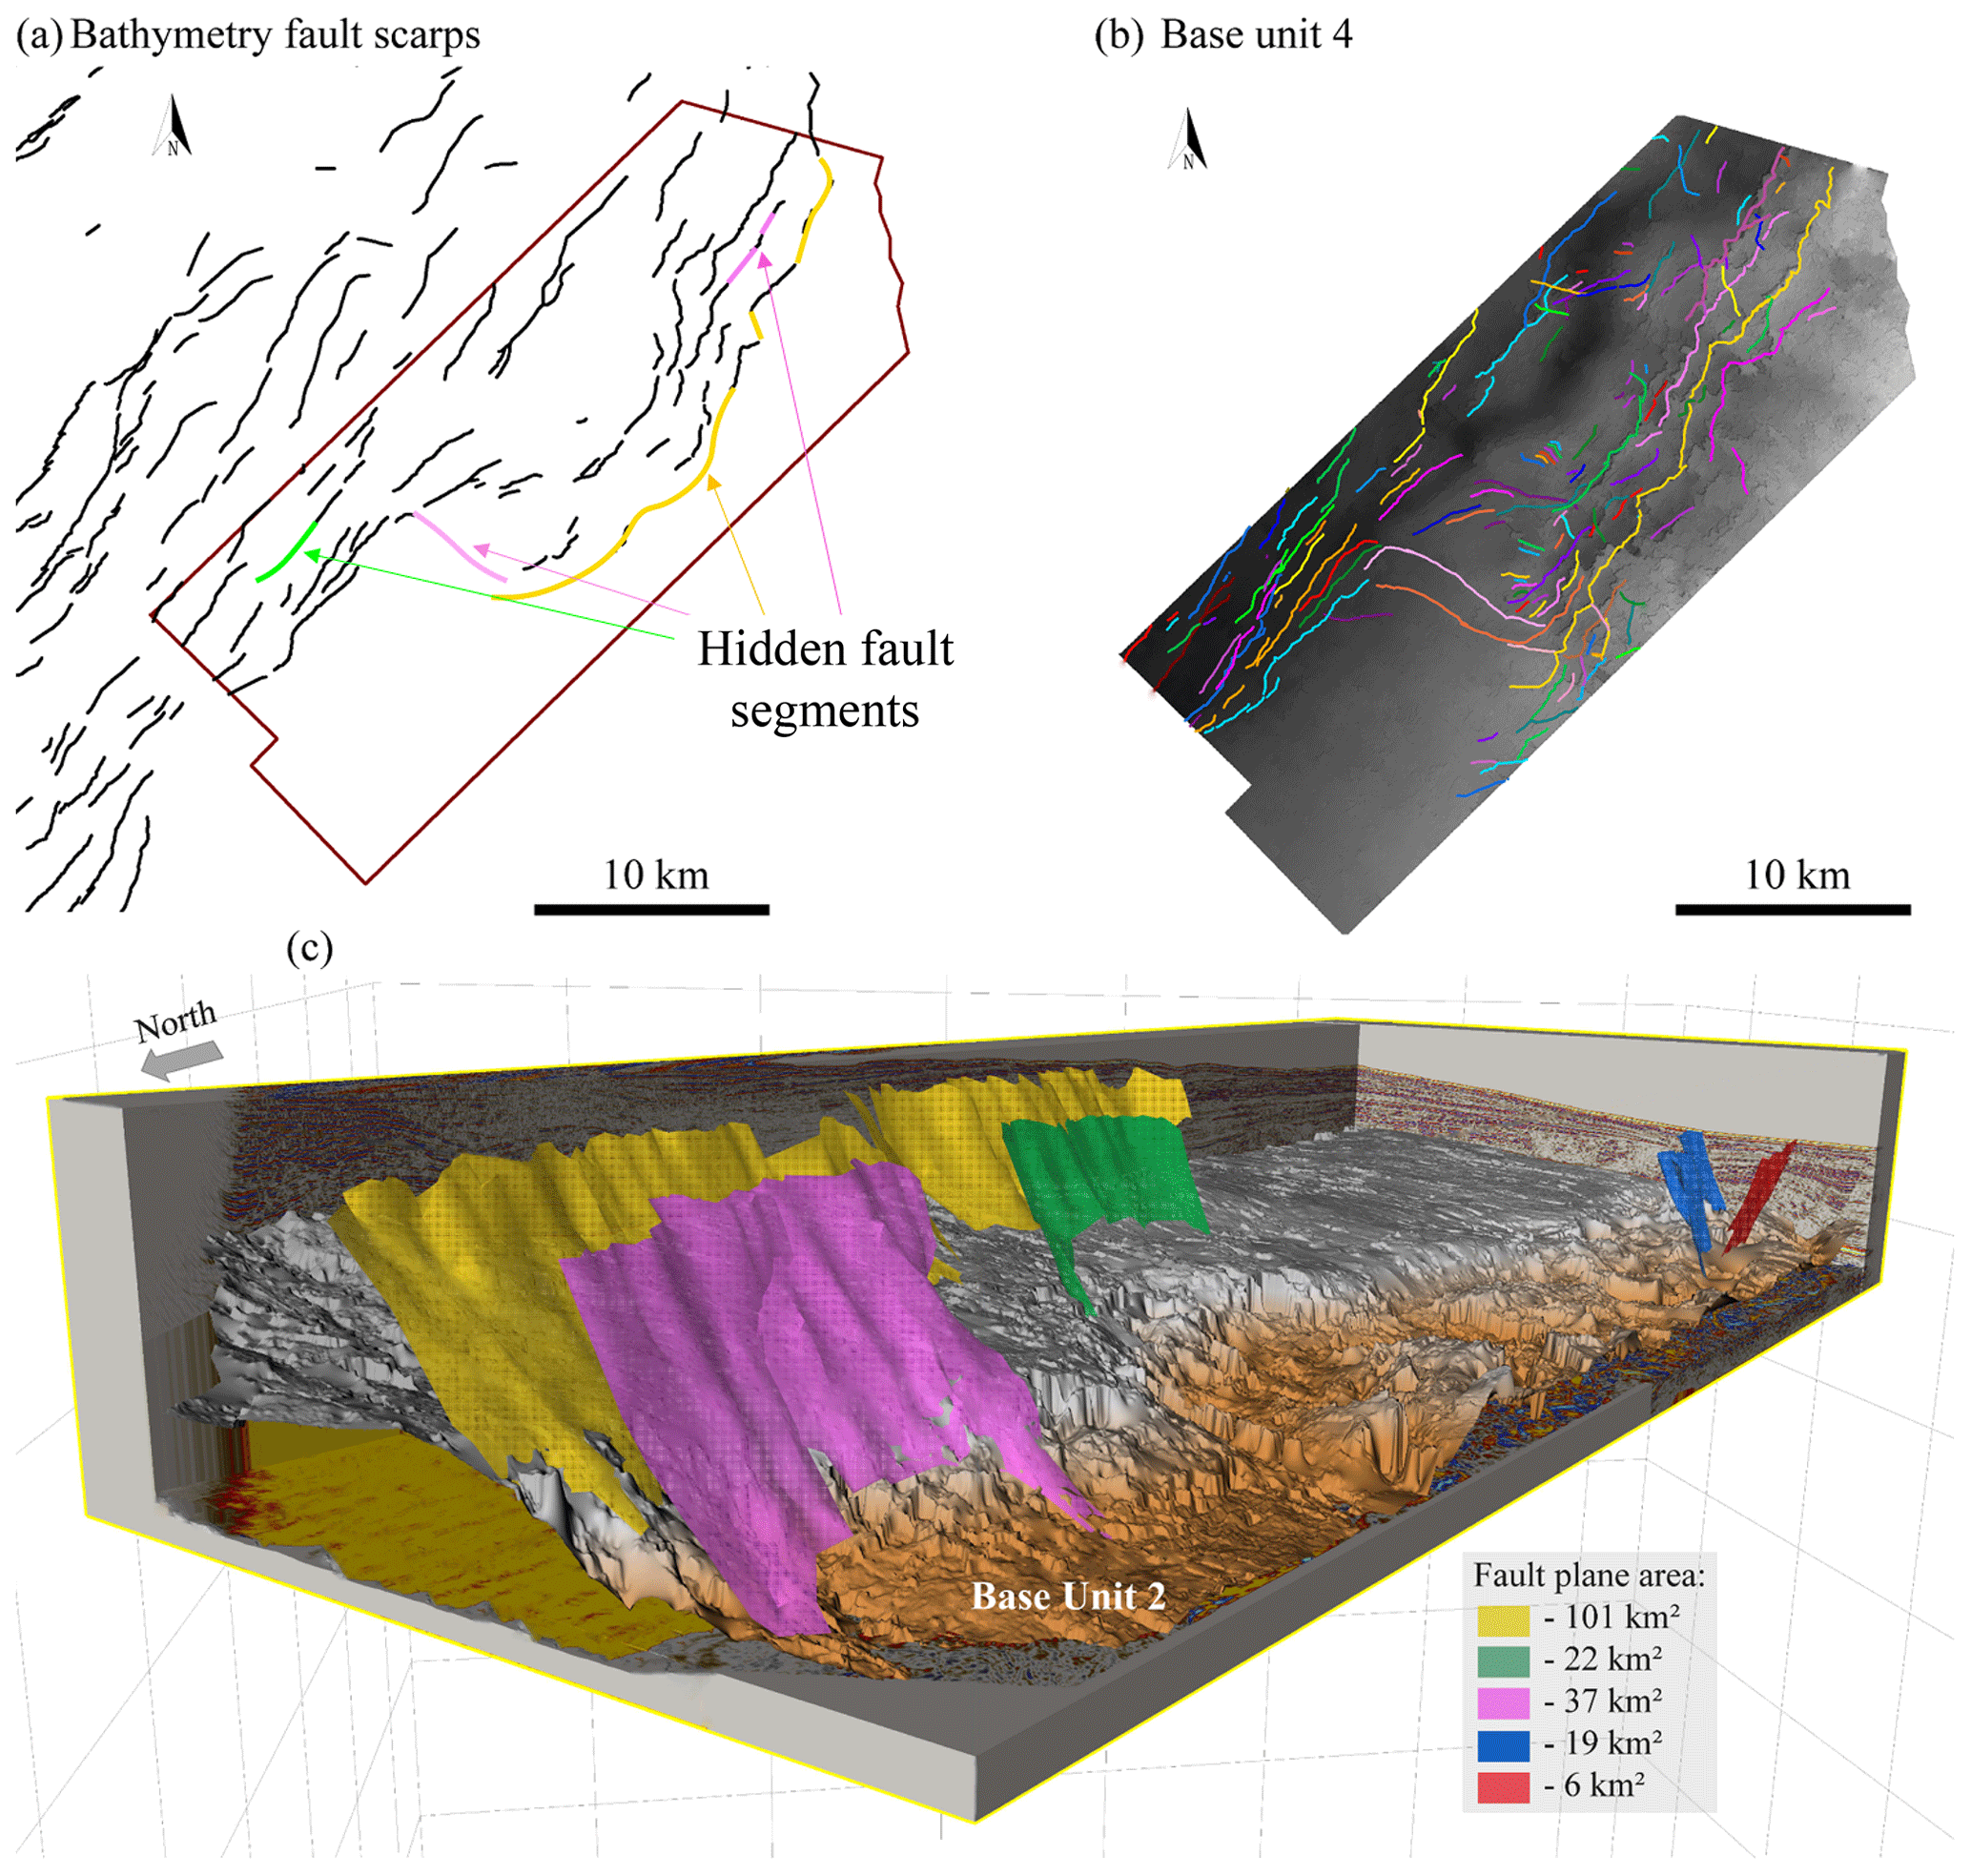
Figure 8(a) Seabed faults in the Yam Hadera seismic survey with hidden fault segments marked in the same colors as the fault to which it is connected in panel (b). (b) All faults are displacing base unit 4. Each fault is represented by one color. (c) Three-dimensional illustration of five faults with their measured fault plane area. Note that the yellow and the pink faults are not detected at the seabed in some parts (hidden fault segments) despite their large plane area (101 km2 and 37 km2, respectively), and their colors are the same as in panel (b).
Figure 8c presents an example of five 3D-mapped faults with their measured plane area. The red and blue faults are two sides of one graben rooted in the Messinian salt layer with a relatively minor fault plane area, whereas the pink, yellow, and green faults have a significantly larger fault plane area despite their shallower penetration only to the top of the Pliocene (base unit 2) horizon (Fig. 8c).
4.2.3 Geometry and location relative to the salt wedge
Another way for fault classification is based on their geometry and location relative to the underlying salt layer (Fig. 9). Group I produces horsts and grabens (marked blue) mostly along the base of the continental slope, west of the salt wedge-out line. The faults of Group I displace the entire Pliocene–Quaternary section down to the top salt horizon (Fig. 10a, cross section aa′), and their dip angle varies around 45∘ (Fig. 11).
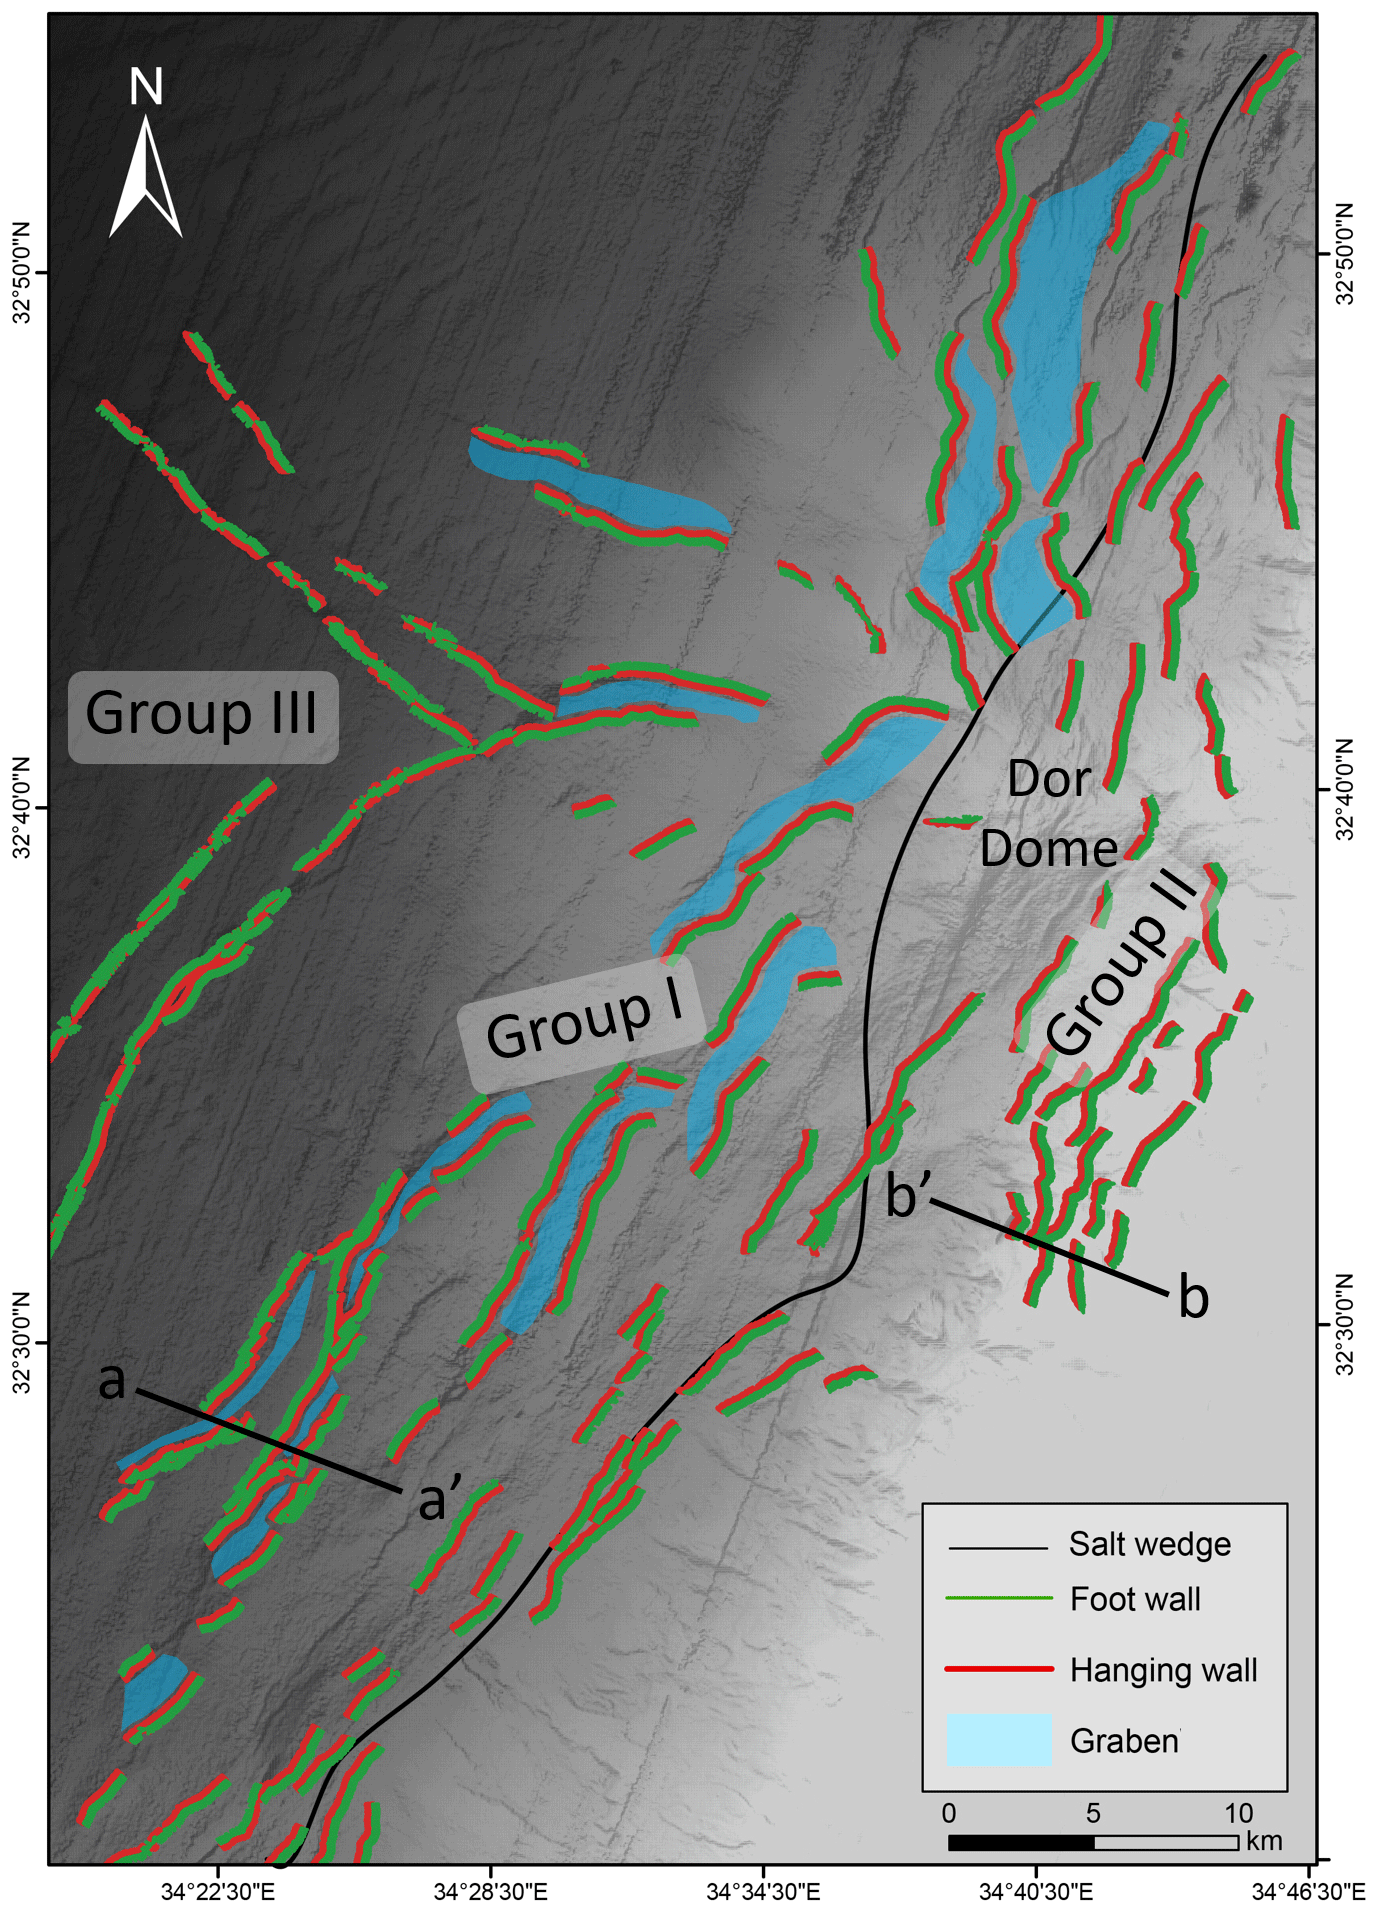
Figure 9Classification of faults according to structure and location. The hanging wall in red, the footwall in green, and the grabens in blue. Group I consists of horsts and grabens, running along the base of the continental slope west of the salt wedge-out boundary (black line). Group II consists of down-stepping normal faults with hanging walls always on the basinward side, mostly located east of the salt wedge-out line. Group III is strike-slip faults. Bathymetry from Tibor et al. (2013).
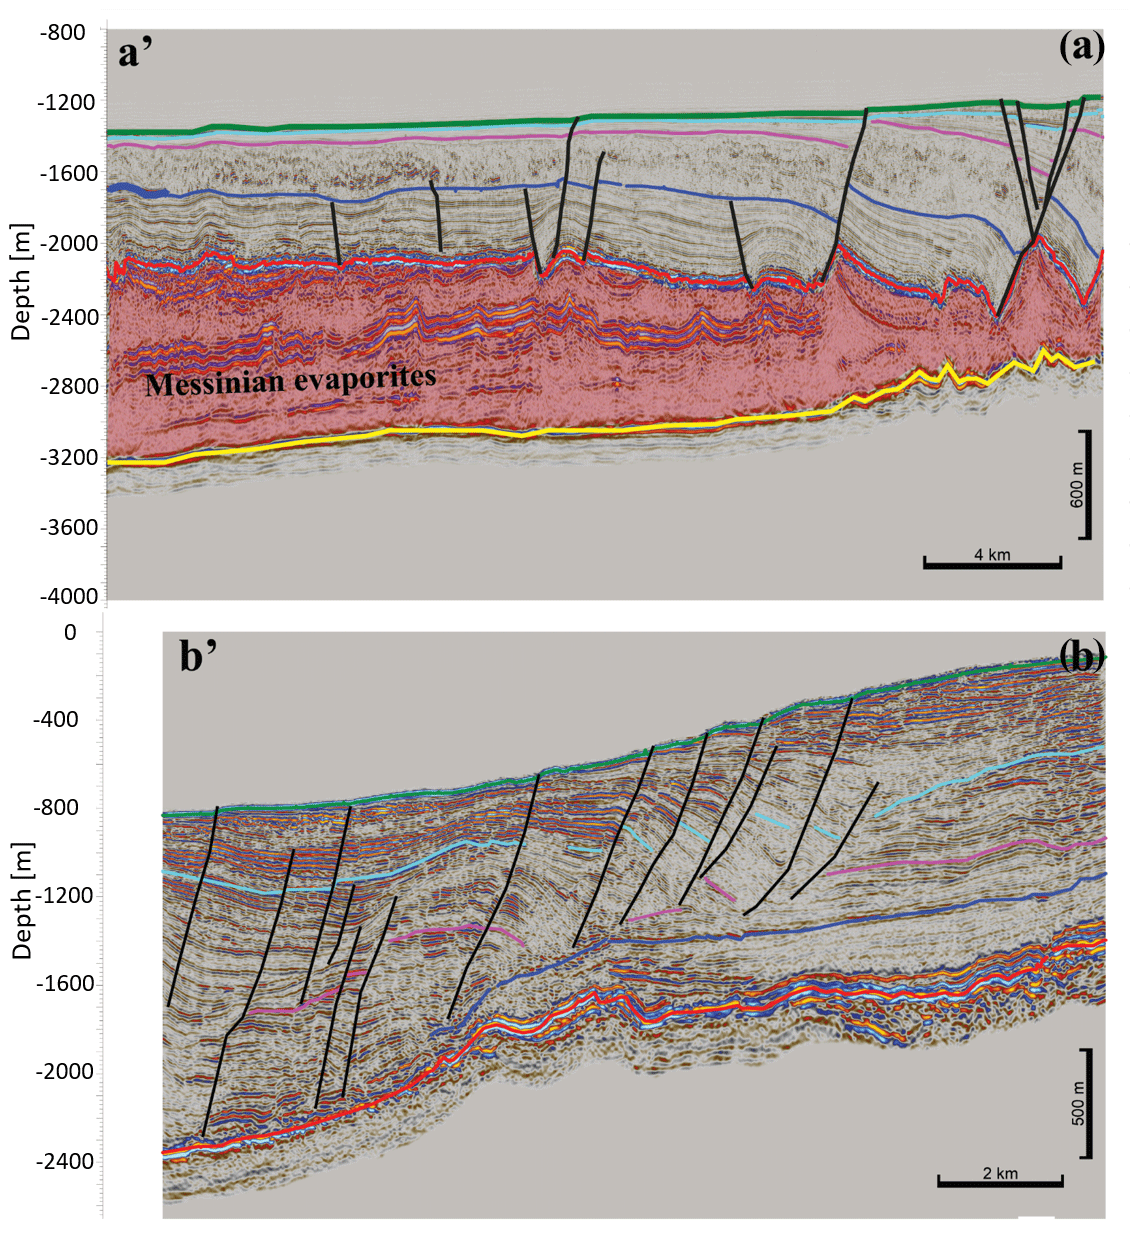
Figure 10Seismic cross sections illustrating the difference between Group I (a-a′, Sara–Mira survey) located west of the salt wedge and Group II (b-b′, Yam–Hadera survey) located on the continental slope east of the salt wedge (Messinian evaporites are missing). Note that the faults of Group II do not displace the top unit 2 horizon (unit 2 in blue). Location in Fig. 9.
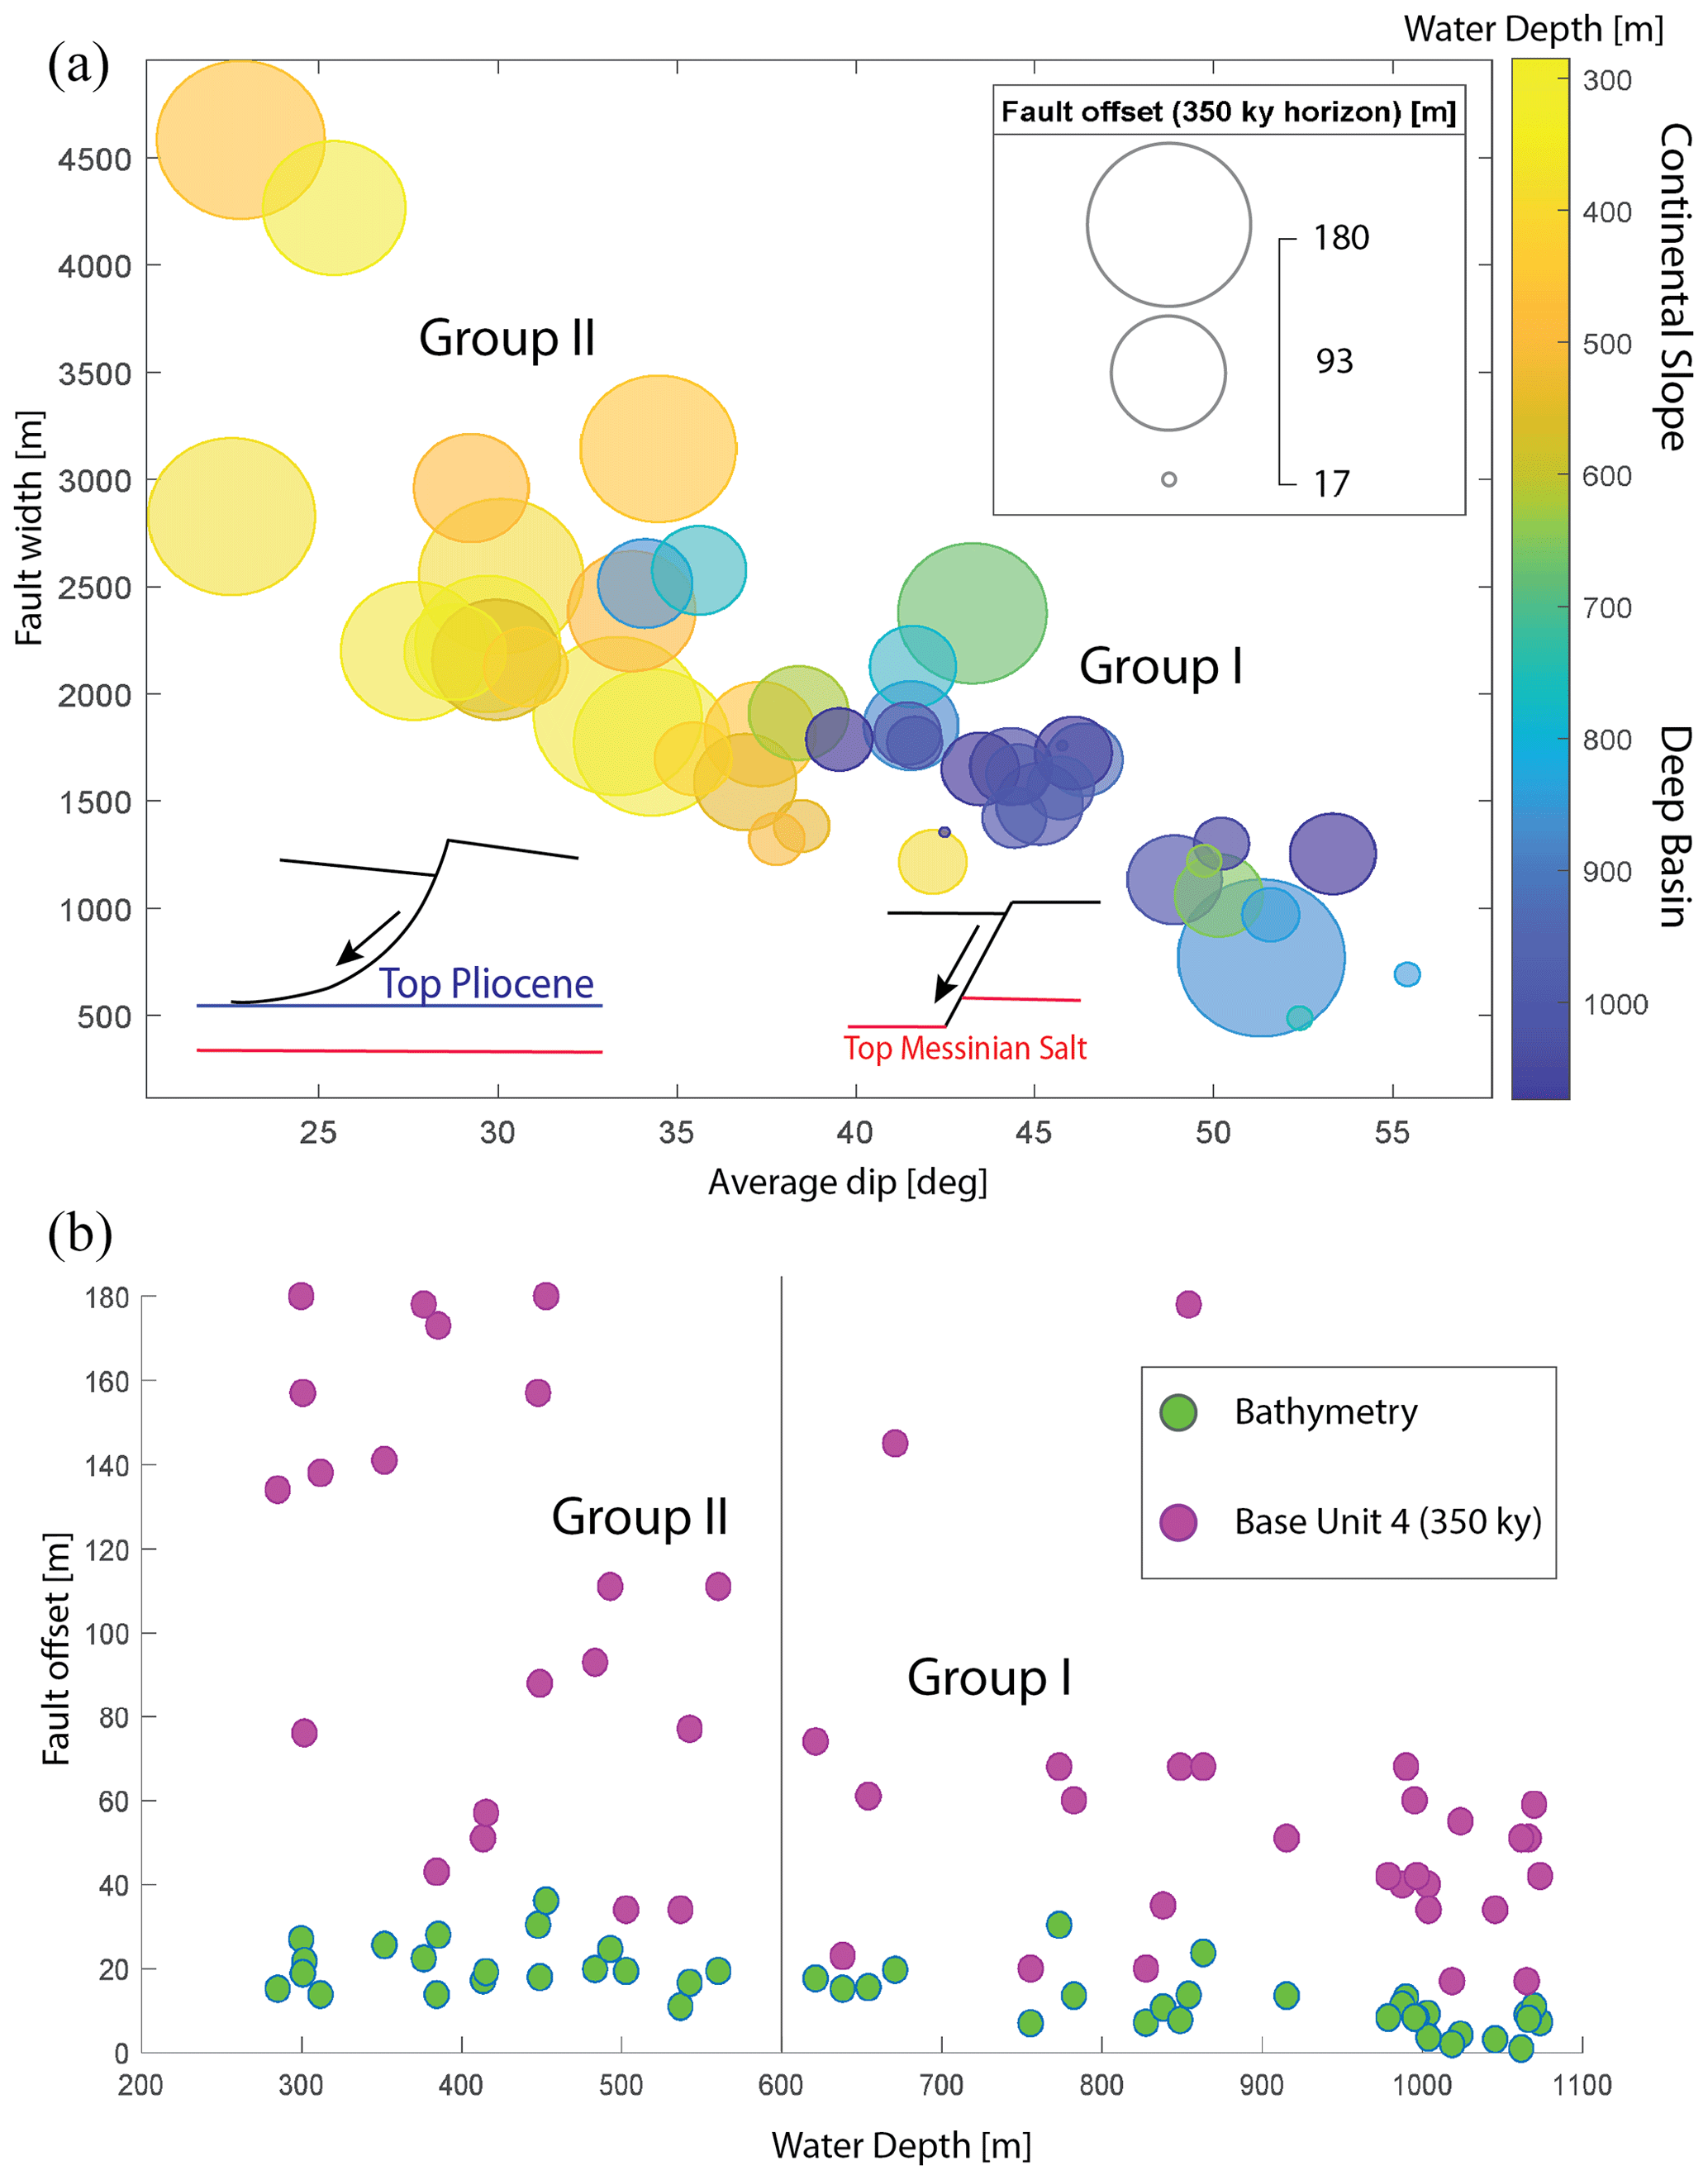
Figure 11Panel (a) shows the relationship between the average faults dip angle, the fault width, the location of the fault along the slope (water depth), and the offset of base unit 4 horizon. Group II, located on the upper slope, is characterized by larger fault width (1.5–4.5 km), gently dipping (∼ 30∘) fault planes and larger fault offsets. Panel (b) shows the difference between the offsets as they were measured on the seabed and base unit 4 (cumulative offset). The differences in faults offsets are much larger in Group II.
Group II consists of seaward-dipping faults producing a series of down-stepping stairs (growth faults, rotated blocks, and half grabens) mainly in the upper slope, east of the salt wedge-out line (Fig. 9). These faults are highly listric (Fig. 10b, cross section bb′) as already described above (Fig. 5). They are characterized by smaller dip angles of about 30∘ (Fig. 11) and do not displace unit 1 (Fig. 10b, cross section bb′).
Group III are relatively long strike-slip faults with a few hundred meters of lateral displacement (Ben Zeev and Gvirtzman, 2020). Their vertical throw is relatively small, and its direction changes along the strike (Fig. 9).
The high-resolution seismic volumes Sara–Myra and Yam Hadera allow detailed investigation of the difference between Group I and Group II according to three parameters: displacement (at the seabed and at the base unit 4), fault plane dip, and fault width. The upper panel in Fig. 11 illustrates that the fault width negatively correlates with the dip angle (larger width for gently dipping faults). The lower panel of Fig. 11 further illustrates that displacement (seabed and base unit 4) negatively correlates with water depth (faults in shallower waters have larger displacements).
Group I, located in the deeper waters (blue), is characterized by relatively small vertical offsets (better seen in the base unit 4 horizon), high dip angles (> 45∘), and relatively short fault width (0.5–2 km). Group II (the listric faults), located in shallower waters (yellow), is characterized by larger (base unit 4) vertical offsets, lower dip angles (∼ 30∘), and larger faults widths (1.5–4.5 km). These observations highlight the listric faults (Group II), located east of the salt wedge-out line (Fig. 10b), which are big in size and in vertical offsets.
5.1 Seabed versus subsurface mapping of faults
Detailed mapping of the seafloor has become standard practice in marine geohazard assessment, and the demand for improved resolution is continuously growing. Here we show that bathymetry is not enough for faults investigation, even if it is extremely detailed, because fault scarps are strongly affected by sedimentation and erosion; hence their heights do not represent the real offsets. In fact, the subsurface mapping may be more informative even if its resolution is lower. For example, peak vertical displacements of faults near the Dor disturbance are twice the size of those measured along nearby faults; yet this is not observed on the bathymetry because the scarps are quickly buried. Sedimentation rates averaged on 350 kyr indicate > 200 cm kyr−1 near the Dor disturbance (Fig. 4c). Moreover, a 6 m long core retrieved nearby (location in Fig. 4c) with a sedimentation rate of > 850 cm kyr−1 (Ashkenazi et al., 2022) indicates that the sedimentation rate may have increased in the last couple of thousands of years. Note that the sedimentation rate calculation includes all sources of material accumulated due to the downslope transport of materials.
The drawback of these measurements is their dependency on the quality of the seismic data. Where only 2D lines are available, the measured value represents the throws at the survey–fault intersection, which may represent the tip of the fault; moreover, some faults may not be crossed by any seismic profile.
Additional support for the advantage of subsurface mapping is the structural map of the 350 ka horizon (Fig. 4b) and the calculated sedimentation rate map (Fig. 4c). These maps show that the most active regions in the study area are the half grabens surrounding the Dor disturbance from the east (Fig. 5). These half grabens are rapidly subsiding (thick unit 4), and the faults bounding them are the most active. We suggest that while the faults of Group I are driven by the salt flow that produces extension above it (Hamdani et al., 2021), the faults of Group II are also affected by the gravitational collapse of the continental slope.
5.2 Fault classification
Based on the maximal vertical displacement of base unit 4 (Fig. 6c and d), we classify all fault segments mapped on the seabed (rupturing the seabed) to three vertical offset levels. Vertical offset smaller than 60 m is considered low, 60–100 m is considered moderate, and > 100 m is considered high (Fig. 12a).
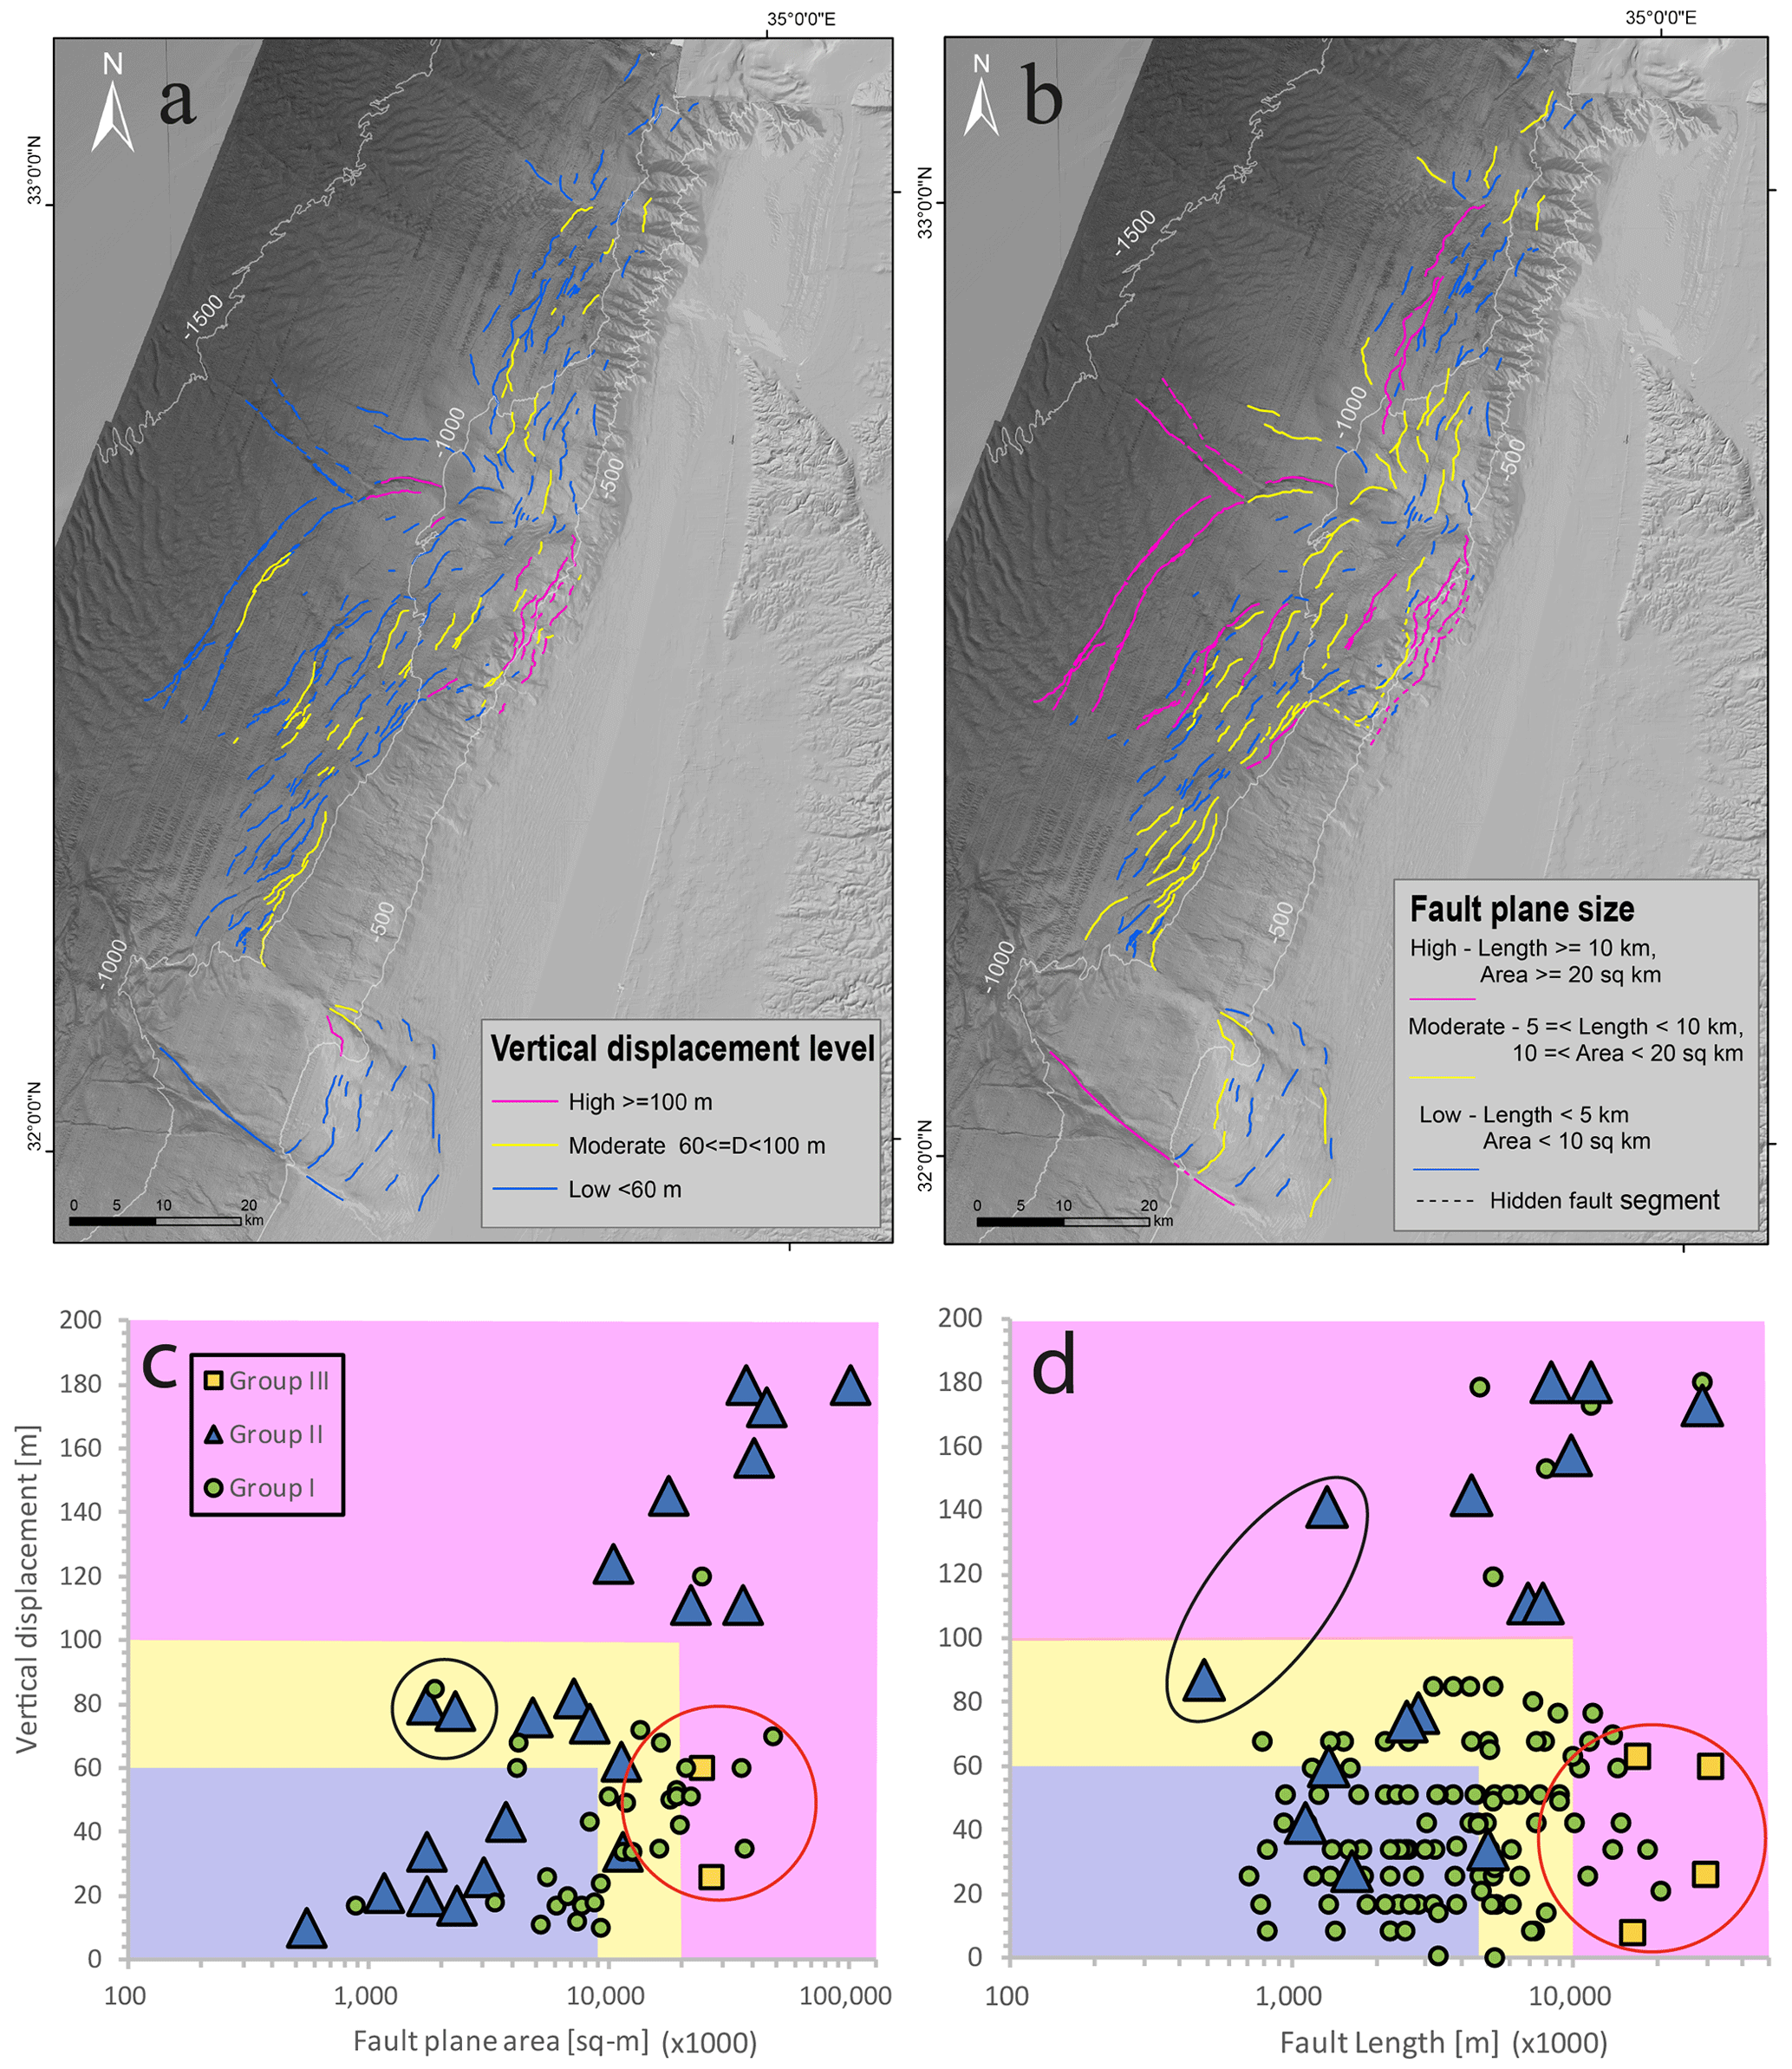
Figure 12Fault classification by vertical displacement (a) and size (b). Each seabed fault segment is assigned a value based on its subsurface structure, i.e., the maximal vertical displacement measured along the fault segment at the base unit 4 horizon and the total area of all segments, connected at the subsurface. When the 3D mapping of a fault is unavailable, fault size is expressed by its length in a map view. (c, d) Vertical displacement at base unit 4 versus fault size (length/area). Pink, yellow, and blue present three levels of vertical displacement and size, which are proxies for surface rupture and potential earthquake magnitudes, respectively. While classification by the two criteria correlates for most faults, black circles mark faults whose vertical displacement is high relative to their size, and red circles mark faults that are big relative to their vertical displacement. Bathymetry from Tibor et al. (2013).
Based on the size (area of fault plane or its length on surface projection), we classify all faults mapped at the subsurface to three levels. Fault planes smaller than 10 km2 or shorter than 5 km are considered small, an area of 10–20 km2 or length of 5–10 km is considered moderate, and an area larger than 20 km2 or length longer than 10 km is considered big (Fig. 12b).
It should be noted that unlike the classification by vertical displacement, which is performed on seabed segments, the classification of faults by size is performed on fault planes, and a single fault plain frequently combines many seabed segments (i.e., the number of fault planes in our database is significantly smaller than the number of seabed segments).
Though the two classification criteria are independently measured, and despite a certain degree of arbitrariness in choosing the cutoff values (60 and 100 m of vertical displacement; 10 and 20 km2 for fault plane area), it is interesting to compare the resulting maps. For most faults in the study area, the two criteria yield a similar category (Fig. 12c and d). That is, fault segments with high vertical displacement levels are usually a part of a big fault and vice versa, similar to observations related to deep-seated tectonic faults (Wells and Coppersmith, 1994). Exceptions, marked in Fig. 12c and d by black circles (moderate vertical displacement and small faults), mainly belong to Group II, which is exceptional in many ways, as shown above. Conversely, exceptions marked by red circles (big faults with small vertical displacement) belong to Group III, which are strike-slip faults whose vertical displacement is not expected to correlate with their dimensions.
Finally, we provide a simplified map that combines the two measured parameters into a single hazard level (Fig. 13). In this map, a high level is assigned to a fault segment, which either is characterized by high vertical displacement or large planes; low means low vertical displacement and small plane area; moderate is all the rest. This map simplifies the use of our analysis for early planning of new infrastructures on the seabed, which is the aim of this study.
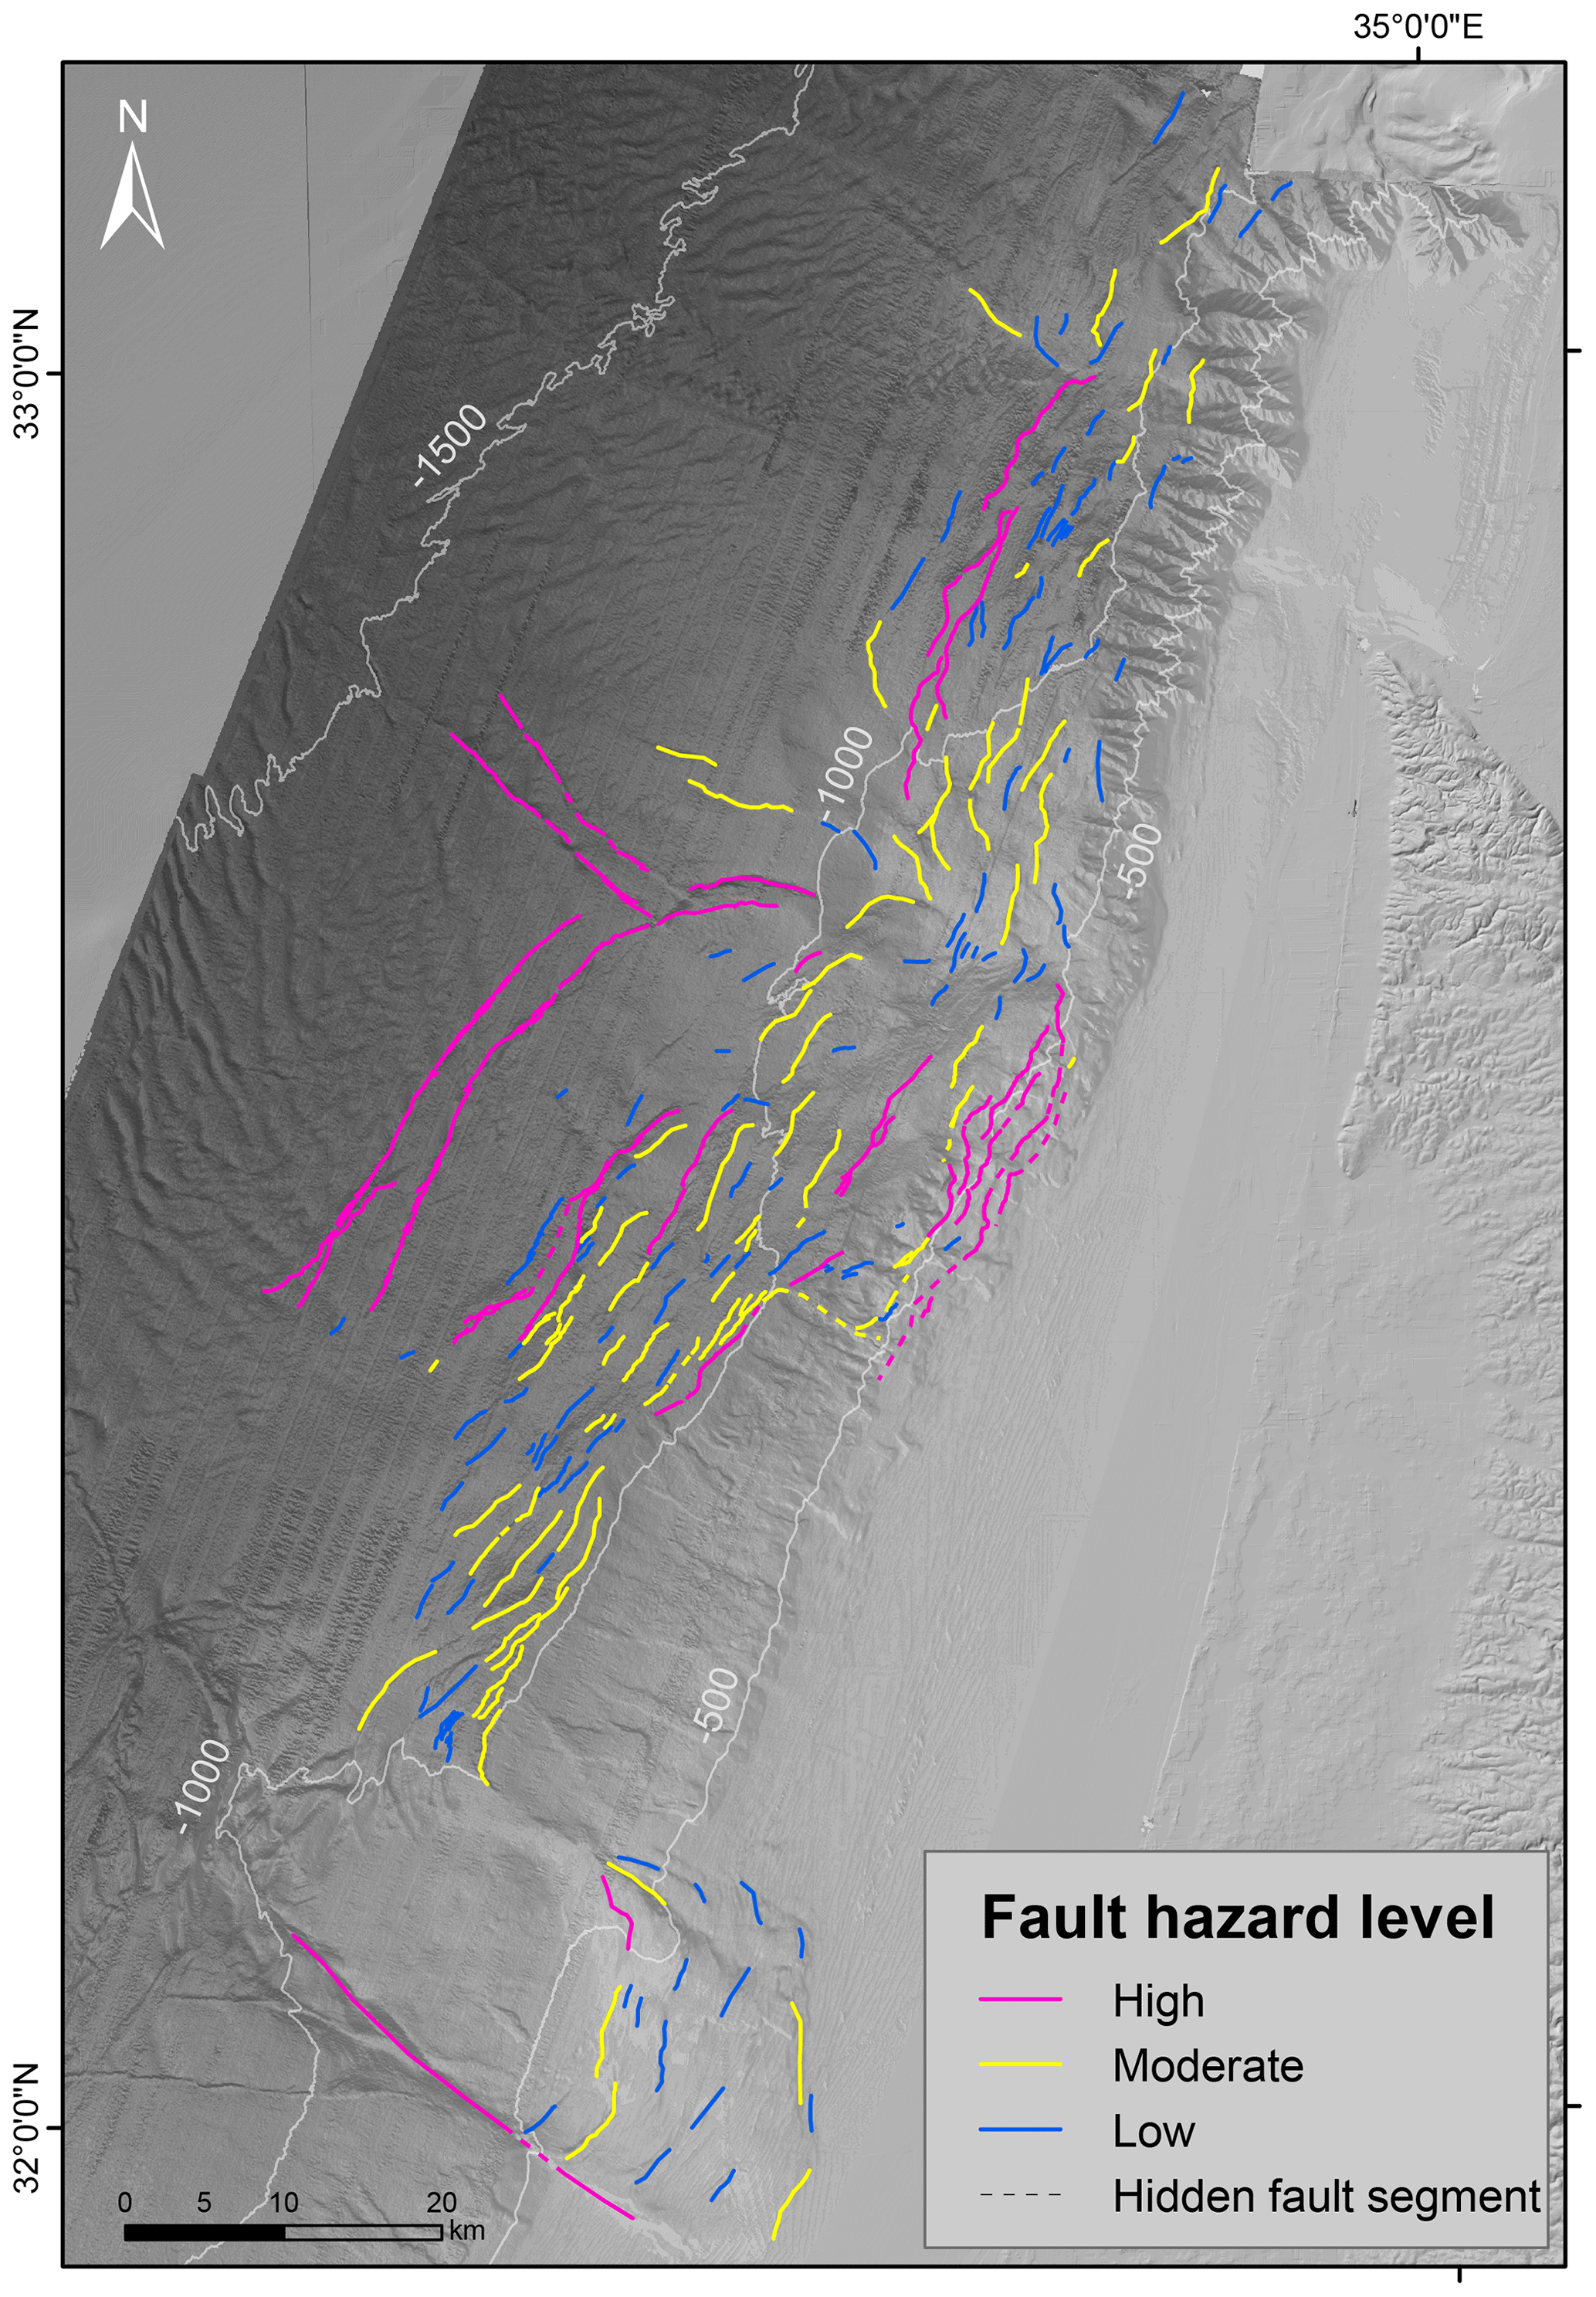
Figure 13Final simplified fault displacement hazard map classified into three hazard levels according to a combination of the two criteria presented in Fig. 12 (i.e., vertical fault displacement and size). The combination is conservative; i.e., a high level is assigned to a fault segment, which either is characterized by high vertical displacement or belongs to a big fault; low means low vertical displacement and small size; moderate are all the rest. Bathymetry from Tibor et al. (2013).
5.3 Listric faults south of the Dor disturbance
The listric faults south of the Dor disturbance (part of Group II) are particularly exceptional. Their planes dip gently with lower angles; they have a bigger width but do not penetrate unit 1; they are located on the steep slope, east of the salt wedge; and, particularly important, they produce large seabed scarps despite their location in a high sedimentation zone. In fact, the sedimentation rate at that location is 4 times larger than the vertical displacement rate (∼ 200 vs. ∼ 50 cm kyr−1, respectively, Figs. 3b and 4c). Allegedly, this observation indicates that these faults are creeping faster than the sedimentation rate, they slip seismically, or they operate in rapid episodes of tremor and slip (ETS) or “slow earthquakes” (Ito and Obara, 2006; Ikari et al., 2011). The possibility of seismic rupture was already raised by Elfassi et al. (2019) for the deep basin faults of Group I in the Sara–Myra survey, where sedimentation rates are similar or slightly higher than vertical displacement rates. In that case, continuous creep seems unlikely because its rate is similar to the burial rate and cannot produce significant seabed scarps, unless the scarps are produced by a recent rapid creep event.
5.4 Earthquakes and faults
If the thin-skinned faults offshore Israel are seismically active, they might produce earthquakes and ground shaking in addition to surface rupture. This possibility is apparently supported by the many epicenters located near the faults and particularly around the Dor disturbance (Wetzler and Kurzon, 2016). The problem is that the depths of these earthquakes are much deeper (10–30 km) than the shallow thin-skinned faults (1–2 km). Katz and Hamiel (2019) argued that many hypocenters coincide with the CMFZ at a depth of about 18 km, but this is inconsistent with Gvirtzman and Steinberg (2012), who showed that the CMFZ stopped operating in the Miocene.
The accuracy of hypocenter depths offshore Israel is highly uncertain, as stated by Wetzler and Kurzon (2016), because of the lack of seismic stations at sea and because of the simplified velocity model they extended from the onshore area. Therefore, at this stage, we cannot determine whether the recorded earthquakes offshore Israel are produced by thin-skinned faults or by deeper sources.
Another complication is the relations between fault plane area, which commonly exceeds 10 and even 20 km2 (Figs. 8 and 12b), and earthquake magnitudes, which are mostly 2 < M < 4 (Wetzler and Kurzon, 2016). These values are inconsistent with the empiric relations measured in deep-seated faults (Wells and Coppersmith, 1994), where fault planes of 10–20 km2 are typically associated with M ∼ 5 earthquakes (which have not been recorded yet). However, deep-seated faults are different from thin-skinned faults in many ways, leaving us with unclearness. This short discussion indicates that the seismicity of the thin-skinned faults needs more research, which is crucial for hazard assessment. At this stage, we cannot tell if the thin-skinned faults creep very fast, rupture seismically, or produce episodes of tremor and slip (ETS).
-
The need for geohazard assessment in the marine environment is increasing globally. Yet, in the field of hazard maps for planning and building, the offshore regions are commonly lagging decades behind the onshore practice.
-
Mapping active faults in the marine environment is particularly complicated. If the onshore practice is followed, a Holocene horizon needs to be detected in the subsurface; then, for each fault, the question whether this horizon is displaced or not needs to be answered. This requires high-resolution seismic surveys and numerous coring and thus cannot be done for large regions.
-
In site-specific surveys, detailed bathymetry has become the main tool for mapping faults. Yet, we demonstrate that this is insufficient because fault scarps are decreased by sedimentation and erosion, particularly in sediment-rich environments such as continental margins.
-
Here, we take advantage of the marine environment (wealth of seismic data) to produce maps that cannot be produced onshore. First, we map a subsurface horizon dated to 350 ka in the entire study area. Second, we measure vertical fault displacements along this horizon. Third, we map fault planes combining several fault segments and measure their size.
-
By classifying all faults according to their vertical displacement and size, we prepare two hazard maps, which are further combined into a single simplified fault hazard map.
-
Our maps are particularly useful for master planning. The sedimentation rate map alone immediately reveals tectonically active grabens, and the hazard maps help define the most hazardous zones.
-
Using our maps, we revealed a particularly problematic zone in the upper slope south of the Dor disturbance. In this area, a series of big listric faults are characterized by large vertical displacements. The sedimentation rate in this location is also exceptional – 4 times faster than the vertical displacement rate – and, still, fault scarps are prominent. We suggest that this indicates rapid creep, seismic rupture, or episodic motions.
The seismic datasets related to this article are industrial data from the Geological Survey of Israel. Details can be obtained from the Israel Ministry of Energy (https://prime.energy.gov.il/contact). Please contact the author via email for more details regarding the fault scarps algorithm, maps, and layers.
This study was conceptualized by ML under the supervision of ZG. Formal analysis, visualization of results, and writing of the original draft were performed by ML. All authors contributed to the interpretation of the findings and revision of the paper.
The contact author has declared that neither of the authors has any competing interests.
Publisher's note: Copernicus Publications remains neutral with regard to jurisdictional claims in published maps and institutional affiliations.
We are grateful to Delek Ltd. and Modiin Energy (Israel) for their permission to release data. We thank IHS Markit (London, UK) for providing the Kingdom academic licenses for seismic interpretation. We thank our colleagues in the subsurface laboratory at the Geological Survey of Israel. This research was funded by the Israeli Ministry of Energy and the Inter-Ministerial Steering Committee for Earthquake Preparedness. We also heartily thank the editor Maria Ana Baptista, reviewer Stéphane Baize, an anonymous reviewer, and reviewer Jack Williams for their constructive and important comments to improve the quality of this paper.
This research has been supported by the Ministry of Energy, Israel (grant no. 218-17-011).
This paper was edited by Maria Ana Baptista and reviewed by Stéphane Baize, Jack Williams, and one anonymous referee.
Allen, H., Jackson, C. A. L., and Fraser, A. J.: Gravity-driven deformation of a youthful saline giant: The interplay between gliding and spreading in the Messinian basins of the Eastern Mediterranean, Petrol. Geosci., 22, 340–356, https://doi.org/10.1144/petgeo2016-034, 2016.
Almagor, G.: Salt-controlled slumping on the Mediterranean slope of central Israel, Mar. Geophys. Res., 6, 227–243, https://doi.org/10.1007/BF00286527, 1984.
Almagor, G. and Garfunkel, Z.: Submarine Slumping in Continental Margin of Israel and Northern Sinai, AAPG Bull., 63, 324–340, https://doi.org/10.1306/c1ea5607-16c9-11d7-8645000102c1865d, 1979.
Almagor, G. and Hall, J. K.: Morphology of the continental margin off NE Sinai and southern Israel, Isr. J. Earth Sci., 27, 128–132, 1979.
Angell, M. M., Geophysics, A. O. A., Hanson, K., Youngs, R., and Abramson, H.: Probabilistic fault displacement hazard assessment for flowlines and export pipelines, mad dog and Atlantis field developments, deepwater Gulf of Mexico, Proc. Annu. Offshore Technol. Conf., Houston, Texas, USA, 5–8 May 2003, 2579–2603, https://doi.org/10.4043/15402-ms, 2003.
Armijo, R., Pondard, N., Meyer, B., Ucarkus, G., De Lépinay, B. M., Malavieille, J., Dominguez, S., Gustcher, M. A., Schmidt, S., Beck, C., Cagatay, N., Cakir, Z., Imren, C., Eris, K., Natalin, B., Özalaybey, S., Tolun, L., Lefévre, I., Seeber, L., Gasperini, L., Rangin, C., Emre, O., and Sarikavak, K.: Submarine fault scarps in the Sea of Marmara pull-apart (North Anatolian Fault): Implications for seismic hazard in Istanbul, Geochem. Geophy. Geosy., 6, 1–29, https://doi.org/10.1029/2004GC000896, 2005.
Ashkenazi, L., Katz, O., Abramovich, S., Almogi-Labin, A., Makovsky, Y., Gadol, O., Kanari, M., Masque, P., and Hyams-Kaphzan, O.: Benthic foraminifera as indicators of recent mixed turbidite-contourite sediment transport system in the Eastern Mediterranean upper continental slope, offshore Israel, Mar. Geol., 445, 106756, https://doi.org/10.1016/j.margeo.2022.106756, 2022.
Avni, Y., Segev, A., and Ginat, H.: Oligocene regional denudation of the northern Afar dome: Pre- and syn-breakup stages of the Afro-Arabian plate, Bull. Geol. Soc. Am., 124, 1871–1897, https://doi.org/10.1130/B30634.1, 2012.
Bar, O., Gvirtzman, Z., Feinstein, S., and Zilberman, E.: Accelerated subsidence and sedimentation in the Levant Basin during the Late Tertiary and concurrent uplift of the Arabian platform: Tectonic versus counteracting sedimentary loading effects, Tectonics, 32, 334–350, https://doi.org/10.1002/TECT.20026, 2013.
Bar, O., Zilberman, E., Feinstein, S., Calvo, R., and Gvirtzman, Z.: The uplift history of the Arabian Plateau as inferred from geomorphologic analysis of its northwestern edge, Tectonophysics, 671, 9–23, https://doi.org/10.1016/J.TECTO.2016.01.004, 2016.
Barrie, J. V., Hill, P. R., Conway, W., Iwanowska, K., and Picard, K.: Environmental Marine Geoscience 4. Georgia Basin: Seabed Features and Marine Geohazards, Geoscience Canada, 32, 145–156, 2005.
Bein, A. and Gvirtzman, G.: A Mesozoic fossil edge of the Arabian Plate along the Levant coastline and its bearing on the evolution of the Eastern Mediterranean, Structural History of the Mediterranean Basins, Editions Technip, Paris, 95–109, 1977.
Ben-Avraham, Z.: The structure and tectonic setting of the levant continental margin, Eastern Mediterranean, Tectonophysics, 46, 313–331, https://doi.org/10.1016/0040-1951(78)90210-X, 1978.
Ben-Gai, Y., Ben-Avraham, Z., Buchbinder, B., and Kendall, C. G. S. C.: Post-Messinian evolution of the Southeastern Levant Basin based on two-dimensional stratigraphic simulation, Mar. Geol., 221, 359–379, https://doi.org/10.1016/j.margeo.2005.03.003, 2005.
Ben Zeev, Y. and Gvirtzman, Z.: When Two Salt Tectonics Systems Meet: Gliding Downslope the Levant Margin and Salt Out-Squeezing From Under the Nile Delta, Tectonics, 1–24, https://doi.org/10.1029/2019tc005715, 2020.
Bertoni, C. and Cartwright, J. A.: 3D seismic analysis of circular evaporite dissolution structures, Eastern Mediterranean, J. Geol. Soc. London, 162, 909–926, https://doi.org/10.1144/0016-764904-126, 2005.
Bertoni, C. and Cartwright, J.: Messinian evaporites and fluid flow, Mar. Petrol. Geol., 66, 165–176, https://doi.org/10.1016/J.MARPETGEO.2015.02.003, 2015.
Bertoni, C. and Cartwright, J. A.: Controls on the basinwide architecture of late Miocene (Messinian) evaporites on the Levant margin (Eastern Mediterranean), Sediment. Geol., 188–189, 93–114, https://doi.org/10.1016/J.SEDGEO.2006.03.019, 2006.
Bertoni, C. and Cartwright, J. A.: Major erosion at the end of the Messinian Salinity Crisis: Evidence from the Levant Basin, Eastern Mediterranean, Basin Res., 19, 1–18, https://doi.org/10.1111/j.1365-2117.2006.00309.x, 2007.
Bruce, C. H.: Pressured Shale and Related Sediment Deformation–Mechanism for Development of Regional Contemporaneous Faults: ABSTRACT, Am. Assoc. Petr. Geol. B., 57, 878–886, https://doi.org/10.1306/83d91213-16c7-11d7-8645000102c1865d, 1973.
Bryant, W. A. and Hart, E. W.: Fault-rupture hazard zones in California, Department of Conservation, California Geological Survey, California, Spec. Publ., 42, 2–7, 2007.
Buchbinder, B. and Zilberman, E.: Sequence stratigraphy of Miocene – Pliocene carbonate – Siliciclastic shelf deposits in the eastern Mediterranean margin (Israel): Effects of eustasy and tectonics, Sediment. Geol., 112, 7–32, https://doi.org/10.1016/S0037-0738(97)00034-1, 1997.
Buchbinder, B., Martinotti, G. M., Siman-Tov, R., and Zilberman, E.: Temporal and spatial relationships in Miocene reef carbonates in Israel, Palaeogeogr. Palaeocl., 101, 97–116, https://doi.org/10.1016/0031-0182(93)90154-B, 1993.
Carmel, Z., Inman, D. L., and Golik, A.: Directional wave measurement at Haifa, Israel, and sediment transport along the Nile littoral cell, Coast. Eng., 9, 21–36, https://doi.org/10.1016/0378-3839(85)90025-0, 1985.
Cartwright, J., Jackson, M., Dooley, T., and Higgins, S.: Strain partitioning in gravity-driven shortening of a thick, multilayered evaporite sequence, Geol. Soc. Spec. Publ., 363, 449–470, https://doi.org/10.1144/SP363.21, 2012.
Cartwright, J., Kirkham, C., Bertoni, C., Hodgson, N., and Rodriguez, K.: Direct calibration of salt sheet kinematics during gravity-driven deformation, Geology, 46, 623–626, https://doi.org/10.1130/G40219.1, 2018.
Cartwright, J. A. and Jackson, M. P. A.: Initiation of gravitational collapse of an evaporite basin margin: The Messinian saline giant, Levant Basin, eastern Mediterranean, Bull. Geol. Soc. Am., 120, 399–413, https://doi.org/10.1130/B26081X.1, 2008.
Chiocci, F. L. and Ridente, D.: Regional-scale seafloor mapping and geohazard assessment. The experience from the Italian project MaGIC (Marine Geohazards along the Italian Coasts), Mar. Geophys. Res., 32, 13–23, https://doi.org/10.1007/s11001-011-9120-6, 2011.
Clark, I. R. and Cartwright, J. A.: Interactions between submarine channel systems and deformation in deepwater fold belts: Examples from the Levant Basin, Eastern Mediterranean sea, Mar. Petrol. Geol., 26, 1465–1482, https://doi.org/10.1016/j.marpetgeo.2009.05.004, 2009.
Clark, S. H., Field, M. E., and Hirozawa, C. A.: Reconnaissance geology and geologic hazards of the offshore Coos Bay basin, Oregon, U.S. Geological Survey Bulletin 1645, 1985.
Cornell, C. A.: ENGINEERING SEISMIC RISK ANALYSIS, B. Seismol. Soc. Am., 1583–1606 pp., 1968.
Cornell, C. A., Howells, D. A., Haigh, I. P., Taylor, C.: Probabilistic analysis of damage to structures under seismic loads, Dynamic waves in civil engineering, 473–488, 1971.
Crans, W., Mandl, G., and Haremboure, J.: on the Theory of Growth Faulting: a Geomechanical Delta Model Based on Gravity Sliding, J. Petrol. Geol., 2, 265–307, https://doi.org/10.1111/j.1747-5457.1980.tb00707.x, 1980.
De-Sitter, L. U.: Structural development of the Arabian Shield in Palestine, Geol. en Mijnb., 41, 116–124, 1962.
Elfassi, Y., Gvirtzman, Z., Katz, O., and Aharonov, E.: Chronology of post-Messinian faulting along the Levant continental margin and its implications for salt tectonics, Mar. Petrol. Geol., 109, 574–588, https://doi.org/10.1016/j.marpetgeo.2019.05.032, 2019.
Elias, A., Tapponnier, P., Singh, S. C., King, G. C. P., Briais, A., Daëron, M., Carton, H., Sursock, A., Jacques, E., Jomaa, R., and Klinger, Y.: Active thrusting offshore Mount Lebanon: Source of the tsunamigenic A. D. 551 Beirut-Tripoli earthquake, Geology, 35, 755–758, https://doi.org/10.1130/G23631A.1, 2007.
Evamy, B. D., Haremboure, J., Kamerling, P., Knaap, W. A., Molloy, F. A., and Rowlands, P. H.: Hydrocarbon Habitat of Tertiary Niger Delta, Am. Assoc. Petr. Geol. B., 62, 1–39, https://doi.org/10.1306/C1EA47ED-16C9-11D7-8645000102C1865D, 1978.
Eyal, Y. and Reches, Z.: Tectonic analysis of the Dead Sea Rift Region since the Late-Cretaceous based on mesostructures, Tectonics, 2, 167–185, https://doi.org/10.1029/TC002i002p00167, 1983.
Freund, R., Goldberg, M., Weissbrod, T., Druckman, Y., and Derin, B.: The Triassic–Jurassic structure of Israel and its relation to the origin of the Eastern Mediterranean, Geol. Surv. Bull. (Israel), 65, 105–127, 1975.
Gadol, O., Tibor, G., ten Brink, U., Hall, J. K., Groves-Gidney, G., Bar-Am, G., Hübscher, C., and Makovsky, Y.: Semi-automated bathymetric spectral decomposition delineates the impact of mass wasting on the morphological evolution of the continental slope, offshore Israel, Basin Res., 32, 1156–1183, https://doi.org/10.1111/bre.12420, 2019.
Garfunkel, Z.: Large-scale submarine rotational slumps and growth faults in the Eastern Mediterranean, Mar. Geol., 55, 305–324, https://doi.org/10.1016/0025-3227(84)90074-4, 1984.
Garfunkel, Z.: The pre-Quaternary geology of Israel, Monog. Biol., 62, 7–34 1988.
Garfunkel, Z.: Constrains on the origin and history of the Eastern Mediterranean basin, Tectonophysics, 298, 5–35, https://doi.org/10.1016/S0040-1951(98)00176-0, 1998.
Garfunkel, Z. and Almagor, G.: Geology and structure of the continental margin off northern Israel and the adjacent part of the Levantine Basin, Mar. Geol., 62, 105–131, https://doi.org/10.1016/0025-3227(84)90057-4, 1984.
Garfunkel, Z. and Derin, B.: Permian-early Mesozoic tectonism and continental margin formation in Israel and its implications for the history of the Eastern Mediterranean, Geol. Soc. Spec. Publ., 17, 187–201, https://doi.org/10.1144/GSL.SP.1984.017.01.12, 1984.
Garfunkel, Z., Arad, A., and Almagor, G.: Palmahim disturbance and similar structures offshore Israel, Israel Electric Corp. Rept., 1977.
Garfunkel, Z., Almagor, G., and Arad, A.: The Palmahim disturbance and its regional setting, Geol. Surv. Isr. Bull., 72, 1–58, 1979.
Ginzburg, A. and Ben-Avraham, Z.: The deep structure of the central and southern Levant continental margin, Ann. Tectonicae, 1, 105–115, 1987.
Goldsmith, V. and Golik, A.: Sediment transport model of the southeastern Mediterranean coast, Mar. Geol., 37, 147–175, https://doi.org/10.1016/0025-3227(80)90015-8, 1980.
Golik, A.: Indirect evidence for sediment transport on the continental shelf off Israel, Geo-Mar. Lett.., 13, 159–164, https://doi.org/10.1007/BF01593189, 1993.
Golik, A.: Pattern of sand transport along the Israeli coastline, Isr. J. Earth Sci., 51, 191–202, 2002.
Gradmann, S., Hübscher, C., Ben-Avraham, Z., Gajewski, D., and Netzeband, G.: Salt tectonics off northern Israel, Mar. Petrol. Geol., 22, 597–611, https://doi.org/10.1016/j.marpetgeo.2005.02.001, 2005.
Gvirtzman, G. and Buchbinder, B.: Recent and Pleistocene Coral Reefs and Coastal Sediments of the Gulf of Elat. IAS, Sedimentology in Israel, Cyprus and Turkey, Tenth International Congress on Sedimentology, Jerusalem, 160–191, 1978.
Gvirtzman, Z. and Garfunkel, Z.: Vertical movements following intracontinental magmatism: An example from southern Israel, J. Geophys. Res.-Sol. Ea., 102, 2645–2658, https://doi.org/10.1029/96jb02567, 1997.
Gvirtzman, Z. and Garfunkel, Z.: The transformation of southern Israel from a swell to a basin: Stratigraphic and geodynamic implications for intracontinental tectonics, Earth Planet. Sc. Lett., 163, 275–290, https://doi.org/10.1016/S0012-821X(98)00193-9, 1998.
Gvirtzman, Z. and Steinberg, J.: Inland jump of the Arabian northwest plate boundary from the Levant continental margin to the Dead Sea Transform, Tectonics, 31, TC4003, https://doi.org/10.1029/2011TC002994, 2012.
Gvirtzman, Z., Zilberman, E., and Folkman, Y.: Reactivation of the Levant passive margin during the late Tertiary and formation of the Jaffa Basin offshore central Israel, Journal of the Geological Society, 165, 563–578, 2008.
Gvirtzman, Z., Reshef, M., Buch-Leviatan, O., and Ben-Avraham, Z.: Intense salt deformation in the Levant Basin in the middle of the Messinian Salinity Crisis, Earth Planet. Sc. Lett., 379, 108–119, https://doi.org/10.1016/J.EPSL.2013.07.018, 2013.
Gvirtzman, Z., Reshef, M., Buch-Leviatan, O., Groves-Gidney, G., Karcz, Z., Makovsky, Y., and Ben-Avraham, Z.: Bathymetry of the Levant basin: interaction of salt-tectonics and surficial mass movements, Mar. Geol., 360, 25–39, https://doi.org/10.1016/J.MARGEO.2014.12.001, 2015.
Gvirtzman, Z., Manzi, V., Calvo, R., Gavrieli, I., Gennari, R., Lugli, S., Reghizzi, M., and Roveri, M.: Intra-Messinian truncation surface in the Levant Basin explained by subaqueous dissolution, Geology, 45, 915–918, https://doi.org/10.1130/G39113.1, 2017.
Hall, J. K.: Digital shaded-relief map of Israel and environs, Agaf ha-medidot, 1994.
Hamdani, I., Aharonov, E., Olive, J. A., Parez, S., and Gvirtzman, Z.: Initiating Salt Tectonics by Tilting: Viscous Coupling Between a Tilted Salt Layer and Overlying Brittle Sediment, J. Geophys. Res.-Sol. Ea., 126, e2020JB021503, https://doi.org/10.1029/2020JB021503, 2021.
Harding, T. P. and Lowell, J. D.: Structural Styles, Their Plate-Tectonic Habitats, and Hydrocarbon Traps in Petroleum Provinces, Am. Assoc. Petr. Geol. B., 63, 1016–1058, https://doi.org/10.1306/2F9184B4-16CE-11D7-8645000102C1865D, 1979.
Henson, R. S.: Observations on the geology and petroleum occurrences in the Middle East, in: 3rd World Petroleum Congress, The Hague, the Netherlands, 28 May–6 June 1951, OnePetro, Paper Number: WPC-4009, 1951.
Hough, G., Green, J., Fish, P., Mills, A., and Moore, R.: A geomorphological mapping approach for the assessment of seabed geohazards and risk, Mar. Geophys. Res., 32, 151–162, https://doi.org/10.1007/s11001-010-9111-z, 2011.
Hsü, K., Cita, M. B., and Ryan, W.: The origin of the Mediterranean evaporites, DSDP, Initial Reports Deep Sea Drill. Proj. 13, Part 2, 1203–1231, https://doi.org/10.2973/dsdp.proc.13.143.1973, 1973.
Hubscher, C., Beitz, M., Dummong, S., Gradmann, S., Meier, K., and Netzband, G.: Stratigraphy, fluid dynamics and structural evolution of the Messinian Evaporites in the Levant Basin, eastern Mediterranean Sea, The Messinian Salinity Crisis from Mega-Deposits to Microbiology – A Consensus Report, 33, 97–105, 2008.
Hübscher, C., Netzeband, G. L.: Evolution of a young salt giant: the example of the Messinian evaporites in the Levantine Basin, in: The Mechanical Behavior of Salt–Understanding of THMC Processes in Salt, CRC Press, 175–182, 2017.
IHS Markit: Kingdom® 2020, https://ihsmarkit.com/index.html (last access: 11 January 2023), 2022.
Ikari, M. J., Saffer, D. M., Editors, G., Saffer, D., Henry, P., and Tobin, H.: Comparison of frictional strength and velocity dependence between fault zones in the Nankai accretionary complex, Geochem. Geophy. Geosy., 12, 0–11, https://doi.org/10.1029/2010GC003442, 2011.
Ito, Y. and Obara, K.: Very low frequency earthquakes within accretionary prisms are very low stress-drop earthquakes, Geophys. Res. Lett., 33, L09302, https://doi.org/10.1029/2006GL025883, 2006.
Kafri, U. and Folkman, Y.: Multiphase reverse vertical tectonic displacement across major faults in northern Israel, Earth Planet. Sc. Lett., 53, 343–348, https://doi.org/10.1016/0012-821X(81)90039-X, 1981.
Kanari, M., Tibor, G., Hall, J. K., Ketter, T., Lang, G., and Schattner, U.: Sediment transport mechanisms revealed by quantitative analyses of seafloor morphology: New evidence from multibeam bathymetry of the Israel exclusive economic zone, Mar. Petrol. Geol., 114, 104224, https://doi.org/10.1016/J.MARPETGEO.2020.104224, 2020.
Katz, O. and Hamiel, Y.: The nature of small to medium earthquakes along the Eastern Mediterranean passive continental margins, and their possible relationships to landslides and submarine salt-tectonic-related shallow faults, Geol. Soc. London, Spec. Publ., 477, 15–22, https://doi.org/10.1144/sp477.5, 2019.
Katz, O., Reuven, E., and Aharonov, E.: Submarine landslides and fault scarps along the eastern Mediterranean Israeli continental-slope, Mar. Geol., 369, 100–115, https://doi.org/10.1016/j.margeo.2015.08.006, 2015.
Kirkham, C., Cartwright, J., Bertoni, C., Rodriguez, K., and Hodgson, N.: 3D kinematics of a thick salt layer during gravity-driven deformation, Mar. Petrol. Geol., 110, 434–449, https://doi.org/10.1016/J.MARPETGEO.2019.07.036, 2019.
Klein, M., Zviely, D., Kit, E., and Shteinman, B.: Sediment Transport along the Coast of Israel: Examination of Fluorescent Sand Tracers, J. Coastal Res., 236, 1462–1470, https://doi.org/10.2112/05-0488.1, 2007.
Krenkel, E.: Die Bruchzonen Ostafrikas, Geol. Rundschau, 14, 209–232, https://doi.org/10.1007/BF01810069, 1924.
Kvalstad, T. J.: What is the Current “Best Practice” in Offshore Geohazard Investigations? A State-of-the-Art Review, in: Offshore Technology Conference, Houston, Texas, USA, 30 April–3 May 2007, OnePetro, Paper Number: OTC-18545-MS, https://doi.org/10.4043/18545-ms, 2007.
Loncke, L., Gaullier, V., Mascle, J., Vendeville, B., and Camera, L.: The Nile deep-sea fan: An example of interacting sedimentation, salt tectonics, and inherited subsalt paleotopographic features, Mar. Petrol. Geol., 23, 297–315, https://doi.org/10.1016/j.marpetgeo.2006.01.001, 2006.
Mart, Y. and Gai, Y. B.: Some depositional patterns at continental margin of southeastern Mediterranean Sea, Am. Assoc. Petr. Geol. B., 66, 460–470, https://doi.org/10.1306/03B59B39-16D1-11D7-8645000102C1865D, 1982.
Mart, Y. and Ryan, W.: The levant slumps and the Phoenician structures: Collapse features along the continental margin of the southeastern Mediterranean Sea, Mar. Geophys. Res., 28, 297–307, https://doi.org/10.1007/s11001-007-9032-7, 2007.
Mart, Y., Eisin, B., and Folkman, Y.: The Palmahim structure – A model of continuous tectonic activity since the Upper Miocene in the Southeastern Mediterranean off Israel, Earth Planet. Sc. Lett., 39, 328–334, https://doi.org/10.1016/0012-821X(78)90018-3, 1978.
Martinez, J. F., Cartwright, J., and Hall, B.: 3D seismic interpretation of slump complexes: Examples from the continental margin of Israel, Basin Res., 17, 83–108, https://doi.org/10.1111/j.1365-2117.2005.00255.x, 2005.
Mascle, J., Zitter, T., Bellaiche, G., Droz, L., Gaullier, V., and Loncke, L.: The Nile deep sea fan: preliminary results from a swath bathymetry survey, Mar. Petrol. Geol., 18, 471–477, https://doi.org/10.1016/S0264-8172(00)00072-6, 2001.
Neev, D.: Tectonic evolution of the Middle East and the Levantine basin (easternmost Mediterranean), Geology, 3, 683–686, https://doi.org/10.1130/0091-7613(1975)3<683:TEOTME>2.0.CO;2, 1975.
Neev, D., Bakler, N., Moshkovitz, S., Kaufman, A., Magaritz, M., and Gofna, R.: Recent Faulting along the Mediterranean Coast of Israel, Nature, 245, 254–256, https://doi.org/10.1038/245254a0, 1973.
Neev, D., Almagor, G., Arad, A., Ginzburg, A., Hall, J. K.: The geology of the southeastern Mediterranean Sea, Geological Survey of Israel, GSI report No. 68, 88 pp., 1976.
Netzeband, G. L., Hübscher, C. P., and Gajewski, D.: The structural evolution of the Messinian evaporites in the Levantine Basin, Mar. Geol., 230, 249–273, https://doi.org/10.1016/j.margeo.2006.05.004, 2006.
On, G. N.: Guidance Notes on Subsea Pipeline Route Determination, ABS (American Bureau of Shipping), 56 pp., 2016.
Perlin, A. and Kit, E.: Longshore Sediment Transport on Mediterranean Coast of Israel, J. Waterw. Port C. Div., 125, 80–87, https://doi.org/10.1061/(asce)0733-950x(1999)125:2(80), 1999.
Posamentier, H. W.: Seismic stratigraphy into the next millennium; a focus on 3D seismic data, American Association of Petroleum Geologists Annual Conference, New Orleans, LA, 16–19 April 2000, AAPG, A118, 2000.
Prior, D. B. and Hooper, J. R.: Sea floor engineering geomorphology: Recent achievements and future directions, Geomorphology, 31, 411–439, https://doi.org/10.1016/S0169-555X(99)00090-2, 1999.
Reches, Z. and Hoexter, D. F.: Holocene seismic and tectonic activity in the Dead Sea area, Tectonophysics, 80, 235–254, https://doi.org/10.1016/0040-1951(81)90151-7, 1981.
Robertson, A. H. F.: 54. Mesozoic-Tertiary tectonic evolution of the easternmost Mediterranean area: Integration of marine and land evidence, Proceedings of the Ocean Drilling Program: Scientific Results, 160, 723–784, https://doi.org/10.2973/odp.proc.sr.160.061.1998, 1998.
Ryan, W. B. F. and Cita, M. B.: The nature and distribution of Messinian erosional surfaces – Indicators of a several-kilometer-deep Mediterranean in the Miocene, Mar. Geol., 27, 193–230, https://doi.org/10.1016/0025-3227(78)90032-4, 1978.
Ryan, W. B. F. and Hsü, K. J.: Initial Report of the Deep-Sea Drilling Project, Leg XIII, US Gov. Printing Office Washington, 1973.
Sade, A. R., Hall, J. K., Amit, G., Golan, A., Gur-Arieh, L., and Tibor, G.: The Israel national bathymetric survey – A new look at the seafloor off Israel, Isr. J. Earth Sci., 55, 185–187, https://doi.org/10.1560/IJES_55_3_185, 2006.
Sade, R., Hall, J. K., and Golan, A.: Multibeam bathymetry of the seafloor off Northern Israel, Israel Geological Society, Abstracts, 2007, p. 104, 2007.
Safadi, M., Meilijson, A., and Makovsky, Y.: Internal deformation of the southeast Levant margin through continued activity of buried mass transport deposits, Tectonics, 36, 559–581, https://doi.org/10.1002/2016TC004342, 2017.
Sagy, A., Sneh, A., Rosensaft, M., and Bartov, Y.: Map of 'active' and 'potentially active' faults that rupture the surface in Israel: Updates 2013 for Israel Standard 413, Geological Survey of Israel, Jerusalem, Report No. GSI/02/2013, 17 pp., 2013 (in Hebrew, English abstract).
Sagy, Y., Gvirtzman, Z., and Reshef, M.: 80 m.y. of folding migration: New perspective on the Syrian arc from Levant Basin analysis, Geology, 46, 175–178, 2018.
Schattner, U. and Lazar, M.: Hierarchy of source-to-sink systems – Example from the Nile distribution across the eastern Mediterranean, Sediment. Geol., 343, 119–131, https://doi.org/10.1016/j.sedgeo.2016.08.006, 2016.
Schattner, U., Ben-Avraham, Z., Lazar, M., and Hüebscher, C.: Tectonic isolation of the Levant basin offshore Galilee-Lebanon – effects of the Dead Sea fault plate boundary on the Levant continental margin, eastern Mediterranean, J. Struct. Geol., 28, 2049–2066, https://doi.org/10.1016/J.JSG.2006.06.003, 2006.
Schattner, U., Gurevich, M., Kanari, M., and Lazar, M.: Levant jet system-effect of post LGM seafloor currents on Nile sediment transport in the eastern Mediterranean, Sediment. Geol., 329, 28–39, https://doi.org/10.1016/j.sedgeo.2015.09.007, 2015.
Sharon, M., Sagy, A., Kurzon, I., Marco, S., and Rosensaft, M.: Assessment of seismic sources and capable faults through hierarchic tectonic criteria: implications for seismic hazard in the Levant, Nat. Hazards Earth Syst. Sci., 20, 125–148, https://doi.org/10.5194/nhess-20-125-2020, 2020.
Shmatkova, A. A., Shmatkov, A. A., Gainanov, V. G., and Buenz, S.: Identification of geohazards based on the data of marine high-resolution 3D seismic observations in the Norwegian Sea, Moscow Univ. Geol. Bull., 70, 53–61, https://doi.org/10.3103/S0145875215010068, 2015.
Stanley, D. J.: Sediment transport on the coast and shelf between the Nile delta and Israeli margin as determined by heavy minerals, J. Coastal Res., 5, 813–828, 1989.
Steinberg, J., Gvirtzman, Z., Gvirtzman, H., and Ben-Gai, Y.: Late Tertiary faulting along the coastal plain of Israel, Tectonics, 27, TC4014, https://doi.org/10.1029/2007TC002151, 2008.
Steinberg, J., Gvirtzman, Z., Folkman, Y., and Garfunkel, Z.: Origin and nature of the rapid late Tertiary filling of the Levant Basin, Geology, 39, 355–358, https://doi.org/10.1130/G31615.1, 2011.
Styron, R. and Pagani, M.: The GEM Global Active Faults Database, Earthq. Spectra, 36, 160–180, https://doi.org/10.1177/8755293020944182, 2020.
Tibor, G., Ben‐Avraham, Z., Steckler, M., and Fligelman, H.: Late Tertiary subsidence history of the Southern Levant Margin, Eastern Mediterranean Sea, and its implications to the understanding of the Messinian event, J. Geophys. Res.-Sol. Ea., 97, 17593–17614, 1992.
Tibor, G., Sade, R., Sade, H., and Hall, J. K.: Data collection and processing of multibeam data from the deep water offshore Israel, Israel Oceanographic and Limnological Research (IOLR), IOLR report H-31/2013, 2013.
Wells, D. L. and Coppersmith, K. J.: New Empirical Relationships among Magnitude, Rupture Length, Rupture Width, Rupture Area, and Surface Displacement, B. Seismol. Soc. Am., 84, 974–1002, 1994.
Wetzler, N. and Kurzon, I.: The Earthquake Activity of Israel: Revisiting 30 Years of Local and Regional Seismic Records along the Dead Sea Transform, Seismol. Res. Lett., 87, 47–58, https://doi.org/10.1785/0220150157, 2016.
Wong, I. G. and Stepp, C.: Probabilistic seismic hazard analyses for fault displacement and vibratory ground motion at Yucca Mountain, Nevada, Milestone SP321M3 WBS Number 1.2.3.2.8.3.6, U.S. Geological Survey, Oakland, California, Report No. MOL.19981207.0393, 1–76, 1998.
Youngs, R. R., Arabasz, W. J., Anderson, R. E., Ramelli, A. R., Ake, J. P., Slemmons, D. B., McCalpin, J. P., Doser, D. I., Fridrich, C. J., Swan, F. H., Rogers, A. M., Yount, J. C., Anderson, L. W., Smith, K. D., Bruhn, R. L., Knuepfer, P. L. K., Smith, R. B., DePolo, C. M., O'Leary, D. W., Coppersmith, K. J., Pezzopane, S. K., Schwartz, D. P., Whitney, J. W., Olig, S. S., and Toro, G. R.: A methodology for probabilistic fault displacement hazard analysis (PFDHA), Earthq. Spectra, 19, 191–219, https://doi.org/10.1193/1.1542891, 2003.
Zucker, E., Gvirtzman, Z., Granjeon, D., and Garcia-castellanos, D.: The accretion of the Levant continental shelf alongside the Nile Delta by immense margin-parallel sediment transport, Mar. Petrol. Geol., 126, 104876, https://doi.org/10.1016/j.marpetgeo.2020.104876, 2021.
Zviely, D., Sivan, D., Ecker, A., Bakler, N., Rohrlich, V., Galili, E., Boaretto, E., Klein, M., and Kit, E.: Holocene evolution of the Haifa Bay area, Israel, and its influence on ancient tell settlements, Holocene, 16, 849–861, https://doi.org/10.1191/0959683606hol977rp, 2006.
Zviely, D., Kit, E., and Klein, M.: Longshore sand transport estimates along the Mediterranean coast of Israel in the Holocene, Mar. Geol., 238, 61–73, https://doi.org/10.1016/j.margeo.2006.12.003, 2007.