the Creative Commons Attribution 4.0 License.
the Creative Commons Attribution 4.0 License.
 | 17 Jan 2023
Warning water level determination and its spatial distribution in coastal areas of China
Shan Liu
Xianwu Shi
Qiang Liu
Jun Tan
Yuxi Sun
Qingrong Liu
Haoshuang Guo
The warning water level is the default water level at which storm surges may occur along a coast and indicates a stage of alert. This level forms the basis for storm-surge forecasting, and prewarning is an important reference for governments and aids in the decision-making process for storm-surge prevention and disaster risk mitigation. The warning water level has four categories (blue, yellow, orange, and red) based on water level observational data. Taking into account the actual defense capability of the shore, we determined the warning water level by comprehensively analyzing factors, including the high water level at the typical return period of each shore section, wave exposure degree and defense capability of storm-surge protection facilities, and the shore-section importance level. Here, we proposed a quantitative method for determining the warning water level, and the application of this method was introduced by determining the warning water level at the shore section of Zhifu District (Yantai City, Shandong Province, China) as an example. We analyzed the spatial distribution characteristics of the warning water levels for 259 shore sections along the coast and revealed their current marine disaster prevention capabilities. Our findings provide a valid direction for determining future warning water levels and a reliable scientific reference for redetermining warning water levels in coastal areas while improving marine disaster prevention and protection capabilities.
- Article
(4381 KB) - Full-text XML
- BibTeX
- EndNote


China is severely affected by storm surges, which have caused huge economic losses and casualties in coastal areas and represent an important factor restricting coastal economic and social development. A statistical report showed that storm surges caused CNY 78.407 billion of direct economic losses and 33 deaths from 2012 to 2021 (including missing person cases) along the coast of China (Ministry of Natural Resources of China, 2021a). However, the number of deaths due to storm surges has decreased sharply due to improvements in storm-surge warning systems (Shi et al., 2015). The warning water level is the default water level at which storm surges may occur along the coast of protected areas, indicating a stage of alert and the need to implement disaster relief strategies (State Oceanic Administration of China, 2012). Notably, the warning water level is the basis of storm-surge forecasting; it also provides a distinct signal to raise an alert for storm-surge disaster prevention and mitigation.
The warning level of a storm surge is determined based on the highest water level of each tide gauge station affected by the storm surge exceeding the local warning water level. A number of simulation models played an important role in the prewarning of storm surges, including Sea, Lake, and Overland Surges from Hurricanes (SLOSH) in the USA, the DELFT3D model in the Netherlands, and the MIKE21 model in Denmark (Konishi, 1995; Lenstra et al., 2019; Lin et al., 2010; Mercado, 1994). Several numerical models have been widely applied across various countries and regions to simulate and forecast storm surges and coastal flood inundation. The National Oceanic and Atmospheric Administration used the SLOSH model to jointly conduct storm-surge risk assessment with government agencies and make large-scale national storm-surge hazard maps for the disaster management department, insurance companies, and residents (National Oceanic and Atmospheric Administration of USA, 2018). The Royal Netherlands Meteorological Institute categorized the country's coastlines into several parts (according to tidal changes), determined the warning water level, utilized the Dutch continental shelf model to forecast storm surges, and issued alerts according to the warning water level (Herman et al., 2013; Yu et al., 2020). High-precision storm-surge numerical models were conducted to investigate the inundation range and water depth distribution of storm surges in Pingyang County (Zhejiang Province, China), as well as in Jinshan District (Shanghai, China) and Huizhou District (Guangdong, China) (Shi et al., 2020a, b; Wang et al., 2021). A 2-D flood inundation model (FloodMap-Inertial) was employed to predict the coastal flood inundation of Lingang New City (Shanghai, China), considering 100- and 1000-year coastal flood return periods (Yin et al., 2019). Much of the current work on extreme coastal flooding events is based on the classical extreme value theory (EVT), which identifies the family of distribution functions known as generalized extreme value (GEV) distribution as a general model for the distribution of maxima (or minima) extracted from fixed time periods of equal length (Stuart, 2011; Caruso and Marani, 2022; Haixia et al., 2022). In the mid-1990s, the State Oceanic Administration of China determined the warning water level for key ports and shore sections based on observational data from ocean stations (Huang and Chen, 1995), and the created determination criterion was 1-D; specifically, it was one value per station. With the rapid development of China's marine economy, the coastline characteristics, development status, population density, and protection facilities in coastal areas have greatly changed. Notably, the warning water level determined at the end of the last century is no longer applicable to current conditions or appropriate for storm-surge prevention and mitigation. Therefore, the State Oceanic Administration of China organized a new round of warning water level assessments in coastal areas in the mid-2010s, and the criteria of warning water levels were divided into four categories (blue, yellow, orange, and red), spanning 259 shore sections in 11 coastal provinces. This assessment was then issued by the governments of each coastal province (National Marine Hazard Mitigation Service of China, 2018). In order to adapt to the new structure of coastal disaster prevention and mitigation, the newly issued warning water levels were quickly applied towards the early warning and forecasting of storm surges (Fu et al., 2017). The four warning water levels corresponded to the four levels of marine disaster emergency response (State Oceanic Administration of China, 2015), which significantly strengthened and supported disaster emergency management at all levels of China's coastal governments.
Here, we describe the technical methods used for warning water level determination and introduce the process and results of this determination in Zhifu District in Yantai City, Shandong Province, China. Through the analysis of spatial distribution characteristics of the warning water levels in 259 shore sections in China, we revealed the current marine disaster prevention capabilities of coastal areas, based on which we propose improvements for future warning water level assessments. Notably, this assessment can provide a scientific reference for promoting the redetermination of warning water levels in China's coastal areas and further improve their marine disaster prevention and protection capabilities.
2.1 Data
This study entailed the processing and use of various types of data: the annual maximum observational water level data from the tide gauge stations, storm-surge disaster data, wave run-up data, data of storm-surge protection facilities, and the socioeconomic data of shore sections. The coastlines of China were divided into 259 shore sections corresponding to coastal county units. More than 120 tide gauge stations were used in this study. For each shore section, we selected one representative tide gauge station.
In order to ensure the scientific reproducibility of the process we used to determine warning tide levels, the process for selecting the representative tide gauge stations of each shore section was as follows: (1) the number of stations is sufficient to cover the coastal areas from north to south; (2) the station is located near the corresponding shore section, making it representative of the characteristics of the shore section in terms of the tide, waves, and storm surges exhibited by the shore section; (3) if a tide gauge station was absent in a shore section, the tide gauge station closest to the shore section was used; (4) it was ensured that each station had observational water level data for at least 5 years.
Based on the abovementioned procedure, four-color warning water levels of the 259 shore sections were determined through the comprehensive analysis of multiple factors, including the typical return period value of high water level at each shore section, degree of wave exposure, actual defense capability of storm-surge protection facilities, and the shore-section importance level.
2.2 Different return periods of the high water level calculation method
Based on the annual maximum observational water level data of the tide gauge stations, the Gumbel model was used as a frequency analysis method to evaluate the return period value of the high water level (HWL) at each station. The Gumbel distribution model is shown in Eq. (1):
where x refers to the annual maximum sample sequence of HWL, μ refers to the position parameter, and β refers to the scale parameter. The least squares method was selected to obtain μ and β.
The different return period value of HWL “X” is calculated by Eq. (2):
The return period “T” is calculated by Eq. (3):
2.3 Calculation method of blue, yellow, orange, and red warning water levels
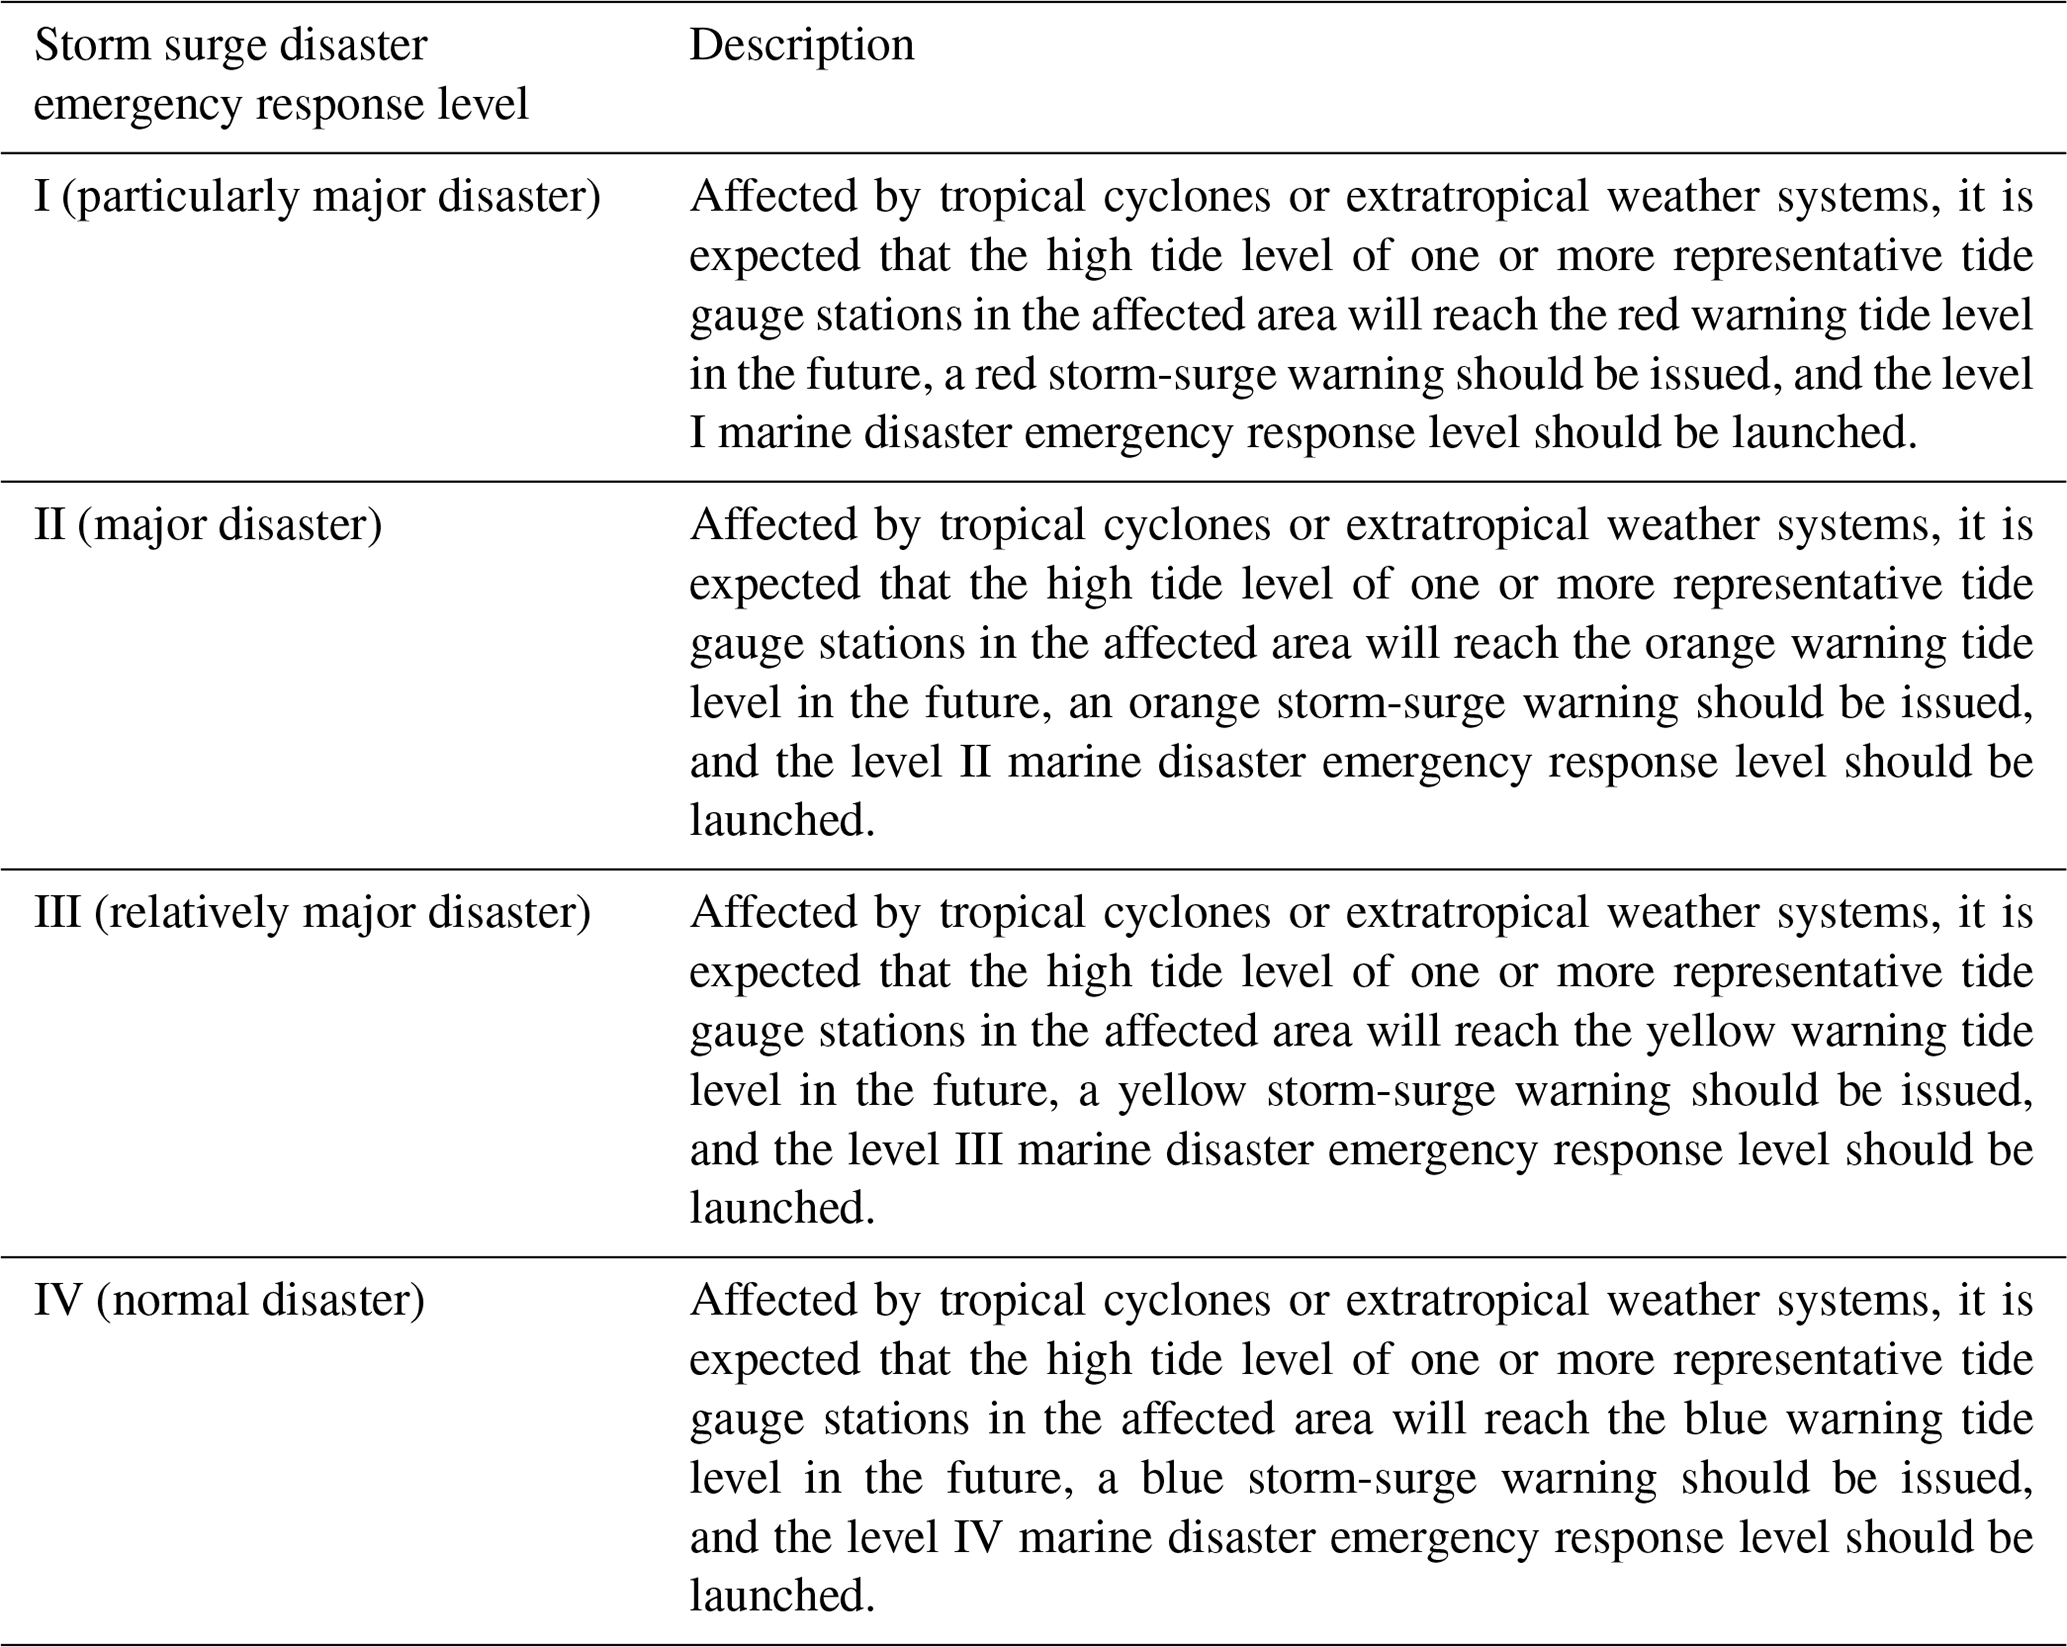
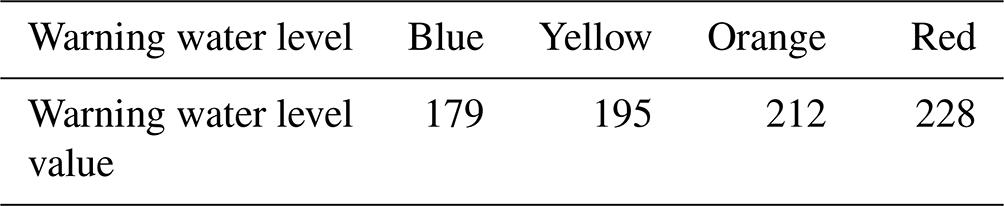
The warning water level is categorized into four types: blue, yellow, orange, and red, which are described in Table 1. The four warning water levels corresponded to the four levels of storm-surge disaster emergency response: I, II, III, and IV, which are described in Table 2. Storm-surge disaster alerts are divided into four levels: red, orange, yellow, and blue, corresponding to the highest to lowest warning water levels, respectively.
Table 1Description of the blue, yellow, orange, and red warning water levels.
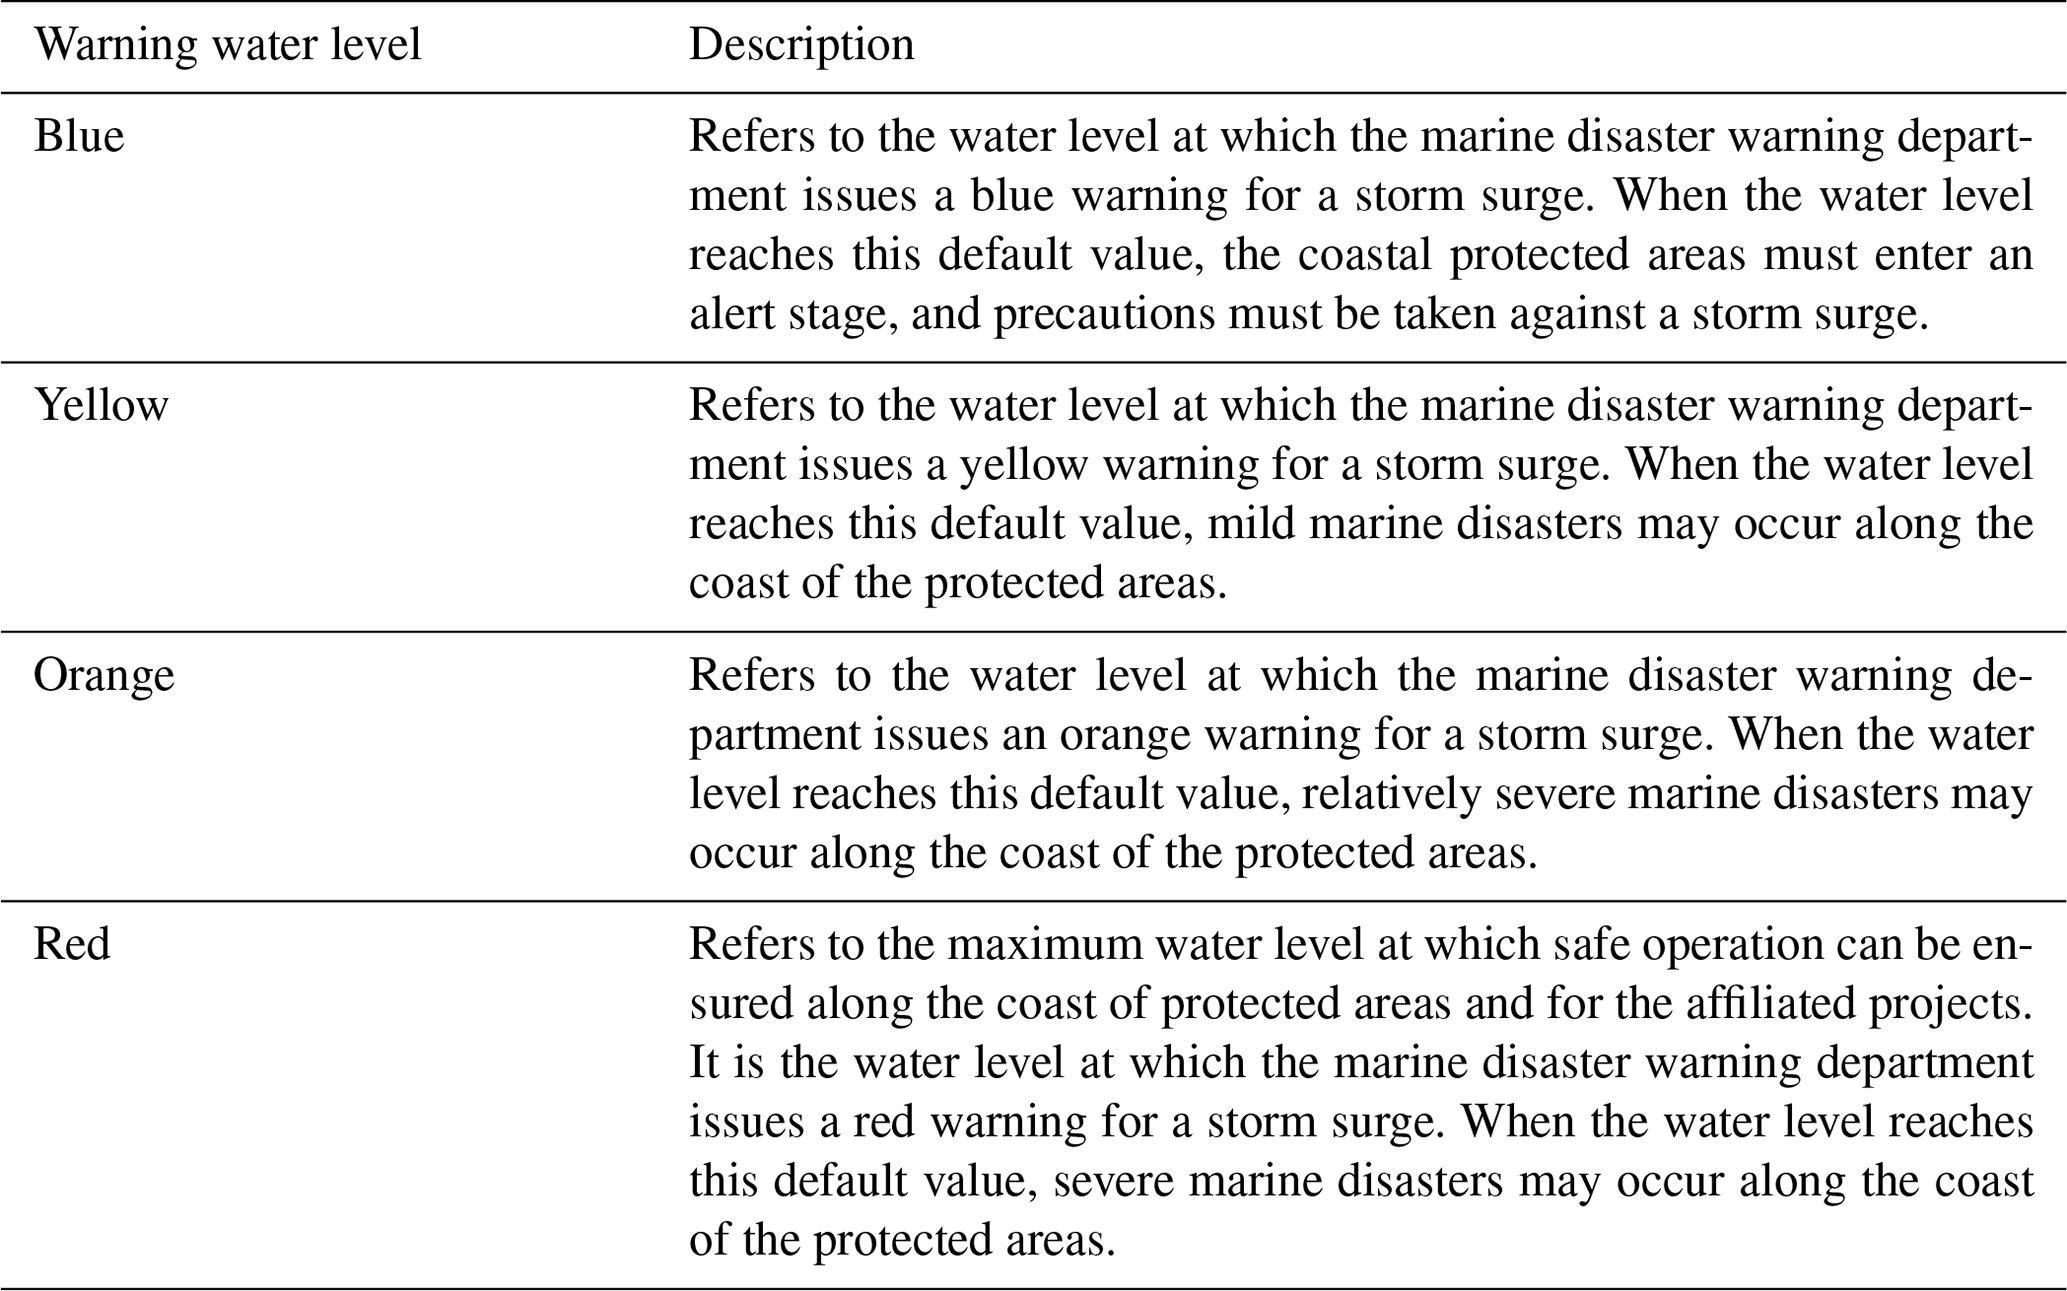
Table 2Description of the storm-surge disaster emergency response level.
The blue warning water level was determined based on HWL at the return period of 2 to 5 years of the shore section and the blue warning water level correction value. The calculation method for the blue warning water level (Hb) is shown in Eq. (4):
where Hs is the HWL at the return period of 2 to 5 years, and Δhb is the blue warning water level correction value. Hs was determined using the actual defense capability of the shore section. Its respective water level return period was the return period corresponding to the elevation of the top of the dike having the lowest defense capability in the shore section. The method to obtain the value is shown in Table 3. Δhb was determined via comprehensive analysis of natural factors including wind, waves, and tides of previous storm surges, along with the actual defense capability and economic conditions of the shore section. The calculation method is shown in Eq. (5):
where h1 is the adjusted value of wave exposure of the surge protection facilities determined by the wave run-up (R) at the return period of 2 years in front of the dike in the shore section. The method to obtain the value of h1 is shown in Table 4 and this value is negative. h2 is the adjusted value of the surge protection facility construction standard, which is determined based on the difference “Δ” between the elevation of the top of the dike and Hs. This value is low where Δ is low. The method used to obtain the value of h2 is shown in Table 5. h3 is the adjusted value of the shore-section importance level, which is determined by the socioeconomic factors of the shore section. This value is low where the shore-section importance level is high. The methods used to obtain the value of h3 and classify the shore-section importance level are both shown in Table 6.

Table 4h1 value (unit: cm).
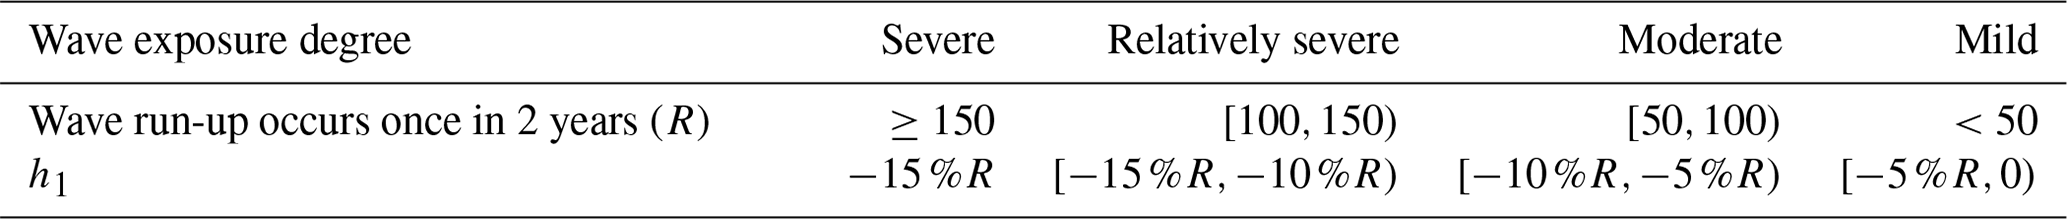
Table note: (1) The wave exposure degree of the storm-surge protection facilities depends on the degree of wave reception of the embankment, the water depth at the bottom of the embankment, and the wave height at the bottom of the embankment. (2) R is the value of the wave run-up occurring once in 2 years. There is a certain correspondence between the wave exposure degree and R. (3) The value of h1 can be taken as 0 %–15 % of the R.
Table 5h2 value (unit: cm).

Table note: the defense capability of storm-surge protection facilities (breakwater) is closely related to the dike construction standards. Δ is the value of the difference between the elevation of the top of the dike and Hs. The value of h2 can be taken as (−20)–20.
Table 6h3 value (unit: cm).

Table note: the shore-section level is categorized into four grades: particularly important, important, relatively important, and normal. Each grade is mainly judged from six criteria; as long as one of the criteria is met, the shore-section importance level can be considered to be this grade. The six criteria are population density, port throughput, construction investment, economic output, cargo unloading capacity, and agricultural reclamation area. The value of h3 can be taken as (−20)–20.
The red warning water level was determined based on the minimum value of HWL at the return period corresponding to the actual defense capability of all dikes in the shore section and the red warning water level correction value. The equation used to determine the red warning water level (Hr) is shown below:
where Hd is the minimum value of HWL at the return period corresponding to the actual defense capability of all dikes in the shore section. Δhr is the red warning water level correction value. The calculation method for Δhr is shown in Eq. (5); the values of h1 and h3 were calculated by the same method used to determine Δhb. When calculating h2, Δ is the difference between the elevation of the top of the dike and Hd.
The yellow and orange warning water levels were determined based on interpolation of the blue and red warning water levels, respectively. The calculation methods for the yellow (Hy) and orange (Ho) warning water levels are shown in Eqs. (7) and (8), respectively:
3.1 Determination result of warning water level at a representative shore section
For warning water level determination, we selected the shore section of Zhifu District, Yantai City, Shandong Province, China (Fig. 1); the representative tide gauge station for this shore section was the Zhifudao tide gauge station. We considered the annual maximum HWL for 31 consecutive years at the Zhifu Island tide gauge station and established a frequency distribution curve of the annual HWL using the Gumbel distribution (Fig. 2). The HWLs at different return periods obtained using this method are presented in Table 7.
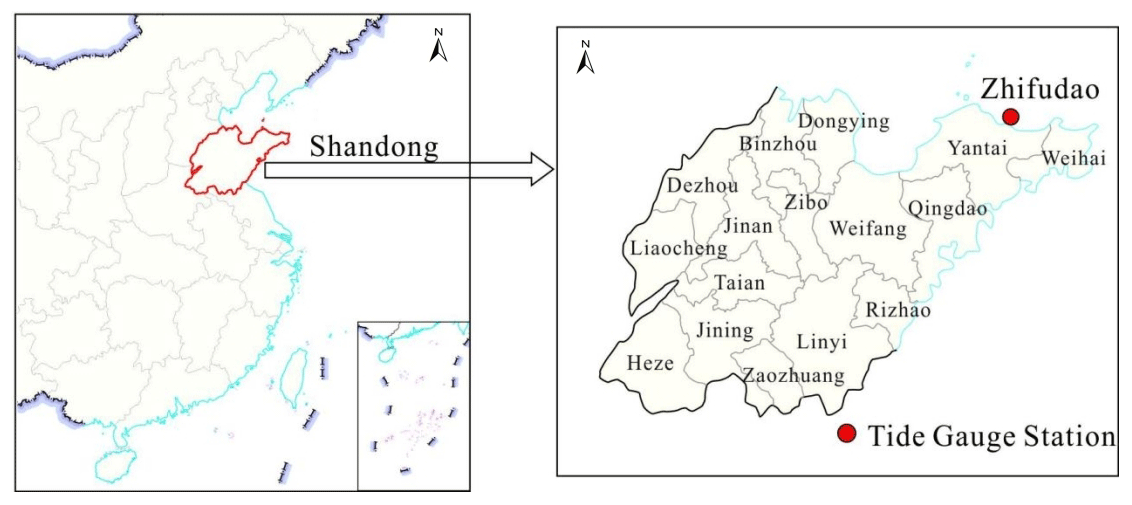
Figure 1The location of Zhifudao tide gauge station in Yantai City, Shandong Province, China.
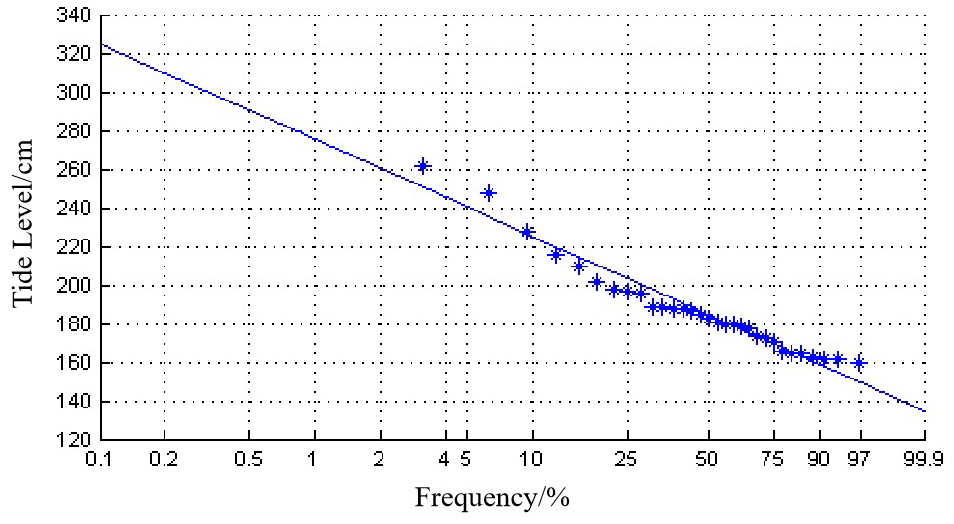
Figure 2Frequency distribution of the annual maximum value of the high water level at Zhifudao tide gauge station.
Table 7The high water levels (HWLs) corresponding to return periods at Zhifudao tide gauge station (unit: cm).
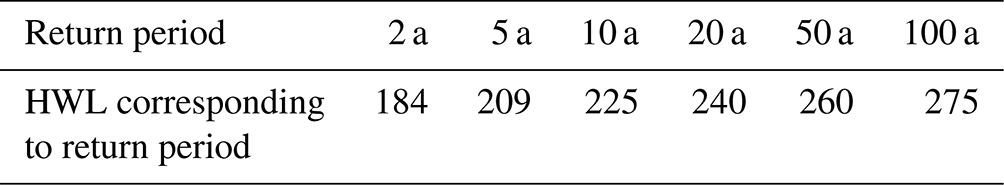
The actual defense capability of the dike in this shore section corresponded to the return periods of 20 to 50 years. Hs indicated the corresponding HWL at the return period of 2 years, and Hs was 184 cm. The wave run-up that occurs once in 2 years at the storm-surge protection facility in this shore section was 1.0 m. The degree of withstanding a wave was moderate, and cm. The types of coastal storm-surge protection facilities in this shore section included cement dikes, and the Δ for Hb was slightly greater than 3.0 m; therefore, h2 for Hb was 16 cm. The shore section was considered to be particularly important; thus, the adjusted value of the shore-section importance level h3 was valued as −11 cm. The blue warning water level correction value of the shore section was + 16 − 11 cm. The blue warning water level value was calculated to be cm.
Hd indicated the corresponding HWL at the return period of 20 years and was 240 cm. For this shore section, cm and cm. The Δ for Hd was approximately 2.5 m; therefore, h2 for Hd was 9 cm. The red warning water level correction value for this shore section was + 9 − 11 cm. The red warning water level was calculated to be cm.
The yellow warning water level was calculated to be cm. The orange warning water level was calculated to be cm.
The warning water level of the shore section in Zhifu District is presented in Table 8.
Table 8Warning water level value of the shore section in Zhifu District, Yantai City, Shandong Province, China (unit: cm).
3.2 Spatial distribution of warning water level along the coast of China
Using the abovementioned method, the warning water levels of 259 shore sections along the coast of China were obtained. The spatial distribution maps of warning water level, shore-section importance level, Hs, Hd, Δhb, and Δhr in the coastal areas of China were drafted (Figs. 3–6).

Figure 3Spatial distribution map of the four-color warning water levels: (a) blue, (b) yellow, (c) orange, and (d) red.
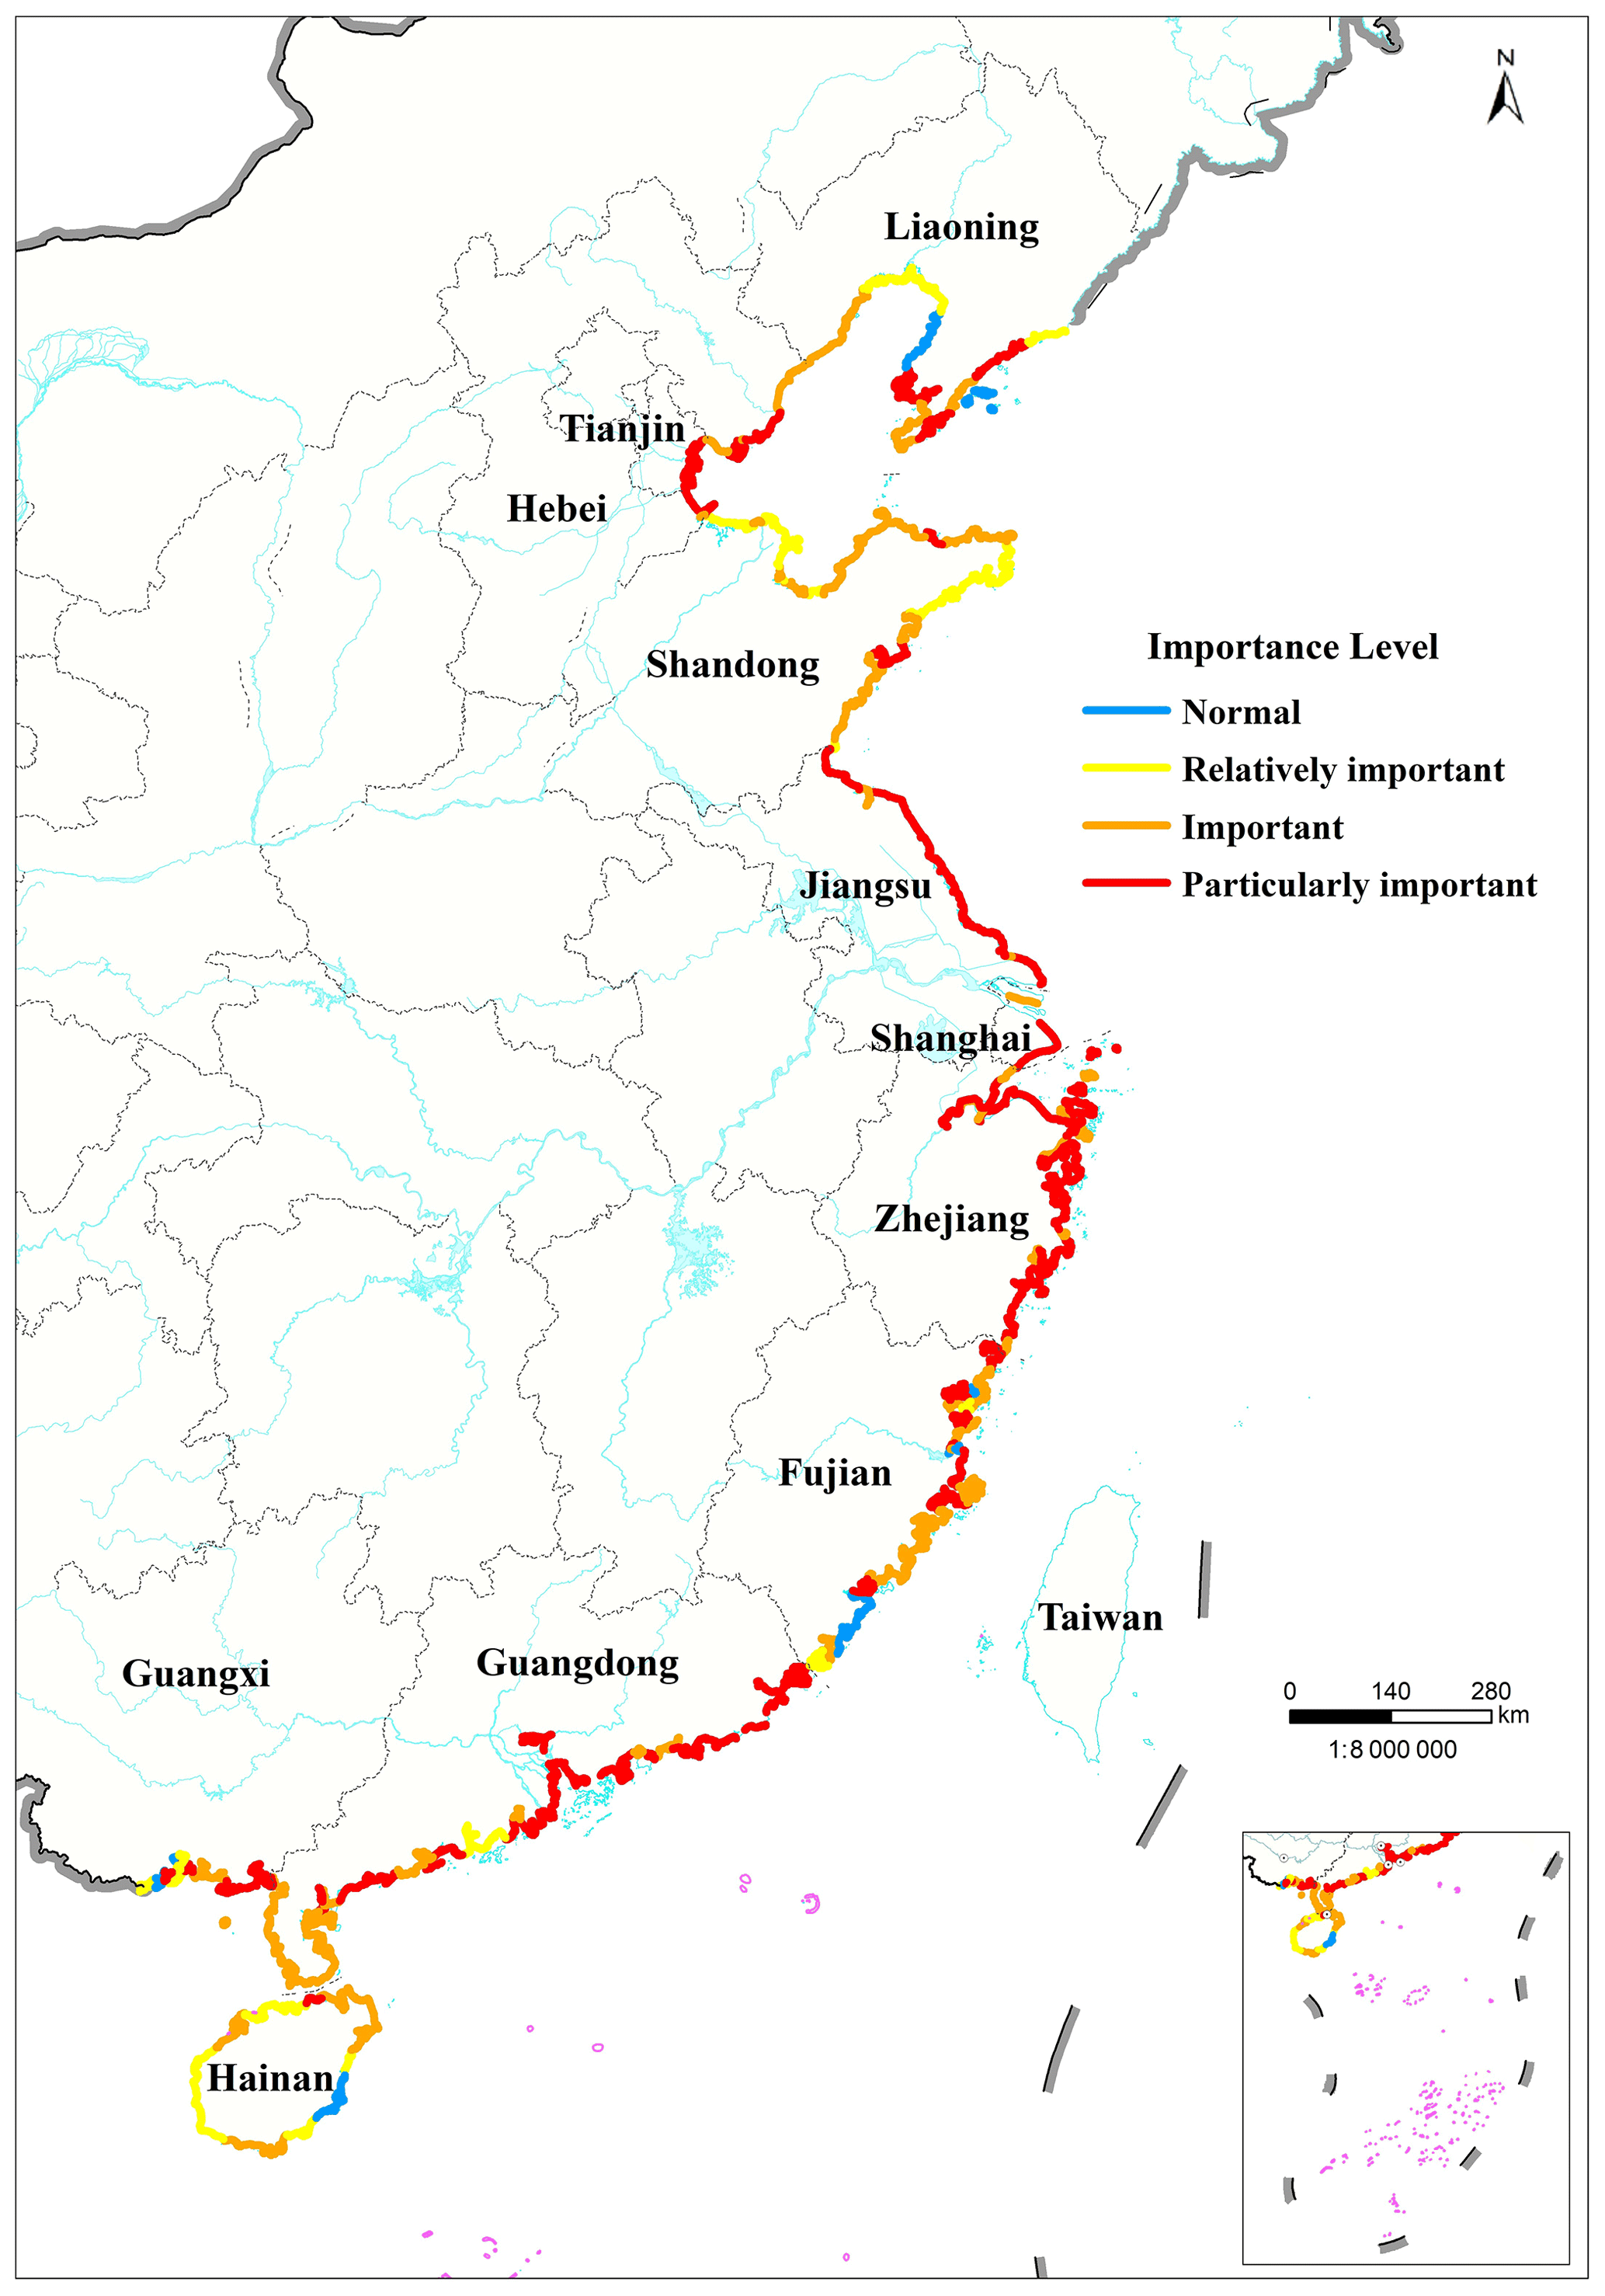
Figure 4Spatial distribution map of the shore-section importance level.
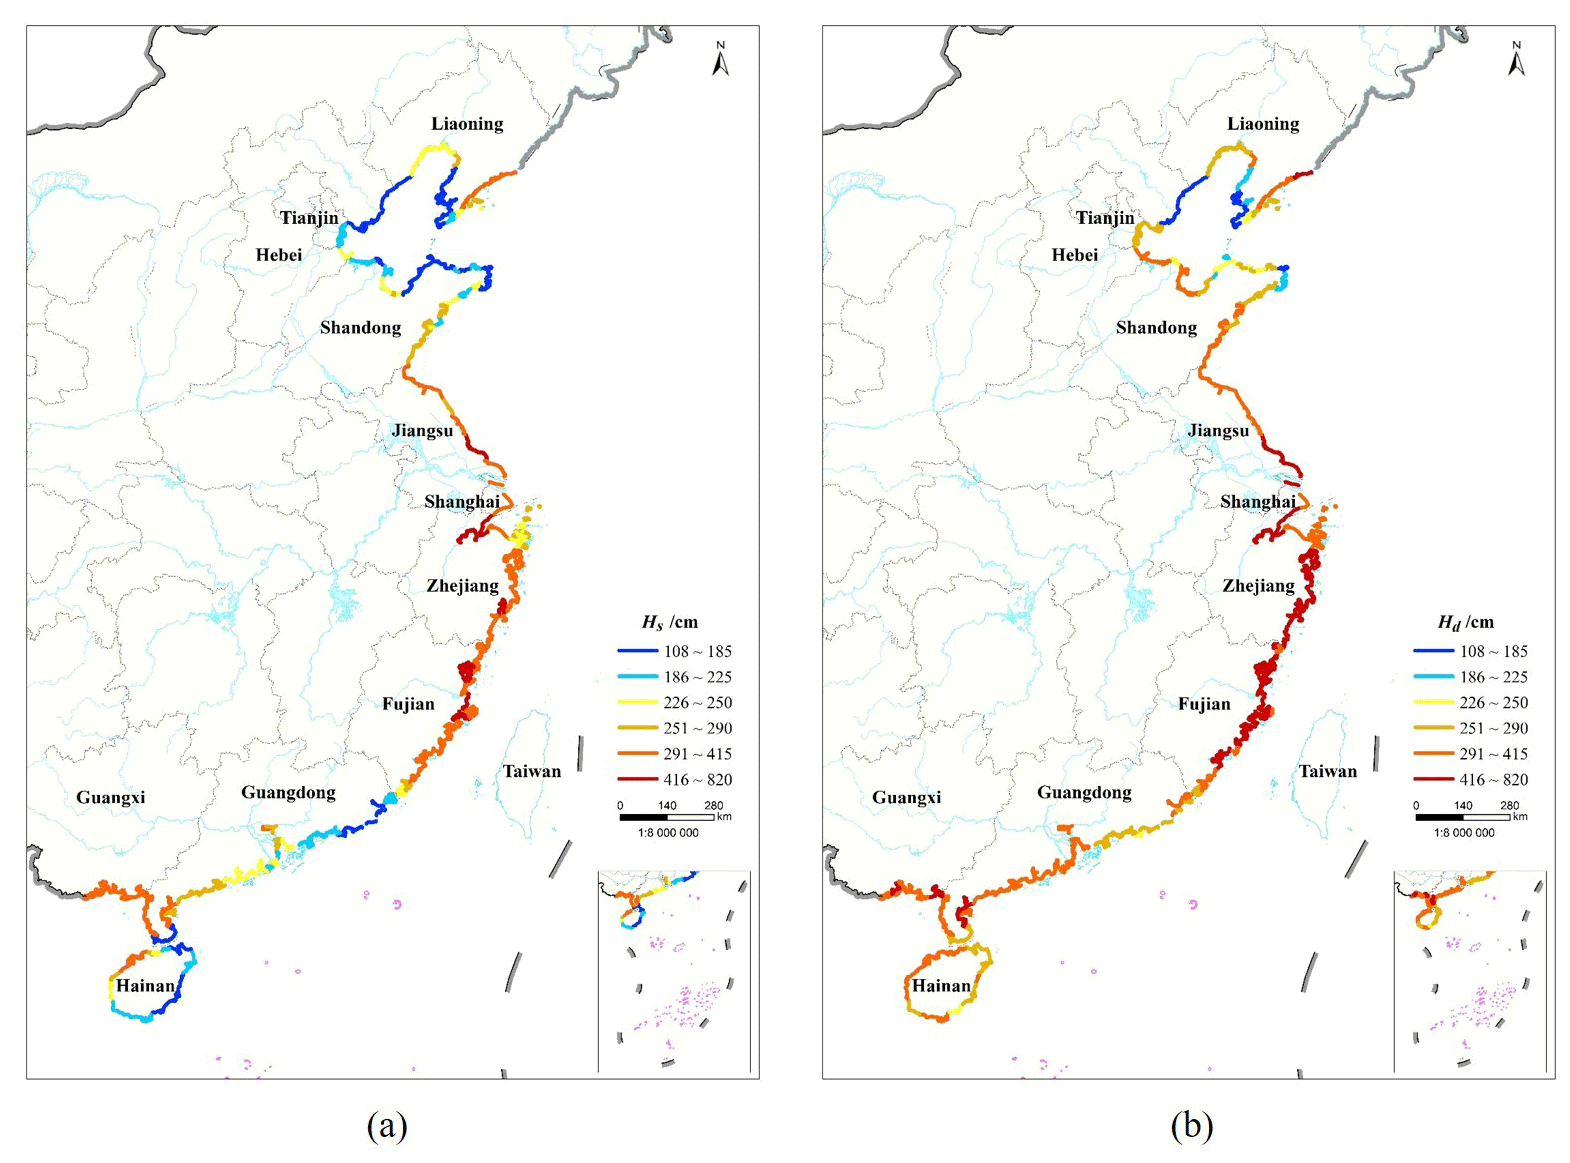
Figure 5Spatial distribution map of Hs and Hd: (a) Hs; (b) Hd.
The warning water level in China's coastal areas was generally low in the northern and southern shore sections and high in the central shore sections. The maximum warning water levels appeared in the shore sections in Hangzhou, Zhejiang Province, in the central coastal area of China. The blue, yellow, orange, and red warning water levels were calculated as 700, 740, 780, and 820 cm, respectively. The spatial distribution of the shore-section importance level was consistent with that of the warning water level. Among the 259 shore sections, the particularly important shore section accounted for the largest proportion (49.1 %), while the other important shore sections grades accounted for 32.4 %, 13.1 %, and 5.4 %, respectively. The shore-section importance levels of Jiangsu, Zhejiang, Fujian, and Guangdong provinces were higher than the other shore sections, and more than 90 % of the particularly important shore sections were distributed in the coastal areas of the above provinces. This is because the coastal zones of these provinces with a high population density were the main areas of economic development on a country-wide scale, with this importance also being reflected in the high shore-section importance level. The spatial distribution characteristics of Hs and Hd were consistent with those of blue and red warning water levels, respectively; this can be mainly attributed to the HWL at the typical return period being the decisive factor in warning water level determination. The warning water level was high where HWL, at the typical return period, was high. The spatial distribution characteristics of Δhb and Δhr were similar but opposite to those of Hs and Hd. Figure 6 shows that Δhb and Δhr were generally low in the central shore sections and high in the northern and southern shore sections. In general, the warning water level correction value Δhb and Δhr was low where shore defensive capability was high.
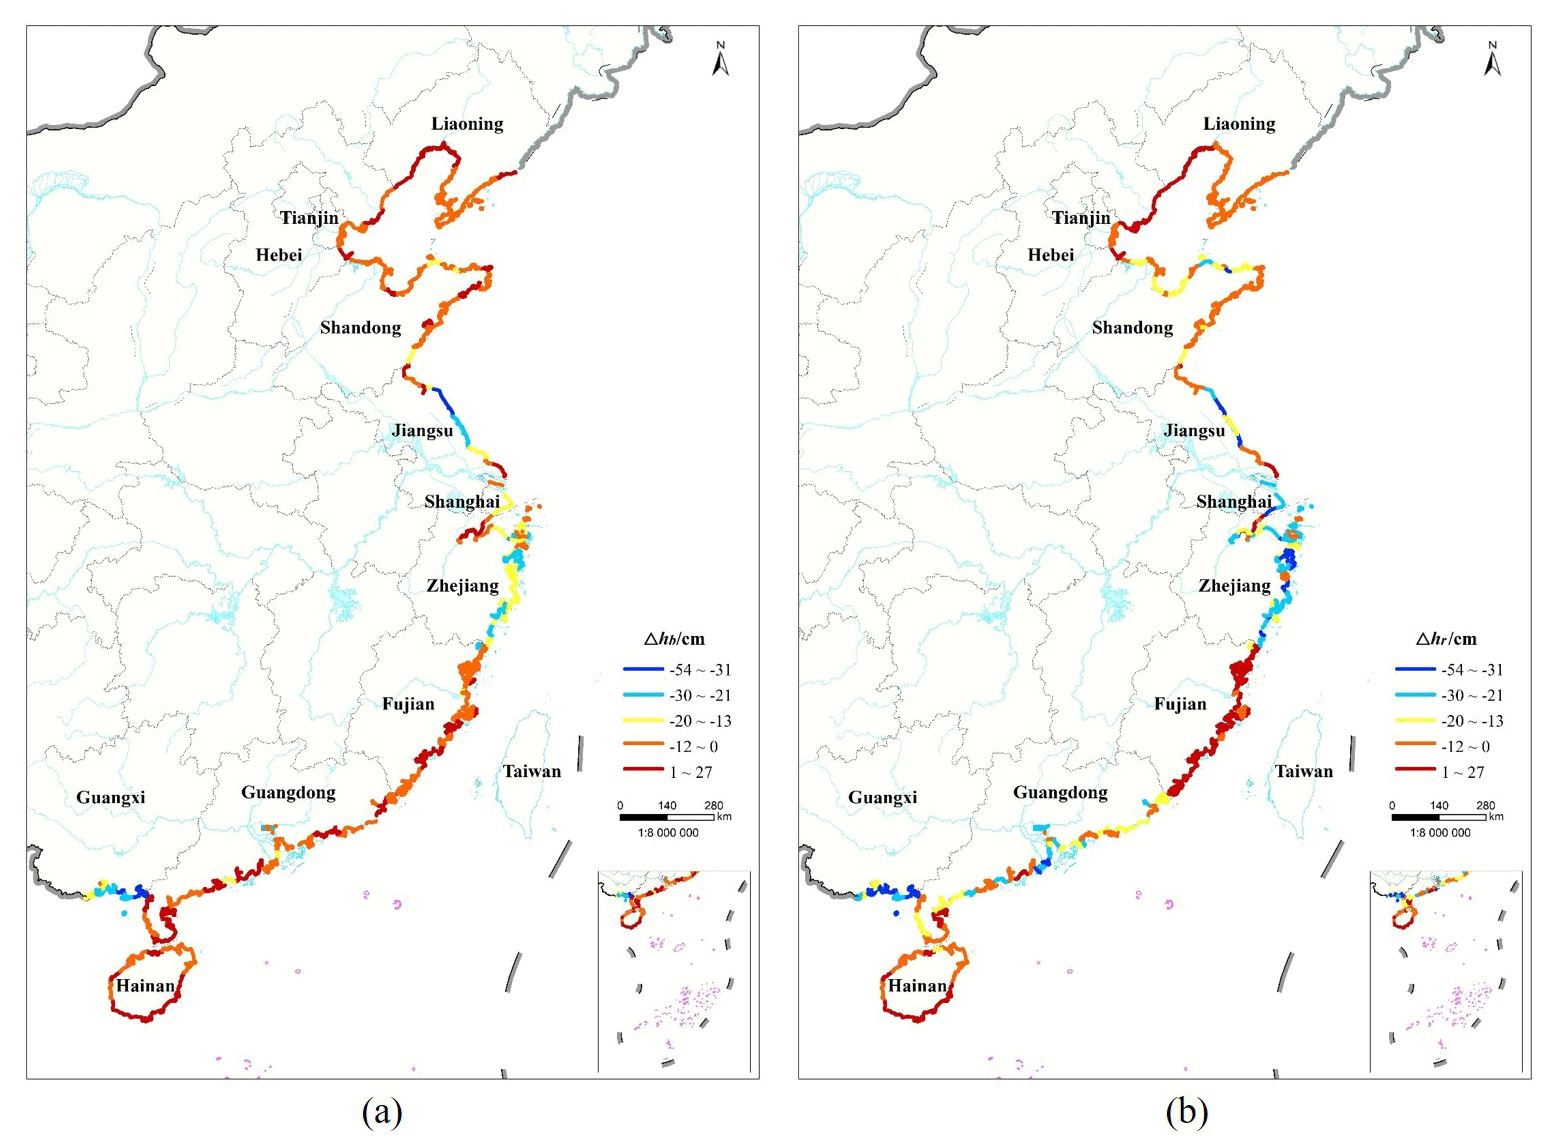
Figure 6Spatial distribution map of the warning water level correction value: (a) Δhb; (b) Δhr.
In the northern coastal areas, including Liaoning, Hebei, Tianjin, and Shandong provinces, the warning water level was generally low. These areas are mainly affected by storm surges typical of the temperate zone, which are of relatively low frequency and intensity. Based on previous observational data, the calculated water level at the typical return period of the northern coastal areas was lower, indicating the lower Hs, Hd, and warning water level.
The shore sections in the central coastal areas, including Shanghai, Zhejiang Province, and Fujian Province, had higher warning water levels. These areas are mainly affected by typhoon surges of high frequency and intensity. Moreover, most of the harbors in these provinces are flared or narrow, which can easily induce larger storm surges, and the water level at the typical return period is greater than that of the other shore sections, leading to higher Hs, Hd, and warning water levels in these areas. Notably, the dike defense capability in these areas is higher, especially for the shore section of Hangzhou Bay in Zhejiang Province, where the large tidal range leads to an extremely high water level at the typical return period. Therefore the warning water level in the shore section of Hangzhou Bay is generally higher than that of other shore sections, indicating the high warning water level distribution in China's coastal areas.
The warning water level in the southern coastal areas, including Guangdong, Guangxi, and Hainan provinces, was generally low. Coastal areas in Guangdong and Guangxi provinces had a lower tidal range, lower water level at the typical return period, and higher shore-section importance level, indicating lower warning water level correction values leading to lower warning water levels. Hainan Island has more natural coastlines of lower shore defensive capability. This island is less affected by typhoons and thus has a lower high water level at the typical return period, resulting in a lower warning water level.
The warning water level is mainly used for storm-surge prewarning, and it is crucial to decision-making and mitigation measure design. This study proposed a newly approved quantitative method for determining the four-color warning water levels, which includes the calculation formula of the HWL at the typical return period, the classification method of the shore section based on its importance and coastal county unit, and the quantitative calculation formula of the correction value of the warning tide level corresponding to wave exposure degree, surge protection facility construction standard, and the shore-section importance level. Compared with the method used for calculating the one single-value warning water level in the mid-1990s, the method of calculating the four-color warning water levels used in this study is more reasonable, mainly in the following aspects: (1) it proposed the description of the warning water level classification corresponding to the four levels of marine disaster emergency response levels, and the determination results of the four-color warning tide levels are more helpful for the storm-surge prewarning – in a way, the newly determined red warning tide level can more truly reflect the actual defense capability of the shore section; (2) the calculation of correction values has been improved by replacing the qualitative calculation method with the quantitative calculation method, especially proposing the method of calculating the wave run-up which is an important decisive element for the correction values; (3) in the process of calculating the four-color warning water levels, the verification of the approved results are strengthened to determine whether the approved warning water level is suitable based on the statistical analysis of historical storm-surge disasters and the corresponding tidal heights. Our results on the spatial distribution of four-color warning water levels have been preliminarily applied to storm-surge disaster prevention and mitigation in coastal areas of China. Several studies focused on the storm-surge prewarning application methods for the newly approved four-color warning water levels, corresponding to a refined shore section (Fu et al., 2017). However, limited by the data availability, it is not considered that the influence of storm-surge disaster loss factors on the calculation of warning water level. The correlation between storm-surge disaster losses and the highest tide water exceeding the warning water level has not been established.
The precision of the warning water level directly affects the accuracy of the storm-surge prewarning results, thereby affecting the objectivity of emergency strategies and decision-making for storm-surge disaster mitigation. With the rapid development of China's coastal society and economy, storm-surge protection facilities, population density, and coastal development conditions have also been changing. Therefore, the warning water level needs to be updated according to the actual conditions of the coastal areas in time when it is not compatible with the storm-surge prevention and mitigation. At the same time, in order to meet the needs of the increasingly refined storm-surge disaster prevention and mitigation plans, the scale of warning water level assessment should be changed from coastal counties to coastal towns and communities.
Several studies highlighted that global sea-level rise would continue accelerating in the 21st century as a consequence of climate change (Church and White, 2011; Hay et al., 2015). In fact, coastal flooding hazard has been increasing on a global scale in recent decades, a trend expected to continue as a result of climate change (Maria et al., 2022). In the past 40 years, sea level in the coastal China seas has increased significantly, at a rate of 3.4 mm a−1, higher than the global average from 1993–2018 (3.25 mm a−1) (Ministry of Natural Resources of China, 2021b; IPCC, 2021). In the Intergovernmental Panel on Climate Change (IPCC) Sixth Assessment Report, the latest monitoring and simulation results indicate that the current rate of global mean sea-level rise from 2006 to 2018 is accelerating (3.7 mm a−1) and will continue to rise in the future, showing an irreversible trend (Zhang et al., 2021; IPCC, 2021). Regional relative sea-level rise is an important driving factor affecting extreme still water levels. The continuous rising sea level has led to an increase in extreme water levels in coastal areas of China (Qi et al., 2019), which can have an impact on the determination of warning water levels. Additionally, changes in storminess may have an important role in modifying the frequency and magnitude of water level extremes (Lowe et al., 2010; Woodworth et al., 2011). Future work about redetermining the warning water level should take these abovementioned issues into consideration.
This study proposed an effective method for determining the four-color warning water levels and introduced the application of this method by determining the warning water level at the shore section of Zhifu District (Yantai City, Shandong Province, China) as an example. Observational water level data from representative tide gauge stations along the 18 000 km coastline were collected and used in this study. Using the method and observational data, we calculated the warning water levels of 259 shore sections along the coast of China and analyzed the assessment results of the spatial distribution characteristics of the blue, yellow, orange, and red warning water levels.
The results showed that the warning water levels were lower in the shore sections of the northern and southern coastal areas in China and higher in central coastal areas. In the northern coastal areas, which are mainly affected by the extratropical storm surges with low intensity, the defense capability of the shore sections was generally low, resulting in the lower warning water levels than the other coastal areas. The maximum values of the blue, yellow, orange, and red warning water levels all appeared in Hangzhou Bay (700, 740, 780, and 820 cm, respectively) of central coastal areas in China. These areas are mainly affected by the typhoon surges with high frequency and intensity, where the defense capability was also high. Understanding the spatial distribution of warning water levels in China's coastal areas not only provides important references for national and local governments to aid in the decision-making process for storm-surge disaster prevention and mitigation but also offers a scientific basis for coastal spatial planning, rational layout of coastal industries, and construction of major projects and industrial parks.
All data used during the study are available from the corresponding author by request.
XS organized the research project and prepared the manuscript with contributions from all co-authors. Specifically, SL wrote the manuscript and participated in the calculation of warning water levels, QiaL devised a method for calculating warning water levels, JT organized the observational data from various tide gauge stations, YS analyzed the distribution of warning water levels along the coast of China, QinL participated in the determination of warning water levels in the shore section of Zhifu District, and HG participated in designing and drawing the diagrams.
The contact author has declared that none of the authors has any competing interests.
Publisher's note: Copernicus Publications remains neutral with regard to jurisdictional claims in published maps and institutional affiliations.
This article is part of the special issue “Advances in flood forecasting and early warning”. It is not associated with a conference.
This study has been funded by the National Natural Science Foundation of China (grant no. 41701596) and the high-level scientific and technological innovation talent project of the Ministry of Natural Resources.
This paper was edited by Heidi Kreibich and reviewed by three anonymous referees.
Caruso, M. F. and Marani, M.: Extreme-coastal-water-level estimation and projection: a comparison of statistical methods, Nat. Hazards Earth Syst. Sci., 22, 1109–1128, https://doi.org/10.5194/nhess-22-1109-2022, 2022.
Church, J. A. and White, N. J.: Sea-Level Rise from the Late 19th to the Early 21st Century, Surv. Geophys., 32, 585–602, https://doi.org/10.1007/s10712-011-9119-1, 2011.
Fu, X., Che, Z. M., Ding, J., Li, M. J., and Li, T.: An application approach of new warning water level in storm surge forecasting and warning, Mar. Forecasts, 34, 1–9, 2017 (in Chinese).
Haixia, Z., Meng, C., and Weihua, F.: Joint probability analysis of storm surge and wave caused by tropical cyclone for the estimation of protection standard: a case study on the eastern coast of the Leizhou Peninsula and Hainan Island of China, EGUsphere [preprint], https://doi.org/10.5194/egusphere-2022-847, 2022.
Hay, C., Morrow, E., Kopp, R., and Mitrovica, J. X.: Probabilistic reanalysis of twentieth-century sea-level rise, Nature, 517, 481–484, https://doi.org/10.1038/nature14093, 2015.
Herman, G., Hans, D. V., and Marc, P.: The Dutch Continental Shelf Model, American Geophysical Union (AGU), the Netherlands, https://www.researchgate.net/publication/255620543_The_Dutch_Continental_Shelf_Model (last access: 25 November 2020), 2013.
Huang, P. J. and Chen, X. Y.: Analyses and studies on warning levels of storm surge of Shandong Coasts, J. Oceanogr. Huanghai Bohai Seas, 13, 11–18, 1995 (in Chinese).
IPCC: Climate change 2021: The physical science basis. Contribution of working group I to the Sixth Assessment Report of the IPCC, Cambridge University Press, Cambridge, United Kingdom and New York, NY, USA, https://www.ipcc.ch/report/ar6/wg1/about/how-to-cite-this-report/ (last access: 9 January 2022), 2021.
Konishi, T.: An experimental storm surge prediction for the western part of the Inland Sea with application to Typhoon 9119, Pap. Meteorol. Geophys., 46, 9–17, https://doi.org/10.2467/mripapers.46.9, 1995.
Lenstra, K. J. H., Pluis, S. R. P. M., Ridderinkhof, W., Ruessink, G., and Maarten, V. D. V.: Cyclic channel-shoal dynamics at the Ameland inlet: The impact on waves, tides, and sediment transport, Ocean Dynam., 69, 409–425, https://doi.org/10.1007/s10236-019-01249-3, 2019.
Lin, N., Emanuel, K. A., Smith, J. A., and Vanmarcke, E.: Risk assessment of hurricane storm surge for New York City, J. Geophys. Res., 115, D18121, https://doi.org/10.1029/2009JD013630, 2010.
Lowe, J. A., Woodworth, P. L., Knutson, T., McDonald, R. E., McInnes, K., Woth, K., Von Storch, H., Wolf, J., Swail, V., Bernier, N., Gulev, S., Horsburgh, K., Unnikrishnan, A. S., Hunter, J., and Weisse, R.: Past and future changes in extreme sea levels and waves, in: Understanding Sea-Level Rise and Variability, Chap. 11, edited by: Church, J. A., Woodworth, P. L., Aarup, T., and Wilson, W. S., Wiley-Blackwell, 326–375, https://doi.org/10.1002/9781444323276, 2010.
Mercado, A.: On the use of NOAA's storm surge model, SLOSH, in managing coastal hazards – the experience in Puerto Rico, Nat. Hazards, 10, 235–246, https://doi.org/10.1007/BF00596144, 1994.
Ministry of Natural Resources of China: 2021 Chinese Marine Disaster Bulletin, Ministry of Natural Resources of China, Beijing, China, 2021a (in Chinese).
Ministry of Natural Resources of China: 2021 China Sea Level Bulletin, Ministry of Natural Resources of China, Beijing, China, 2021b (in Chinese).
National Marine Hazard Mitigation Service of China: Abridged edition of warning water level value in the coastal areas of China, China Ocean Press, Beijing, China, ISBN 978-7-5210-0251-5, 2018a (in Chinese).
National Oceanic and Atmospheric Administration of USA: National Storm Surge Hazard Maps – Version 2, Miami, FL, USA, https://www.nhc.noaa.gov/nationalsurge/#intro (last access: 30 November 2018), 2018b.
Qi, Q. H., Cai, R. S., and Yan, X. H.: Discussion on climate change and marine disaster risk governance in the coastal China seas, Marine Science Bulletin, 38, 361–367, 2019.
Shi, X. W., Liu, S., Yang, S. N., Liu, Q., Tan, J., and Guo, Z. X.: Spatial-temporal distribution of storm surge damage in the coastal areas of China, Nat. Hazards, 79, 237–247, https://doi.org/10.1007/s11069-015-1838-z, 2015.
Shi, X. W., Qiu, J. F., Chen, B. R., Zhang, X. J., Guo, H. S., and Wang, J.: Storm surge risk assessment method for a coastal county in China: case study of Jinshan District, Shanghai, Stoch. Env. Res. Risk A., 34, 627–640, https://doi.org/10.1007/s00477-020-01791-3, 2020a.
Shi, X. W., Yu, P., Guo, Z., Sun, Z., Chen, F., Wu, X., Cheng, W., and Zeng, J.: Simulation of storm surge inundation under different typhoon intensity scenarios: case study of Pingyang County, China, Nat. Hazards Earth Syst. Sci., 20, 2777–2790, https://doi.org/10.5194/nhess-20-2777-2020, 2020b.
State Oceanic Administration of China: Specification for Warning Water Level Determination: GB/T 17839–2011, National Standards Press of China, Beijing, China, ISBN 155066 ⋅ 1-4423, 2012 (in Chinese).
State Oceanic Administration of China: Storm surge, Ocean Wave, Tsunami and Sea ice Disaster Emergency Plan, State Oceanic Administration of China, Bejing, http://www.gc.mnr.gov.cn/201806/t20180614_1795760.html (last access: 30 December 2015), 2015 (in Chinese).
Stuart, C.: An introduction to statistical modeling of extreme values, Springer, London, UK, ISBN 9787506291897, 2011.
Wang, S., Mu, L., Yao, Z., Gao, J., Zhao, E., and Wang, L.: Assessing and zoning of typhoon storm surge risk with a geographic information system (GIS) technique: a case study of the coastal area of Huizhou, Nat. Hazards Earth Syst. Sci., 21, 439–462, https://doi.org/10.5194/nhess-21-439-2021, 2021.
Woodworth, P. L., Menéndez, M., and Roland Gehrels, W.: Evidence for Century-Timescale Acceleration in Mean Sea Levels and for Recent Changes in Extreme Sea Levels, Surv. Geophys., 32, 603–618, https://doi.org/10.1007/s10712-011-9112-8, 2011.
Yin, J., Zhao, Q., Yu, D. P., Lin, N., Kubanek, J., Ma, G., Liu, M., and Pepe, A.: Long-term flood-hazard modeling for coastal areas using InSAR measurements and a hydrodynamic model: the case study of Lingang New City, Shanghai, J. Hydrol., 571, 593–604, https://doi.org/10.1016/j.jhydrol.2019.02.015, 2019.
Yu, F. J., Fu, C. F., Guo, H. L., and Liu, Q. X.: Modern Technologies and Application in Storm Surge Forecasting, Science Press, Beijing, China, ISBN 9787030635990, 2020 (in Chinese).
Zhang, T., Yu, Y. Q., and Xiao, C. D.: Interpretation of IPCC AR6 report: monitoring and projections of global and regional sea level change, Climate Change Research, 17, 12–18, 2021 (in Chinese).