the Creative Commons Attribution 4.0 License.
the Creative Commons Attribution 4.0 License.
 | 17 Mar 2023
Variations of extreme precipitation events with sub-daily data: a case study in the Ganjiang River basin
Guangxu Liu
Aicun Xiang
Zhiwei Wan
Yang Zhou
Jie Wu
Yuandong Wang
Sichen Lin
Climate warming increases the intensity of extreme precipitation. Studying extreme precipitation patterns and changes is vital to reducing risk. This paper investigates thresholds, changes and timescales for extreme precipitation using sub-daily records from meteorological stations in the Ganjiang River basin. We use the gamma distribution and select the L-moment method to estimate the parameters α and β. Results show that (1) continuous precipitation events of 36 h contributed the most precipitation to the total but with lower frequency, which would be key events for flood monitoring; (2) the intensity and the occasional probability of extreme precipitation will increase in spring in the future in stations like Yifeng, Zhangshu and Ningdu, which will in turn increase the risk of storm floods; and (3) spatial distribution of extreme precipitation risk shows that the risk increases as elevation increases in the northern lowland and the Jitai Basin in the midstream region, while the risk in the southern mountainous region decreases as elevation increases. These findings will facilitate emergency preparedness, including risk management and disaster assistance, in the study areas.
- Article
(12693 KB) - Full-text XML
- BibTeX
- EndNote


The hydrological cycle is expected to intensify with global warming, which likely increases the intensity of extreme precipitation events and the risk of flooding (Tabari, 2020). Extreme weather events such as storms have occurred frequently around the world in recent years, which often cause disastrous floods and landslides, resulting in great casualties and economic losses. The city of Zhengzhou in China experienced a rare and continuous heavy precipitation process from 18 to 21 July 2021. Extreme precipitation intensity reached 201.9 mm h−1, and cumulative precipitation reached 449 mm, which caused 292 deaths and 47 people to go missing, the loss of CNY 65.5 billion, and 44 209.73 ha of crops to be affected. Just 8 d before the Zhengzhou storm, heavy rainfall had already caused severe flash flooding in parts of Rhineland-Palatinate and North Rhine-Westphalia, Germany. Within 48 h, the region was hit with 148 L of rain per square meter, resulting in significant damage and loss of life. As of 23 July 2021, the death toll from the flood in western Germany had risen to 180 people, with around 150 people still missing. The cost of reconstruction was estimated to be billions of euros. Changes in extreme precipitation are among the most impact-relevant consequences of climate warming (Pfahl et al., 2017). The Intergovernmental Panel on Climate Change (IPCC) reported that the globally averaged combined land and ocean surface temperature showed a warming trend of 0.85 ∘C [0.65 to 1.06 ∘C] over the period 1880 to 2012, and continued emission of greenhouse gases will cause further warming in the future (Pachauri et al., 2014). The continuous warming breaks the original energy balance of the climate system, causing abnormalities in the atmospheric circulation and water circulation system, which in turn causes an increase in extreme precipitation events and discharges. Theoretical models predict that extreme precipitation intensity could exponentially increase with warming at a rate determined by the Clausius–Clapeyron (C–C) relationship (Trenberth, 1999; Trenberth et al., 2003). An increase in the frequency of extreme precipitation events has increased at the high and mid-latitudes of the land as a likely consequence of climate warming (Rodrigo, 2010). A rate of 6 % to 10 % increase per degree of warming has been observed in annual maximum daily precipitation over land (Asadieh et al., 2015; Westra et al., 2013). Climate models show that extreme precipitation will continue to increase in the 21st century at approximately the same rate because of continued warming (Fischer et al., 2013; O'Gorman and Schneider, 2009; Pendergrass and Hartmann, 2014; Sillmann et al., 2013). The future trend of extreme precipitation in China is consistent with that of the world. Xiao et al. (2016) found that analysis from gauge records for 1971–2013 from 721 weather stations showed that the maximum hourly summer rainfall intensity has increased by about 11.2 % on average in China, which will exacerbate the risks of flash floods in rapidly urbanizing areas. Zeng and Lu (2015) found that summer precipitation in China from 1961 to 2010 experienced the biggest increase in the middle and lower reaches of the Yangtze River, which was caused mainly by the positive contribution of extreme precipitation (Shi et al., 2014). Gao and Xie (2014) analyzed the response of extreme precipitation to warming in winter in China and found that extreme precipitation would increase by 22.6 % for every 1 ∘C increase in winter temperature. This increase is significantly higher than the global average, indicating that extreme precipitation is more sensitive to warming in winter in China. Wu et al. (2015) analyzed the changes of extreme weather events against the background of future warming and pointed out that compared with 1986–2005, the total annual precipitation (PROPTOT), the 5 d maximum precipitation (Rx5day) and heavy precipitation (R95p) would increase in China. The Coupled Model Intercomparison Project 5 (CMIP5) data also show a trend of increasing extreme precipitation events in the future in various regions of China (Zhao et al., 2019). These studies show the importance of studying extreme precipitation changes and trends under climate warming.
Extreme precipitation can be defined in a variety of ways. Pendergrass (2018) thinks that precipitation events can be considered extreme when precipitation exceeds an amount that people often appreciate. The Expert Team on Climate Change Detection Monitoring Indices (ETCCDMI) established several indicators such as CWD10, CWD20, R1d (annual), R10mm and R20mm in undertaking regional analysis for understanding climate extremes and trends (Easterling et al., 2003). Soro et al. (2016) grouped extreme events into two broad categories. One is the yearly extreme events, based on heavy daily rainfall. The other is event-driven extremes characterized by severe floods (Soro et al., 2016). A common definition of extreme precipitation is when an event passes a threshold of exceedance or a certain threshold. There are different criteria to define the threshold, including a fixed absolute value (Brunetti et al., 2004; López-Moreno and Beniston 2009), standard deviation based on statistics and percentile-based thresholds (Fernández-Montes et al., 2014; Merino et al., 2016). Practically, percentile-based thresholds such as the 95th or 99th percentile of the cumulative frequency distribution of daily precipitation with only wet days (or wet hours) has been widely used in previous studies (Marelle et al., 2018; Merino et al., 2018; Pendergrass, 2018; Myhre et al., 2019). Pendergrass (2016) points out that how we define extreme precipitation affects the conclusions we draw. The reason why researchers focus on extreme precipitation is because extreme precipitation is one of the most frequent weather factors resulting in floods and landslides which are hazards responsible for damage to buildings and infrastructures, serious social disruption, and loss of human life worldwide each year (Soro et al., 2016). The choice of the definition for extreme depends on the intended use in terms of reducing disaster loss.
In specific research, researchers used either precipitation observations or simulated data from climate models to study the temporal and spatial variation of the scale and frequency of extreme precipitation. For example, Gao et al. (2017) examined the space–time variations of extreme precipitation over monsoon regions in China and assessed the time-varying influences of climate drivers using Bayesian dynamic linear regression. Results suggest that the central-east and south China are dominated by less frequent but more intense precipitation. Ren et al. (2014) used the daily precipitation data from 1961 to 2011 from the National Meteorological Information Center and the daily precipitation observations from the meteorological stations in China to investigate changes of extreme precipitation events in south China. The selected index includes the maximum 5 d precipitation (RX5day), extreme precipitation (R95), days with precipitation ≥20 mm (R20mm), continuous precipitation days (CWD) and intensity of daily precipitation (SDII), which are all recommended by the World Meteorological Organization. They found that RX5day, R95, R20mm and SDII have an inter-annual tendency rate of 0.17 mm a−1, 1.14 mm a−1, 0.02 d−1 a−1 and 0.01 mm d−1 a−1 (d−1 or a−1 is the abbreviation of per day or per year), respectively. The proportions of grid points with an increasing trend of RX5day, SDII and R95 reach 60.85 %, 75.32 % and 75.74 %, respectively (Ren et al., 2014). Pfahl et al. (2017) decompose the forced response of daily regional-scale extreme precipitation in climate model simulations into thermodynamic and dynamic contributions using a robust physical diagnostic to study the regional pattern of projected changes in extreme precipitation. Pfahl et al. (2017) found that thermodynamics alone would lead to a spatially homogeneous fractional increase in most regions throughout the globe. The dynamic contribution amplifies the increase in the Asian monsoon region but weakens them across the Mediterranean, South Africa and Australia. They think that the dynamic contribution is key to reducing uncertainties in future projections of regional extreme precipitation (Pfahl et al., 2017). Mukherjee et al. (2018) studied the gridded observations and simulations from the CMIP5 and Climate of the 20th Century Plus (C20C+) Detection and Attribution (D & A) project. They found that the frequency and intensity of extreme precipitation events have increased in India during the last few decades, and anthropogenic warming has made a significant contribution to the rise in the frequency. Talchabhadel et al. (2018) analyzed the spatial distribution of monthly and annual precipitation, 1 d extreme precipitation, and their trends with the records from 291 stations across Nepal for the period of 1966–2015. The result shows that extreme precipitation events has increased in western mountainous regions in recent decades. Bao et al. (2017) analyzed daily extreme precipitation events in several Australian cities and found that future daily extremes are increasing at rates faster than those inferred from observed scaling.
These studies use daily precipitation to analyze extreme events. However, events with scales shorter or longer than 1 d also cause floods. Merino et al. (2018) explained with two examples that daily databases would bring uncertainty in analyzing floods. One example is of two extreme precipitation events that had the same amount of precipitation, but one event resulted in a flash flood due to its 2 h duration, while the other one had no hydrologic floods, because it lasted for over 12 consecutive hours. Another example is that a precipitation event below the extreme precipitation threshold caused floods, because it began one day and ended the next, and the total amount was high but not recorded. It is key to analyze precipitation event periods, that is, the timescales of precipitation. Besides, extreme precipitation poses a threat to human society, because they may cause floods, leading to loss of life and property (Tabari and Willems, 2018). Regional differences often indicate whether extreme precipitation can cause flooding. For example, daily precipitation of 50 mm may have a low impact on human society in flat or humid areas. However, it can lead to flash floods and even landslides and debris flows in mountainous or arid areas (Tabari and Willems, 2018). Time distribution patterns and return levels of extreme precipitation should be analyzed in risk research locally (Wu et al., 2018). Furthermore, engineering construction in disaster mitigation and prevention usually follows a standard design flood for a given return period. With climate warming, the intensity of extreme precipitation has increased significantly. Projects constructed in accordance with past flood control standards have the risk of increased losses. According to the annual report of road flooding statistics, the annual direct economic loss of road infrastructure caused by flood damage has reached CNY 10 to 30 billion in China in the past 10 years (Li et al., 2014). Analyzing the evolving patterns of extreme precipitation and developing new design standards for flooding preparedness is of great significance to improving the disaster prevention and mitigation system (Xu et al., 2014; Chen, 2015).
Collectively, this analysis aims to achieve the following objectives: (1) to investigate the thresholds of extreme precipitation using sub-daily records in meteorological stations in the Ganjiang River basin, (2) to identify the changes and timescales of extreme precipitation using probability distribution and the Mann–Kendall (M–K) test, and (3) to explore the risk caused by extreme precipitation with different timescales and return periods in a case study.
2.1 Study area
The study area comprises the Ganjiang Basin which is located with a longitude spanning 113.74–116.63∘ E and latitude spanning 24.57–29.07∘ N in the southeast of China (Fig. 1). The drainage area is about 81 244 km2. The Ganjiang River is the main stream which originates from the south and flows into Poyang Lake in the north. Extreme precipitation in this watershed depends heavily on the windward mountains, the amount of precipitation and the timing of the precipitation. The topography is characterized by mountains mainly distributed in the south and alluvial plains in the north. The Jiulian Mountain is the south-western boundary. The Wuyi Mountain forms the eastern border. The elevation is uplifting gradually from the north to the south-eastern end, which results in a higher precipitation in the mountainous north-western area and a lower rainfall zone in the central basin and lower reach in the north (Hu et al., 2013). In addition to moderating effects due to topographical changes, near-stationary fronts and monsoon and typhoon systems also control precipitation patterns. The average annual precipitation ranges between 1400 and 1600 mm (Li et al., 2017). Due to the long existence (hours to days) of near-stationary fronts over the basin, over 70 % of the annual precipitation occurs during the period from April to June. Monsoon and typhoon rainstorms frequently occur between July and September. This area is characterized by a highly variable hydro-climate and flood-prone area in China. Fluvial floodplain deposition investigations indicate that the Ganjiang Basin has experienced 18 floods during the past 130 years (Liu et al., 2018).
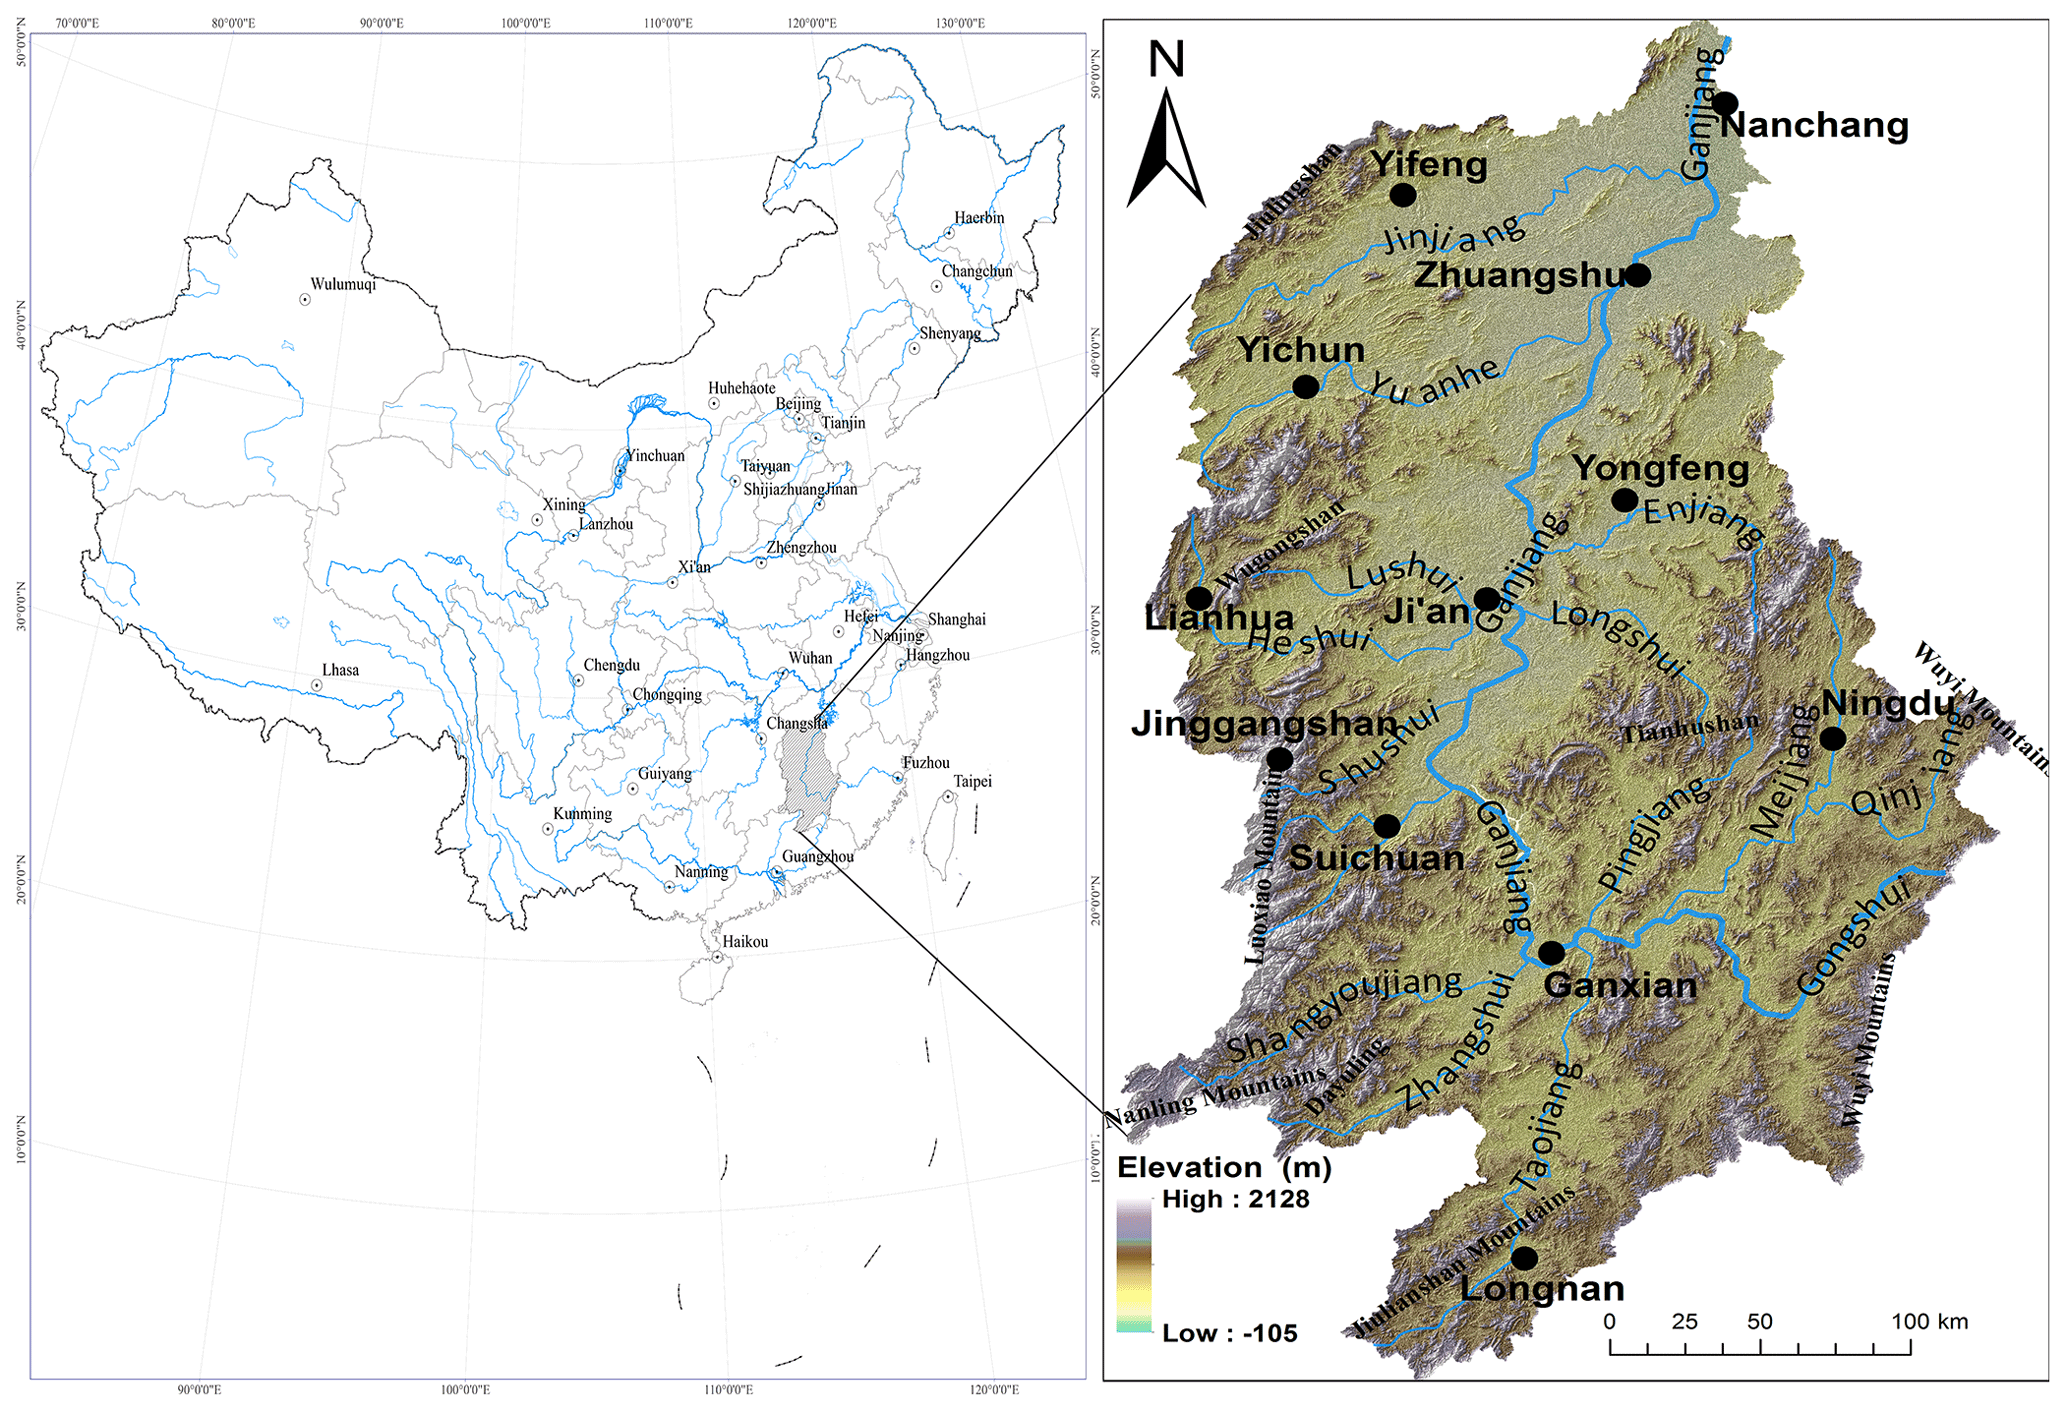
Figure 1Study area and location of meteorological stations.
2.2 Precipitation data
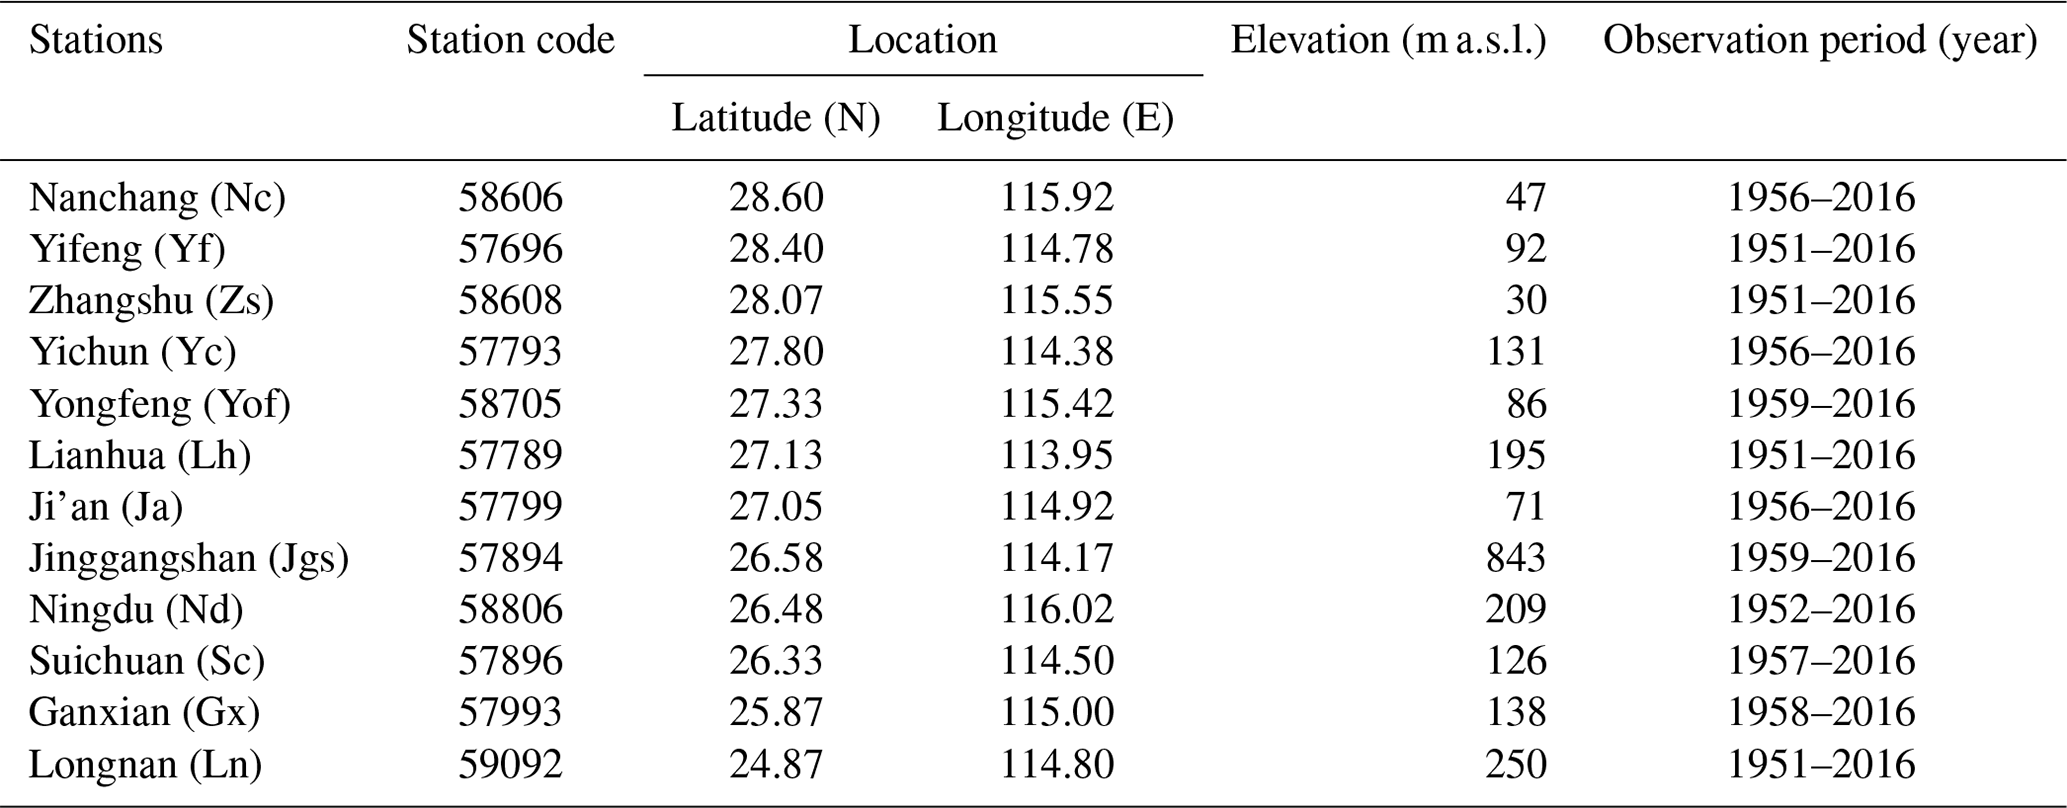
The precipitation data are collected from 12 national basic meteorological stations in Fig. 1 supplied by the National Meteorological Information Center in China. These stations scatter from latitude 24.87 to 28.60∘ N and longitude 113.95 to 116.02∘ E (Table 1). The highest station is Jinggangshan (Jgs) with an elevation of 843 m above sea level (m a.s.l), and the lowest one is Zhangshu (Zs) with an elevation of 30 m a.s.l. Four stations, Yifeng (Yf), Zs, Lianhua (Lh) and Longnan (Ln), began observing in 1951. Ningdu (Nd) and the others all began at the end of the 1950s. All these stations have been well maintained and managed since the 1950s. The original data include precipitation records from 08:00 to 20:00 (UTC+8) during the day, precipitation records from 20:00 to 08:00 (UTC+8) the following day during the night and daily precipitation records from 20:00 to 20:00 the following day. The data precision is 0.1 mm. Twelve-hour (12 h) precipitation was defined as precipitation records from 08:00 to 20:00 during the day or from 20:00 to 08:00 the following day during the night, and the data were selected from the original data between 1 January 1959 and 31 December 2016 with the purpose of keeping the data consistency. The suppliers assessed the data quality with several assay controls and detection limits. The erroneous or likely erroneous data were all manually verified and corrected. Particular attention has been paid to problems such as changing points arising from inhomogeneities of the data series, which were validated and corrected according to the methods supposed by Wang (2008) station by station. The change points were detected by integrating a Box–Cox power transformation procedure into a common trend two-phase regression model-based test (the transPMFred algorithm). The detected change points were adjusted with a quantile matching (QM) algorithm (Wang et al., 2010).
Table 1Characteristics of the selected meteorological stations.
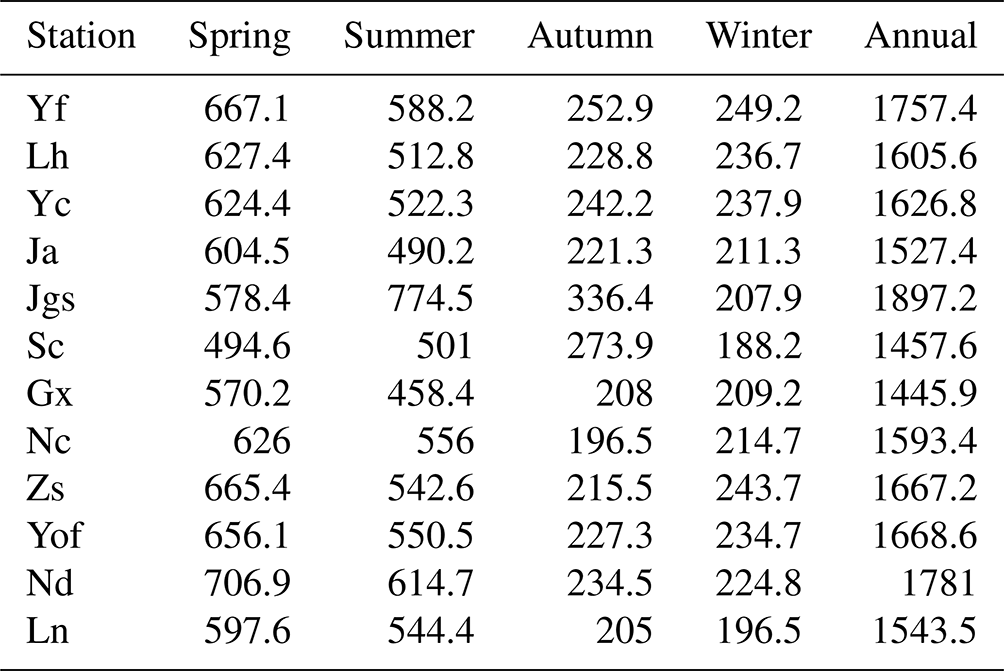
Then a precipitation event is determined by rainfall above the threshold of 0.1 mm in 12 h (12 h) from 08:00 to 20:00 in the day or from 20:00 to 08:00 in the night in this paper. Considering the high seasonal variations of precipitation in the study area, the investigation was performed season by season. Therefore, the data were divided into four seasons, where winter data refer to the records in December, January, and February; spring, March, April, and May; summer, June, July, and August; and autumn, September, October, and November. Seasonal and annual average precipitation was calculated for each station and listed in Table 2, which shows that the highest precipitation in most stations is found in spring, followed by summer, autumn and winter. The stations located in the windward mountains have more annual precipitation, while the stations located in the plain areas have less precipitation. Jgs in the west has the highest annual precipitation.
Table 2Seasonal and annual mean precipitation in stations (mm). The data are based on the selected period 1959–2016.
2.3 Definition of extreme precipitation
The definition of extreme precipitation should be chosen with care and should be articulated clearly (Pendergrass, 2018). Previous studies have discussed the definition of what constitutes an extreme event (Saidi et al., 2015). These definitions are grouped into two categories (Easterling et al., 2000).
Extreme events are defined according to intensity such as yearly or seasonal maximum, CWD10, CWD20, R1 d (annual), R10 mm and R20 mm indices from the Expert Team on Climate Change Detection Monitoring Indices (ETCCDMI) (Soro et al., 2016). Yearly or seasonal maxima are one of the commonly used extreme value sampling. It generates annual maximum series whose sample size is identical with the number of years. Yet this definition does not include all extreme values, because any second highest would be dropped out (Saidi et al., 2015).
Events over a threshold (EOT), referred to as the extreme frequency (Haylock and Nicholls, 2000), is the other definition. EOT is characterized by expected physical hazards, such as floods or hurricanes. Pendergrass (2018) investigated thresholds such as the 99th percentile of the cumulative frequency distribution, the 95th percentile and the 90th percentile and found that the way extreme precipitation is defined would affect the conclusions.
The impact of extreme precipitation on human beings is to cause flood disasters which often occur several times in some years and are missing in other years. Therefore, a threshold of the 99th percentile is selected to define extreme precipitation in this paper, which is calculated based on all rainy events from 1959 to 2016. According to this threshold, 0–4 extreme precipitation events can be found in a year, which is very close to the number of flood disasters that the study area experienced.
2.4 Method to analyze extreme precipitation events
The goal of the return period analysis is to estimate the value of the event magnitude corresponding to a given probability. How to accurately estimate the return period of extreme precipitation needs deterministic information with sufficient skill (El Adlouni and Ouarda, 2010). It could be precisely determined by frequency distribution if there were sufficiently long records of precipitation. In this study, there are 58 years of rainfall records, which forces us to use limited samples to estimate events with a chance of 1 in 100 years or even more, i.e., exceedance probabilities of 1 % or more. The addressed problem is solved in practice by estimating probability distributions, which can estimate parameters of a distribution based on samples. Such distributions involving precipitation research mainly include gamma, generalized extreme value and Pearson type 3 distributions. The gamma distribution is one of the most popular models for describing precipitation (Papalexiou et al., 2013), which could provide the best fit for rainfall distribution (Şen and Eljadid, 1999).
The gamma distribution belongs to the exponential family (Papalexiou et al., 2013). It is used to fit positive data, and it is a good representation of rainfall distribution. Assuming that the precipitation in a certain period is x, the probability density function that satisfies the gamma distribution is
where α is the shape parameter, β is the scale parameter and x is the precipitation records. when x>0, and when x≤0. Γ(α) is the gamma function.
The L-moment method (LM), along with the moment and maximum likelihood methods, was often applied to samples taken from simulated gamma distribution (Kliche et al., 2008). LMs are linear combinations of order statistics (L statistics) analogous to conventional moments and can be used to summarize the shape of a probability distribution (Hosking, 1990). LMs of a probability distribution of random variable X are defined in terms of a linear combination of probability weighted moments (PWM) by Hosking (1990). LMs have some advantages: they are less sensitive to outliers in the data, approximate their asymptotic normal distribution more closely, are nearly unbiased for all combinations of sample sizes and populations, and can characterize a wider range of probability distributions than conventional moments. Similar to Vivekanandan (2015), the LM is used to sample the precipitation for determining parameters α and β in this paper. Sample L moments can be computed as population L moments of the sample. Assume that variable X follows a certain distribution function, and n is the sample value of the observed variable x. The n values are sorted in ascending order, and Xj: n is used to represent the jth value, i.e., precipitation precipitation . The sample L moments of the first 2 orders in a finite sample of n observations are calculated as follows (Wang, 1996):
The L mean and L variation of the sample series are defined as follows:
Then the shape parameter α is estimated with l1 and l2 with the equation below by iteration using recursion (Kliche et al., 2008):
where αL is the LM estimate of α.
Once the shape parameter is determined, the estimator for the scale parameter is calculated from
Python programs are used to estimate the gamma distribution function of the precipitation events with these equations, as well as to estimate extreme precipitation thresholds.
2.5 Method for spatiotemporal changes
The Mann–Kendall (M–K) non-parametric test is a statistical test widely used to detect monotonic trends in climatological data series. Two advantages of the M–K test were summed up by Soro et al. (2016):
-
Distribution-free. It does not need to assume any distribution function of the values.
-
Low sensitivity to abrupt breaks in homogeneous time series. It does not need to censor missing data.
Precipitation is intermittent and highly scale-dependent (Sun and Stein, 2015). Therefore, the M–K test is used to analyze the trends of extreme precipitation in seasons.
If Xi and Xj are the time series precipitation observations in chronological order, then the M–K statistics S and V(S) and standardized test statistics Z are calculated with the equation as follows (Ahmad et al., 2015):
where n is the length of the time series, tp is the number of data points for pth values, q is the number of tied groups in the data set and VAR(S) is the variance of S. When VAR(S)>0, it indicates an upward trend in the precipitation series and when VAR(S)<0, a negative trend. The Z value is to detect whether the trend is significant. If , there exists a statistically significant trend in the series. is the critical value for the p value of 0.05 from the standard normal table.
Spatial distribution of precipitation hazards is analyzed using a GIS method. Extreme precipitation is the main disaster-causing factor of floods in the study area. The extreme precipitation thresholds of different probabilities are used to evaluate the risk. The number of events above the thresholds is calculated at each meteorological station. The inverse distance weighted method (IDW) is then used to interpolate and zone the number after validation with observations, with the purpose to show the spatial characteristics of the extreme precipitation risk.
3.1 Frequency and contributions of precipitation events
Runs of 12 h precipitation in each station were calculated with records of precipitation >0.1 mm. Runs are defined as consecutive precipitation series in this paper. Run 1 refers to a precipitation event recorded in 12 h. Run 2 refers to an event with precipitation recorded in two consecutive 12 h intervals, and so on. If no precipitation is recorded at an interval greater than 12 h, precipitation is defined as discontinuous and divided into two runs. This definition helps keep the calculated events independent. We further calculated their frequency and contribution to the total precipitation in all stations and plotted them in Fig. 2. Figure 2 showed that the frequency of precipitation events decreased with runs increasing. The run 1 continuous precipitation event occurred most frequently, accounting for 39.0 % of the total events, followed by the run 2, with a frequency of 21.7 %. The frequency of events ≤4 runs accounted for as high as 83.5 % of the total events. The frequency of events ≤10 runs reached 98.6 %. Events greater than 10 runs only accounted for 1.4 % of the total. This indicated that the study area was mainly characterized by short-duration precipitation events. Events of 1 to 4 runs occurred most commonly (frequency >10 %). Events greater than 10 runs rarely occurred. The longest consecutive event was run 28, which only occurred once at Jgs station in June 1993.
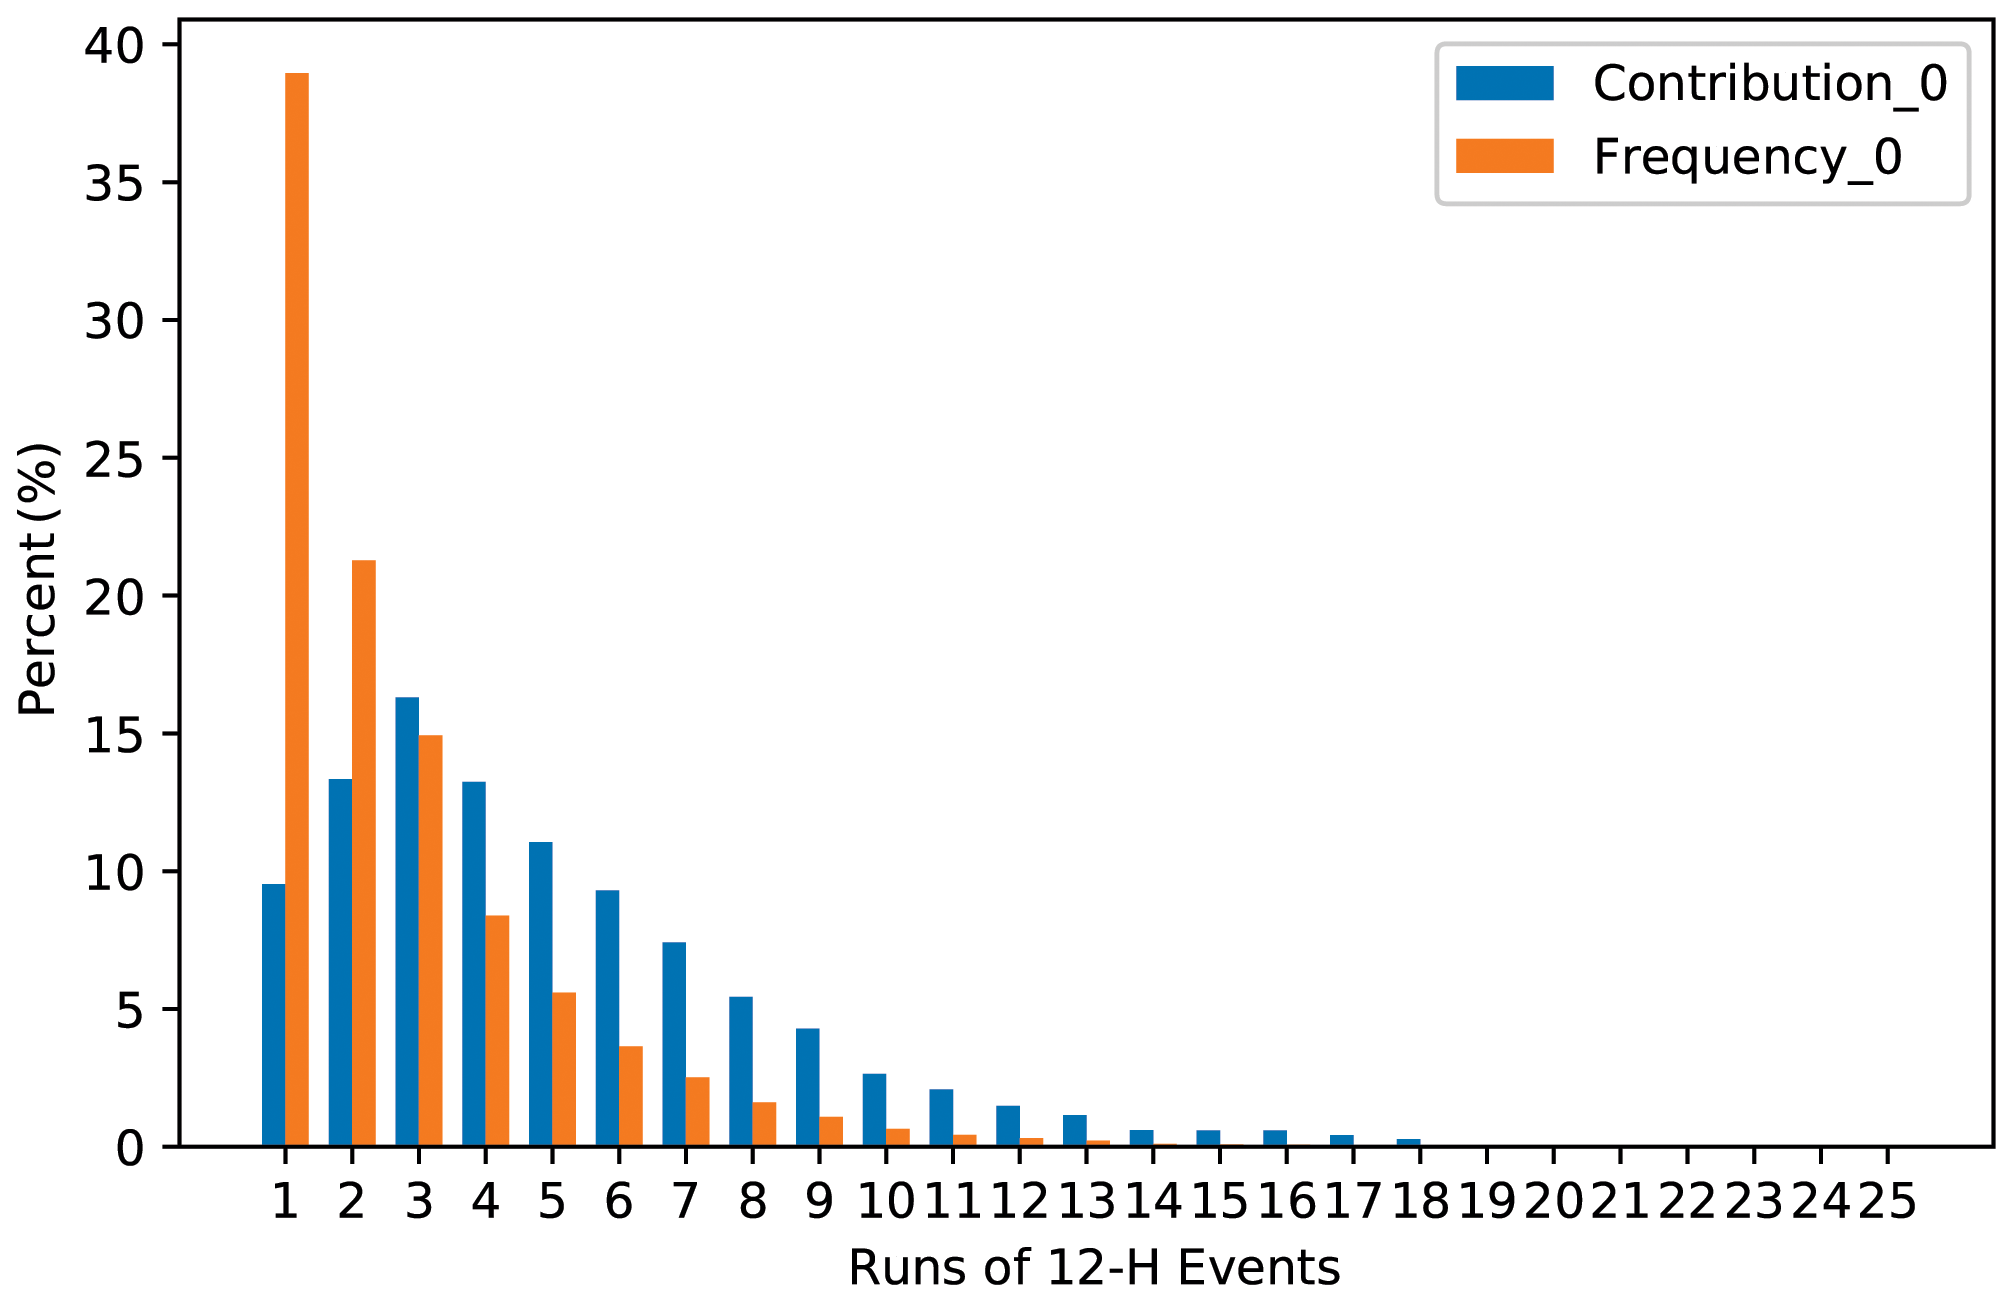
Figure 2 also shows that the contribution of runs of precipitation events to the total precipitation rose slowly first and then fell sharply. Contributions gradually increased from 9.5 % to 16.3 % from run 1 to run 3 events. Run 3 precipitation events contributed the most to the total precipitation. Contribution of events >14 runs decreased to less than 1 %; cumulative contributions of events with 1–10 runs counted for 92.6 %, while events greater than 10 runs counted for only 7.4 %. This indicates that continuous precipitation events that contributed the most to total precipitation were events of 1–10 runs. The precipitation events with a longer duration had lower frequency and contributed less to the total precipitation.
Frequency and contribution to total precipitation of all runs in the study area were not proportional according to Fig. 2. Frequencies of run 1 and run 2 events were higher than their contribution rates. Contribution rates of events >3 runs were all greater than their frequency. The frequency of the run 1 precipitation event (its frequency was 39 % and contribution was 9.5 %) was 2.61 times bigger than that of the run 3 (its frequency was 14.9 % and contribution was 16.3 %), but the contribution rate of the former was only 58 % of the latter events. This indicated that precipitation events of fewer than 3 runs occurred most often, but the total amount was small. Run 3 precipitation events contributed the most precipitation but with lower frequency and would be key events for flood monitoring.
Figure 3 shows the cumulative probability distribution and fitted gamma curves in stations. Consecutive events with fewer than 10 runs showed an abrupt rainfall rise, up to more than 250 mm in all stations. Rainfall of runs longer than 10 rose slowly, with increasing rainfall less than 30 mm in most stations. This result showed similar findings to the analysis in Fig. 2, that is, precipitation events with a very long duration rarely occurred and had minimal contribution to the total. Therefore, 1–10 runs were selected as experimental data for estimating the risk in the follow-up analysis.
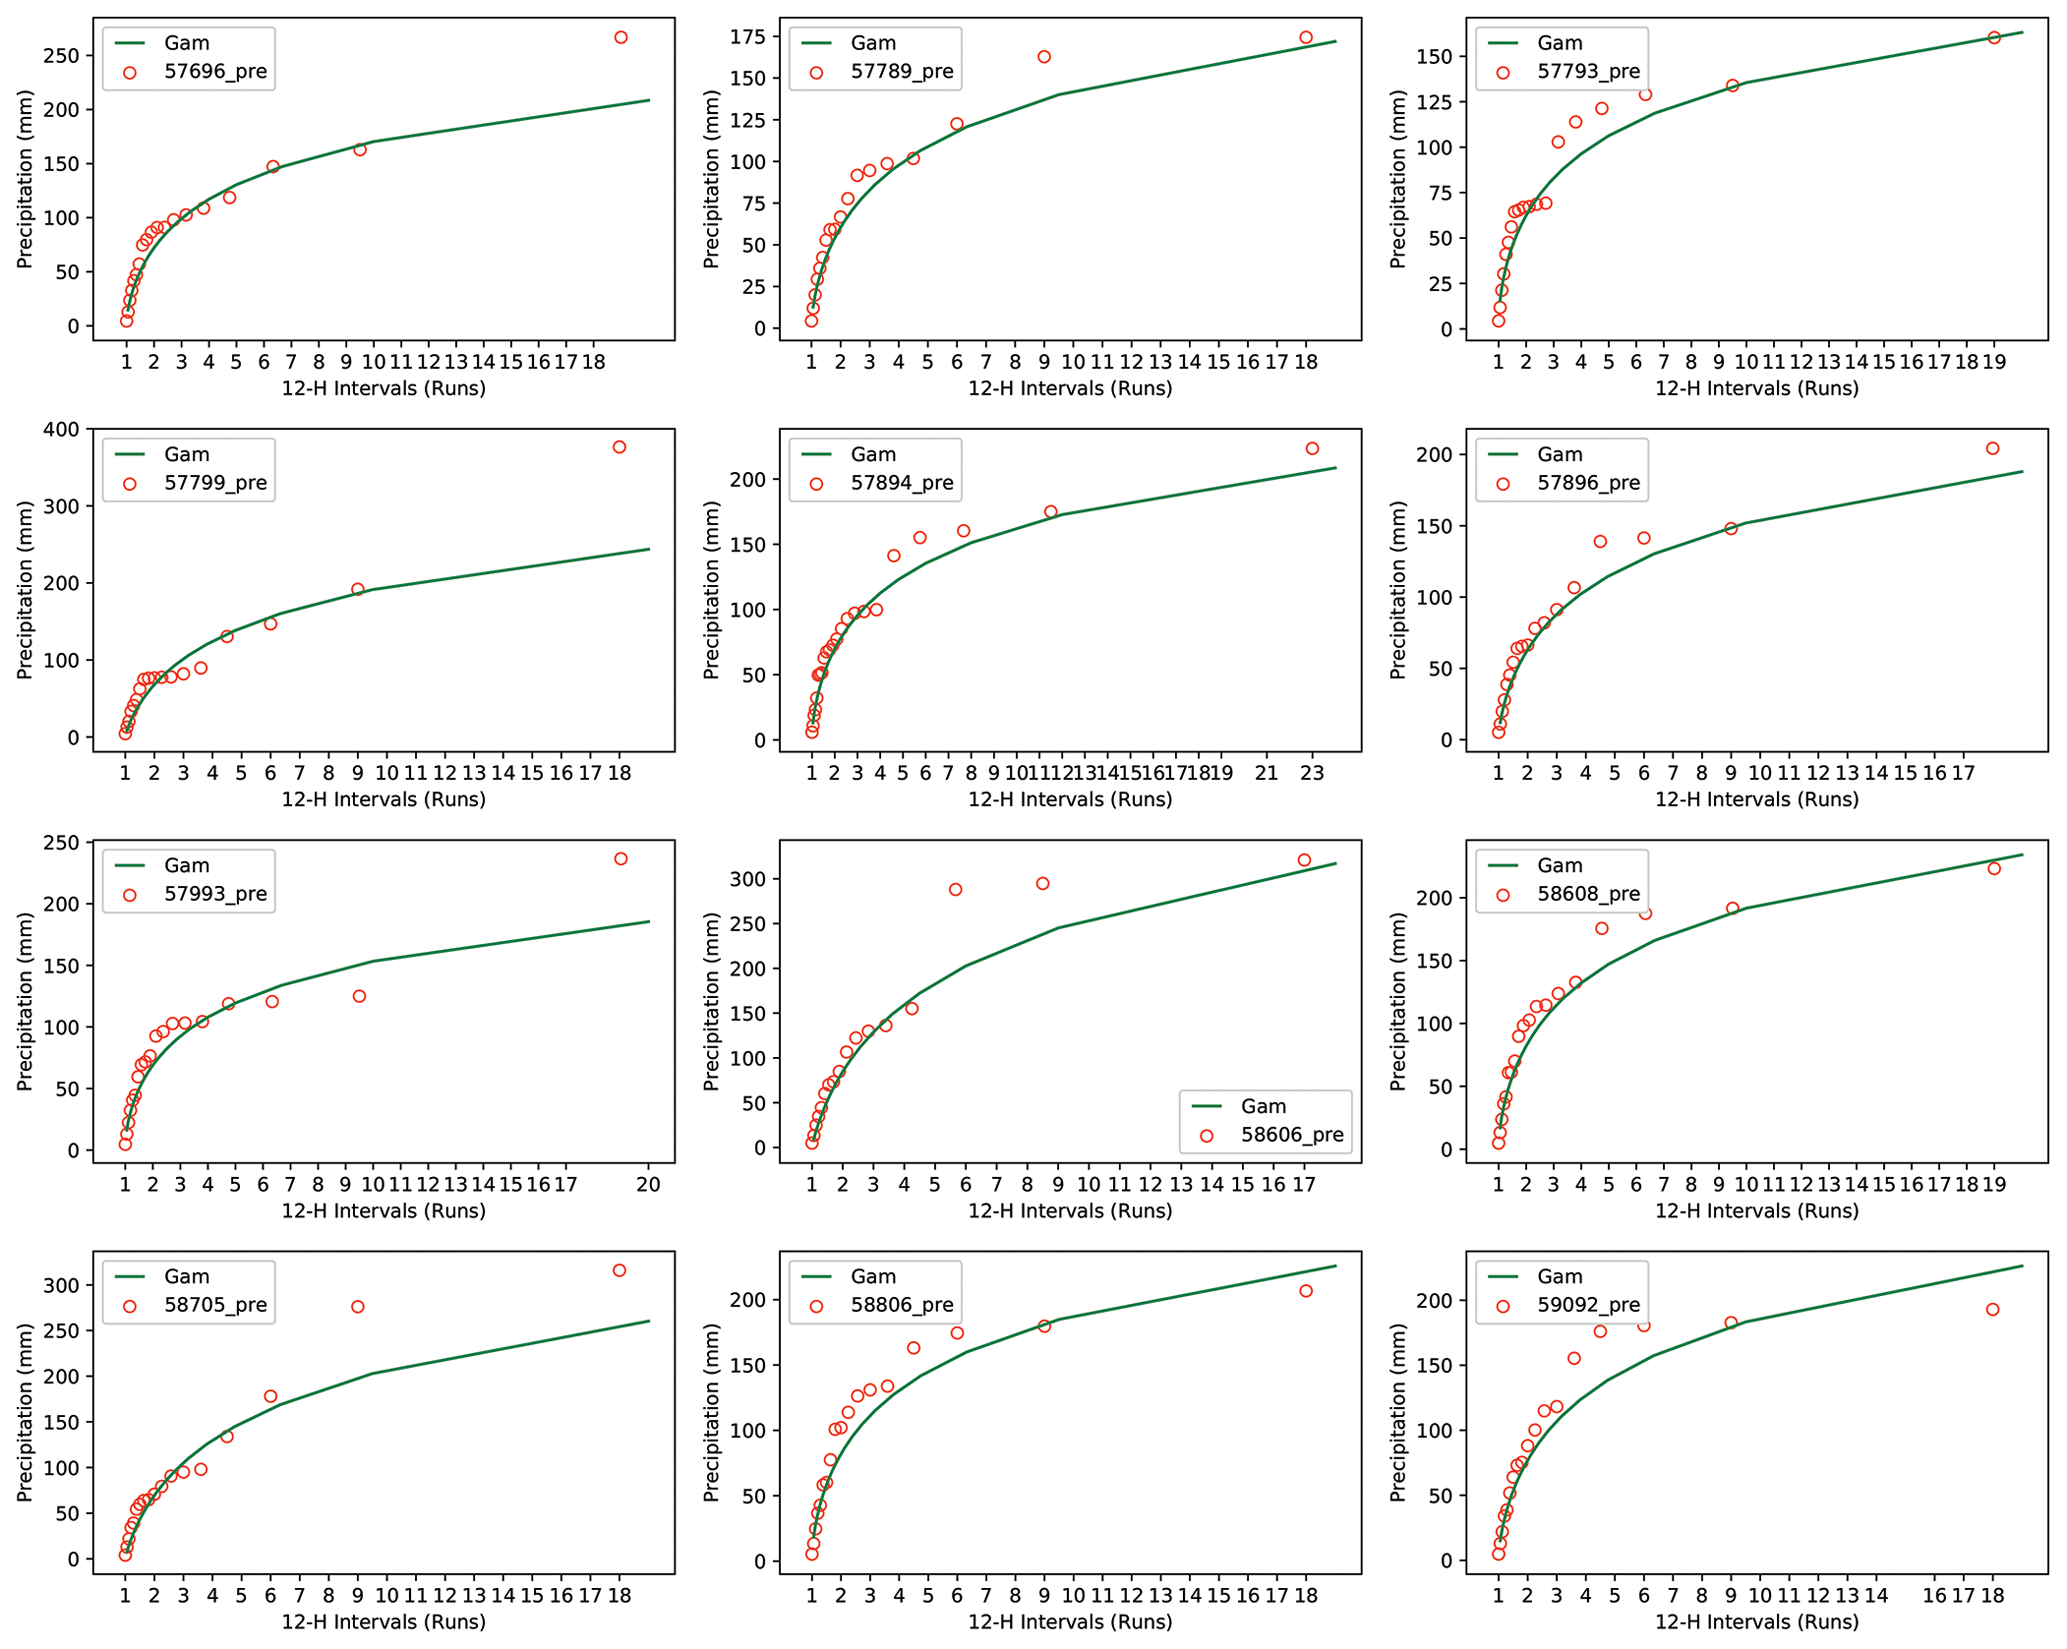
Figure 3Cumulative precipitation of runs of events. The hollow orange points show observed precipitation events. The green lines represent their gamma estimates.
3.2 Gamma fits of precipitation events
3.2.1 Estimated distribution of precipitation events
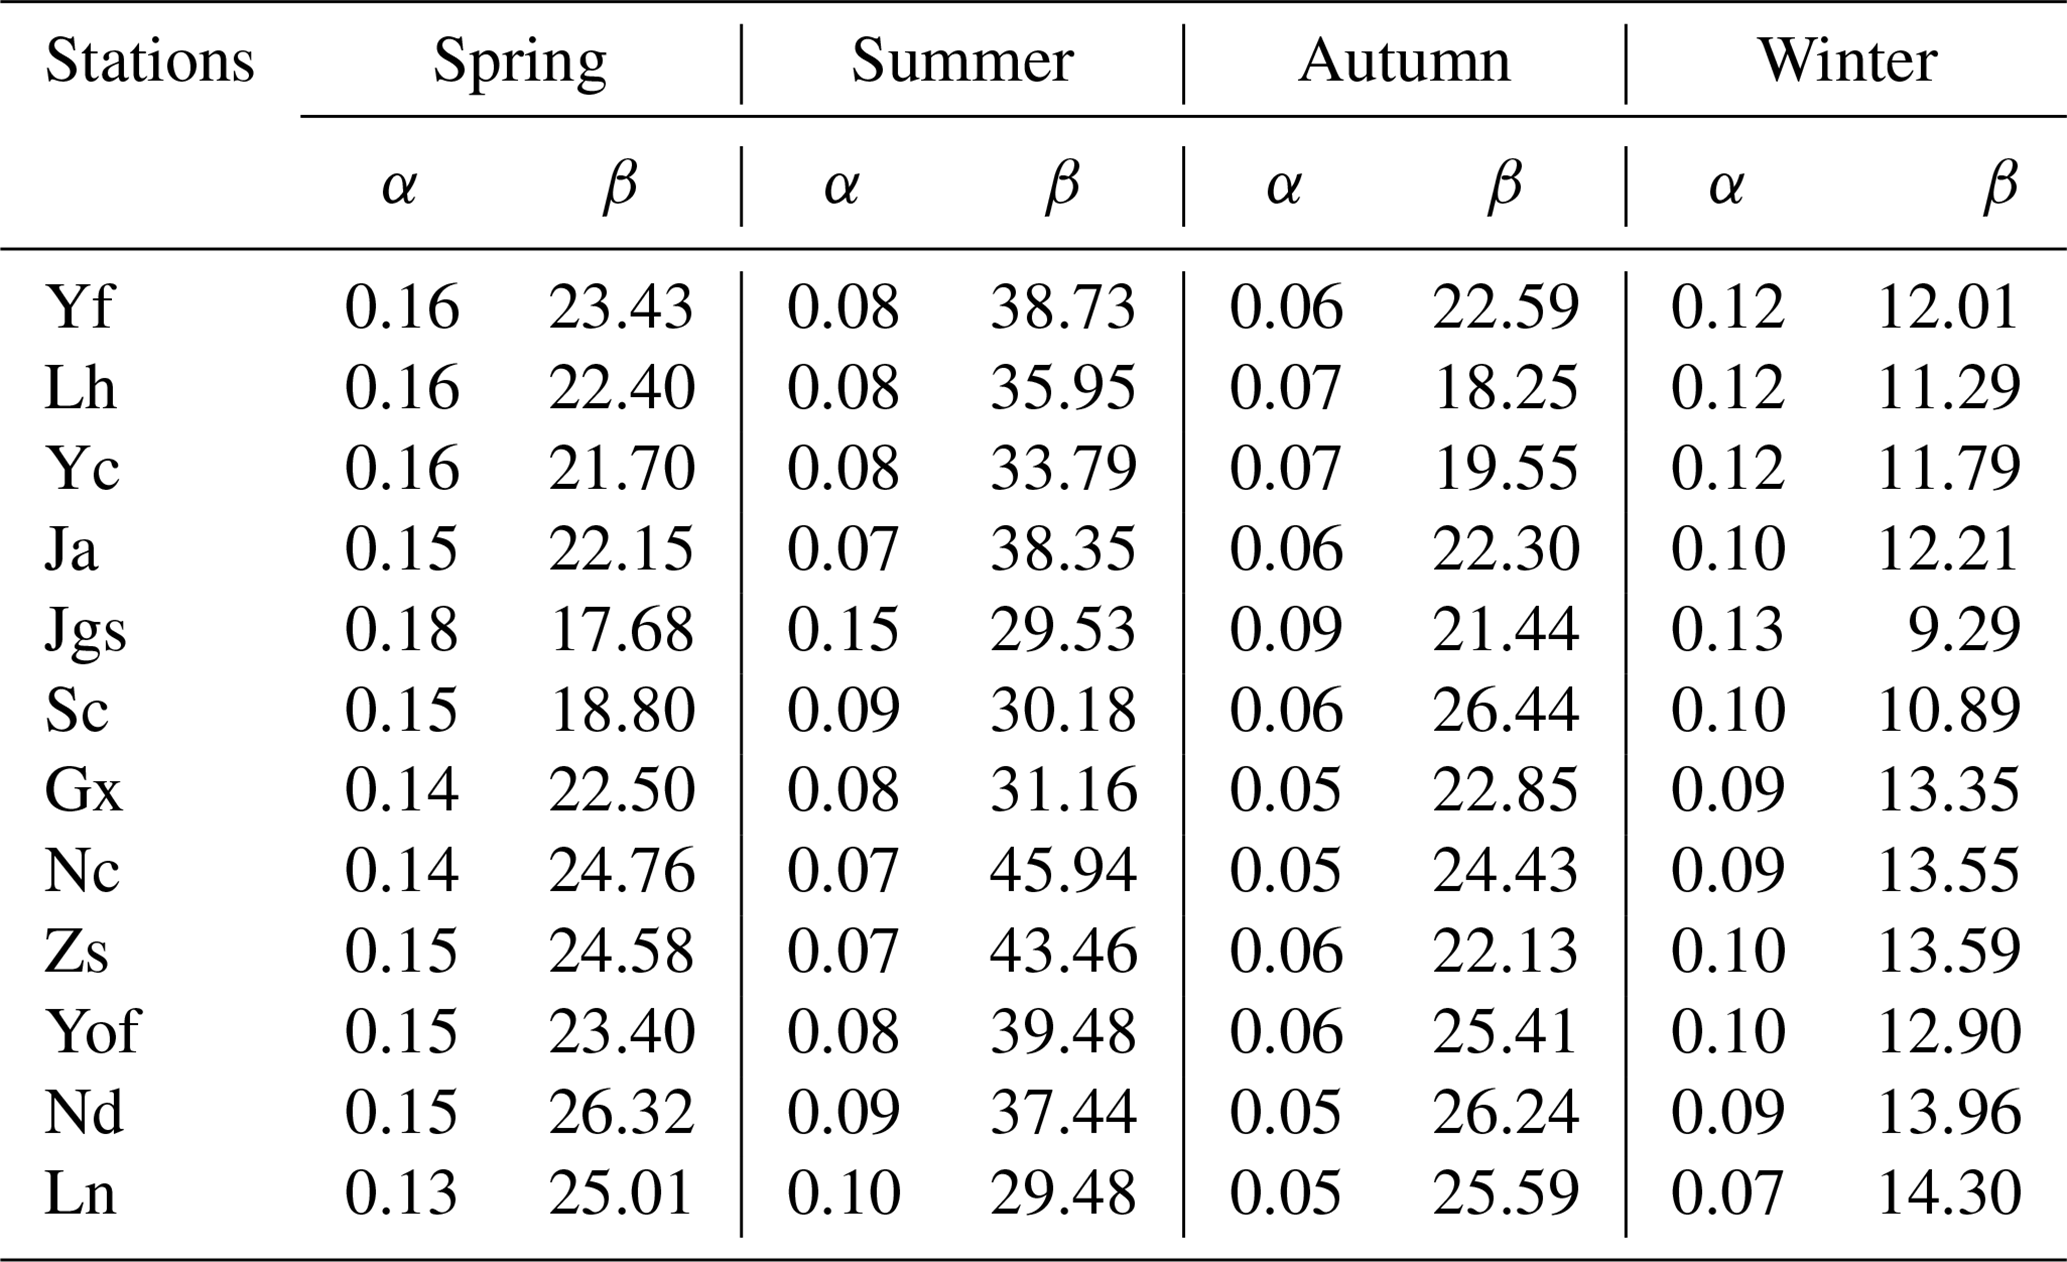
As presented in Sect. 2.3, the gamma function was used to fit observed precipitation data first with a view to provide smooth changes and long-time projection. Table 3 shows the mean values of α and β of the gamma curves in the four seasons. Related research shows that when the shape parameter α was ≤1, the gamma distribution has a asymmetric J-shaped probability density function (Loucks et al., 2005), which indicates that events with small amounts of rainfall account for a substantial, large proportion, while events with large amounts of rainfall account for a very small proportion (Rodrigo, 2010). This case is common for the four seasons in Table 3, especially in summer and autumn when α is ≤0.1, indicating that these two seasons are characterized with occasional and sudden extreme heavy precipitation in all stations. The β parameter characterizes the scale of the gamma distribution. When β increases, the distribution curve squeezes leftward and upward, indicating high intensity of precipitation (Rodrigo, 2010). β has a greater temporal variability. β is the biggest in summer, followed by that in spring, autumn and winter. The highest values of β in spring are from Nd and Ln. These two stations are located in the mountainous upstream areas where northerly cold air meets with warm air from the ocean in spring, often resulting in frontal and cyclone precipitation. The highest values of β in summer appear in Nc, Zs and Yof, which are located in the alluvial plains where the precipitation is often caused by typhoons heading west and southwest in summer (Yin et al., 2007). The highest values of β in autumn are in Sc, Yof, Nd and Ln, indicating that fronts, typhoons and other air activities are frequent in autumn, and the main precipitation occurs in the hilly area of the upper Ganjiang River.
Table 3Mean parameters α (shape) and β (scale, millimeter per 12 h) for the gamma distribution in stations.
3.2.2 Trends of the gamma parameters
Temporal trends of the shape parameter α and the scale parameter β were further analyzed using the Mann–Kendall test. Table 4 summarizes the results, which indicated that precipitation would occur more occasionally but with higher intensity in spring, winter and autumn. The two parameters in most stations are experiencing more intensive changes in spring. α in spring shows a significant downward trend in Yf, Yc, Jgs, Sc, Nc, Zs and Nd with the absolute value of Z bigger than 2.32, while β exhibits an upward trend in Yf, Lh, Zs, Nd and Ln. The trend of α is tested downward in Jgs, Yof and Ln in autumn, while the trend of β is upward in Ja, Zs and Yof. β in Ja, Jgs, Sc, Gx, Yof and Nd shows an upward trend in winter. No obvious trends are detected in summer. Studies have showed that decreasing the shape parameter α will reduce the threshold for the extreme precipitation threshold, which in turn increases the risk of storm flooding (Rodrigo, 2010). The downtrend α along with upward-trend scale parameter β in Yf, Zs and Nd means that the intensity and occasional probability of concentrated precipitation events in these stations will increase in the future, which will thereby increase the risk of storm floods in spring. Similar cases were also found in Yof in autumn and Jgs in winter, which indicated that extreme precipitation would become more intensive with a warmer and warmer climate. The particular case is the station of Jgs, with α decreasing in all the seasons except summer. Jgs is located in the mountain at an elevation of 843 m. We may infer this mountainous station will present increasingly obvious maritime precipitation characteristics in the future.
Table 4Changes of the gamma distribution parameters α and β in each station and season during 1959 to 2016. Z: Z values from the M–K test. When Z is bigger than 0, the trend is upward; when Z is smaller than 0, the trend is downward. When the absolute value of Z is bigger than or equal to 1.28, 1.64 and 2.32, it means that the test has passed the reliability test of 90 %, 95 % and 99 %, respectively. Tr: trend of α and β. Increasing (↑): when the M–K statistic is positive and the confidence level is below 0.05. Decreasing (↓): when the Mann–Kendall statistic is negative and the confidence level is below 0.05. No trend (–): there is no trend detected according to the confidence level.

3.3 Risk of extreme precipitation
3.3.1 Estimation of thresholds for extreme precipitation
As defined in Sect. 2.2, the 99 % percentile of the 12 h precipitation data and their gamma distribution estimates were first calculated as extreme precipitation thresholds. Table 5 shows the mean values for each station. The estimated threshold values show higher variability from winters to summers in Table 5. The maximum threshold values occur in summer, followed by spring, autumn and winter. The study area is mainly controlled by monsoons and typhoons in summer, which result in the most concentrated heavy precipitation (Shan et al., 2001). In spring, the ridge of the subtropical high system moved to the south of 20∘ N latitude. The warm and humid air from the south along the subtropical high ridge intersects with cold air from the north, forming fronts and cyclone activities, which bring a wide range of cloudy and rainy weather. Autumn and winter are often affected by the winter monsoon, which is characterized with cold air and low precipitation (Zhang and Song, 2018).
Table 5Mean threshold values (mm) of 12 h in each station and seasons and their estimates obtained from the gamma distribution according to data in 1959–2016. Pre_99 refers to thresholds from the observed precipitation and gam_99 to the estimates from the gamma distribution.
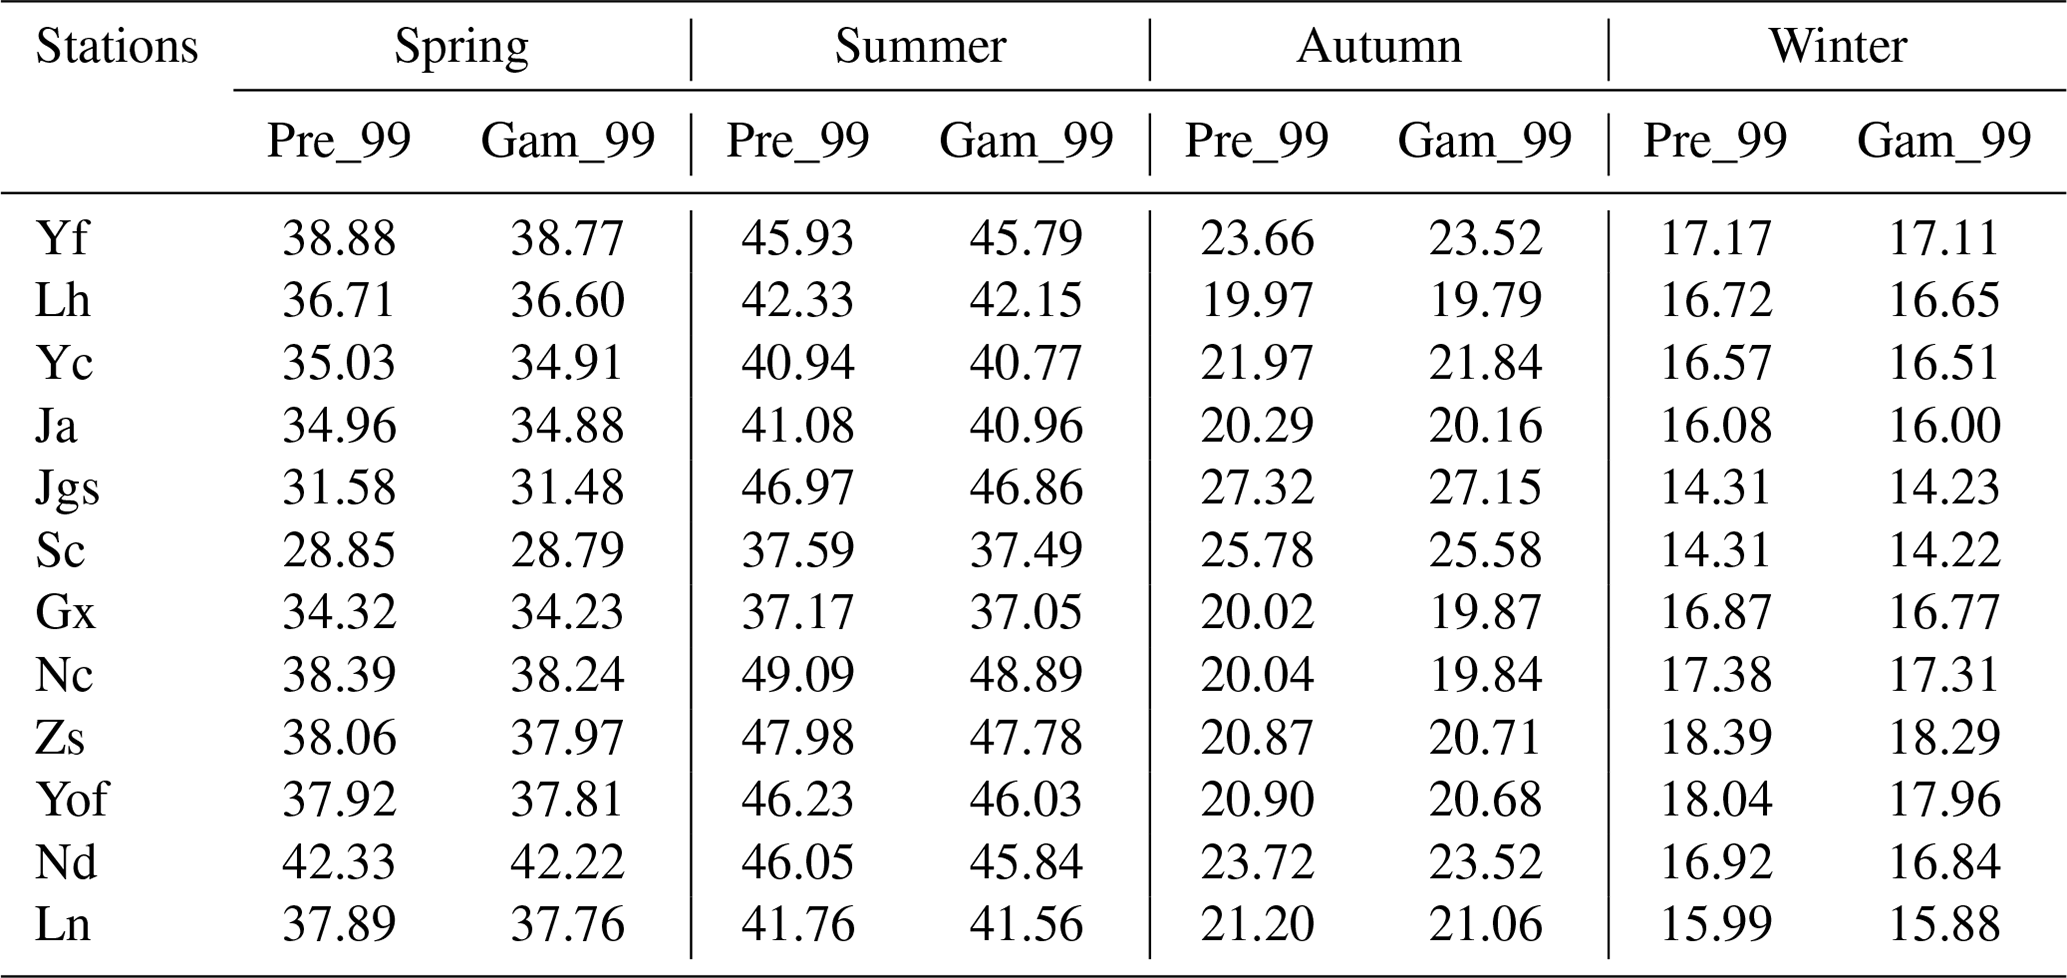
What stands out in Table 5 is that the estimated gamma values are 0.3 %–0.8 % lower than those observed on average, with the smallest in spring (0.3 %) and the largest in autumn (0.8 %). This result is similar to that of Rodrigo (2010). A slightly lower threshold for extreme precipitation will increase the estimated risk, which allows risk managers to improve risk management before storm floods occur. Therefore, the lower values from the gamma function would help reduce risks. The 99th percentile estimates are maintained as the threshold values to obtain the risk analysis.
The estimated thresholds of 12 h to 120 h precipitation events (1 to 10 runs of 12 h events) were also calculated and plotted. The Kolmogorov–Smirnov (KS) test was used to test the goodness of the fits at the 95 % confidence level. KS values range from 0.06 to 0.12, which shows that gamma distribution had a good agreement with the selected thresholds from the observations. Forty-eight fits (4 seasons × 12 stations) were calculated eventually, and Fig. 4 shows an example in Gx. Its horizontal axis represents scenarios or probability, while the vertical axis represents thresholds of extreme precipitation events in millimeters (mm). The lowest curve is fitted from run 1 observed precipitation. Curves from the run 2 to the run 10 are higher and higher. Figure 4 shows that there are bigger intervals between curves in summer and winter, indicating that runs of precipitation events in summer and winter have a greater impact on the extreme event thresholds. Compared with runs 5 to 10, the intervals are even bigger between runs 1 and 4, indicating that the precipitation threshold changes greatly when the events happen within 48 h. The curve slopes in all the four pictures are steep when the probability is less than 0.5 (), which shows precipitation thresholds increase quickly. The slopes gradually decline when the probability is less than 0.2 (). It shows the precipitation threshold increases slowly as the probability decreases. Fits in other stations show similar trends.
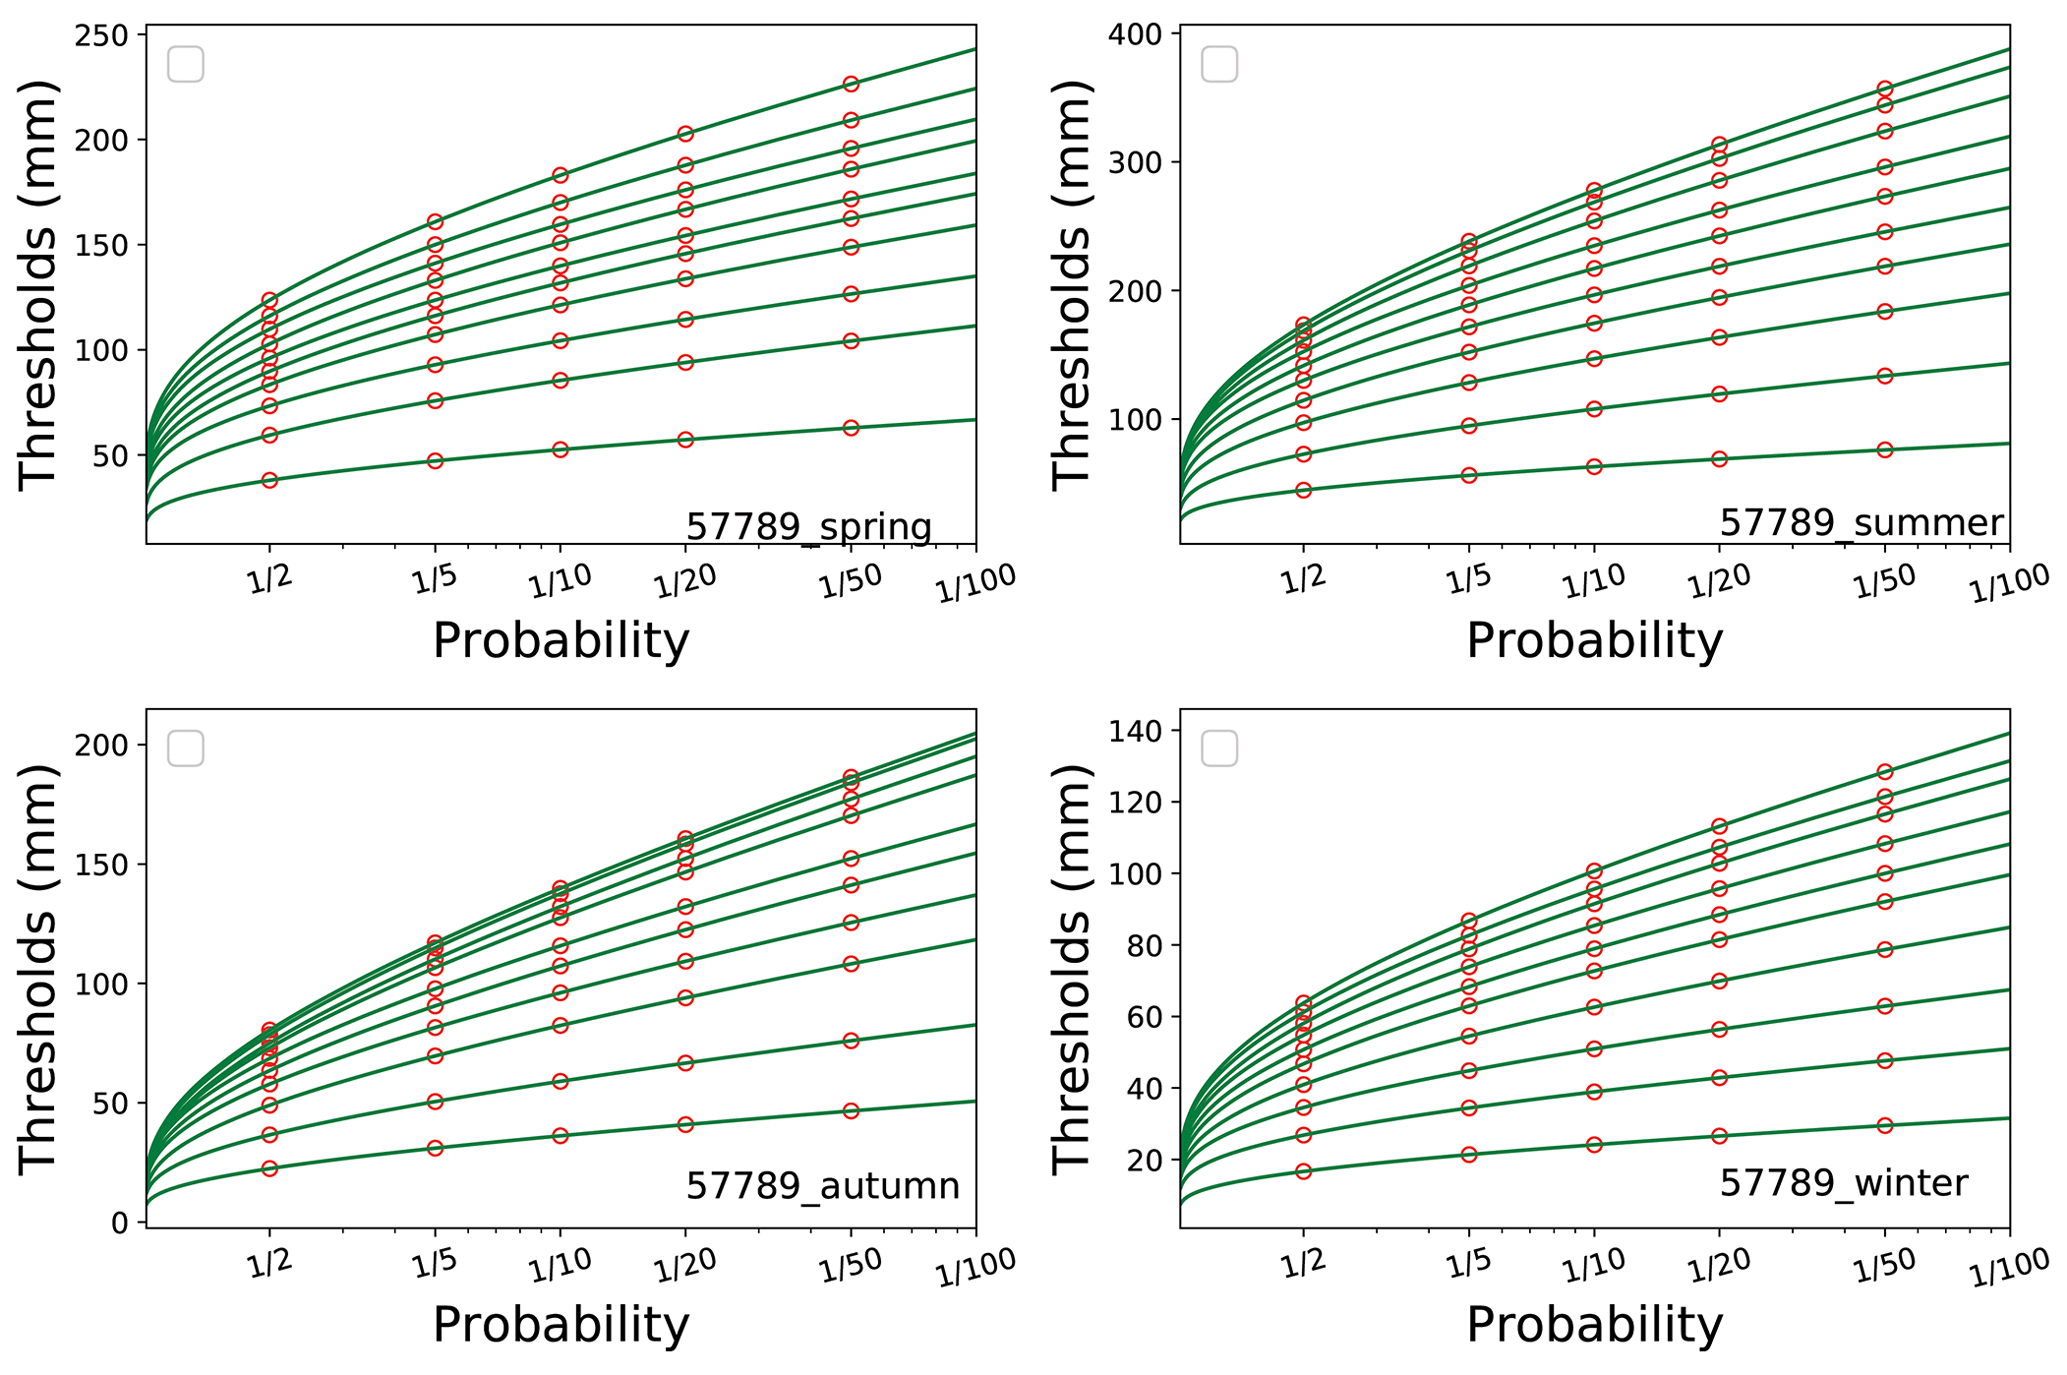
Figure 4An example of extreme precipitation threshold distribution from the gamma fits of 1–10 runs of 12 h data in seasons. The green lines from the bottom to top show the gamma fits of 1–10 runs, respectively. The hollow orange points are thresholds calculated with a probability of 0.5 (), 0.2 (), 0.1 (), 0.05 () and 0.02 ().
With the help of these gamma fits, thresholds under any given probability can be estimated. The hollow orange points in Fig. 4 show estimates when the return period is set to be one in 2 years (its probability is 0.5), one in 5 years (0.2), one in 10 years (0.1), one in 20 years (0.05) and one in 50 years (0.02), respectively, which is used for risk analysis later in the following section.
3.3.2 Extreme events and floods
The estimated thresholds in Sect. 3.3.1 could help to analyze extreme precipitation events and their risks. In order to identify what kinds of extreme events would cause floods, we selected Gx, a meteorological station, and Hanlinqiao, a hydrological observation station, to do a comparative analysis, due to the available hydrological data. Figure 5 shows their location. Gx (25.87∘ N, 115∘ E), located at the lower reach of the Gongshui River (a branch of the Ganjiang River in its upper reach), is a national meteorological observatory. It is one of the four basic national stations in the upper reach of the Ganjiang River. The records in Gx began in 1951, and they are relatively complete with good data consistency. Hanlinqiao is a regional representative hydrological station at 115∘12′ E and 26∘03′ N. It was established in February 1953 and is located in the village of Laoheshi, Jibu, Ganxian, downstream of the Pingjiang River, whose catchment area is 2689 km2. It is 17 km away from the entrance to the Gongshui River. The two stations are close, and the representative area covers almost the same region.

Figure 5Location of Ganxian meteorological station and Hanlinqiao hydrological observation station.
The extreme events supposed to be with risk-causing floods in Gx are selected according to the following standards, and Table 6 shows the number of selected events:
-
events above thresholds estimated by the gamma curves of runs 1–10 in Sect. 3.3.1;
-
events under the scenarios of probability at 0.5, 0.2, 0.1, 0.05 and 0.02, representing return periods of 2, 5, 10, 20 and 50 years, respectively;
-
the time intervals between two events are greater than run 1 (12 h); and
-
events between 2009 and 2014, which is the period of the available hydrological data at Hanlinqiao station.
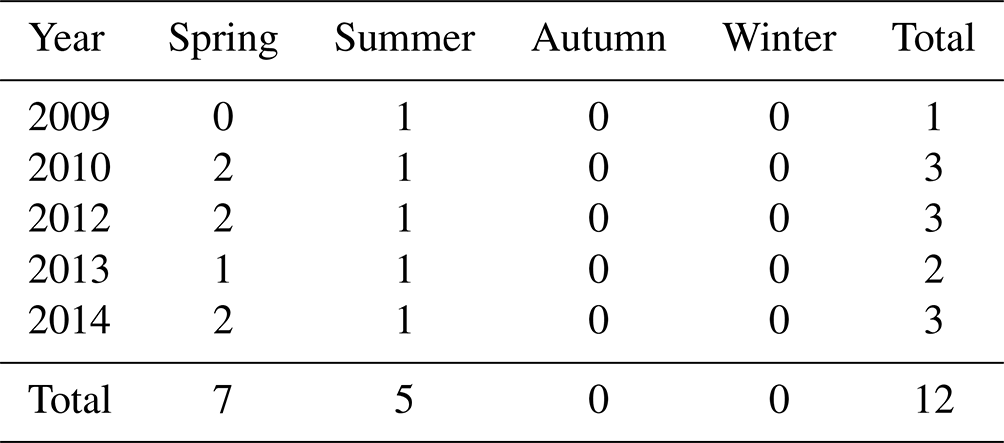
The flood events in Hanlinqiao are selected according to the standards below, and Table 7 shows the result:
-
events above the threshold, which is the 99 % percentile of the daily flow records, and
-
the time interval between two events greater than 1 d, that is, the estimated convergence time from the farthest point to the outlet in the catchment.
Table 6Statistics of extreme precipitation events from 1–10 runs at Ganxian station from 2009 to 2014.
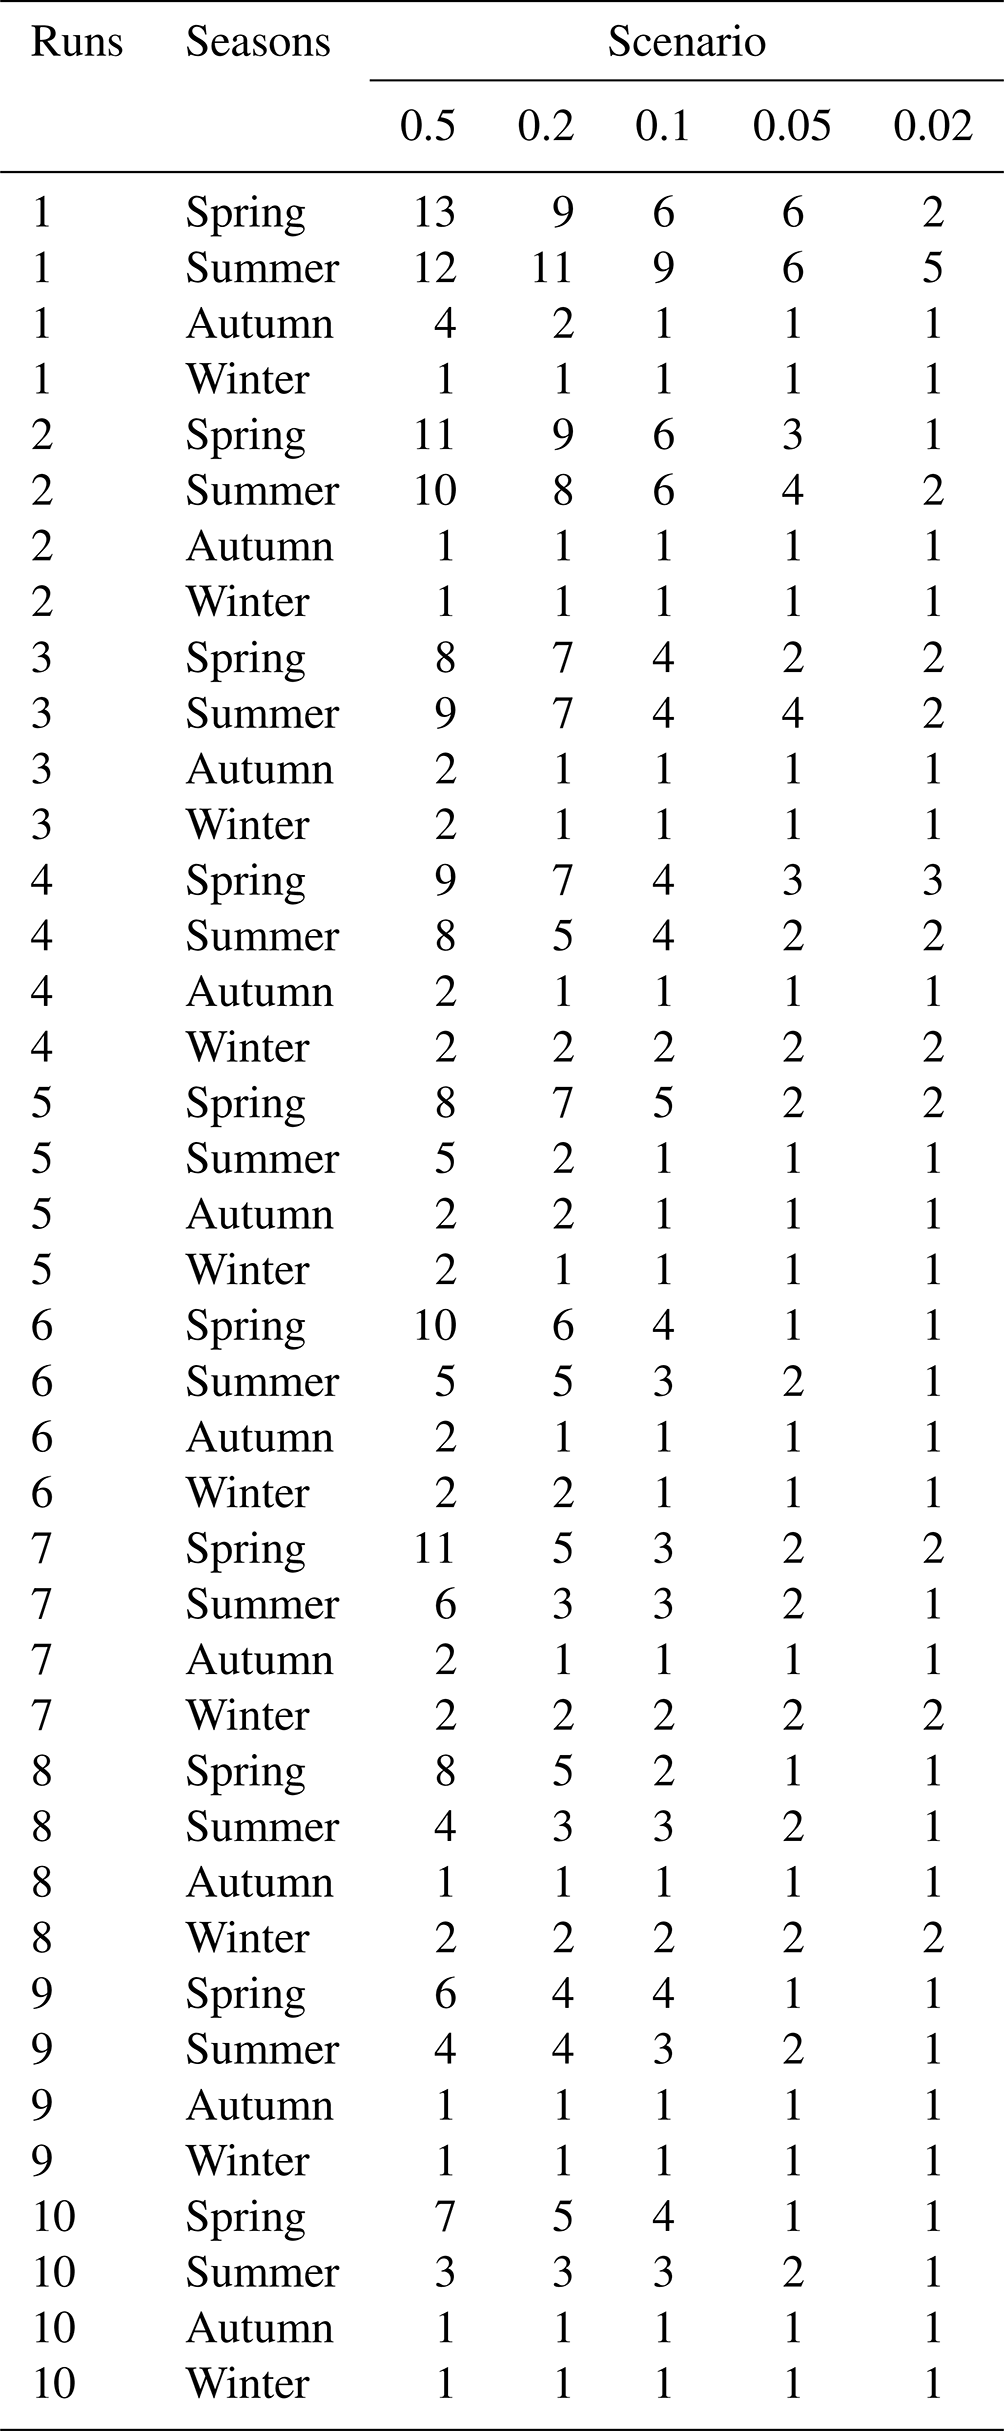
Analysis from Tables 6 and 7 shows that the predicted extreme precipitation events have similar trends as the flood records. Both have more events in spring than in summer, followed by autumn and winter. Table 6 shows the predicted events of all the runs in spring account for more than 40 % under scenarios of probability at 0.5, 0.2 and 0.1 and about 30 % under scenarios of probability at 0.05 and 0.02. Events in summer account for more than 30 % under all scenarios. Those in autumn and winter only account for 20 % or so from 2009 to 2014. Records in Hanlinqiao find 12 flood events in the 6 years. Seven events were in spring and five in summer. No events are found in autumn and winter. The precipitation records at Gx were selected with the flood occurrence date. There are nine precipitation events found on the same day when the floods happened, with the highest precipitation of 72.2 mm in 12 h and 118.1 mm in 24 h. There was no precipitation recorded with the same date of the rest of the three floods, but precipitation was found on the previous day, with the highest precipitation of 73.3 mm in 12 h before the date and 83 mm in 24 h before the date. Two floods were found with a run 6 precipitation event in the early stage, four floods with a run 4 precipitation event, two floods with a run 3 precipitation event, one flood with a run 2 precipitation event and three floods with a run 1 precipitation event. Compared with the flood records, thresholds in Scenario 1 (probability at 0.5) are a little lower, which will overestimate the number of extreme precipitation events. Scenarios 3, 4 and 5 (probabilities at 0.1, 0.05 and 0.02) have high thresholds, which will underestimate the number of the flood events. The predicted extreme precipitation events from Scenario 2 (probability at 0.2) are very close to the recorded flood events.
Table 7Floods events recorded in Hanlinqiao hydrological station from 2009 to 2014.
Of all the runs under Scenario 2, the predicted events from runs more than seven are lower than the recorded floods. It is a complex process from precipitation to floods, involving several disaster-generating environments such as land covers, topography, soil, temperature, shape of the catchment area, etc. It is reasonable that the predicted extreme precipitation events are bigger than or equal to flood events in the risk assessment. Therefore, runs 1, 2, 3, 4, 5 and 6 are more suitable for predicting extreme events. According to the flood events at Hanlinqiao station, the predicted events from run 1 (one 12 h precipitation) under Scenario 1 are almost double the flood records. Events from runs 2, 3, 4, 5 and 6 are all more or very close to the flood records. The analysis suggests that events predicted using the gamma distribution based on 12–72 h of precipitation data are highly beneficial for flood estimates. However, events predicted using data beyond 72 h may result in underestimation of the risk of flooding. There are some cases where little precipitation (less than the given threshold) was observed at the beginning, which was not considered to cause floods. However, a new record of precipitation that was just above the threshold in the following periods eventually led to flooding because of rainfall accumulated in the previous period. If time intervals between precipitation are too long, this flood event will be missed because of the high threshold. Run 1 (12 h precipitation) will be the best time interval for predicting extreme events in disaster management, which will avoid such missed cases.
3.3.3 Spatial distribution of extreme precipitation risk
The paper further analyzed the spatial distribution of extreme precipitation risk in the study area. The method is listed below according to the analysis above:
-
The observed precipitation was 12 h precipitation from the 12 meteorological stations. The 99th percentile was selected as thresholds in each season.
-
A gamma function was used to fit the observed data. Thresholds were calculated at a given probability of 0.2 from the gamma curves according to Sect. 3.3.2. Events bigger than the threshold were considered extreme precipitation events and were calculated for risk map.
-
The number of events in all stations was further interpolated with an inverse distance method. The results were mapped and stretched from low to high, according to the number of events.
Maps of extreme precipitation risk in spring, summer, autumn and winter with the methods above are followed in Fig. 6 to show spatial distribution of extreme precipitation risk. Figure 6 shows that the high-risk centers of extreme precipitation are distributed on the east side of the Luoxiao Mountains in spring, moving south to the upper reaches of the Ganjiang River, which is the north side of the Nanling Ranges in summer. Two new high-risk centers are found in the middle reaches of the Ganjiang River, near the west side of Wuyi Mountain in autumn, and tend to move eastward and northward in winter. The low-risk areas are distributed in the Jitai Basin, which is in the middle reaches of the Ganjiang River and the upper Ganzhou Basin in spring, moving north to the lower reaches to Poyanghu Lake in summer, then moving slightly to the south in autumn. During winter, a new low-risk center develops in the northwest region and gradually moves towards the northwest, approaching the Luoxiao Mountain range in the west. In general, extreme precipitation has a high risk of flooding in the upper reaches of the Ganjiang River, the Jitai Basin in the middle reaches and the northern plains. Risk tends to increase with elevation in the northern river–lake plain area and the Jitai Basin in the midstream area, while risk in the southern hilly area is the opposite and shows signs of decreasing as elevation rises. This risk result is similar to the conclusions of Yin et al. (2018).
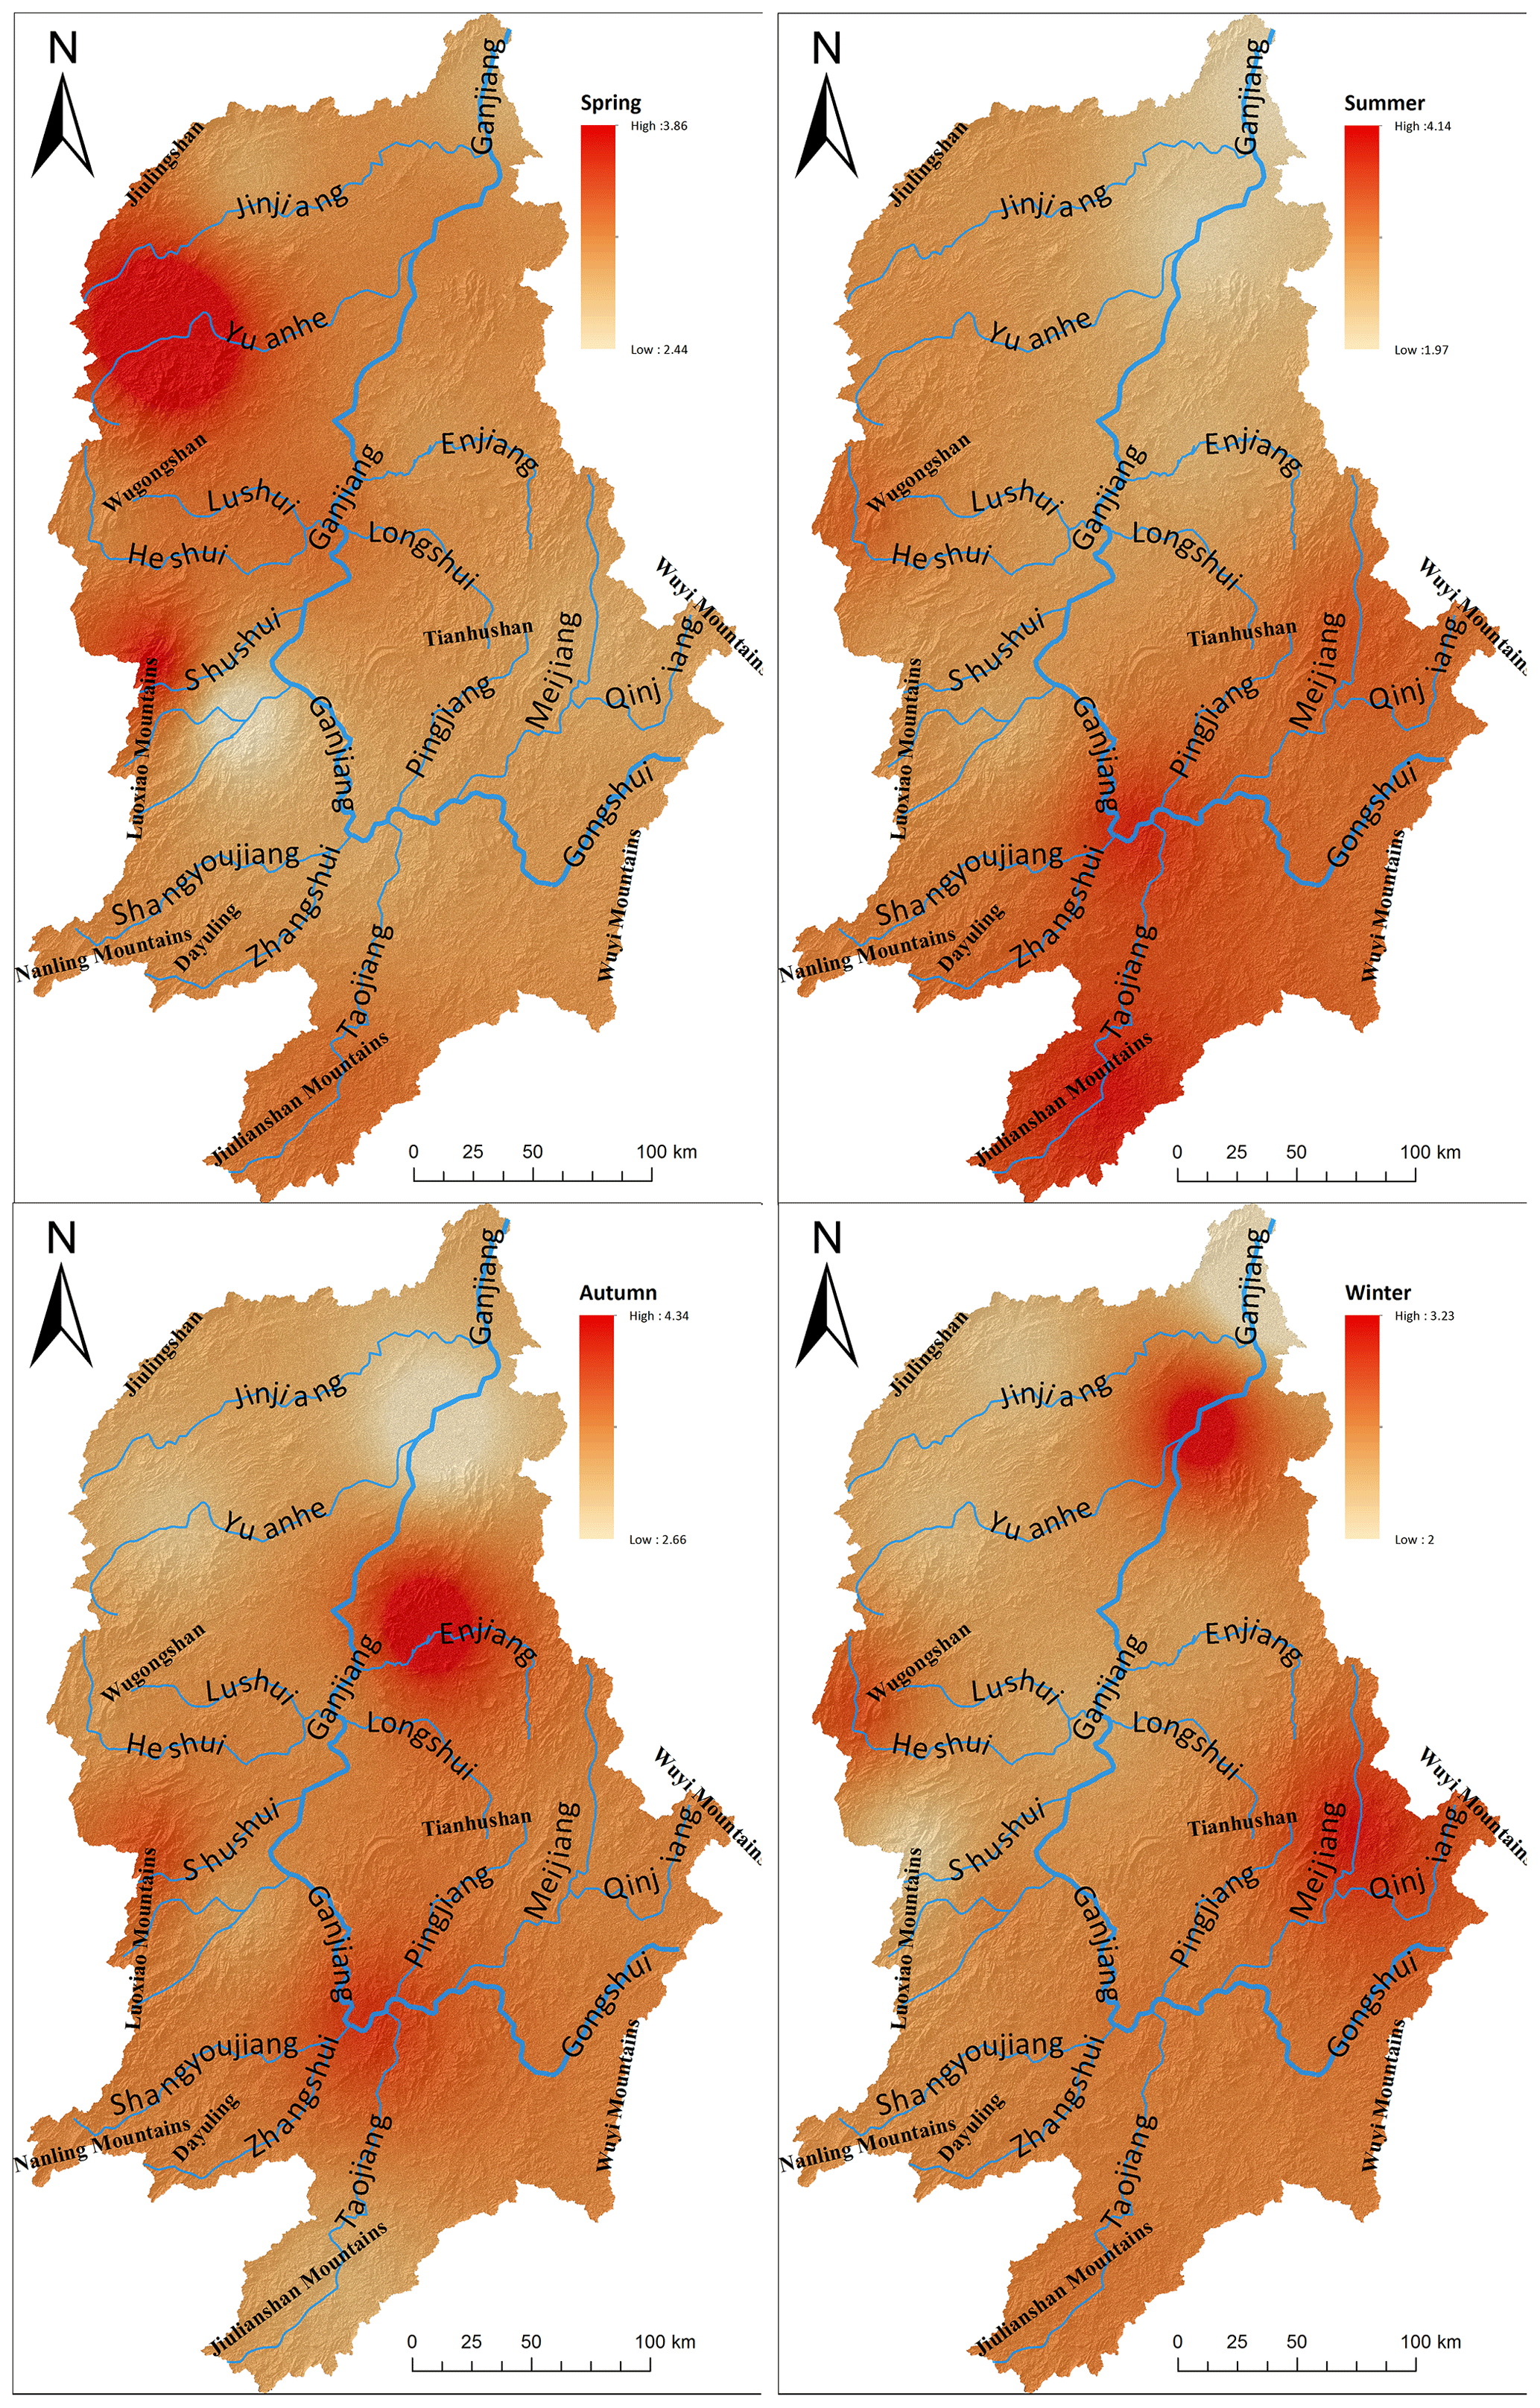
Figure 6Extreme precipitation risk under Scenario 2 in spring, summer, autumn and winter in the Ganjiang River basin. The colors range from light orange to red, indicating the increasing risk from low to high. The numbers are the annual average of the estimated extreme precipitation events.
The main weather systems that cause extreme precipitation in the study area include low- and medium-level shear lines, low-level jets, typhoons with low pressure, etc. (Shan et al., 2001). Monsoons in spring and summer from the tropical ocean cyclones run southwest in the study area, are uplifted with micro-topography, and result in high-risk centers in the west and south mountain regions. The winter monsoons in autumn and winter from deep inland move south-eastward and form frontal precipitation when they encounter stranded warm air currents, causing high-risk centers in the eastern and southern parts of the study area.
3.4 Discussion
3.4.1 Timescales of precipitation
Precipitation events, especially occasional extreme precipitation events, are highly variable in time (Beck et al., 2015), and intermittency is a core characteristic (Trenberth et al., 2017). This paper investigated the timescales of precipitation with 12 h data and found run 3 precipitation events contributed the most precipitation but with lower frequency. The study area was mainly characterized with short-duration precipitation events, and events greater than 10 runs occurred very rarely. Hence, short-duration precipitation events would be a key hazard factor for extreme precipitation forecasting and flood and disaster risk management analysis. Section 3.2 further analyzes the trend of short-duration precipitation and finds that it will occur less frequently but with higher intensity in future. Other associated studies have yielded similar results. Cheng et al. (2014) investigated the precipitation intensity–duration–frequency (IDF) in a changing climate and found that climate-induced changes on heavy rainfall events are non-uniform. Shorter precipitation events have changed more in the past decades, while longer events have not changed substantially (Cheng and Aghakouchak, 2014). Hosseinzadehtalaei et al. (2020) found the frequency of sub-daily extreme precipitation events of 50- and 100-year return periods will be tripled under the high-end RCP8.5 (Representative Concentration Pathway) scenario in the future, which will increase the risk of flooding. Similar cases are also found in China. Ren et al. (2016) analyzed the data from 2300 stations across China. Their research shows that the frequency of trace precipitation (precipitation with a daily rainfall of less than 0.1 mm) has shown a more significant downward trend than the frequency of light rain events in the eastern monsoon region. The frequency of light precipitation in the eastern monsoon region has shown a very obvious downward trend (Ren et al., 2016). The Ganjiang River basin is located in the south of the east Asian monsoon region. Changes in short-duration precipitation events caused by climate warming will cause a higher risk of flooding, which is certainly the key indicator for further study on climate change, floods and other extreme weather disasters.
3.4.2 Extreme precipitation risk
In fact, most precipitation events bring us necessary beneficial freshwater resources. Only a few events, especially extreme precipitation events, cause disasters and losses. However, which extreme events will result in flooding is not very clear. Researchers should consider how extreme precipitation is defined and carefully choose the data for their analysis of extreme precipitation (Pendergrass, 2018). We compared the extreme precipitation events from runs 1–10 of 12 h data with the flood records at the hydrological observation station and found that the number of events from runs 1, 2, 3 and 4 were close to the number of flood records. The number of diagnosed extreme events decreases as precipitation runs of 12 h increase; i.e., precipitation of more than 5 runs would underestimate the risk. A similar case has also been found in Merino et al. (2018), who selected 29 floods between 2000 and 2014 in Spain and compared them with the extreme precipitation events calculated with hourly and daily precipitation data in order to find their capability to identify flood events. The result shows that no extreme precipitation events are identified in eight of the flood events using definitions based on daily precipitation, but events based on sub-daily data permit much more accurate identification of events posing hydrologic risks (Merino et al., 2018). Obviously, it would be better to use short-duration data, for example, sub-daily precipitation, in extreme event analysis to avoid underestimation of potentially dramatic consequences they caused, such as flooding. In practice, daily precipitation series are commonly used to analyze extreme precipitation events with sufficient quantities and few homogeneity problems. The reason might be that high time resolution precipitation data are not provided or recorded in most regions. Therefore, remotely sensed data from satellites or rain radar would be used to replace sub-daily precipitation in follow-up research (Müller and Kaspar, 2014).
In this study, we investigated the frequency and contributions of precipitation events using sub-daily records in meteorological stations in the Ganjiang River basin; identified their changes and timescales using gamma distribution and the M–K test; and explored the definition, thresholds of extreme precipitation events, and flooding risk. We further spatially mapped the extreme precipitation risk across the entire study area and analyzed the distribution characteristics. Based on the analysis presented in this study, the following conclusions can be drawn:
-
For frequency and contributions, it was found that events of 1 to 4 runs occurred most frequently, and events of 1–10 runs contributed the most to the total precipitation. The frequency of events ≤4 runs accounted for as high as 83.5 % of the total events. Events greater than 10 runs only accounted for 1.4 % of the total. The cumulative contributions of events with 1–10 runs counted for 92.6 %, while events greater than 10 runs counted for only 7.4 %. Run 3 precipitation events contributed the most precipitation but with lower frequency, which would be key events for flood monitoring.
-
The gamma parameters analysis shows that extreme precipitation has the characteristics of high intensity and occasional occurrence in summer in all stations. In summer, the shape parameter α is ≤0.1, and the scale parameter β is the highest. The highest β values indicate that stations in mountainous areas and the transition areas from mountains to plains, such as Ningdu, Longnan Nanchang, Zhangshu and Yongfeng, are characterized with high-intensity precipitation in spring. Suichuan, Yongfeng, Ningdu and Longnan often have high-intensity precipitation in autumn. Temporal trends analysis of α and β shows the intensity and occasional probability of precipitation events will increase in spring in the future in Yifeng, Zhangshu and Ningdu, which will in turn increase the risk of storm floods.
-
Extreme precipitation risk shows the risk increasing as elevation increases in the northern river–lake plain area and the Jitai Basin in the midstream area, while the risk in the southern hilly area is the opposite, decreasing with elevation. Elevation and weather systems such as medium-to-low-level shear lines, low-level jets and southward typhoons are the key disaster-prone factors for disaster management.
The software code underlying this research paper is not available for download online. To access the code, readers can contact the corresponding author (Guangxu Liu, lg760411@126.com). The code is written in Python and is free to use and modify under an open-source license. In the interest of reproducibility and transparency, we encourage readers to review and use the code to reproduce our results and build on our research.
The underlying research data for this study are available upon request from the corresponding author (Guangxu Liu, lg760411@126.com). In the interest of transparency and reproducibility, we are committed to sharing our data with interested researchers. To request access to the data, readers can contact the corresponding author and provide a brief description of their intended use. We will review all requests and aim to respond within a reasonable time frame. Alternatively, readers can access a subset of the data used in this study through the National Meteorological Information Center in China at http://data.cma.cn/data/detail/dataCode/A.0012.0001.html (last access: 13 March 2023). We encourage readers to use the data to verify our findings and to build on our research.
GL and ZW designed the structures and prepared the manuscript. AX and SL collected and processed data. YZ, JW and YW revised and improved the manuscript.
The contact author has declared that none of the authors has any competing interests.
Publisher's note: Copernicus Publications remains neutral with regard to jurisdictional claims in published maps and institutional affiliations.
We would like to thank the Humanities and Social Science Research Planning Project for the Universities of Jiangxi Province (grant no. GL20116), the Science and Technology Project of Jiangxi Department of Education (grant no. GJJ201419), and the National Natural Science Foundation of China (NSFC) (grant no. 42161019) for funding.
This research has been supported by the Social and Political Affairs Office of the Education Department of Jiangxi Province (grant no. GL20116), the Education Department of Jiangxi Province (grant no. GJJ201419), and the National Natural Science Foundation of China (grant no. 42161019).
This paper was edited by Vassiliki Kotroni and reviewed by three anonymous referees.
Ahmad, I., Tang, D., Wang, T., Wang, M., and Wagan, B.: Precipitation trends over time using Mann-Kendall and spearman's rho tests in swat river basin, Pakistan, Adv. Meteorol., 2015, 431860, https://doi.org/10.1155/2015/431860, 2015.
Asadieh, B. and Krakauer, N. Y.: Global trends in extreme precipitation: climate models versus observations, Hydrol. Earth Syst. Sci., 19, 877–891, https://doi.org/10.5194/hess-19-877-2015, 2015.
Bao, J., Sherwood, S. C., Alexander, L. V., and Evans, J. P.: Future increases in extreme precipitation exceed observed scaling rates, Nat. Clim. Change, 7, 128–132, 2017.
Beck, F., Bárdossy, A., Seidel, J., Müller, T., Sanchis, E. F., and Hauser, A.: Statistical analysis of sub-daily precipitation extremes in Singapore, Journal of Hydrology: Regional Studies, 3, 337–358, 2015.
Brunetti, M., Maugeri, M., Monti, F., and Nanni, T.: Changes in daily precipitation frequency and distribution in Italy over the last 120 years, J. Geophys. Res.-Atmos., 109, 1–16, https://doi.org/10.1029/2003JD004296, 2004.
Chen, M.: Research on the Prevention and Control of Urban Rainstorm and Flood Disasters Based on the Construction of Standardization System, Opportunities for Standardization Reform and Development – The 12th China Standardization Forum, Hanzhou, 21 September 2015 (in Chinese).
Cheng, L. and AghaKouchak, A.: Nonstationary precipitation intensity-duration-frequency curves for infrastructure design in a changing climate, Sci. Rep.-UK, 4, 1–6, 2014.
Easterling, D. R., Meehl, G. A., Parmesan, C., Changnon, S. A., Karl, T. R., and Mearns, L. O.: Climate extremes: observations, modeling, and impacts, Science, 289, 2068–2074, 2000.
Easterling, D. R., Alexander, L. V., Mokssit, A., and Detemmerman, V.: CCI/CLIVAR workshop to develop priority climate indices, B. Am. Meteorol. Soc., 84, 1403–1407, 2003.
El Adlouni, S. and Ouarda, T. B. M. J.: Frequency analysis of extreme rainfall events, in: Rainfall: State of the Science, edited by: Testik, F. Y. and Gebremichael, M., American Geophysical Union (AGU), 191, 171–188, 2010.
Fernández-Montes, S., Seubert, S., Rodrigo, F., Álvarez, D. R., Hertig, E., Esteban, P., and Philipp, A.: Circulation types and extreme precipitation days in the Iberian Peninsula in the transition seasons: Spatial links and temporal changes, Atmos. Res., 138, 41–58, 2014.
Fischer, E. M., Beyerle, U., and Knutti, R.: Robust spatially aggregated projections of climate extremes, Nat. Clim. Change, 3, 1033–1038, 2013.
Gao, T. and Xie, L. A.: Study on progress of the trends and physical causes of extreme precipitation in China during the last 50 years, Advances in Earth Science, 29, 577–589, 2014 (in Chinese).
Gao, T., Wang, H. J., and Zhou, T.: Changes of extreme precipitation and nonlinear influence of climate variables over monsoon region in China, Atmos. Res., 197, 379–389, 2017.
Haylock, M. and Nicholls, N.: Trends in extreme rainfall indices for an updated high quality data set for Australia, 1910–1998, Int. J. Climatol., 20, 1533–1541, 2000.
Hosking, J. R.: L-moments: Analysis and estimation of distributions using linear combinations of order statistics, J. Roy. Stat. Soc. B, 52, 105–124, 1990.
Hosseinzadehtalaei, P., Tabari, H., and Willems, P.: Climate change impact on short-duration extreme precipitation and intensity–duration–frequency curves over Europe, J. Hydrol., 590, 125249, https://doi.org/10.1016/j.jhydrol.2020.125249, 2020.
Hu, Q., Yang, D., Wang, Y., and Yang, H.: Accuracy and spatio-temporal variation of high resolution satellite rainfall estimate over the Ganjiang River Basin, Science China Technological Sciences, 56, 853–865, 2013.
Kliche, D. V., Smith, P. L., and Johnson, R. W.: L-moment estimators as applied to gamma drop size distributions, J. Appl. Meteorol. Clim., 47, 3117–3130, 2008.
Li, J., Zhang, L., Tian, W., Guo, P., and Dong, Q.: Risk-based Study of Flood Frequency Standard for Highway Subgrade, China Journal of Highway and Transport, 27, 32–38, 2014 (in Chinese).
Li, N., Tang, G., Zhao, P., Hong, Y., Gou, Y., and Yang, K.: Statistical assessment and hydrological utility of the latest multi-satellite precipitation analysis IMERG in Ganjiang River basin, Atmos. Res., 183, 212–223, 2017.
Liu, X., Fan, S., Wang, J., and Xu, C.: Analysis on Meteorological Characteristics of a Strong Storm Disasters in the Eastern Foot of Longmen Mountain, Journal of Catastrophology, 33, 102–110, 2018.
López-Moreno, J. and Beniston, M.: Daily precipitation intensity projected for the 21st century: seasonal changes over the Pyrenees, Theor. Appl. Climatol., 95, 375–384, 2009.
Loucks, D. P., Van Beek, E., Stedinger, J. R., Dijkman, J. P. M., and Villars, M. T.: Water Resources Systems Planning and Management: An Introduction to Methods, Models and Applications, Springer Cham, 624 pp., https://doi.org/10.1007/978-3-319-44234-1, 2005.
Marelle, L., Myhre, G., Hodnebrog, Ø., Sillmann, J., and Samset, B. H.: The changing seasonality of extreme daily precipitation Geophys. Res. Lett., 45, 11352–11360, https://doi.org/10.1029/2018GL079567, 2018.
Merino, A., Fernández‐Vaquero, M., López, L., Fernández‐González, S., Hermida, L., Sánchez, J. L., García‐Ortega, E., and Gascón, E.: Large‐scale patterns of daily precipitation extremes on the Iberian Peninsula, Int. J. Climatol., 36, 3873–3891, 2016.
Merino, A., Fernández-González, S., García-Ortega, E., Sánchez, J. L., López, L., and Gascón, E.: Temporal continuity of extreme precipitation events using sub-daily precipitation: application to floods in the Ebro basin, northeastern Spain, Int. J. Climatol., 38, 1877–1892, 2018.
Mukherjee, S., Aadhar, S., Stone, D., and Mishra, V.: Increase in extreme precipitation events under anthropogenic warming in India, Weather and Climate Extremes, 20, 45–53, 2018.
Müller, M. and Kaspar, M.: Event-adjusted evaluation of weather and climate extremes, Nat. Hazards Earth Syst. Sci., 14, 473–483, https://doi.org/10.5194/nhess-14-473-2014, 2014.
Myhre, G., Alterskjær, K., Stjern, C. W., Hodnebrog, Ø., Marelle, L., Samset, B. H., Sillmann, J., Schaller, N., Fischer, E., and Schulz, M.: Frequency of extreme precipitation increases extensively with event rareness under global warming, Sci. Rep.-UK, 9, 1–10, 2019.
National Meteorological Information Center (NMIC): Basic Meteorological Observation Data of China, NMIC [data set], China, http://data.cma.cn/data/detail/dataCode/A.0012.0001.html, last access: 13 March 2023.
O'Gorman, P. A. and Schneider, T.: The physical basis for increases in precipitation extremes in simulations of 21st-century climate change, P. Natl. Acad. Sci. USA, 106, 14773–14777, https://doi.org/10.1073/pnas.0907610106, 2009.
Pachauri, R. K., Allen, M. R., Barros, V. R., Broome, J., Cramer, W., Christ, R., Church, J. A., Clarke, L., Dahe, Q., and Dasgupta, P., Pachauri, R. K., and Meyer, L. (Eds.): Climate change 2014: synthesis report. Contribution of Working Groups I, II and III to the fifth assessment report of the Intergovernmental Panel on Climate Change, IPCC, Geneva, Switzerland, 151 pp., 2014.
Papalexiou, S. M., Koutsoyiannis, D., and Makropoulos, C.: How extreme is extreme? An assessment of daily rainfall distribution tails, Hydrol. Earth Syst. Sci., 17, 851–862, https://doi.org/10.5194/hess-17-851-2013, 2013.
Pendergrass, A. G.: What precipitation is extreme?, Science, 360, 1072–1073, 2018.
Pendergrass, A. G. and Hartmann, D. L.: Changes in the Distribution of Rain Frequency and Intensity in Response to Global Warming, J. Climate, 27, 8372–8383, 2014.
Pfahl, S., O'Gorman, P. A., and Fischer, E. M.: Understanding the regional pattern of projected future changes in extreme precipitation, Nat. Clim. Change, 7, 423–427, 2017.
REN, G., LIU, Y., SUN, X., ZHANG, L., Yuyu, R., Ying, X., Hua, Z., Yunjian, Z., Tao, W., and Yanjun, G.: Spatial and temporal patterns of precipitation variability over mainland China: III.: causes for recent trends, Advances in Water Science, 27, 327–348, 2016 (in Chinese).
Ren, Z., Zhang, M., Wang, S., Zhu, X., Dong, L., and Qiang, F.: Changes in precipitation extremes in South China during 1961–2011, Acta Geographica Sinica, 69, 640–649, 2014 (in Chinese).
Rodrigo, F.: Changes in the probability of extreme daily precipitation observed from 1951 to 2002 in the Iberian Peninsula, Int. J. Climatol., 30, 1512–1525, 2010.
Saidi, H., Ciampittiello, M., Dresti, C., and Ghiglieri, G.: Assessment of trends in extreme precipitation events: a case study in Piedmont (North-West Italy), Water Resour. Manag., 29, 63–80, 2015.
Şen, Z. and Eljadid, A. G.: Rainfall distribution function for Libya and rainfall prediction, Hydrolog. Sci. J., 44, 665–680, 1999.
Shan, J., Zhang, Y., and Zhang, Y.: Features analysis about weather system to five river basins of Jiangxi province and important precipitation procedure, Jiangxi Meteorological Science & Technology, 24, 14–18, https://doi.org/10.3969/j.issn.1007-9033.2001.01.003, 2001.
Shi, P., Kong, F., and Fang, J.: Spatio-temporal Patterns of China Decadal Storm Rainfall, Scientia Geographica Sinica, 34, 1281–1290, 2014 (in Chinese).
Sillmann, J., Kharin, V. V., and Zhang, X. B.: Climate extremes indices in the CMIP5 multi-model ensemble: Part 1, J. Geophys. Res.-Atmos., 118, 1–18, 2013.
Soro, G. E., Noufé, D., Goula Bi, T. A., and Shorohou, B.: Trend analysis for extreme rainfall at sub-daily and daily timescales in Côte d’Ivoire, Climate, 4, 37–52, 2016.
Sun, Y. and Stein, M. L.: A stochastic space-time model for intermittent precipitation occurrences, Ann. Appl. Stat., 9, 2110–2132, 2015.
Tabari, H.: Climate change impact on flood and extreme precipitation increases with water availability, Sci. Rep.-UK, 10, 1–10, 2020.
Tabari, H. and Willems, P.: Lagged influence of Atlantic and Pacific climate patterns on European extreme precipitation, Sci. Rep.-UK, 8, 1–10, 2018.
Talchabhadel, R., Karki, R., Thapa, B. R., Maharjan, M., and Parajuli, B.: Spatio-temporal variability of extreme precipitation in Nepal, Int. J. Climatol., 38, 4296–4313, 2018.
Trenberth, K. E.: Conceptual framework for changes of extremes of the hydrological cycle with climate change, Climatic Change, 42, 327–339, https://doi.org/10.1023/A:1005488920935, 1999.
Trenberth, K. E., Zhang, Y., and Gehne, M.: Intermittency in precipitation: Duration, frequency, intensity, and amounts using hourly data, J. Hydrometeorol., 18, 1393–1412, 2017.
Trenberth, K. E., Dai, A., Rasmussen, R. M., and Parsons, D. B.: The changing character of precipitation, B. Am. Meteorol. Soc., 84, 1205–1218, 2003.
Vivekanandan, N.: Flood frequency analysis using method of moments and L-moments of probability distributions, Cogent Engineering, 2, 1018704, https://doi.org/10.1080/23311916.2015.1018704, 2015.
Wang, Q.: Direct sample estimators of L moments, Water Resour. Res., 32, 3617–3619, 1996.
Wang, X. L.: Accounting for autocorrelation in detecting mean shifts in climate data series using the penalized maximal t or F test, J. Appl. Meteorol. Clim., 47, 2423-2444, 2008.
Wang, X. L., Chen, H., Wu, Y., Feng, Y., and Pu, Q.: New techniques for the detection and adjustment of shifts in daily precipitation data series, J. Appl. Meteorol. Clim., 49, 2416–2436, 2010.
Westra, S., Alexander, L. V., and Zwiers, F. W.: Global Increasing Trends in Annual Maximum Daily Precipitation, J. Climate, 26, 3904–3918, 2013.
Wu, J., Zhou, B., and Xu, Y.: RESPONSE OF PRECIPITATION AND ITS EXTREMES OVER CHINA TO WARMING: CMIP5 SIMULATION AND PROJECTION, Chinese J. Geophys.-CH., 58, 3048–3060, 2015 (in Chinese).
Wu, X., Guo, S., Yin, J., Yang, G., Zhong, Y., and Liu, D.: On the event-based extreme precipitation across China: Time distribution patterns, trends, and return levels, J. Hydrol., 562, 305–317, 2018.
Xiao, C., Wu, P., Zhang, L., and Song, L.: Robust increase in extreme summer rainfall intensity during the past four decades observed in China, Sci. Rep.-UK, 6, 1–9, 2016.
Xu, K., Ma, C., Lian, J., and Bin, L.: Joint probability analysis of extreme precipitation and storm tide in a coastal city under changing environment, PLoS One, 9, e109341, https://doi.org/10.1371/journal.pone.0109341, 2014.
Yin, J., Kim, M., Feng, K., and Chen, J.: Comparative Analysis of Three Typhoons Hitting Jiangxi on Routes and Mechanisms of Heavy Rainfall, Meteorology And Disaster Reduction Research, 30, 18–22, 2007.
Yin, Z. E., Tian, P., and Chi, X.: Multi-scenario-based risk analysis of precipitation extremes in China during the past 60 years (1951–2011), Acta Geographica Sinica, 73, 405–413, 2018 (in Chinese).
Zeng, Y. and Lu, E.: Changes of Summer Rainfall and Extreme Precipitation During 1961–2010 in China, Climate Change Research, 11, 79-85, 2015 (in Chinese).
Zhang, D. and Song, W.: Northern Hemisphere Atmospheric Circulation Characteristics in 2017/2018 Winter and Its Impact on Weather and Climate in China, Meteorological Monthly, 44, 969–976, 2018.
Zhao, Y., Xiao, D., and Bai, H.: Projection and Application for Future Climate in China by CMIP5 Climate Model, Meteorological Science and Technology, 47, 608–621, 2019 (in Chinese).