the Creative Commons Attribution 4.0 License.
the Creative Commons Attribution 4.0 License.
 | 06 Mar 2023
Inferring the depth and magnitude of pre-instrumental earthquakes from intensity attenuation curves
Pierfrancesco Burrato
Valerio De Rubeis
Patrizia Tosi
Gianluca Valensise
Roberto Vallone
Paola Vannoli
The Italian historical earthquake record is among the richest worldwide; as such it allows for the development of advanced techniques for retrieving quantitative information by calibration with recent earthquakes. Building on a pilot elaboration of northern Italian earthquakes, we developed a procedure for determining the hypocentral depth of all Italian earthquakes from macroseismic intensity data alone. In a second step the procedure calculates their magnitude, taking into account the inferred depth.
Hypocentral depth exhibits substantial variability countrywide but has so far received little attention: pre-instrumental earthquakes were routinely “flattened” at the upper-crustal level (∼10 km), on the grounds that the calculation of hypocentral depth is heavily dependent on the largely unknown local propagation properties.
We gathered a learning set of 42 earthquakes documented by reliable instrumental data and by numerous macroseismic intensity observations. We observe (1) that within 50 km from the epicenter the ground motion attenuation rate is primarily controlled by hypocentral depth and largely independent of magnitude, (2) that within this distance the fluctuations in crustal attenuation properties are negligible countrywide, and (3) that knowing both the depth and the expected epicentral intensity makes it possible to estimate a reliable magnitude.
- Article
(7503 KB) - Full-text XML
-
Supplement
(11506 KB) - BibTeX
- EndNote


In addition to earthquake magnitude, the severity of seismic ground shaking at any given site is primarily controlled by its geometric spreading; by elastic and anelastic attenuation of the upper-crustal rocks; and by hypocentral distance, i.e., the combination of horizontal distance from the epicenter and earthquake depth. Other parameters controlling the ground shaking include the earthquake radiation pattern; the rupture directivity, if any; and the inevitable site amplification effects.
When dealing with damaging instrumental earthquakes, the magnitude, depth, and focal mechanism – which in its turn determines the radiation pattern – are generally known, and even the rupture directivity may be at least hypothesized if the recording network is dense enough. Things change drastically when dealing with historical earthquakes. For the vast majority of these events the severity of shaking is expressed by the macroseismic intensity reported at a number of sites, a proxy for a set of accelerometric records (Worden et al., 2012); for all the other parameters we can only make “informed inferences”.
Nevertheless, given the limited length of the available instrumental record, historical earthquakes are the primary source of information for the assessment of seismic hazard, at any scale and with any approach. Historical catalogues are especially relevant for assessing seismic hazard in Italy (e.g., Meletti et al., 2021), a country where average recurrence intervals for damaging earthquakes generated by individual sources are very long if compared with the length of the instrumental record (e.g., Galli, 2020) but where the historical record of the effects of strong ground shaking is extraordinarily long, spanning over a millennium (Guidoboni et al., 2019). For all of these reasons, it is crucial to establish what information can be actually derived from intensity patterns and how reliable this information is.
Italy affords a unique opportunity to explore what type of information can be realistically derived from intensity data. In the early 1990s, macroseismic intensity data started being organized into analytical historical catalogues (see the Catalogue of Strong Earthquakes in Italy, CFTI, Boschi et al., 1995, 2000; Guidoboni et al., 2019, 2018), i.e., computer databases where all available individual intensity reports were stored in an orderly fashion, ready to be used for automatic and reproducible elaboration. Later on, the implementation of efficient, Internet-based data acquisition platforms has allowed the systematic investigation of intensity observations also at weak-motion levels, opening new avenues in the interpretation of seismic-wave propagation and site response. Over the past 15 years, the platform Hai Sentito Il Terremoto (HSIT, Tosi et al., 2007; Sbarra et al., 2019b; De Rubeis et al., 2019) has collected over 1 290 000 “felt” reports supplied by ordinary people for Italian earthquakes of any size, mostly for weak motions.
Starting at the end of the 1990s and following the inception of analytical historical catalogues, different workers developed computer algorithms for calculating the earthquake location, its magnitude, and even the presumed rupture orientation and length, for many well-documented pre-instrumental earthquakes (e.g., Musson, 1996; Bakun and Wentworth, 1997; Gasperini et al., 1999; Bakun et al., 2003; Bakun and Scotti, 2006; Sirovich et al., 2013).
Unlike instrumental data, which offer a variety of relevant independent observations (arrival times, amplitudes, phase delays), historical earthquake data are essentially mono-variable, meaning that all seismological parameters must be inferred from the same observations: the earthquake macroseismic intensities. Nevertheless, the spatial variation in intensities allows for some of the source parameters to be derived. Within this line of research, Sbarra et al. (2019a) proposed a method for estimating the depth of pre-instrumental earthquakes of northern Italy, whereas other works (e.g., Valensise et al., 2020) explored the possibility of inferring from intensity data also an indication of rupture directivity.
Aside from the inevitable uncertainties that may arise from such a limited and often poorly distributed dataset, the mono-variable nature of the data inevitably leads to the existence of a trade-off among magnitude and depth because a deeper earthquake will generate less shaking and may thus simply appear as a smaller event. In most cases the magnitude has been estimated without considering the depth or by fixing it in advance. Other methods were based on a joint inversion of intensity data to obtain magnitude and depth (Traversa et al., 2018; Provost and Scotti, 2020). In any case, depth affects the observed macroseismic intensity and thus the magnitude estimation of any earthquake (Jánosi, 1906; Kövesligethy, 1907; Blake, 1941; Sponheuer, 1960; Ambraseys, 1985; Burton et al., 1985; Levret et al., 1996; Musson, 1996).
Gasperini et al. (1999) and Gasperini (2001) were certainly aware of these trade-offs (for example, see the discussion in Appendix 2 of Gasperini et al., 1999) but chose not to take countermeasures to minimize their impact. And since the learning set used for calibrating their method included almost exclusively instrumental earthquakes that ruptured within the shallowest portion of the crust, the magnitude values supplied by their method are accurate only for earthquakes occurring in that specific depth interval. Given the large variability in earthquake depth – in Italy as much as elsewhere – determining a reliable magnitude requires that earthquake depth be properly taken into account, especially in the case of lower-crustal or subcrustal events.
At least in Italy, the limited consideration of the depth variability of damaging crustal earthquakes (in this work we are not concerned with subduction zone events) has often been explained with the inherent difficulty in evaluating the depth of historical earthquakes, motivated by an allegedly large variability in the propagation characteristics of the upper crust (e.g., Mele et al., 1997). Due to the known trade-off between earthquake depth and the properties of seismic-wave propagation, this viewpoint – and the resulting decision to fix the depth of historical earthquakes – led the natural variability in earthquake depth to be mapped in terms of variability in crustal properties. For all of these reasons, it is important to use a method capable of estimating depth and magnitude separately.
Building on the findings of Sbarra et al. (2019a), in this work we characterize the depth and the magnitude of Italian pre-instrumental earthquakes, in particular the following:
-
First we extend the experimental method put forward by these investigators to the whole Italian territory and to the whole pre-1984 earthquake catalogue (CPTI15 v2.0, the Parametric Catalogue of Italian Earthquakes, Rovida et al., 2019, 2020). This method was shown to be independent of magnitude, meaning that the steepness of the attenuation curve calculated within 50 km (+5 km buffer) from the epicenter is not affected by earthquake size but only by earthquake depth.
-
We then develop a scheme for objectively ranking the quality of an intensity dataset and hence for selecting only earthquakes that are suitable for calculating a reliable source depth.
-
Similarly to what was done by Sbarra et al. (2019a) for a northern Italian dataset, we derive equations describing the steepness of the attenuation curve versus earthquake focal depth from a learning set, i.e., a set of relatively recent Italian earthquakes for which both instrumental and macroseismic observations are available. We then use these equations to estimate the depth of the pre-instrumental events comprising our analyzed set.
-
Finally, from the data from the learning set we derive a multiple regression equation relating expected epicentral intensity to magnitude and hypocentral depth so as to estimate also the magnitude of pre-instrumental earthquakes.
Notice that the approach we adopted in this work was specifically designed for analyzing also higher-magnitude earthquakes (Mw≥6.75), based on
-
the awareness that their causative fault cannot be assumed to be a point source;
-
the awareness that they are often characterized by sizable directivity effects; and
-
empirical relationships (e.g., Wells and Coppersmith, 1994), for which the 55 km maximum distance we adopted in our analysis is comparable to the expected length of the causative source of such larger events.
In the process we aim to (a) use our learning set to evaluate the properties of wave propagation (within 50 km of the epicenter) in the crust versus the variability in source depth, exploring the trade-off between these two parameters in different tectonic settings, and (b) discuss the potential implications of these developments for the estimation of seismic hazard. The inferred distribution of earthquake depth may have important seismotectonic implications, but these are beyond the scope of this work and will be discussed in a further, dedicated paper.
The Italian Peninsula is located along the complex Africa–Europe convergent plate boundary. Due to this complexity, the causative sources of Italian earthquakes exhibit highly variable kinematics and geometrical parameters, as shown by focal mechanisms (Pondrelli et al., 2020) and active stress indicators (Italian Present-day Stress Indicators, IPSI database, Mariucci and Montone, 2020) and as summarized by the Database of Individual Seismogenic Sources (DISS) (Basili et al., 2008; DISS Working Group, 2021), more specifically the following:
-
Normal faulting dominates along the hinge of the Apennines chain and in the Calabrian Arc.
-
Thrust and reverse faulting are widespread along the external fronts of the southern Alps and of the northern and central Apennines, in the northern and southern Tyrrhenian domain, and in the Sicilian–Maghrebian Chain.
-
Strike-slip faulting is found in northeastern Italy, in the most external portions of the central and southern Apennines, and in the corresponding foreland areas (Fig. 1).

Figure 1Location of the 42 earthquakes of the learning set used in this work and regional-scale tectonic information from the DISS database (DISS Working Group, 2021). The areas with different patterns indicate active tectonic domains that exist in the Italian Peninsula and surrounding areas (from Vannoli et al., 2021). The learning set includes earthquakes that occurred in northern Italy, shown in blue (Table 1, IDs 1 to 20 and 23), and in central and southern Italy, shown in red (Table 1, IDs 21 to 42, except for 23).
In addition, an active slab related to the subduction of the Ionian lithosphere exists below the Calabrian Arc: the slab is bounded by tear faults along its edges (Maesano et al., 2017, 2020).
The active faults and seismogenic sources identified so far in the Italian region belong both to extensional or compressional fault systems that formed during the presently active stress regime (new faults) and to structures that formed during previous tectonic phases and were later reactivated with different kinematics (inherited faults). While the new faults cut through the Alps and Apennines fold-and-thrust belts at relatively shallow depth and are the expression of the ongoing compressional activity or extension due to back-arc stretching or ridge-top collapse, the inherited faults are generally rooted at deeper depth in the crust of the lower plate and are reactivated mostly with compressional and transcurrent faulting mechanisms. Their depth generally increases moving from the foreland areas, where they may be exposed at the surface (e.g., the Mattinata and Scicli-Ragusa fault systems in the Adriatic and Hyblean foreland areas; Di Bucci et al., 2010), towards the axes of the chain, following the increasing depth of the regional foreland monocline.
The inherited faults have been interpreted either as Mesozoic extensional structures characterizing the African northern passive margin and separating fossil paleogeographic domains (e.g., Scardia et al., 2015) or as long-lived faults of various origin, often perpendicular to the architecture of the more recent thrust belts (Zampieri et al., 2021). In addition to this general rule, the recent 2016 central Italy earthquake sequence has shown that also some large and older thrust faults occurring close to the extensional hinge of the chain may be negatively reactivated if favorably oriented with respect to the current stress field, thus becoming the causative sources of significant normal-faulting earthquakes (Bonini et al., 2019; Buttinelli et al., 2021).
Finally, further evidence of the seismotectonic complexity of the Italian region is supplied by the control exerted by the inherited structural and paleogeographic grain of the African paleomargin, which resulted in the segmentation and differential retreat of independent panels of the “foreland monocline”, i.e., of the subducting Adriatic, Ionian, and Pelagian lithosphere (Mariotti and Doglioni, 2000; Scrocca et al., 2007). As a result of this process, major discontinuities perpendicular to the main structural trends of the Apennines fold-and-thrust belt developed at the boundaries of different foreland monocline panels (e.g., Rosenbaum and Piana Agostinetti, 2015; Vannoli et al., 2015); these discontinuities are highlighted by alignments of geofluid emissions and earthquake swarms (Vannoli et al., 2021), often characterized by transcurrent mechanisms and generally located at deeper depth with respect to the new faults, either extensional or compressional.
As a result of this framework, Italian earthquakes exhibit an unusually broad depth range, mainly as a function of their faulting mechanism and of their location in the upper or lower plate (e.g., Chiarabba and De Gori, 2016). They can be grouped in at least four independent depth classes:
-
very shallow in the active volcanic areas of the peri-Tyrrhenian margin and of Sicily (≤5 km),
-
shallow (<15 km depth) in both the internal and external domains of the orogen,
-
shallow–intermediate (>15 km) in the foreland areas and along large lithospheric tears cutting through the Adriatic monocline and the Apennines (Vannoli et al., 2015),
-
deep (up to 600 km depth) in the subduction system below the Calabrian Arc (Chiarabba et al., 2008).
The earthquakes generated by the new faults and by the inherited faults are often geographically overlapped, as seen in the Po Plain (Sbarra et al., 2019a), which makes their seismotectonic interpretation rather difficult if only the epicentral location is available. Conversely, assigning each pre-instrumental earthquake to a specific depth class helps assigning that event to its relevant domain, thus greatly supporting its seismotectonic interpretation and the calculation of accurate global earthquake budgets and rates.
We updated and extended the method proposed in Sbarra et al. (2019a) to make it suitable for use on earthquakes over the entire Italian Peninsula through an automated procedure.
We adopt a distance binning method, and we use only well-located instrumental earthquakes (see Sect. 3.1). We first calculate the intensity average of individual macroseismic data points (MDPs) falling within 10 km wide ring-shaped moving windows so as to obtain an intensity attenuation curve interpolating the resulting 10 average-intensity points. In most cases the trend of this curve shows an abrupt drop in the attenuation beyond an epicentral distance of about 50 km, as described in Fah and Panza (1994) and Gasperini (2001) and empirically observed by Sbarra et al. (2019a) for earthquakes in northern Italy. For this reason, we calculate the steepness of the line that best fits only the first 50 km of the attenuation curve.
A further issue concerns the treatment of intensity data as integers or real numbers. When estimating macroseismic intensity, all potential diagnostic effects are jointly evaluated to assess which degree of the scale best matches those effects. Typically, however, the effects may belong to contiguous degrees: this circumstance results from multiple reasons, including the geological nature of the outcropping lithology near building foundations; differences in the vulnerability of adjacent buildings; or – for the lowest shaking levels – differences in the perception of seismic vibration depending on the number of stories comprising the building, on whether the observer is still or is moving, and so on (Sbarra et al., 2012, 2014; Oliveira and Ferreira, 2021). Estimation of the shaking effects is even more uncertain for older earthquakes and when only few historical sources are available. The resulting macroseismic intensity is an integer, although the half degree is often used even in direct field surveys in the case of uncertainty between two contiguous degrees. This latter approach implies that intensity values must be processed as real numbers and that an uncertain assessment is either approximated to a half integer, as proposed by Gasperini (2001), or simply discarded from the dataset, as proposed by Albarello and D'Amico (2004). Nevertheless, assigning macroseismic intensities using web-based questionnaires entails greater precision because it involves using decimal intensities rather than simply integer values (Wald et al., 2006). It has been demonstrated that this procedure leads to less scatter than if the calculated intensities were truncated to integers (e.g., Dengler and Dewey, 1998; Dewey et al., 2002). Web-based macroseismic data are decimal intensities, while the historical catalogues include half-degree intensities.
In the following step we plot the instrumental depth of the earthquakes used as a learning set versus the steepness of the attenuation curve. By fitting these values we obtain a logarithmic function that is then used for the last step, that is, to infer the depth of the non-instrumental earthquakes of our analyzed set.
Notice that the radius of our ring-shaped moving windows is now calculated from the instrumental earthquake epicenter rather than based on the distance from the epicenter of the innermost MDP within the first 10 km, as proposed by Sbarra et al. (2019a). This minor update makes the algorithm more uniform across the full earthquake magnitude range and avoids a differential shifting from the epicenter for each earthquake (according to the actual distance of the closest MDP from the epicenter). The new approach is summarized in Fig. 2 with reference to a specific recent earthquake (20 May 2012; ID 13 of Table 1). After drawing the first 10 km wide, circular search area centered in the instrumental epicenter (for all events in the learning set) and the following nine 10 km wide ring-shaped search areas, each one shifted by 5 km from the previous one (0–10, 5–15, 10–20, 15–25, 20–30, 25–35, 30–40, 35–45, 40–50, and 45–55 km; magenta and purple lines in Fig. 2b), up to the distance of 55 km from the epicenter, the resulting 10 averaged MDPs intensities are used to build the attenuation diagram (Fig. 2c). Subsequently, using the data from the learning set we derive a multiple regression equation to calculate the magnitude of the historical earthquakes.
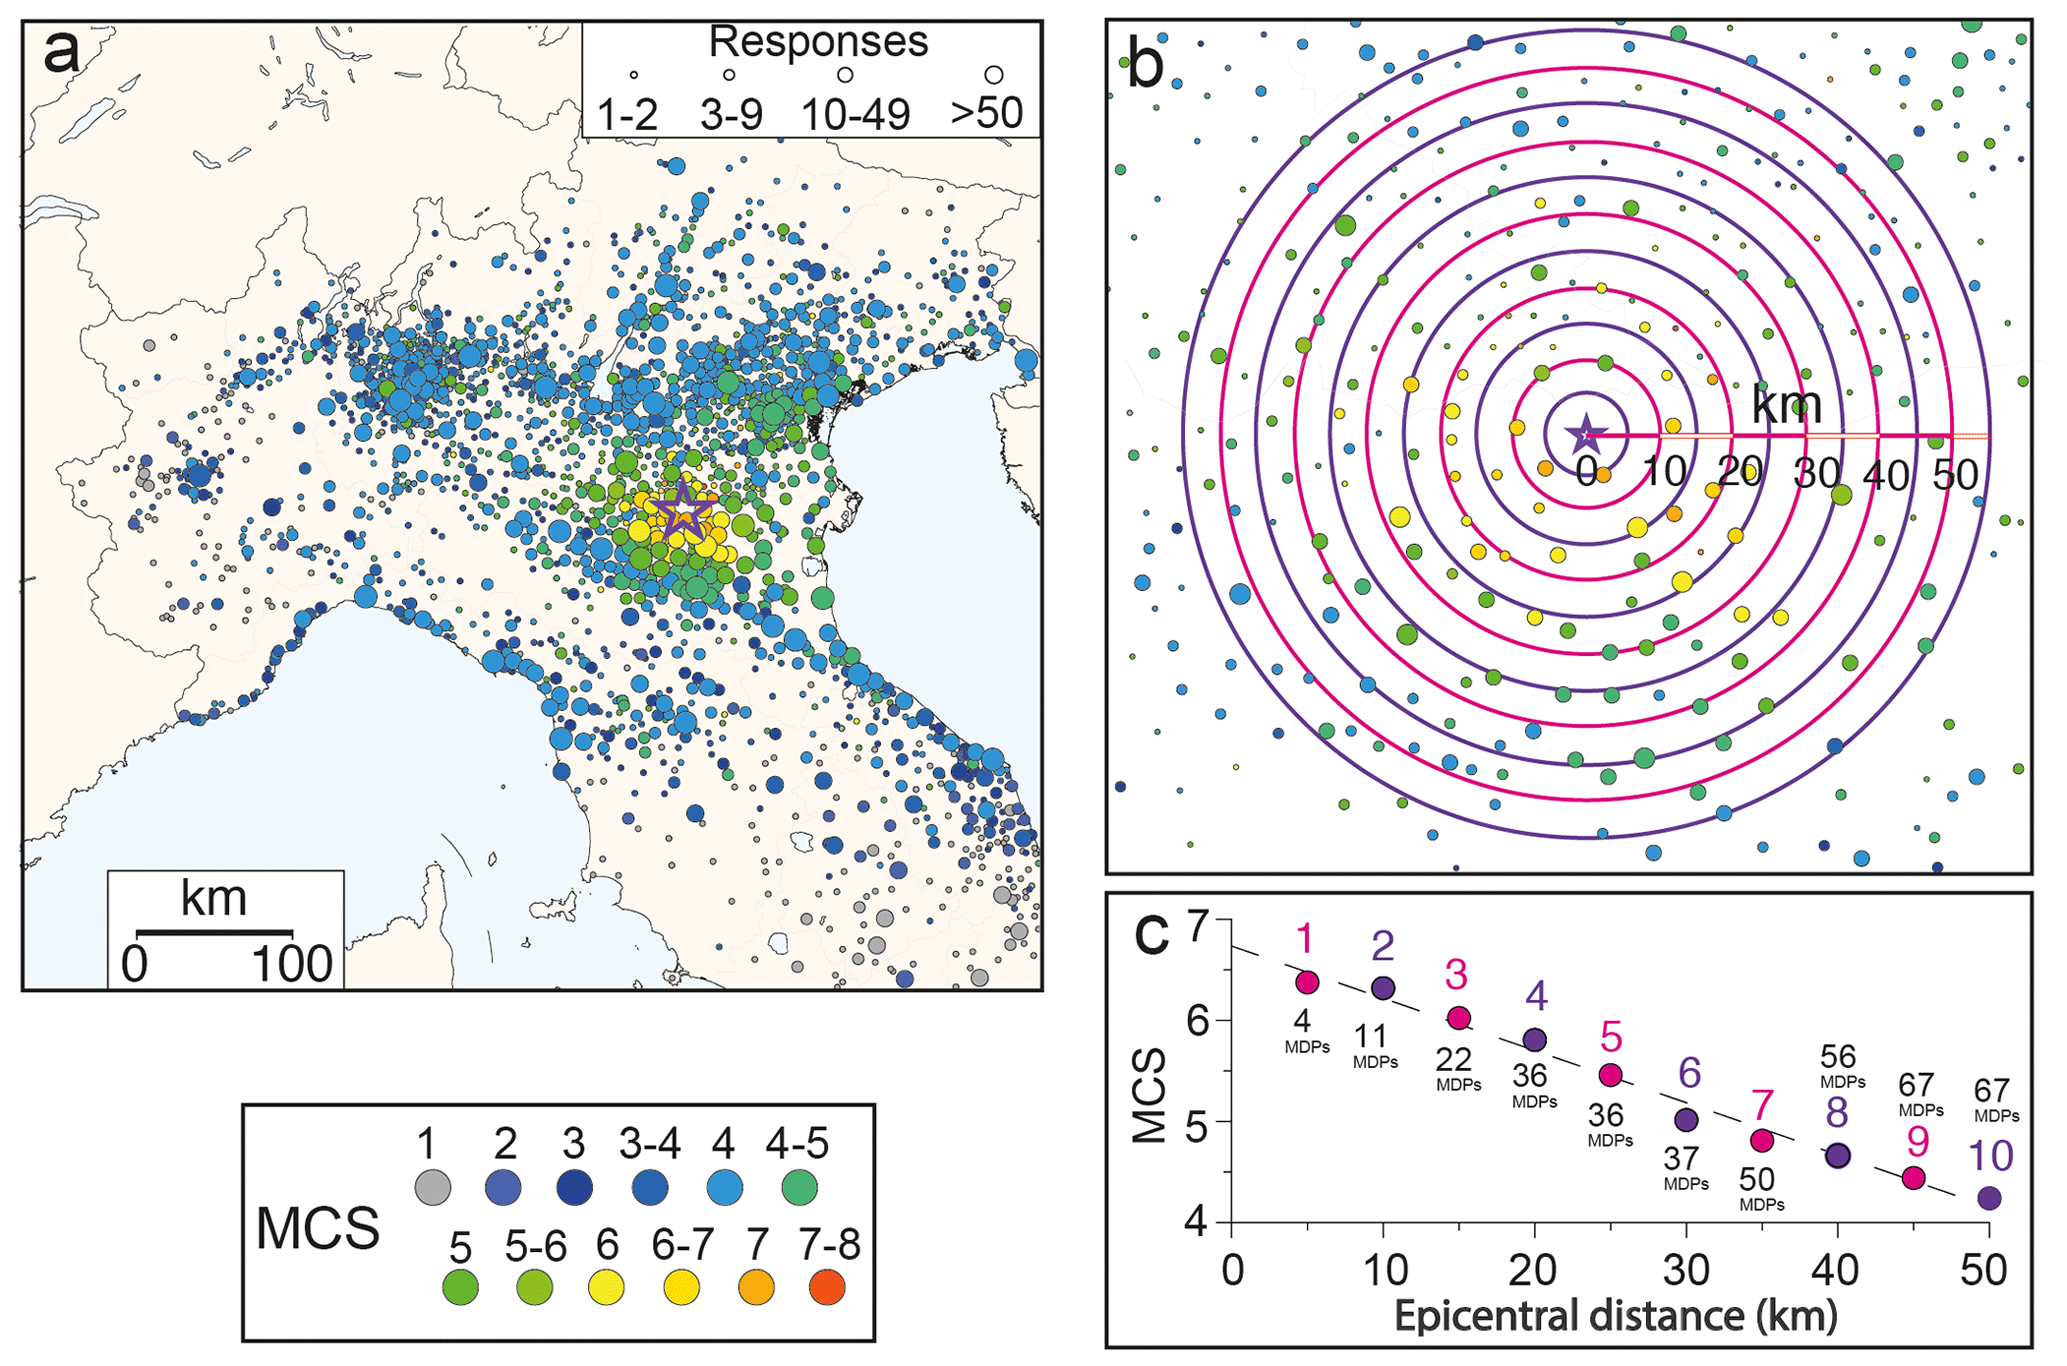
Figure 2Workflow of the moving-window procedure. (a) Macroseismic field of the 20 May 2012 earthquake (ID 13 in Table 1) from the HSIT database (available at https://e.hsit.it/772691/index.html, last access: 22 December 2022). The highest intensities are shown in the foreground. (b) Map showing the first 50 km from the instrumental epicenter and the 10 ring-shaped search areas centered in the instrumental epicenter (shown by magenta and purple lines), each one shifted by 5 km with respect to the previous one. (c) Plot of the 10 intensity values obtained averaging the MDPs falling in each of the rings, with no. 1 reporting the average intensity calculated for the 0–10 km search area, no. 2 reporting the average intensity for the 5–15 km search area, and so on.
Table 1Full learning set used for this work. Event no. 1 to no. 20 occurred in northern Italy and were already used in the pilot work by Sbarra et al. (2019a). Latitude and longitude source parameters have been instrumentally obtained and derived from the CPTI15 v2.0 catalogue (Rovida et al., 2019). Uncertainties about the epicenter location of longitude and latitude reach a maximum value of ±2 and can be found in the ISIDe catalogue (Italian Seismological Instrumental and Parametric Database; ISIDe Working Group, 2007). In the header, “Mw” is the moment magnitude, “Long” and “Lat” are the epicentral coordinates, “Depth unc” is the hypocentral depth uncertainty, “SE” is the standard error of the attenuation steepness, and “IE” is the expected intensity at the epicenter. The unit of the steepness and of the SE is intensity per kilometer. Italian CMT: Italian centroid–moment–tensor database.
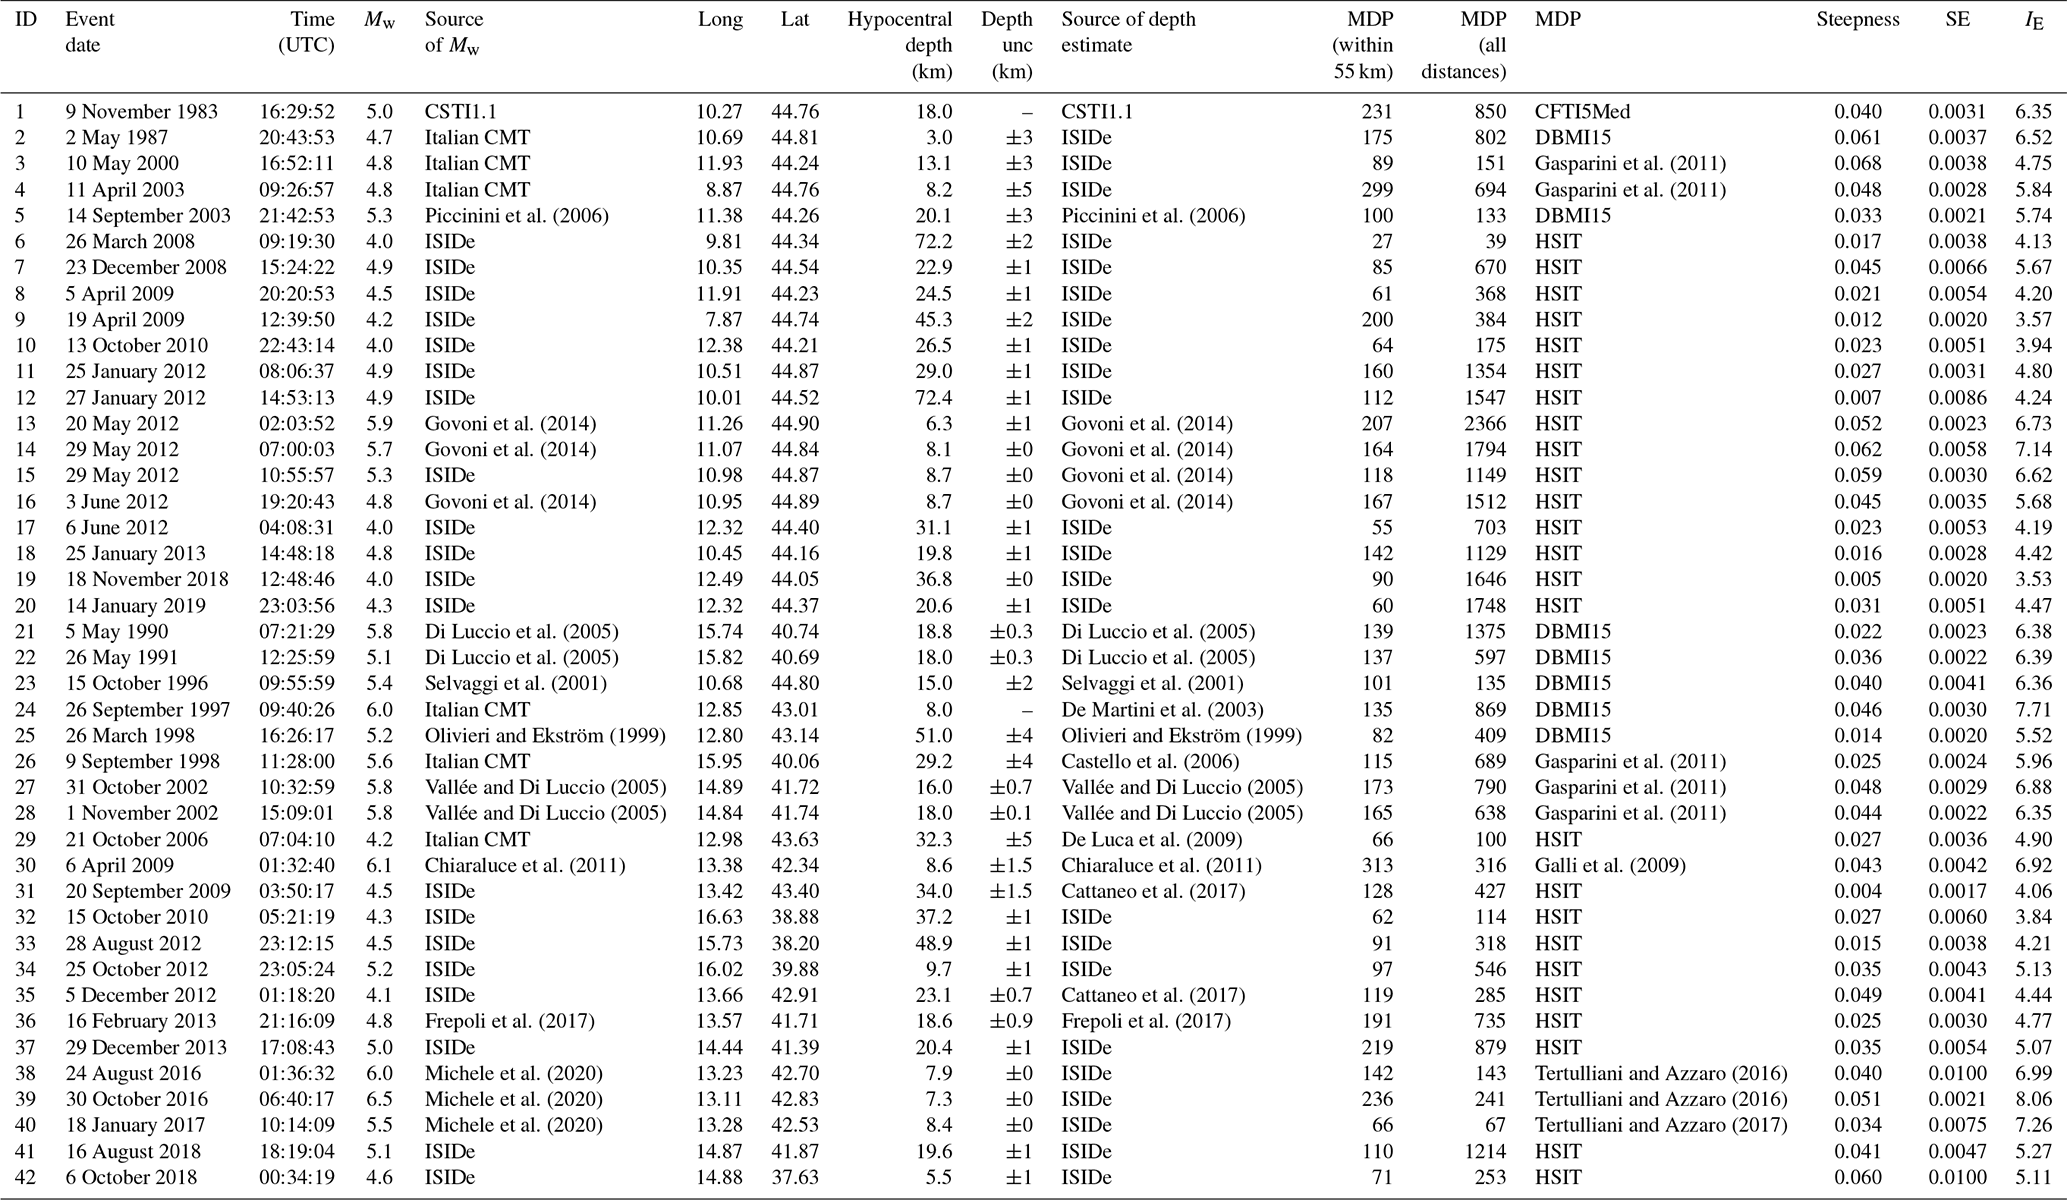
3.1 Data selection criteria
To compose our learning set (Table 1) we searched the whole Italian territory, selecting all instrumentally well-documented earthquakes, i.e., events whose location uncertainties are small and that also feature good-quality macroseismic information. For each event the best available source was chosen by expert evaluation based on all available literature sources; Table 1 reports the exact bibliographic source of its depth and magnitude. Whenever a specific study about a given earthquake exists, we used the relocated depth (if available). We built a learning set comprising macroseismic data either obtained from a direct survey or collected through the web so as to gather information to be used as a sort of “Rosetta Stone” for obtaining the parameters of historical earthquakes. For pre-2008 events we used the data stored in the DBMI15 v2.0 catalogue (Italian Macroseismic Database; Locati et al., 2019), a compilation of macroseismic intensities for Italian earthquakes that occurred in the time window 1000–2017 CE, whereas for more recent events of Mw≤5.9 we used either intensity data from the web-based HSIT catalogue (Tosi et al., 2007; De Rubeis et al., 2019; Sbarra et al., 2019b) or the MDPs collected by targeted post-earthquake surveys conducted by experienced INGV QUEST personnel (Istituto Nazionale di Geofisica e Vulcanologia QUick Earthquake Survey Team; https://quest.ingv.it/index.php/rilievi-macrosismici; last access: 21 February 2023). Only for the 18 January 2017 Mw 5.5 event we had to make an exception to this rule, due to the incompleteness of HSIT data caused by the evacuations following the Mw 6.0 mainshock of 24 August 2016.
The use of web-based data was fundamental to accomplishing our goals because these data were almost always the only observations available, especially for deeper earthquakes (>30 km). Furthermore, the use of macroseismic data obtained from direct surveys of earthquake damage was fundamental for the correct analysis of the attenuation curves, especially in the epicentral area. The combination of web-based HSIT data and dedicated traditional studies does not affect the results of the learning set because the earthquakes that we considered are all relatively recent and their macroseismic field was estimated through a direct field survey. In general, intensity maps drawn for historical earthquakes show more scattered patterns of damage than those revealed by spatially rich, web-based intensity data for similar-sized, recent events (Hough, 2013, 2014). This problem particularly affects earthquakes whose effects are estimated through written sources. The same is true if only written sources (e.g., newspapers) are used to estimate the intensities of recent earthquakes; they will inevitably end up being overestimated (Sbarra et al., 2010; Hough, 2014).
The events comprising the learning set were further selected based on the following criteria:
- 1.
Pre-2007 earthquakes must have Mw≥5.0, but events of Mw≥4.5 are also accepted if they are backed by a targeted study.
- 2.
Post-2007 earthquakes must have Mw≥4.0 if their depth is >25 km or Mw≥4.5 if their depth is ≤25 km.
- 3.
The earthquake depth must not have been fixed a priori by INGV's National Seismic Network.
- 4.
Only for pre-2012 earthquakes, the event must not be an aftershock occurring within a week of the mainshock or a foreshock that occurred less than 24 h before the mainshock.
- 5.
All earthquakes with Mw≤5.8 must not be aftershocks of the central Italy sequence of 2016.
- 6.
The earthquake must be documented by at least 100 MDPs, at least 60 of which must fall within the first 55 km from the epicenter.
- 7.
The MDPs falling at a 10–55 km distance from the epicenter must be distributed in an azimuthal range ≥180∘.
- 8.
The attenuation steepness must be calculated based on six or more averaged points; thus at least 6 of the 10 rings must contain suitable MDPs.
- 9.
The standard error of the estimated attenuation steepness must be ≤0.01.
All 42 earthquakes listed in Table 1 fulfill these rather strict criteria with the only exception being no. 6 and no. 17 (MDP <60), two deeper events that were already included in the learning set of Sbarra et al. (2019a) as they are crucial for characterizing lower-crustal and subcrustal seismicity.
Notice that selection criteria 1–4 had already been adopted by Sbarra et al. (2019a). Additional criteria 5 through 9 were added in consideration that the present work deals with the entire Italian territory and hence with a much larger diversity of the potentially concerned earthquakes, more specifically the following:
-
Criterion no. 5 was added due to the recurring lack of data in the epicentral areas of the main aftershocks of the 2016–2017 central Italy sequence, due to the widespread evacuations following the Mw 6.0 mainshock of 24 August 2016 and to the superposition of the effects of subsequent shocks.
-
Criterion no. 6 was added after various experimental tests, in order to achieve more reliable and stable estimates of the attenuation.
-
Criteria no. 7 and no. 8 were introduced to discard earthquakes located offshore or near the coastline, whose epicentral location generally exhibits greater uncertainty.
-
Criterion no. 9 was adopted to retain only earthquakes for which we could calculate a reliable attenuation steepness.
3.2 Analysis of the learning set
We analyzed separately two data subsets, respectively, comprising only earthquakes located in northern Italy and earthquakes located in the rest of the Italian Peninsula. We made this choice because the dataset used in Sbarra et al. (2019a) included only earthquakes from a region whose lithospheric structure and wave propagation properties are homogeneous (Mele et al., 1997; Gasperini, 2001). Conversely, in this work we wanted to evaluate the possible influence of variable attenuation properties resulting from the full range of tectonic and geodynamic diversity characterizing the Italian Peninsula.
Due to the intervening minor updates in our methodology – and specifically in the calculation of the starting point of our moving window, which implies a slightly different steepness for the first 50 km of the attenuation curve (mean: −0.00015; max: 0.007) – we first recalculated the attenuation steepness for all the 20 earthquakes comprising the learning set used by Sbarra et al. (2019a) (Table 1, IDs 1 to 20; see Figs. 1 and 3). We added to this dataset the 1996 Emilia earthquake (ID 23), originally rejected because its depth from the ISIDe catalogue (ISIDe Working Group, 2007) was fixed at 10 km; for this event we now use the depth evaluated by Selvaggi et al. (2001). We then analyzed the earthquakes we selected for the rest of Italy and calculated their intensity attenuation steepness (Figs. 1, 4; Table 1, from no. 21 to no. 42, except for no. 23).
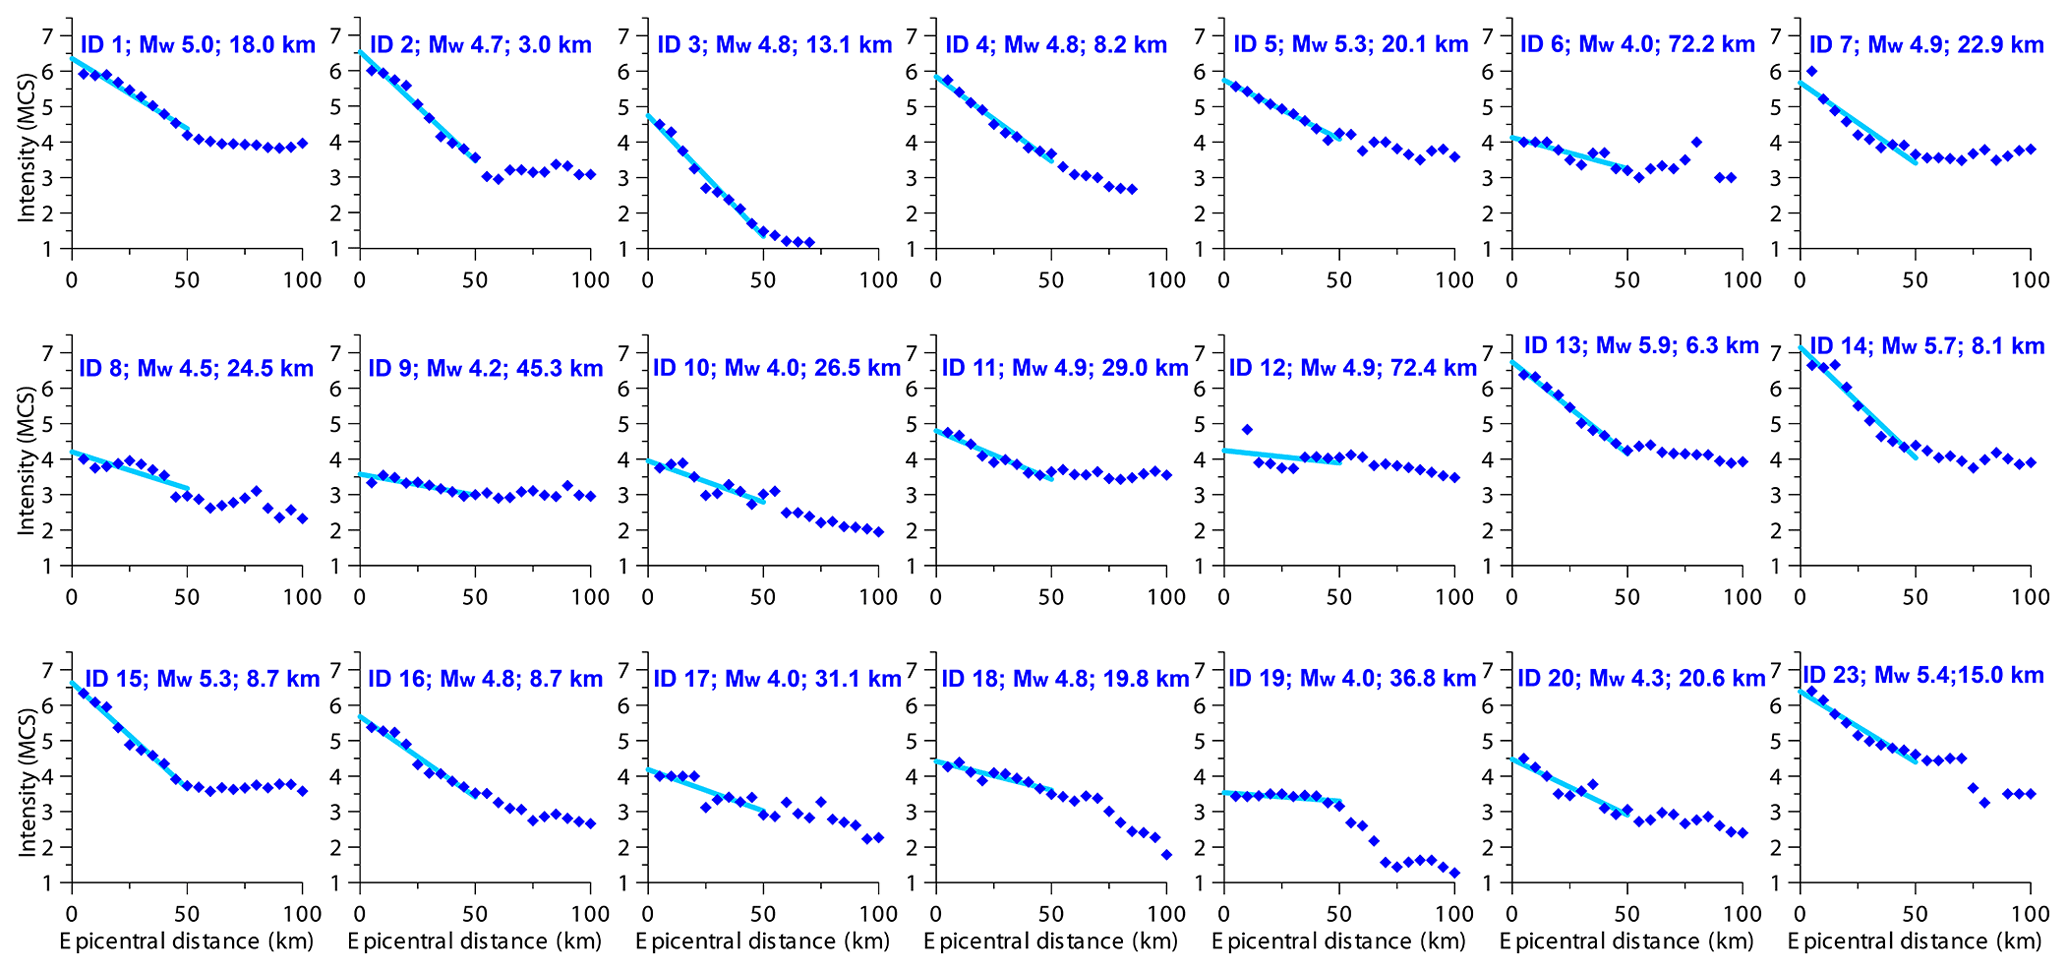
Figure 3Attenuation curves obtained for the northern Italian earthquakes in the learning set (Table 1, from no. 1 to no. 20, plus no. 23; blue symbols in Figs. 1 and 5). Individual intensity data points were obtained by averaging the intensity values as shown in Fig. 2. We obtained the linear fit for the first 50 km of each curve and calculated the resulting steepness.
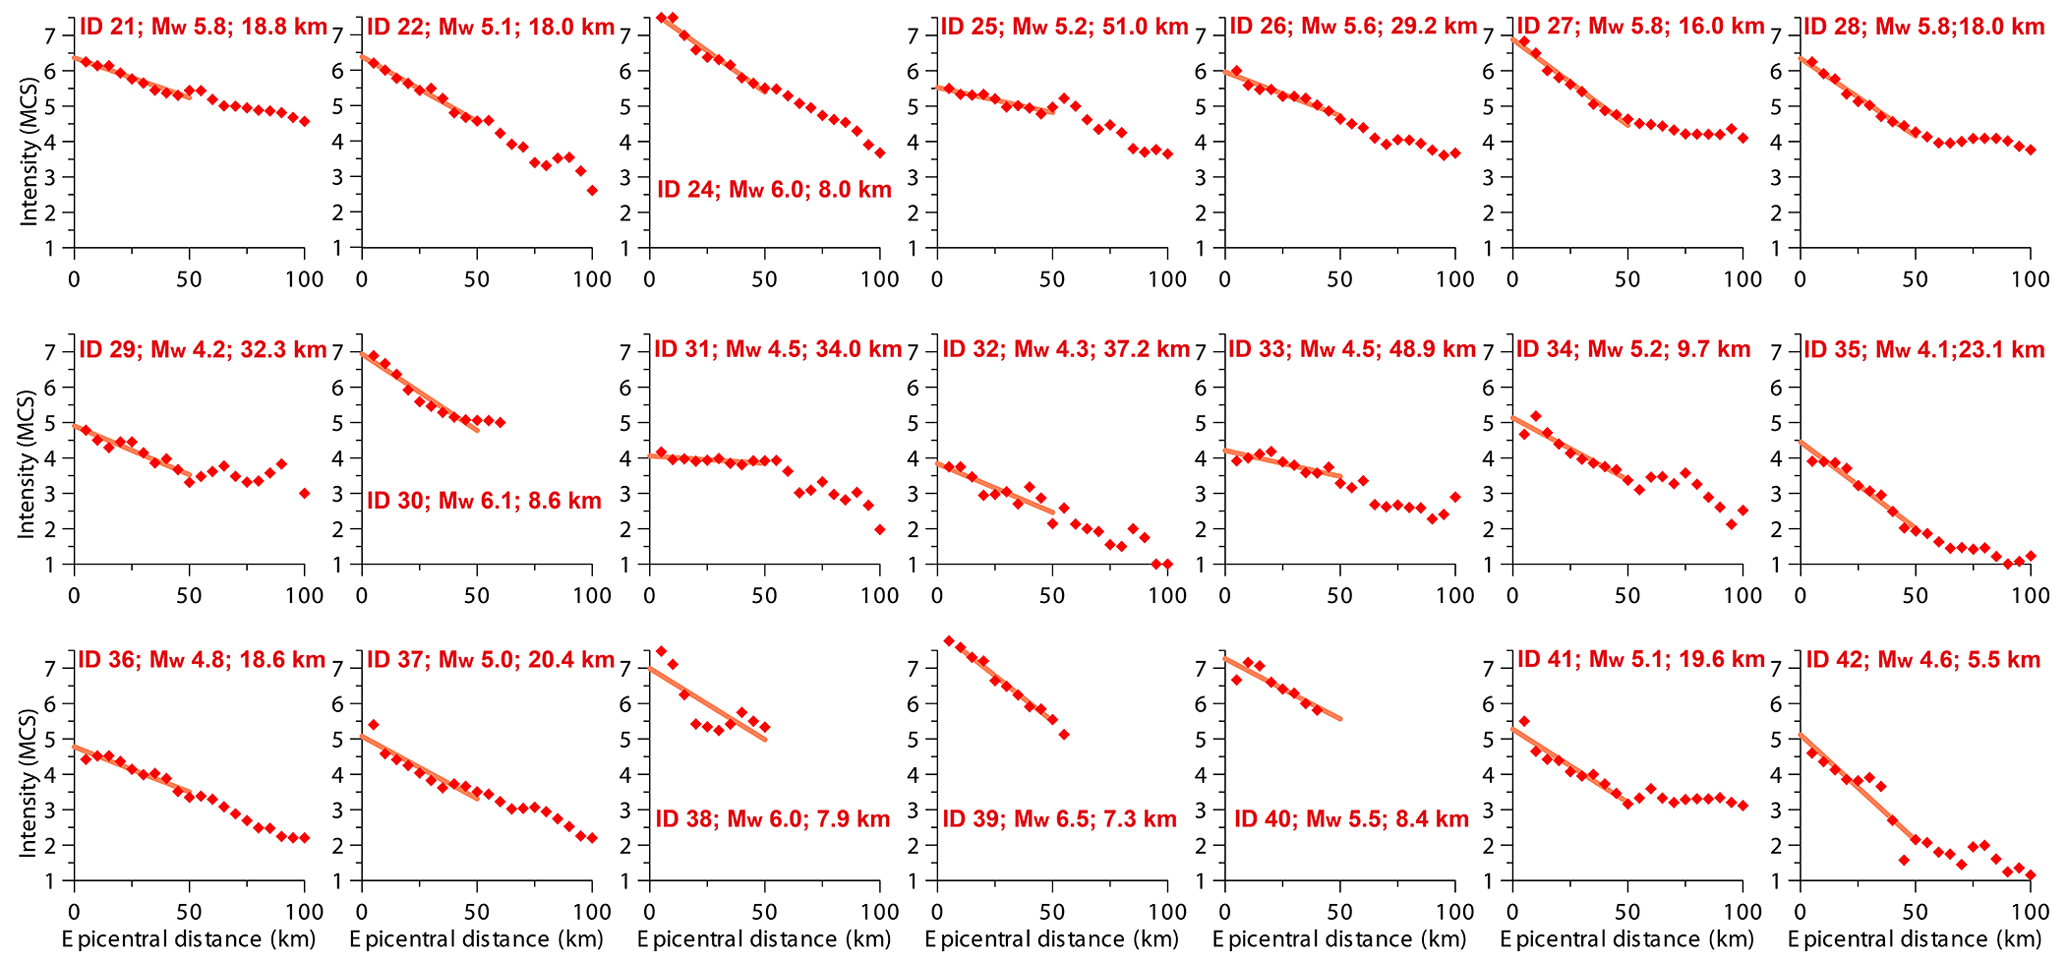
Figure 4Attenuation curves obtained for the central and southern Italian earthquakes in the learning set (Table 1, from no. 21 to no. 42, except for no. 23; red symbols in Figs. 1 and 5). Individual intensity data points were obtained by averaging the intensity values as shown in Fig. 2. We obtained the linear fit for the first 50 km of each curve and calculated the resulting steepness.
As discussed earlier, in both datasets, which together form our new learning set, we observed a distinct break in steepness at an epicentral distance of about 50 km (see Figs. 3, 4). In describing this feature of the Italian attenuation curves, Gasperini (2001) contended that within a ∼50 km epicentral distance the ground shaking is dominated by direct seismic phases, whose propagation is highly sensitive to earthquake depth, whereas Moho-reflected phases dominate at larger distances. According to this hypothesis, the exact distance of the transition would be controlled by the average Moho depth along the source–receiver path.
For all the earthquakes in the learning set we then plotted the steepness (S; intensity per kilometer), i.e., the absolute value of the attenuation slope, versus focal depth (D; km) and found two separate but very similar best-fitting logarithmic functions (Fig. 5). For northern Italy we found
whereas for central and southern Italy we found
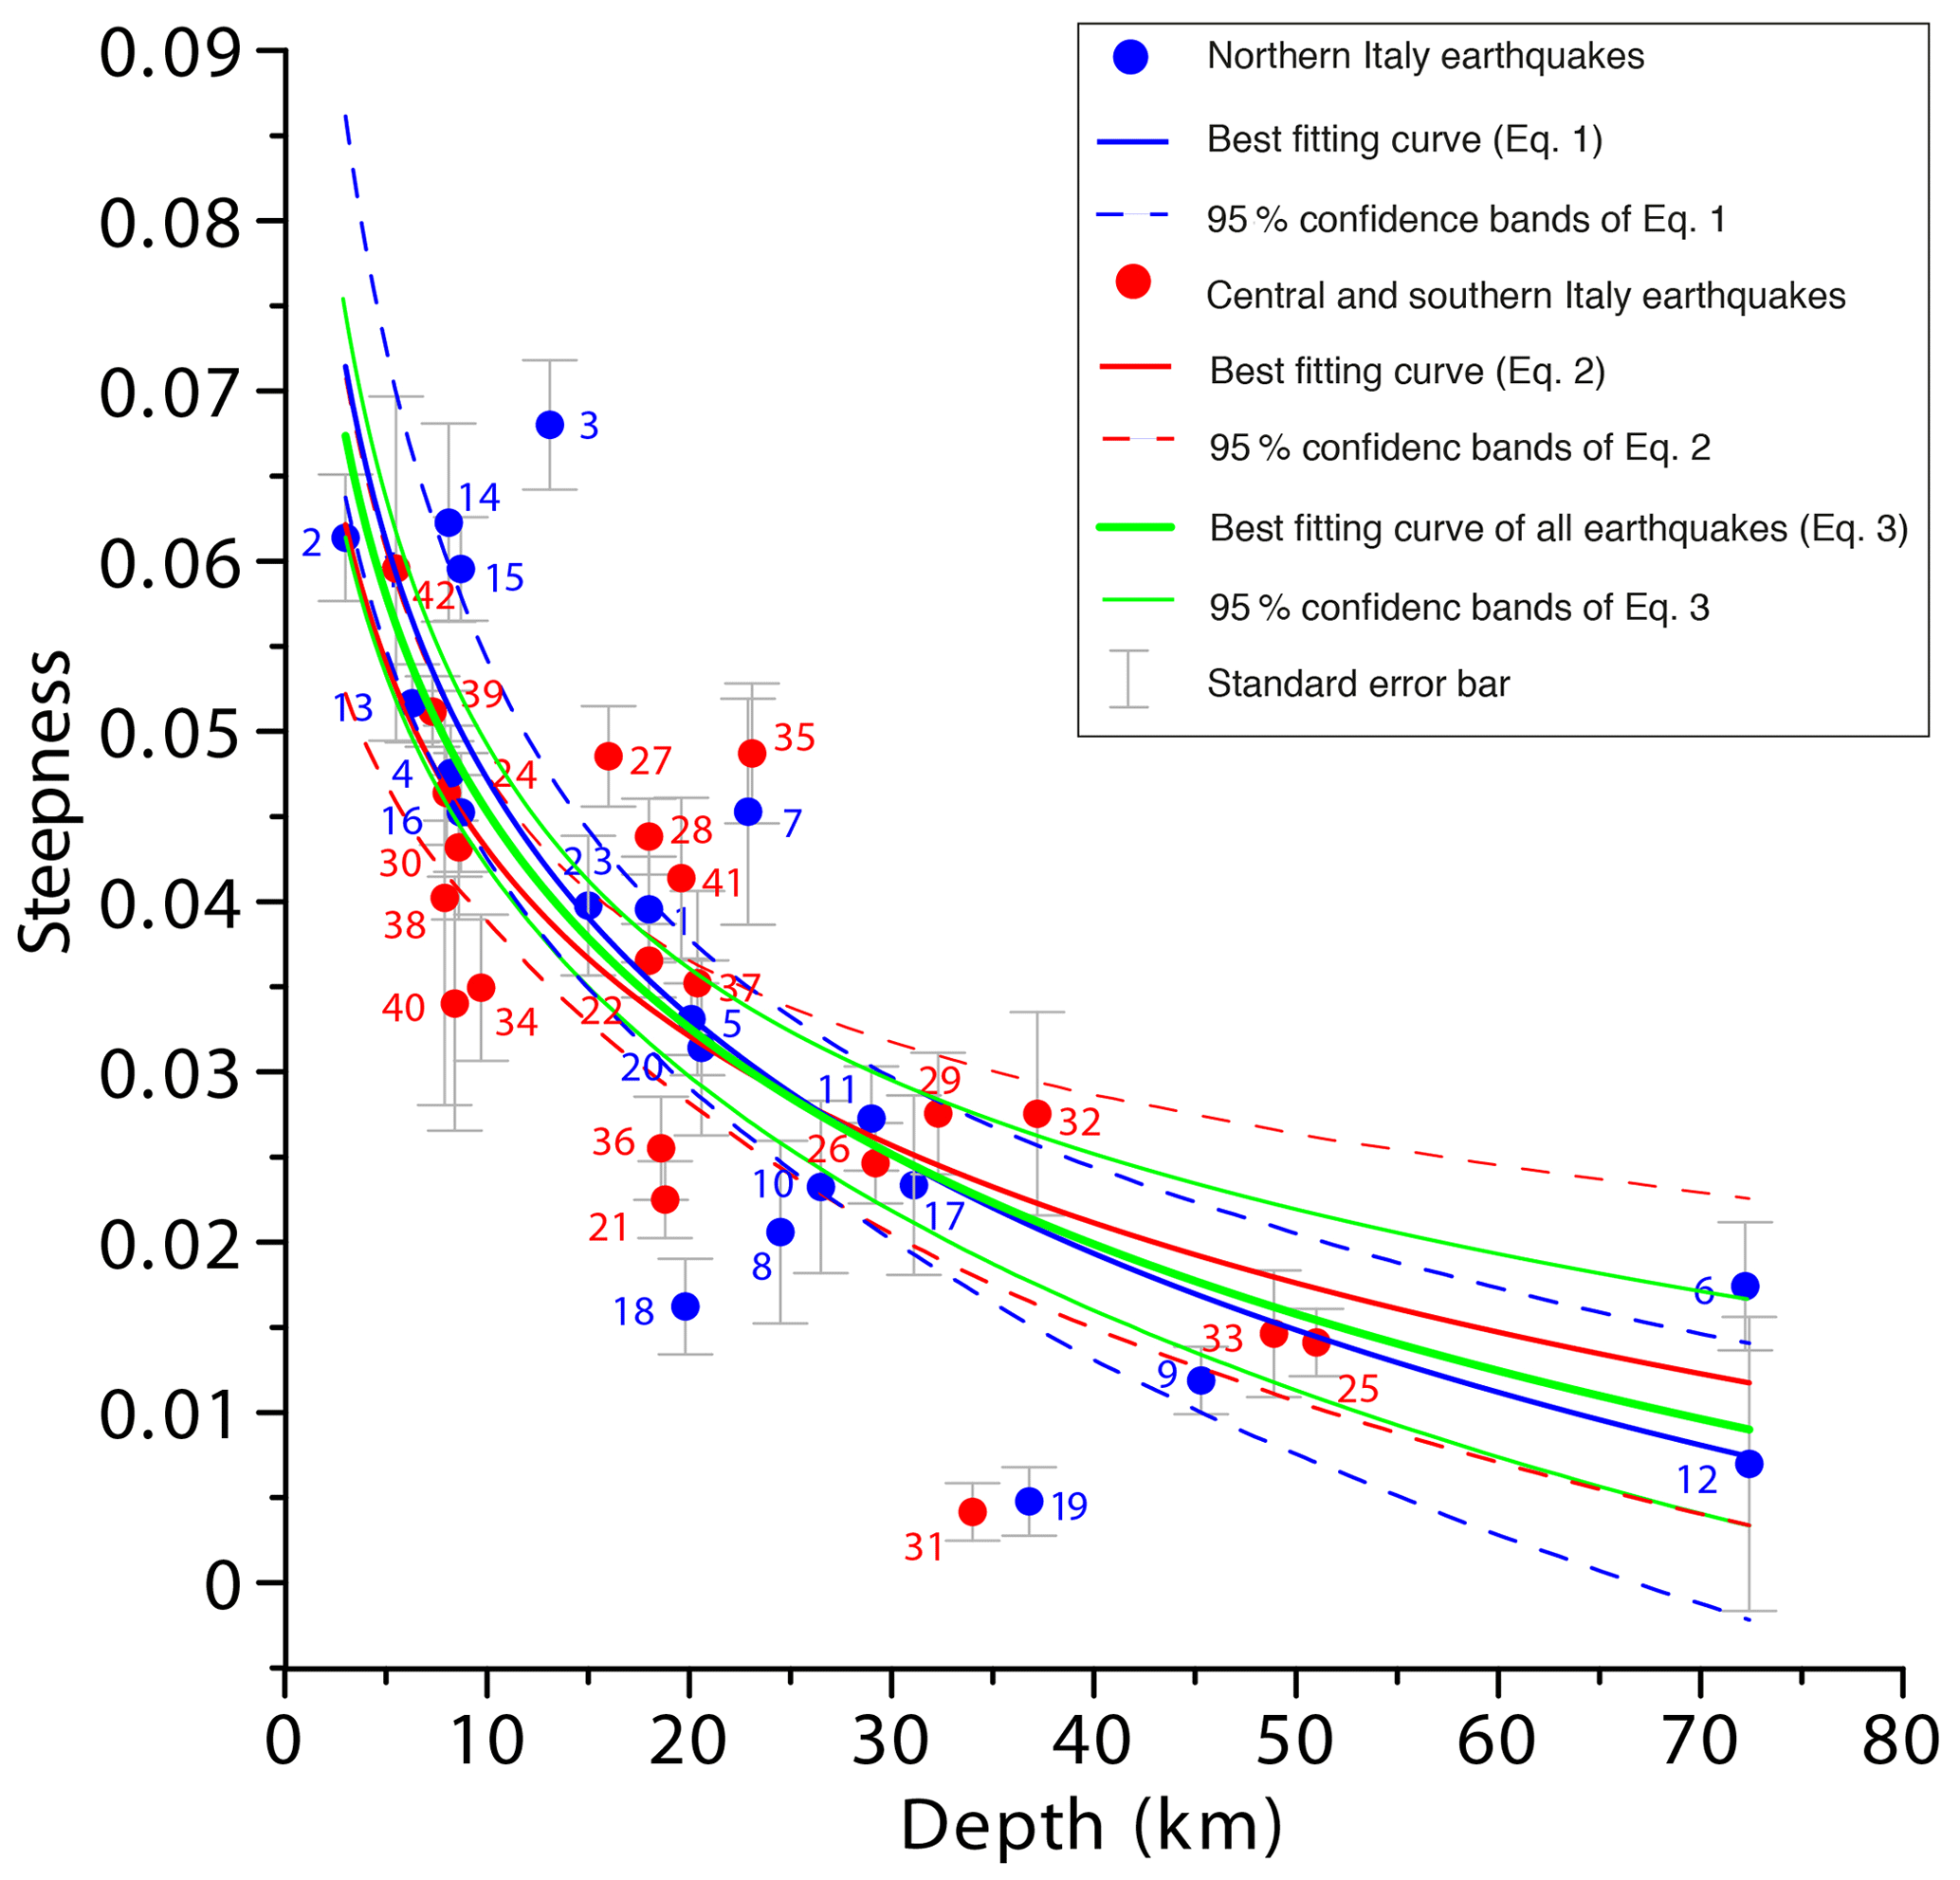
Figure 5Depth versus attenuation steepness for the 42 earthquakes used as a learning set. Blue and red symbols indicate the northern Italian and the central and southern Italian datasets, respectively: the corresponding best-fitting logarithmic functions are shown in blue (Eq. 1) and red (Eq. 2), respectively, along with their 95 % confidence bands. The best-fitting function obtained for the whole dataset (Eq. 3) is shown in green. Each earthquake is labeled with a unique identifier (see Table 1) and is plotted along with its standard error (shown by a vertical bar of ± standard error).
The coefficients of each function fall within the 95 % confidence interval of the other function, suggesting that our method does not detect any statistically significant change in the attenuation of macroseismic intensity between the two domains, at least over the first 50 km of epicentral distance. This finding also suggests that an approach based on averaging the intensity values distributed over circular search areas has the ability to smooth out most of the inevitable azimuthal differences in crustal propagation properties.
We decided to calculate a new logarithmic function using all 42 earthquakes in the learning set so as to obtain a law that may be used over the whole Italian region (green line in Fig. 5):
The regression F test of the three regressions is acceptable at a significant probability level of p<0.0001. As we expected, Eq. (3) is similar to the previous two equations and exhibits narrower 95 % confidence bands (Davis and Sampson, 2002) resulting from the larger number of available data points. Equation (3) can be applied for a steepness interval of , which corresponds to a depth interval of km. Notice that the function is not constrained beyond these limits and hence should not be used for shallower or deeper events. For depths greater than 35 km and steepness less than 0.02, the uncertainty is larger. Consequently, the confidence bands of Eq. (3) in Fig. 5 exhibit wider limits, yet they still provide valuable information on depth estimation, albeit within a wider error range. Notice also that for epicentral distances >50 km the curves shown in Figs. 3 and 4 exhibit slightly different steepness between the northern and the central and southern Italian datasets (respectively, 0.01 and 0.02), in agreement with the observations made by Gasperini (2001). Conversely, as mentioned above, in the first 50 km of the attenuation curve there does not seem to be any influence by crustal attenuation properties; hence in this case a trade-off exists only between magnitude and depth. In contrast, the intensity attenuation for epicentral distances >50 km for earthquakes occurring in northern Italy, where the crust is generally thicker than in the rest of the country, frequently shows a characteristic, very gently sloping plateau that has been interpreted as due to Moho-reflected seismic waves by Bragato et al. (2011). A further element to be taken into account is the difference in seismic-wave propagation between the Tyrrhenian and Adriatic sides of Italy, most likely resulting from a rather different efficiency of the seismic energy propagation of the crust–upper-mantle system (Mele et al., 1997; Lolli et al., 2015; De Rubeis et al., 2016; Di Bona, 2016). But again, no differences are appreciated in our analysis for earthquakes located on the Tyrrhenian or Adriatic sides with epicentral distances up to 50 km (see Figs. 1, 3, and 4).
3.3 Independence of the method to infer the earthquake depth from magnitude
The steepness of the first 50 km of the attenuation curves calculated for the earthquakes of our learning set (Figs. 3, 4) is independent from magnitude, as already empirically observed by Sbarra et al. (2019a) for a smaller sample of events. To prove this statement, we correlated the steepness with Mw in addition to the natural logarithm of depth (see Eq. 3) and found that its coefficients are not significant (95 % confidence interval includes the null value). As an example of the independence of the steepness from magnitude we plotted in Fig. 6a the attenuation curves for four earthquakes falling in the rather wide Mw range 4.8–6.5, with a similar instrumental depth, in the range 7.3–8.7 km (no. 4, no. 16, no. 24, no. 39; see Table 1). Figure 6a shows that all the calculated steepness values fall in a rather narrow range (0.045–0.051), regardless of magnitude. Figure 6b shows that the same behavior is observed also for four deeper earthquakes (no. 8, no. 10, no. 11, no. 26; see Table 1), which share a similar instrumental depth (24.5–29.2 km) but exhibit a different Mw value (4.0–5.6).

Figure 6Attenuation curves obtained for two groups of earthquakes featuring a similar hypocentral depth but a different magnitude: (a) for the shallow events of no. 4, no. 16, no. 24, and no. 39 and (b) for the deep events of no. 8, no. 10, no. 11, and no. 26 (see Table 1 for further details). The steepness of the best-fitting line in the first 50 km is similar among the four events reported for each group, providing empirical evidence for the independence of inferred depth from magnitude in our methodology.
The invariance of the attenuation steepness with magnitude for events in the learning set is a key point as it makes our approach suitable for analyzing historical earthquakes even if their size is not well constrained. Instead, other methodologies (Traversa et al., 2018; Provost and Scotti, 2020) are subject to a trade-off between depth and magnitude, as both parameters are treated as unknown. Our approach is similar to that of previous investigators (Jánosi, 1906; Kövesligethy, 1907; Blake, 1941; Sponheuer, 1960; Burton et al., 1985; Musson, 1996), who based their analyses on manually drawn isoseismals, but directly uses the fit of the attenuation curve computed on averages of the original MDP falling inside moving circular windows.
3.4 Comparison with synthetic models
We analyzed the possibility of reproducing the empirical trend of Fig. 5 through predictive models, expressing the macroseismic intensity (intensity prediction equations, IPEs) or the peak ground acceleration (PGA) as a function of the earthquake magnitude and distance. It is worth noting that many of the IPEs and GMPEs (ground motion prediction equations) proposed in the literature (e.g., Douglas, 2003, 2021) assume a predetermined depth for all earthquakes considered. The difficulty in considering this parameter is due to the uncertainty associated with the depth itself, not only for historical earthquakes but also for recent events located in areas that are geologically complex or not monitored by a dense seismic network. To explore the variation in the attenuation steepness with depth, we therefore used three of the models that explicitly include this parameter: the IPE by Tosi et al. (2015), the IPE by Musson (2013), and the GMPE by Cauzzi and Faccioli (2008). We chose these functions because they feature a simple functional form which determines a magnitude-independent attenuation steepness, as suggested by real earthquake data. Conversely, a functional form containing a term combining magnitude and distance would lead to a change in the shape of the attenuation curve with distance and to a variation in the steepness for a variable magnitude.
We then used two different conversion equations (Faenza and Michelini, 2010; Masi et al., 2020) to convert the PGA values obtained with the adopted GMPEs into MCS (Mercalli–Cancani–Sieberg intensity scale) macroseismic intensities so as to test also the influence of the conversion process. We used these equations to compute the macroseismic intensities caused at several epicentral distances by a hypothetical Mw 5.0 earthquake located at variable depth. We then applied the same 10 km moving-window average method used for the analyzed earthquakes and calculated the regression line within a distance of 50 km.
Figure 7a shows some of the average-intensity values obtained using the IPE proposed by Musson (2013) for a magnitude of Mw 5.0, along with their regression lines. We remark that, although the macroseismic intensity is proportional to the logarithm of the hypocentral distance, the linear regression of intensity versus epicentral distance gives statistically significant results in the adopted distance range. In addition we show that, even using an IPE, 50 km is a reasonable limit for a linear regression that approximates the first part of the attenuation curve well. Figure 7b shows the steepness of the regression lines, thus calculated as a function of the earthquake focal depth, and the values, calculated with the same method, derived from PGA using the GMPE proposed by Cauzzi and Faccioli (2008), converted into macroseismic intensity. It is worth noting that differences caused by the use of two different conversion equations are greater than the differences caused by the use of the IPE in place of the GMPE. At any rate, in all three cases the trend of the values as a function of the depth is similar to the trend we found empirically. The greater difference is observed for depth larger than 35 km, probably because the empirical regression is less constrained for such deep events. This is reflected in the wider confidence bands of Eq. (3) (see Fig. 5), due to fewer earthquakes in the learning set at those depths. Having been obtained with a completely different kind of data, this result suggests that the approach followed for deriving Eq. (3) is adequate and reliable.
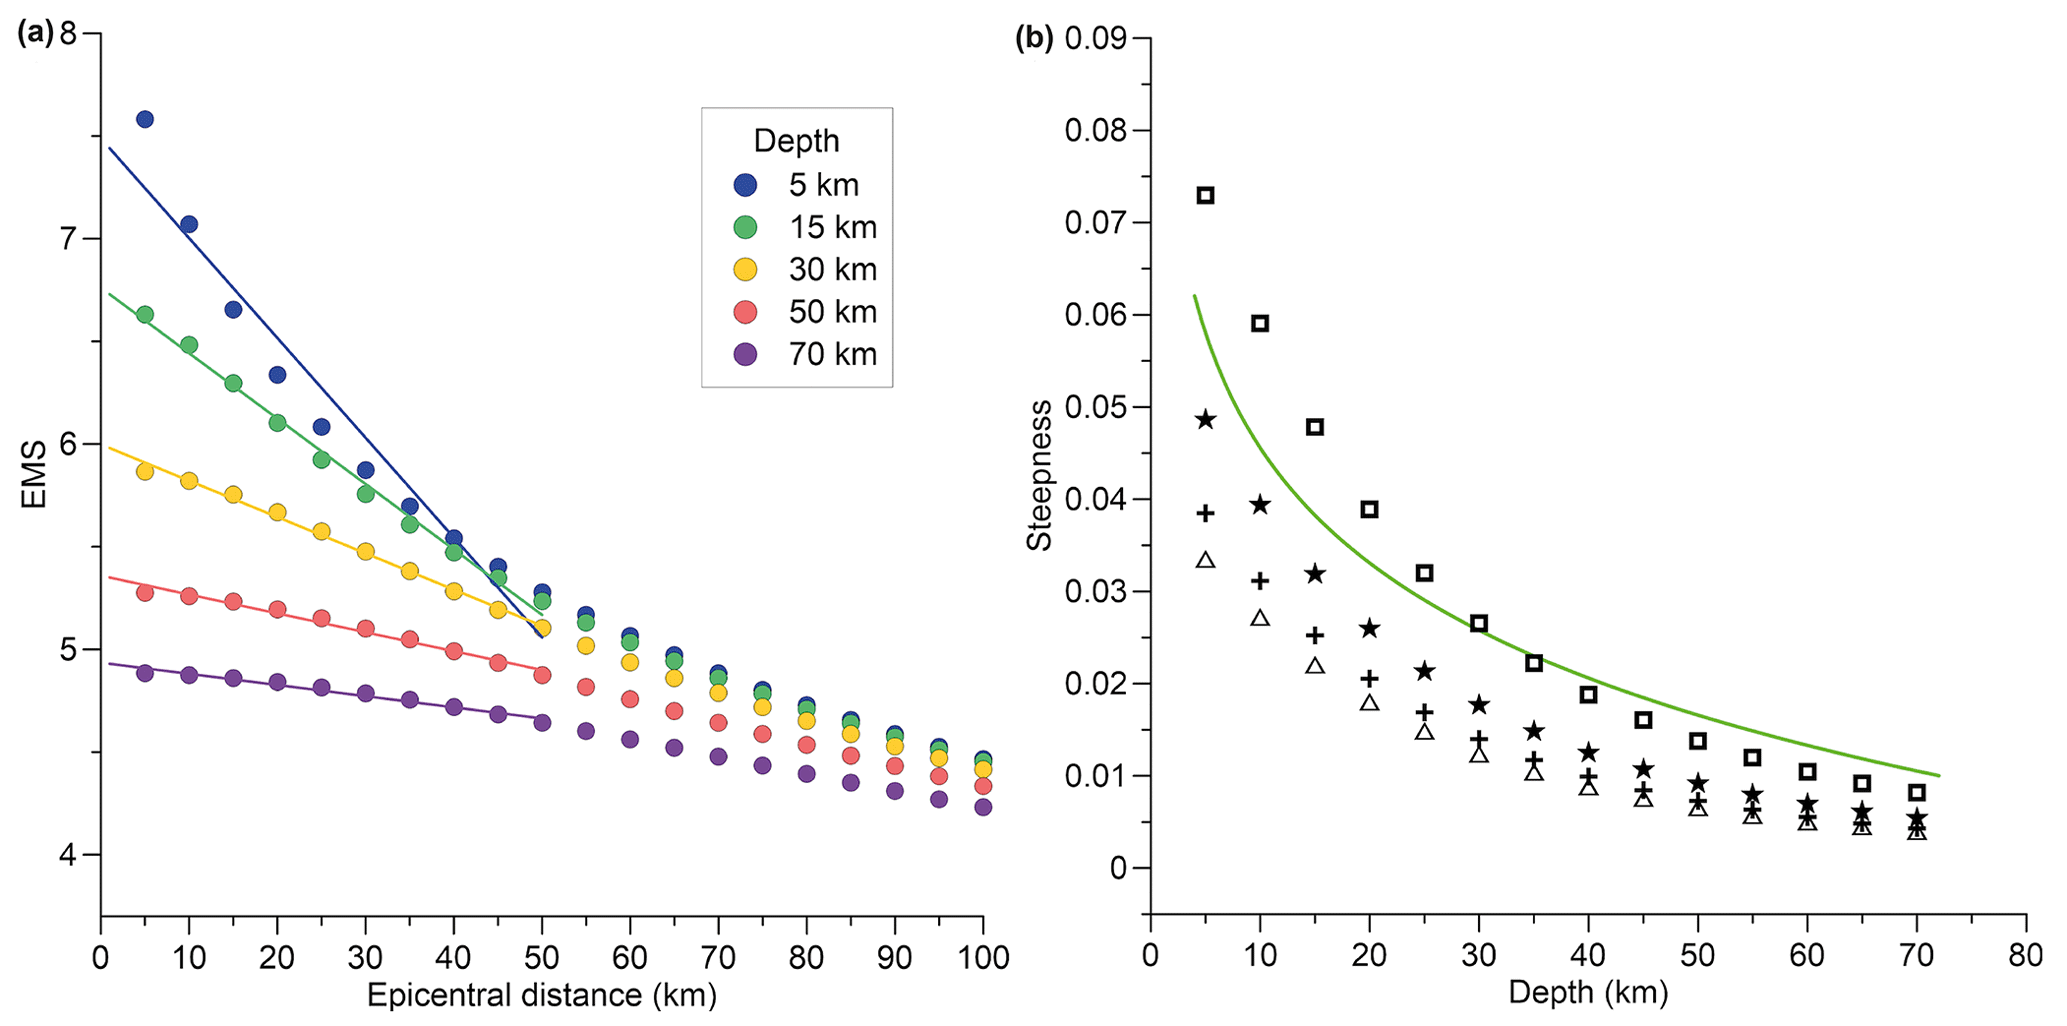
Figure 7Attenuation curves and steepness simulated with different intensity or ground motion models for a Mw 5.0 earthquake located at increasing depths. (a) Average intensity calculated using the IPE by Musson (2013) and the corresponding regression lines. (b) Attenuation steepness of intensities calculated using the IPE by Musson (2013) (stars), the IPE by Tosi et al. (2015) (crosses), and the GMPE by Cauzzi and Faccioli (2008); the PGAs predicted by this latter equation have been converted into MCS using the equations provided by Faenza and Michelini (2010) (squares) and by Masi et al. (2020) (triangles), respectively. All predictions are compared with the empirical Eq. (3), shown by the green line in panel (b).
3.5 Reliability and validation of the depth estimation method
The reliability of the steepness of the first 50 km of the attenuation curve depends on the quality and spatial distribution of the available MDPs and on the accuracy of the epicentral locations. Italian macroseismic data are systematically stored in the DBMI v4.0 database (Locati et al., 2022); as a rule of thumb, the older the earthquake is, the less complete and reliable the historical sources from which macroseismic intensities were derived are (e.g., Guidoboni and Ebel, 2009).
To test our procedure we investigated the minimum number of MDPs of the macroseismic field that are needed to obtain an estimate of the attenuation steepness. To this end we intentionally and randomly depleted the macroseismic field of the 20 May 2012 Mw 5.8 Emilia earthquake (no. 13), a well-recorded event for which over 200 spatially well-distributed MDPs are available, using data from the HSIT database (De Rubeis et al., 2019; see Fig. 2a). For each of the 10 ring-shaped search areas (see Fig. 2b, c) we performed a gradual reduction in the number of MDPs (from 1 % to 99 %) and did the same for each step and for all areas (see Fig. 8). For example, let us consider three adjacent ring-shaped areas: the first with 32 MDPs, the second with 18 MDPs, and the third with 9 MDPs. The depletion procedure would lead (among others) to the following steps: a 35 % depletion will leave 21 MDPs in the first area, 12 MDPs in the second, and 6 MDPs in the third; a 68 % depletion will leave 10, 6, and 3, respectively; and a 97 % of depletion will leave 1, 1, and 0 MDPs.
The linear fit of the attenuation trend was calculated 1000 times for each depletion step so as to evaluate the steepness variability through its standard deviation.
Figure 8 shows the number of MDPs versus the standard deviation of the steepness, which is equal to 0.01 when only 14 % of the total data are left, corresponding to 30 MDPs; this implies that the most likely steepness values (68 %) fall within a standard deviation equal to ±0.01.
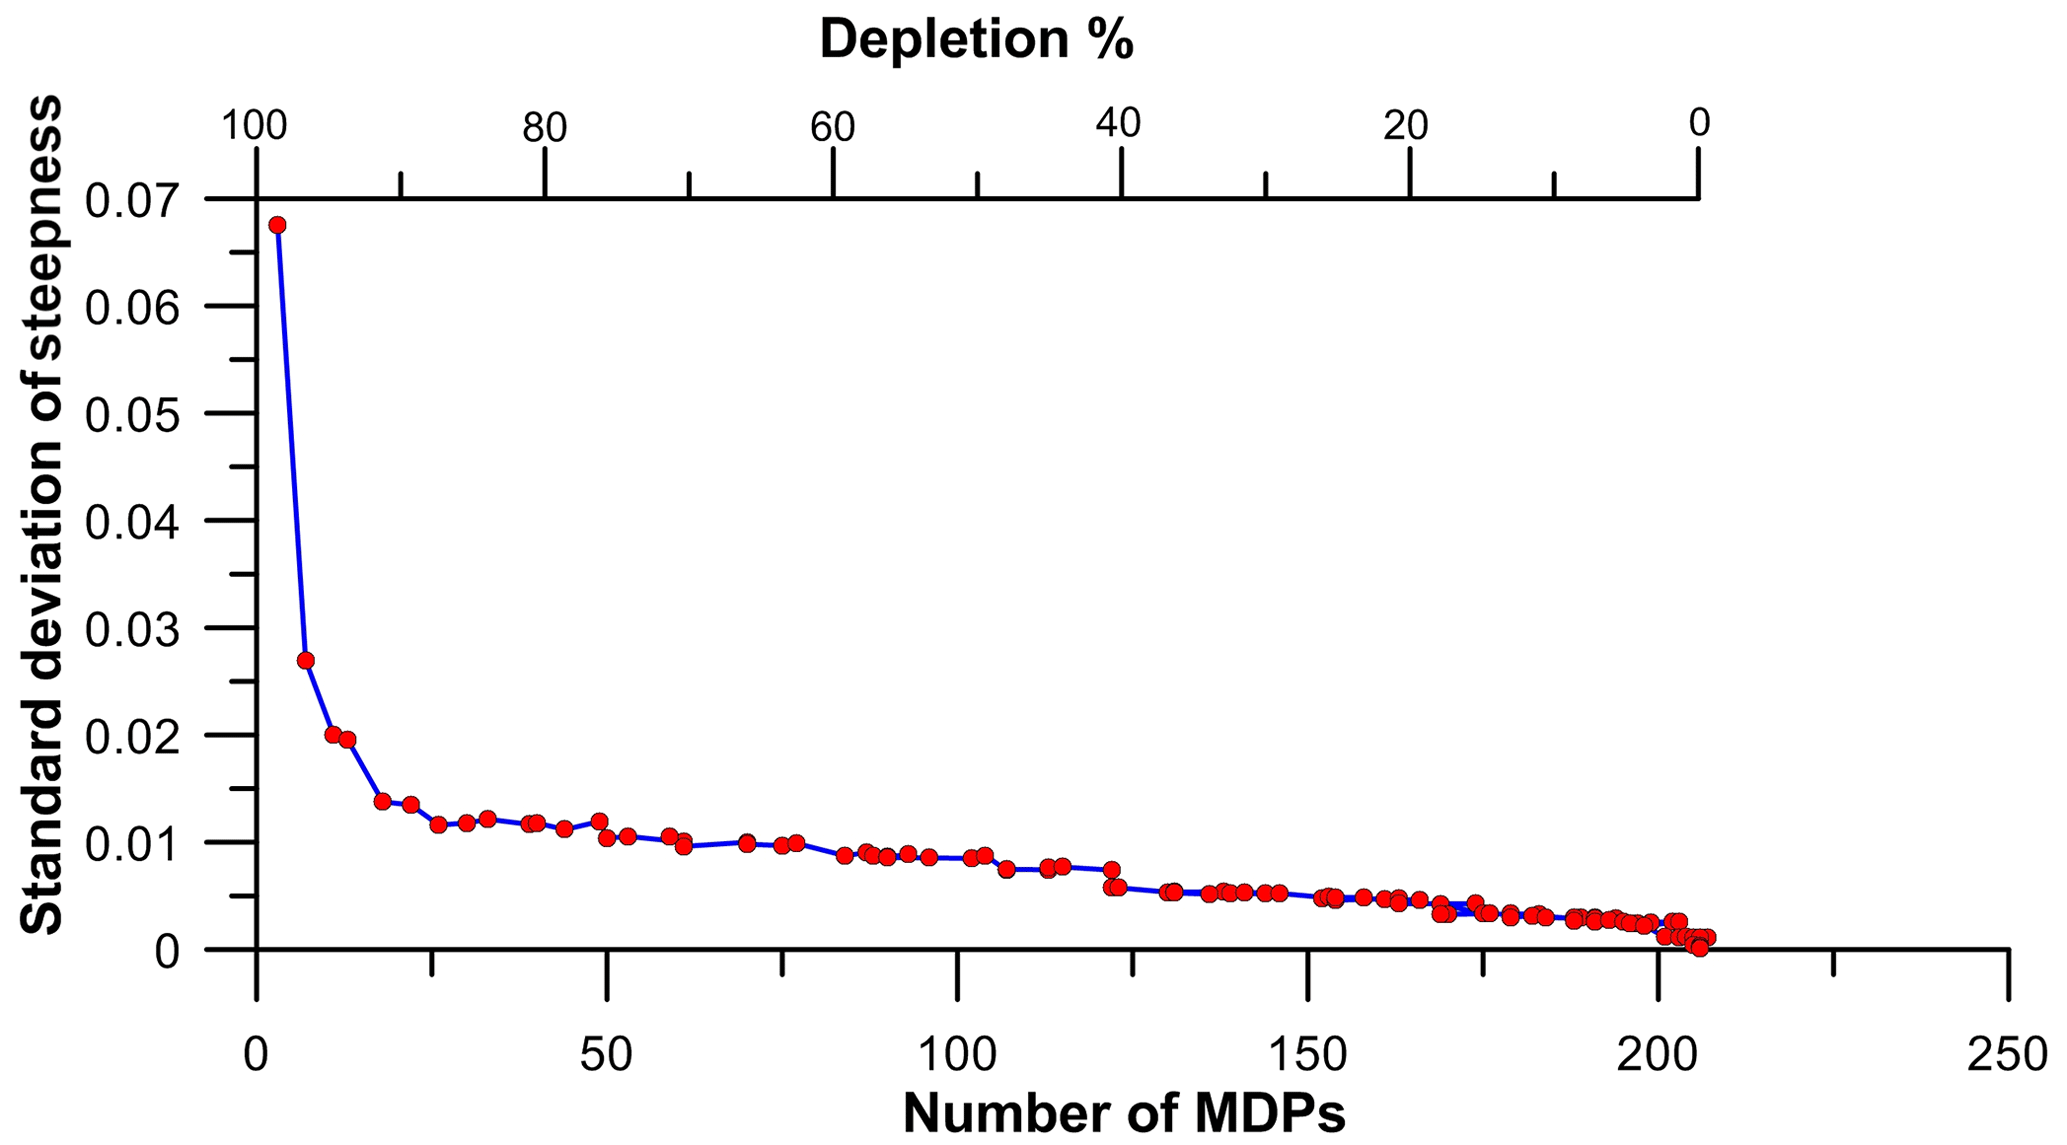
Figure 8Application of the depletion test to the macroseismic field of the 20 May 2012 earthquake (Figs. 1, 2; ID 13 in Table 1) taken from the HSIT database (available at https://e.hsit.it/772691/index.html, last access: 22 December 2022), for which there exist 207 MDPs falling within a radius of 55 km from the epicenter. The percentage of MDPs falling within each ring-shaped area (see Fig. 1) was gradually depleted from 1 % to 99 %, and the steepness was calculated 1000 times for all the different depleted datasets. So a total of 100 000 calculations were done. The y axis shows the variability in the calculated steepness, expressed through the standard deviation of the steepness obtained for the depleted datasets with the same number of MDPs.
Our depletion test shows that we may obtain an acceptable attenuation steepness even for historical earthquakes for which at least 30 MDPs are available, provided that they are homogeneously distributed for each distance window. Moreover we calculated the depth reliability by estimating the depths corresponding to the confidence bands of Eq. (3) for each calculated steepness of the earthquakes in the analyzed set (see Fig. 5); these values are shown in Table S1 in the Supplement. We also calculated the depth of the 42 events in our learning set using the proposed methodology (Table S2, Fig. S1 in the Supplement).
3.6 A two-step method for estimating magnitude based on intensity and depth
While the inferred hypocentral depth is independent of magnitude and can be obtained simply based on the steepness of the line that best fits the first 50 km of the attenuation curve, the estimation of the magnitude itself affects the y intercept (the expected intensity at the epicenter, IE) of the linear fit (Fig. 6): for a constant depth the y intercept increases for an increasing magnitude (Fig. 6) and decreases if depth increases for a constant magnitude. Therefore, a reliable magnitude determination based on macroseismic data must necessarily take into account earthquake depth.
We devised a two-step procedure where depth is estimated first (step 1) and then Mw is empirically estimated using our data from the learning set to derive a standard least-squares regression equation among D (depth), IE, and Mw (step 2):
Equation (4) can be applied for a depth interval of km and . Figure 9 shows the data of the learning set used in the regression, together with the magnitude isolines of Eq. (4). This relationship shows the extent of geometric attenuation of intensity due to the propagation of seismic waves from the hypocenter to the epicenter.
Figure 9Magnitude as a function of the natural logarithm of depth and expected intensity at the epicenter IE for all earthquakes in the learning set (colored dots). The multiple regression function (Eq. 4) is shown with colored lines of equal magnitude for Mw 4.0 (blue), Mw 5.0 (green), and Mw 6.0 (orange).
For ln D the 95 % confidence interval of the coefficient includes the null value; however, the coefficient becomes significant at a slightly smaller confidence level (93 %). Magnitudes obtained through this procedure are referred to as y-intercept Mw. In this perspective the attenuation curve becomes a sort of “earthquake identity card”, as it contains all the elements needed to retrieve magnitude and depth from the observed intensities, provided that a reliable calibration scheme is available. Such calibration can be regarded as an application to seismology of the principle of actualism popularized by British naturalists in the late 18th century: “observing modern earthquakes to understand those of the past”.
Deriving magnitude using only well-studied earthquakes with their expected epicentral intensities provides a better estimate of Mw because it is based on larger intensities than that obtained by inverting an IPE (Sbarra et al., 2019a).
The method summarized by Eqs. (3) and (4) is simple and intuitive, and it may allow for a geological verification of the depth before estimating the magnitude. Our step 2 uses a method similar to that proposed by Gutdeutsch et al. (2002), who applied it only to carefully selected datasets so as to minimize the bias caused by a poorly constrained depth or by an incomplete macroseismic field.
In conclusion, starting from our empirical observations of the independence of the attenuation steepness from magnitude, we were able to mitigate the trade-off between magnitude and depth when estimating both these parameters from macroseismic data.
3.7 Influence of macroseismic cumulative effects on the depth and magnitude estimation
It is hard to estimate macroseismic intensities for individual earthquakes occurring close in time and space (multiple events, strong aftershocks, etc.; e.g., Grünthal, 1998; Grimaz and Malisan, 2017; Graziani et al., 2019), particularly in the case of historical events. Macroseismic data may then reflect accumulated effects, a circumstance that would ultimately affect the attenuation steepness and hence contaminate the inferred earthquake depth and magnitude. This is a recurring problem in historical earthquake catalogues, a condition that is hard to overcome even for modern earthquakes and even if a very rapid damage survey is carried out because the first large shock inevitably causes an increase in the vulnerability of the building stock whose effects on later shocks are virtually impossible to identify.
To quantify the effect of multiple events on the determination of earthquake depth, we analyzed the 29 May 2012 Mw 5.7 Emilia earthquake, one of the events in the learning set, using the MDPs from DBMI15 instead of those supplied by HSIT (ID 14 in Table 1). For this event the DBMI macroseismic field (Tertulliani et al., 2012, https://emidius.mi.ingv.it/ASMI/event/20120529_0700_000, last access: 22 December 2022) includes the effects of the 20 May event (Mw 5.9; https://emidius.mi.ingv.it/ASMI/event/20120520_0203_000, last access: 22 December 2022), which occurred nearby. As expected, these circumstances misled our method, causing a drastic overestimation of the earthquake depth (36.8 km). Conversely, thanks to the rapidity in the response given by citizens and to the ensuing lack of contamination, the HSIT dataset method returned a depth ≤5 km, much closer to instrumental estimate (8.1 km).
A similar case of contamination could be that of two earthquakes that occurred 7 months apart in two distinct but relatively close areas of the northern Apennines: the 10 November 1918 Mw 6.0 Appennino forlivese and the 29 June 1919 Mw 6.4 Mugello shocks (IDs 101 and 102 in Table S1, respectively). Our work estimates a depth range of 19–27 km for the 1919 earthquake (see Table S1). This result is incompatible with the estimated depth of the DISS seismogenic source that is deemed responsible for the 1919 event (fault ID ITIS086; depth range of 1–7 km based on seismotectonic evidence; DISS Working Group, 2021). We suspect that this anomalous depth estimate (19–27 km) could be explained by a sort of overlap between the two macroseismic fields because a portion of the intensity pattern of the 1919 earthquake overlaps the region struck by the 1918 shock (Rovida et al., 2021). As a result, the (apparent) intensity pattern of the 1919 earthquake is likely contaminated by the 1918 event. Both in the case of the 2012 sequence and in the case of the 1918–1919 earthquakes, the inferred depth of the second mainshock is deeper than that shown by instrumental data or suggested by geological observations, due to the overlap between the two macroseismic fields. The intensity fields for 29 May 2012 and 29 June 1919 appear more spread out than they should, due to the contamination from the previous earthquakes; this entails a lower steepness of the attenuation curve – corresponding to an apparently lower attenuation of macroseismic intensity – which ultimately translates into a deeper depth.
3.8 Dealing with higher-magnitude earthquakes
Our approach works well if the size of the seismic source is negligible relative to the epicentral distances, but it may not be immediately applicable to estimate the attenuation of the macroseismic intensity for a high-magnitude earthquake (Gasperini, 2001; Albarello and D'Amico, 2004; Pasolini et al., 2008). To test the validity and possible limitations of this assumption, we evaluated the maximum magnitude for which the use of a point-source approximation is granted, using both our learning set and our analyzed set.
We used the empirical relationships proposed by Wells and Coppersmith (1994) to calculate the rupture area and the expected length of the seismogenic source based on the y-intercept Mw (Eq. 4). Assuming a dip angle of 45∘ for every fault, irrespective of its kinematics and tectonic setting, we calculated the surface projection area of each rectangular source and the radius Re of the equivalent circle (i.e., a circle with the same projected area as the fault; thus Re is a function of Mw). We found Re >10 km only for earthquakes of Mw≥6.75 (10 km is our standard radius of the moving circular search areas), but not having any such earthquakes in the learning set (Table 1), we used a geometric correction only to infer the depth of 21 earthquakes in the analyzed set (see discussion at the end of this section and in Table S1).
Then we applied to this group of higher-magnitude earthquakes a procedure that we call “variable moving windows”. More specifically, we used as the first search area a circular window of radius Re, inside which we averaged the MDP intensities, while for the subsequent windows – each one shifted by 5 km, as usual – we adopted the standard 10 km radius increase. For the 13 January 1915 Mw 7.1 Marsica (central Apennines) earthquake, one of the largest in Italian history and for which there exists a very reliable macroseismic dataset, we made a test using the RJB distance following the method implemented by Joyner and Boore (1981) and calculating the average of the MDPs inside a rectangular rather than a ring-shaped area. We singled out this earthquake because it was a single mainshock event and its macroseismic field should not have been contaminated by the effects of previous or later significant events (see Sect. 3.7).
The comparison of the attenuation steepness calculated using the RJB distance or using the moving-window or variable-moving-window methodology proposed here shows only modest fluctuations. For the 1915 earthquake we found a steepness of 0.044, 0.044, and 0.047, respectively, using the RJB approach, the moving-window approach, and the variable-moving-window approach. These steepness fluctuations imply a difference of about 1.5 km in the expected depth. Given the uncertainty about our knowledge of the source geometry for historical earthquakes and the limited impact of using the RJB distance in the window approach, we decided to recalculate all distances for earthquakes with Mw≥6.75 using the variable-moving-window method only, which analyses the MDPs over circular search areas.
In conclusion, using an extended source approach for the largest earthquakes has a minimal influence on the steepness. Conversely, the effect on the y intercept (IE) is not negligible. The correct way of calculating their magnitude would be using RJB distances, but due to the lack of information on source geometry we use the variable-moving-window method and apply a geometric correction to the intercept value. As a result, for 21 earthquakes with Mw≥6.75 (see Table S1) we assumed an extended source with a radius of Re. Consequently, the distances of the relevant MDPs were systematically reduced by Re, leading to a geometric correction of the regression line and of its intercept: , where S is the steepness.
Finally, we recalculated the magnitude of these 21 earthquakes using Eq. (4).
3.9 Reliability of the magnitude estimation method
Since ours is a two-step method and magnitude is calculated after estimating depth, we provided the estimate of the error associated with the magnitude of the earthquakes in the analyzed set, based on the confidence limits of depth, by applying Eq. (4) for the lower and higher depth limit based on the 95 % confidence band (Table S1).
As a countercheck we used our method to calculate the depth first (Eq. 5) and then the magnitude (Eq. 4) of the 42 events of our learning set (Fig. 10, Table S2; see also magnitude residuals in Fig. S2) so as to analyze the difference from the instrumental magnitudes listed in Table 1. We obtained differences in the range 0.68 to −0.41 magnitude units (Fig. S2), respectively, with an average of −0.03 and a standard deviation of 0.28.
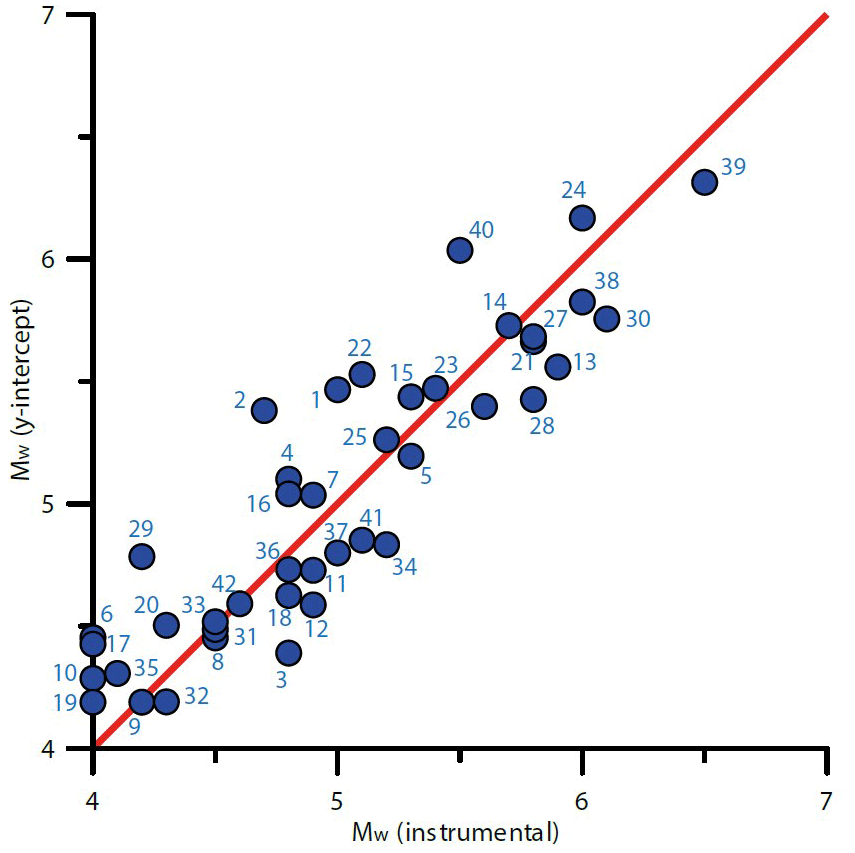
Figure 10Correlation between the Mw calculated with the y-intercept approach proposed in this work and the instrumental Mw reported in Table 1 (Rovida et al., 2020) for all the events in the learning set. Earthquakes falling above or below the line exhibit a higher (up to +0.61 magnitude units) or lower (up to −0.41 magnitude units) Mw value, respectively.
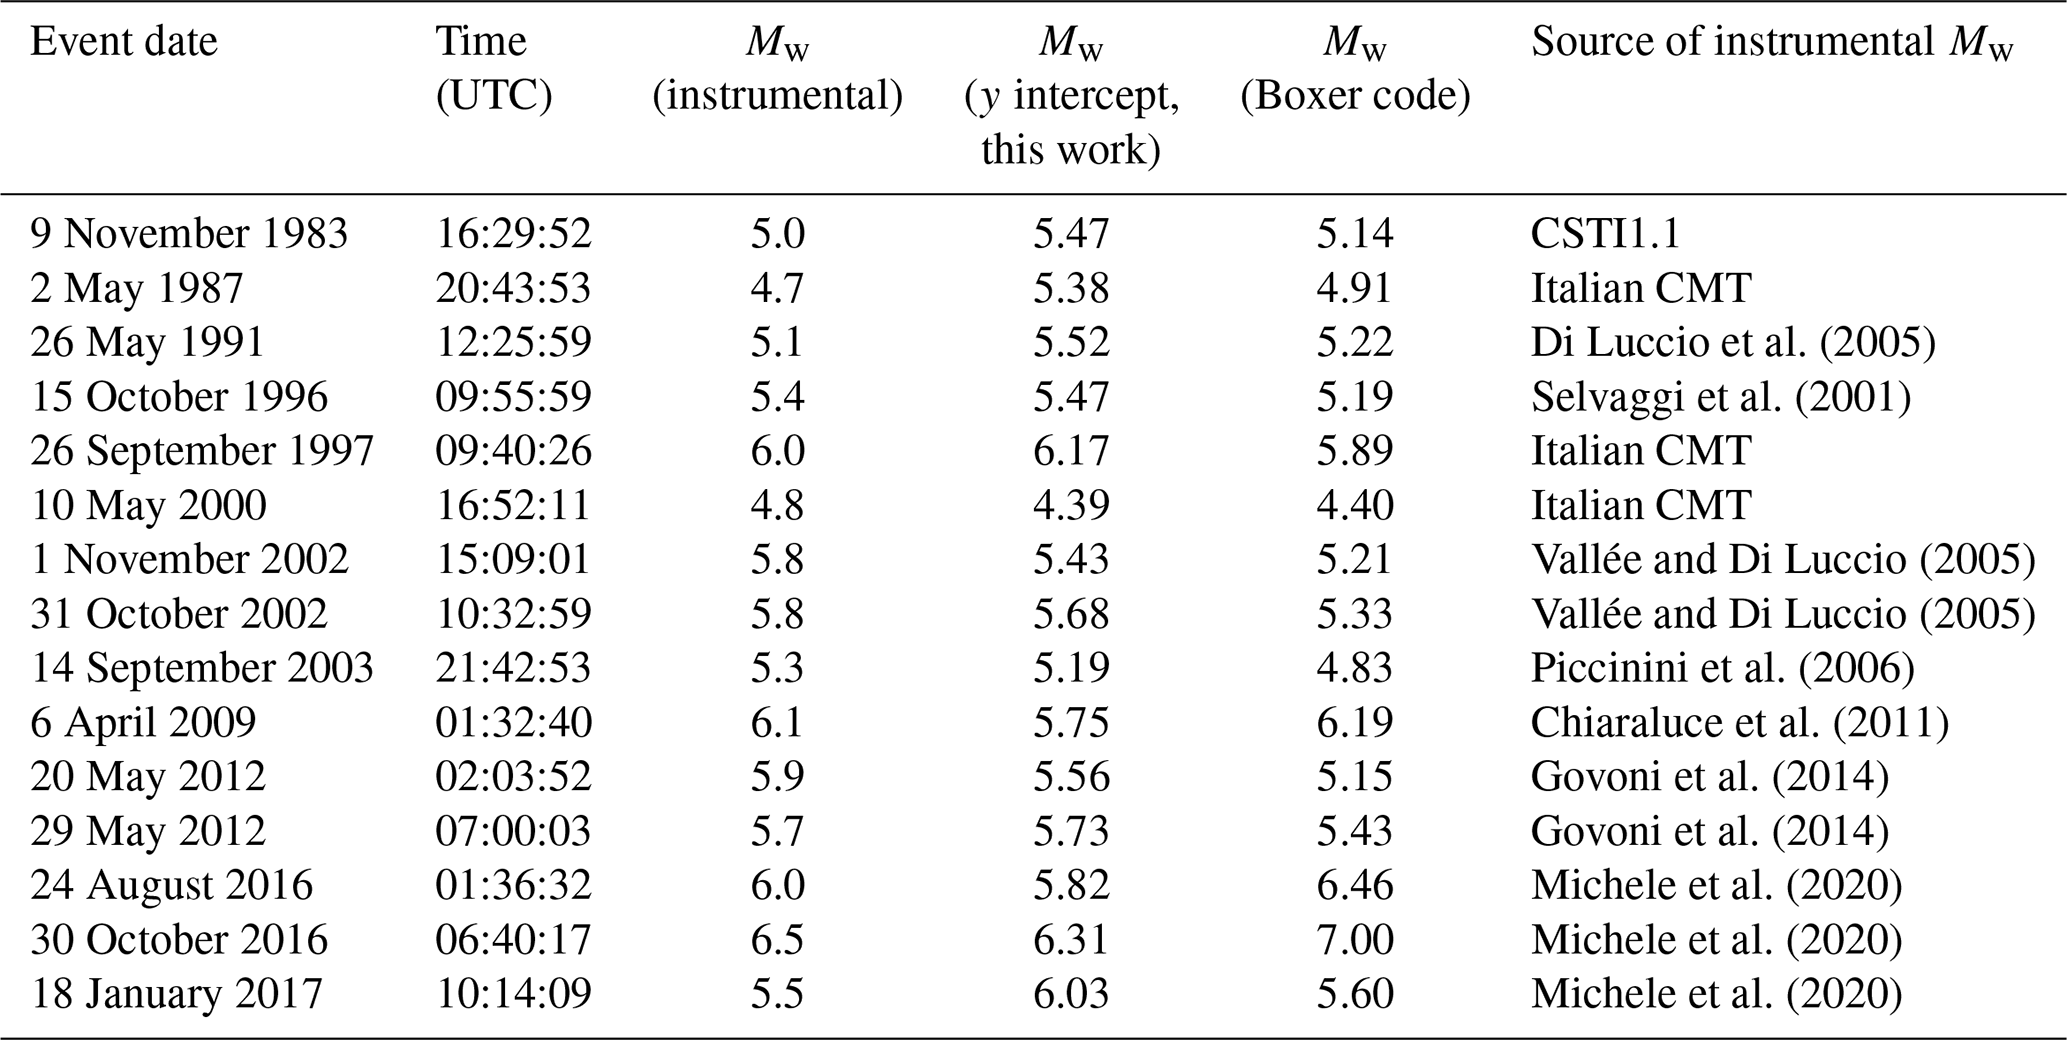
We then compared the macroseismic magnitudes calculated through our method with those calculated through the Boxer method (Gasperini et al., 1999), using the very same intensity dataset from DBMI15. Notice, however, that the parameters of the earthquakes comprising our learning set were computed using also data from other sources, such as HSIT and CFTI5Med (Table 1). Table 2 lists the magnitude of all earthquakes in the learning set for which the comparison was possible. Notwithstanding the significant differences between the two methods, the root mean squared error between instrumental magnitudes and those estimated with Boxer and our method turned out to be comparable at 0.38 and 0.35, respectively.
Di Luccio et al. (2005)Selvaggi et al. (2001)Vallée and Di Luccio (2005)Vallée and Di Luccio (2005)Piccinini et al. (2006)Chiaraluce et al. (2011)Govoni et al. (2014)Govoni et al. (2014)Michele et al. (2020)Michele et al. (2020)Michele et al. (2020)Table 2Comparison of Mw estimates. The source of Mw (Boxer code) is the CPTI15 v2.0 catalogue (Rovida et al., 2019), with the exception of the last three events, whose Mw is from Rossi et al. (2019). The Mw (y intercept) is from this work.
Finally, the reliability of the y-intercept Mw is a function primarily of the accuracy of the macroseismic field from which IE is derived but also of the estimated depth. For instance, we examined the 13 January 1909 northern Italy earthquake (https://emidius.mi.ingv.it/ASMI/event/19090113_0045_000, last access: 22 December 2022), whose macroseismic field is suggestive of a rather deep source. We obtained a depth of 44 km, yielding Mw 5.5; were this earthquake to be much shallower (e.g., 5 km), Eq. (4) would return a substantially lower Mw value (5.1).
We applied our methodology to the pre-1984 earthquakes of the DBMI15 v2.0 catalogue (Locati et al., 2019). We analyzed only pre-1984 events because their parameters were computed from intensity data as their instrumental location is generally unreliable, although there are notable exceptions (see discussion in Rovida et al., 2021).
We first selected the earthquakes to be analyzed: they must meet all criteria listed in Sect. 3.1 (“Data selection criteria”). We made an exception only for earthquake no. 6, for which we reduced the minimum number of MDPs from 60 to 30 based on the conclusions drawn in Sect. 3.5 (“Reliability and validation of the depth estimation method”). These criteria were passed by 206 out of 2679 earthquakes (Fig. 11 and Table S1), which comprise the analyzed set of this work. Unfortunately, the vast majority of the events listed in DBMI15 exhibit less than 30 MDPs within the first 55 km from the epicenter and therefore had to be discarded. To estimate the depth of the 206 events that were retained, we first calculated the steepness of the line that best fits the first 50 km of the attenuation curve of each event and then we used Eq. (5), which is simply the reverse of Eq. (3):
We recall that D is the depth and S is the steepness (see Sect. 3.2 for the application ranges).
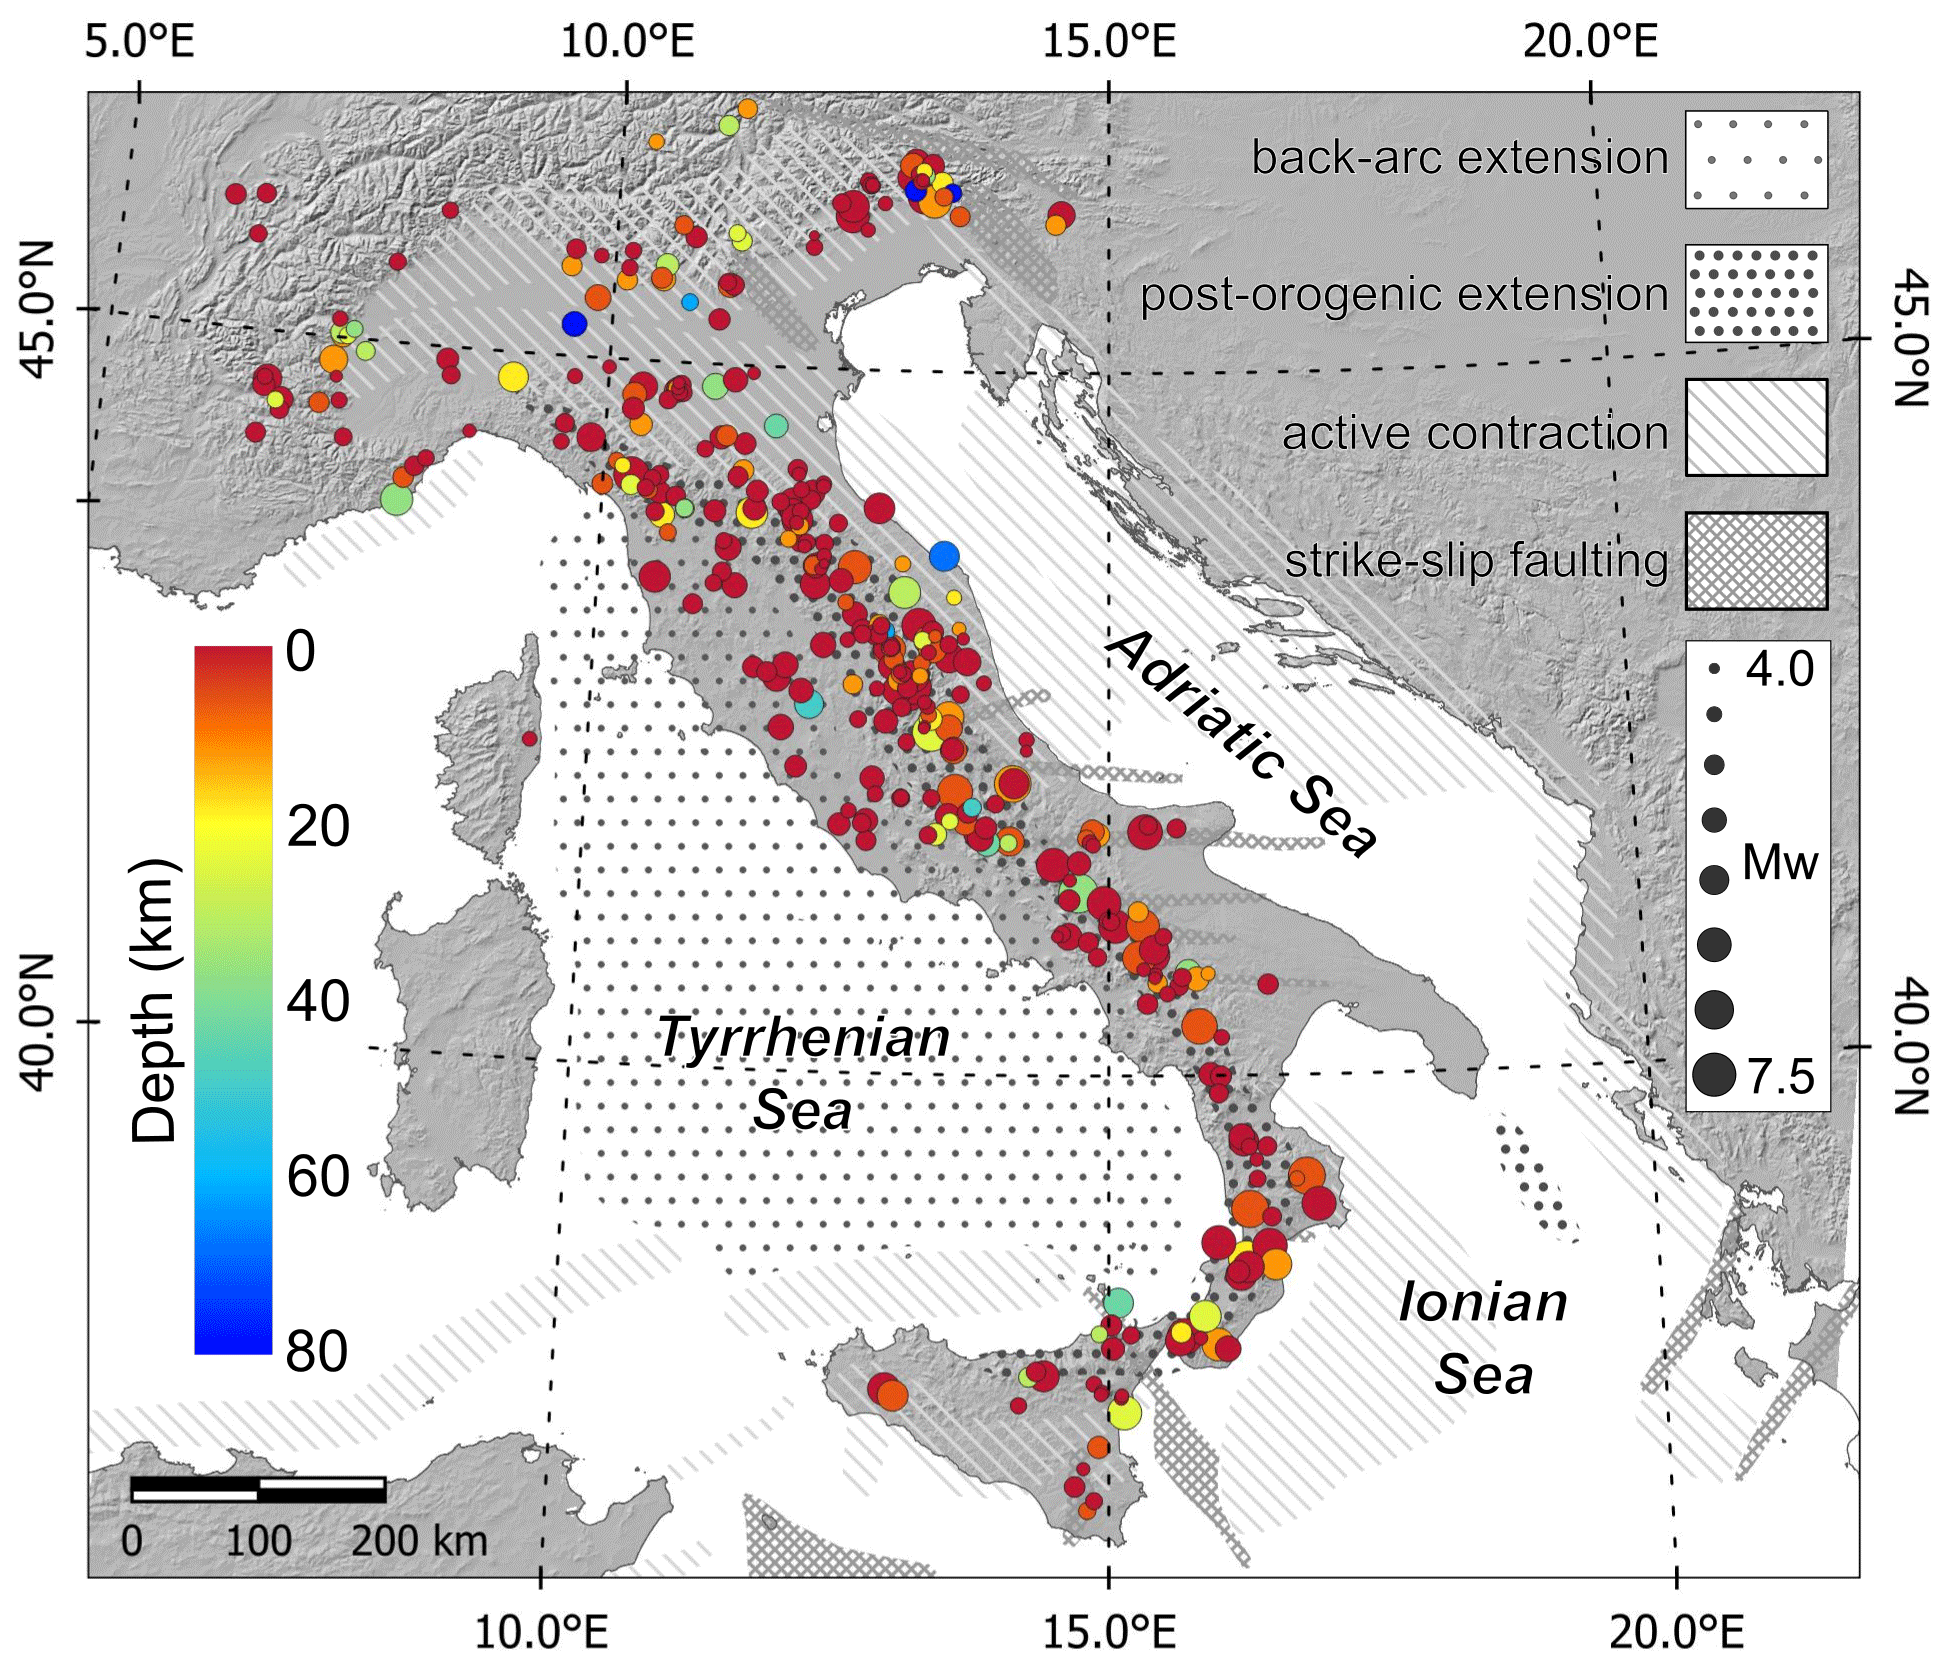
Figure 11Estimated depth calculated using our approach (color-coded) for the 206 earthquakes in the analyzed set, shown with symbol size scaled with the magnitude calculated in this work. The areas with different patterns indicate active tectonic domains that exist in the Italian Peninsula and surrounding areas (same as Fig. 1) (from Vannoli et al., 2021).
In Sect. 3.2 we clarified that we can calculate a reliable depth only for events whose steepness falls in the interval 0.058 to 0.012 (Fig. 5), which corresponds to the depth interval 5.0–73.0 km, respectively (Table S1). This implies that an inferred 5.0 km depth must be intended as ≤5.0 km, and similarly, a 73.0 km depth stands for ≥73.0 km.
We wish to stress once again that the reliability of the magnitude and depth determinations shown in Fig. 11 and Table S1 depends on both the quality of the macroseismic data and the accuracy of the epicentral locations. For completeness of information, Table S1 also reports the full details of the processing for each of the selected events; in addition the .zip files of S1 and S2 in the Supplement contain the histograms of the number of MDPs in ranges of distances up to 50 km from the epicenter (as in Fig. 2) and the attenuation curves of the 206 earthquakes in the analyzed set, thus allowing for a detailed examination of all analyzed data. The uncertainty associated with the inferred depths is determined by the confidence bands shown in Fig. 5 and is hence larger for deeper earthquakes (Table S1 shows the depth range obtained by calculating the lower and upper limits of the 95 % confidence band). In addition, Eqs. (3) and (5) are affected by the accuracy of the instrumental location of the earthquakes in the learning set, on the basis of which the logarithmic-curve data are fitted. Some of the inferred depths have larger confidence intervals, due to inherent uncertainties that are reflected in the determination of the steepness and of the y intercept (as defined in Sect. 3.8): these may include the cumulation of damage (see Sect. 3.7) from subsequent shocks, unpredictable anomalies in wave propagation, strong source directivity, and site amplification effects, all of which may also cause a sizable shift in the epicentral location.
Once the depth of the 206 selected earthquakes is known, we can estimate their magnitude using Eq. (4). All estimated depths and magnitudes are shown in Fig. 11 (see Table S1). We used the equations on the analyzed set even beyond the application limits of IE to still estimate an indicative magnitude (in these cases magnitudes are marked in Table S1 with an asterisk).
Before comparing the Mw estimates obtained with our approach and those listed in the CPTI15 catalogue, we must recall that all Mw estimates supplied by this catalogue are inherently hybrid. When the catalogue reports both an instrumental and a macroseismic epicenter, the decision to adopt the macroseismic or the instrumental value as “preferred” is made on a case-by-case basis by the catalogue compilers. For the vast majority of these 206 events, the CPTI15 catalogue adopted the intensity-based magnitude as the preferred Mw (Rovida et al., 2021).
Figure 12 shows a comparison of the magnitude obtained with our methodology with the corresponding magnitude listed in the CPTI15 catalogue (Table S1). The two sets of estimates are generally consistent, yet on average the magnitudes calculated in the present work show a difference of +0.25 magnitude units. Moreover, Vannucci et al. (2021) stated that the magnitudes of all pre-instrumental earthquakes in the CPTI15 catalogue might be overestimated by 0.1–0.2 units due to differences in the response of pre-1960 seismographs relative to the response of more recent and better calibrated electromagnetic sensors. Recalibrating the Boxer coefficients for magnitude calculation using only events from 1960 to 2009 results in macroseismic moment magnitudes that are lower than those reported by the CPTI15 catalogue by 0.144 magnitude units, on average (Vannucci et al., 2021). If this were the case, the difference between our estimates and the CPTI15 estimates summarized in Fig. 12 would be even larger.

Figure 12Correlation between the Mw calculated with the y-intercept approach proposed in this work and the Mw reported in the latest version of the pre-1984 CPTI15 catalogue (Rovida et al., 2021) for the 206 events in the analyzed set (Table S1). Earthquakes falling above or below the blue line exhibit a higher (up to +1.12 magnitude units) or lower (up to −0.48 magnitude units) Mw value, respectively. The global average is +0.25 magnitude units.
The calculated Mw may also vary if we consider macroseismic intensities assigned using the MCS or the EMS (European Macroseismic Scale); according to Vannucci et al. (2021), using one or the other may cause differences in the macroseismic location.
It is important to be aware that the calculation of Mw from macroseismic data, using either Boxer or our methodology, is controlled by a number of variables whose relative weight is critical: assigning proper weights, however, is not an easy task, regardless of the quality of the data and of the reliability of the adopted algorithm.
The +0.25 magnitude unit difference we found implies that on average our seismic moments are 2.3 times larger than those obtained using the Boxer method, a conclusion that may have strong implications for the assessment of seismic hazard.
In this study we present a two-step procedure for deriving the depth and magnitude of Italian pre-instrumental earthquakes from official, publicly accessible macroseismic intensity datasets: the traditional macroseismic historical dataset supplied by DBMI15 and the new web-based macroseismic HSIT dataset. The main merit of the proposed methodology is its objectivity and ease of application.
Web-based macroseismic platforms allow for a large number of data to be collected through crowdsourcing; they are often the only available source of information concerning the effects of low–medium-magnitude earthquakes and of the far-field effects of larger events. In fact, HSIT data were critical to perform this work because – especially for deeper earthquakes (>30 km) – they were almost always the only available macroseismic observations available for our learning set.
We proved that the initial 50 km of the attenuation curve contains all the elements needed to retrieve not only the depth but also the magnitude of any given earthquake. The methodology was tested on Italian earthquakes, but we maintain that it can be extended to other countries, following the necessary calibrations.
The first step of our procedure involves the calculation of earthquake depth (Eq. 5). Based on our empirical observations we show that the steepness of the attenuation curve in the first 50 km from the epicenter does not vary much due to regional differences in seismic-wave propagation properties (Fig. 5) so that for these distances the only significant trade-off is that between depth and magnitude. We also show that, at least in our learning set, the steepness of the attenuation curve in the first 50 km from the epicenter appears to be independent of magnitude but is largely a function of source depth. This finding implies that the propagation properties do not change much countrywide, despite the well-known complexity of Italian geodynamics and the ensuing geological heterogeneity; as a result, our new relations are valid for the whole Italian territory (Fig. 5).
The second step involves estimating the magnitude through an empirical law obtained from a regression function that relates the expected epicentral intensity to the depth and magnitude of the 42 earthquakes comprising our learning set (Eq. 4). We applied this methodology to 206 earthquakes from the CPTI15 catalogue, after removing all events whose macroseismic field is too sparse or too inhomogeneous to return reliable results.
Our approach allowed us to verify that the inferred depth is consistent with the presumed earthquake-causative tectonic structures and is essential to obtain a well-calibrated magnitude value. We contend that the new methodology may be crucial for mitigating the trade-off between earthquake depth and magnitude; this is a pre-condition for calculating reliable depth estimates – and hence reliable magnitudes – for earthquakes of the pre-instrumental era.
In Italy the historical record is still the main pillar of any seismic-hazard analysis conducted at any scale and using any approach. We maintain that the revised framework discussed in this work may ultimately serve for exploiting more systematically the enormous potential of historical earthquake data and ultimately for providing inherently more reliable input data for seismic-hazard assessment.
Code cannot be shared at this stage.
This work used only published or public domain datasets: Tosi et al. (2007, https://doi.org/10.13127/HSIT), Sbarra et al. (2019b, https://doi.org/10.13127/HSIT/Q.1), and De Rubeis et al. (2019, https://doi.org/10.13127/HSIT/I.1) for Hai Sentito Il Terremoto (HSIT); Guidoboni et al. (2018, https://doi.org/10.6092/INGV.IT-CFTI5); Locati et al. (2019, https://doi.org/10.13127/DBMI/DBMI15.2); Rovida et al. (2019, https://doi.org/10.13127/CPTI/CPTI15.2); QUEST (2023, https://quest.ingv.it/index.php/rilievi-macrosismici, last access: 21 February 2023); ISIDe Working Group (2007, https://doi.org/10.13127/ISIDE); and Pondrelli and Salimbeni (2007, https://doi.org/10.13127/rcmt/italy).
The supplement related to this article is available online at: https://doi.org/10.5194/nhess-23-1007-2023-supplement.
PS conceived the work and wrote the initial draft of the paper. PB, PT, PV, and GV contributed to delineating the structure of the paper. PB, PV, and GV provided information on the seismotectonic background, along with the associated interpretations. PS and RV analyzed the macroseismic data, and RV implemented the algorithms in the R language. PT tested the method through the use of synthetic data. VDR statistically evaluated the effects of using finite seismic sources. PS and GV did most of the writing. All authors discussed the results and contributed to the final version of the paper.
The contact author has declared that none of the authors has any competing interests.
Publisher’s note: Copernicus Publications remains neutral with regard to jurisdictional claims in published maps and institutional affiliations.
We thank Franco Mele, Mario Locati, Graziano Ferrari, Livio Sirovich, and Franco Pettenati for suggestions and for providing valuable insight during the early stages of this work.
This research has been supported by the Dipartimento della Protezione Civile, Presidenza del Consiglio dei Ministri (INGV DPC, 2019–2021 agreement; All. A, WP 7).
This paper was edited by Filippos Vallianatos and reviewed by three anonymous referees.
Albarello, D. and D'Amico, V.: Attenuation relationship of macroseismic intensity in Italy for probabilistic seismic hazard assessment, B. Geofis. Teor. Appl., 45, 271–284, 2004. a, b
Ambraseys, N.: Intensity-attenuation and magnitude-intensity relationships for northwest European earthquakes, Earthq. Eng. Struct. D., 13, 733–778, 1985. a
Bakun, W., Johnston, A., and Hopper, M.: Estimating locations and magnitudes of earthquakes in eastern North America from modified Mercalli intensities, B. Seismol. Soc. Am., 93, 190–202, https://doi.org/10.1785/0120020087, 2003. a
Bakun, W. H. and Scotti, O.: Regional intensity attenuation models for France and the estimation of magnitude and location of historical earthquakes, Geophys. J. Int., 164, 596–610, https://doi.org/10.1111/j.1365-246X.2005.02808.x, 2006. a
Bakun, W. H. and Wentworth, C. M.: Estimating earthquake location and magnitude from seismic intensity data, B. Seismol. Soc. Am., 87, 1502–1521, 1997. a
Basili, R., Valensise, G., Vannoli, P., Burrato, P., Fracassi, U., Mariano, S., Tiberti, M. M., and Boschi, E.: The Database of Individual Seismogenic Sources (DISS), version 3: Summarizing 20 years of research on Italy's earthquake geology, Tectonophysics, 453, 20–43, https://doi.org/10.1016/j.tecto.2007.04.014, 2008. a
Blake, A.: On the estimation of focal depth from macroseismic data, B. Seismol. Soc. Am., 31, 225–231, https://doi.org/10.1785/BSSA0310030225, 1941. a, b
Bonini, L., Basili, R., Burrato, P., Cannelli, V., Fracassi, U., Maesano, F. E., Melini, D., Tarabusi, G., Tiberti, M. M., Vannoli, P., and Valensise, G.: Testing Different Tectonic Models for the Source of the Mw 6.5, 30 October 2016, Norcia Earthquake (Central Italy): A Youthful Normal Fault, or Negative Inversion of an Old Thrust?, Tectonics, 38, 990–1017, https://doi.org/10.1029/2018TC005185, 2019. a
Boschi, E., Ferrari, G., Gasperini, P., Guidoboni, E., Smriglio, G., and Valensise, G.: Catalogo dei forti terremoti in Italia dal 461 a.C. al 1980, CDROM, ING-SGA [data set], ISBN 88-85213-07-3, 1995. a
Boschi, E., Guidoboni, E., Ferrari, G., Mariotti, D., Valensise, G., and Gasperini, P.: Catalogue of Strong Italian Earthquakes from 461 BC to 1997 (Appendix to volume 43 N∘ 4, 2000), Ann. Geophys.-Italy, 43, 609–868, https://doi.org/10.4401/ag-3668, 2000. a
Bragato, P., Sugan, M., Augliera, P., Massa, M., Vuan, A., and Saraò, A.: Moho reflection effects in the Po Plain (northern Italy) observed from instrumental and intensity data, B. Seismol. Soc. Am., 101, 2142–2152, https://doi.org/10.1785/0120100257, 2011. a
Burton, P., McGonigle, R., Neilson, G., and Musson, R. M.: 8. Macroseismic focal depth and intensity attenuation for British earthquakes, in: Earthquake engineering in Britain, Thomas Telford Publishing, 91–109, 1985. a, b
Buttinelli, M., Petracchini, L., Maesano, F. E., D'Ambrogi, C., Scrocca, D., Marino, M., Capotorti, F., Bigi, S., Cavinato, G. P., Mariucci, M. T., Montone, P., and Di Bucci, D.: The impact of structural complexity, fault segmentation, and reactivation on seismotectonics: Constraints from the upper crust of the 2016–2017 Central Italy seismic sequence area, Tectonophysics, 810, 228861, https://doi.org/10.1016/j.tecto.2021.228861, 2021. a
Castello, B., Selvaggi, G., Chiarabba, C., and Amato, A.: Catalogo della sismicità italiana (CSI) 1981-2002, Istituto Nazionale di Geofisica e Vulcanologia (INGV) [data set], https://doi.org/10.13127/CSI.1.1, 2006. a
Cattaneo, M., Frapiccini, M., Ladina, C., Marzorati, S., and Monachesi, G.: A mixed automatic-manual seismic catalog for Central-Eastern Italy: analysis of homogeneity, Ann. Geophys.-Italy, 60, S0667, https://doi.org/10.4401/ag-7333, 2017. a, b
Cauzzi, C. and Faccioli, E.: Broadband (0.05 to 20 s) prediction of displacement response spectra based on worldwide digital records, J. Seismol., 12, 453–475, https://doi.org/10.1007/s10950-008-9098-y, 2008. a, b, c
Chiarabba, C. and De Gori, P.: The seismogenic thickness in Italy: constraints on potential magnitude and seismic hazard, Terra Nova, 28, 402–408, https://doi.org/10.1111/ter.12233, 2016. a
Chiarabba, C., De Gori, P., and Speranza, F.: The southern Tyrrhenian subduction zone: Deep geometry, magmatism and Plio-Pleistocene evolution, Earth Planet. Sc. Lett., 268, 408–423, https://doi.org/10.1016/j.epsl.2008.01.036, 2008. a
Chiaraluce, L., Valoroso, L., Piccinini, D., Di Stefano, R., and De Gori, P.: The anatomy of the 2009 L'Aquila normal fault system (central Italy) imaged by high resolution foreshock and aftershock locations, J. Geophys. Res., 116, B12311, https://doi.org/10.1029/2011JB008352, 2011. a, b, c
Davis, J. C. and Sampson, R. J.: Statistics and data analysis in geology, 3rd edn., Wiley New York, ISBN 978-0-471-17275-8, 2002. a
De Luca, G., Cattaneo, M., Monachesi, G., and Amato, A.: Seismicity in Central and Northern Apennines integrating the Italian national and regional networks, Tectonophysics, 476, 121–135, https://doi.org/10.1016/j.tecto.2008.11.032, 2009. a
De Martini, P. M., Alessandro Pino, N., Valensise, G., and Mazza, S.: Geodetic and seismologic evidence for slip variability along a blind normal fault in the Umbria-Marche 1997–1998 earthquakes (central Italy), Geophys. J. Int., 155, 819–829, https://doi.org/10.1111/j.1365-246X.2003.02049.x, 2003. a
De Rubeis, V., Sbarra, P., and Tosi, P.: Regional macroseismic field and intensity residuals of the August 24, 2016, MW=6.0 central Italy earthquake, Ann. Geophys.-Italy, 59, Fast track 5, https://doi.org/10.4401/ag-7217, 2016. a
De Rubeis, V., Sbarra, P., Tosi, P., and Sorrentino, D.: Hai Sentito Il Terremoto (HSIT) - Macroseismic intensity database 2007-2018, version 1, Istituto Nazionale di Geofisica e Vulcanologia (INGV) [data set], https://doi.org/10.13127/HSIT/I.1, 2019. a, b, c, d
Dengler, L. and Dewey, J.: An intensity survey of households affected by the Northridge, California, earthquake of 17 January 1994, B. Seismol. Soc. Am., 88, 441–462, 1998. a
Dewey, J. W., Hopper, M. G., Wald, D. J., Quitoriano, V., and Adams, E. R.: Intensity distribution and isoseismal maps for the Nisqually, Washington, earthquake of 28 February 2001, US Geol. Surv., Open-File Report 2002-346, 57 pp., 2002. a
Di Bona, M.: A local magnitude scale for crustal earthquakes in Italy, B. Seismol. Soc. Am., 106, 242–258, https://doi.org/10.1785/0120150155, 2016. a
Di Bucci, D., Burrato, P., Vannoli, P., and Valensise, G.: Tectonic evidence for the ongoing Africa-Eurasia convergence in central Mediterranean foreland areas: A journey among long-lived shear zones, large earthquakes, and elusive fault motions, J. Geophys. Res.-Sol. Ea., 115, B12404, https://doi.org/10.1029/2009JB006480, 2010. a
Di Luccio, F., Piscini, A., Pino, N. A., and Ventura, G.: Reactivation of deep faults beneath Southern Apennines: evidence from the 1990–1991 Potenza seismic sequences, Terra Nova, 17, 586–590, https://doi.org/10.1111/j.1365-3121.2005.00653.x, 2005. a, b, c, d, e
DISS Working Group: Database of Individual Seismogenic Sources (DISS), version 3.3.0: A compilation of potential sources for earthquakes larger than M 5.5 in Italy and surrounding areas, Istituto Nazionale di Geofisica e Vulcanologia (INGV) [data set], https://doi.org/10.13127/DISS3.3.0, 2021. a, b, c
Douglas, J.: Earthquake ground motion estimation using strong-motion records: a review of equations for the estimation of peak ground acceleration and response spectral ordinates, Earth-Sci. Rev., 61, 43–104, https://doi.org/10.1016/S0012-8252(02)00112-5, 2003. a
Douglas, J.: Ground motion prediction equations 1964–2021, http://www.gmpe.org.uk (last access: 22 December 2022), 2021. a
Faenza, L. and Michelini, A.: Regression analysis of MCS intensity and ground motion parameters in Italy and its application in ShakeMap, Geophys. J. Int., 180, 1138–1152, https://doi.org/10.1111/j.1365-246X.2009.04467.x, 2010. a, b
Fah, D. and Panza, G. F.: Realistic modelling of observed seismic motion in compIex sedimentary basins, Ann. Geophys.-Italy, 37, 6, https://doi.org/10.4401/ag-4141, 1994. a
Frepoli, A., Cimini, G., De Gori, P., De Luca, G., Marchetti, A., Monna, S., Montuori, C., and Pagliuca, N.: Seismic sequences and swarms in the Latium-Abruzzo-Molise Apennines (central Italy): New observations and analysis from a dense monitoring of the recent activity, Tectonophysics, 712–713, 312–329, https://doi.org/10.1016/j.tecto.2017.05.026, 2017. a, b
Galli, P.: Recurrence times of central-southern Apennine faults (Italy): hints from palaeoseismology, Terra Nova, 32, 399–407, 2020. a
Galli, P., Camassi, R., Castenetto, S., Lucantoni, A., Molin, D., Naso, G., Peronace, E., Bernardini, F., Cavaliere, A., Ercolani, E., Castelli, V., Salimbeni, S., Tripone, D., Vannucci, G., Arcoraci, L., Berardi, M., Castellano, C., Del Mese, S., Graziani, L., Leschiutta, I., Massucci, A., Maramai, A., Rossi, A., Tertulliani, A., Vecchi, M., Azzaro, R., D'Amico, S., Ferrari, F., Platania, P. R., Scarfì, L., Tuvè, T., Zuccarello, L., Carlino, S., Marturano, A., Albini, P., Gómez Capera, A. A., Stucchi, M., Locati, M., Meroni, F., Pessina, V., Piccarreda, C., Rovida, A., Buffarini, G., Paolini, S., Verrubbi, V., Mucciarelli, M., Gallipoli, M., Barbano, M. S., and Cecić, I.: Rapporto sugli effetti del terremoto aquilano del 6 aprile 2009, Istituto Nazionale di Geofisica e Vulcanologia (INGV), https://doi.org/10.13127/QUEST/20090406, 2009. a
Gasparini, C., Conte, S., and Vannucci, C.: Bollettino macrosismico 2001-2005, Istituto Nazionale di Geofisica e Vulcanologia (INGV) [data set], https://emidius.mi.ingv.it/ASMI/study/BMINGV011 (last access: 22 February 2023), 2011. a, b, c, d, e
Gasperini, P.: The Attenuation of Seismic Intensity in Italy: A Bilinear Shape Indicates the Dominance of Deep Phases at Epicentral Distances Longer than 45 km, B. Seismol. Soc. Am., 91, 826–841, https://doi.org/10.1785/0120000066, 2001. a, b, c, d, e, f, g
Gasperini, P., Bernardini, F., Valensise, G., and Boschi, E.: Defining seismogenic sources from historical earthquake felt reports, B. Seismol. Soc. Am., 89, 94–110, 1999. a, b, c, d
Govoni, A., Marchetti, A., De Gori, P., Di Bona, M., Lucente, F. P., Improta, L., Chiarabba, C., Nardi, A., Margheriti, L., Agostinetti, N. P., Di Giovambattista, R., Latorre, D., Anselmi, M., Ciaccio, M. G., Moretti, M., Castellano, C., and Piccinini, D.: The 2012 Emilia seismic sequence (Northern Italy): Imaging the thrust fault system by accurate aftershock location, Tectonophysics, 622, 44–55, https://doi.org/10.1016/j.tecto.2014.02.013, 2014. a, b, c, d, e, f, g, h, i
Graziani, L., Del Mese, S., Tertulliani, A., Arcoraci, L., Maramai, A., and Rossi, A.: Investigation on damage progression during the 2016–2017 seismic sequence in Central Italy using the European Macroseismic Scale (EMS-98), B. Earthq. Eng., 17, 5535–5558, https://doi.org/10.1007/s10518-019-00645-w, 2019. a
Grimaz, S. and Malisan, P.: How could cumulative damage affect the macroseismic assessment?, B. Earthq. Eng., 15, 2465–2481, https://doi.org/10.1007/s10518-016-0016-3, 2017. a
Grünthal, G. (Ed.): European Macroseismic Scale 1998 (EMS-98) European Seismological Commission, sub commission on Engineering Seismology, Working Group Macroseismic Scales, Conseil de l’Europe, Cahiers du Centre Européen de Géodynamique et de Séismologie, Vol. 15, Luxembourg, ISBN 2-87977-008-4, 1998. a
Guidoboni, E. and Ebel, J.: Earthquakes and Tsunamis in the Past. A Guide to Techniques in Historical Seismology, Cambridge University Press, ISBN 978-0-521-83795-8, https://hdl.handle.net/2122/5880 (last access: 22 December 2022), 2009. a
Guidoboni, E., Ferrari, G., Mariotti, D., Comastri, A., Tarabusi, G., Sgattoni, G., and Valensise, G.: CFTI5Med, Catalogo dei Forti Terremoti in Italia (461 a.C.-1997) e nell’area Mediterranea (760 a.C.-1500), Istituto Nazionale di Geofisica e Vulcanologia (INGV) [data set], https://doi.org/10.6092/INGV.IT-CFTI5, 2018. a, b
Guidoboni, E., Ferrari, G., Tarabusi, G., Sgattoni, G., Comastri, A., Mariotti, D., Ciuccarelli, C., Bianchi, M. G., and Valensise, G.: CFTI5Med, the new release of the catalogue of strong earthquakes in Italy and in the Mediterranean area, Scientific Data, 6, 80, https://doi.org/10.1038/s41597-019-0091-9, 2019. a, b
Gutdeutsch, R., Kaiser, D., and Jentzsch, G.: Estimation of earthquake magnitudes from epicentral intensities and other focal parameters in Central and Southern Europe, Geophys. J. Int., 151, 824–834, https://doi.org/10.1046/j.1365-246X.2002.01804.x, 2002. a
Hough, S. E.: Spatial variability of “Did You Feel It?” intensity data: Insights into sampling biases in historical earthquake intensity distributions, B. Seismol. Soc. Am., 103, 2767–2781, 2013. a
Hough, S. E.: Earthquake intensity distributions: A new view, B. Earthq. Eng., 12, 135–155, 2014. a, b
ISIDe Working Group: Italian Seismological Instrumental and Parametric Database (ISIDe), Istituto Nazionale di Geofisica e Vulcanologia (INGV), https://doi.org/10.13127/ISIDE, 2007. a, b, c
Jánosi, I. Makroszeizmikus rengések feldolgozása a Cancani-féle egyenlet alapján, in: Az 1906 évi Magyarországi Földrengések, edited by: Réthly, A., A. M. Kir. Orsz. Met. Föld. Int., Budapest, 77–82, 1906. a, b
Joyner, W. B. and Boore, D. M.: Peak horizontal acceleration and velocity from strong-motion records including records from the 1979 imperial valley, California, earthquake, B. Seismol. Soc. Am., 71, 2011–2038, 1981. a
Kövesligethy, R. v.: Seismischer Stärkegrad und Intensität der Beben, Gerl. Beitr. Geophys., Bd. 8, 24–103, 1907. a, b
Levret, A., Cushing, M., Peyridieu, G., and de protection et de sûreté nucléaire (France), I.: Etude des caractéristiques de séismes historiques en France - Atlas de 140 cartes macrosismiques, Institut de protection et de sûreté nucléaire, Vol. I, 399 pp., 1996. a
Locati, M., Camassi, R., Rovida, A., Ercolani, E., Bernardini, F., Castelli, V., Caracciolo, C. H., Tertulliani, A., Rossi, A., Azzaro, R., D'Amico, S., and Antonucci, A.: Database Macrosismico Italiano (DBMI15), versione 2.0, INGV [data set], https://doi.org/10.13127/DBMI/DBMI15.2, 2019. a, b, c
Locati, M., Camassi, R., Rovida, A., Ercolani, E., Bernardini, F., Castelli, V., Caracciolo, C. H., Tertulliani, A., Rossi, A., Azzaro, R., D'Amico, S., and Antonucci, A.: Database Macrosismico Italiano DBMI15, versione 4.0, INGV [data set], https://doi.org/10.13127/DBMI/DBMI15.4, 2022. a
Lolli, B., Gasperini, P., Mele, F. M., and Vannucci, G.: Recalibration of the Distance Correction Term for Local Magnitude (ML) Computations in Italy, Seismol. Res. Lett., 86, 1383–1392, https://doi.org/10.1785/0220150020, 2015. a
Maesano, F. E., Tiberti, M. M., and Basili, R.: The Calabrian Arc: three-dimensional modelling of the subduction interface, Scientific Reports, 7, 1–15, 2017. a
Maesano, F. E., Tiberti, M. M., and Basili, R.: Deformation and Fault Propagation at the Lateral Termination of a Subduction Zone: The Alfeo Fault System in the Calabrian Arc, Southern Italy, Frontiers in Earth Science, 8, 107, https://doi.org/10.3389/feart.2020.00107, 2020. a
Mariotti, G. and Doglioni, C.: The dip of the foreland monocline in the Alps and Apennines, Earth Planet. Sc. Lett., 181, 191–202, https://doi.org/10.1016/S0012-821X(00)00192-8, 2000. a
Mariucci, M. T. and Montone, P.: Database of Italian present-day stress indicators, IPSI 1.4, Scientific data, 7, 1–11, https://doi.org/10.1038/s41597-020-00640-w, 2020. a
Masi, A., Chiauzzi, L., Nicodemo, G., and Manfredi, V.: Correlations between macroseismic intensity estimations and ground motion measures of seismic events, B. Earthq. Eng., 18, 1899–1932, https://doi.org/10.1007/s10518-019-00782-2, 2020. a, b
Mele, G., Rovelli, A., Seber, D., and Barazangi, M.: Shear wave attenuation in the lithosphere beneath Italy and surrounding regions: Tectonic implications, J. Geophys. Res.-Sol. Ea., 102, 11863–11875, https://doi.org/10.1029/97JB00262, 1997. a, b, c
Meletti, C., Marzocchi, W., D'amico, V., Lanzano, G., Luzi, L., Martinelli, F., Pace, B., Rovida, A., Taroni, M., Visini, F., and and MPS19 Working Group: The new Italian seismic hazard model (MPS19), Ann. Geophys.-Italy, 64, SE112, https://doi.org/10.4401/ag-8579, 2021. a
Michele, M., Chiaraluce, L., Di Stefano, R., and Waldhauser, F.: Fine-Scale Structure of the 2016–2017 Central Italy Seismic Sequence From Data Recorded at the Italian National Network, J. Geophys. Res.-Sol. Ea., 125, e2019JB018440, https://doi.org/10.1029/2019JB018440, 2020. a, b, c, d, e, f
Musson, R.M.W.: Updated intensity attenuation for the UK, British Geological Survey Open Report, OR/13/029, 19 pp., 2013. a, b, c, d
Musson, R.M.W.: Determination of parameters for historical British earthquakes, Ann. Geophys.-Italy, 39, https://doi.org/10.4401/ag-4035, 1996. a, b, c
Oliveira, C. S. and Ferreira, M. A.: Following the video surveillance and personal video cameras: New tools and innovations to health monitor the earthquake wave field, Int. J. Disast. Risk Re., 64, 102489, https://doi.org/10.1016/j.ijdrr.2021.102489, 2021. a
Olivieri, M. and Ekström, G.: Rupture depths and source processes of the 1997–1998 earthquake sequence in central Italy, B. Seismol. Soc. Am., 89, 305–310, https://doi.org/10.1785/BSSA0890010305, 1999. a, b
Pasolini, C., Albarello, D., Gasperini, P., D'Amico, V., and Lolli, B.: The Attenuation of Seismic Intensity in Italy, Part II: Modeling and Validation, B. Seismol. Soc. Am., 98, 692–708, https://doi.org/10.1785/0120070021, 2008. a
Piccinini, D., Chiarabba, C., Augliera, P., and Monghidoro Earthquake Group (M.E.G.): Compression along the northern Apennines? Evidence from the Mw 5.3 Monghidoro earthquake, Terra Nova, 18, 89–94, https://doi.org/10.1111/j.1365-3121.2005.00667.x, 2006. a, b, c
Pondrelli, S. and Salimbeni, S.: Italian CMT Dataset, Istituto Nazionale di Geofisica e Vulcanologia (INGV) [data set], https://doi.org/10.13127/rcmt/italy, 2007. a
Pondrelli, S., Visini, F., Rovida, A., D'Amico, V., Pace, B., and Meletti, C.: Style of faulting of expected earthquakes in Italy as an input for seismic hazard modeling, Nat. Hazards Earth Syst. Sci., 20, 3577–3592, https://doi.org/10.5194/nhess-20-3577-2020, 2020. a
Provost, L. and Scotti, O.: QUake‐MD: Open‐Source Code to Quantify Uncertainties in Magnitude–Depth Estimates of Earthquakes from Macroseismic Intensities, Seismol. Res. Lett., 91, 2520–2530, https://doi.org/10.1785/0220200064, 2020. a, b
QUEST: https://quest.ingv.it/index.php/rilievi-macrosismici, last access 21 February 2023. a
Rosenbaum, G. and Piana Agostinetti, N.: Crustal and upper mantle responses to lithospheric segmentation in the northern Apennines, Tectonics, 34, 648–661, https://doi.org/10.1002/2013TC003498, 2015. a
Rossi, A., Tertulliani, A., Azzaro, R., Graziani, L., Rovida, A., Maramai, A., Pessina, V., Hailemikael, S., Buffarini, G., Bernardini, F., Camassi, R., Del Mese, S., Ercolani, E., Fodarella, A., Locati, M., Martini, G., Paciello, A., Paolini, S., Arcoraci, L., Castellano, C., Verrubbi, V., and Stucchi, M.: The 2016–2017 earthquake sequence in Central Italy: macroseismic survey and damage scenario through the EMS-98 intensity assessment, B. Earthq. Eng., 17, 2407–2431, https://doi.org/10.1007/s10518-019-00556-w, 2019. a
Rovida, A., Locati, M., Camassi, R., Lolli, B., and Gasperini, P.: Catalogo Parametrico dei Terremoti Italiani (CPTI15), versione 2.0, INGV [data set], https://doi.org/10.13127/CPTI/CPTI15.2, 2019. a, b, c, d
Rovida, A., Locati, M., Camassi, R., Lolli, B., and Gasperini, P.: The Italian earthquake catalogue CPTI15, B. Earthq. Eng., 18, 2953–2984, 2020. a, b
Rovida, A., Locati, M., Camassi, R., Lolli, B., Gasperini, P., and Antonucci, A.: Catalogo Parametrico dei Terremoti Italiani (CPTI15), versione 3.0, INGV [data set], https://doi.org/10.13127/CPTI/CPTI15.3, 2021. a, b, c, d
Sbarra, P., Tosi, P., and De Rubeis, V.: Web-based macroseismic survey in Italy: Method validation and results, Nat. Hazards, 54, 563–581, 2010. a
Sbarra, P., Tosi, P., De Rubeis, V., and Rovelli, A.: Influence of observation floor and building height on macroseismic intensity, Seismol. Res. Lett., 83, 261–266, 2012. a
Sbarra, P., Tosi, P., and De Rubeis, V.: How observer conditions impact earthquake perception, Seismol. Res. Lett., 85, 306–313, 2014. a
Sbarra, P., Burrato, P., Tosi, P., Vannoli, P., e Rubeis, V., and Valensise, G.: Inferring the depth of pre-instrumental earthquakes from macroseismic intensity data: a case-history from Northern Italy, Scientific Reports, 9, 1–13, https://doi.org/10.1038/s41598-019-51966-4, 2019a. a, b, c, d, e, f, g, h, i, j, k, l, m, n
Sbarra, P., Tosi, P., De Rubeis, V., and Sorrentino, D.: HSIT macroseismic questionnaire database 2007-2018, version 1, Istituto Nazionale di Geofisica e Vulcanologia (INGV) [data set], https://doi.org/10.13127/HSIT/Q.1, 2019b. a, b, c
Scardia, G., Festa, A., Monegato, G., Pini, R., Rogledi, S., Tremolada, F., and Galadini, F.: Evidence for late Alpine tectonics in the Lake Garda area (northern Italy) and seismogenic implications, GSA Bulletin, 127, 113–130, https://doi.org/10.1130/B30990.1, 2015. a
Scrocca, D., Carminati, E., Doglioni, C., and Marcantoni, D.: Slab Retreat and Active Shortening along the Central-Northern Apennines, in: Thrust Belts and Foreland Basins, edited by: Lacombe, O., Roure, F., Lavé, J., and Vergés, J., Springer Berlin Heidelberg, Berlin, Heidelberg, 471–487, https://doi.org/10.1007/978-3-540-69426-7_25, 2007. a
Selvaggi, G., Ferulano, F., Di Bona, M., Frepoli, A., Azzara, R., Basili, A., Chiarabba, C., Ciaccio, M., Di Luccio, F., Lucente, F., Margheriti, L., and Nostro, C.: The MW 5.4 Reggio Emilia 1996 earthquake: active compressional tectonics in the Po Plain, Italy, Geophys. J. Int., 144, 1–13, 2001. a, b, c, d
Sirovich, L., Pettenati, F., and Cavallini, F.: Intensity-based source inversion of the destructive earthquake of 1695 in the southern Apennines, Italy, J. Geophys. Res.-Sol. Ea., 118, 6241–6257, https://doi.org/10.1002/2013JB010245, 2013. a
Sponheuer, W.: Methoden zur Herdtiefenbestimmung in der Makroseismik, Freiberger Forschungsh, Freiberger Forschungshefte, C88, 117 pp., http://digital.slub-dresden.de/id1680570072 (last access: 22 December 2022), 1960. a, b
Tertulliani, A. and Azzaro, R.: QUEST - Rilievo macrosismico in EMS98 per il terremoto di Amatrice del 24 agosto 2016, Zenodo [data set], https://doi.org/10.5281/zenodo.160707, 2016. a, b
Tertulliani, A. and Azzaro, R.: QUEST - Rilievo macrosismico in EMS98 per la sequenza sismica in Italia Centrale: aggiornamento dopo il 18 gennaio 2017, Zenodo [data set], https://doi.org/10.5281/zenodo.556929, 2017. a
Tertulliani, A., Arcoraci, L., Berardi, M., Bernardini, F., Brizuela, B., Castellano, C., Del Mese, S., Ercolani, E., Graziani, L., Maramai, A., Rossi, A., Sbarra, M., and Vecchi, M.: The Emilia 2012 sequence: a macroseismic survey, Ann. Geophys.-Italy, 55, 679–687, https://doi.org/10.4401/ag-6140, 2012. a
Tosi, P., De Rubeis, V., Sbarra, P., and Sorrentino, D.: Hai Sentito Il Terremoto (HSIT), Istituto Nazionale di Geofisica e Vulcanologia (INGV) [data set], https://doi.org/10.13127/HSIT, 2007. a, b, c
Tosi, P., Sbarra, P., De Rubeis, V., and Ferrari, C.: Macroseismic intensity assessment method for web questionnaires, Seismol. Res. Lett., 86, 985–990, 2015. a, b
Traversa, P., Baumont, D., Manchuel, K., Nayman, E., and Durouchoux, C.: Exploration tree approach to estimate historical earthquakes Mw and depth, test cases from the French past seismicity, B. Earthq. Eng., 16, 2169–2193, https://doi.org/10.1007/s10518-017-0178-7, 2018. a, b
Valensise, G., Vannoli, P., Burrato, P., and Fracassi, U.: From Historical Seismology to seismogenic source models, 20 years on: Excerpts from the Italian experience, Tectonophysics, 774, 228189, https://doi.org/10.1016/j.tecto.2019.228189, 2020. a
Vallée, M. and Di Luccio, F.: Source analysis of the 2002 Molise, southern Italy, twin earthquakes (10/31 and 11/01), Geophys. Res. Lett., 32, L12309, https://doi.org/10.1029/2005GL022687, 2005. a, b, c, d, e, f
Vannoli, P., Burrato, P., and Valensise, G.: The seismotectonics of the Po Plain (northern Italy): Tectonic diversity in a blind faulting domain, Pure Appl. Geophys., 172, 1105–1142, https://doi.org/10.1007/s00024-014-0873-0, 2015. a, b
Vannoli, P., Martinelli, G., and Valensise, G.: The Seismotectonic Significance of Geofluids in Italy, Frontiers in Earth Science, 9, 579390, https://doi.org/10.3389/feart.2021.579390, 2021. a, b, c
Vannucci, G., Lolli, B., and Gasperini, P.: Inhomogeneity of Macroseismic Intensities in Italy and Consequences for Macroseismic Magnitude Estimation, Seismol. Res. Lett., 92, 2234–2244, https://doi.org/10.1785/0220200273, 2021. a, b, c
Wald, D. J., Quitoriano, V., and Dewey, J. W.: USGS “Did you feel it?” Community internet intensity maps: Macroseismic data collection via the internet, in: First European Conference on Earthquake Engineering and Seismology, Geneva, Switzerland, 3–8 September 2006, p. 10, 2006. a
Wells, D. L. and Coppersmith, K. J.: New Empirical Relationships among Magnitude, Rupture Length, Rupture Width, Rupture Area, and Surface Displacement, B. Seismol. Soc. Am., 84, 974–1002, 1994. a, b
Worden, C. B., Gerstenberger, M. C., Rhoades, D. A., and Wald, D. J.: Probabilistic Relationships between Ground‐Motion Parameters and Modified Mercalli Intensity in California, B. Seismol. Soc. Am., 102, 204–221, https://doi.org/10.1785/0120110156, 2012. a
Zampieri, D., Vannoli, P., and Burrato, P.: Geodynamic and seismotectonic model of a long-lived transverse structure: The Schio-Vicenza Fault System (NE Italy), Solid Earth, 12, 1967–1986, https://doi.org/10.5194/se-12-1967-2021, 2021. a
- Abstract
- Introduction
- Seismotectonic complexity and depth variability in Italian earthquakes
- Methodology and data analysis
- Application to the CPTI15 and DBMI15 catalogues
- Conclusions
- Code availability
- Data availability
- Author contributions
- Competing interests
- Disclaimer
- Acknowledgements
- Financial support
- Review statement
- References
- Supplement