the Creative Commons Attribution 4.0 License.
the Creative Commons Attribution 4.0 License.
 | 10 Mar 2022
Compound flood modeling framework for surface–subsurface water interactions
Fernando Nardi
Assefa Melesse
Jayantha Obeysekera
Fabio Castelli
René M. Price
Todd Crowl
Noemi Gonzalez-Ramirez
Compound floods are an active area of research in which the complex interaction between pluvial, fluvial, coastal and groundwater flooding are analyzed. A number of studies have simulated the compound flooding impacts of precipitation, river discharge and storm surge variables with different numerical models and linking techniques. However, groundwater flooding is often neglected in flood risk assessments due to its sporadic frequency (as most regions have water tables sufficiently low that do not exacerbate flooding conditions), isolated impacts and considerably lower severity with respect to other types of flooding. This paper presents a physics-based, loosely coupled modeling framework using FLO-2D and MODFLOW-2005 that is capable of simulating surface–subsurface water interactions. FLO-2D, responsible for the surface hydrology and infiltration processes, transfers the infiltration volume as recharge to MODFLOW-2005 until the soil absorption capacity is exceeded, while MODFLOW-2005 returns exchange flow to the surface when the groundwater heads are higher than the surface depth. Three events characterized by short-duration intense precipitation, average tide levels and unusually high water table levels are used to assess the relevance of groundwater flooding in the Arch Creek Basin, a locality in North Miami particularly prone to flooding conditions. Due to limitations in water level observations, the model was calibrated based on properties that have experienced repetitive flooding losses and validated using image-based volunteer geographic information (VGI). Results suggest that groundwater-induced flooding is localized, and high groundwater heads influence pluvial flooding as the shallow water table undermines the soil infiltration capacity. Understanding groundwater flood risk is of particular interest to low-elevation coastal karst environments as the sudden emergence of the water table at ground surface can result in social disruption, adverse effects to essential services and damage to infrastructure. Further research should assess the exacerbated impacts of high tides and sea level rise on water tables under current and future climate projections.
- Article
(34424 KB) - Full-text XML
- BibTeX
- EndNote


Flood inundation modeling is of critical importance for better planning, forecasting and decision-making practices (Teng et al., 2017). Scientific and technological innovations in numerical algorithms have continuously improved the performance of physically based hydrologic, ocean circulation and hydraulic modeling packages to simulate faster and more accurate flood physical processes over the computational domain at various scales and resolutions (Devia et al., 2015). However, most flood inundation models are designed to simulate specific flood hazards (i.e., pluvial, fluvial, coastal, groundwater) independently and are unable to assess complex flood dynamics per se due to code limitations and burdensome compatibility. To address these numerical constraints, some models have the ability to operate as linked units or groups by using coupling schemes (i.e., one-way, loosely, tightly, fully) to build compound models capable of simulating multiple flood drivers (Santiago-Collazo et al., 2019).
Compound floods (CFs) are high-impact low-probability events characterized by a non-linearity behavior resulting from the complex interactions of interrelated flood drivers triggered at the same spatial and temporal scales (Field et al., 2012; Seneviratne et al., 2012; van Westen and Greiving, 2017; Zscheischler et al., 2018). Research on CFs has received increasing attention in recent years due to their adverse impacts at the global scale. Deterministic and probabilistic approaches are preferred frameworks to analyze CF events. Stochastic models through copula-based probability analysis and extreme value theory examine the interrelationship between flood drivers, while physically based numerical simulations provide a tangible depiction of the flood dynamics for current and future climate projections. Several compound flooding studies have used physically based hydrodynamic models as the reference model to simulate the combined effects of rainfall runoff and storm surge (Christian et al., 2015; Gori et al., 2020; Ikeuchi et al., 2017; Karamouz et al., 2015; Kumbier et al., 2018; Olbert et al., 2017). Failure to consider the compound interactions of flood drivers can result in significant uncertainties in the magnitude, timing and estimation of flood risk (Wahl et al., 2015). Therefore, the transition from traditional univariate approaches to a multivariate perspective is necessary to improve flood hazard understanding and predictions (Bates et al., 2021).
The significance of groundwater flooding is rarely disputed as it is only relevant to geographical regions sitting on top of permeable rock that are prone to groundwater emergence (i.e., Miami, Yucatán Peninsula, United Kingdom). Groundwater floods are events limited to prolonged rainfall in low-elevation karst watersheds characterized by unconfined aquifers that experience sudden increases in already high water table levels above normal conditions (Finch et al., 2004). Although there has been a substantial increase in groundwater flooding literature since the 2000s, as well as advances in understanding surface-water–groundwater interactions (Brunner et al., 2017; Sophocleous, 2002), relevant knowledge gaps and lack of understanding of this phenomenon persist from the complex relationship between topography and hydrogeology (Bradford, 2002; Hughes et al., 2011; Ó Dochartaigh et al., 2019). The water table response time to hydrological events is controlled by the soil, vegetation and aquifer properties, which influence the infiltration capacity, recharge rate and response time (Nalesso, 2009). Similarly, the groundwater dynamics are influenced by spatial-temporal variations of single or compound flood drivers (i.e., precipitation events, high river levels, above-average tides and sea level rise conditions) over long or repetitive periods of time (Ascott et al., 2017). Thus, the water table response to hydrological mechanisms (García-Gil et al., 2015), system fluctuations and residence time (MacDonald et al., 2014) determine the severity of groundwater flooding.
While probabilistic and empirical approaches have contributed to the development of regional groundwater flood maps (Cobby et al., 2009; Jacobs, 2007), physically based models are scarce. Abboud et al. (2018) found that the June 2013 compound flood disaster in the Elbow River (Canada) was induced by steady precipitation and increased river flow discharges from upstream basins resulting in basement flooding due to the rise of the water table. The combined effects of fluvial and groundwater flooding were not considered in that study since the MODFLOW river package focused exclusively on groundwater flow. Similarly, Yu et al. (2019) applied the coupled surface–subsurface Penn State Integrated Hydrologic Model (PIHM) to produce a comprehensive groundwater flood risk and damage assessment over the Koiliaris River (Greece). Yang and Tsai (2020) investigated the impacts of water table dynamics on groundwater flooding and levee under seepage in New Orleans, Louisiana, using MODFLOW-USG for hazard mapping, flood delineation and levee breach analysis. Su et al. (2020) developed a coupled model to assess the improved response of the repaired storm drain system infrastructure with the shallow aquifer groundwater dynamics by coupling the Environmental Protection Agency (EPA) Storm Water Management Model (SWMM) with MODFLOW-2005 in the city of Hoboken in New Jersey (USA).
Previous efforts to model groundwater levels in South Florida have been developed in the form of hydrogeologic maps (Fish and Stewart, 1991), estimation of aquifer parameters to calculate groundwater flow (Cunningham et al., 2004) and statistical analysis of hydrological measurements (Chebud and Melesse, 2011, 2012; Prinos and Dixon, 2016). Similarly, Hughes and White (2016) investigated the effect of pump practices and sea level rise on surface-water routing and groundwater interactions in Miami-Dade County (MDC) using MODFLOW. Currently this is the main reference model for MDC regional research and planning purposes in hydrologic, ecologic and environmental fields. Regarding the study area, Sukop et al. (2018) developed a MODFLOW model that analyzed the current and future response of the water table to rainfall events in a portion of the Arch Creek Basin. The study highlighted precipitation as the main trigger for groundwater-induced flooding, with tidal fluctuations and sea level rise increasing the shallow water table. Researching the flood risk potential from surface–subsurface water interactions in MDC where the water table is near to the ground surface is critical as it could reveal hidden risks from the compound impact of major storms and coastal forcing variables for present and future scenarios.
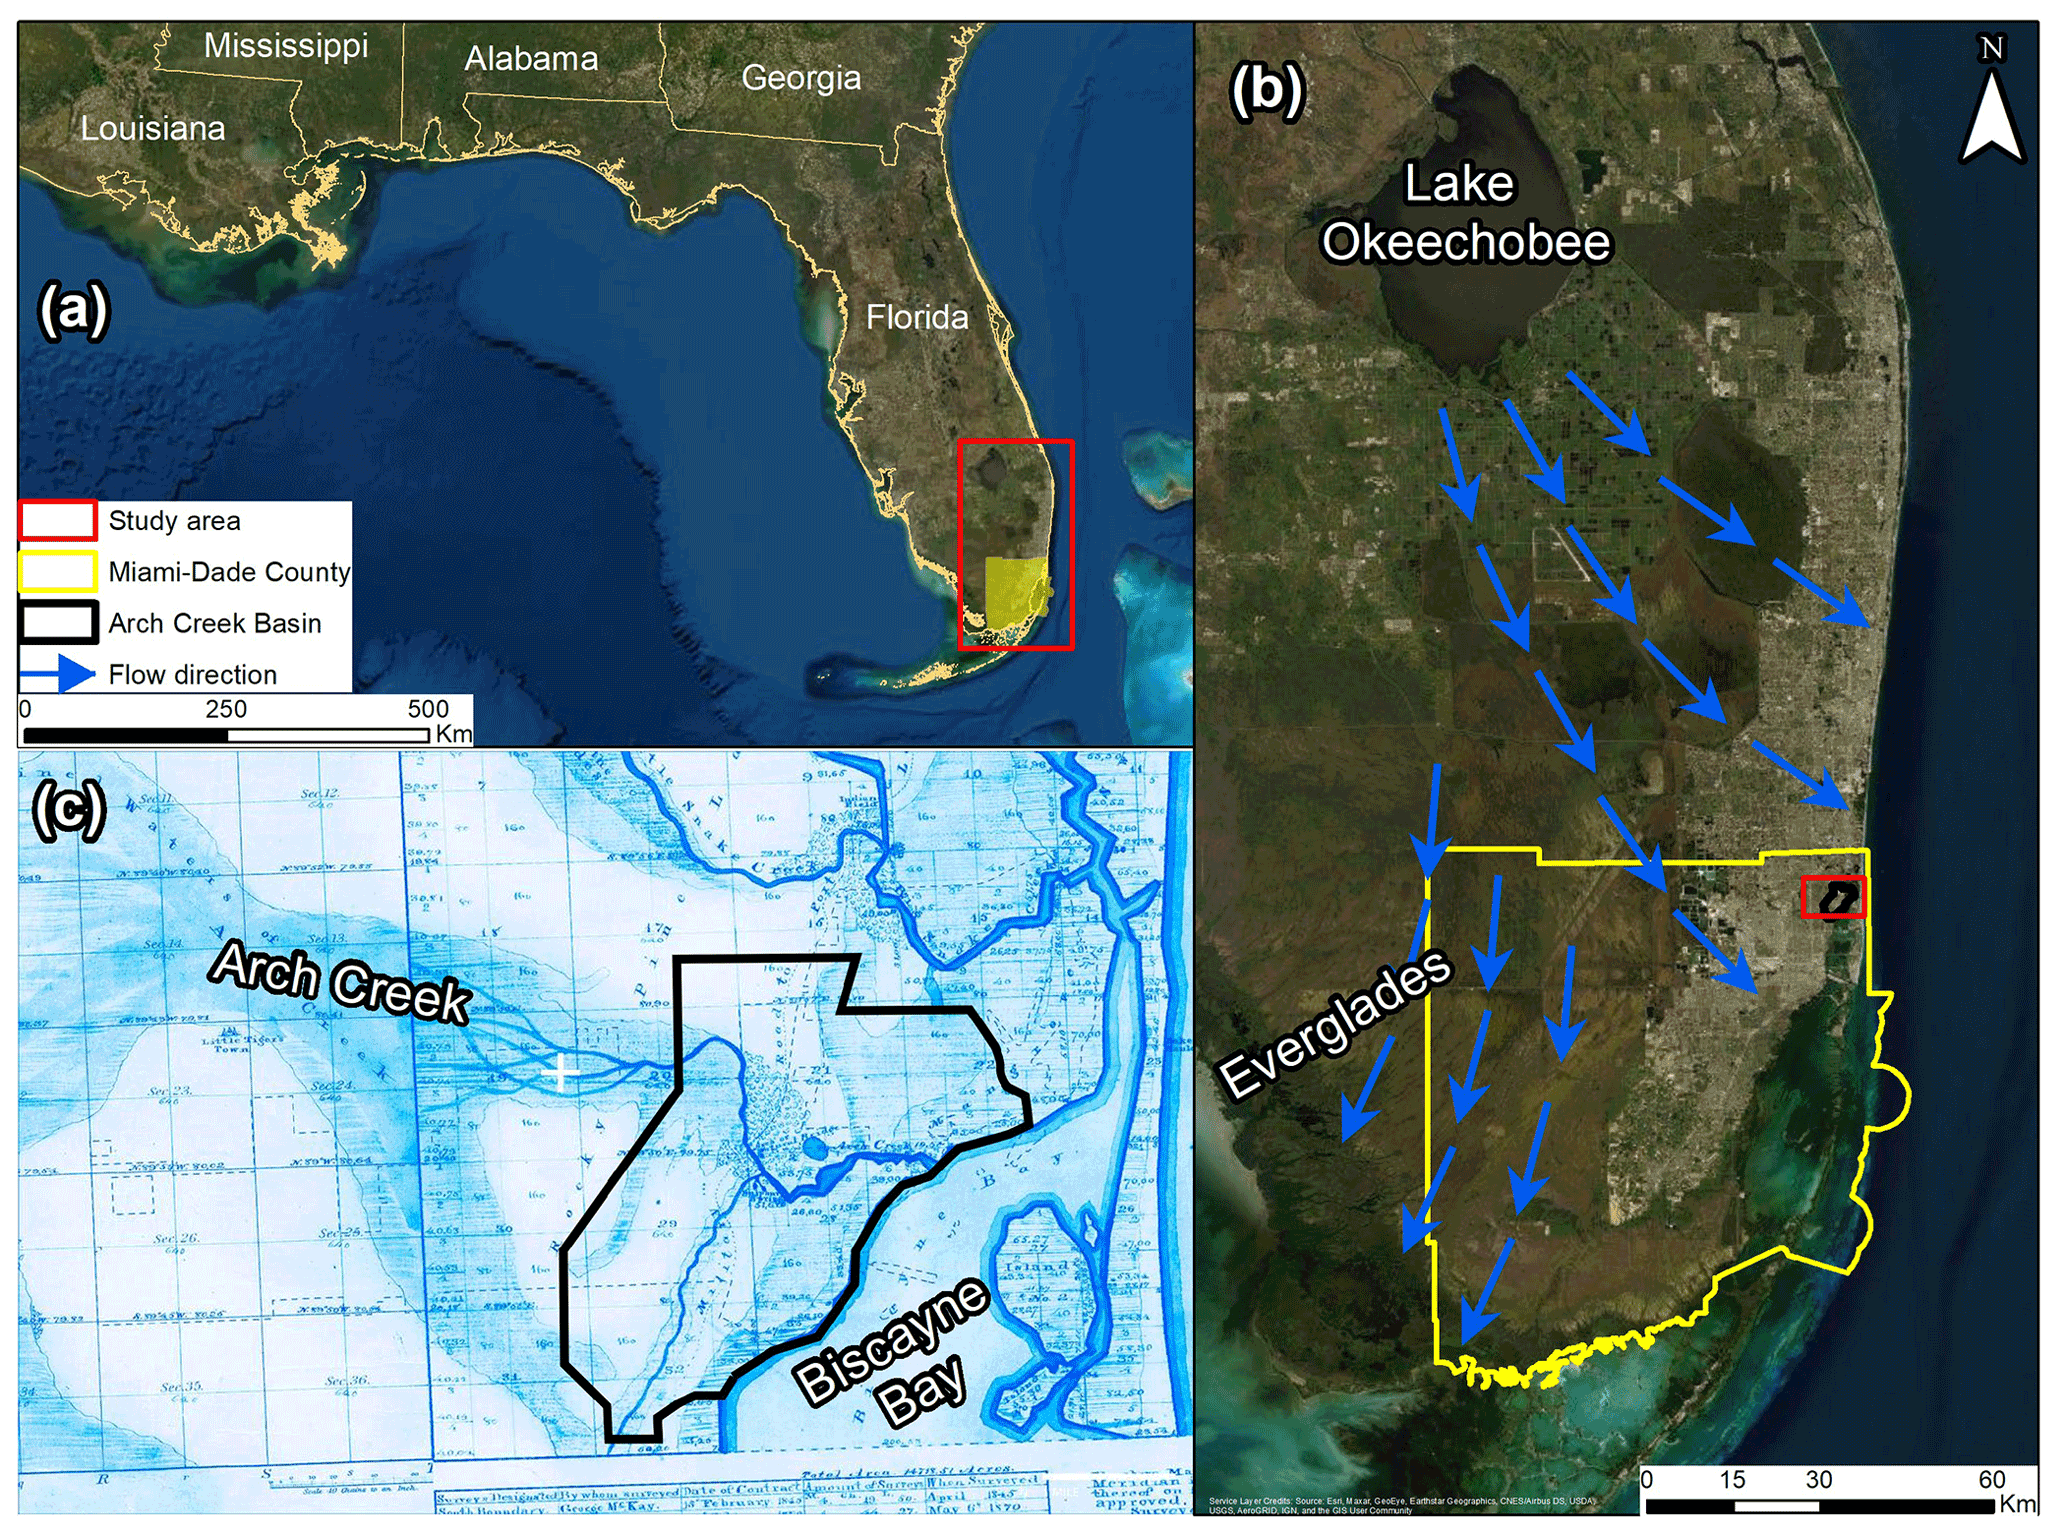
Figure 1Location map of the study area. (a) MDC located in southeast Florida, USA, (b) current Everglades water flow from Lake Okeechobee towards the Atlantic Coast and Gulf of Mexico, and (c) land survey from 1870 that illustrates the natural flow direction of Arch Creek to its discharge into Biscayne Bay prior to urbanization (Miami Herald, 2019).
The main purpose of this study is to present a loosely coupled modeling framework capable of simulating surface and subsurface water interactions to advance flood vulnerability assessments in regions prone to groundwater-induced flooding and complex compound flooding phenomena. To better understand the effects of the water table in a low-elevation coastal zone, a methodology is developed to couple the 2D hydrodynamic software FLO-2D and the groundwater model MODFLOW-2005. The Arch Creek Basin in North Miami was selected as an ideal test site due to its unique hydrogeomorphology, low-lying topography and high vulnerability to flood events. For the purpose of this analysis, three events characterized by short-lived heavy precipitation, regular tide levels and unusually high water tables were selected to demonstrate the importance of simulating surface–subsurface water interactions in urbanized karst coasts as high groundwater heads may exacerbate flooding conditions. In the context of this paper, compound flooding is defined as the interaction of overland flow and groundwater emergence, while surge levels are normal and have a minimal influence in the inundation beyond the coast. Finally, the coupled model results were calibrated based on the official database from the Federal Emergency Management Agency (FEMA) and validated using volunteered geographic information (VGI) flood observations from the study area. The paper is organized as follows: a complete description of the study area is introduced (Sect. 2), followed by data collection and the methodology presented in Sects. 3 and 4. Model calibration and results illustrate the main findings (Sect. 5); the discussion compares the results with similar work in the region (Sect. 6); and the conclusion section includes the advantages, limitations and future research (Sect. 7).
2.1 Site description
The Arch Creek Basin is located in the northeastern part of MDC, along the coast of Biscayne Bay in the city of North Miami, Florida. Prior to anthropogenic interventions, the Arch Creek River served as an important flow corridor that connected the Everglades to Biscayne Bay, controlling the flood pulse dynamics in the tropical wetland system (Fig. 1).
The gradual modifications in land use and the construction of Biscayne Canal in the 1920s marked the transition of the natural environment to agricultural lands. Variations in the soil moisture conditions and infiltration levels due to changes in the streamflow and drainage patterns in the area caused unsustainable farming practices that led to a shift to residential development (Fig. 2). The urbanization process along Biscayne Bay required considerable cut and fill earthworks to create ideal urban development conditions (Miami-Dade, 2016).
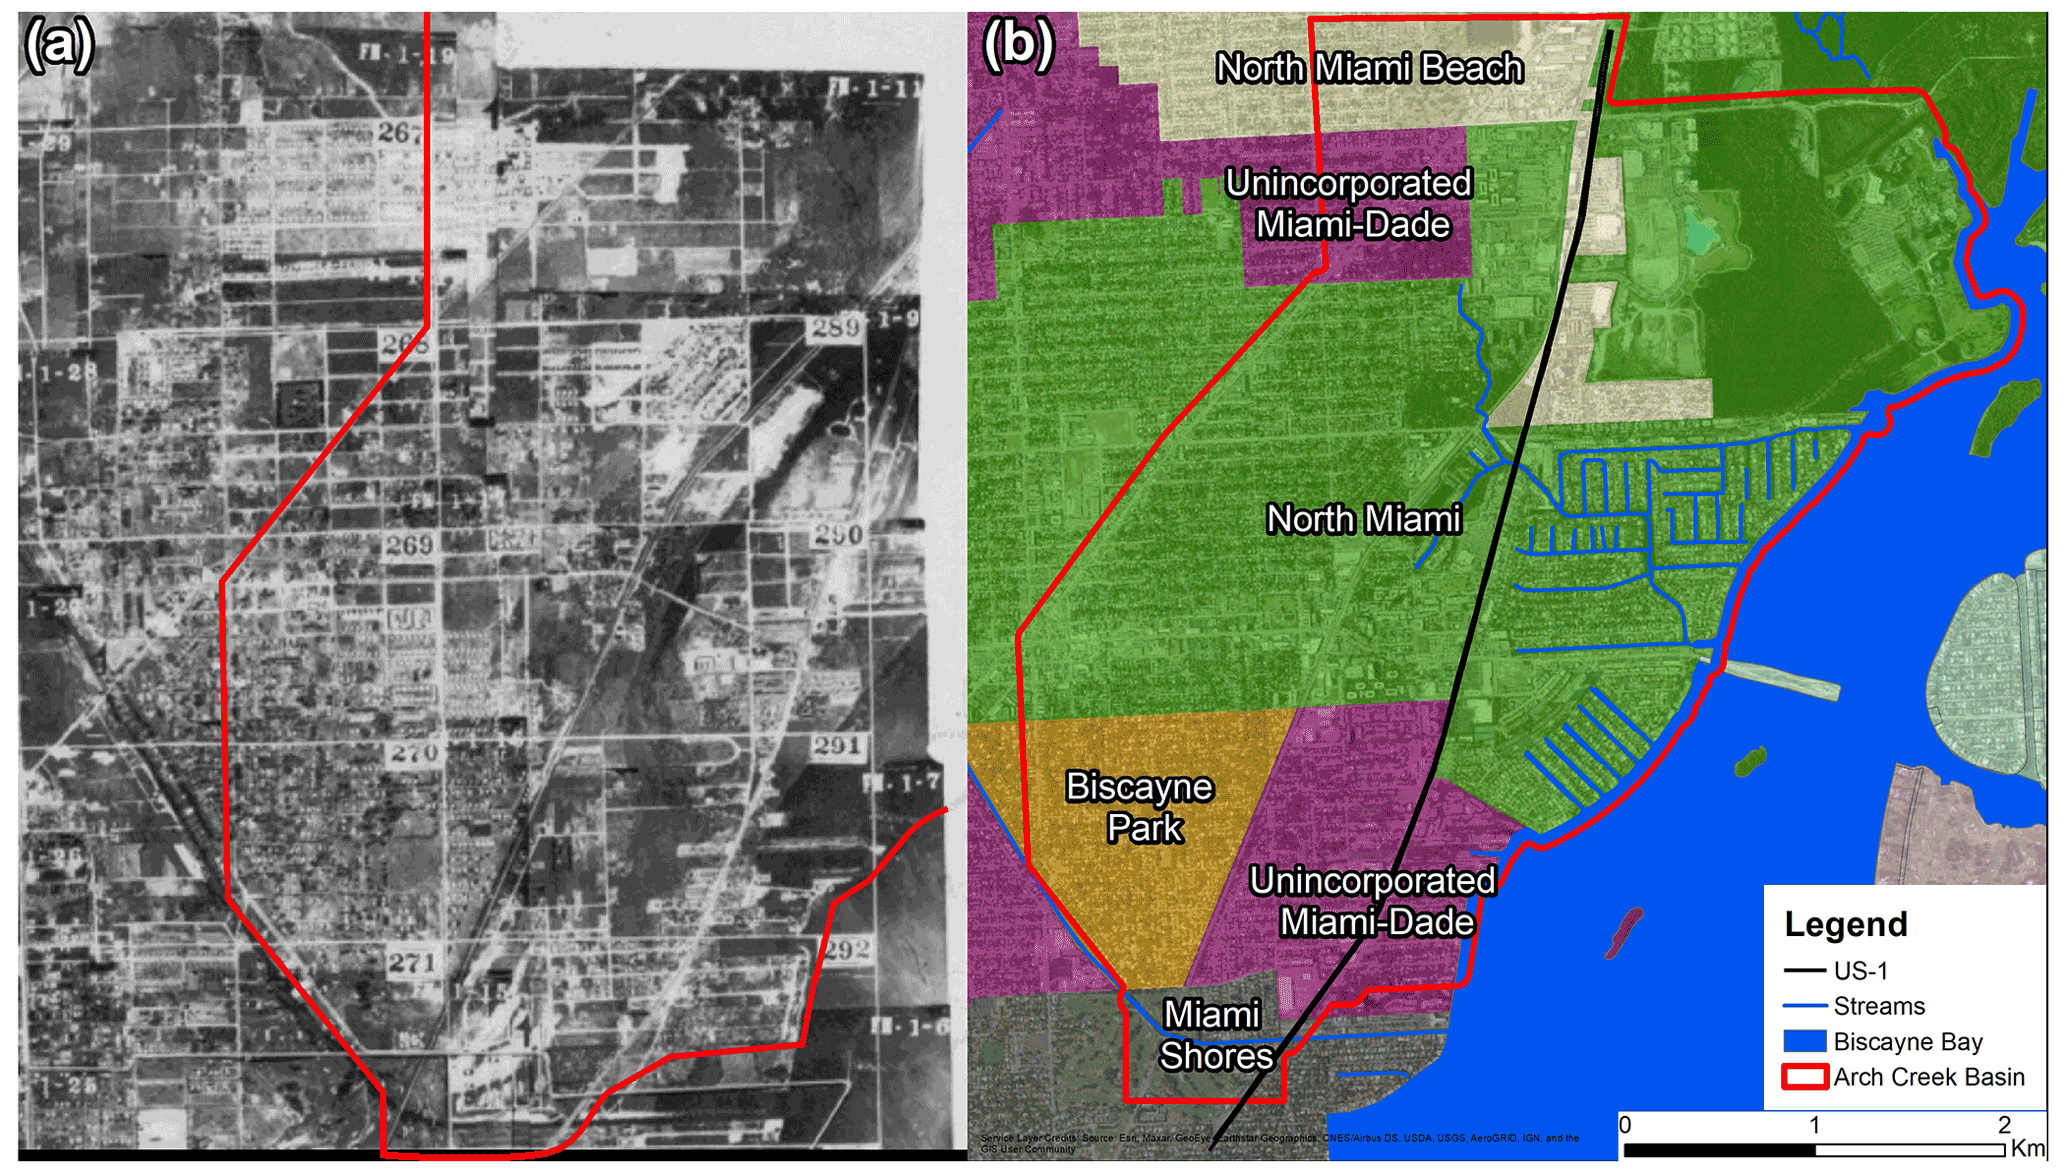
Figure 2Aerial photography that compares the historical (1948) and current urbanized environment in the study area. (a) Major civil and drainage works contributed to the rapid urbanization of the Arch Creek Basin; (b) municipality map, including North Miami, Biscayne Park, North Miami Beach, Miami Shores and unincorporated Miami-Dade (US Department of Agriculture, 1948).
The Arch Creek Basin (16.95 km2) is a low-lying coastal zone predominantly urbanized (90.1 %) and economically diverse. The population is distributed within five jurisdictions, primarily concentrated in North Miami and North Miami Beach (Table 1). Although the topography is predominantly low and flat, some areas within the basin are considered the highest elevations in MDC ranging from 5 to 15 m.
Table 1Population and land elevations of Arch Creek Basin jurisdictions. Population totals account for the whole jurisdiction area (US Census Bureau, 2020).

NA stands for not available.
2.2 Climate
The climate of Miami and southeast Florida is characterized by wet (May to October) and dry seasons (November through April) with 75 % of the annual rainfall occurring in the wet season (Abiy et al., 2019). The average annual rainfall is above 1500 mm, and the average monthly precipitation during the wet season is above 150 mm (Abiy et al., 2019). Rainfall can vary from year to year (1000–2000 mm yr−1) due to tropical storms and extreme hydrometeorological events which highly influence rainfall amounts. A reported increasing trend in rainfall of 2.1 mm yr−1 from 1906 to 2016, mainly attributed to an increase in wet season rainfall (Abiy et al., 2019), underscores that MDC is under a continued threat from flooding.
2.3 Hydrogeology and groundwater
The Arch Creek Basin sits atop one of the most permeable aquifers in the world, known as the Biscayne Aquifer. The Biscayne Aquifer stores 34 billion m3 of water and spans an area of 10 000 km2 (Price et al., 2020) tapering from near the center of peninsular Florida towards the eastern coastline where its maximum thickness is about 38 m (Parker and Cooke, 1944) and hydraulic conductivities exceed 3000 m d−1 (Fish and Stewart, 1991).
The stratigraphy of Biscayne aquifer consists entirely of unconfined permeable limestones of the Fort Thompson and Miami Limestone formations and contains numerous solution conduits, resulting in rapid infiltration and recharge to the aquifer (Cunningham and Florea, 2009; Hoffmeister et al., 1967; Parker and Cooke, 1944). Recharge via precipitation occurs primarily in the Everglades, and groundwater flows eastward towards the shore where it discharges into Biscayne Bay (Cunningham and Florea, 2009).
2.4 Flood risk and vulnerability
Floods resulting from extreme weather and climate events represent a major threat to low-lying neighborhoods and housing infrastructure in the Arch Creek Basin. Historically, frontal systems and summer cloudbursts are responsible for most of the significant pluvial flooding events in the study area compared to strong tropical systems, with hurricanes Irene (1999), Katrina (2005) and Irma (2017) and the No-name Storm as the only exceptions (Miami-Dade, 2015).
Most of the population of MDC lives in high-risk areas, only 1.2 m (4 ft) above sea level. With regard to the Arch Creek Basin, three quarters of the urban landscape (67 %) is located in a 100-year flood-prone area, and over 80 % of the housing stock was built prior to the development of the 1973 Flood Insurance Rate Map (Miami-Dade, 2016). For instance, properties in the Arch Creek Estates and localized areas east of US-1 highway such as the Key Stone Islands and Sans Souci Estates experienced repetitive flood losses since these settlements were built in the former riverbed of the Arch Creek Rivers or in land reclamation areas. The capacity of these communities to respond to hydrometeorological phenomena is limited or non-existent, resulting in repetitive negative impacts on livelihoods and residential property, expanding the socioeconomic gap and inequality of MDC communities (Keenan et al., 2018).
Frameworks to integrate flood risk mitigation and climate change adaptation strategies are a main component in Miami Dade County's policy agenda (Greater Miami & the Beaches, 2019). As a result, the Arch Creek Basin received the designated status of “Adaptation Action Area”, the first pilot project in Florida to build social, environmental and economic resilience (Miami-Dade, 2016).
This section presents the datasets required to build the 2D surface–subsurface flood modeling study, including the topographic input and hydrologic monitoring stations that provide rainfall, tide and well gauge records, as well as verified flood observations.
3.1 Topography
The light detection and ranging (lidar) digital elevation model (DEM) is a 2 m spatial resolution model produced by Miami-Dade County, Florida. The lidar scanner corresponds to the actual bare-earth surface, removing tops of vegetation, buildings and vehicles, and the project coordinate system is UTM zone 17N horizontal datum WGS84. In terms of elevation, the North American Vertical Datum of 1988 (NAVD 88) was assigned as the reference geodetic vertical datum for this study, substituting the original measurements based on the National Geodetic Vertical Datum of 1929 (NGVD 29).
3.2 Hydrologic input
Hydrologic modeling included hydrologic conditions of the time periods 1–4 October 2000, 6–8 June 2013 and 23–26 May 2020. Boundary and initial hydrologic inputs such as precipitation, tide and ocean-side water levels, and groundwater heads over the specified time periods were obtained from the following sources.
3.2.1 Rainfall
The Next Generation Weather Radar (NEXRAD) rainfall application is a scientific web map interface developed by the South Florida Water Management District (SFWMD) on which rainfall data are reported based on spatial coverage configurations in the form of the entire district, counties, Arch Hydro Enhanced Database (AHED) watersheds or rain grid. The NEXRAD rain grid layer with a 2 km grid resolution provides an accurate representation of precipitation every 15 min. Rainfall grid cell 10044042 was selected to characterize the Arch Creek Basin's rainfall conditions.
3.2.2 Tides and ocean-side water levels
DBHYDRO is the official SFWMD repository for climate, hydrologic and environmental databases (https://www.sfwmd.gov/science-data/dbhydro, last access: 1 August 2021). Ocean-side water levels were obtained from stations S28_H and S28_T, located in Biscayne Canal Number C-8 on the Arch Creek southern boundary edge.
The NOAA Tides and Currents website (https://tidesandcurrents.noaa.gov/, last access: 1 August 2021) provides local water levels, tides, current predictions, and other oceanographic and meteorological conditions. The closest coastal sensor to the Arch Creek Basin is located at the Virginia Key, Biscayne Bay station (ID #8723214).
3.2.3 Groundwater heads
The Unites States Geological Survey (USGS) National Water Information System (https://waterdata.usgs.gov/nwis/gw, last access: 1 August 2021), in cooperation with the SFWMD, records daily summary data of maximum groundwater levels in the South Florida region. The groundwater level data were obtained from well G-852 adjacent to the outer western boundary of the study area (Fig. 3). Daily field water level measurements have been recorded since 1973 and at 15 min intervals since October 2007.
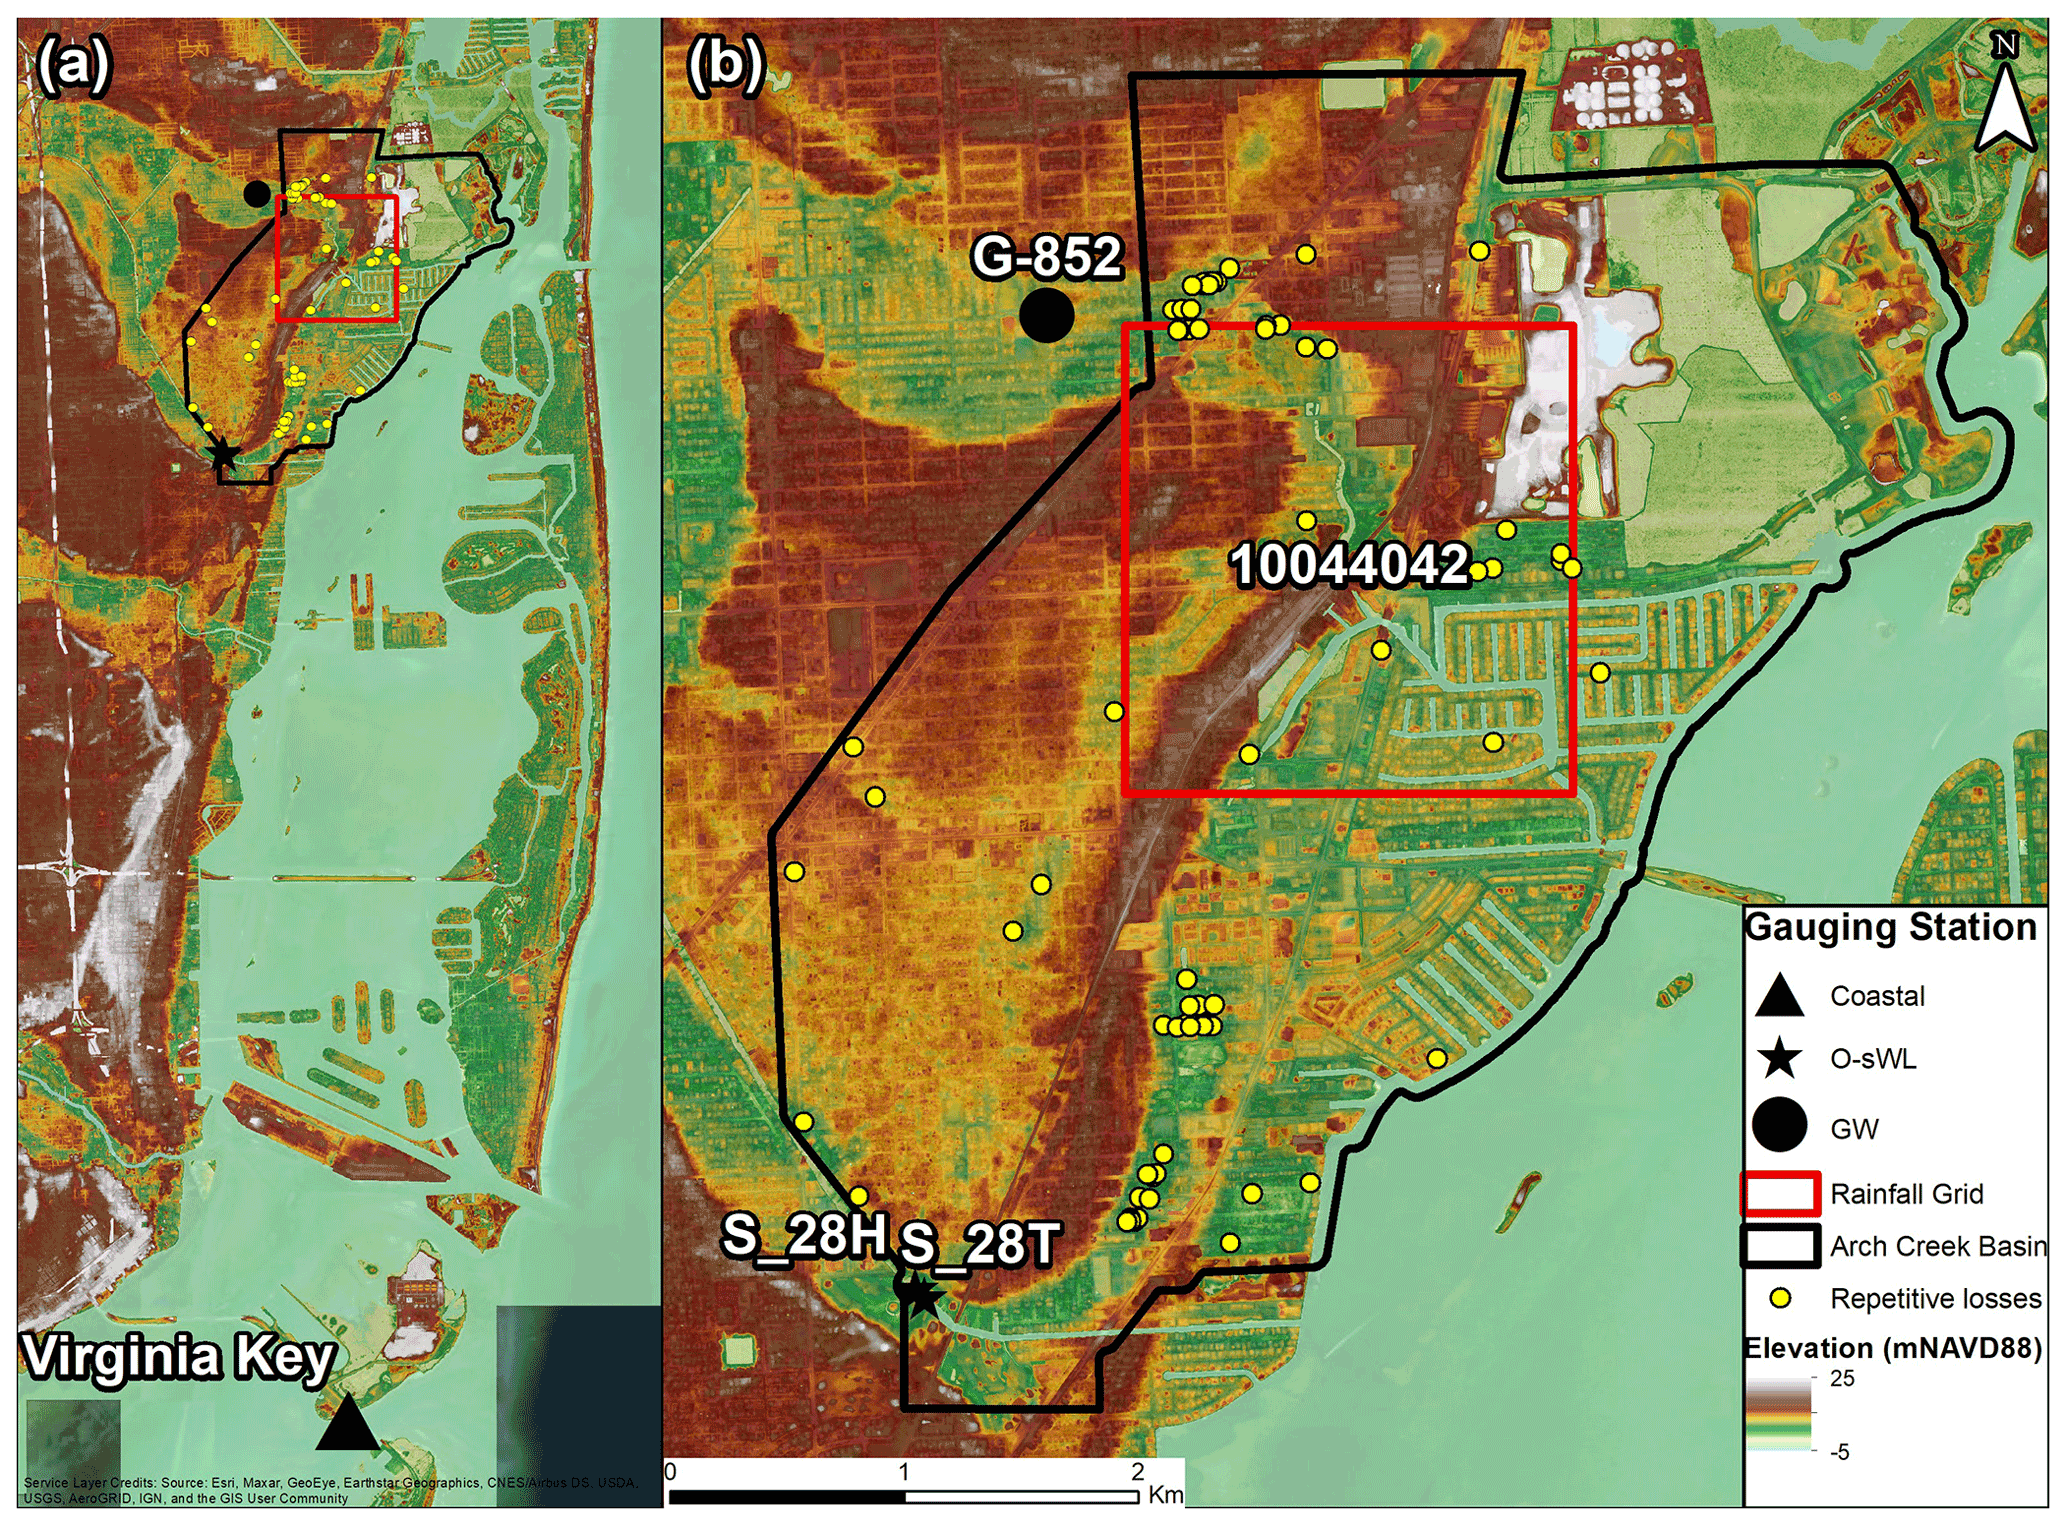
Figure 3Geographical location of selected data in the study site. (a, b) Topographic map showing the location of the Arch Creek Basin (black polygon) and the distribution of the closest gauging stations to the study site (black markers), rainfall grid (red square) and properties that have experienced severe repetitive losses due to flooding events (yellow).
3.3 Repetitive flood claims
FEMA's Severe Repetitive Loss property program is designed to provide grants and financial assistance to residential properties that have experienced frequent flood losses over the years (FEMA, 2021). Currently, 75 properties have requested financial assistance for property acquisition or to recoup some of their investments due to flood damages in the Arch Creek Basin (Miami-Dade, 2017). The database stores detailed information on the date of loss, building type, flood zone designation, type of insurance and claim payments between 1995 and 2015, providing a clear footprint of flooding risk hotspots and flood prone communities. This dataset will be used to calibrate the flood inundation maps.
4.1 Hydraulic model: FLO-2D
FLO-2D is a physically based volume conservation model that combines hydrology and hydraulics to simulate the propagation of water dynamics in urban, riverine and coastal environments for flood hazard mapping, floodplain delineation, flood vulnerability assessments and mitigation planning (O'Brien et al., 1993). The flood routing model applies the dynamic wave approximation to the momentum equation to calculate the average flow velocity across the square grid system one direction at a time in eight potential flow directions over the floodplain. Hydrological processes are represented as rainfall data over the computational domain or as input hydrographs that can be specified in the channel, floodplain or along the coasts. Various attributes (elevations, roughness coefficient), components (channel, infiltration, storm drain) and features (streets, hydraulic structures) can be incorporated into the FLO-2D model to produce more refined simulations (O'Brien, 2011). Details are described elsewhere (Annis and Nardi, 2019; Grimaldi et al., 2013; Peña et al., 2021; Peña and Nardi, 2018).
4.2 MODFLOW-2005
MODFLOW-2005 is a fully distributed model developed by the USGS that simulates groundwater flow in aquifer layers (confined or unconfined) using a block-centered finite difference approach (Harbaugh, 2005). The spatial discretization of the aquifer(s) into grid elements computes the horizontal and vertical flow stresses of the hydrogeological system (water heads, recharge, zetas) at the center of the cell. Similarly, the model offers several solvers for matrix equations, as well as subsidence, observations, surface-water routing and transport packages. Technical documentation on the model description and groundwater flow equations is presented in Harbaugh (2005).
4.3 Coupling surface-water–groundwater models
The main factors determining the coupling process between FLO-2D and MODFLOW-2005 include the algorithms' mathematical solver capability to calculate and transfer the exchanged volumes in opposite directions within a fully integrated framework and share consistent spatial and temporal scales.
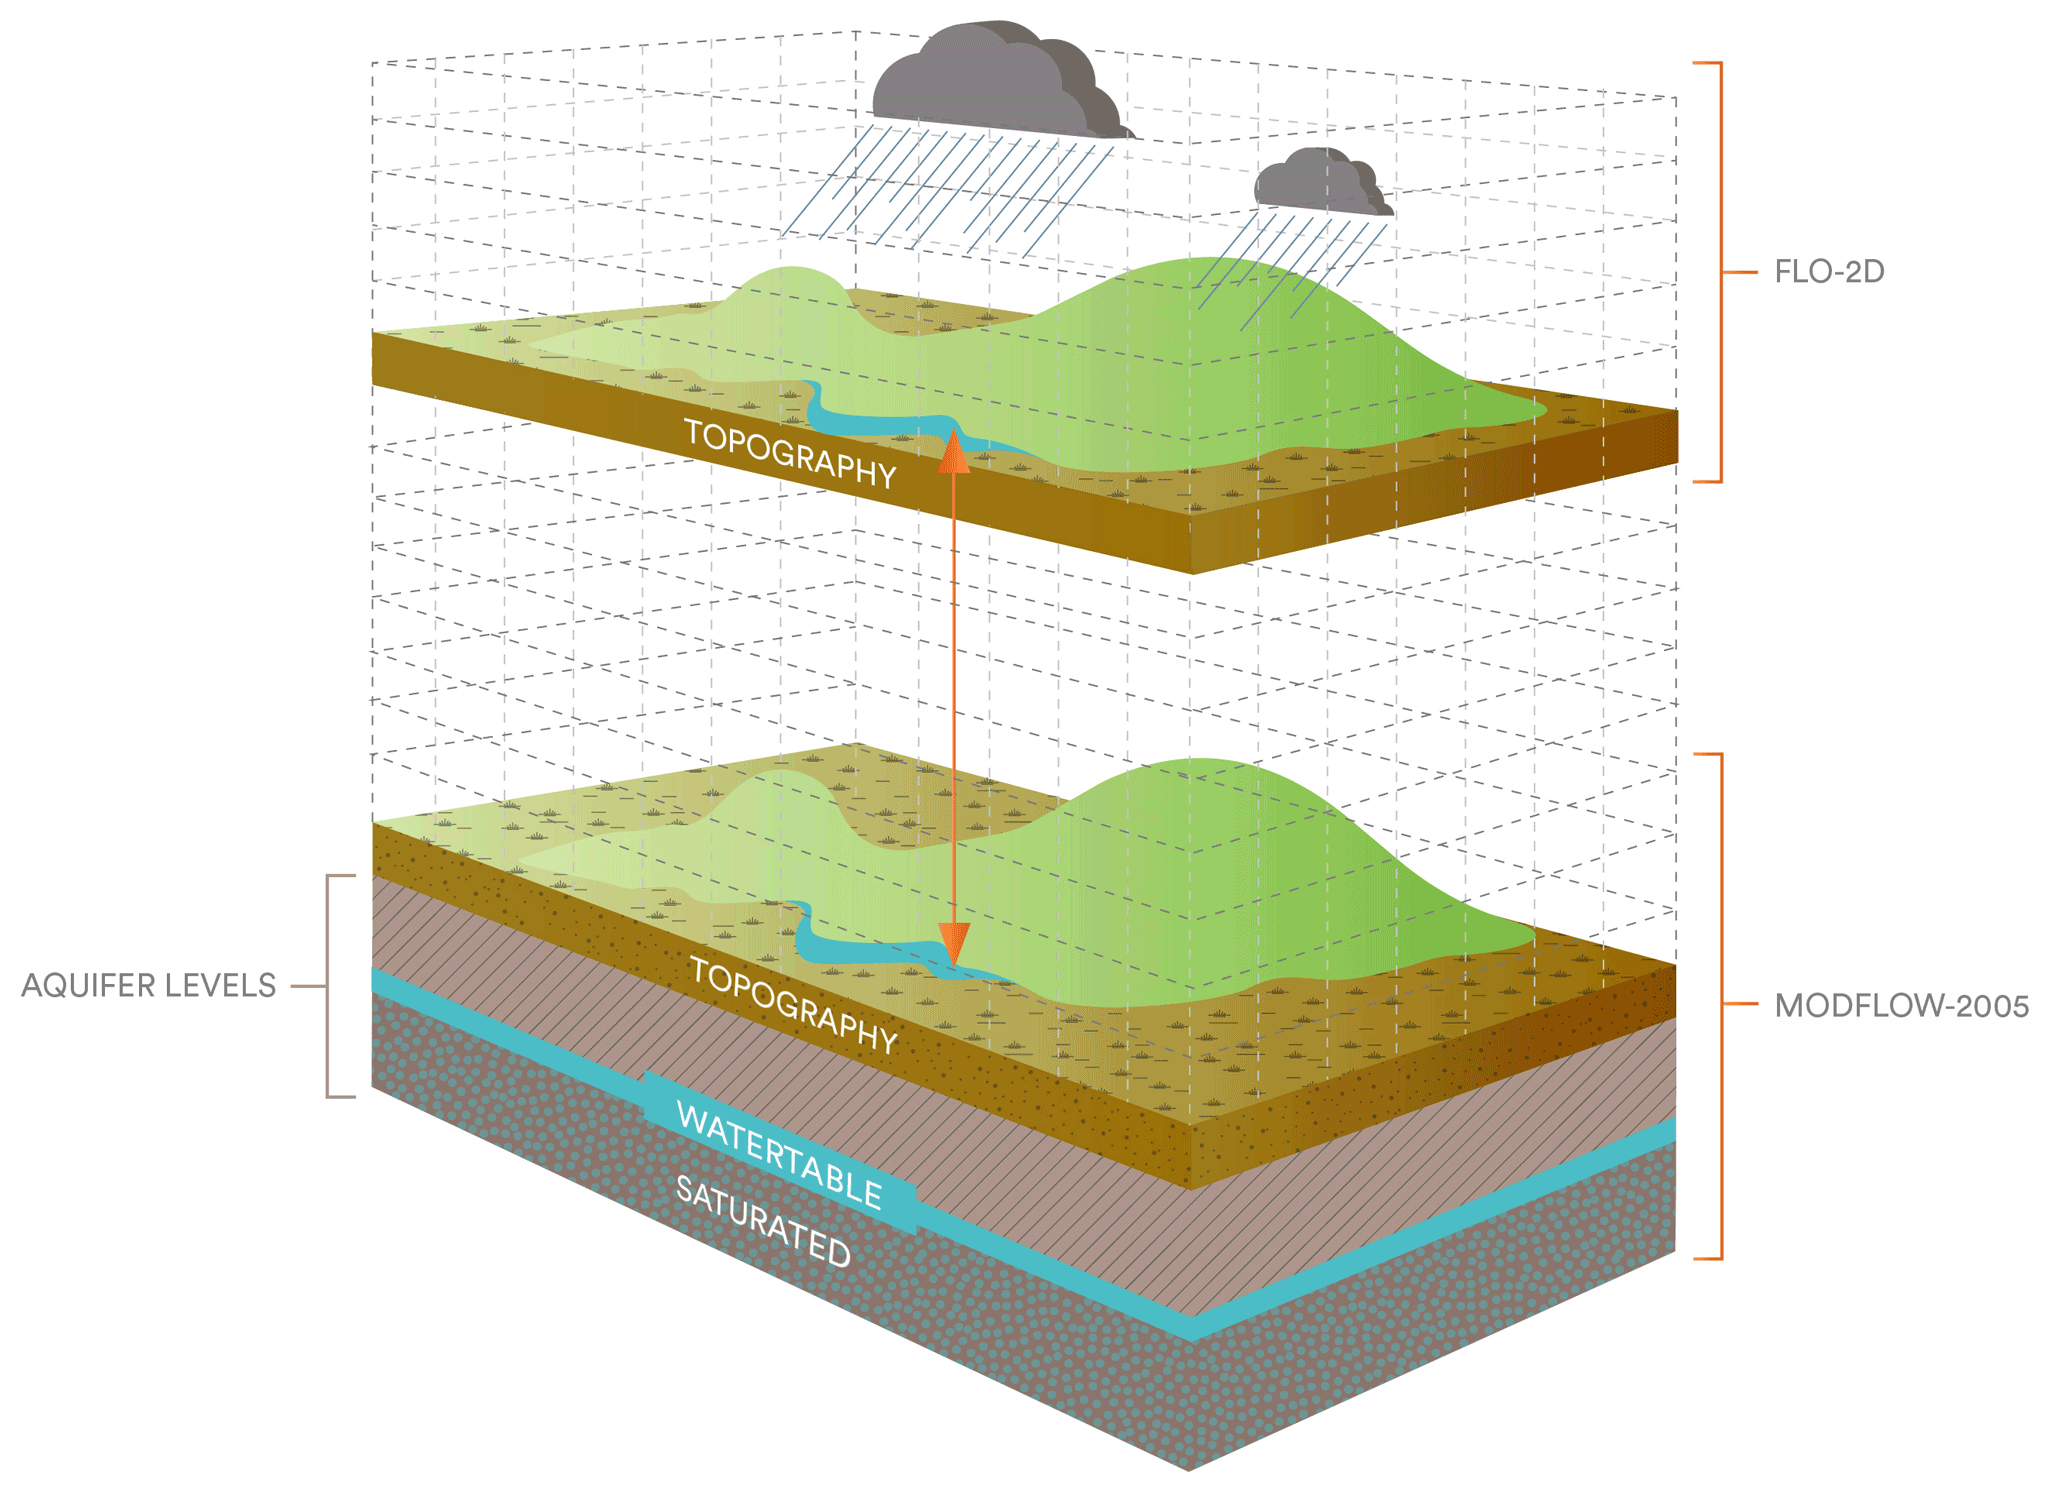
In terms of the spatial scale, a perfect match between FLO-2D and MODFLOW-2005 surface elevation layers is necessary for the surface and subsurface water interactions to happen. This agreement is subject to identical geographical position, reference system, size resolution and topographic cell elevations (Fig. 4). Although the coupled models can have variations in the number of cells and domains, FLO-2D cells must overlap the MODFLOW-2005 grid domain system to compute results and transfer the output data from one model to another and vice versa until the end of the simulation.
A significant advantage in the coupling process is that both numerical codes are written in FORTRAN programming language and share the same explicit finite difference method simulating all physical processes simultaneously in a fully integrated framework. Nevertheless, FLO-2D and MODFLOW-2005 design structures present significant operability differences to perform calculations. Both numerical algorithms solve the 2D and 3D equations independent from each other to satisfy their respective numerical stability criteria and accuracy. For this reason, the need for a loosely coupled linking technique is presented in order for FLO-2D and MODFLOW-2005 to exchange output in a synchronized systematic way and simulate the surface–subsurface interactions within the same modeling framework. In MODFLOW-2005, the simulation is divided into a series of stress periods within which specified data are constant. Each stress period, in turn, is divided into a series of time steps. The solution of the finite difference equations can be written in matrix form as follows:
where [A] is a matrix of the coefficients of the head for all active nodes in the grid, {h} is a vector of head values at the end of time step n for all grid nodes, and q is a vector of the constant heads for each time step.
MODFLOW-2005 has three internal nested loops: the stress period loop (outer), time step loop (intermediate) and iteration loop (inner). A predetermined procedure is implemented at the beginning as a routine setup function to read the domain setup (i.e., grid resolution, number of layers and simulation time), model data in the form of boundary conditions, aquifer hydraulic characteristics (i.e., hydraulic conductivity, specific storage, transmissivity), initial head conditions and selected solution method.
The outer loop is responsible for calculating the resulting heads for each time step from defined boundary conditions, including specified heads (i.e., time-variant or head boundary packages), specified flux (i.e., recharge or wells) and head-dependent flux (i.e., drain, evapotranspiration or river recharge). The intermediate loop accounts for the total simulation time, as well as additional output processing, and the inner loop for calculation purposes to approximate the head solution until the maximum number of iterations is achieved. At the end of the iteration loop, specified output control files are created in the form of heads, budget terms or flow in the domain. The intermediate and outer loops repeat until all time steps are completed for all stress periods (Harbaugh, 2005).
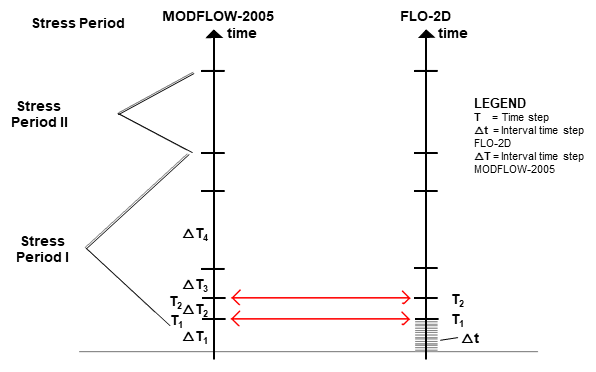
FLO-2D works with variable time steps that are automatically adjusted internally based on stability criteria requirements. Because FLO-2D uses an explicit finite difference method to solve the surface-water equations, its time step is usually much smaller than that defined for the MODFLOW-2005 model, resulting in an increasing number of 2D computational sweeps to match the MODFLOW-2005 simulation time (FLO-2D, 2018). A time-synchronization scheme was developed to achieve the coupling as the MODFLOW-2005 intermediate loop is in charge of transferring the information between models. For example, the FLO-2D iterative calculations start until reaching MODFLOW-2005 time step one. Then, the MODFLOW-2005 intermediate loop performs its respective calculations from time step one and is shared in both directions to continue with the following time step (Nalesso, 2009). The process repeats itself until the simulation time of FLO-2D is completed. Similarly, MODFLOW-2005 can experience numerous stress periods during the simulation. Figure 5 depicts the time step synchronization procedure between both models.
The Green and Ampt method (1911) was selected for being the most complete function available in FLO-2D that calculates the accumulated volume of water that infiltrates from the surface layer into the soil and is transferred to MODFLOW-2005 as recharge. The unsaturated zone is not considered in the coupling methodology as the infiltrated volume travels directly to the water table. Rainfall intensity predominantly influences the infiltration process as runoff and is generated when the maximum infiltration capacity is exceeded. Several variables are accounted for in the Green and Ampt infiltration function, including initial abstraction, hydraulic conductivity, soil porosity, volumetric moisture deficiency (initial and final soil saturation conditions), soil suction and soil storage depth. The development of the Green and Ampt method in FLO-2D is based on the application of Darcy's law principle that the infiltration process begins as soon as the surface water moves in a vertical direction through the permeable medium and can be written as follows:
where ΔF is change in infiltration over the computational time step, Kw is hydraulic conductivity at natural saturation (mm h−1), , PSIF is capillary suction (mm), Head is incremental rainfall for the time step plus flow depth on the grid element (mm), DTHETA is volumetric soil moisture deficit (dimensionless), F(t) is total infiltration at time t, and Δt is computational time step.
Fullerton (1983) developed an explicit equation ΔF by using a power series expansion for infiltration with respect to time to approximate the logarithmic term in the latter equation:
Figure 6 provides a schematic representation of how the simulated groundwater heads of MODFLOW-2005 are incorporated in the infiltration methodology of FLO-2D. The infiltration methodology was developed under the principle of hydrostatic pressure and the assumption that the piezometric head is similar to the datum elevation in unconfined aquifers (Nalesso, 2009). The soil saturation percentage is determined based on the surface flow and water table levels. The infiltration calculation continues as long as the water table levels are lower than the terrain elevation. Conversely, the water exchange can also occur in the opposite direction due to a sudden rise in the water table. If the groundwater heads calculated in MODFLOW-2005 are higher than the water surface elevation in FLO-2D, the depth of water from groundwater will be added to the water surface depth. The infiltration calculation is switched off at each node as long as the saturation condition persists, meaning that infiltration will not be calculated until the soil absorption capacity is reestablished.
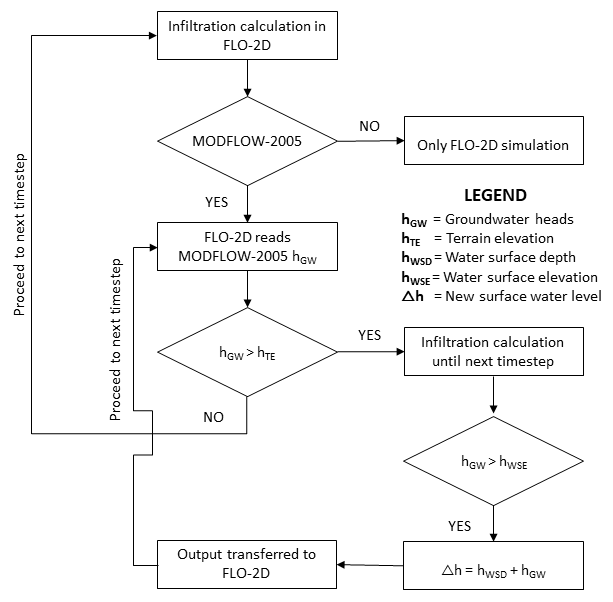
Figure 6Conceptual diagram of the infiltration methodology incorporated in the coupled FLO-2D and MODFLOW-2005 that illustrates the influence of groundwater heads in the infiltration calculation. Adapted from Nalesso (2009).
4.4 Model configuration and setup
The FLO-2D hydraulic model requires a grid of square cells to represent the topography of the floodplain domain. The structured grid size of the computational domain defines the hydraulic model resolution. The lidar digital terrain model (DTM) was used as the source floodplain topographic information, and an interpolation algorithm was implemented to produce a resampled DTM floodplain model to be used as input elevation of the hydraulic model. The nearest neighbor interpolation method was selected to resample data from the high-resolution 2 m lidar to a 20 m resolution (42 621 cells).
In addition to the topographic features, a detailed representation of the built environment is relevant for urban flood modeling in order to simulate the flow wave propagation dynamics realistically. All buildings in the domain (7827 features) were imported to the FLO-2D computational domain. The polygon vectors are represented as area reduction factors (ARF = 1), in which the grid element surface area is considered impervious and is removed from potential water interactions.
Rainfall and tides were considered for the hydrologic forcing, setting the precipitation over the grid system and tide levels in the easternmost cells to represent Biscayne Bay's coastal conditions. Both time series are structured on a 1 h basis and are presented in the following section. The inclusion of the storm drain system, French drains, surface-water control structures and pump stations in the modeling framework is beyond the scope of this study.
The infiltration method selected for the case study was the Green and Ampt. Global soil parameters correspond to the urbanized and permeable surfaces characteristics. Considering that MDC is characterized by the water table response to rainfall events, conservative infiltration estimates for the impermeable surfaces were selected to account for the influence of the French drains in the system. For simplicity, the Manning roughness coefficient was assumed as 0.40 for green land cover areas and 0.04 for the impervious urbanized environment, canal bed and Biscayne coast.
Bathymetric measures were available for the Little Arch Creek River. A 1D hydraulic model with natural cross-sections was imported into FLO-2D extending from NE 143rd Street to structure G-58 located downstream of the Enchanted Forest Elaine Gordon Park. Official bathymetry from the Biscayne shore, Keystone Island and Sans Souci canals was not available for this study due to jurisdiction restrictions. To compensate for the missing geometry, aerial imagery from Google Earth was used to measure the canal's width, while a 10 m bottom elevation was used as constant depth based on the Miami Florida Intracoastal Topography database from the Oleta River.
Concerning MODFLOW-2005, a simple model was developed based on the regional groundwater model of MDC developed by USGS (Hughes and White, 2016) using an advanced version of MODFLOW-2005 that applies the Newton–Raphson formulation (MODFLOW-NWT) with the surface-water routing (SWR1) process to simulate comprehensive surface and groundwater hydrologic conditions on a 15 m grid resolution; the second model consists of a local 1D MODFLOW that simulates the influence of the water table on flooding conditions in an upper portion of the Arch Creek Basin (Sukop et al., 2018).
The boundary area applicable to the Arch Creek Basin was extracted from the regional model using the ModelMuse graphical user interface (Winston, 2009), and the grid spacing across the model was regenerated to a 20 m resolution. The spatial discretization of the model on the horizontal axis consists of 265 columns and 285 rows for a total of 75 525 cells. The Biscayne aquifer is simplified to one layer of 35 m thickness compared to the three-layer units of the regional hydrogeological system. Taking the upper aquifer parameters as reference, the hydraulic conductivities (Kx≈1890 m d−1), specific storage () and specific yield (Sy≈0.376) vary across the domain. Four boundary conditions are assigned with respect to the hydrological forcing in the study area. The Time-Variant Specified-Head (CHD) package feature in the easternmost boundary represents the tide conditions of Biscayne Bay and the ocean-side water levels from Canal C-8 in the southern boundary edge. With respect to the groundwater heads, the General-Head Boundary (GHB) package was used to set the water table levels from gauge station G-852 in the westernmost boundary of the domain. MODFLOW-2005 package solvers were customize based on the local groundwater model. The stress periods are structured in 1 h to match the FLO-2D time steps, and the groundwater flow calculations are under transient state.
After the modeling setup, the compatibility process validates the perfect agreement between the surface layers of FLO-2D and MODFLOW-2005 in order for the loosely coupled model to link the floodplain–aquifer hydrodynamics. If so, FLO-2D will act as the base hydraulic model responsible for simulating precipitation and ocean levels with the support of MODFLOW-2005 to simulate the groundwater heads, creating a compound flood modeling framework for surface–subsurface water interactions (Fig. 7).

Figure 7Flowchart representing the CF simulation using FLO-2D as the base hydraulic model. The hydrologic, ocean and groundwater datasets were obtained through observations. The surface hydrology was incorporated as rainfall and coastal boundary conditions in FLO-2D. The groundwater heads were calculated in MODFLOW-2005 and transferred in an iterative manner to FLO-2D every time a MODFLOW-2005 time step is reached (Fig. 6). Adapted from Santiago-Collazo et al. (2019).
4.5 Flood events
Three flood events characterized by similar high-intensity rainfall, tide levels and unusually high water table levels with different response times were selected to compare the surface–subsurface model results (Fig. 8). Tropical Storm Leslie (2–4 October 2000) was responsible for one of the most severe events in North Miami in recent history in terms of flooding and property damage, with an accumulated rainfall of 454 mm over 65 h and an estimated return period of 50 years (Franklin et al., 2001). Similarly, Tropical Storm Andrea (6–8 June 2013) was a short-lived storm that formed in the Gulf of Mexico which produced very heavy precipitation across Broward and MDC (Beven II, 2013) and a total rainfall of 317 mm in the Arch Creek Basin. The 25 May 2020 event is categorized as a 25-year storm with a total daily rainfall depth of 263 mm, producing localized rainfall in the North Biscayne Bay watershed, specifically in the Arch Creek Basin, due to antecedent rainfall conditions since mid-April 2020.
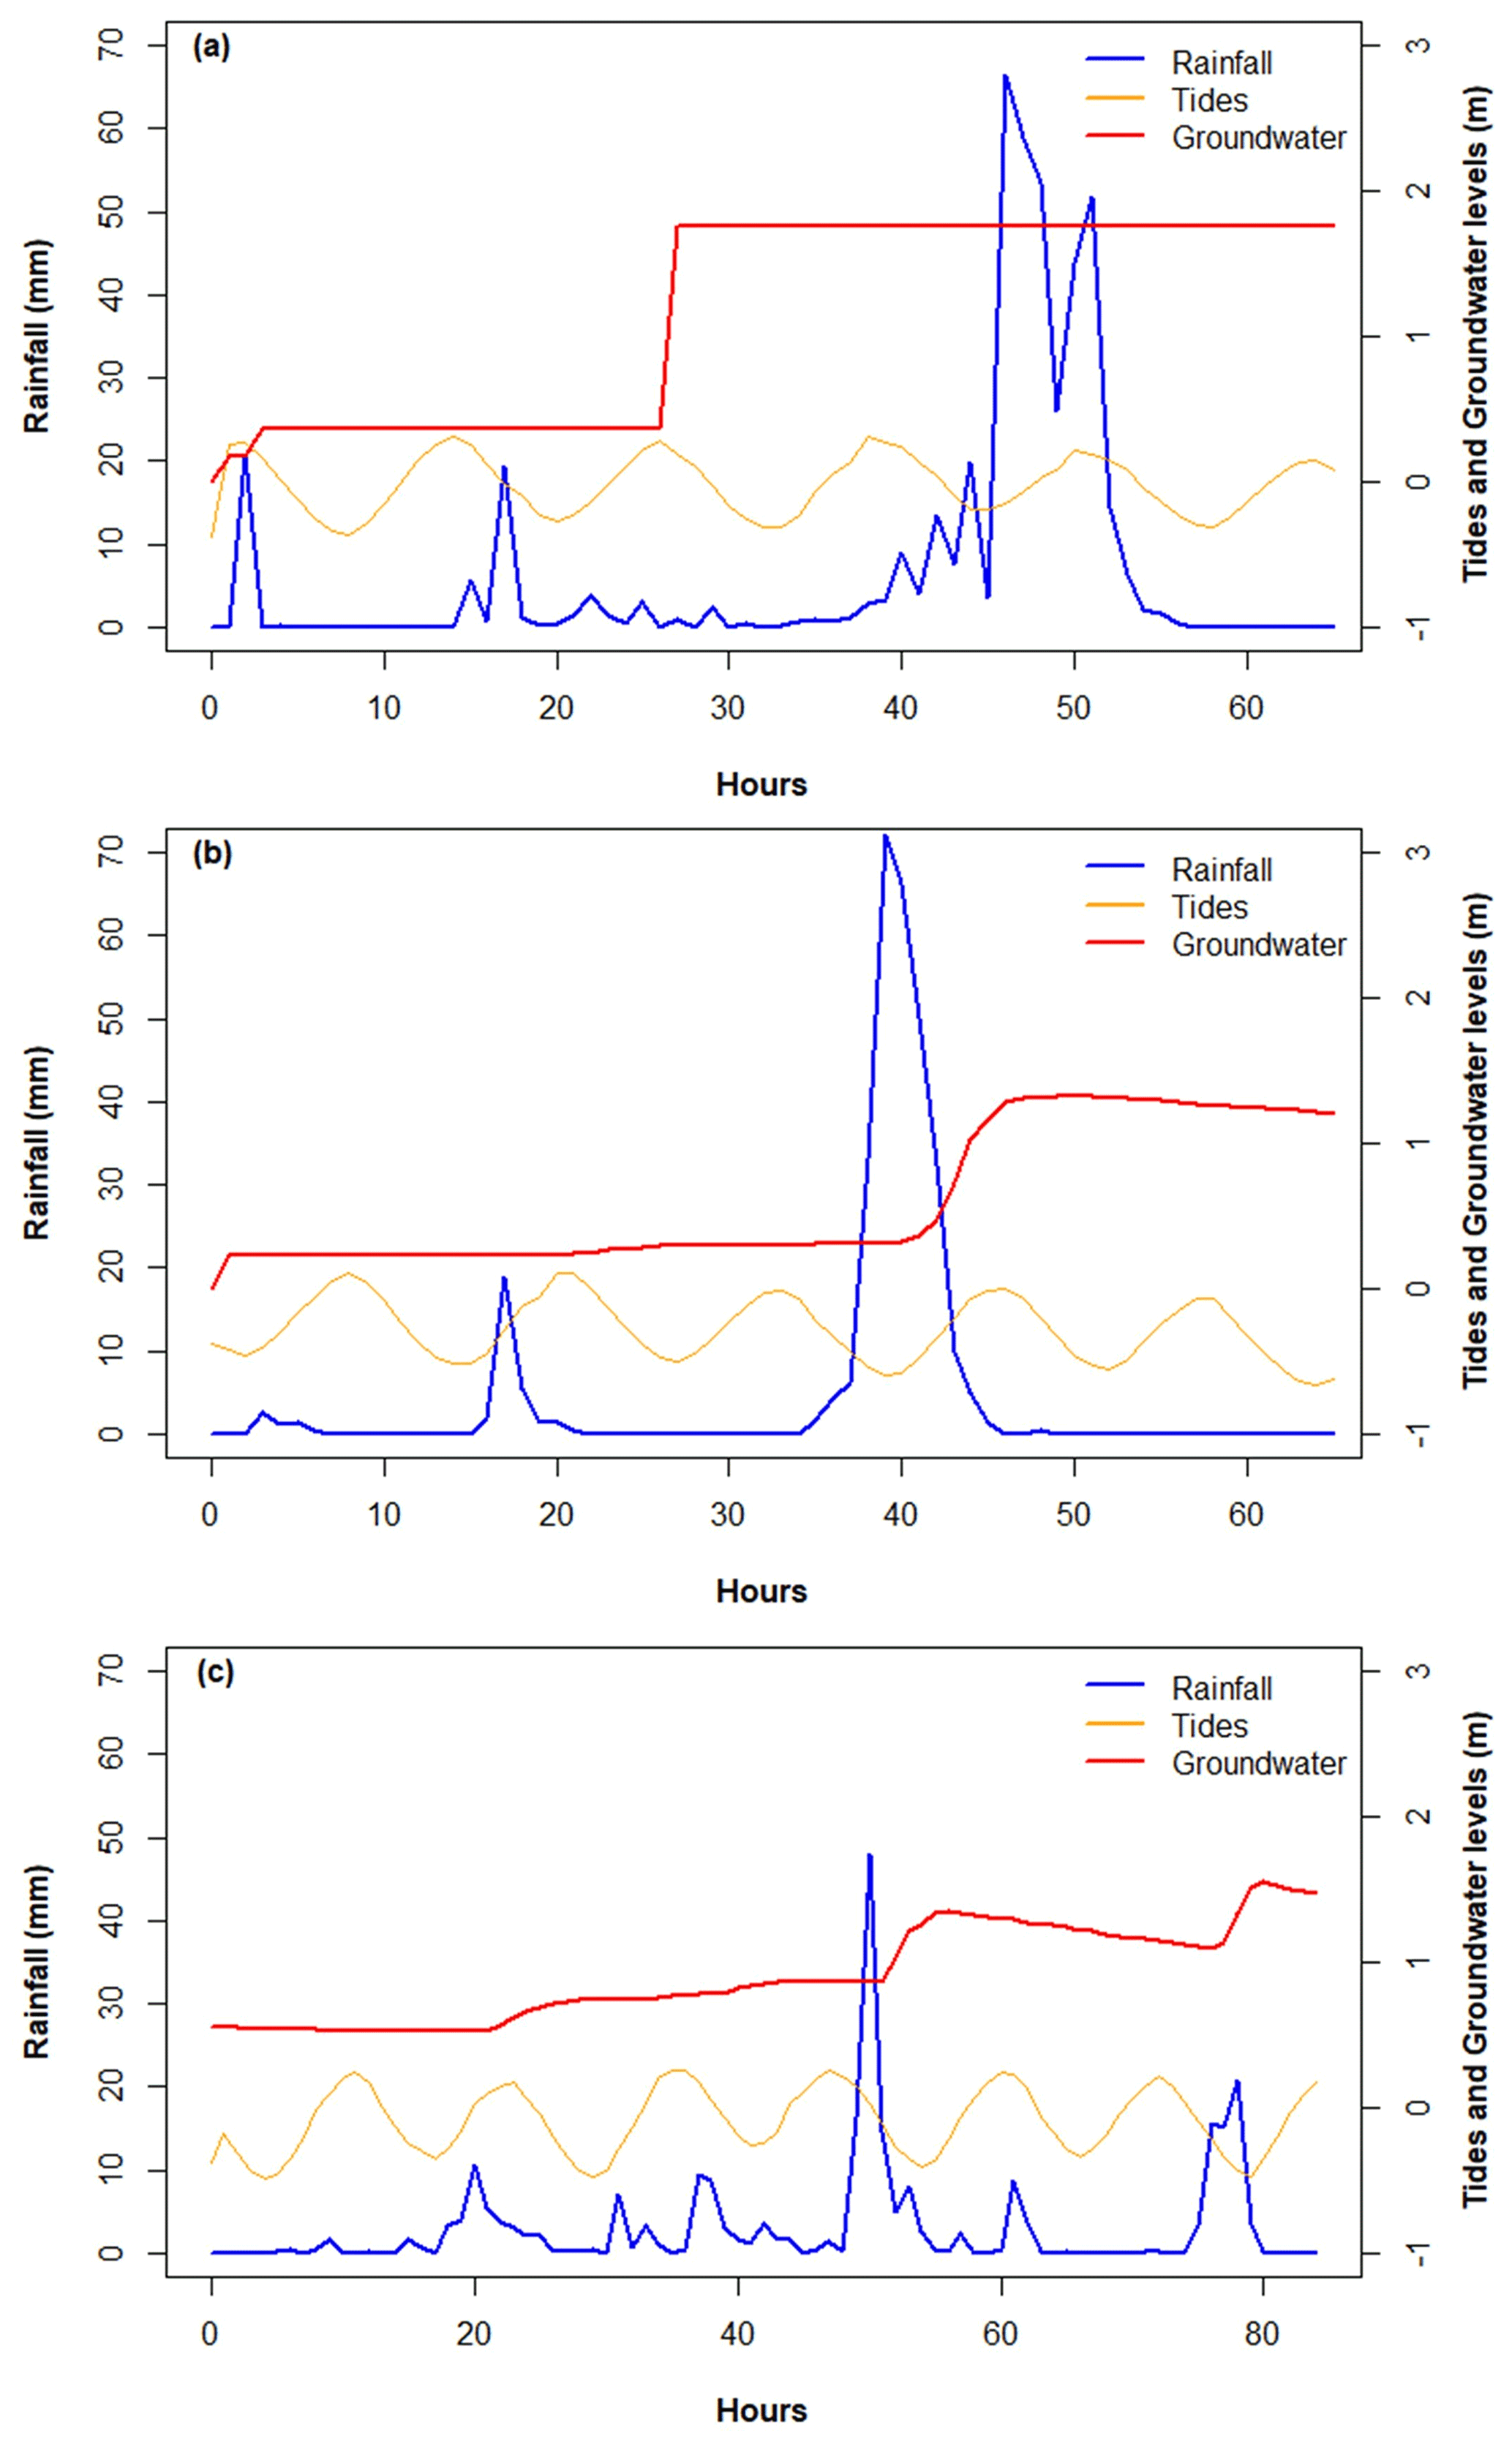
Figure 8Time series of rainfall, tides and groundwater levels for (a) Tropical Storm Leslie, (b) Tropical Storm Andrea and (c) the 25 May 2020 storm. The simulation time was determined based on the rainfall duration and groundwater fluctuations to properly characterized each event, being 64 h for both tropical storms and 84 h for the May 2020 event.
5.1 Calibrated coupled surface–subsurface model
Simulating surface–subsurface water physical processes through physics-based flood modeling frameworks is relevant and meaningful to better assess the severity of groundwater-induced flooding in low-elevation coastal environments characterized by porous permeable soil. Figure 9 illustrates the simulated maximum inundation depths corresponding to the magnitudes of Tropical Storm Leslie, Tropical Storm Andrea, and the 25 May 2020 storm. Tide levels per se do not pose significant threats to infrastructure as the coastal waters remain within the channels. Figure 10 illustrates the emergence of the groundwater heads to the surface as a result of the increase in the water table. The simulation proves reasonable in terms of maximum flood depth and extent due to the similarities in the hydrologic conditions, Tropical Storm Leslie being the most severe of all three storms. FEMA's records on properties subject to frequent flooding were used as a calibration approach to verify a match between the model results with flood observations. Although the available records do not specify the observed inundation depths, an agreement between the property locations and maximum water levels may offer sufficient evidence that the model provides reasonable results (Fig. 11). The calibrated results and display of the water table time series in selected locations for Tropical Storm Leslie are shown in Figs. 12 and 13.
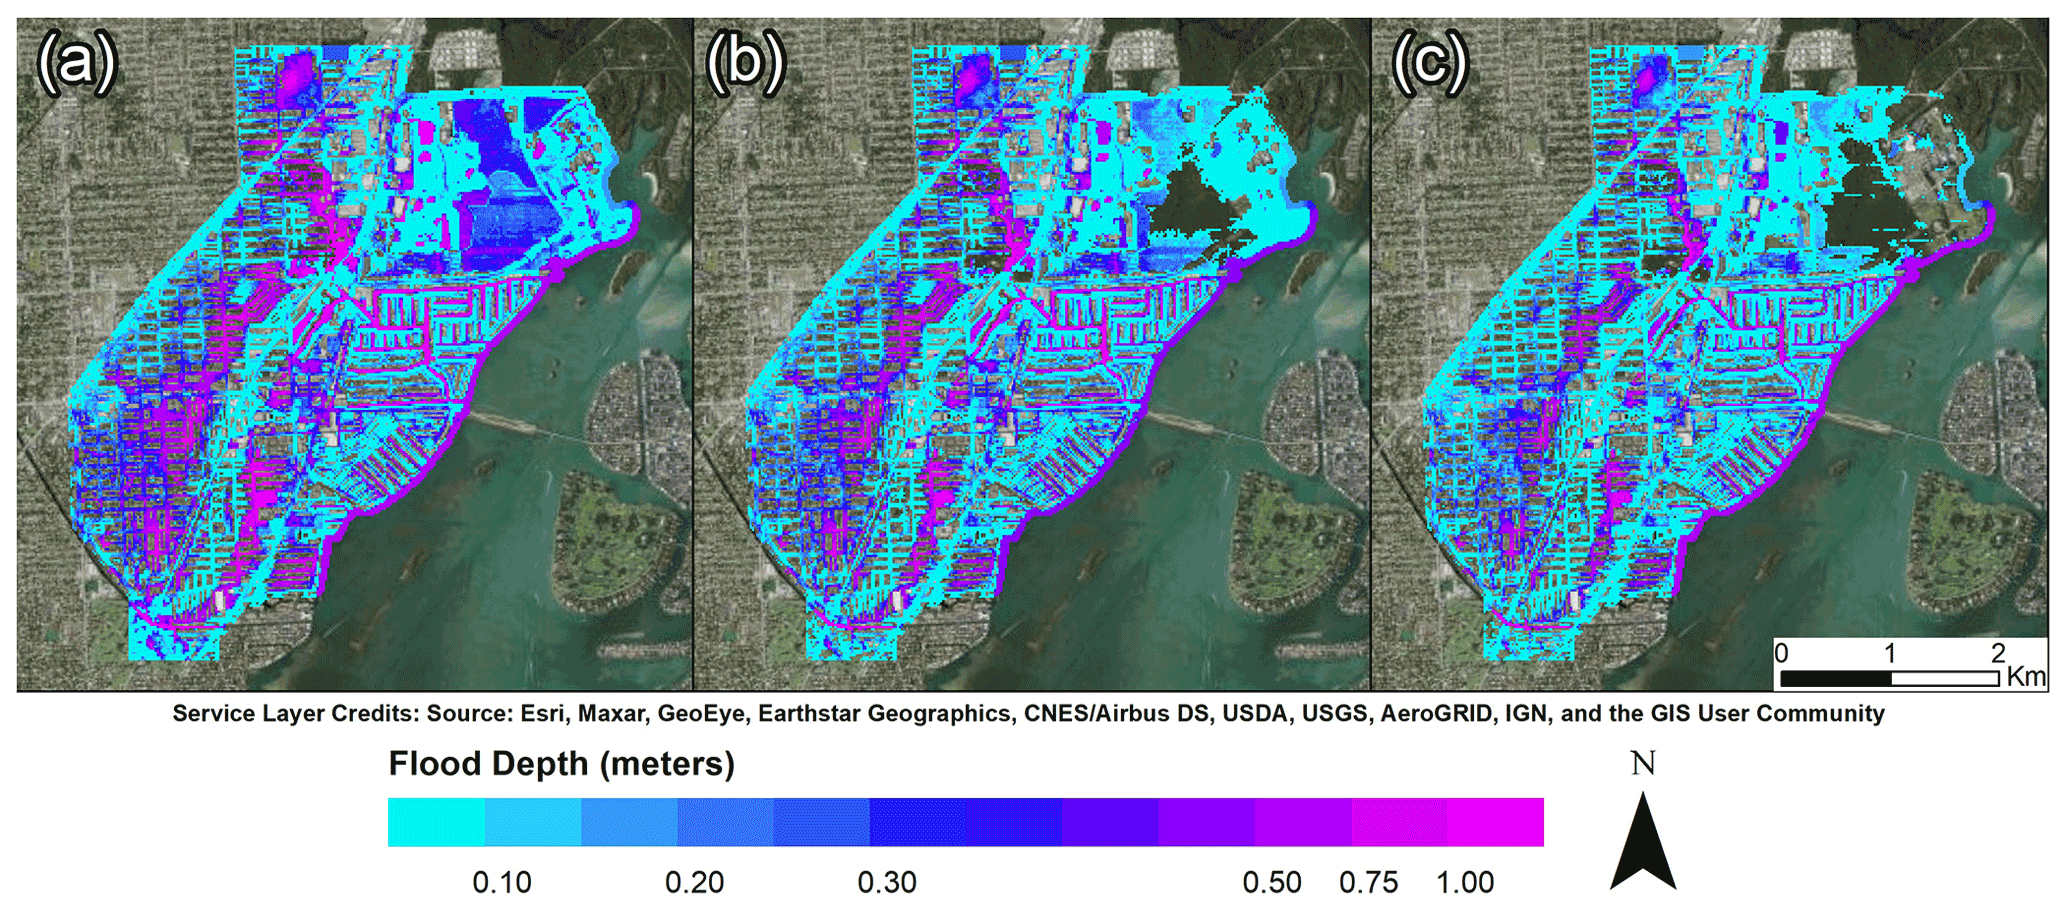
Figure 9Spatial distribution of maximum inundation depths for Tropical Storm Leslie (a), Tropical Storm Andrea (b) and the 25 May 2020 event (c).
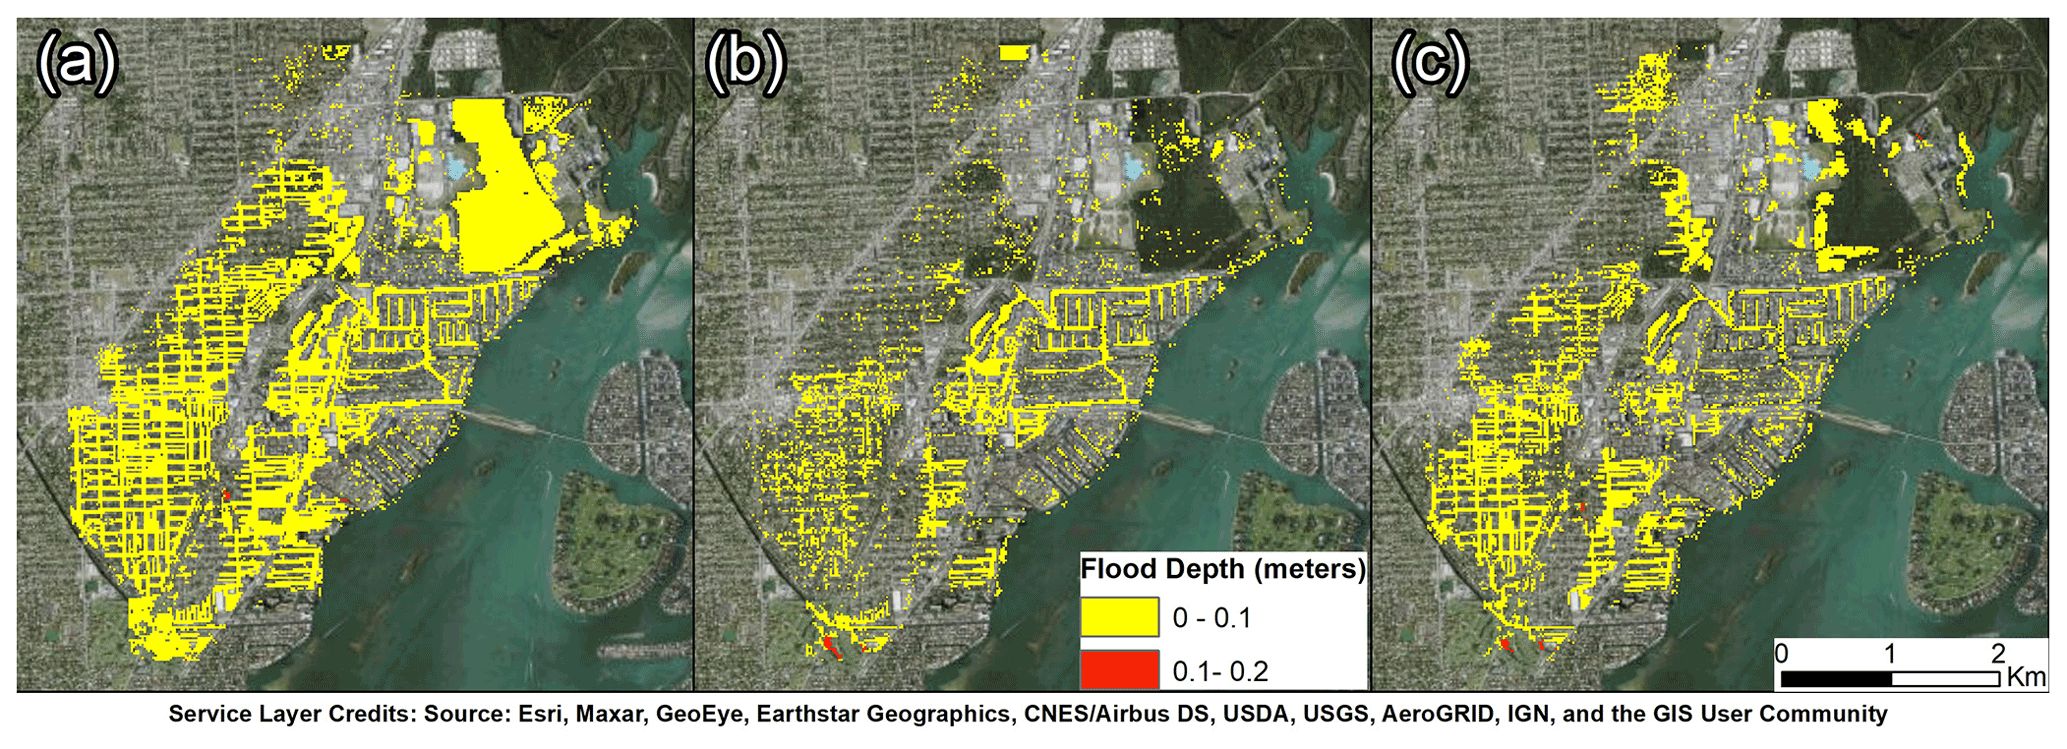
Figure 10Spatial distribution of groundwater-induced flooding for Tropical Storm Leslie (a), Tropical Storm Andrea (b) and the 25 May 2020 event (c).
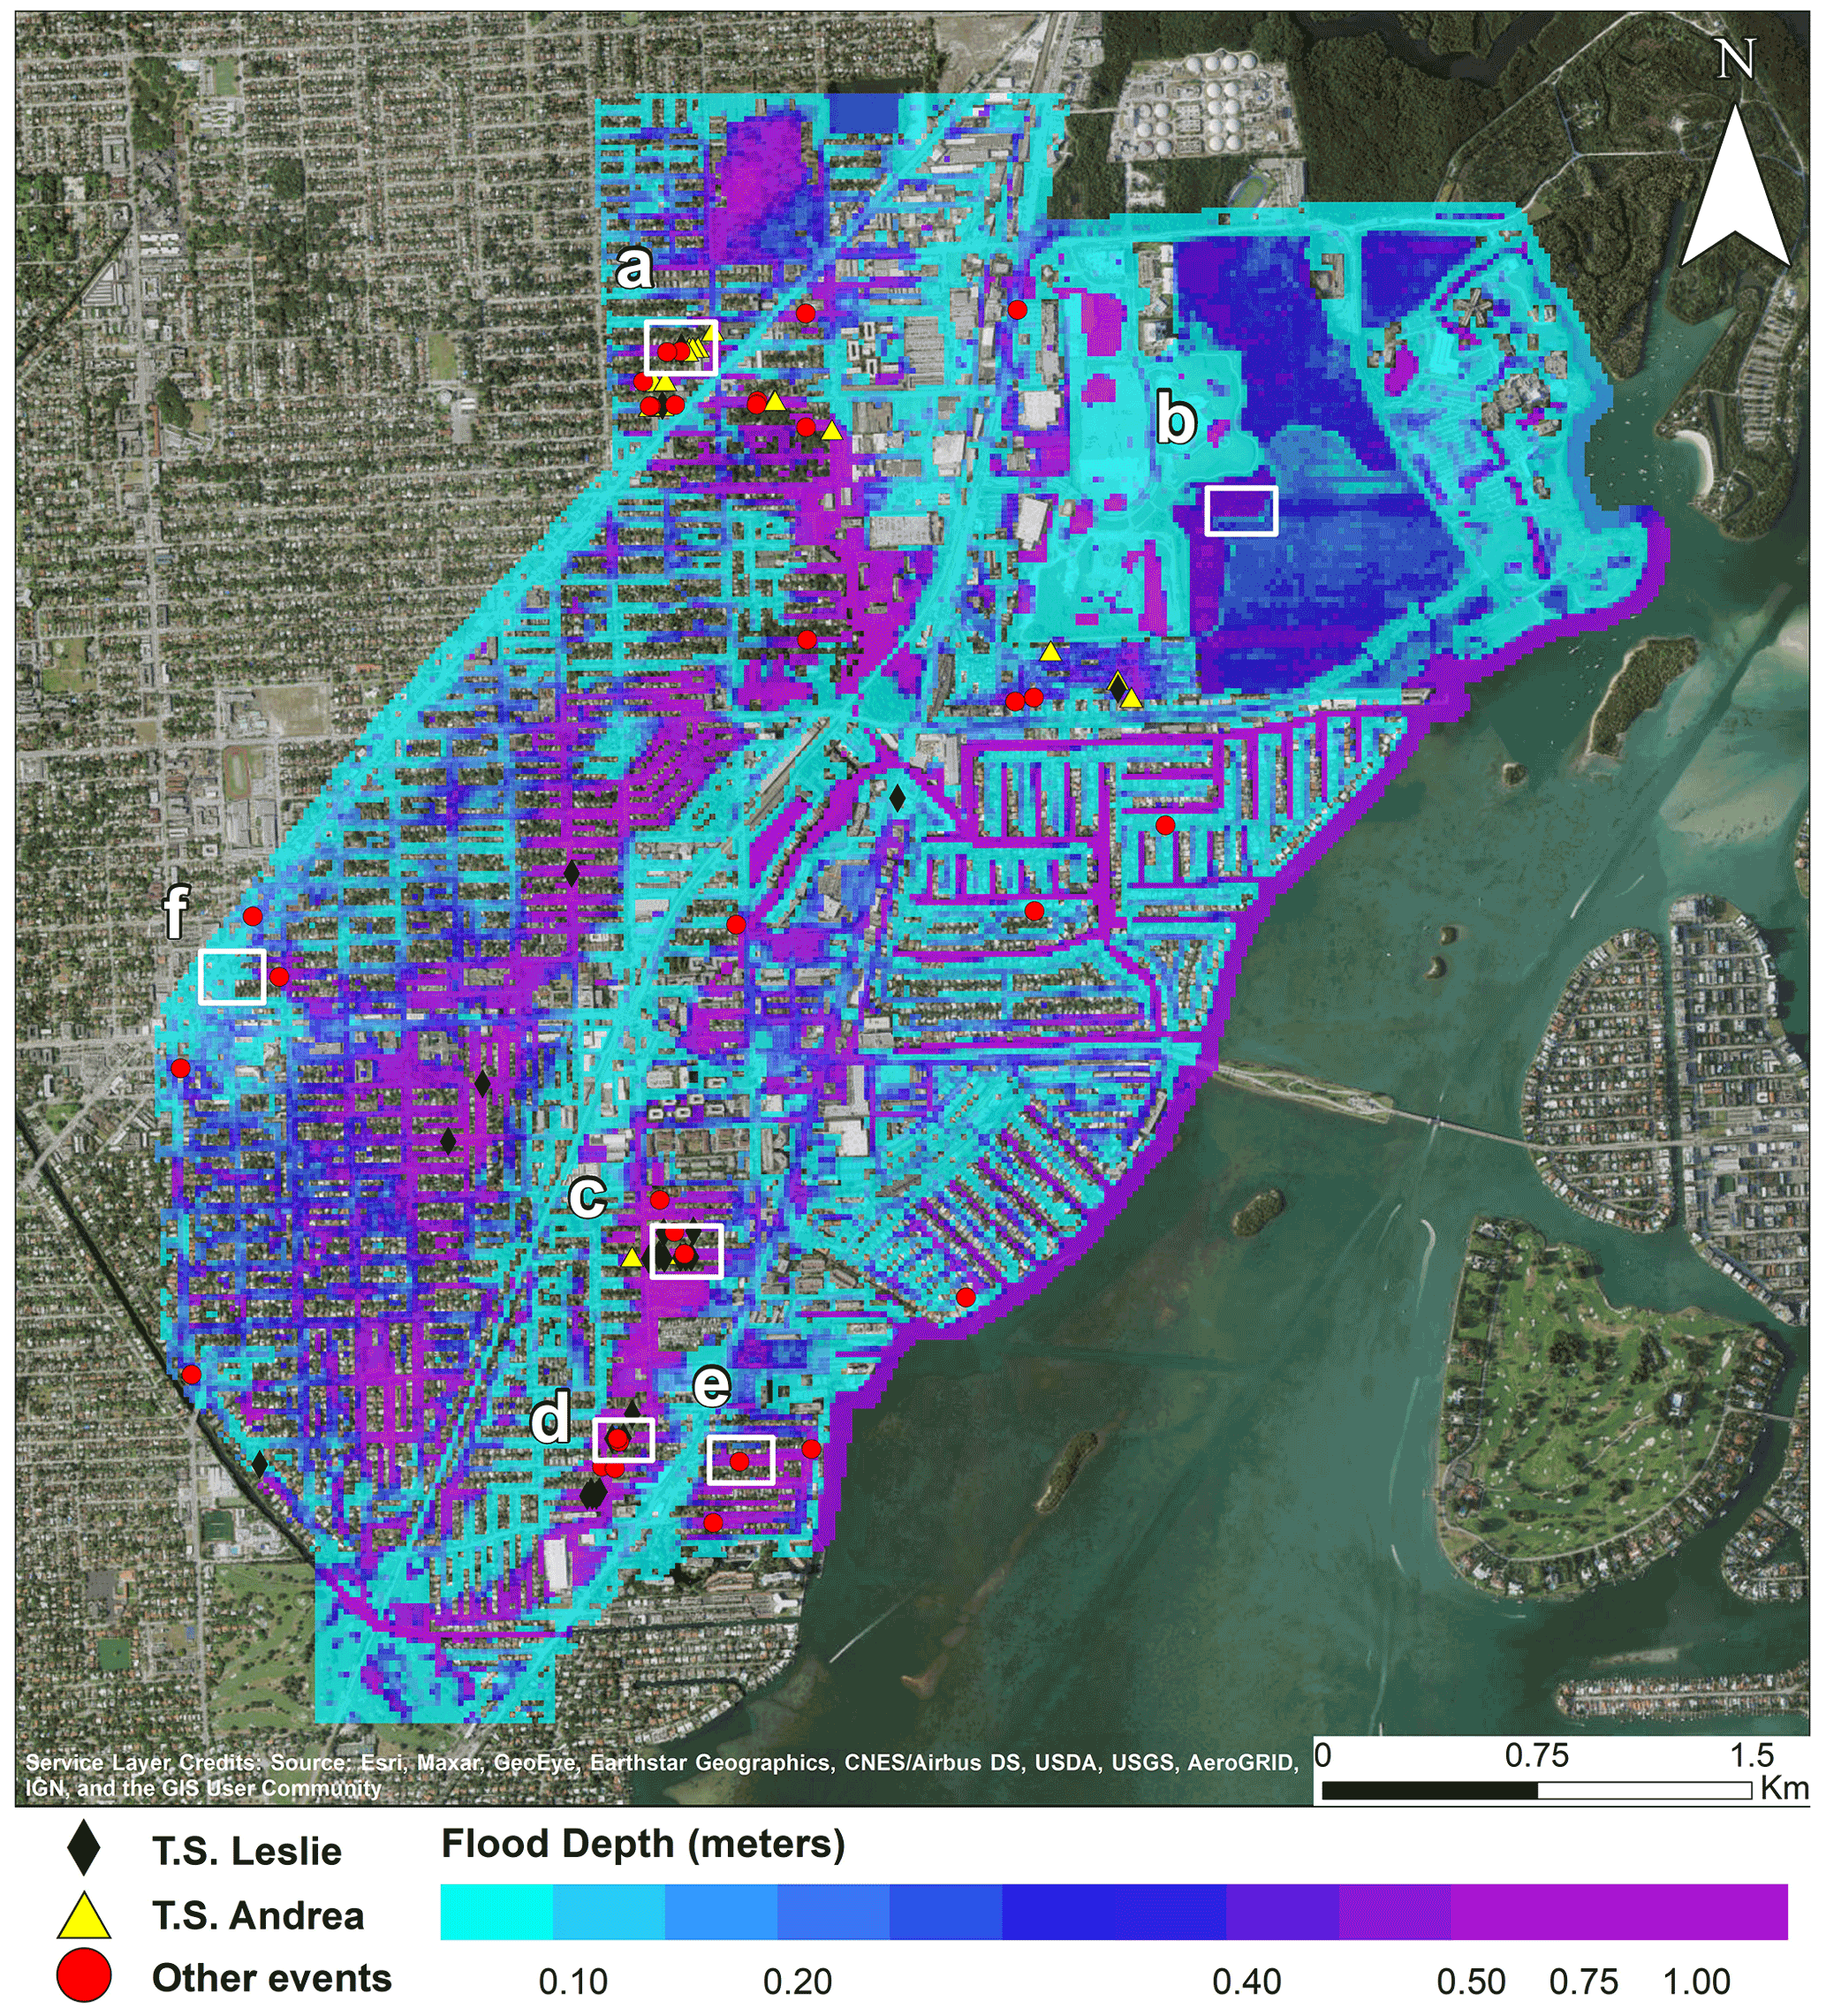
Figure 11Distribution of maximum flood depths for Tropical Storm Leslie. The markers indicate repetitive loss properties caused by Tropical Storm Leslie (black), Tropical Storm Andrea (yellow) or other storm events (red). Maximum flood depths at six sample locations (white) are presented in Fig. 11.

Figure 12Six sample locations (Fig. 10) are selected to observe the maximum flood depths for Tropical Storm Leslie (a–c). The markers display repetitive loss properties that have been affected by Tropical Storm Leslie (black), Tropical Storm Andrea (yellow) and other storm events (red). The water table time series (a–c) display the behavior of the groundwater heads during Tropical Storm Leslie (blue line), Tropical Storm Andrea (red line) and the 25 May 2020 event (green line) at a specific location (white). Results demonstrate that the simulated water table (d–f) exceeded the surface elevation (brown line) at two locations leading to groundwater-induced flooding (a, b), while the rest are driven by pluvial flooding (c–f).
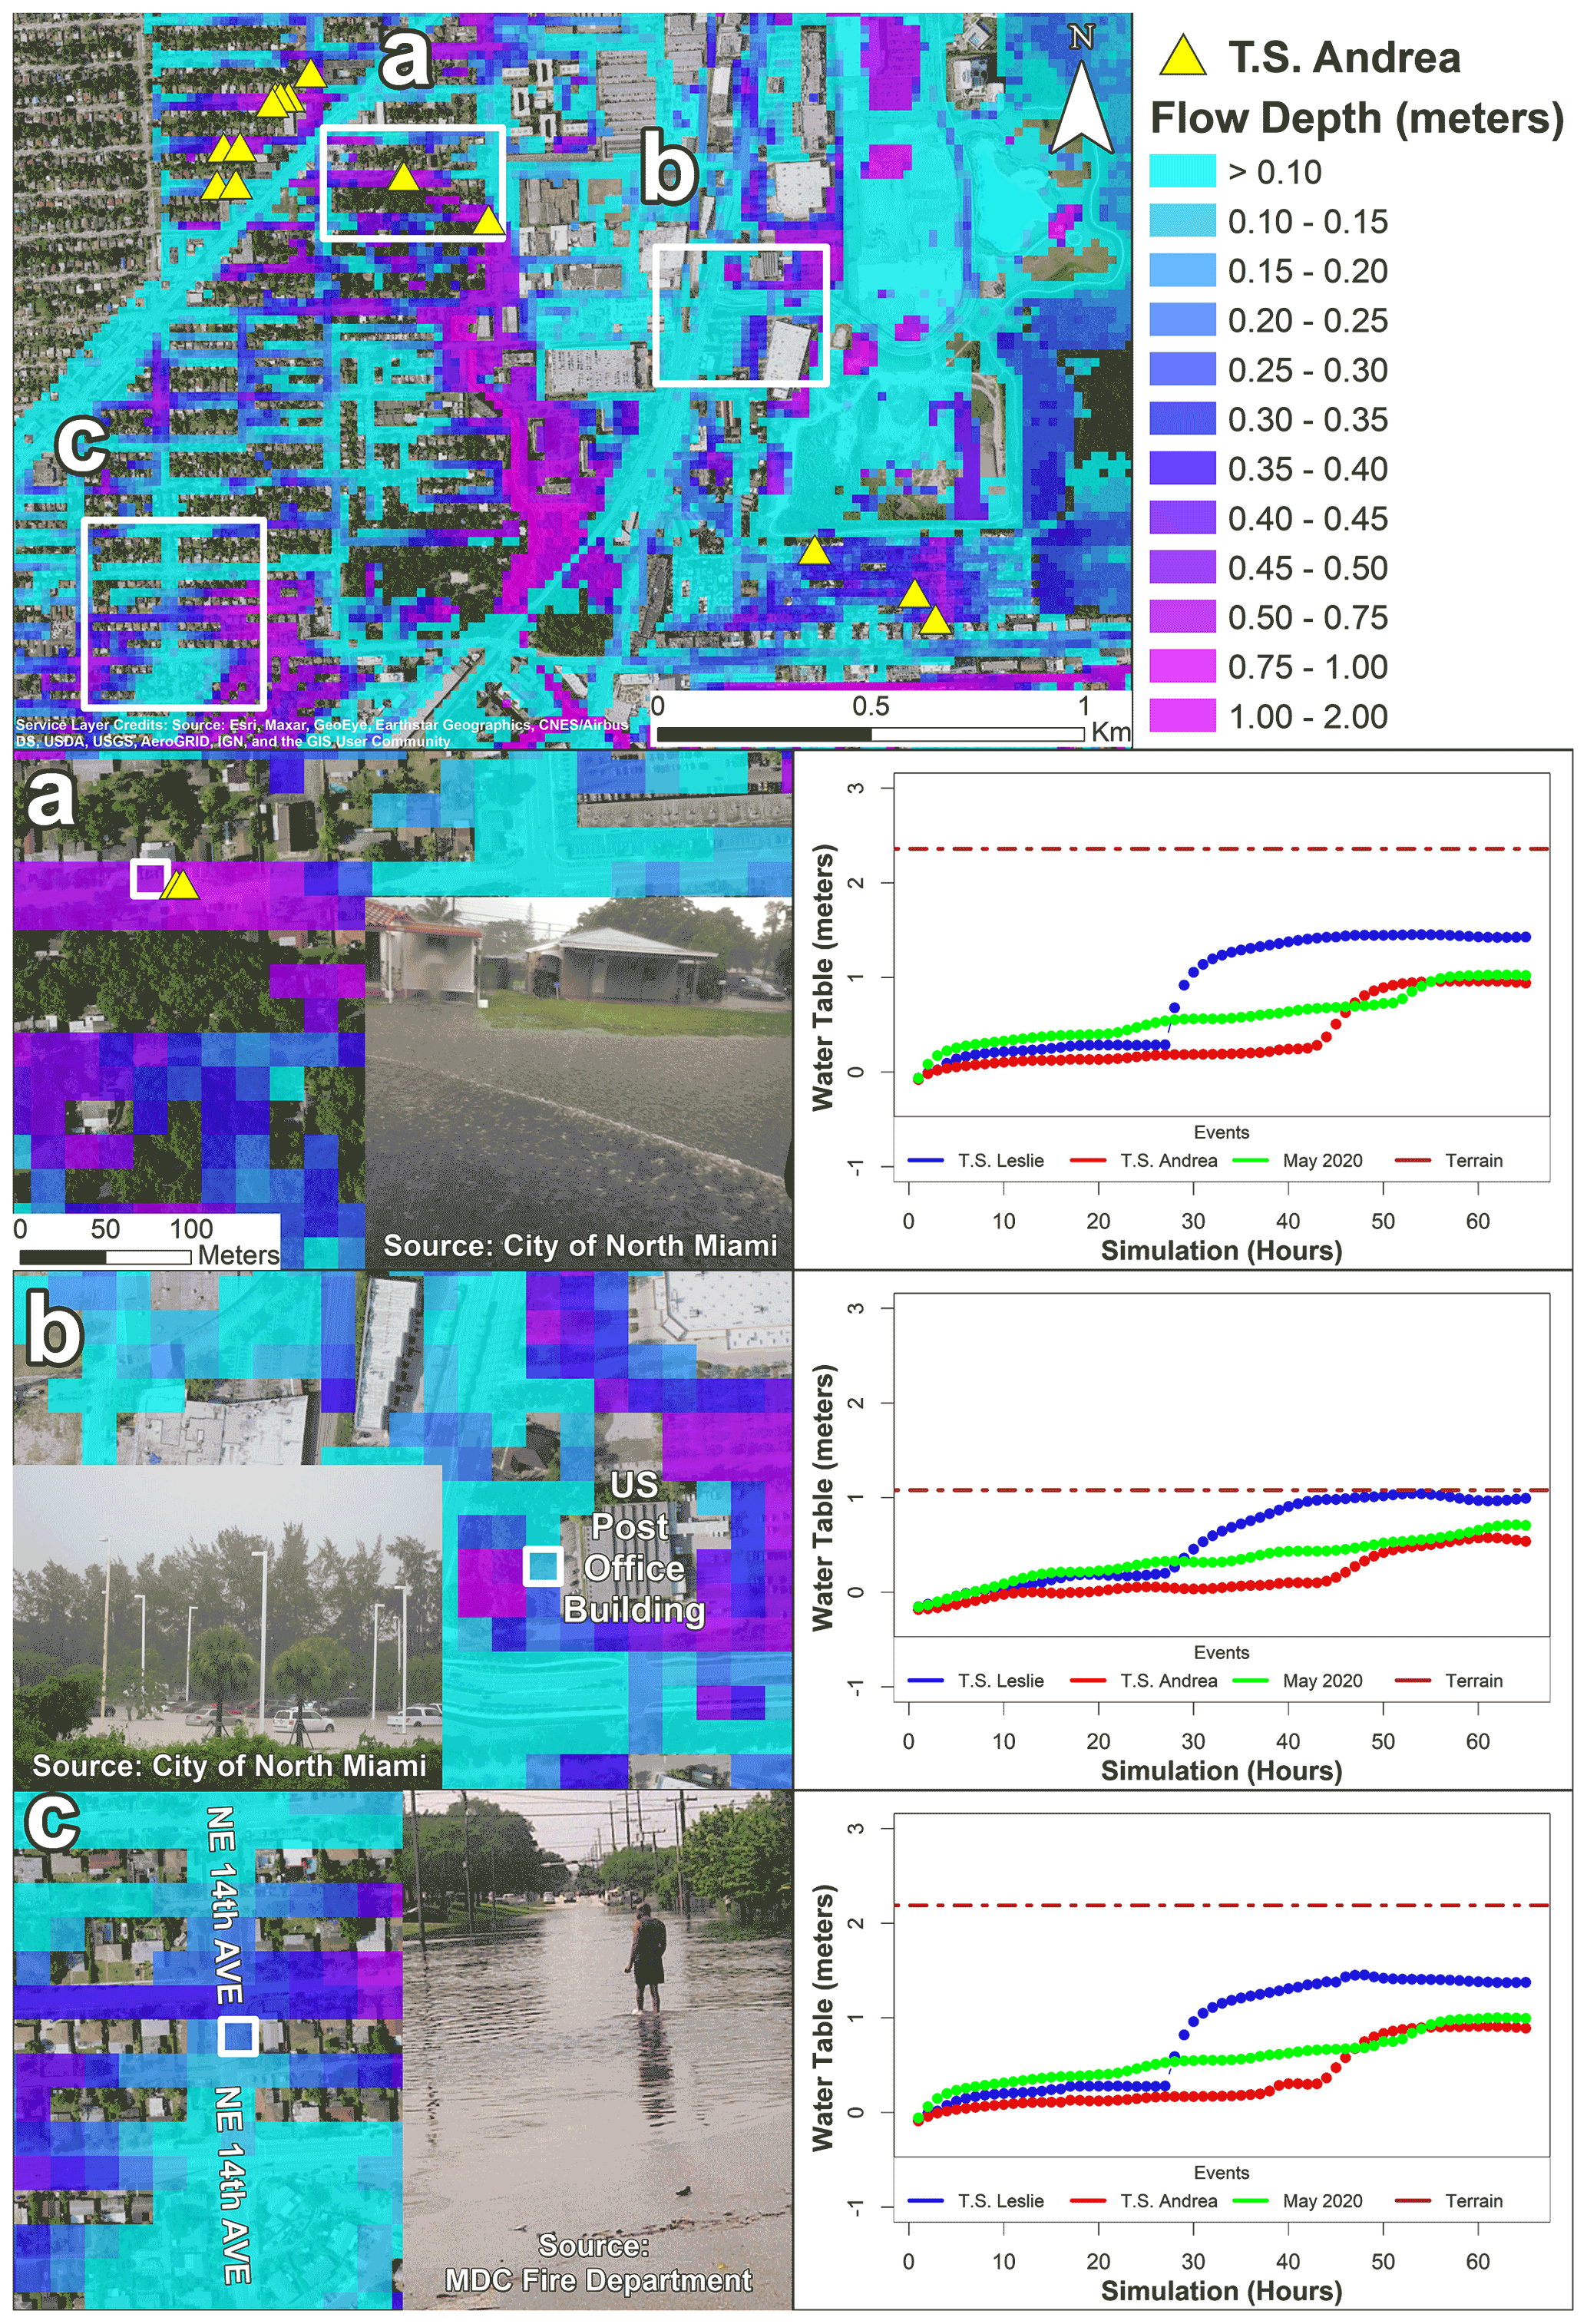
Figure 13Maximum flood depths for Tropical Storm Andrea in the northwestern portion of the Arch Creek Basin (top panel). The markers (yellow) display properties that were affected during Tropical Storm Andrea. Three sample locations (white) are presented as subdomains (a–c), and available crowdsourced observations display the flooding conditions at a specific cell (white). The simulated water table time series (right panel) show that groundwater heads remained below the surface elevation (brown line); thus, all three locations experienced rainfall-induced flooding.
5.2 Identification of flooding hotspots
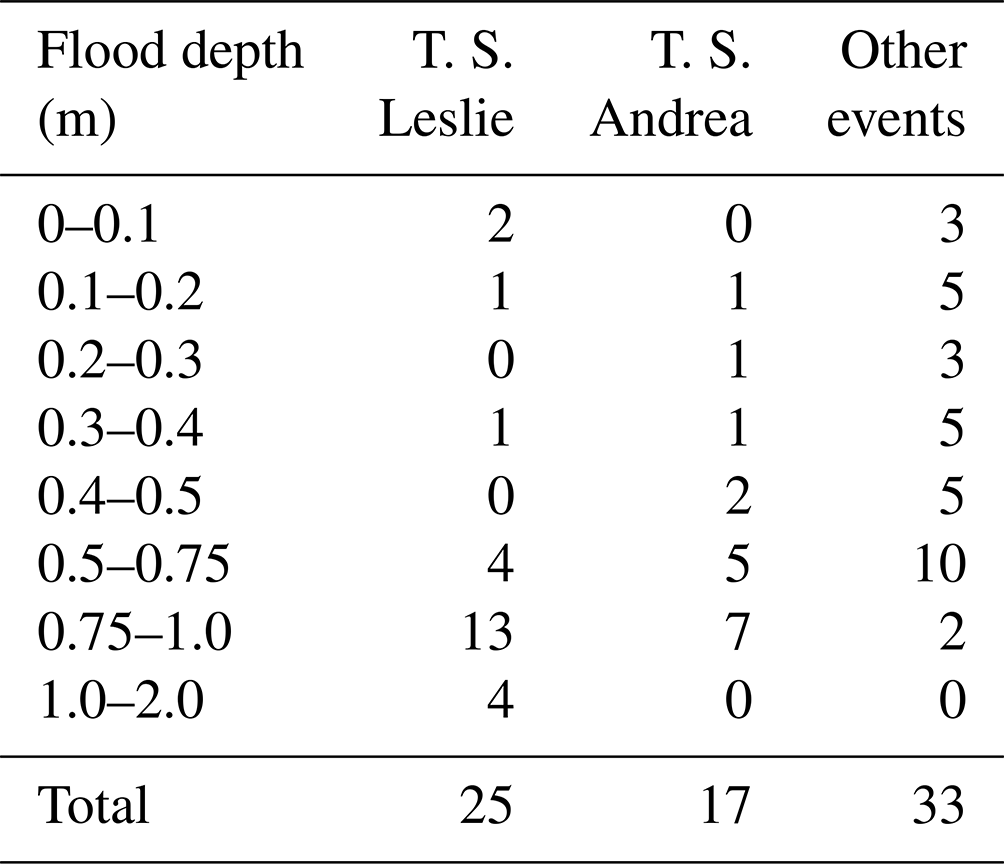
The groundwater flood maps for Tropical Storm Leslie (37.17 %), Tropical Storm Andrea (13.87 %) and the May 2020 event (20.82 %) are shown in Fig. 10. The simulation demonstrates that slight variations in the water table depth (Fig. 8) can exacerbate groundwater emergence extent, resulting in ≈10 cm across the Arch Creek Basin. Interestingly heavy precipitations scenarios with very high water tables over extended periods of time (May 2020 event) are more likely to trigger groundwater-induced flooding compared to very high precipitation with high water table levels (Tropical Storm Andrea). Figure 11 presents reasonable results between the reported claims and localized flooding, indicating that the housing infrastructure in these neighborhoods are likely to experience additional flood losses at some point in the future. The simulated storm events illustrate that most of the properties experienced moderate to high flood depths (>0.5 m) in predefined locations. Although rainfall runoff is the primary source of flooding in the urbanized Arch Creek Basin, abnormally high groundwater levels triggered groundwater-induced flooding near historic waterways and zones below the county's land elevation flood criteria, with flood depths ≈1 m (Fig. 12a and b). The groundwater plots illustrate the effect of tidal and groundwater boundary conditions on the behavior of the simulated water table, in turn demonstrating the importance of both variables in the modeling setup and influence in subsurface dynamics, as a cyclic high-low pattern characterizes the tide fluctuations of Biscayne Bay (Fig. 12b–e) compared to the defined water heads behavior from well G-852 in the boundary of the domain (Fig. 12a and f). In terms of residential damage, Tropical Storm Leslie and Tropical Storm Andrea may be considered the costliest events in the Arch Creek Basin as both account for 60 % of the reported claims (25 and 17 respectively) (Table 2).
Table 2Quantitative analysis of simulated flood depths with respect to FEMA's repetitive loss properties database by events.
Sources of uncertainty in the coupled numerical model could be reduced by increasing the model's resolution and incorporating storm water infrastructure features (i.e., French drains). For example, the increase in the water table levels could challenge the ability of the storm drain system to convey water towards the bay, resulting in prolonged flooding conditions, or anti-flood pump stations may alleviate the impacts of flooding by draining water from the streets and swales back to the ocean. Nevertheless, the repetitive loss records only reflect a small percentage of the damaged infrastructure and cannot be generalized at the basin scale as the property owners may not meet the criteria to file the claim. Therefore, the presented modeling results fall more on the conservative side and might overestimate the real flooding conditions.
5.3 Validation using crowdsourced data from Tropical Storm Andrea
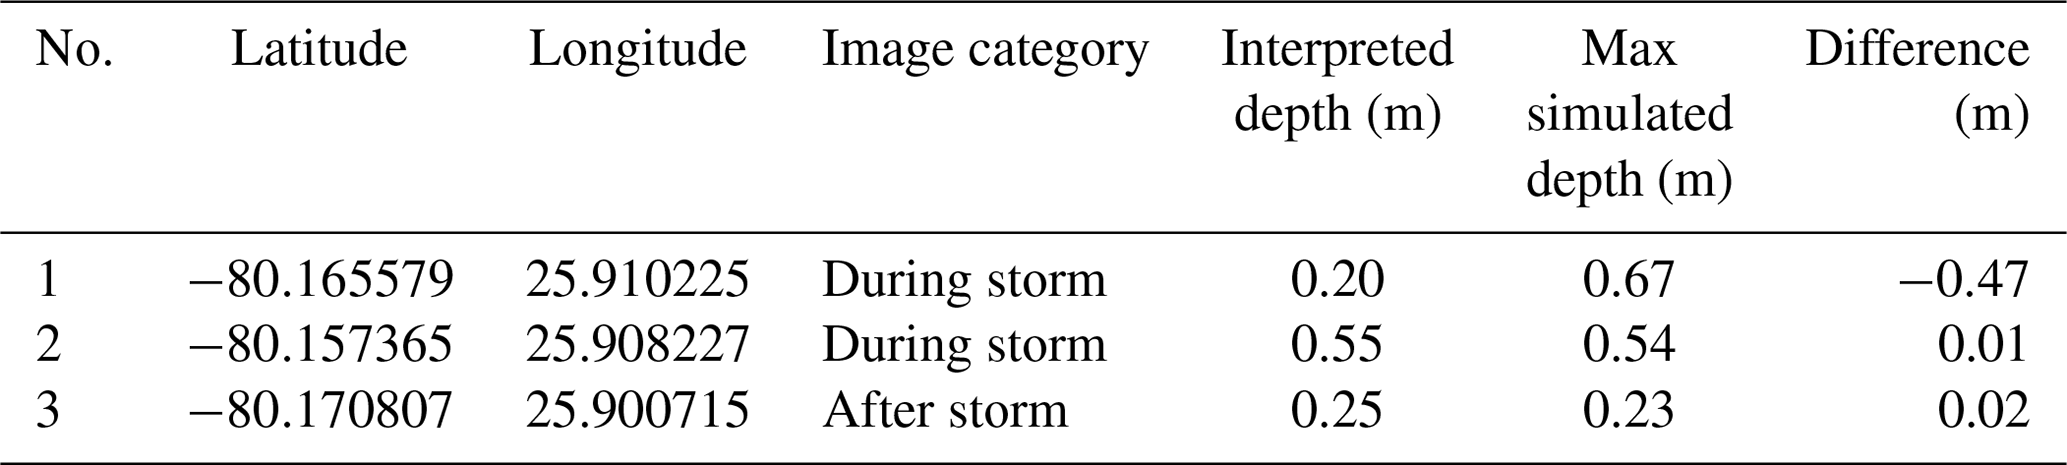
A limited number of real-time crowdsourced flooding observations in the Arch Creek Basin were available for Tropical Storm Andrea (Fig. 13). The visual comparison indicates a spatial agreement between the maximum flood depth of the coupled simulation and the interpreted depth of the crowdsourced data (Table 3). Figure 12a associates high flow depths (>0.5 m) with several properties that have experienced regular flooding conditions, while the crowdsourced photograph displays an estimated inundation depth of 0.20 m. Despite the model's overestimation, this comparison can be seen as an effective form of validation considering the changes in land use associated with the Arch Creek flow (Fig. 2) and low topographic elevation (Fig. 3b). Regarding Fig. 13b, the US post office exhibits chronic flooding in the parking lot. The coupled model exhibits a reasonable level of accuracy in terms of flood depth validation results. Figure 13c displays stagnant flood water accumulated post-event in a portion of NE 14 Ave. The results suggest that the rise of the water table does not influence the inundation depth and extents in any of these locations. Despite the limitations on the amount of collected crowdsourced data in the study area, a larger georeferenced dataset including the date and time could improve the reliability of VGI data to validate hydrodynamic models.
Table 3Comparison between simulated maximum water flood depths and VGI imagery obtained during and after Tropical Storm Andrea.
The results of this investigation determined that areas in the Arch Creek Basin below 1.0 m elevation are potentially vulnerable to groundwater-induced flooding (Figs. 10 and 12a, b). Similar results were obtained by Sukop et al. (2018) who found that precipitation was the main trigger for rainfall-induced and groundwater-induced flooding in elevations below 0.9 and 1.5 m respectively, with tidal fluctuations and sea level rise increasing the shallow water table, contributing to the reduction in the storm drain capacity. The present study also determined that antecedent rainfall events were important in the height of the water table at the start of the rainfall events investigated.
A simple groundwater model was approximated to be 2D in the horizontal axis and 1D in the vertical axis. Considering that most of the water table interactions occurred in the upper aquifer layer of the regional model (≈7 m) and the short simulation time of the selected events (64 and 84 h), we presume that differences in the modeling setup are not significant compared to the regional model and can be considered adequate for the purpose of this study. Additional work may be necessary for the coupled model to be fully operational as the groundwater model should represent the heterogeneous aquifer system to assess the sensitivity of the water table dynamics.
Seasonal water table fluctuations are expected throughout the year, presenting a higher level frequency during the winter and spring seasons due to climate variability and hydrological forcing (Gurdak et al., 2009; Taylor and Alley, 2001). Nevertheless, as we observed with Tropical Storm Leslie and Tropical Storm Andrea, the potential rise of groundwater levels to the surface during the dry season cannot be ruled out since the hydraulically non-restrictive nature of the carbonate strata in MDC allows for rapid infiltration and high recharge rates during heavy precipitation events. The hydrologic forcing input and modeling results suggest that the joint occurrence of high-intensity short-duration precipitation (>50 mm peak, 250 mm total) with already high groundwater levels (>1 m) results in a CF event. Further research on linking multivariate statistical analysis with coupled hydrodynamic modeling frameworks may prove beneficial to identify thresholds that trigger CF conditions (Couasnon et al., 2018; Jane et al., 2020; Moftakhari et al., 2019; Saksena et al., 2019; Sebastian et al., 2017; Serafin et al., 2019).
Although this investigation determined that rainfall and tide levels alone did not produce significant flooding, the modeling efforts did not include storm surge flooding that often accompanies large hurricanes (Zhang et al., 2013). Nonetheless storm-surge-induced flooding conditions and sea level rise projections are beyond the scope of this study, and future work on assessing the impact of high-tide- and storm-surge-induced flooding is fundamental to assess CF events and future flood risk scenarios (Obeysekera et al., 2019).
Surface–subsurface water interactions are increasing in coastal cities due to multiple factors related to climate change. The Arch Creek Basin in North Miami, which served as a vital flow corridor that connected the Everglades to Biscayne Bay, is an appropriate location to study the influence of high water tables in flood conditions. Results corroborate that groundwater-induced flooding is localized, thus becoming an underlying condition that must be considered in low-elevation coastal karst environments where the water table dynamics are subject to swift fluctuations caused by rainfall events.
A knowledge gap regarding a consolidated groundwater modeling framework was identified and addressed by proposing a loosely coupled flood model that integrates surface hydrology and groundwater. The ability to produce more comprehensive flood hazard mapping from coupled surface and subsurface water interactions is scientifically relevant to professionals in hydroinformatics since it improves the replicability of flood dynamics, setting the path to improve the understanding, prediction and response time of groundwater levels as a potential trigger to compound flooding phenomena that can exacerbate floodwater depth and areal extent. This work opens new horizons on the development of CF models from a holistic perspective.
The quality and accuracy of flood hazard mapping in urban areas are strictly related to the model spatial resolution considering that the vertical datum and built-up environment influence flow propagation dynamics. A 20 m grid resolution was selected to balance the computational demands with a certain level of precision without compromising the quality of the simulation. However, the investigation of higher and coarser resolutions in surface–subsurface modeling studies might yield insights into the estimation of inundated areas and time performance at different scales.
Considering Miami's hydrogeomorphology is one of the most complex globally, the compounding effects of flood drivers may respond differently in diverse geographic settings. Therefore, further research should consider the proposed modeling framework to assess the CF risk in different geographical regions prone to multiple flood drivers, specifically in areas that have access to post-event flooding maps in the form of remote sensing products or VGI data for calibration and validation purposes.
The contributions of this research are substantial and go beyond the numerical simulation scope as it supports numerous fields and real applications including flood management, urban planning and design, flood mapping and zoning, disaster risk reduction, flood insurance policies, and policy making. The ability to simulate rising groundwater levels may be of great interest to Miami-Dade authorities regarding the impact of flooded septic systems and pollutants from a water quality, ecological and public health perspective. Ultimately, this research is a small piece of multidisciplinary work that analyzes the ripple effects of flooding in a wide range of fields (such as socioeconomic costs, urban and ecological degradation, and health) and can set the basis for prevention, protection, accommodation, and even retreat and/or relocation policies.
FLO-2D modeling software is available at FLO-2D: Two-Dimensional Flood Routing Model (https://flo-2d.com/; FLO-2D, 2022); and MODFLOW-2005 at https://water.usgs.gov/water-resources/software/MODFLOW-2005/ (MODFLOW-2005, 2022).
As mentioned in Sect. 3, all data are available from the following official repositories:
-
rainfall: https://apps.sfwmd.gov/nexrad2/nrdmain.action (SFWMD, 2020a);
-
tides and ocean-side water levels: https://www.sfwmd.gov/science-data/dbhydro (SFWMD, 2020b);
-
groundwater heads: https://waterdata.usgs.gov/nwis/gw (USGS, 2020).
FP and JO jointly conceptualized the research experiment, from the design of the procedure to the presentation of results. FP gathered and processed the case study data, developed the coupled model framework, calibrated and validated the simulation results, wrote the initial version of the manuscript, and produced all figures and tables. NGR provided the technical expertise to achieve the coupling between FLO-2D and MODFLOW-2005. FN, JO and AM provided guidance and supervised the work of FP. RMP and FC shared ideas to improve the results and discussion sections. FN, AM, JO, RMP, FC and TC contributed to the paper revisions.
The contact author has declared that neither they nor their co-authors have any competing interests.
Publisher's note: Copernicus Publications remains neutral with regard to jurisdictional claims in published maps and institutional affiliations.
This article is part of the special issue “Understanding compound weather and climate events and related impacts (BG/ESD/HESS/NHESS inter-journal SI)”. It is not associated with a conference.
We gratefully acknowledge Marcia Steelman from MDC for the kind support throughout this research, including the provision of detailed background of the study area, documentation, historic imagery, shapefiles and crowdsourced data. We thank Angela Montoya from MDC for her helpful assistance in understanding MDC's regional groundwater model using MODFLOW and Ruben Arteaga from SFWMD for sharing flood protection and planning drainage reports. We would also like to thank our colleagues Michael C. Sukop and Martina Rogers from FIU for their valuable tutoring and recommendations during the development phase of the Arch Creek MODFLOW model.
This work was supported by the University for Foreigners of Perugia – ISPRA INFO/RAC2020 research grant no. COAN AC.11.04.01 (Research grant “Research and implementation of GIS and hydrologic-hydraulic models for large-scale water and flood risk management to support the Disaster Risk Reduction program”). In addition, this material is based upon work supported by the National Science Foundation under grant no. HRD-1547798. This NSF grant was awarded to Florida International University as part of the Centers for Research Excellence in Science and Technology (CREST) Program. This is contribution number 1341 from the Southeast Environmental Research Center at the Institute of Environment at Florida International University. This work was also funded by Florida International University Sea Level Solution Center grant no. 800008174 and the dissertation year fellowship from the FIU University Graduate School.
This paper was edited by Jakob Zscheischler and reviewed by Thomas Wahl and one anonymous referee.
Abboud, J. M., Ryan, M. C., and Osborn, G. D.: Groundwater flooding in a river-connected alluvial aquifer, J. Flood Risk Manage., 11, 1–11, https://doi.org/10.1111/jfr3.12334, 2018.
Abiy, A. Z., Melesse, A. M., Abtew, W., and Whitman, D.: Rainfall trend and variability in Southeast Florida: Implications for freshwater availability in the Everglades, PLoS One, 14, 1–20, https://doi.org/10.1371/journal.pone.0212008, 2019.
Annis, A. and Nardi, F.: Integrating VGI and 2D hydraulic models into a data assimilation framework for real time flood forecasting and mapping, Geo-Spat. Inform. Sci., 22, 223–236, https://doi.org/10.1080/10095020.2019.1626135, 2019.
Ascott, M. J., Marchant, B. P., Macdonald, D., McKenzie, A. A., and Bloomfield, J. P.: Improved understanding of spatio-temporal controls on regional scale groundwater flooding using hydrograph analysis and impulse response functions, Hydrol. Process., 31, 4586–4599, https://doi.org/10.1002/hyp.11380, 2017.
Bates, P. D., Quinn, N., Sampson, C., Smith, A., Wing, O., Sosa, J., Savage, J., Olcese, G., Neal, J., Schumann, G., Giustarini, L., Coxon, G., Porter, J. R., Amodeo, M. F., Chu, Z., Lewis-Gruss, S., Freeman, N. B., Houser, T., Delgado, M., Hamidi, A., Bolliger, I., McCusker, K., Emanuel, K., Ferreira, C. M., Khalid, A., Haigh, I. D., Couasnon, A., Kopp, R., Hsiang, S., and Krajewski, W. F.: Combined Modeling of US Fluvial, Pluvial, and Coastal Flood Hazard Under Current and Future Climates, Water Resour. Res., 57, 1–29, https://doi.org/10.1029/2020wr028673, 2021.
Beven II, J. L.: Tropical Storm Andrea (AL012013), Miami, FL, https://www.nhc.noaa.gov/data/tcr/AL012013_Andrea.pdf (last access: 24 March 2021), 2013.
Bradford, R. B.: Volume-duration growth curves for flood estimation in permeable catchments, Hydrol. Earth Syst. Sci., 6, 939–947, https://doi.org/10.5194/hess-6-939-2002, 2002.
Brunner, P., Therrien, R., Renard, P., Simmons, C. T., and Franssen, H. J. H.: Advances in understanding river-groundwater interactions, Rev. Geophys., 55, 818–854, https://doi.org/10.1002/2017RG000556, 2017.
Chebud, Y. and Melesse, A.: Operational Prediction of Groundwater Fluctuation in South Florida using Sequence Based Markovian Stochastic Model, Water Resour. Manage., 25, 2279–2294, https://doi.org/10.1007/s11269-011-9808-z, 2011.
Chebud, Y. and Melesse, A.: Spatiotemporal Surface-Groundwater Interaction Simulation in South Florida, Water Resour. Manage., 26, 4449–4466, https://doi.org/10.1007/s11269-012-0156-4, 2012.
Christian, J., Fang, Z., Torres, J., Deitz, R., and Bedient, P.: Modeling the Hydraulic Effectiveness of a Proposed Storm Surge Barrier System for the Houston Ship Channel during Hurricane Events, Nat. Hazards Rev., 16, 04014015, https://doi.org/10.1061/(asce)nh.1527-6996.0000150, 2015.
Cobby, D., Morris, S., Parkes, A., and Robinson, V.: Groundwater flood risk management: Advances towards meeting the requirements of the EU floods directive, J. Flood Risk Manage., 2, 111–119, https://doi.org/10.1111/j.1753-318X.2009.01025.x, 2009.
Couasnon, A., Sebastian, A., and Morales-Nápoles, O.: A Copula-based bayesian network for modeling compound flood hazard from riverine and coastal interactions at the catchment scale: An application to the houston ship channel, Texas, Water, 10, 1190, https://doi.org/10.3390/w10091190, 2018.
Cunningham, K. J. and Florea, L. J.: The Biscayne Aquifer of Southeastern Florida, Caves and Karst of America, 196–199, http://digitalcommons.wku.edu/geog_fac_pub/20 (last access: 1 November 2020), 2009.
Cunningham, K. J., Carlson, J. L., Wingard, G. L., Robinson, E., and Wacker, M. A.: Characterization of aquifer heterogeneity using cyclostratigraphy and geophysical methods in the upper part of the Karstic Biscayne Aquifer, Southeastern Florida, US Geological Survey Water-Resources Investigations Report 03-4208, p. 66, 5 appendixes (on CD), and 5 plates, https://pubs.usgs.gov/wri/wri034208/ (last access: 4 October 2020), 2004.
Devia, G. K., Ganasri, B. P., and Dwarakish, G. S.: A Review on Hydrological Models, Aquat. Procedia, 4, 1001–1007, https://doi.org/10.1016/j.aqpro.2015.02.126, 2015.
FEMA: Repetitive Flood Claims Program Benefits City and Homeowners, https://www.fema.gov/case-study/repetitive-flood-claims-program-benefits-city-and-homeowners (last access: 4 June 2020), 2021.
Field, C., Barros, V., and Stocker, T.: Managing the risks of extreme events and disasters to advance climate change adaptation, Special report of the Intergovernmental Panel on Climate Change (IPCC), https://www.ipcc.ch/site/assets/uploads/2018/03/SREX_Full_Report-1.pdf (last access: 24 March 2021), 2012.
Finch, J. W., Bradford, R. B., and Hudson, J. A.: The spatial distribution of groundwater flooding in a chalk catchment in southern England, Hydrol. Process., 18, 959–971, https://doi.org/10.1002/hyp.1340, 2004.
Fish, J. E. and Stewart, M. T.: Hydrogeology of the surficial aquifer system, Dade County, Florida, US Geological Survey, Reston, VA, https://doi.org/10.3133/wri904108, 1991.
FLO-2D: FLO-2D Reference Manual, https://flo-2d.com/downloads/ (last access: 20 April 2021), 2018.
FLO-2D: Two-Dimensional Flood Routing Model, FLO-2D, https://flo-2d.com/, last access: 21 February 2022.
Franklin, J. L., Avila, L. A., Beven, J. L., Lawrence, M. B., Pasch, R. J., and Stewart, S. R.: Atlantic hurricane season of 2000, Mon. Weather Rev., 129, 3037–3056, https://doi.org/10.1175/1520-0493(2001)129<3037:AHSO>2.0.CO;2, 2001.
Fullerton, W. T.: Water and Sediment Routing from Complex Watersheds and Example Application to Surface Mining, MS Thesis, Civil Engineering Dept., CSU, Fort Collins, CO, 1983.
García-Gil, A., Vázquez-Suñé, E., Sánchez-Navarro, J. Á., Mateo Lázaro, J., and Alcaraz, M.: The propagation of complex flood-induced head wavefronts through a heterogeneous alluvial aquifer and its applicability in groundwater flood risk management, J. Hydrol., 527, 402–419, https://doi.org/10.1016/j.jhydrol.2015.05.005, 2015.
Gori, A., Lin, N., and Smith, J.: Assessing Compound Flooding From Landfalling Tropical Cyclones on the North Carolina Coast, Water Resour. Res., 56, e2019WR026788, https://doi.org/10.1029/2019WR026788, 2020.
Greater Miami & the Beaches: Resilient 305, https://www.mbrisingabove.com/wp-content/uploads/Resilient305_final.pdf (last access: 29 January 2021), 2019.
Grimaldi, S., Petroselli, A., Arcangeletti, E., and Nardi, F.: Flood mapping in ungauged basins using fully continuous hydrologic-hydraulic modeling, J. Hydrol., 487, 39–47, https://doi.org/10.1016/j.jhydrol.2013.02.023, 2013.
Gurdak, J. S., Hanson, R. T., and Green, T. R.: Effects of Climate Variability and Change on Groundwater Resources of the United States, US Geological Survey, https://doi.org/10.3133/fs20093074, 2009.
Harbaugh, A. W.: MODFLOW-2005: the U.S. Geological Survey modular ground-water model–the ground-water flow process, https://doi.org/10.3133/tm6A16, 2005.
Hoffmeister, J. E., Stockman, K. W., and Multer, H. G.: Miami Limestone of Florida and Its Recent Bahamian Counterpart, GSA Bull., 78, 175–190, https://doi.org/10.1130/0016-7606(1967)78[175:MLOFAI]2.0.CO;2, 1967.
Hughes, A. G., Vounaki, T., Peach, D. W., Ireson, A. M., Jackson, C. R., Butler, A. P., Bloomfield, J. P., Finch, J., and Wheater, H. S.: Flood risk from groundwater: Examples from a Chalk catchment in southern England, J. Flood Risk Manage., 4, 143–155, https://doi.org/10.1111/j.1753-318X.2011.01095.x, 2011.
Hughes, J. D. and White, J. T.: Hydrologic conditions in urban Miami-Dade County, Florida, and the effect of groundwater pumpage and increased sea level on canal leakage and regional groundwater flow, Scientific Investigations Report 2014-5162, US Geol. Surv., 175 pp., US Geological Survey, Reston, VA, https://doi.org/10.3133/sir20145162, 2016.
Ikeuchi, H., Hirabayashi, Y., Yamazaki, D., Muis, S., Ward, P. J., Winsemius, H. C., Verlaan, M., and Kanae, S.: Compound simulation of fluvial floods and storm surges in a global coupled river-coast flood model: Model development and its application to 2007 Cyclone Sidr in Bangladesh, J. Adv. Model. Earth Syst., 9, 1847–1862, https://doi.org/10.1002/2017MS000943, 2017.
Jacobs: Groundwater flooding records collation, monitoring and risk assessment (reference HA5): consolidated report, http://archive.defra.gov.uk/environment/flooding/documents/risk/groundwaterreport.pdf (last access: 11 January 2020), 2007.
Jane, R., Cadavid, L., Obeysekera, J., and Wahl, T.: Multivariate statistical modelling of the drivers of compound flood events in south Florida, Nat. Hazards Earth Syst. Sci., 20, 2681–2699, https://doi.org/10.5194/nhess-20-2681-2020, 2020.
Karamouz, M., Zahmatkesh, Z., Goharian, E., and Nazif, S.: Combined Impact of Inland and Coastal Floods: Mapping Knowledge Base for Development of Planning Strategies, J. Water Resour. Pl. Manage., 141, 04014098, https://doi.org/10.1061/(asce)wr.1943-5452.0000497, 2015.
Keenan, J. M., Hill, T., and Gumber, A.: Climate gentrification: From theory to empiricism in Miami-Dade County, Florida, Environ. Res. Lett., 13, 054001, https://doi.org/10.1088/1748-9326/aabb32, 2018.
Kumbier, K., Carvalho, R. C., Vafeidis, A. T., and Woodroffe, C. D.: Investigating compound flooding in an estuary using hydrodynamic modelling: A case study from the Shoalhaven River, Australia, Nat. Hazards Earth Syst. Sci., 18, 463–477, https://doi.org/10.5194/nhess-18-463-2018, 2018.
MacDonald, A. M., Lapworth, D. J., Hughes, A. G., Auton, C. A., Maurice, L., Finlayson, A., and Gooddy, D. C.: Groundwater, flooding and hydrological functioning in the Findhorn floodplain, Scotland, Hydrol. Res., 45, 755–773, https://doi.org/10.2166/nh.2014.185, 2014.
Miami-Dade: Little Arch Creek Salinity Control Structure, Arch Creek Basin Drainage Evaluation Report, ftp://ftp.sfwmd.gov/incoming/Little_Arch_Creek_Drainage_Report_Final.pdf(lLast access: 1 February 2021), 2015.
Miami-Dade: Arch Creek Study Area, Miami-Dade County, Florida, Briefing Book for ULI Advisory Services Panel, 22–27 May 2016, https://www.miamidade.gov/green/library/arch-creek-briefing-book.pdf (last access: 21 April 2021), 2016.
Miami-Dade: Repetitive losses, http://www.miamidade.gov/environment/repetitive-losses.asp (last access: 18 September 2020), 2017.
Miami Herald: North Miami bought her flooded home. Now it's going to become a park to fight sea rise, https://www.miamiherald.com/news/local/environment/article235403232.html (last access: 1 October 2020), 2019.
MODFLOW-2005: USGS Three-Dimensional Finite-Difference Ground-Water Model, USGS [code], https://water.usgs.gov/water-resources/software/MODFLOW-2005/, last access: 21 February 2022.
Moftakhari, H., Schubert, J. E., AghaKouchak, A., Matthew, R. A., and Sanders, B. F.: Linking statistical and hydrodynamic modeling for compound flood hazard assessment in tidal channels and estuaries, Adv. Water Resour., 128, 28–38, https://doi.org/10.1016/j.advwatres.2019.04.009, 2019.
Nalesso, M.: Integrated surface-ground water modeling in wetlands with improved methods to simulate vegetative resistance to flow, ProQuest ETD Collect, FIU, https://digitalcommons.fiu.edu/cgi/viewcontent.cgi?article=1160&context=etd (last access: 5 October 2021), 2009.
O'Brien, J. S.: FLO-2D Users Manual, Nutrioso, AZ, USA, https://flo-2d.com/downloads/ (last access: 25 May 2021), 2011.
O'Brien, J. S., Julien, P. Y., and Fullerton, W. T.: Two-dimensional water flood and mudflow simulation, Hydrol. Eng., (119), 244–261, 1993.
Obeysekera, J., Sukop, M., Troxler, T., Irizarry, M., and Rogers, M.: Potential Implications of Sea-Level Rise and Changing Rainfall for Communities in Florida using Miami-Dade County as a Case Study, Miami, FL, https://slsc.fiu.edu/_assets/pdfs/fbc_fiu_finalreport_22aug2019.pdf (last access: 6 April 2021), 2019.
Ó Dochartaigh, B., Archer, N. A. L., Peskett, L., MacDonald, A. M., Black, A. R., Auton, C. A., Merritt, J. E., Gooddy, D. C., and Bonell, M.: Geological structure as a control on floodplain groundwater dynamics, Hydrogeol. J., 27, 703–716, https://doi.org/10.1007/s10040-018-1885-0, 2019.
Olbert, A. I., Comer, J., Nash, S., and Hartnett, M.: High-resolution multi-scale modelling of coastal flooding due to tides, storm surges and rivers inflows. A Cork City example, Coast. Eng., 121, 278–296, https://doi.org/10.1016/j.coastaleng.2016.12.006, 2017.
Parker, G. G. and Cooke, C. W.: Late Cenozoic Geology of Southern Florida with a Discussion of the Ground Water, US Geol. Surv., https://ufdc.ufl.edu/UF00000455/00001 (last access: 6 November 2020), 1944.
Peña, F. and Nardi, F.: Floodplain terrain analysis for coarse resolution 2D flood modeling, Hydrology, 5, 52, https://doi.org/10.3390/hydrology5040052, 2018.
Peña, F., Nardi, F., Melesse, A., and Obeysekera, J.: Assessing geomorphic floodplain models for large scale coarse resolution 2D flood modelling in data scarce regions, Geomorphology, 389, 107841, https://doi.org/10.1016/j.geomorph.2021.107841, 2021.
Price, R., Schwartz, K., Anderson, B., Boucek, R., Briceño, H., Cook, M., Fitz, C., Onsted, J., Rehage, J., Rivera-Monroy, V., Roy Chowdhury, R., and Saha, A.: Chapter 3: Water, Sustainability, and Survival, in: The Coastal Everglades: The Dynamics of Social-Ecological Transformation in the South Florida Landscape, edited by: Childers, D. L., Gaiser, E. E., and Ogden, L. A., Oxford University Press, New York, ISBN 9780190869007 0190869003, 2020.
Prinos, S. T. and Dixon, J. F.: Statistical analysis and mapping of water levels in the Biscayne aquifer, water conservation areas, and Everglades National Park, Miami-Dade County, Florida, 2000–2009, US Geological Survey, Reston, VA, https://doi.org/10.3133/sir20165005, 2016.
Saksena, S., Merwade, V., and Singhofen, P. J.: Flood inundation modeling and mapping by integrating surface and subsurface hydrology with river hydrodynamics, J. Hydrol., 575, 1155–1177, https://doi.org/10.1016/j.jhydrol.2019.06.024, 2019.
Santiago-Collazo, F. L., Bilskie, M. V., and Hagen, S. C.: A comprehensive review of compound inundation models in low-gradient coastal watersheds, Environ. Model. Softw., 119, 166–181, https://doi.org/10.1016/j.envsoft.2019.06.002, 2019.
Sebastian, A., Dupuits, E. J. C., and Morales-Nápoles, O.: Applying a Bayesian network based on Gaussian copulas to model the hydraulic boundary conditions for hurricane flood risk analysis in a coastal watershed, Coast. Eng., 125, 42–50, https://doi.org/10.1016/j.coastaleng.2017.03.008, 2017.
Seneviratne, S., Nicholls, N., Easterling, D., Goodess, C., Kanae, S., Kossin, J., Luo, Y., Marengo, J., Mcinnes, K., Rahimi, M., Reichstein, M., Sorteberg, A., Vera, C., and Zhang, X.: Changes in climate extremes and their impacts on the natural physical environment, https://www.ipcc.ch/site/assets/uploads/2018/03/SREX-Chap3_FINAL-1.pdf (last access: 15 December 2020), 2012.
Serafin, K. A., Ruggiero, P., Parker, K., and Hill, D. F.: What's streamflow got to do with it? A probabilistic simulation of the competing oceanographic and fluvial processes driving extreme along-river water levels, Nat. Hazards Earth Syst. Sci., 19, 1415–1431, https://doi.org/10.5194/nhess-19-1415-2019, 2019.
SFWMD – South Florida Water Management District: NEXRAD Viewer, https://apps.sfwmd.gov/nexrad2/nrdmain.action (last access: 1 November 2020), 2020a.
SFWMD – South Florida Water Management District: SFWMD DBHYDRO Database, SFWMD [data set], https://www.sfwmd.gov/science-data/dbhydro (last access: 1 November 2020), 2020b.
Sophocleous, M.: Interactions between groundwater and surface water: The state of the science, Hydrogeol. J., 10, 52–67, https://doi.org/10.1007/s10040-001-0170-8, 2002.
Su, X., Liu, T., Beheshti, M., and Prigiobbe, V.: Relationship between infiltration, sewer rehabilitation, and groundwater flooding in coastal urban areas, Environ. Sci. Pollut. Res., 27, 14288–14298, https://doi.org/10.1007/s11356-019-06513-z, 2020.
Sukop, M. C., Rogers, M., Guannel, G., Infanti, J. M., and Hagemann, K.: High temporal resolution modeling of the impact of rain, tides, and sea level rise on water table flooding in the Arch Creek basin, Miami-Dade County Florida USA, Sci. Total Environ., 616–617, 1668–1688, https://doi.org/10.1016/j.scitotenv.2017.10.170, 2018.
Taylor, C. J. and Alley, W. M.: Ground-water-level monitoring and the importance of long-term water-level data, US Geol. Surv. Circ., https://pubs.usgs.gov/circ/circ1217/pdf/circ1217_final.pdf (last access: 22 January 2021), 2001.
Teng, J., Jakeman, A. J., Vaze, J., Croke, B. F. W., Dutta, D., and Kim, S.: Flood inundation modelling: A review of methods, recent advances and uncertainty analysis, Environ. Model. Softw., 90, 201–216, https://doi.org/10.1016/j.envsoft.2017.01.006, 2017.
US Census Bureau: American Community Survey 5-Year Data (2009–2019), https://www.census.gov/data/developers/data-sets/acs-5year.html (last access: 18 July 2021), 2020.
US Department of Agriculture: Aerial photographs of Dade County, https://ufdc.ufl.edu/UF00071738/00034/1x?search=dade (last access: 11 December 2020), 1948.
USGS – United States Geological Survey Water Resources: USGS Groundwater Data for the Nation, https://waterdata.usgs.gov/nwis/gw, last access: 1 November 2020.
van Westen, C. J. and Greiving, S.: Multi-hazard risk assessment and decision making, Environ. Hazards Methodol. Risk Assess. Manage., 31–94, https://doi.org/10.2166/9781780407135_0031, 2017.
Wahl, T., Jain, S., Bender, J., Meyers, S. D., and Luther, M. E.: Increasing risk of compound flooding from storm surge and rainfall for major US cities, Nat. Clim. Change, 5, 1093–1097, https://doi.org/10.1038/nclimate2736, 2015.
Winston, R. B.: ModelMuse: A Graphical User Interface for MODFLOW-2005 and PHAST, US Geological Survey Techniques and Methods 6-A29, http://pubs.usgs.gov/tm/tm6A29/tm6A29.pdf (last access: 21 February 2020), 2009.
Yang, S. and Tsai, F. T. C.: Understanding impacts of groundwater dynamics on flooding and levees in Greater New Orleans, J. Hydrol. Reg. Stud., 32, 100740, https://doi.org/10.1016/j.ejrh.2020.100740, 2020.
Yu, X., Moraetis, D., Nikolaidis, N. P., Li, B., Duffy, C., and Liu, B.: A coupled surface-subsurface hydrologic model to assess groundwater flood risk spatially and temporally, Environ. Model. Softw., 114, 129–139, https://doi.org/10.1016/j.envsoft.2019.01.008, 2019.
Zhang, K., Li, Y., Liu, H., Xu, H., and Shen, J.: Comparison of three methods for estimating the sea level rise effect on storm surge flooding, Climatic Change, 118, 487–500, https://doi.org/10.1007/s10584-012-0645-8, 2013.
Zscheischler, J., Westra, S., Van Den Hurk, B. J. J. M., Seneviratne, S. I., Ward, P. J., Pitman, A., Aghakouchak, A., Bresch, D. N., Leonard, M., Wahl, T., and Zhang, X.: Future climate risk from compound events, Nat. Clim. Change, 8, 469–477, https://doi.org/10.1038/s41558-018-0156-3, 2018.